company and workforce - xcel energy and workforce ... upper midwest 36,368,182 11,919,341 48,287,524...
TRANSCRIPT

COMPANY AND WORKFORCE
Workforce Totals by Job Classification and State (as of year-end 2016)
The following table includes all full-time, part-time and temporary employees of Xcel Energy, but excludes contractors and employees on leaves of absence. It breaks down our workforce by state and by main job categories. Bargaining employees are full-time, permanent employees covered under collective bargaining agreements. Craft employees are temporary, project-specific employees also covered by collective bargaining agreements. Both bargaining and craft employees are combined to make up the percent of our workforce represented by unions. Non-bargaining employees consist of management and non-management employees based on the type of work they perform.
State Bargaining Non-Bargaining
Temporary Total* % Represented by Unions
Management Non-Management
Colorado 1,903 1,782 58 3,743 51.1% 546 1,236
Washington DC 0 4 0 4 0.0% 3 1
Michigan 14 3 1 18 77.8% 0 3
Minnesota 2,063 2,728 563 5,354 48.1% 883 1,845
North Dakota 67 37 4 108 65.7% 6 31
New Mexico 149 83 0 232 64.2% 25 58
South Dakota 65 22 17 104 78.8% 7 15
Texas 663 798 39 1,500 44.2% 164 630
Wisconsin 380 538 28 946 41.4% 74 464
Total 5,304 5,995 710 12,009 48.9 1,712 4,283
* This employee count is different from the 2016 Form 10-K report because the information includes temporary employees and reflects workforce changes that happened immediately prior to year-end 2016 that were not recorded or reconciled until early 2017.
Find the breakdown of Xcel Energy’s workforce by gender, ethnicity and age group in the Our People and Culture brief. As for Xcel Energy’s
Board of Directors, 33 percent of the board is female and/or minority.
COMPANY AND WORKFORCE
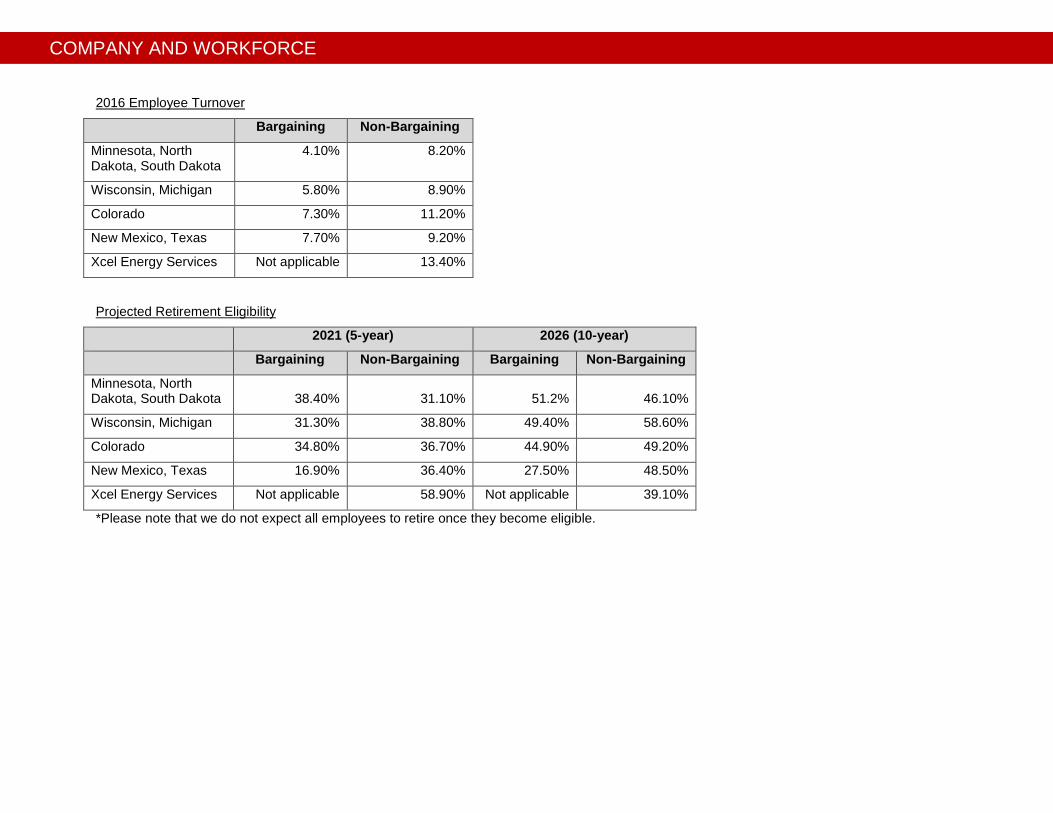
2016 Employee Turnover
Bargaining Non-Bargaining
Minnesota, North Dakota, South Dakota
4.10% 8.20%
Wisconsin, Michigan 5.80% 8.90%
Colorado 7.30% 11.20%
New Mexico, Texas 7.70% 9.20%
Xcel Energy Services Not applicable 13.40%
Projected Retirement Eligibility
2021 (5-year) 2026 (10-year)
Bargaining Non-Bargaining Bargaining Non-Bargaining
Minnesota, North Dakota, South Dakota 38.40% 31.10% 51.2% 46.10%
Wisconsin, Michigan 31.30% 38.80% 49.40% 58.60%
Colorado 34.80% 36.70% 44.90% 49.20%
New Mexico, Texas 16.90% 36.40% 27.50% 48.50%
Xcel Energy Services Not applicable 58.90% Not applicable 39.10%
*Please note that we do not expect all employees to retire once they become eligible.
COMPANY AND WORKFORCE
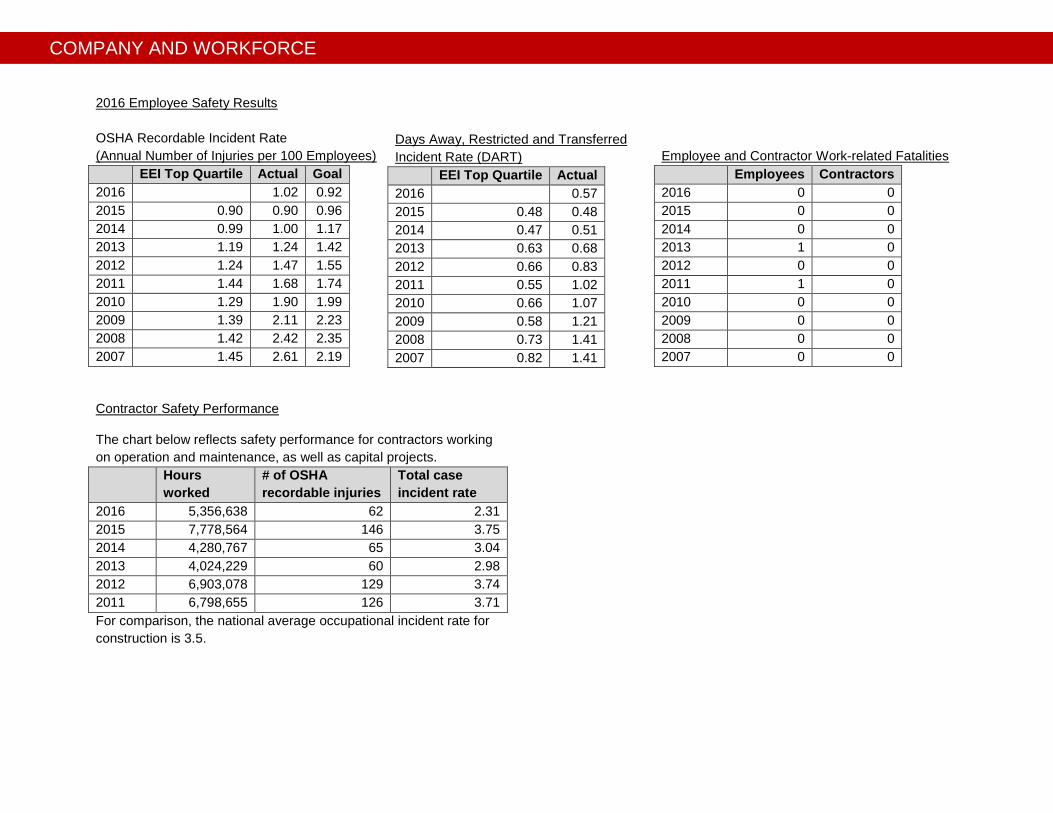
2016 Employee Safety Results
OSHA Recordable Incident Rate
(Annual Number of Injuries per 100 Employees)
EEI Top Quartile Actual Goal
2016 1.02 0.92
2015 0.90 0.90 0.96
2014 0.99 1.00 1.17
2013 1.19 1.24 1.42
2012 1.24 1.47 1.55
2011 1.44 1.68 1.74
2010 1.29 1.90 1.99
2009 1.39 2.11 2.23
2008 1.42 2.42 2.35
2007 1.45 2.61 2.19
Contractor Safety Performance
The chart below reflects safety performance for contractors working
on operation and maintenance, as well as capital projects.
Hours
worked
# of OSHA
recordable injuries
Total case
incident rate
2016 5,356,638 62 2.31
2015 7,778,564 146 3.75
2014 4,280,767 65 3.04
2013 4,024,229 60 2.98
2012 6,903,078 129 3.74
2011 6,798,655 126 3.71
For comparison, the national average occupational incident rate for
construction is 3.5.
Days Away, Restricted and Transferred
Incident Rate (DART)
EEI Top Quartile Actual
2016 0.57
2015 0.48 0.48
2014 0.47 0.51
2013 0.63 0.68
2012 0.66 0.83
2011 0.55 1.02
2010 0.66 1.07
2009 0.58 1.21
2008 0.73 1.41
2007 0.82 1.41
Employee and Contractor Work-related Fatalities
Employees Contractors
2016 0 0
2015 0 0
2014 0 0
2013 1 0
2012 0 0
2011 1 0
2010 0 0
2009 0 0
2008 0 0
2007 0 0

CUSTOMERS AND COMMUNITIES
Electricity Customers (as of year-end 2016)
Residential Large
Commercial &
Industrial
Small
Commercial &
Industrial
Public Authority
& Other
Wholesale Total
Colorado 1,235,378 337 159,299 53,944 34 1,449,096
Michigan 7,631 2 1,283 45 -- 8,961
Minnesota 1,135,931 507 131,732 6,552 10 1,274,732
New Mexico 94,718 71 23,473 1,757 4 120,023
North Dakota 80,623 24 12,746 375 -- 93,768
South Dakota 80,298 24 11,387 441 -- 92,150
Texas 210,358 148 53,846 4,620 4 268,976
Wisconsin 208,795 115 38,246 1,097 -- 248,253
Total 3,053,732 1,228 432,012 68,935 52 3,555,959
Natural Gas Customers (as of year-end 2016)
Residential Commercial & Industrial Transportation & Other Total
Colorado 1,269,338 100,718 7,261 1,377,317
Minnesota 418,615 35,210 24 453,849
North Dakota 47,130 8,343 1 55,474
Michigan 5,080 673 -- 5,753
Wisconsin 95,344 12,342 30 107,716
Total 1,835,507 157,286 7,316 2,000,109

CUSTOMERS AND COMMUNITIES
Xcel Energy Community Investment (managed through the Xcel Energy Foundation)*
2016 2015 2014
Focus Area Grants $3,917,800 $4,042,800 $3,680,428
STEM education $1,286,100 $1,349,100 $1,259,600
Economic sustainability $1,126,200 $1,233,900 $737,698
Environmental stewardship $530,300 $657,600 $1,100,500
Access to the arts $455,200 $550,200 $582,630
Strategic philanthropy $450,000 $210,000 —
Disaster $70,000 $20,000 —
Other grants — $22,000 —
United Way Contributions $5,696,033 $5,457,599 $5,439,368
Employee contributions $3,039,360 $2,808,547 $2,725,158
Company match and corporate gifts $2,666,673 $2,453,596 $2,714,210
Company in-kind — $195,456
Matching Gifts Program $1,452,134 $1,300,570 $1,409,731
Employee contributions $685,475 $701,157 $811,232
Company contributions $766,659 $599,413 $598,499
Volunteer Matching Dollars $71,500 $238,510 $244,750
Disaster Relief $8,150 $79,046 $122,605
Employee contributions $4,275 $4,875 $5,240
Company contributions $3875 $74,171 $117,365
Volunteer Paid Time Off (VPTO) $694,932
VPTO Hours 17,137 17,463 16,179
VPTO Dollars $694,932 $686,037 $635,020
Other Contributions $2,030,988 $1,823,435 $2,238,541
In-kind Contributions $45,000 $94,574 $74,452
Total $13,916,537 $13,706,413 $13,844,895
Employee Volunteer Hours $49,040 39,326 27,229
*Other Contributions are sponsorships, including tables, sports venues and charitable contributions made outside of the Xcel Energy Foundation.
In-kind Contributions refers to the value of donated equipment and supplies; it also includes supplies purchased for sponsoring or participating in
community and volunteer events.
Employee Volunteer Hours are provided for those programs that we have a system in place for tracking, which include Volunteer Paid Time Off,
Dollars-for-Doing, Volunteer Energy and Day of Service. Actual employee volunteer hours are greater than reported here because the company
promotes and sponsors a number of employee volunteer activities in addition to the programs we track.
Volunteer Matching Dollars includes company payments to community organizations through Dollars-for Doing and Volunteer Energy.
Disaster Relief includes corporate contributions to the Red Cross and similar organizations, as well as funds donated on behalf of customers
through special product promotions.

CUSTOMERS AND COMMUNITIES
2016 Xcel Energy Tax Payments by State
Xcel Energy annually pays significant property and sales taxes that support local governments and pay for community services. In many small
communities, we are the largest tax payer.
State 2016 Sales, Use and Property Tax
Payments (in millions)
Colorado $307.6
Kansas $0.9
Michigan $2.3
Minnesota $369.3
New Mexico $30.0
North Dakota $3.2
Oklahoma $0.6
South Dakota $15.9
Texas $55.5
Wisconsin $21.6
Total $806.9
2016 City Franchise Agreements
Xcel Energy has franchise agreements with some of the cities and towns where we provide natural gas and electricity service. These agreements
give us rights to use the municipality’s alleys, streets and rights-of-way so we can, for example, run power lines along city property. As part of
some of the franchise agreements, we collect a fee from our customers and pay that money to the cities and towns. The franchise fee is not a tax
but rather a portion of the cost to operate a utility.
2016 Franchise Fees Collected and Paid
Colorado $ 77,244,544
Minnesota $ 71,504,473
North Dakota $ 3,932,045
New Mexico $ 3,504,970
Texas $ 15,304,108
Total $ 171,490,139
OPERATIONS
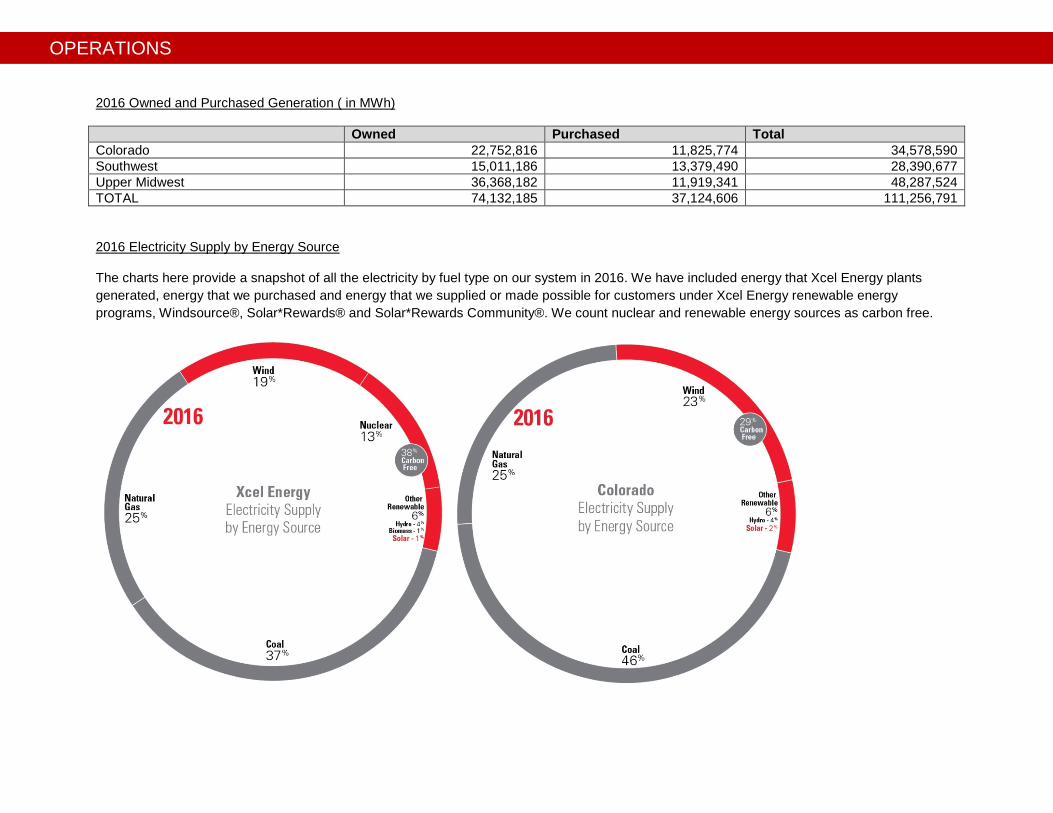
2016 Owned and Purchased Generation ( in MWh)
Owned Purchased Total Colorado 22,752,816 11,825,774 34,578,590 Southwest 15,011,186 13,379,490 28,390,677 Upper Midwest 36,368,182 11,919,341 48,287,524 TOTAL 74,132,185 37,124,606 111,256,791
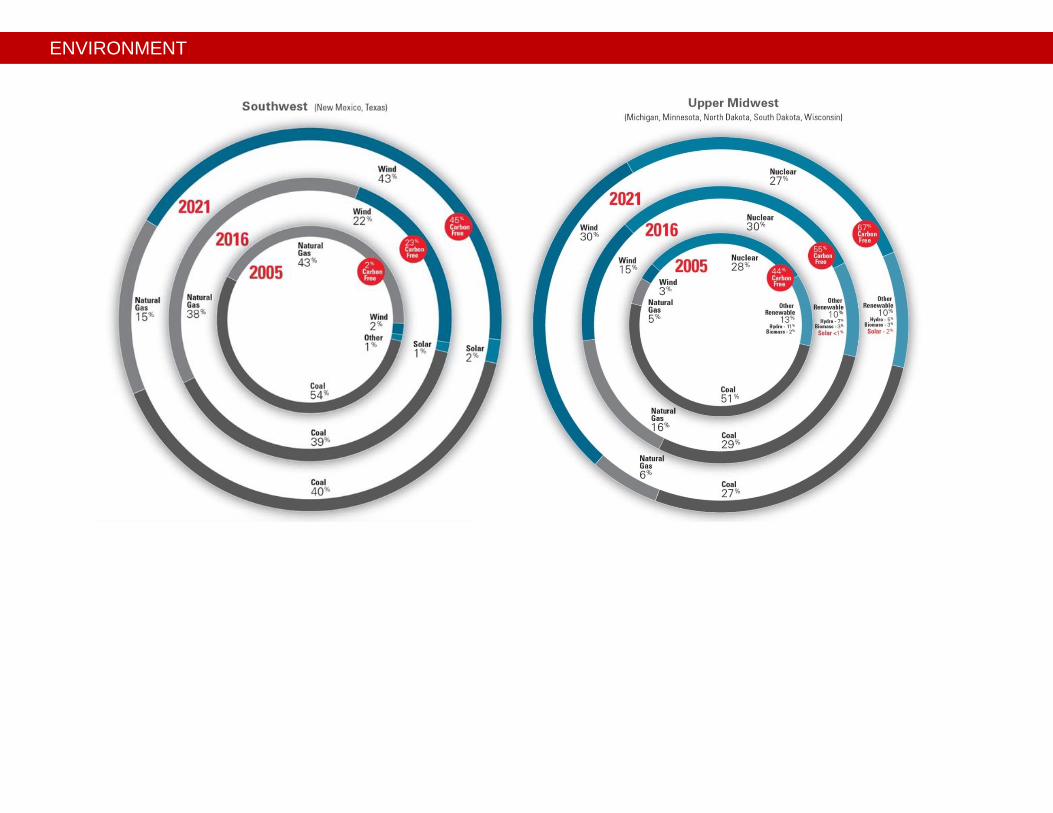
2016 Electricity Supply by Energy Source
The charts here provide a snapshot of all the electricity by fuel type on our system in 2016. We have included energy that Xcel Energy plants generated, energy that we purchased and energy that we supplied or made possible for customers under Xcel Energy renewable energy programs, Windsource®, Solar*Rewards® and Solar*Rewards Community®. We count nuclear and renewable energy sources as carbon free.

OPERATIONS
2016 Generating Plant Efficiency Thermal plant heat rates (BTU/kWh)
Coal
Natural Gas Combined-Cycle
Colorado 10,640 7,539 Southwest 10,558 - Upper Midwest 10,336 7,140 Xcel Energy 10,515 7,363 2016 Average Plant Availability Factor Coal 87.52 Natural gas 87.09

OPERATIONS
Xcel Energy Owned Generating Plants
Type Plants Units Net Dependable Capacity in Megawatts (MW)
Coal 9 19 6,991
Colorado 5 10 2,516
Upper Midwest 2 4 2,390
Southwest 2 5 2,085
Natural Gas 22 68 7,360
Colorado 7 20 2,560
Upper Midwest 9 29 2,452
Southwest 6 19 2,348
Nuclear 2 3 1,657
Upper Midwest 2 3 1,657
Hydro 26 79 377
Colorado 6 11 236
Upper Midwest 20 68 141
Wind* 5 476 852
Upper Midwest 5 476 852
Solar 4 4 0.08
Southwest 4 4 0.08
Other 4 20 416
Upper Midwest 4 20 416
Total 72 669 17,653
Colorado 18 41 5,312
Upper Midwest 42 600 7,908
Southwest 12 28 4,433
*Wind generation is based on net maximum capacity.

OPERATIONS
2016 Electric Transmission and Distribution Lines Transmission
Lines Distribution Lines
Transmission and Distribution Lines by Voltage
500 kV 345 kV 230 kV 161 kV 138 kV 115 kV <115 kV Minnesota, North Dakota,
South Dakota 28,540 78,548 2,917 9,012 2,157 417 - 7,517 85,068
Michigan, Wisconsin 9,879 27,205 - 1,153 - 1,577 - 1,817 32,537
Colorado 21,963 74,933 - 2,630 12,890 - 92 4,929 76,355
New Mexico, Texas 35,234 19,882 - 8,509 9,424 - - 12,685 24,498
TOTAL 95,616 200,568 2,917 21,304 24,471 1,994 92 26,948 218,458
(Provided in conductor miles— a measure of the conductor in use on our system in miles; it accounts for all conductor phases or strands on a circuit)
2016 Electric Transmission and Distribution Line Loss
Xcel Energy calculates electric line losses in accordance with The Climate Registry’s Electric Power Sector Protocol using method IE-01. Using this methodology, transmission and distribution losses were calculated to be 2.7 percent for 2016.
2016 Xcel Energy Reliability Results We measure electric system reliability through three indexes, using methodology provided by the Institute of Electrical and Electronics Engineers (IEEE). The methodology is commonly used in our industry and incorporating it improves our ability to benchmark Xcel Energy’s performance with other utilities. The System Average Interruption Duration Index (SAIDI) measures the average number of minutes a typical customer was without power in a year. The System Average Interruption Frequency Index (SAIFI) measures the average number of power outages that an average customer experienced in a year. The Customer Average Interruption Duration Index (CAIDI) measures the length of the average power outage in a year.
SAIDI SAIFI CAIDI Colorado 88.31 0.95 93.02 Michigan, Wisconsin 83.67 0.66 126.30 Minnesota, North Dakota, South Dakota
88.20 0.83 106.82
New Mexico, Texas 124.25 1.23 100.73 Xcel Energy Total 91.7 0.91 101.25

OPERATIONS
2016 Natural Gas Pipelines (measured in miles)
Transmission Distribution Minnesota, North Dakota 134 10,218 Michigan, Wisconsin -- 2,395 Colorado 2,281 22,262 WestGas Interstate (WGI)* 11 -- Xcel Energy Total 2,426 34,875 *WGI is an interstate natural gas pipeline company that is part of our continuing regulated utility operations.
2016 Xcel Energy Renewable Energy Portfolio (yearend)
Renewable Energy Capacity (in MW-AC)
Wind Hydro
Solar
Biomass RDF/ Landfill
Total Large Universal
Community Gardens
On-site Total Solar
Solar Rewards
Non-Solar Rewards
Colorado 2,566 66 256 14 290 13 573 - 3 3,208
Southwest 1,506 - 190 - 8 - 198 - - 1,704
Upper Midwest 2,604 312 169 36 25 10 240 189 104 3,449
Total 6,676 378 615 50 323 23 1,011 189 107 8,361

OPERATIONS
2016 REC Sales Transactions by Vintage Sold
2013 2014 2015 2016 2017 2018 2019 Total
Colorado -- 1,254,877 957,200
786,800
313,400 3,312,277
Southwest 50,000 225,000 --
-- -
- -- 275,000
Upper Midwest 86,157 64,974 271,076
--
-- -- -- 422,207
Total 86,157 114,974
496,076
1,254,877
957,200
786,800
313,400
4,009,484
Xcel Energy Daily System Wind Records:
System Percent of Load Served Date Colorado 55.5% Oct. 2, 2015 Southwest 50.8% Nov. 15, 2015 Upper Midwest 48.5% Nov. 12, 2016 Xcel Energy Total 45.4% March 6, 2017 Xcel Energy Hourly System Wind Records:
System Percent of Load Served
Date Time
Colorado 68.5% March 6, 2017 1-2 a.m. Southwest 57.6% April 5, 2016 5-6 a.m. Upper Midwest 61.4% March 6, 2017 1-2 a.m. Xcel Energy Total 57.0% March 6, 2017 1-2 a.m.
ENVIRONMENT
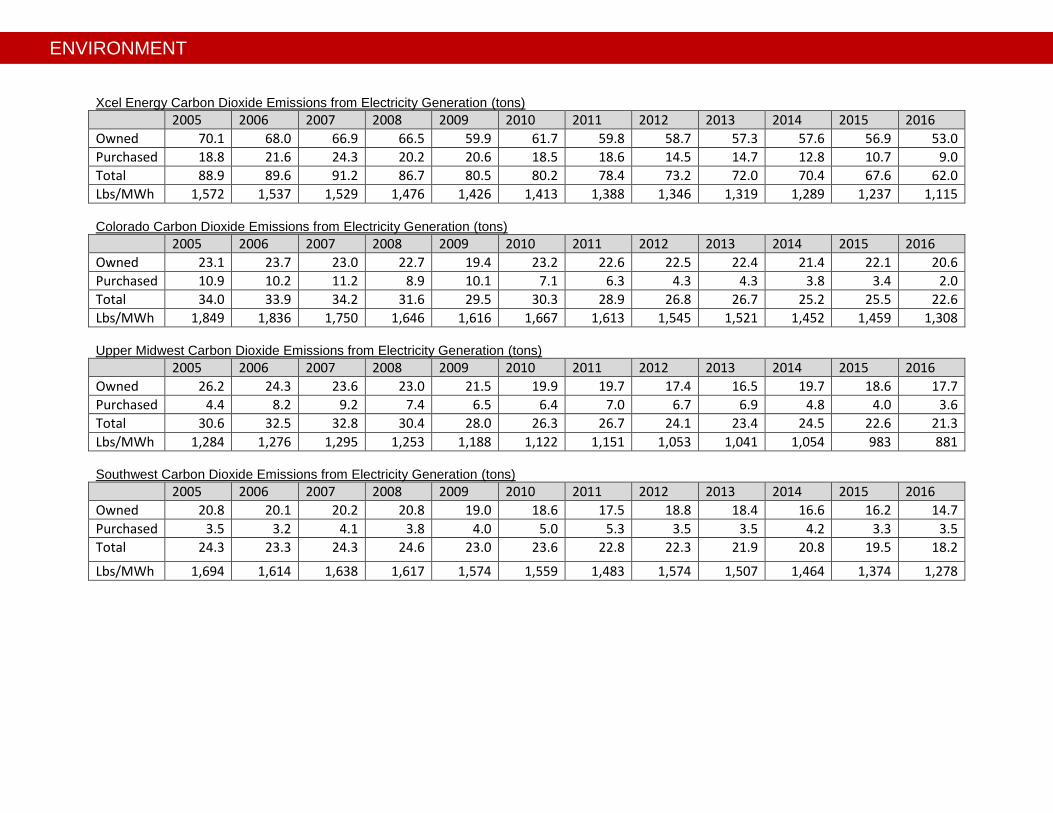
Xcel Energy Carbon Dioxide Emissions from Electricity Generation (tons)
2005 2006 2007 2008 2009 2010 2011 2012 2013 2014 2015 2016
Owned 70.1 68.0 66.9 66.5 59.9 61.7 59.8 58.7 57.3 57.6 56.9 53.0
Purchased 18.8 21.6 24.3 20.2 20.6 18.5 18.6 14.5 14.7 12.8 10.7 9.0
Total 88.9 89.6 91.2 86.7 80.5 80.2 78.4 73.2 72.0 70.4 67.6 62.0
Lbs/MWh 1,572 1,537 1,529 1,476 1,426 1,413 1,388 1,346 1,319 1,289 1,237 1,115 Colorado Carbon Dioxide Emissions from Electricity Generation (tons)
2005 2006 2007 2008 2009 2010 2011 2012 2013 2014 2015 2016
Owned 23.1 23.7 23.0 22.7 19.4 23.2 22.6 22.5 22.4 21.4 22.1 20.6
Purchased 10.9 10.2 11.2 8.9 10.1 7.1 6.3 4.3 4.3 3.8 3.4 2.0
Total 34.0 33.9 34.2 31.6 29.5 30.3 28.9 26.8 26.7 25.2 25.5 22.6
Lbs/MWh 1,849 1,836 1,750 1,646 1,616 1,667 1,613 1,545 1,521 1,452 1,459 1,308 Upper Midwest Carbon Dioxide Emissions from Electricity Generation (tons)
2005 2006 2007 2008 2009 2010 2011 2012 2013 2014 2015 2016
Owned 26.2 24.3 23.6 23.0 21.5 19.9 19.7 17.4 16.5 19.7 18.6 17.7
Purchased 4.4 8.2 9.2 7.4 6.5 6.4 7.0 6.7 6.9 4.8 4.0 3.6
Total 30.6 32.5 32.8 30.4 28.0 26.3 26.7 24.1 23.4 24.5 22.6 21.3
Lbs/MWh 1,284 1,276 1,295 1,253 1,188 1,122 1,151 1,053 1,041 1,054 983 881 Southwest Carbon Dioxide Emissions from Electricity Generation (tons)
2005 2006 2007 2008 2009 2010 2011 2012 2013 2014 2015 2016
Owned 20.8 20.1 20.2 20.8 19.0 18.6 17.5 18.8 18.4 16.6 16.2 14.7
Purchased 3.5 3.2 4.1 3.8 4.0 5.0 5.3 3.5 3.5 4.2 3.3 3.5
Total 24.3 23.3 24.3 24.6 23.0 23.6 22.8 22.3 21.9 20.8 19.5 18.2
Lbs/MWh 1,694 1,614 1,638 1,617 1,574 1,559 1,483 1,574 1,507 1,464 1,374 1,278

ENVIRONMENT
2016 Assertion Statement (CO2e metric tons)
Year Label Equity Share Operational Control
2016 Direct Biogenic Emissions 550,155.4 550,155.4
2016 Scope 1 Emissions 48,472,886.7 52,832,512.9
2016 Indirect Location Based Scope 2 Emissions 891,278.6 891,278.6
2016 Indirect Market Based Scope 2 Emissions 426,624.4 426,624.4
2016 Optional Scope 3 Emissions – Fuel and Energy Related Activities (Purchased Power for Resale) 8,781,128.6 8,827,650.8
2016 Optional Scope 3 Emissions – Business Travel 7,201.5 7,201.5
2016 Optional Scope 3 Emissions – Employee Commuting 24,230.7 24,230.7
Methodology
In this report, we include emissions from the electricity that we produce and that we purchase from third-party suppliers. A system emission rate is included for each year that provides the pounds of carbon emissions produced for each megawatt hour of electricity supplied. Emissions for 2016 are preliminary, and may slightly change during third-party verification, which should be completed by the end of 2017.
To provide transparent and complete emissions information for customers, we report biogenic carbon dioxide from biomass generation, as well as emissions from fossil fuel generation. We consider biogenic carbon emissions effectively neutral, since compared to fossil fuels, these emissions from biomass combustion are part of a relatively short-term cycling of carbon dioxide between ecosystems and the atmosphere.
Third-party assurance and verification
We recognize the value of having a formal emissions protocol and completing third-party verification for emissions reporting. In 2007, we became a founding member of The Climate Registry, a nonprofit organization established to provide consistent and transparent standards for calculating, verifying and reporting greenhouse gas emissions into a single registry for North America. All of our greenhouse gas emissions from 2005 to 2015 have been third-party verified and registered with The Climate Registry.
Other emissions reporting
Xcel Energy publicly reports annual carbon dioxide emissions, as well as other greenhouse gases, through a number of different reporting programs, including The Climate Registry, CDP and the U.S. Environmental Protection Agency’s mandatory greenhouse gas reporting rule. These programs each use a unique reporting protocol and may represent emissions differently. While reporting protocols and formats vary, the information we provide comes from the same foundation data.

ENVIRONMENT
Xcel Energy Sulfur Dioxide Emissions (owned tons)
2005 2006 2007 2008 2009 2010 2011 2012 2013 2014 2015 2016
Total 148,706 137,384 124,698 114,700 95,443 97,773 83,749 74,335 69,466 59,102 48,838 45,591
Lbs/MWh 3.7 3.4 3.2 3.0 2.7 2.5 2.2 2.0 2.0 1.6 1.3 1.2 Colorado Sulfur Dioxide Emissions (owned tons)
2005 2006 2007 2008 2009 2010 2011 2012 2013 2014 2015 2016
Total 39,955 41,462 41,898 38,291 25,400 29,776 26,745 23,918 23,284 13,257 9,099 8,512
Lbs/MWh 3.6 3.6 3.7 3.5 2.7 2.4 2.3 2.0 2.0 1.2 0.8 0.7 Upper Midwest Sulfur Dioxide Emissions (owned tons)
2005 2006 2007 2008 2009 2010 2011 2012 2013 2014 2015 2016
Total 65,869 54,022 44,712 37,077 25,235 23,190 22,047 15,844 12,403 13,604 8,504 7,869
Lbs/MWh 3.7 3.1 2.6 2.2 1.5 1.4 1.4 1.0 0.8 0.8 0.5 0.4 Southwest Sulfur Dioxide Emissions (owned tons)
2005 2006 2007 2008 2009 2010 2011 2012 2013 2014 2015 2016
Total 42,882 41,899 38,087 39,332 44,808 44,807 34,956 34,572 33,780 32,242 31,235 29,210
Lbs/MWh 3.9 3.8 3.6 3.7 4.6 4.6 3.6 3.5 3.6 3.8 3.8 3.9 Xcel Energy Nitrogen Oxide Emissions (owned tons)
2005 2006 2007 2008 2009 2010 2011 2012 2013 2014 2015 2016
Total 122,949 114,783 105,151 89,244 66,068 66,439 61,862 55,228 54,113 49,578 39,795 33,620
Lbs/MWh 3.1 2.9 2.7 2.3 1.8 1.7 1.6 1.5 1.5 1.3 1.1 0.9 Colorado Nitrogen Oxide Emissions (owned tons)
2005 2006 2007 2008 2009 2010 2011 2012 2013 2014 2015 2016
Total 34,736 35,227 34,853 33,102 25,585 27,965 25,659 21,450 22,239 18,266 15,325 12,053
Lbs/MWh 3.1 3.0 3.1 3.0 2.7 2.3 2.2 1.8 1.9 1.6 1.3 1.1 Upper Midwest Nitrogen Oxide Emissions (owned tons)
2005 2006 2007 2008 2009 2010 2011 2012 2013 2014 2015 2016
Total 58,303 51,158 47,487 34,300 22,235 20,423 19,833 18,181 17,385 18,964 12,379 10,760
Lbs/MWh 3.2 3.0 2.8 2.0 1.3 1.2 1.2 1.2 1.2 1.1 0.7 0.6

ENVIRONMENT
Southwest Nitrogen Oxide Emissions (owned tons)
2005 2006 2007 2008 2009 2010 2011 2012 2013 2014 2015 2016
Total 29,910 28,398 22,811 21,842 18,248 18,051 16,370 15,597 14,488 12,348 12,092 10,807
Lbs/MWh 2.7 2.6 2.2 2.1 1.9 1.9 1.7 1.6 1.5 1.5 1.5 1.4 Particulate Matter (owned tons)
2005 2006 2007 2008 2009 2010 2011 2012 2013 2014 2015 2016
Total 7,125 9,154 8,844 8,625 7,594 7,113 7,637 4,856 3,803 4,787 2,773 2,277 Mercury (owned pounds)
2005 2006 2007 2008 2009 2010 2011 2012 2013 2014 2015 2016
Total 2,654 2,579 2,118 2,007 1,915 1,557 1,333 1,344 1,333 1,151 366
Lbs/MWh 0.000033 0.000032 0.000027 0.000026 0.000027 0.000020 0.000018 0.000018 0.000018 0.000016 0.00005 0.000004 2016 Water Supply and Consumption (Billions of Gallons)
Water Withdrawn Municipal Effluent Water Consumed Water Returned
Colorado 10.33 0.81 9.54 1.60
Southwest 4.23 4.70 7.48 1.45
Upper Midwest 624.2 — 7.1 617.1
Find Xcel Energy’s Toxic Release Inventory reporting in the Mercury and Other Hazardous Substances brief. Find Xcel Energy’s waste reporting in the Waste Management brief.
ENVIRONMENT
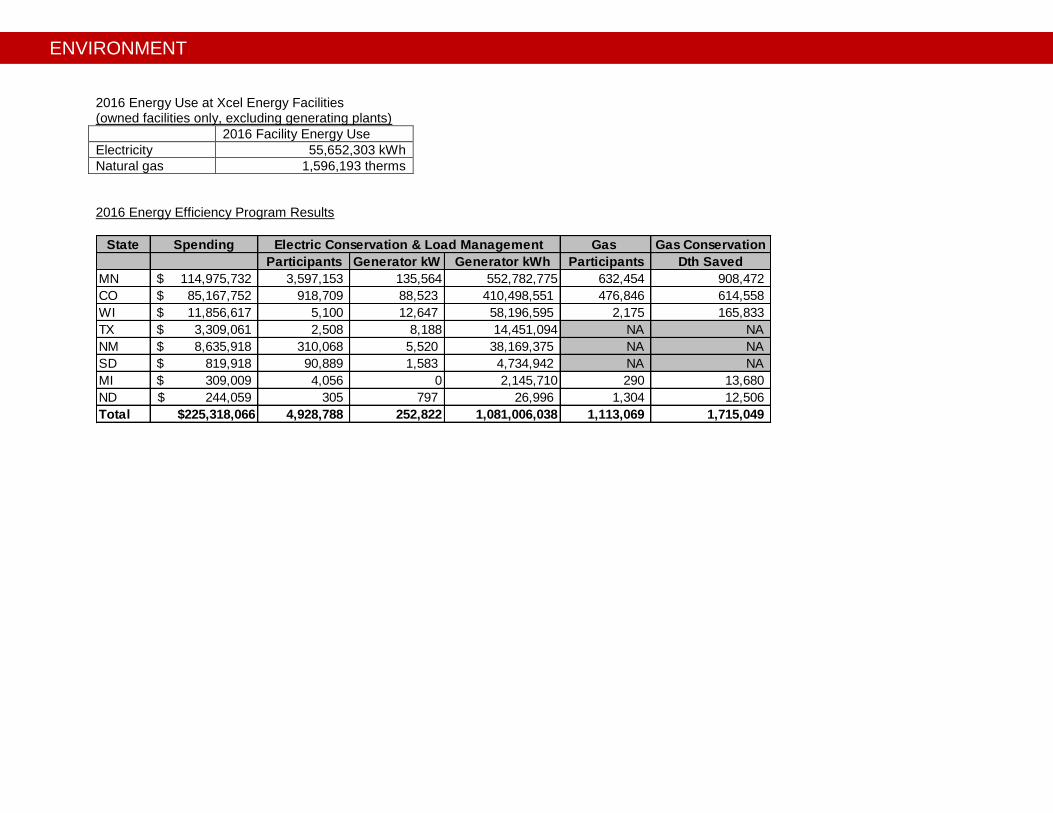
2016 Energy Use at Xcel Energy Facilities (owned facilities only, excluding generating plants)
2016 Facility Energy Use
Electricity 55,652,303 kWh
Natural gas 1,596,193 therms
2016 Energy Efficiency Program Results
State Spending Gas Gas Conservation
Participants Generator kW Generator kWh Participants Dth Saved
MN 114,975,732$ 3,597,153 135,564 552,782,775 632,454 908,472
CO 85,167,752$ 918,709 88,523 410,498,551 476,846 614,558
WI 11,856,617$ 5,100 12,647 58,196,595 2,175 165,833
TX 3,309,061$ 2,508 8,188 14,451,094 NA NA
NM 8,635,918$ 310,068 5,520 38,169,375 NA NA
SD 819,918$ 90,889 1,583 4,734,942 NA NA
MI 309,009$ 4,056 0 2,145,710 290 13,680
ND 244,059$ 305 797 26,996 1,304 12,506
Total $225,318,066 4,928,788 252,822 1,081,006,038 1,113,069 1,715,049
Electric Conservation & Load Management

ENVIRONMENT
ENVIRONMENT