company insight brit in equity december 16, 2014...
TRANSCRIPT
Ambit Capital and / or its affiliates do and seek to do business including investment banking with companies covered in its research reports. As a result, investors should be aware that Ambit Capital may have a conflict of interest that could affect the objectivity of this report. Investors should not consider this report as the only factor in making their investment decision.
Key financials – Consolidated Year to March FY13 FY14 FY15E FY16E FY17E Operating income (` mn) 61,854 69,127 78,489 91,397 106,241 EBITDA (` mn) 4,206 6,272 8,269 9,139 10,753 EBITDA Margin (%) 6.8% 9.1% 10.5% 10.0% 10.1% Adjusted EPS (`) 21.7 33.0 47.5 53.5 62.6 RoCE (%) 53.7% 58.3% 56.9% 47.2% 44.2% P/E (x) 84.8 55.8 38.7 34.4 29.4
Source: Company, Ambit Capital research
Product innovation in focus
Britannia’s recent premium product launches focusing on product differentiation, packaging, aggressive advertising and leveraging its strong brands are steps in the right direction. Moreover, as the company is resolving distributor issues (like supply chain inefficiencies) and improving its focus on systems and processes in the channel, we see a tangible improvement in distributor satisfaction levels. However, threat from Parle in the mass market and from ITC and Mondelez in the premium category should limit market share gains to 236bps (from 32% in FY15 to 34% in FY18). Also, EBITDA margin gains from the current levels will be offset by higher A&P spends to support new launches. We expect 16%/15% sales/EPS CAGR over FY15-18E. Our DCF-based TP of `1,370 implies 26x FY16E P/E, a justified discount to its current 34x FY16E P/E, due to industry growth of only 14%, with rising competitive intensity from both incumbents and new entrants.
Competitive position: STRONG Changes to this position: POSITIVE Product innovation likely to result in market share gains During 3QFY15, Britannia launched super-premium cookies focused on technology-driven product differentiation, superior packaging, aggressive advertising and leveraging on the existing strong brands. Over the next 12 months, the company is likely to do several new launches with a focus on: (a) premium product launches based on innovation; and (b) refreshing the existing successful products in the mid/mass portfolio. We expect market share gains of 445bps (from ~42% in FY15 to ~47% in FY18) in the premium market and 160bps (from ~30% in FY15 to ~32% in FY18) in the mass market for Britannia. Resolution of distributors’ issues and setting up systems and processes Distributors’ morale and satisfaction levels have risen over the past 12 months due to improvements in systems and processes like: (a) use of IT platform; (b) split salesman structure; and (c) increase in problem-solving authority with junior sales staff. Also, several distributors’ issues have been addressed, including: (a) reduction of damaged goods in the supply chain; (b) bridging the gap between margins for modern trade and general trade; and (c) re-calibrated incentive schemes for distributors. Thus, we expect support to market share gains from a stronger push-based demand in the future. However, our bullishness is capped by high competitive intensity The corrective changes highlighted above are steps in the right direction and hence we have upgraded our FY16/17E revenue forecasts by 3%/6% and EPS forecasts by 43%/42%. However, our bullishness around gains in market share and EBITDA margin is capped by: (a) the aggressive approach to product development by peers like ITC and Parle, and (b) heightened A&P spends for Britannia for the new product launches. Our TP of `1,370 implies 26x FY16 P/E, a 26% premium to the average 1-yr fwd multiple over the last three years. This implies a justified 10%/25% discount to our implied FY16 P/E of HUL and Nestle, which have demonstrated greater consistency of returns in the last 1-2 decades.
COMPANY INSIGHT BRIT IN EQUITY December 16, 2014
BritanniaSELL
Analyst Details
Rakshit Ranjan, CFA +91 22 3043 3201 [email protected]
Ritesh Vaidya +91 22 3043 3246 [email protected]
Consumer Staples
Recommendation Mcap (bn): `198/US$3.2 6M ADV (mn): `198/US$3.2 CMP: `1,840 TP (12 mths): `1,370 Downside (%): 26
Flags Accounting: GREEN Predictability: AMBER Earnings Momentum: GREEN
Catalysts
Downgrade to consensus FY16 EBITDA forecasts due to higher-than-expected A&P spends to back new launches
Aggressive rollout of Mondelez’s international product portfolio over the next 1-2 years
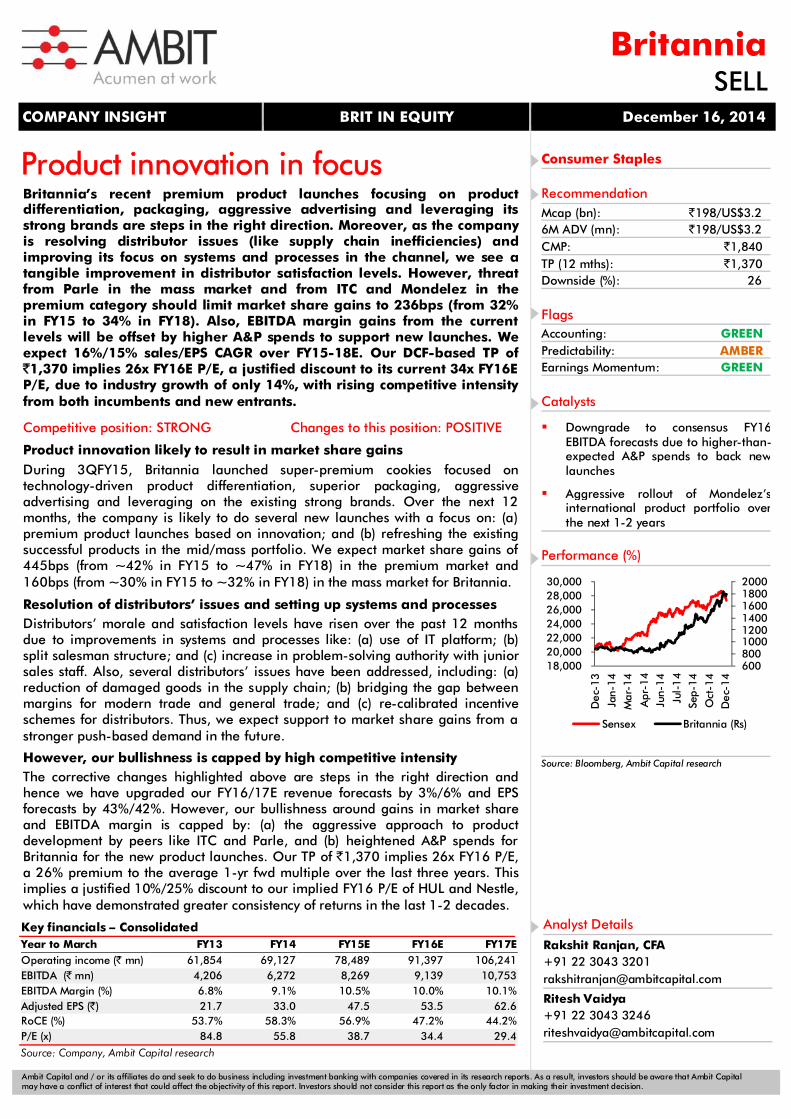
Performance (%)
Source: Bloomberg, Ambit Capital research
600800100012001400160018002000
18,000 20,000 22,000 24,000 26,000 28,000 30,000
Dec
-13
Jan-
14M
ar-1
4
Apr
-14
Jun-
14
Jul-
14
Sep-
14
Oct
-14
Dec
-14
Sensex Britannia (Rs)

Britannia
December 16, 2014 Ambit Capital Pvt. Ltd. Page 2
Product innovation back in focus Britannia has lagged its peers in product innovation in the last ten years, due to which the company saw a decline in its market share from ~35% in FY09 to 30% in FY14. ITC has been aggressive with product innovation in the last five years which has resulted in it being the market leader (>50% market share) in premium cream biscuits, which was initially dominated by Britannia. 3QFY15 has marked the beginning of Britannia’s product innovation with the launch of Nutri Choice Heavens and Good Day Choco Chunkies. Our discussions with the management suggest that product innovation will now be in focus for Britannia over the next two years as it tries to win back its lost market share particularly at the premium end of the market. We expect the firm to gain 236bps market share (from 32% in FY14 to 34% in FY18).
Britannia has lagged behind its peers in product innovation over FY05-14 In our initiation note published in May 2014 (‘Crumbling Cookie’), we had highlighted that Britannia’s weak product innovation over the past decade has led to the firm ceding market share in the premium segment. Consumption in the economy segment (~80% of the industry) has become commoditised, leaving limited room for Britannia to differentiate against price-led competition and lack of product differentiation from ITC and Parle.
ITC and Parle stepped up new product launches in 1HFY15 During 1HFY15, a slew of new products were launched by ITC and Parle, backed by aggressive advertising (see the exhibit below).
Exhibit 1: Parle and ITC have launched several products over the last quarter
New launches Month of launch Category Direct Competitors Comments
Parle Happy Happy Dual Cream biscuits Jul-14 Premium cream biscuits Cadbury Oreo
Parle has been launched Happy Happy (̀ 20.8/100gm) at a similar price point as Cadbury Oreo's strawberry and orange cream variant (̀ 20/100gm) but at a 20% discount to the Oreo vanilla (`25/100gm) variant. Parle is trying to differentiate by offering two flavours of cream in the same sandwich.
Parle Milano - Centre filled Dark Cookies Aug-14 Premium Cookies Sunfeast Dark
Fantasy Choco Fills Parle Milano retails at the same price (`400/100gm) as the ITC product but has differentiated by offering dark cookies.
Parle Simply Good Digestive Sep-14 Nutrition biscuits BIL NutriChoice
Digestive
Parle Simply Good retails at the same price (`20/100gm) as the Britannia product. Parle has differentiated by introducing three varieties which Britannia does not offer.
ITC Mom's Magic - Rich Butter Cookies Oct-14 Mid-premium cookies BIL Good Day
cookies
ITC has launched Mom's Magic (`13.3/100gm) in direct competition to the market leader, Good Day (̀ 15.2/100gm) and at a ~15% discount. The packaging appears more premium to Good Day and also the butter content in Mom's Magic is almost double of what Good Day offers.
Source: Company, Ambit Capital research
3QFY15 marks the beginning of Britannia’s new launches - Steps in the right direction Britannia has launched two new products in the super premium segment at price points which have not existed in the biscuit industry historically:
Nutrichoice Heavens: Priced at `50/100gms (25% premium to its closest competitor, Sunfeast Delishus Gourmet Cookies), positioned as premium health cookies.
Good Day Choco Chunkies: Priced at `50/100gms (50% premium to its closest competitor, Parle Milano), positioned as premium indulgence cookies, with as high as 30% of the ingredients being choco-chips.
Britannia
December 16, 2014 Ambit Capital Pvt. Ltd. Page 3
Exhibit 2: New super premium product launches from Britannia
New launches Month of launch Category Direct Competitors Comments
Britannia Nutri Choice Heavens Nov-14 Super Premium Cookies Sunfeast Farmlite,
Parle Simply Good
Britannia has launched Nutri Choice Heavens cookies (`50/100gm), positioning it as super premium healthy and tasty cookies. It has tried to leverage the strong brand equity of mother brand Nutri Choice and stave off competition from ITC ‘Farmlite’ and Parle ‘Simply Good’.
Britannia Good Day Choco Chunkies Nov-14 Premium Cookies Parle Milano
With the launch of Good Day Choco Chunkies (`50/100gm), Britannia has again leveraged the strength of its ‘Good Day’ brand to launch a premium choco chip cookie in direct competition to Parle Milano (`33.3/100gm).
Source: Company, Ambit Capital research
It is too early to call these launches a success because: (a) these price points have NOT been tested historically; and (b) Britannia is yet to complete the rollout of distribution and advertising behind these products. However, we believe that Britannia is moving in the right direction through these new launches because the company is:
Targeting an un-explored area of demand: Our discussions with the management suggest that the target audience for these price points (`50/100gms) can be divided into two parts: (a) a consumer who buys imported products which are NOT distributed in India by the manufacturer, and are available at price points as high as `80-100/100gms; based on anecdotal evidence, this market size is likely to be ~`500mn; and (b) premiumisation opportunity for consumers who currently buy premium products like Sunfeast Delishus Gourmet cookies and Dark Fantasy Chocofils; this market size is currently ~`2.4bn.
Leveraging on technology to deliver product differentiation: The management suggests that it has imported the technology used to manufacture these products.
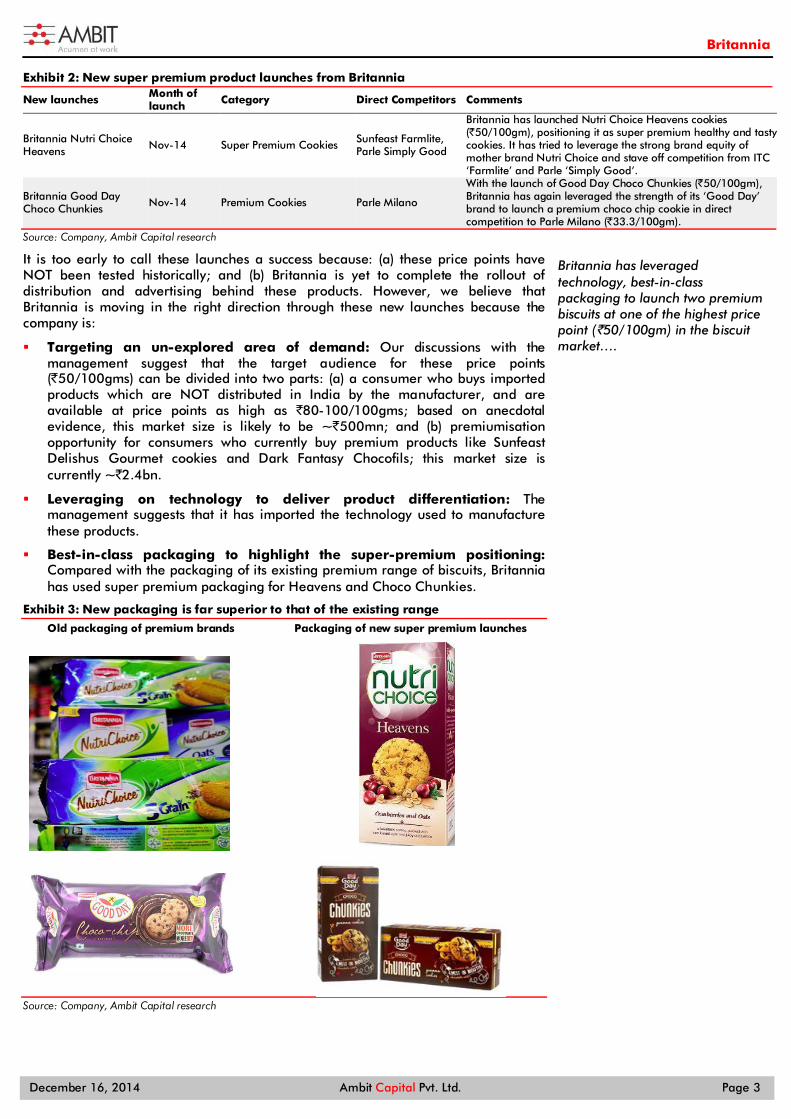
Best-in-class packaging to highlight the super-premium positioning: Compared with the packaging of its existing premium range of biscuits, Britannia has used super premium packaging for Heavens and Choco Chunkies.
Exhibit 3: New packaging is far superior to that of the existing range
Old packaging of premium brands Packaging of new super premium launches
Source: Company, Ambit Capital research
Britannia has leveraged technology, best-in-class packaging to launch two premium biscuits at one of the highest price point (`50/100gm) in the biscuit market….
Britannia
December 16, 2014 Ambit Capital Pvt. Ltd. Page 4
Leveraging on two of its strongest brands to premiumise consumers: Britannia has leveraged on its existing strong premium brands - Nutrichoice and Good Day - to launch these new products rather than launching new brands altogether.
Targeting to support the new launches with aggressive advertising from 4QFY15: Our discussions with the management suggest that the firm will aggressively launch advertising campaigns for these new launches from 4QFY15 onwards. Costs in 3QFY15 are still being directed towards product innovation and distribution.
Management’s approach towards product innovation in the future We recently met with Britannia’s R&D head, Sudhir Nema, and the company’s R&D consultant, Pascal Ville. Sudhir Nema was appointed as the R&D head at Britannia in August 2014. He previously was the head of the R&D team for the Foods category at PepsiCo India. Pascal Ville was appointed as the R&D head for Britannia in September 2013 but he has stepped down since August 2014. He now works as an independent consultant exclusively for Britannia.
Here are the key takeaways from our meeting:
Britannia’s innovation will be a combination of uniqueness and familiarity: According to Mr. Nema, innovation in the foods category has to be a correct mix of uniqueness and familiarity. On one hand, a very unique product may be a breakthrough innovation but could need several years of investment behind the brand till the consumers develop a taste for the product. This approach is easier for an MNC which can continue to make losses for several years until it creates a market for its products. For example, several years of investments behind Nestle’s ‘Maggi’ brand were needed after its launch before it was proven to be a success. On the other hand, a very familiar product allows easy replication by competitors, enabling them to launch a ‘me-too’ product. For example, the series of product innovations seen in the mass end of the biscuit market like Parle ’20-20’ cookies, Kreams cream biscuits, ITC Sunfeast cookies, and Bounce cream biscuits.
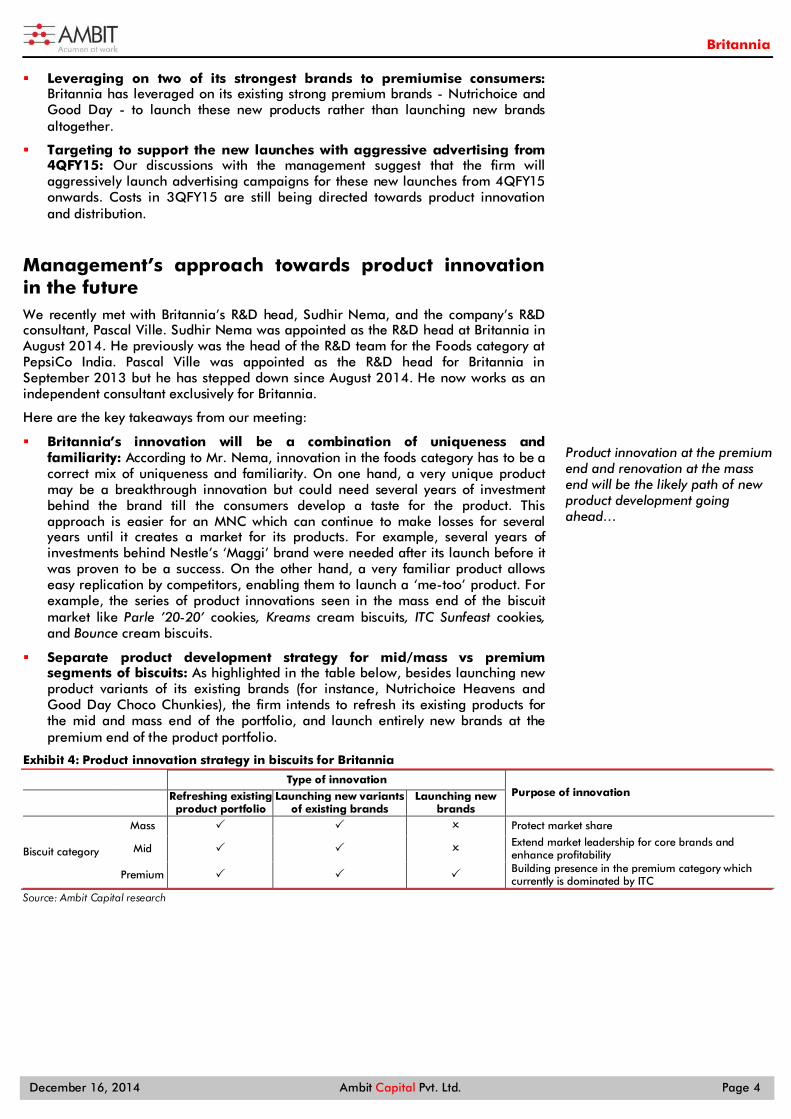
Separate product development strategy for mid/mass vs premium segments of biscuits: As highlighted in the table below, besides launching new product variants of its existing brands (for instance, Nutrichoice Heavens and Good Day Choco Chunkies), the firm intends to refresh its existing products for the mid and mass end of the portfolio, and launch entirely new brands at the premium end of the product portfolio.
Exhibit 4: Product innovation strategy in biscuits for Britannia
Type of innovation Purpose of innovation
Refreshing existing product portfolio
Launching new variants of existing brands
Launching new brands
Biscuit category
Mass Protect market share
Mid Extend market leadership for core brands and enhance profitability
Premium Building presence in the premium category which currently is dominated by ITC
Source: Ambit Capital research
Product innovation at the premium end and renovation at the mass end will be the likely path of new product development going ahead…

Britannia
December 16, 2014 Ambit Capital Pvt. Ltd. Page 5
Rising satisfaction amongst distributors Britannia has increased the efficiency and morale of its distributors by setting up new systems and processes like: (a) IT infrastructure for distributors, (b) split salesman approach to push a wider product portfolio; and (c) empowerment of junior sales managers to resolve some distributor-related issues. Resolution of existing issues has also resulted in a more motivated sales channel that is ready to work harder to help Britannia grow ahead of the market. The company has resolved the issues by: (a) Improving the supply chain to reduce damage of goods, (b) Offering a level-playing field for modern and general trade, and (c) Reworking the incentive structure to encourage distributors to achieve their targets. These initiatives, we believe, are likely to help the firm gain market share from its peers in a sustainable manner.
Our recent discussions with Britannia’s channel partners suggest that the company has made significant changes at the ground level over the past 6-12 months around: (a) Setting up of new systems and processes; and (b) Resolving the existing issues faced by distributors. These changes have resulted in an improved sentiment amongst distributors, which is one of the key competitive advantages in small-ticket FMCG products.
Setting up of new systems and processes New IT infrastructure for distributors to help improve transparency within
the channel and better MIS for stock tracking for Britannia
“In the last one year the company has rolled out its new IT system putting all transactions online. As a result, all promotions and benefits are rolled out across all distributors without a time lag. Also, these promotions are directly reflected in the billing process. Hence, distributors are now forced to pass on these offers to retailers unlike previously where they took advantage of the retailer’s ignorance to retain the promotions with them. We are offered extra 0.25% margin for daily upload of our sales data onto the IT platform.” – Britannia’s channel partner in west India
Such IT investments by Britannia have increased the transparency in the distributor billing process. This, we believe, allows for: (a) improved MIS for tracking inventory and forecasting demand; (b) evaluation of the impact of promotions on sales; and (c) equal treatment of Britannia’s channel partners.
Split salesman improves the ability to push the entire product portfolio
“In order to improve the focus across the entire product portfolio, Britannia introduced spilt salesmen. With two salesmen visiting the same retailer, more product lines are sold to the retailers and we have also seen a 15-20% increase in sales. In order to compensate us for the added cost of a sales representative, Britannia is giving us extra 0.5% margin.” – Britannia’s channel partner in west India
Over the last 12 months, the split salesman–led distribution model has led to higher-than-category sales growth for Britannia and hence market share gains, which will NOT be unwound in the future.
More decision-making power with Britannia’s junior sales managers allows resolution of some issues at their level
“The company has reduced one level of sales managers in order to reduce the hierarchy. Sales managers are now handling 2-3 distributors instead of just one distributor earlier. In regions which have larger scale or which require more focus, the company has appointed two Area Sales Managers instead of one. The current sales managers are given more decision-making power, enabling resolution of some distributor issues at their level itself. The entire sales team seems more fresh and even the top bosses are seen more often in the market than just sitting in their offices.” – Britannia’s channel partner in north India
“The new management seems more driven and intent on making a change for the betterment of the company. We also hope to benefit from the improving fortunes of the company.” - Britannia’s channel partner in north India
New IT infrastructure, split salesman, more decision marking power with junior salespersons are the steps taken to improving the systems and processes at the distributor level….

Britannia
December 16, 2014 Ambit Capital Pvt. Ltd. Page 6
Increased receptiveness and faster redressal of distributor issues improves distributor morale, encouraging them to try harder to achieve their sales targets. It also increases their stickiness towards Britannia over the longer term.
Resolving existing issues faced by distributors Supply chain efficiencies to reduce instances of damaged/near-expiry
products being delivered to distributors
“Mr. Varun Berry visited us personally and assured us that our interests will be taken care of. He visited our warehouses as well to understand the reason for high damages. Mr. Berry guaranteed us that damaged or near-expiry biscuits will not be sent to us from the company depot. By setting up these systems and checks he has reduced the limit of damage claims from 2.5% of sales to 1.5%. Benefits of these changes are visible to us over the past few months” – Britannia’s channel partner in north India
With new systems and checks in place to reduce damaged goods or supply of near-expiry goods, the company has limited damage claims to only 1.5% of sales at a distributor level, from the earlier limit of 2.5%. These benefits we believe have already accrued to Britannia in terms of higher operating margins.
Re-worked modern trade margins to resolve the issue of retailers being incentivised to buy from modern trade rather than general trade
“Modern trade due to their high volumes always got far better offers from Britannia. This allowed them to offer steep discounts which we could never match. Retailers would buy from these modern trade outlets due to which we would lose out on sales. Mr. Berry was very categorical in giving modern trade offers which were only slightly better than those offered to other distributors in a particular region. This has stopped retailers from buying directly from modern trade. As a result we are seeing an increase in our sales.” – Britannia’s channel partner in north India
By offering almost similar terms to modern and general trade, Varun Berry has assured distributors of their relevance for Britannia’s business. This has improved distributor morale and they are more motivated to work harder for the company.
Re-calibrated incentive schemes encouraging distributors to achieve their sales targets
“The top-two distributors in my area are being offered a trip to Switzerland based on their sales growth targets, which in turn are based on YoY sales growth rates. Since my turnover is already high it has been difficult for me to achieve the sales growth target on a high base. Hence, despite maintaining one of the largest distribution networks in the zone, I managed to win only a domestic travel trip last year. Realising my predicament, the company has now changed the criteria to evaluate our performance and it also looks at my increase in direct reach in addition to sales target. Now I am hopeful of achieving my target and getting the rewards. We also get an extra 0.25% margin for achieving our monthly sales target.” – Britannia’s channel partner in north India
Re-calibration of incentive schemes for distributors to ensure that targets and rewards truly reflect a distributors’ performance (such as measuring the increase in direct reach rather than only the sales growth target for a large distributor) motivates channel partners and helps improve push-based demand for the firm.
Improving supply chain efficiencies, similar margins for modern and general trade and a re-worked incentive scheme are the steps taken to resolve existing issues faced by distributors….
Britannia
December 16, 2014 Ambit Capital Pvt. Ltd. Page 7
We expect market share gains vs previous forecasts of share losses for Britannia Due to the positive changes implemented in its distribution channel and the company’s renewed focus on new product launches, we expect Britannia to deliver a sales CAGR of 16% over FY15-18E, including 236bps market share gains over this period (vs our expectation of 90bps of share losses previously). Gross margin benefits from premiumisation would likely be offset by higher A&P spends to back new product launches. However, given A&P spends optimisation of ~150bps YoY reported in 1HFY15, we have upgraded our EBITDA margin forecasts for FY16 onwards by 170bps. EPS as a result is likely to record 15% CAGR over FY15-18E.
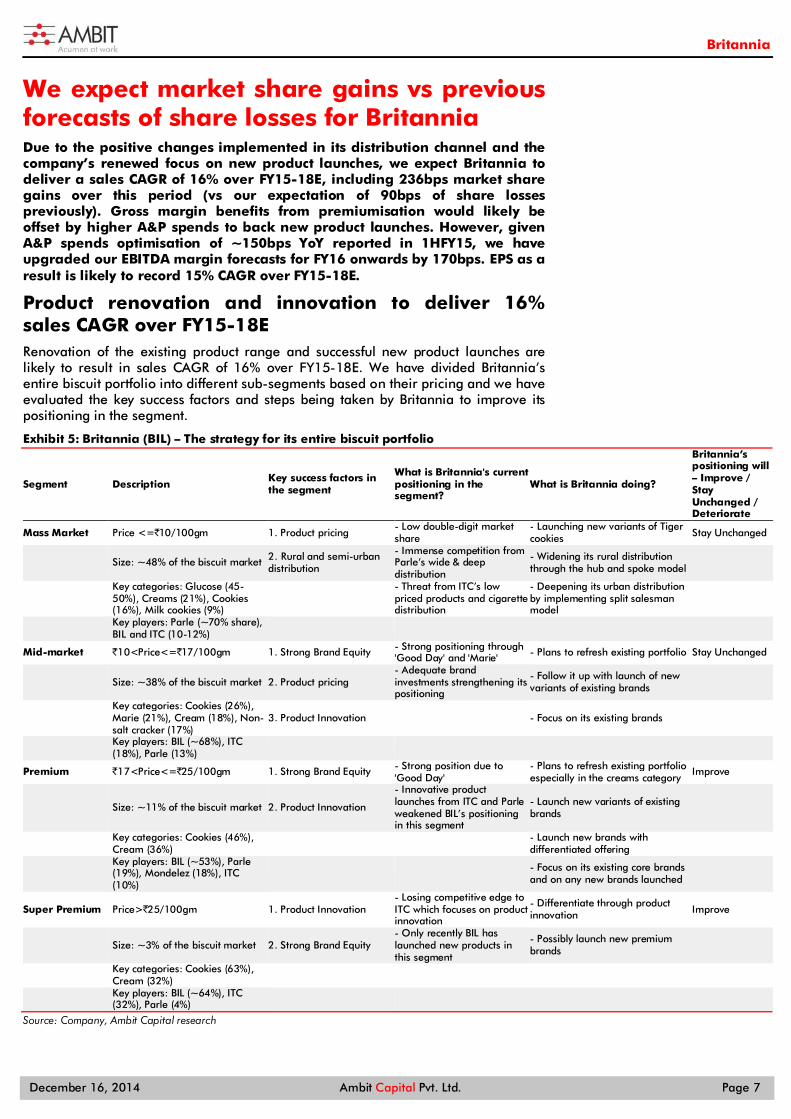
Product renovation and innovation to deliver 16% sales CAGR over FY15-18E Renovation of the existing product range and successful new product launches are likely to result in sales CAGR of 16% over FY15-18E. We have divided Britannia’s entire biscuit portfolio into different sub-segments based on their pricing and we have evaluated the key success factors and steps being taken by Britannia to improve its positioning in the segment.
Exhibit 5: Britannia (BIL) – The strategy for its entire biscuit portfolio
Segment Description Key success factors in the segment
What is Britannia's current positioning in the segment?
What is Britannia doing?
Britannia’s positioning will – Improve / Stay Unchanged / Deteriorate
Mass Market Price <=`10/100gm 1. Product pricing - Low double-digit market share
- Launching new variants of Tiger cookies Stay Unchanged
Size: ~48% of the biscuit market 2. Rural and semi-urban
distribution
- Immense competition from Parle’s wide & deep distribution
- Widening its rural distribution through the hub and spoke model
Key categories: Glucose (45-50%), Creams (21%), Cookies (16%), Milk cookies (9%)
- Threat from ITC’s low priced products and cigarette distribution
- Deepening its urban distribution by implementing split salesman model
Key players: Parle (~70% share), BIL and ITC (10-12%)
Mid-market `10<Price<=`17/100gm 1. Strong Brand Equity - Strong positioning through 'Good Day' and 'Marie' - Plans to refresh existing portfolio Stay Unchanged
Size: ~38% of the biscuit market 2. Product pricing - Adequate brand investments strengthening its positioning
- Follow it up with launch of new variants of existing brands
Key categories: Cookies (26%), Marie (21%), Cream (18%), Non-salt cracker (17%)
3. Product Innovation - Focus on its existing brands
Key players: BIL (~68%), ITC (18%), Parle (13%)
Premium `17<Price<=`25/100gm 1. Strong Brand Equity - Strong position due to 'Good Day'
- Plans to refresh existing portfolio especially in the creams category
Improve
Size: ~11% of the biscuit market 2. Product Innovation
- Innovative product launches from ITC and Parle weakened BIL’s positioning in this segment
- Launch new variants of existing brands
Key categories: Cookies (46%), Cream (36%)
- Launch new brands with differentiated offering
Key players: BIL (~53%), Parle (19%), Mondelez (18%), ITC (10%)
- Focus on its existing core brands and on any new brands launched
Super Premium Price>`25/100gm 1. Product Innovation - Losing competitive edge to ITC which focuses on product innovation
- Differentiate through product innovation Improve
Size: ~3% of the biscuit market 2. Strong Brand Equity - Only recently BIL has launched new products in this segment
- Possibly launch new premium brands
Key categories: Cookies (63%), Cream (32%)
Key players: BIL (~64%), ITC (32%), Parle (4%)
Source: Company, Ambit Capital research
Britannia
December 16, 2014 Ambit Capital Pvt. Ltd. Page 8
Given Britannia’s strategy, as highlighted above, over FY15-18, we expect the company to report 160bps market share gain in the mass- to mid-market segment. These gains are likely to come from fringe players in the mass market and Parle in the mid-market. In the premium to super premium category, we expect Britannia to gain 445bps market share over FY15-18 particularly from Parle and partially from ITC in the premium creams category.
We expect 14% revenue growth for overall biscuits market over FY15-18E
The organised biscuit market (~65% of the total biscuit market) grew at a CAGR of 17% over FY09-14 led by volume growth of ~8% and price/mix-led growth of ~9%. Premiumisation, we believe, contributed to most of the price/mix growth, as consumers changed their biscuit preference from glucose (30% of market in FY09 to 19% in FY13) to cookies (20% of market in FY09 to 26% in FY13) and creams (16% of market in FY09 to 23% in FY13). Over FY15-18E, we expect the biscuit market to record a CAGR of 14% led by: (a) ~300bps from premiumisation of consumer preference from cookies to premium/super premium cookies and cream biscuits, although at a slower pace than that over FY09-14, (b) ~700bps from volume growth led by increased penetration from current levels of ~60%, and (c) ~400bps from price-led growth.
As a result, due to a combination of market share gains and overall market growth rates, we expect overall market share gains of 236bps (from 32.2% in FY15 to 34.5% in FY18) over FY15-18E and revenue CAGR of 16% over FY15-18E.
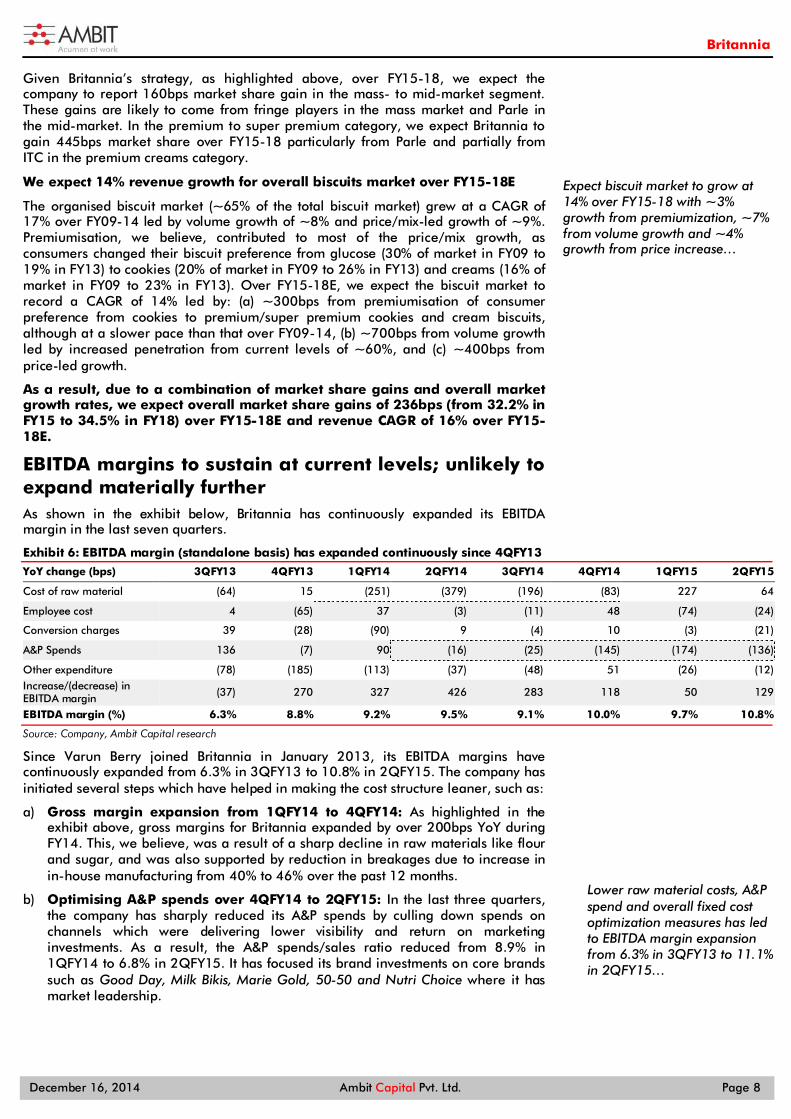
EBITDA margins to sustain at current levels; unlikely to expand materially further As shown in the exhibit below, Britannia has continuously expanded its EBITDA margin in the last seven quarters.
Exhibit 6: EBITDA margin (standalone basis) has expanded continuously since 4QFY13
YoY change (bps) 3QFY13 4QFY13 1QFY14 2QFY14 3QFY14 4QFY14 1QFY15 2QFY15
Cost of raw material (64) 15 (251) (379) (196) (83) 227 64
Employee cost 4 (65) 37 (3) (11) 48 (74) (24)
Conversion charges 39 (28) (90) 9 (4) 10 (3) (21)
A&P Spends 136 (7) 90 (16) (25) (145) (174) (136)
Other expenditure (78) (185) (113) (37) (48) 51 (26) (12) Increase/(decrease) in EBITDA margin (37) 270 327 426 283 118 50 129
EBITDA margin (%) 6.3% 8.8% 9.2% 9.5% 9.1% 10.0% 9.7% 10.8%
Source: Company, Ambit Capital research
Since Varun Berry joined Britannia in January 2013, its EBITDA margins have continuously expanded from 6.3% in 3QFY13 to 10.8% in 2QFY15. The company has initiated several steps which have helped in making the cost structure leaner, such as:
a) Gross margin expansion from 1QFY14 to 4QFY14: As highlighted in the exhibit above, gross margins for Britannia expanded by over 200bps YoY during FY14. This, we believe, was a result of a sharp decline in raw materials like flour and sugar, and was also supported by reduction in breakages due to increase in in-house manufacturing from 40% to 46% over the past 12 months.
b) Optimising A&P spends over 4QFY14 to 2QFY15: In the last three quarters, the company has sharply reduced its A&P spends by culling down spends on channels which were delivering lower visibility and return on marketing investments. As a result, the A&P spends/sales ratio reduced from 8.9% in 1QFY14 to 6.8% in 2QFY15. It has focused its brand investments on core brands such as Good Day, Milk Bikis, Marie Gold, 50-50 and Nutri Choice where it has market leadership.
Expect biscuit market to grow at 14% over FY15-18 with ~3% growth from premiumization, ~7% from volume growth and ~4% growth from price increase…
Lower raw material costs, A&P spend and overall fixed cost optimization measures has led to EBITDA margin expansion from 6.3% in 3QFY13 to 11.1% in 2QFY15…

Britannia
December 16, 2014 Ambit Capital Pvt. Ltd. Page 9
However, from current levels, we see only a gradual upside potential for margin expansion from current levels due to the following factors:
a) Portfolio premiumisation to have limited benefits: Britannia plans to target most of its new launches at the premium segment. However, in the foods category, the gross margin differential between premium and mass products is not large. This is because in premium variants the finest ingredients have to be used which increases the cost without a disproportionate increase in the price of the product. We assume premium products to have 30% more gross margin than mass products. With the proportion of premium products increasing from 19% of biscuits sales in FY15 to 23% in FY18, we assume premiumisation benefits to add 40bps to gross margin over FY15-18E.
b) A&P spends need to be stepped up to support new launches: We expect A&P spends of ~7.5% of sales for Britannia’s existing portfolio of products, i.e. in line with the current levels. However, additional spends will be needed to support new product launches. For a new product launch, we expect the company to spend ~35-40% of the new product sales as A&P for the first three years following the launch. As a result, we expect ~40bps higher A&P spends as a percentage of total sales to support new product launches over FY15-18.
Given the limited upside potential from premiumisation and the higher A&P spends needed to support new launches, we expect EBITDA margin to reduce over FY15-17E from the current levels of 10.5% to 10.1% in FY17. From FY18 onwards, as the pace of new launches reduces and the initial launches mature, we expect EBITDA margin expansion trends to resume. Overall, we expect ~18bps of EBITDA margin compression over FY15-18E (see the exhibit below).
Exhibit 7: EBITDA margin likely to come down over FY15-17 before rising back in FY18
Source: Company, Ambit Capital research
6.5%7.0%7.5%8.0%8.5%9.0%9.5%10.0%10.5%11.0%
37.0%
37.5%
38.0%
38.5%
39.0%
39.5%
40.0%
40.5%
FY13 FY14 FY15E FY16E FY17E FY18E
Gross margin % EBITDA margin % (RHS) A&P spends as % of sales (RHS)
We believe premiumization benefits over FY15-18 will be offset by higher A&P spends needed to support new product launches leading to flat EBITDA margin over the same period….

Britannia
December 16, 2014 Ambit Capital Pvt. Ltd. Page 10
Change to estimates Due to the factors detailed above, we have affected substantial upgrades to our estimates as highlighted in the exhibit below.
Exhibit 8: Change to estimates (in ̀ mn)
Sales New Old %ch Comment
FY15 78,489 78,727 0% Expect market share gains of 236bps over FY15-18 vs earlier expectations of market share loss of 90bps.
FY16 91,397 89,008 3%
FY17 106,241 100,485 6%
Gross Profit FY15 31,203 31,234 0% Lower premiumisation benefits as the
margin differential between mass and premium products is less.
FY16 36,495 35,668 2%
FY17 42,553 40,670 5%
Gross Margin (%) FY15 39.8% 39.7% 8 FY16 39.9% 40.1% -14 FY17 40.1% 40.5% -42 EBITDA FY15 8,269 6,671 24%
We have revised our EBITDA margin estimates substantially due to the significant margin expansion delivered over the last seven quarters (due to factors which we believe are sustainable). However, over FY16-17 we factor in YoY compression due to increased A&P spends (to support new product launches).
FY16 9,139 7,364 24%
FY17 10,753 8,615 25%
EBITDA margin (%) FY15 10.5% 8.5% 206
FY16 10.0% 8.3% 173
FY17 10.1% 8.6% 155
PAT FY15 5,696 4,036 41% EBITDA margin expansion flows down to
the PAT level supported by higher other income due to increased cash balances from sale of land.
FY16 6,422 4,486 43%
FY17 7,504 5,303 42%
TP 1,370 734 87% Source: Ambit Capital research
Why is our bullishness limited despite these changes? Due to the changes around product innovation in the right direction and resolving distributors’ issues and improving their morale, we are now factoring in market share gains for Britannia vs our earlier expectations of a share loss. However, the quantum of our expected market share gains is limited to only 236bps (from 32% in FY15 to 34% in FY15) over FY15-18 and our expectations of EBITDA margin expansion are limited to almost flat at 10.5% over the same period due to the following factors:
Face competition from Parle in the mass market: As we had highlighted in our initiation note, success in the mass market is hinged on a widespread distribution outreach. Due to the distributor-level changes implemented by Britannia in the last 18 months, we factor in market share gains for Britannia in this segment. However, Parle has an outreach of ~5.5mn outlets which is well penetrated in to rural and the Tier-II/III centres due to its strong mass market offering. The other threat is from ITC which is yet to completely separate out its cigarette and FMCG distribution which if implemented will sharpen its focus on its non-cigarette FMCG distribution.
Hence, we believe Britannia will have limited success in the mass market and factor in 160bps share gains over FY15-18 (from ~30% in FY15 to ~32% in FY18).
Britannia
December 16, 2014 Ambit Capital Pvt. Ltd. Page 11
ITC has capabilities to match Britannia in product innovation: As we had highlighted in our initiation note, at the premium end of the market that is more dependent on urban and modern trade, brand equity and product differentiation are the key success factors. Britannia stands to do well than most of its peers due to its: (a) strong brand equity and (b) inherent urban focus. If its innovations are a success, Britannia should gain share from Parle. It could also make consumers of imported biscuits to consumer more of Britannia’s super premium products. However, we expect ITC to also come out with a similar innovation as Britannia and we see a threat from Mondelez as well which has a ready global portfolio of similar premium biscuits. By leveraging on the brand equity of its existing brands (Nutri Choice and Good Day) and first mover advantage in the super premium category, we believe Britannia has a right to win in the premium segment and should gain ~450bps market share over FY15-18 (from 42% in FY15 to 47% in FY18).
Higher A&P spends to back new launches should limit EBITDA margin gains: Britannia has expanded its EBITDA margin in the last 18 months (from 6.4% in 3QFY13 to 11.1% in 2QFY15) through several cost optimisation measures implemented over this period. Whilst we expect these benefits to continue in the future, we believe the A&P spends which are near all-time lows of 7.3% of sales need to be increased to support the new product launches. We expect A&P spends to increase up to 8.2% of sales to support new launches. Hence, EBITDA margin is expected to remain flat at ~10.5% over FY15-18.
As a result, we expect 16% revenue CAGR over FY15-18 when the biscuits market is expected to grow at 14% CAGR (explained further in detail on page 9), and we forecast EPS CAGR of 15% over FY15-18.
Strength of Parle in the mass market and ITC in the premium market should limit market share gains for Britannia over FY15-18…..

Britannia
December 16, 2014 Ambit Capital Pvt. Ltd. Page 12
Summary of our key assumptions and estimates Exhibit 9: Key assumptions and estimates – others (in ̀ mn)
FY14 FY15E FY16E FY17E FY18E Comments
Profit and loss Total revenues 69,127 78,489 91,397 106,241 121,517 Revenue growth to be led by the biscuits segment growth of
~16% CAGR over FY15-18E Growth (%) 11.8% 13.5% 16.4% 16.2% 14.4%
Gross Profit 27,417 31,203 36,495 42,553 48,793 Gross margin likely to expand due to premiumisation benefits
Gross margin (%) 39.7% 39.8% 39.9% 40.1% 40.2%
Employee cost (% of sale) 3.8% 3.6% 3.8% 3.8% 3.8% Employee cost likely to remain stable
Advertising (% of sale) 8.7% 7.7% 8.2% 8.2% 8.1% New product launches would need higher spends
Freight (% of sale) 5.6% 5.6% 5.6% 5.6% 5.6% Employee cost likely to remain stable
Conversion charges (% of sale) 6.6% 6.4% 6.4% 6.4% 6.4% Employee cost likely to remain stable
Other expenses (% of sale) 5.9% 5.9% 5.9% 5.9% 5.9% Employee cost likely to remain stable
EBITDA 6,272 8,269 9,139 10,753 12,586 Above changes to lead to EBITDA margin compression over FY15-17 before expanding again in FY18 EBITDA Margin 9.1% 10.5% 10.0% 10.1% 10.4%
Tax rate 30.5% 29.0% 30.0% 31.0% 32.0% Build an increase in tax rate over FY15-18
Net Profit margin 5.7% 6.9% 6.7% 6.8% 7.0% Net profit margin likely to follow the trend in EBITDA margin
Balance Sheet Capex 1,460 1,000 1,500 1,500 1,500 Expect capex to remain at `1.5bn-2.0bn over FY14-16E as the
company commissions new factories Capital Work in Progress 1,071 1,071 1,071 1,071 1,071
Working Capital days -16 -9 -9 -8 -8
Debtor days 6 7 7 8 8 Expect debtor days to remain stable
Current Liabilities days 61 60 60 60 60 Expect current liabilities to remain stable
Inventory days 22 23 23 23 23 Expect inventories to remain stable
Net debt/(cash) to equity 0 0 0 -1 -1
Cash flows (̀ mn) Operating cash flows 5,979 5,824 8,074 9,035 10,669 FCF to grow materially from FY16E onwards as we factor in
slowing pace of capex Free cash flows 4,519 4,824 6,574 7,535 9,169
Source: Ambit Capital research
Britannia
December 16, 2014 Ambit Capital Pvt. Ltd. Page 13
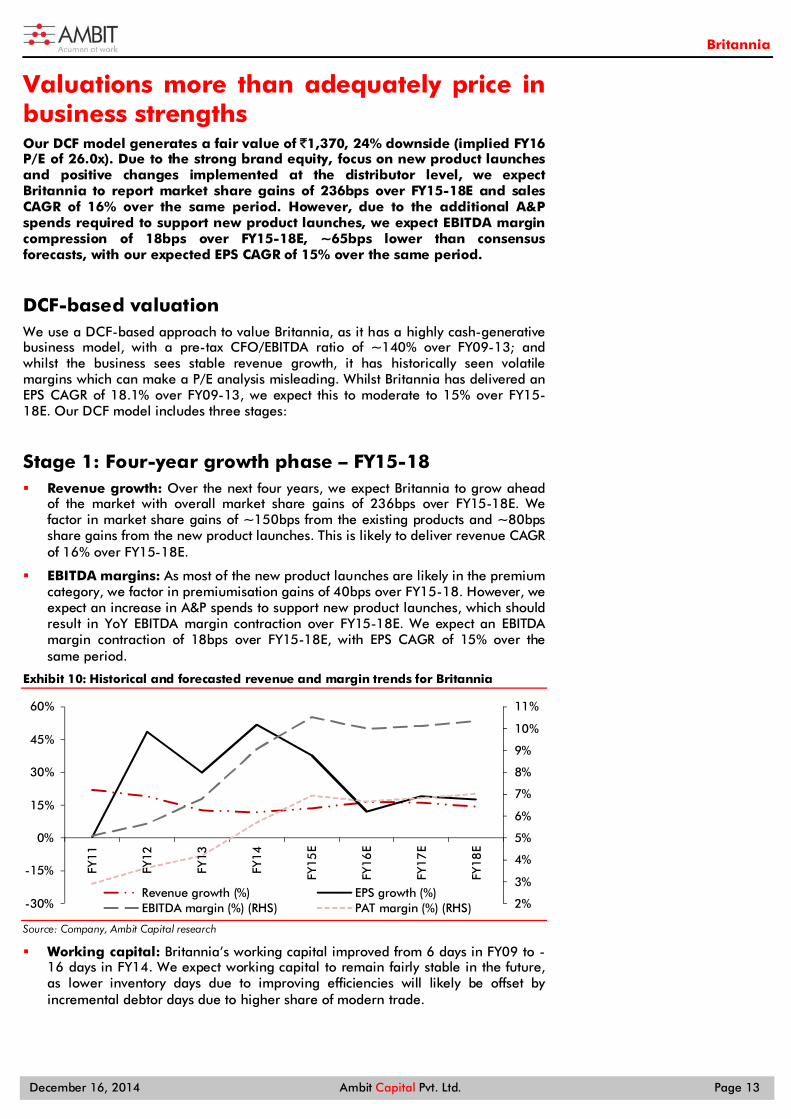
Valuations more than adequately price in business strengths Our DCF model generates a fair value of `1,370, 24% downside (implied FY16 P/E of 26.0x). Due to the strong brand equity, focus on new product launches and positive changes implemented at the distributor level, we expect Britannia to report market share gains of 236bps over FY15-18E and sales CAGR of 16% over the same period. However, due to the additional A&P spends required to support new product launches, we expect EBITDA margin compression of 18bps over FY15-18E, ~65bps lower than consensus forecasts, with our expected EPS CAGR of 15% over the same period.
DCF-based valuation We use a DCF-based approach to value Britannia, as it has a highly cash-generative business model, with a pre-tax CFO/EBITDA ratio of ~140% over FY09-13; and whilst the business sees stable revenue growth, it has historically seen volatile margins which can make a P/E analysis misleading. Whilst Britannia has delivered an EPS CAGR of 18.1% over FY09-13, we expect this to moderate to 15% over FY15-18E. Our DCF model includes three stages:
Stage 1: Four-year growth phase – FY15-18 Revenue growth: Over the next four years, we expect Britannia to grow ahead
of the market with overall market share gains of 236bps over FY15-18E. We factor in market share gains of ~150bps from the existing products and ~80bps share gains from the new product launches. This is likely to deliver revenue CAGR of 16% over FY15-18E.
EBITDA margins: As most of the new product launches are likely in the premium category, we factor in premiumisation gains of 40bps over FY15-18. However, we expect an increase in A&P spends to support new product launches, which should result in YoY EBITDA margin contraction over FY15-18E. We expect an EBITDA margin contraction of 18bps over FY15-18E, with EPS CAGR of 15% over the same period.
Exhibit 10: Historical and forecasted revenue and margin trends for Britannia
Source: Company, Ambit Capital research
Working capital: Britannia’s working capital improved from 6 days in FY09 to -16 days in FY14. We expect working capital to remain fairly stable in the future, as lower inventory days due to improving efficiencies will likely be offset by incremental debtor days due to higher share of modern trade.
2%
3%
4%
5%
6%
7%
8%
9%
10%
11%
-30%
-15%
0%
15%
30%
45%
60%
FY11
FY12
FY13
FY14
FY15
E
FY16
E
FY17
E
FY18
E
Revenue growth (%) EPS growth (%)EBITDA margin (%) (RHS) PAT margin (%) (RHS)

Britannia
December 16, 2014 Ambit Capital Pvt. Ltd. Page 14
Exhibit 11: Working capital cycle trends for Britannia
Source: Company, Ambit Capital research
Stage 2: Rising competition and penetration to lead to moderation towards perpetuity growth rate This stage of our DCF model forecasts a gradual moderation in revenue growth rates from 14% in FY18 to 7% in FY27 (an overall CAGR of 13% over this period). PBIT margins rise by 60bps over FY19-27, as A&P spends on new product launches taper off during this phase. This stage is based on our assumption that due to an increase in penetration levels of biscuits in India, Britannia’s revenue growth will start moderating after FY18 gradually.
Exhibit 12: Our assumptions on operating metrics in the fade period of our DCF valuation
Source: Company, Ambit Capital research
Stage 3: Growth to perpetuity Beyond FY27, we forecast a growth in revenues, earnings and cash flows at 5%, broadly in line with the long-term GDP growth forecasts for India.
Our DCF model uses a WACC of 13.5% for the company which is based on the computation shown in the table on the right.
(30)
(20)
(10)
-
10
20
30
40
50
60
70
FY11
FY12
FY13
FY14
FY15
E
FY16
E
FY17
E
FY18
E
Creditor days (LHS) Inventory days (LHS)Debtor days (RHS) WC Cycle (ex-cash) days (RHS)
5.0%
7.0%
9.0%
11.0%
13.0%
15.0%
17.0%
19.0%
5,000
10,000
15,000
20,000
25,000
30,000
FY18
E
FY19
E
FY20
E
FY21
E
FY22
E
FY23
E
FY24
E
FY25
E
FY26
E
FY27
E
FCFF Rs mn (LHS) Revenue Growth (RHS) PBIT Margin (RHS)
WACC assumptions
Particulars Value
Risk free rate (%) 8.5
Beta (2 year monthly) 0.72
Equity risk premium (%) 7.0
Cost of equity (%) 13.5
Cost of debt (%) 12.0
Debt/Equity ratio (%) 0%
Tax rate (%) 30.5
WACC (%) 13.5
Source: Ambit Capital research

Britannia
December 16, 2014 Ambit Capital Pvt. Ltd. Page 15
Exhibit 13: DCF-based valuation of ̀ 1,370/share
PV of the forecasting period upto FY27 (` bn) 80
Terminal Value (` bn) 77
Enterprise Value (̀ bn) 160
Less: Net-debt at Mar-15 (̀ bn) (5)
Implied equity value (` bn) 164
Implied equity value (̀ per share) 1,370
Source: Ambit Capital research
Scenario analysis – Bull case also gives no upside Considering the uncertainty of success of product innovation, we have done a scenario analysis by factoring in the varying degrees of success of new product launches and product renovation. In our base case scenario, we have a TP downside of ~26% whilst the bull case scenario delivers a TP downside of ~5%.
Exhibit 14: Scenario analysis suggests no upside even in the bull case
Base case (modest success in product innovation)
Bear case (failure of product innovation)
Bull case (huge success in product innovation)
TP 1,370 830 1,750
Up/Downside (%) -26% -54% -3%
Market Share Changes over FY15-18
Overall (bps) 236 (400) 763
Contribution from existing portfolio
<=1`17/100gm (bps) 100 (400) 450
>`17/100gm (bps) 275 (600) 600 Contribution from new product launches
<=1`17/100gm (bps) 60 - 230
>`17/100gm (bps) 170 - 400
Sales CAGR (FY15-18) 15.7% 9.7% 20.0%
Comments:
Market share gains of ~150bps in existing portfolio over FY15-18
through renovation. Successful new product launches likely to deliver
~80bps of market share gains. 25% of incremental sales over FY15-18
are likely to come from new launches.
We assume that the renovation of existing brands and new product
launches both results in a failure. As a result, Britannia's overall market
share is likely to decline 400bps over FY15-18.
We expect existing product portfolio renovation to be a huge success and hence deliver market share gains of
~4,500bps over FY15-18. New product launches are likely to deliver
~300bps of share gains. 32% of incremental sales over FY15-18 are
likely to come from new launches. Premiumisation gains at gross margin over FY15-18 40 27 32
A&P spends to support existing portfolio as % of sales 7.5% 7.5% 7.5%
Incremental A&P spends over FY15-18 to support new launches (% of sales, bps) 206 252 220
Comments:
We expect new launches to have a gestation period of three years. A&P spends are likely to be at ~35-40%
of sales from new launches.
We expect new launches to have a gestation period of three years. A&P
spends are likely to be at ~50% of sales from new launches.
We expect new launches to have a gestation period of three years. A&P
spends are likely to be at ~30% of sales from new launches.
EBITDA margin gains over FY14-18 (bps) 128 68 163
EPS CAGR (FY15-18) 15.0% 10.2% 21.4%
Source: Company, Ambit Capital research

Britannia
December 16, 2014 Ambit Capital Pvt. Ltd. Page 16
Relative valuation Exhibit 15: Consumer staples - Relative valuation table
CMP Mcap Stance Target Price
Upside/ Downside P/E EV/EBITDA ROCE Implied P/E
(̀ ) ($mn) FY15E FY16E FY15E FY16E FY15E FY16E FY15E FY16E
HUL 798 28,768 SELL 588 -26% 43.3 38.6 29.5 26.4 100.6% 86.9% 31.9 28.4
Nestle 6,230 10,125 SELL 4,750 -24% 52.0 45.0 29.1 26.0 33.8% 45.8% 39.7 34.3
Dabur 235 6,827 SELL 172 -27% 38.9 34.2 30.0 25.7 30.0% 30.5% 28.5 25.0
Godrej Consumer 920 5,213 SELL 700 -24% 37.1 31.9 19.2 16.3 16.8% 18.3% 28.2 24.2
GSK Consumer 5,780 4,003 SELL 4,330 -25% 40.1 35.0 34.1 29.4 32.9% 33.3% 30.0 26.2
Colgate 1,801 4,082 SELL 1,245 -31% 44.5 38.1 21.8 18.5 91.3% 100.1% 30.8 26.3
Marico 322 3,462 UR 312 -3% 36.0 27.9 23.2 18.0 30.8% 38.1% 34.9 27.1
ITC 396 48,754 NA NA NA 31.4 26.8 16.0 13.6 50.0% 50.0% NA NA
Emami 744 2,815 NA NA NA 36.3 30.7 22.4 19.2 42.0% 42.0% NA NA
Britannia 1,800 3,190 SELL 1,370 -26% 37.9 33.6 19.3 17.1 49.6% 44.8% 28.9 25.6
Median -25% 38.4 33.9 22.8 18.8 38% 43% 30.4 26.3
Source: Company, Ambit Capital research
As highlighted in the table above, Britannia is currently trading at only a 5% discount to its FMCG peer group median P/E valuations. Whilst we expect this discount to be fair as compared to its peers, we expect the valuation multiples for Britannia as well as its peers to de-rate from the current levels due to a combination of: (a) company-specific issues with regards to the product portfolio; (b) high competitive intensity; and (c) sluggish EPS CAG` with expected downgrades to consensus estimates in the coming quarters. Hence, we reiterate our SELL stance on the stock with a TP of `1,370 (24% downside, implying 26.0x FY16E P/E).
Exhibit 16: One-year forward price/sales band charts
Source: Company, Ambit Capital research
Exhibit 17: One-year forward P/E band charts
Source: Company, Ambit Capital research
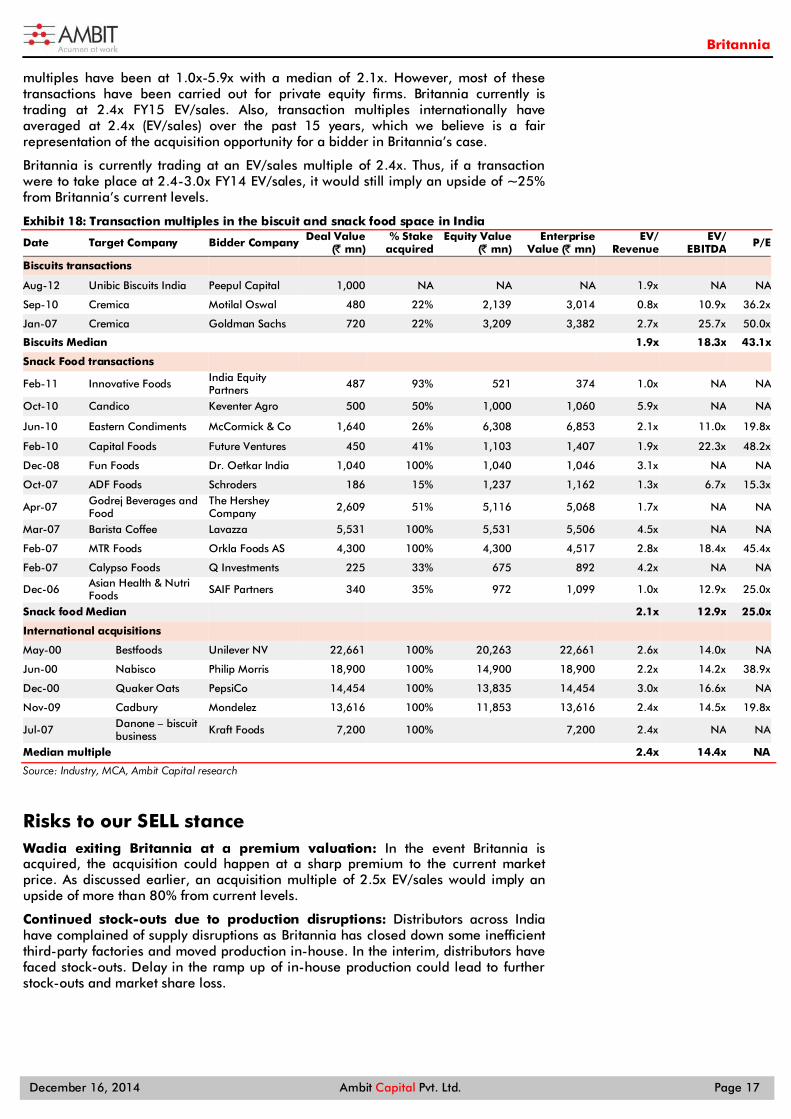
Strategic bid - An upside for investors? As highlighted in our previous report, we expect a possibility of Britannia’s promoters seeking strategic bids, with several players likely to be keen on targeting Britannia. The company offers the following benefits: (a) access to a ready distribution network to introduce the innovative products of the MNCs; and (b) access to the existing consumer base to help expand presence into other packaged foods categories. Consequently, there could be interest not only from biscuit manufacturers like Mondelez and United Biscuits but also for other firms looking to establish their presence in the fast-growth Indian packaged foods industry.
As highlighted in the table below, transaction multiples (EV/sales) in the biscuit space in India have been at 0.8x-2.7x with a median of 1.9x. In the snack food space,
150
350
550
750
950
1150
1350
1550
1750
1950
Dec
-08
Dec
-09
Dec
-10
Dec
-11
Dec
-12
Dec
-13
Dec
-14
0.9x
1.3x
1.7x
2.1x
2.5x
150
350
550
750950
1150
1350
1550
1750
1950
Dec
-08
Dec
-09
Dec
-10
Dec
-11
Dec
-12
Dec
-13
Dec
-14
15x
35x
30x
25x
20x
Britannia
December 16, 2014 Ambit Capital Pvt. Ltd. Page 17
multiples have been at 1.0x-5.9x with a median of 2.1x. However, most of these transactions have been carried out for private equity firms. Britannia currently is trading at 2.4x FY15 EV/sales. Also, transaction multiples internationally have averaged at 2.4x (EV/sales) over the past 15 years, which we believe is a fair representation of the acquisition opportunity for a bidder in Britannia’s case.
Britannia is currently trading at an EV/sales multiple of 2.4x. Thus, if a transaction were to take place at 2.4-3.0x FY14 EV/sales, it would still imply an upside of ~25% from Britannia’s current levels.
Exhibit 18: Transaction multiples in the biscuit and snack food space in India
Date Target Company Bidder Company Deal Value (̀ mn)
% Stake acquired
Equity Value (̀ mn)
Enterprise Value (̀ mn)
EV/ Revenue
EV/ EBITDA P/E
Biscuits transactions Aug-12 Unibic Biscuits India Peepul Capital 1,000 NA NA NA 1.9x NA NA
Sep-10 Cremica Motilal Oswal 480 22% 2,139 3,014 0.8x 10.9x 36.2x
Jan-07 Cremica Goldman Sachs 720 22% 3,209 3,382 2.7x 25.7x 50.0x
Biscuits Median 1.9x 18.3x 43.1x
Snack Food transactions Feb-11 Innovative Foods India Equity
Partners 487 93% 521 374 1.0x NA NA
Oct-10 Candico Keventer Agro 500 50% 1,000 1,060 5.9x NA NA
Jun-10 Eastern Condiments McCormick & Co 1,640 26% 6,308 6,853 2.1x 11.0x 19.8x
Feb-10 Capital Foods Future Ventures 450 41% 1,103 1,407 1.9x 22.3x 48.2x
Dec-08 Fun Foods Dr. Oetkar India 1,040 100% 1,040 1,046 3.1x NA NA
Oct-07 ADF Foods Schroders 186 15% 1,237 1,162 1.3x 6.7x 15.3x
Apr-07 Godrej Beverages and Food
The Hershey Company 2,609 51% 5,116 5,068 1.7x NA NA
Mar-07 Barista Coffee Lavazza 5,531 100% 5,531 5,506 4.5x NA NA
Feb-07 MTR Foods Orkla Foods AS 4,300 100% 4,300 4,517 2.8x 18.4x 45.4x
Feb-07 Calypso Foods Q Investments 225 33% 675 892 4.2x NA NA
Dec-06 Asian Health & Nutri Foods SAIF Partners 340 35% 972 1,099 1.0x 12.9x 25.0x
Snack food Median 2.1x 12.9x 25.0x
International acquisitions
May-00 Bestfoods Unilever NV 22,661 100% 20,263 22,661 2.6x 14.0x NA
Jun-00 Nabisco Philip Morris 18,900 100% 14,900 18,900 2.2x 14.2x 38.9x
Dec-00 Quaker Oats PepsiCo 14,454 100% 13,835 14,454 3.0x 16.6x NA
Nov-09 Cadbury Mondelez 13,616 100% 11,853 13,616 2.4x 14.5x 19.8x
Jul-07 Danone – biscuit business Kraft Foods 7,200 100% 7,200 2.4x NA NA
Median multiple 2.4x 14.4x NA
Source: Industry, MCA, Ambit Capital research
Risks to our SELL stance Wadia exiting Britannia at a premium valuation: In the event Britannia is acquired, the acquisition could happen at a sharp premium to the current market price. As discussed earlier, an acquisition multiple of 2.5x EV/sales would imply an upside of more than 80% from current levels.
Continued stock-outs due to production disruptions: Distributors across India have complained of supply disruptions as Britannia has closed down some inefficient third-party factories and moved production in-house. In the interim, distributors have faced stock-outs. Delay in the ramp up of in-house production could lead to further stock-outs and market share loss.
Britannia
December 16, 2014 Ambit Capital Pvt. Ltd. Page 18
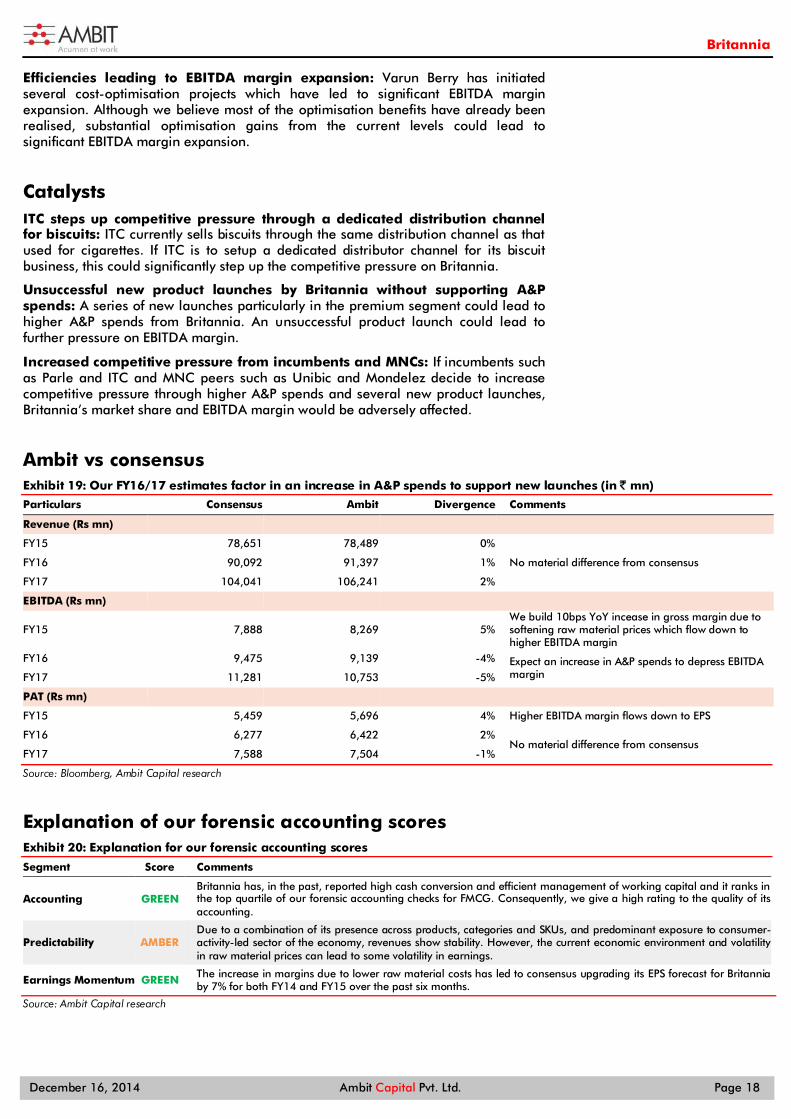
Efficiencies leading to EBITDA margin expansion: Varun Berry has initiated several cost-optimisation projects which have led to significant EBITDA margin expansion. Although we believe most of the optimisation benefits have already been realised, substantial optimisation gains from the current levels could lead to significant EBITDA margin expansion.
Catalysts ITC steps up competitive pressure through a dedicated distribution channel for biscuits: ITC currently sells biscuits through the same distribution channel as that used for cigarettes. If ITC is to setup a dedicated distributor channel for its biscuit business, this could significantly step up the competitive pressure on Britannia.
Unsuccessful new product launches by Britannia without supporting A&P spends: A series of new launches particularly in the premium segment could lead to higher A&P spends from Britannia. An unsuccessful product launch could lead to further pressure on EBITDA margin.
Increased competitive pressure from incumbents and MNCs: If incumbents such as Parle and ITC and MNC peers such as Unibic and Mondelez decide to increase competitive pressure through higher A&P spends and several new product launches, Britannia’s market share and EBITDA margin would be adversely affected.
Ambit vs consensus Exhibit 19: Our FY16/17 estimates factor in an increase in A&P spends to support new launches (in ̀ mn)
Particulars Consensus Ambit Divergence Comments
Revenue (Rs mn) FY15 78,651 78,489 0%
No material difference from consensus FY16 90,092 91,397 1%
FY17 104,041 106,241 2%
EBITDA (Rs mn)
FY15 7,888 8,269 5% We build 10bps YoY incease in gross margin due to softening raw material prices which flow down to higher EBITDA margin
FY16 9,475 9,139 -4% Expect an increase in A&P spends to depress EBITDA margin FY17 11,281 10,753 -5%
PAT (Rs mn) FY15 5,459 5,696 4% Higher EBITDA margin flows down to EPS
FY16 6,277 6,422 2% No material difference from consensus
FY17 7,588 7,504 -1%
Source: Bloomberg, Ambit Capital research
Explanation of our forensic accounting scores Exhibit 20: Explanation for our forensic accounting scores
Segment Score Comments
Accounting GREEN Britannia has, in the past, reported high cash conversion and efficient management of working capital and it ranks in the top quartile of our forensic accounting checks for FMCG. Consequently, we give a high rating to the quality of its accounting.
Predictability AMBER Due to a combination of its presence across products, categories and SKUs, and predominant exposure to consumer-activity-led sector of the economy, revenues show stability. However, the current economic environment and volatility in raw material prices can lead to some volatility in earnings.
Earnings Momentum GREEN The increase in margins due to lower raw material costs has led to consensus upgrading its EPS forecast for Britannia by 7% for both FY14 and FY15 over the past six months.
Source: Ambit Capital research
Britannia
December 16, 2014 Ambit Capital Pvt. Ltd. Page 19
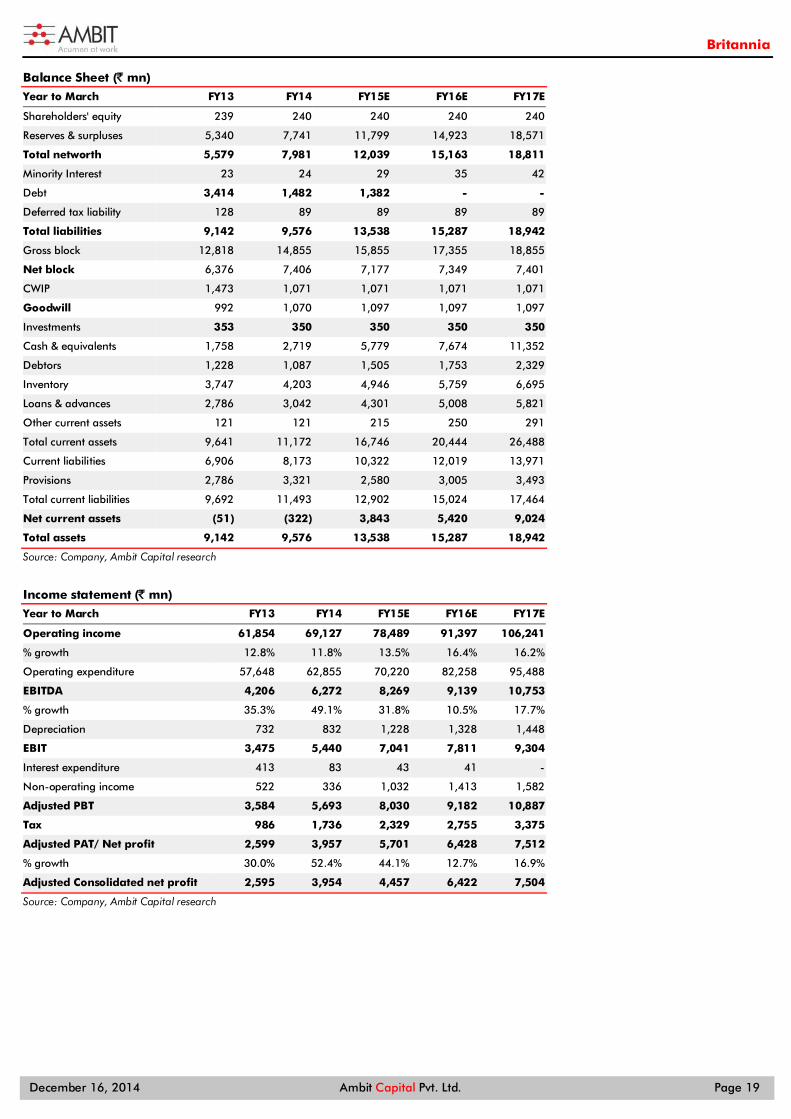
Balance Sheet (` mn)
Year to March FY13 FY14 FY15E FY16E FY17E
Shareholders' equity 239 240 240 240 240
Reserves & surpluses 5,340 7,741 11,799 14,923 18,571
Total networth 5,579 7,981 12,039 15,163 18,811
Minority Interest 23 24 29 35 42
Debt 3,414 1,482 1,382 - -
Deferred tax liability 128 89 89 89 89
Total liabilities 9,142 9,576 13,538 15,287 18,942
Gross block 12,818 14,855 15,855 17,355 18,855
Net block 6,376 7,406 7,177 7,349 7,401
CWIP 1,473 1,071 1,071 1,071 1,071
Goodwill 992 1,070 1,097 1,097 1,097
Investments 353 350 350 350 350
Cash & equivalents 1,758 2,719 5,779 7,674 11,352
Debtors 1,228 1,087 1,505 1,753 2,329
Inventory 3,747 4,203 4,946 5,759 6,695
Loans & advances 2,786 3,042 4,301 5,008 5,821
Other current assets 121 121 215 250 291
Total current assets 9,641 11,172 16,746 20,444 26,488
Current liabilities 6,906 8,173 10,322 12,019 13,971
Provisions 2,786 3,321 2,580 3,005 3,493
Total current liabilities 9,692 11,493 12,902 15,024 17,464
Net current assets (51) (322) 3,843 5,420 9,024
Total assets 9,142 9,576 13,538 15,287 18,942
Source: Company, Ambit Capital research
Income statement (` mn)
Year to March FY13 FY14 FY15E FY16E FY17E
Operating income 61,854 69,127 78,489 91,397 106,241
% growth 12.8% 11.8% 13.5% 16.4% 16.2%
Operating expenditure 57,648 62,855 70,220 82,258 95,488
EBITDA 4,206 6,272 8,269 9,139 10,753
% growth 35.3% 49.1% 31.8% 10.5% 17.7%
Depreciation 732 832 1,228 1,328 1,448
EBIT 3,475 5,440 7,041 7,811 9,304
Interest expenditure 413 83 43 41 -
Non-operating income 522 336 1,032 1,413 1,582
Adjusted PBT 3,584 5,693 8,030 9,182 10,887
Tax 986 1,736 2,329 2,755 3,375
Adjusted PAT/ Net profit 2,599 3,957 5,701 6,428 7,512
% growth 30.0% 52.4% 44.1% 12.7% 16.9%
Adjusted Consolidated net profit 2,595 3,954 4,457 6,422 7,504
Source: Company, Ambit Capital research
Britannia
December 16, 2014 Ambit Capital Pvt. Ltd. Page 20
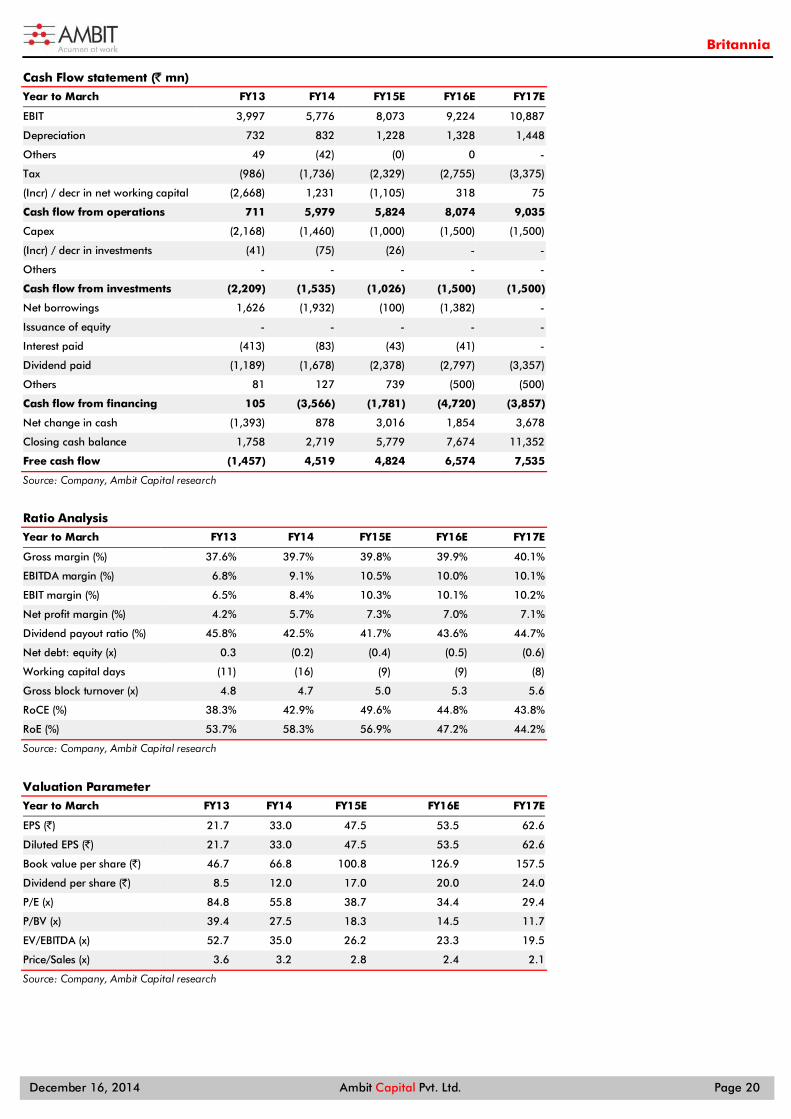
Cash Flow statement (` mn)
Year to March FY13 FY14 FY15E FY16E FY17E
EBIT 3,997 5,776 8,073 9,224 10,887
Depreciation 732 832 1,228 1,328 1,448
Others 49 (42) (0) 0 -
Tax (986) (1,736) (2,329) (2,755) (3,375)
(Incr) / decr in net working capital (2,668) 1,231 (1,105) 318 75
Cash flow from operations 711 5,979 5,824 8,074 9,035
Capex (2,168) (1,460) (1,000) (1,500) (1,500)
(Incr) / decr in investments (41) (75) (26) - -
Others - - - - -
Cash flow from investments (2,209) (1,535) (1,026) (1,500) (1,500)
Net borrowings 1,626 (1,932) (100) (1,382) -
Issuance of equity - - - - -
Interest paid (413) (83) (43) (41) -
Dividend paid (1,189) (1,678) (2,378) (2,797) (3,357)
Others 81 127 739 (500) (500)
Cash flow from financing 105 (3,566) (1,781) (4,720) (3,857)
Net change in cash (1,393) 878 3,016 1,854 3,678
Closing cash balance 1,758 2,719 5,779 7,674 11,352
Free cash flow (1,457) 4,519 4,824 6,574 7,535
Source: Company, Ambit Capital research
Ratio Analysis
Year to March FY13 FY14 FY15E FY16E FY17E
Gross margin (%) 37.6% 39.7% 39.8% 39.9% 40.1%
EBITDA margin (%) 6.8% 9.1% 10.5% 10.0% 10.1%
EBIT margin (%) 6.5% 8.4% 10.3% 10.1% 10.2%
Net profit margin (%) 4.2% 5.7% 7.3% 7.0% 7.1%
Dividend payout ratio (%) 45.8% 42.5% 41.7% 43.6% 44.7%
Net debt: equity (x) 0.3 (0.2) (0.4) (0.5) (0.6)
Working capital days (11) (16) (9) (9) (8)
Gross block turnover (x) 4.8 4.7 5.0 5.3 5.6
RoCE (%) 38.3% 42.9% 49.6% 44.8% 43.8%
RoE (%) 53.7% 58.3% 56.9% 47.2% 44.2%
Source: Company, Ambit Capital research
Valuation Parameter
Year to March FY13 FY14 FY15E FY16E FY17E
EPS (`) 21.7 33.0 47.5 53.5 62.6
Diluted EPS (`) 21.7 33.0 47.5 53.5 62.6
Book value per share (`) 46.7 66.8 100.8 126.9 157.5
Dividend per share (`) 8.5 12.0 17.0 20.0 24.0
P/E (x) 84.8 55.8 38.7 34.4 29.4
P/BV (x) 39.4 27.5 18.3 14.5 11.7
EV/EBITDA (x) 52.7 35.0 26.2 23.3 19.5
Price/Sales (x) 3.6 3.2 2.8 2.4 2.1
Source: Company, Ambit Capital research
Britannia
December 16, 2014 Ambit Capital Pvt. Ltd. Page 21
Institutional Equities Team Saurabh Mukherjea, CFA CEO, Institutional Equities (022) 30433174 [email protected]
Research
Analysts Industry Sectors Desk-Phone E-mail
Nitin Bhasin - Head of Research E&C / Infra / Cement / Industrials (022) 30433241 [email protected]
Aadesh Mehta, CFA Banking / Financial Services (022) 30433239 [email protected]
Achint Bhagat Cement / Infrastructure (022) 30433178 [email protected]
Aditya Bagul Consumer (022) 30433264 [email protected]
Aditya Khemka Healthcare (022) 30433272 [email protected]
Ashvin Shetty, CFA Automobile (022) 30433285 [email protected]
Bhargav Buddhadev Power Utilities / Capital Goods (022) 30433252 [email protected]
Dayanand Mittal, CFA Oil & Gas / Metals & Mining (022) 30433202 [email protected]
Deepesh Agarwal Power Utilities / Capital Goods (022) 30433275 [email protected] Gaurav Mehta, CFA Strategy / Derivatives Research (022) 30433255 [email protected]
Karan Khanna Strategy (022) 30433251 [email protected]
Krishnan ASV Real Estate (022) 30433205 [email protected]
Pankaj Agarwal, CFA Banking / Financial Services (022) 30433206 [email protected]
Paresh Dave, CFA Healthcare (022) 30433212 [email protected]
Parita Ashar Metals & Mining / Oil & Gas (022) 30433223 [email protected]
Rakshit Ranjan, CFA Consumer / Retail (022) 30433201 [email protected]
Ravi Singh Banking / Financial Services (022) 30433181 [email protected]
Ritesh Gupta, CFA Midcaps – Chemical / Retail (022) 30433242 [email protected]
Ritesh Vaidya Consumer (022) 30433246 [email protected] Ritika Mankar Mukherjee, CFA Economy / Strategy (022) 30433175 [email protected]
Ritu Modi Automobile (022) 30433292 [email protected]
Sagar Rastogi Technology (022) 30433291 [email protected]
Sumit Shekhar Economy / Strategy (022) 30433229 [email protected]
Sandeep Gupta Media / Midcaps (022) 30433211 [email protected]
Tanuj Mukhija, CFA E&C / Infra / Industrials (022) 30433203 [email protected]
Utsav Mehta Technology (022) 30433209 [email protected]
Sales
Name Regions Desk-Phone E-mail
Sarojini Ramachandran - Head of Sales UK +44 (0) 20 7614 8374 [email protected]
Deepak Sawhney India / Asia (022) 30433295 [email protected]
Dharmen Shah India / Asia (022) 30433289 [email protected]
Dipti Mehta India / USA (022) 30433053 [email protected]
Hitakshi Mehra India (022) 30433204 [email protected]
Nityam Shah, CFA USA / Europe (022) 30433259 [email protected]
Parees Purohit, CFA UK / USA (022) 30433169 [email protected]
Praveena Pattabiraman India / Asia (022) 30433268 [email protected]
Production
Sajid Merchant Production (022) 30433247 [email protected]
Sharoz G Hussain Production (022) 30433183 [email protected]
Joel Pereira Editor (022) 30433284 [email protected]
Nikhil Pillai Database (022) 30433265 [email protected]
E&C = Engineering & Construction

Britannia
December 16, 2014 Ambit Capital Pvt. Ltd. Page 22
Britannia (BRIT IN, SELL) - Stock price performance
Source: Bloomberg, Ambit Capital research
0
500
1,000
1,500
2,000
Dec
-11
Feb-
12
Apr
-12
Jun-
12
Aug
-12
Oct
-12
Dec
-12
Feb-
13
Apr
-13
Jun-
13
Aug
-13
Oct
-13
Dec
-13
Feb-
14
Apr
-14
Jun-
14
Aug
-14
Oct
-14
Dec
-14
BRITANNIA INDUSTRIES LTD

Britannia
December 16, 2014 Ambit Capital Pvt. Ltd. Page 23
Explanation of Investment Rating
Investment Rating Expected return (over 12-month)
BUY >5%
SELL <5%
NO STANCE We have forward looking estimates for the stock but we refrain from assigning valuation and recommendation
UNDER REVIEW We will revisit our recommendation, valuation and estimates on the stock following recent events
NOT RATED We do not have any forward looking estimates, valuation or recommendation for the stock
Disclaimer
This report or any portion hereof may not be reprinted, sold or redistributed without the written consent of Ambit Capital. AMBIT Capital Research is disseminated and available primarily electronically, and, in some cases, in printed form.
Additional information on recommended securities is available on request.
Disclaimer
1. AMBIT Capital Private Limited (“AMBIT Capital”) and its affiliates are a full service, integrated investment banking, investment advisory and brokerage group. AMBIT Capital is a Stock Broker, Portfolio Manager and Depository Participant registered with Securities and Exchange Board of India Limited (SEBI) and is regulated by SEBI.
2. AMBIT Capital makes best endeavours to ensure that the research analyst(s) use current, reliable, comprehensive information and obtain such information from sources which the analyst(s) believes to be reliable. However, such information has not been independently verified by AMBIT Capital and/or the analyst(s) and no representation or warranty, express or implied, is made as to the accuracy or completeness of any information obtained from third parties. The information, opinions, views expressed in this Research Report are those of the research analyst as at the date of this Research Report which are subject to change and do not represent to be an authority on the subject. AMBIT Capital may or may not subscribe to any and/ or all the views expressed herein.
3. This Research Report should be read and relied upon at the sole discretion and risk of the recipient. If you are dissatisfied with the contents of this complimentary Research Report or with the terms of this Disclaimer, your sole and exclusive remedy is to stop using this Research Report and AMBIT Capital or its affiliates shall not be responsible and/ or liable for any direct/consequential loss howsoever directly or indirectly, from any use of this Research Report.
4. If this Research Report is received by any client of AMBIT Capital or its affiliate, the relationship of AMBIT Capital/its affiliate with such client will continue to be governed by the terms and conditions in place between AMBIT Capital/ such affiliate and the client.
5. This Research Report is issued for information only and the 'Buy', 'Sell', or ‘Other Recommendation’ made in this Research Report such should not be construed as an investment advice to any recipient to acquire, subscribe, purchase, sell, dispose of, retain any securities and should not be intended or treated as a substitute for necessary review or validation or any professional advice. Recipients should consider this Research Report as only a single factor in making any investment decisions. This Research Report is not an offer to sell or the solicitation of an offer to purchase or subscribe for any investment or as an official endorsement of any investment.
6. This Research Report is being supplied to you solely for your information and may not be reproduced, redistributed or passed on, directly or indirectly, to any other person or published, copied in whole or in part, for any purpose. Neither this Research Report nor any copy of it may be taken or transmitted or distributed, directly or indirectly within India or into any other country including United States (to US Persons), Canada or Japan or to any resident thereof. The distribution of this Research Report in other jurisdictions may be strictly restricted and/ or prohibited by law or contract, and persons into whose possession this Research Report comes should inform themselves about such restriction and/ or prohibition, and observe any such restrictions and/ or prohibition.
7. AMBIT Capital Private Limited plans to register itself as a Research Entity under the SEBI (Research Analysts) Regulations, 2014. Conflict of Interests
8. In the normal course of AMBIT Capital’s business circumstances may arise that could result in the interests of AMBIT Capital conflicting with the interests of clients or one client’s interests conflicting with the interest of another client. AMBIT Capital makes best efforts to ensure that conflicts are identified and managed and that clients’ interests are protected. AMBIT Capital has policies and procedures in place to control the flow and use of non-public, price sensitive information and employees’ personal account trading. Where appropriate and reasonably achievable, AMBIT Capital segregates the activities of staff working in areas where conflicts of interest may arise. However, clients/potential clients of AMBIT Capital should be aware of these possible conflicts of interests and should make informed decisions in relation to AMBIT Capital’s services.
9. AMBIT Capital and/or its affiliates may from time to time have or solicit investment banking, investment advisory and other business relationships with companies covered in this Research Report and may receive compensation for the same.
Additional Disclaimer for U.S. Persons
10. The research report is solely a product of AMBIT Capital.
11. AMBIT Capital is the employer of the research analyst(s) who has prepared the research report.
12. Any subsequent transactions in securities discussed in the research reports should be effected through J.P.P. Euro-Securities, Inc. (“JPP”).
13. JPP does not accept or receive any compensation of any kind for the dissemination of the AMBIT Capital research reports.
14. The research analyst(s) preparing the email / Research Report/ attachment is resident outside the United States and is/are not associated persons of any U.S. regulated broker-dealer and that therefore the analyst(s) is/are not subject to supervision by a U.S. broker-dealer, and is/are not required to satisfy the regulatory licensing requirements of FINRA or required to otherwise comply with U.S. rules or regulations regarding, among other things, communications with a subject company, public appearances and trading securities held by a research analyst account.
Additional Disclaimer for Canadian Persons
15. AMBIT Capital is not registered in the Province of Ontario and /or Province of Québec to trade in securities and/or to provide advice with respect to securities.
16. AMBIT Capital's head office or principal place of business is located in India.
17. All or substantially all of AMBIT Capital's assets may be situated outside of Canada.
18. It may be difficult for enforcing legal rights against AMBIT Capital because of the above.
19. Name and address of AMBIT Capital's agent for service of process in the Province of Ontario is: Torys LLP, 79 Wellington St. W., 30th Floor, Box 270, TD South Tower, Toronto, Ontario M5K 1N2 Canada.
20. Name and address of AMBIT Capital's agent for service of process in the Province of Montréal is Torys Law Firm LLP, 1 Place Ville Marie, Suite 1919 Montréal, Québec H3B 2C3 Canada.
Disclosure 21. NIL © Copyright 2014 AMBIT Capital Private Limited. All rights reserved.
Ambit Capital Pvt. Ltd. Ambit House, 3rd Floor 449, Senapati Bapat Marg, Lower Parel, Mumbai 400 013, India. Phone: +91-22-3043 3000 Fax: +91-22-3043 3100 CIN: U74140MH1997PTC107598 www.ambitcapital.com