company presentation 19 june 2020 biomarine... · presentation or any information or to correct any...
TRANSCRIPT

COMPANY PRESENTATION
19 JUNE 2020
IMPROVING HUMAN AND PLANETARY HEALTH

IMPORTANT NOTICE
This presentation has been prepared by Aker BioMarine AS (the "Company"). The presentation does not constitute or form part o f, and should not be construed as, an offer, solicitation or invitation to subscribe for, underwrite or otherwise acquire, any securities of the Company or any of its subsidiaries nor should it or any part of it form the basis of , or be relied on in connection with, any contract to purchase or subscribe for any securities of the Company or any of its subsidiaries, nor shall it or any part of it form the basis of or be relied on in connection with any contract or commitment whatsoever. No reliance may be or should be placed by any person for any purposes whatsoever on the information contained in this presentation, or on its completeness, accuracy or fairness.
This presentation contains summary information only and does not purport to be comprehensive and is not intended to be (and s hould not be used as) the sole basis of any analysis or other evaluation. No representation, warranty, or undertaking, express or implied, is made by the Company, its affiliates or representatives as to, and no reliance should be p laced on, the fairness, accuracy, completeness or correctness of the information or the opinions contained herein, for any purpose whatsoever. Neither the Company nor any of its affiliates or representatives shall have any responsib ility or liability whatsoever (for negligence or otherwise) for any loss whatsoever and howsoever arising from any use of this presentation or its contents or otherwise arising in connection with this presentation. All information in this presentation is subject to updating, revision, verification, correction, completion, amendment and may change materially and without notice. In giving this presentation, none of the Company, its affiliates or representatives und ertake any obligation to provide the recipient with access to any additional information or to update this presentation or any information or to correct any inaccuracies in any such information. The information contained in this pre sentation should be considered in the context of the circumstances prevailing at the time and has not been, and will not be, updated to reflect material developments which may occur after the date of the presentation .
Several factors could cause the actual results, performance or achievements that may be expressed or implied by statements an d information in this Presentation. By reviewing this Presentation you acknowledge that you will be solely responsible for your own assessment of the market position of the Company and that you will conduct your own analysis and be solely responsible for forming your own view of the potential future performance of the Company’s business.
Matters discussed in this document and any materials distributed in connection with this presentation may constitute or inclu de forward-looking statements. Forward-looking statements are statements that are not historical facts and may be identified by words such as "believes", "expects", "anticipates", "intends", "estimates", "will", "may", "continues", "should" and similar expressions. These forward-looking statements reflect the Company’s beliefs, intentions and current expectations concerning, among other things, the Company’s results of operations, financial condition, liquidity, pro spects, growth and strategies. Forward-looking statements include statements regarding: objectives, goals, strategies, outlook and growth prospects; future plans, events or performance and potential for future growth; liquidity, cap ital resources and capital expenditures; economic outlook and industry trends; developments of the Company’s markets; the impact of regulatory initiatives; and the strength of the Company’s competitors. Forward -looking statements involve risks and uncertainties because they relate to events and depend on circumstances that may or may not occur in the future. The forward -looking statements in this presentation are based upon various assumptions, many of which are based, in turn, upon further assumptions, including without limitation, management’s examination of historical operating trends, data contained in the Company’s records and other data available from third parti es. Although the Company believe that these assumptions were reasonable when made, these assumptions are inherently subject to significant known and unknown risks, uncertainties, contingencies and other important factors which are difficult or impossible to predict and are beyond its control. Forward-looking statements are not guarantees of future performance and such risks, uncertainties, contingencies and other important factors could cause the act ual results of operations, financial condition and liquidity of the Company or the industry to differ materially from those results expressed or implied in this presentation by such forward looking statements. No representation is made that any of these forward-looking statements or forecasts will come to pass or that any forecast result will be achieved and you are cautioned not to place any undue influence on any forward-looking statement.
This presentation and the information contained herein are not an offer of securities for sale in the United States and are n ot for publication or distribution to persons in the United States (within the meaning of Regulation S under the U.S. Securities Act of 1933, as amended (the "Securities Act")). The securities referred to herein have not been and will not be registered under the Securities Act and may not be offered or sold in the United States except pursuant to an exemption from the registration requirements of the Securities Act. Neither this document nor any copy of it m ay be taken or transmitted into the United States, Australia, Canada or Japan or to any securities analyst or other person in any of those jurisdictions. Any failure to comply with this restriction may constitute a violation of Unit ed States securities laws. Neither this document nor any copy of it may be taken, released, published, transmitted or distributed, directly or indirectly, in or into the United States, Canada, Australia or Japan. Any failure to comply with this restriction may constitute a violation of United States, Canadian, Australian or Japanese Securities laws. This document is also not for publication, release or distribution in any other jurisdiction where to do so would constitute a violation of the relevant laws of such jurisdiction nor should it be taken or transmitted into such jurisdiction and persons into whose possession this document comes should inform themselves about and observe any such r elevant laws.
No money, securities or other consideration is being solicited, and, if sent in response to this presentation or the informat ion contained herein, will not be accepted.
This Presentation shall be governed by Norwegian law and any dispute arising in respect of this Presentation is subject to the exclusive jurisdiction of the Norwegian courts with Oslo District Court as legal venue.
2

1
COMPANY OVERVIEW
3

THE OPPORTUNITY
▪ Largest biomass on the planet
▪ Present in 70% of the planet’s surface
▪ At the bottom of the food chain
FAST
GROWTH
▪ Developing technology for sustainable harvesting
▪ Inventing processes to refine out essential molecules
▪ R&D to document the importance and development
potential of these molecules for life
▪ Commercializing our findings and knowledge
15 YEARS OF TECHNOLOGY
& PROCESS DEVELOPMENT
UNPARALLELED SCALE & KNOWLEDGE
▪ Unbeatable scale
▪ Deep knowledge resulting in 76 patents and a
sizeable and actionable innovation pipeline
▪ Large and diversified customer and product base
INCREASING
MARGINS
THROUGH MILLIONS OF YEARS OF EVOLUTION THE MOLECULES AND NUTRIENTS FROM KRILL HAVE BECOME IMPORTANT FOR ALL LIFE ON THE PLANET
4

AKER BIOMARINE IS THE FAST GROWING WORLD LEADER WITHIN KRILL WITH A 70% SHARE OF THE GLOBAL HARVEST
124
154
246
18 1917
+41%
18
39
53
17 18 19
+74%
REVENUE DEVELOPMENT
EBITDA DEVELOPMENT*
North
America
42%EMEA
24%
APAC
23%
Row
12%
Superba
37%
Brands
32%
Qrill Aqua
27%
Pet & HP
5%
KEY COMPANY FACTS
GEOGRAPHIC BREAKDOWN OF REVENUE PRODUCT BREAKDOWN OF REVENUE
504
PEOPLE
10
LOCATIONS
4
VESSELS
445
CUSTOMERS
76
PATENTS
2
SEGMENTS
▪ World leader within krill harvesting and processing,
accounting for ~70% of global harvest1 and ~80% of global
krill oil production
▪ Founded on the strong belief in the positive health
effects of krill. Pioneer in krill research and has invested
tens of millions of dollars over the last 15 years
▪ Sustainability has been at the core through focus on
preventing lifestyle diseases, increasing resource
utilization, and promoting sustainable fishery practices
▪ Launching own US brand in Q2 2020
USDm
USDm
39
71
Q1 19 Q1 20
+80%
3
13
Q1 19 Q1 20
+268%
5
% of 2019 revenue % of 2019 revenue before
eliminations
1Source: CCMALR. Aker BioMarine operates in the markets for aquaculture feed industry, human supplements industry and the pet food industry with its krill based products. Please see the appendix for further details of the market
where Aker BioMarine operates.
*adjusted

RECENT STRATEGIC INVESTMENTS AND INITIATIVES BUILT UNIQUE CAPABILITIES, POSITIONING AKER BIOMARINE FOR STRONG GROWTH
Roll-out of own
products
202120202019201820172016201520142013
Delisted the
company from
Oslo Børs
New CEO,
Matts Johansen
Fully integrate
own value chain
Focus on own
research and IP
portfolio
Build US
distributionPhases
Strategic
initiatives
2012
Vessels
Acquisition of Lang Pharma
Epion launch
Acquisition of Enzymotec
Acquisition of Neptune IP
Acquisition of Houston plant for krill oil production
Reinforced focus on developing the end-consumer market and R&D
Antarctic Endurance
Saga Sea
Antarctic Sea
La Manche (support vessel)
Diversification of contracts
Decoupling of pricing from commodity products
Provider
Human protein
Dog food brand
Acquisitions
Built industry leadership in terms of capacity, scale and unit costs with reduced earnings volatility backed by strong contract portfolio
Fully integrated value chain enabling Aker BioMarine to push the development of the market to drive growth and optimise margins6
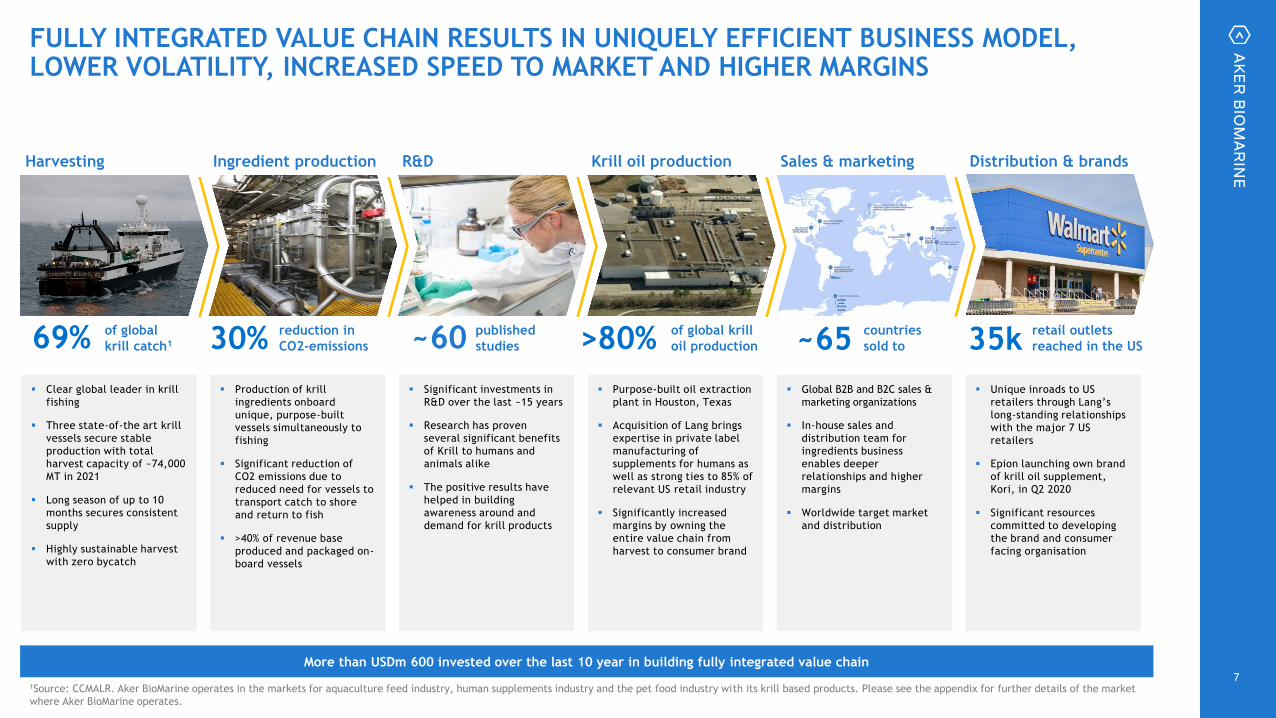
FULLY INTEGRATED VALUE CHAIN RESULTS IN UNIQUELY EFFICIENT BUSINESS MODEL, LOWER VOLATILITY, INCREASED SPEED TO MARKET AND HIGHER MARGINS
Harvesting Ingredient production R&D Sales & marketingKrill oil production
published
studies~60of global
krill catch169% of global krill
oil production>80% countries
sold to~65reduction in
CO2-emissions30%
▪ Clear global leader in krill
fishing
▪ Three state-of-the art krill
vessels secure stable
production with total
harvest capacity of ~74,000
MT in 2021
▪ Long season of up to 10
months secures consistent
supply
▪ Highly sustainable harvest
with zero bycatch
▪ Production of krill
ingredients onboard
unique, purpose-built
vessels simultaneously to
fishing
▪ Significant reduction of
CO2 emissions due to
reduced need for vessels to
transport catch to shore
and return to fish
▪ >40% of revenue base
produced and packaged on-
board vessels
▪ Significant investments in
R&D over the last ~15 years
▪ Research has proven
several significant benefits
of Krill to humans and
animals alike
▪ The positive results have
helped in building
awareness around and
demand for krill products
▪ Purpose-built oil extraction
plant in Houston, Texas
▪ Acquisition of Lang brings
expertise in private label
manufacturing of
supplements for humans as
well as strong ties to 85% of
relevant US retail industry
▪ Significantly increased
margins by owning the
entire value chain from
harvest to consumer brand
▪ Global B2B and B2C sales &
marketing organizations
▪ In-house sales and
distribution team for
ingredients business
enables deeper
relationships and higher
margins
▪ Worldwide target market
and distribution
7
More than USDm 600 invested over the last 10 year in building fully integrated value chain
Distribution & brands
▪ Unique inroads to US
retailers through Lang’s
long-standing relationships
with the major 7 US
retailers
▪ Epion launching own brand
of krill oil supplement,
Kori, in Q2 2020
▪ Significant resources
committed to developing
the brand and consumer
facing organisation
retail outlets
reached in the US35k
1Source: CCMALR. Aker BioMarine operates in the markets for aquaculture feed industry, human supplements industry and the pet food industry with its krill based products. Please see the appendix for further details of the market
where Aker BioMarine operates.

STRONG MANAGEMENT AND BOARD OF DIRECTORS SUPPORTING VALUE CREATION
8
▪ CEO since 2015
▪ Previous experience
as COO of Aker
BioMarine and Chief
Marketing Officer
at Telefonica O2
▪ Studied at Oslo
University College
Matts Johansen
CEO
2009
▪ Previous experience
from several senior
consulting positions
at PwC and
Accenture
▪ Master’s degree
from the Norwegian
University of
Science and
Technology and
University of New
Orleans
Kristine Hartmann
EVP Transformation
2011
▪ Previous experience
from BioMar and
the Norwegian
Ministry of Fisheries
▪ Master’s degree
from the Norwegian
School of Life
Sciences and a PhD
from the Norwegian
Veterinary CollegeSigve Nordrum
EVP Animal Health
and Nutrition
2007
▪ Previous experience
as CFO of Yara’s
Production
segment, 10+ years
in various senior
corporate financial
positions in the
Aker system and
from McKinsey &
Company
▪ Holds a Master’s
from BI Norwegian
Business School
Katrine Klaveness
CFO
▪ Responsible for
global sales and
marketing of
Human Nutrition &
Health products
▪ Previous experience
as a Management
Consultant for
Capgemini
▪ Master’s degree in
Economics from the
University of
Hamburg
Tim de Haas
EVP Human Health
and Nutrition
2018 2010
▪ Oversees the entire
supply chain from
harvest to
production
▪ 25 years of
experience with
global supply chain
operations
▪ Previous experience
from Nycomed,
Amersham, GE
Healthcare and
Trygg Pharma
Tone Lorentzen
EVP Supply Chain
▪ Experience from a
variety of strategy,
product and
business
development roles
including at Ecolab
and BCG
▪ MBA from Harvard
Business School and
a B.S. in Chemical
Engineering from
the University of
Minnesota
Shauna C. McNeill
EVP Innovation
2015 2017
▪ Previous experience
as the President
and COO at Sabinsa
and has more than
40 years of
experience from
the nutraceutical
industry
▪ Has a B.A. degree
in Business
ManagementTodd Norton
EVP Special Advisor
▪ Previously ran Aker
BioMarine’s
Marketing and
Innovation
department and has
experience from
senior positions at
Coca-Cola and PwC
▪ Has a Master’s
degree from BI
Norwegian School
of Management
Trond A. Smedsrud
EVP Strategic
Investments
2010 2015
MANAGEMENT TEAM BOARD OF DIRECTORS
▪ Chairman of the
board since 2014
▪ Previous experience
as Investment
Director of Aker
ASA for 10+ years,
President and CEO
of Epax
▪ NED in several
technology
companies
including Cognite
Ola Snøve
Chairman
▪ Previous experience
as partner and
chairman in BA-HR
▪ Board chairman in
Aker Solutions,
Aker BP, Cognite,
Aker Capital, Aker
Kværner and
director of Aker
Energy, Akastor,
The Resurce Group
TRG and
Reitangruppen
Øyvind Eriksen
Director
▪ VP of Science and
Regulatory Affairs
at AKBM
▪ Previous experience
as a regulatory
associate at LINK
Medical Research
and as a post
doctor at the
Norwegian Radium
Hospital
▪ PhD in Biochemistry
from UiO
Line JohnsenDirector (employee
elected)
▪ Technical Director,
Offshore Operations
at Aker BioMarine
▪ Experience from
several roles in
Aker BioMarine’s
offshore
operations,
manager roles at
Ramoen and Chief
Engineer at Skaregg
▪ Chief Engineer class
I, Cooling Engineer
and Coastal Captain
Sindre Skjong
Director (employee
elected)
▪ CFO in Aker ASA in
from 2015 to 2019
▪ Previous experience
as President & CEO
of Akastor, a
variety of executive
positions in the
Aker group and as
Operating Director
at Paine & Partners
▪ Chair of the board
in Ocean Yield
Frank O. Reite
Director
▪ Aker ASA’s main
owner
▪ Has been the
driving force in the
development of
Aker since the
1990s
▪ Director of Aker BP,
Kvaerner, Ocean
Yield and Aker
EnergyKjell Inge Røkke
Director
Year joining Aker BioMarinex

Share of revenues 2019Share of revenues 2019
AKER BIOMARINE GROUP CONSISTS OF THREE COMPANIES WITH DISTINCT CAPABILITIES
▪ Aker BioMarine produces and markets ingredients for aquaculture and dog feed
▪ Proven to increase growth and robustness in salmon and to improve quality of filet
▪ Dogs also benefit from including up to 5% Qrill in the feed
▪ The Qrill product range consist of krill meal, oil and high protein specialty meal
▪ Superba is the B2B brand for high quality krill oil for human consumption sold in bulk to brand owners
▪ State-of-the-art healthcare manufacturing company based in the US, acquired by Aker BioMarine in 2019
▪ Expertise in producing private label brands for the largest US retailers
▪ Established direct access to ~85% of the relevant retail market
▪ Produces the Kori krill oil brand for Epion
▪ Epion is Aker BioMarine’s FMCG brand company
▪ Hired significant expertise from the FMCG industry to ensure rapid roll-out and success
▪ Value chain integration and business model ensures a higher share of the retail sales price to the Aker BioMarine group, enabling significant investments in marketing to reach scale quickly
▪ Launching first product, Kori, in 2020 in the US
▪ Ambition to become a USDm 100 brand company within 5 years
Ingredients Brands
68%
32%
68%
32%
Strong relationships with the largest retailersRevenue breakdown 2019
9

KRILL CAN PROVIDE SIGNIFICANT BENEFITS TO
SOCIETY AS A WHOLE
KRILL IS THE WORLD’S LARGEST BIOMASS AND MOST SUSTAINABLE FISHERY, AND PROVIDES SIGNIFICANT BENEFITS TO HUMANS, PETS AND OTHER ANIMALS
Proven preventative health
ingredients
..for the 70% of the world
population with omega 3 deficiency1
Multi-functional sustainable
marine ingredients
..for the USDbn ~200 aquaculture
industry2
Healthy and delicious natural
ingredient
..for the 850 million pet cats
and dogs in the world3
Reduces the
burden of
lifestyle diseases
Improves
resource
efficiency
through
sustainable food
productionFacilitates
sustainable
fisheriesFaster growth (grams)6
267 315 330
Control Qrill Aqua7.5%
Qrill Aqua15%
+24 %
WHAT IS KRILL?
▪ Antarctic krill (Euphausia Superba) are paper clip-sized, shrimp-like crustaceans that play a key role in the oceans’ ecosystem
▪ Krill are present in most oceans around the world, however, they gather together in huge swarms in the pristine waters of Antarctica to feed on microscopic algae and are harvested by Aker BioMarine there
▪ Packed full of health promoting long-chain omega-3 fatty acids (EPA & DHA), phospholipids, choline and astaxanthin
▪ The Convention of the Conservation of Antarctic Marine Living Resources (CCAMLR), an international treaty, regulates krill harvesting in a sustainable way (quota of ~1% of biomass)
KrillFish oil
2x
Krill is 2x as effective in increasing the
Omega-3 Index as fish oil4Krill supplements results in a higher
Omega-3 levels than eating fish
3x/week5
5,36,3
Three fish
meals
Krill oil
supplement only
10
Ingredients
6% Qrill Pet increases omega-3
index, EPA and DHA levels in dogs8
significantly in six weeks
KrillFish oil
2.2x
Reducing inflammation
CRP, Post-race9
Fish oil Krill
-54%
70%
40%
Control Qrill Aqua
Improved heart health
Visible fat (%)7
Sources: 1. “System approach to quantify the global omega-3 fatty acid cycle”, Hamilton et al., Nature, 2020 2. “Global Aquaculture market”, Business Wire, 2017 3. “Winning in Pet Care”, Nestlé, 2019. 4. Ramprasath VR, Eyal I, Zchut
S, Jones PJ. Lipids Health Dis. 2013, 5. Rundblad A, Holven KB, Bruheim I, Myhrstad MC, Ulven SM. J Nutr Sci. 2018 Jan 17;7:e3, 6. Hatlen et al. 2016, 7. Mørkøre et al., Nofima, 2020, 8. Aker BioMarine , 9. Burri et. Al (2018), Res Vet.
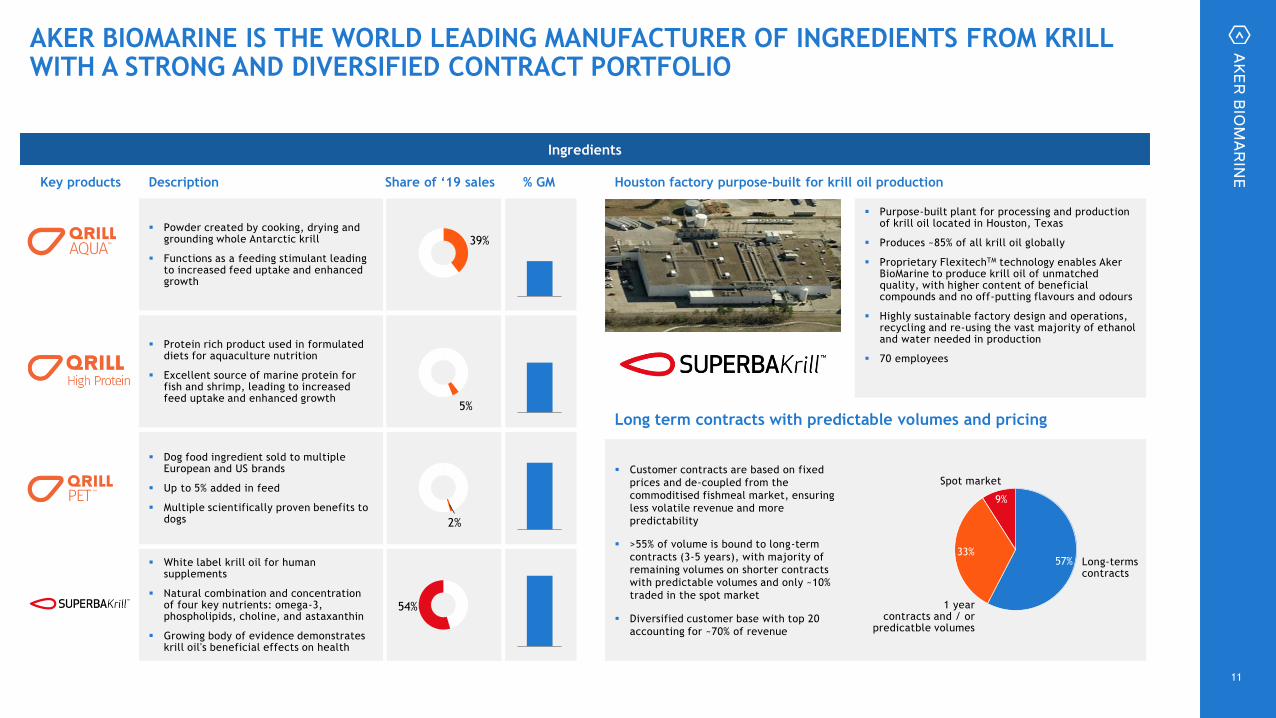
▪ Customer contracts are based on fixed
prices and de-coupled from the
commoditised fishmeal market, ensuring
less volatile revenue and more
predictability
▪ >55% of volume is bound to long-term
contracts (3-5 years), with majority of
remaining volumes on shorter contracts
with predictable volumes and only ~10%
traded in the spot market
▪ Diversified customer base with top 20
accounting for ~70% of revenue
AKER BIOMARINE IS THE WORLD LEADING MANUFACTURER OF INGREDIENTS FROM KRILL WITH A STRONG AND DIVERSIFIED CONTRACT PORTFOLIO
Key products
▪ Powder created by cooking, drying and grounding whole Antarctic krill
▪ Functions as a feeding stimulant leading to increased feed uptake and enhanced growth
▪ Protein rich product used in formulated diets for aquaculture nutrition
▪ Excellent source of marine protein for fish and shrimp, leading to increased feed uptake and enhanced growth
▪ White label krill oil for human supplements
▪ Natural combination and concentration of four key nutrients: omega-3, phospholipids, choline, and astaxanthin
▪ Growing body of evidence demonstrates krill oil's beneficial effects on health
39%
Description Share of ‘19 sales
▪ Dog food ingredient sold to multiple European and US brands
▪ Up to 5% added in feed
▪ Multiple scientifically proven benefits to dogs
Houston factory purpose-built for krill oil production
Long term contracts with predictable volumes and pricing
▪ Purpose-built plant for processing and production of krill oil located in Houston, Texas
▪ Produces ~85% of all krill oil globally
▪ Proprietary FlexitechTM technology enables Aker BioMarine to produce krill oil of unmatched quality, with higher content of beneficial compounds and no off-putting flavours and odours
▪ Highly sustainable factory design and operations, recycling and re-using the vast majority of ethanol and water needed in production
▪ 70 employees
5%
54%
2%
Ingredients
11
% GM
57%33%
9%
Spot market
1 yearcontracts and / or
predicatble volumes
Long-termscontracts

KoriRevenue breakdown per customer
2019
Revenues1
USDm
▪ Full service, mass market private label and brand manufacturer
▪ Acquired in order to gain pharmaceutical production capabilities and better access to US retailers
▪ Delivers turnkey solutions, managing the entire development of process from prototype development and raw materials sourcing, through regulatory review, and packaging production
▪ Significant in-house R&D capabilities, leveraging a global network to track emerging ingredients, technology, IP and science in order to quickly bring new market leading products to the shelf
▪ Produces 146 products across 15 categories for all major US retailers
▪ 62 employees (as of Q1 2020)
AKER BIOMARINE HAS ESTABLISHED SIGNIFICANT EXPERTISE IN PRODUCING FINISHED CONSUMER GOODS THROUGH THE ACQUISITION OF LANG AND CREATION OF EPION
▪ Established by Aker BioMarine to develop consumer brands of krill based products
▪ Experienced team of four who have taken several successful brands to market
▪ Rationale for establishing own brand is to push the development of the industry through education of the end consumer
▪ Strategy to re-invest EBITDA into marketing allowing for market development while retaining the same margin to Aker BioMarine as supplying a third party
▪ Launching Kori, a krill oil supplement for humans, as its first product in Q2 2020
▪ Kori is a high gross margin product, and with full effects from Kori, Aker BioMarine’s gross margin is targeted to be >70% as a whole
▪ Exciting pipeline with further products being developed
▪ First brand launched by Epion –krill oil supplement for humans
▪ Launching in the US market through multiple of the largest retailers
▪ Launched in CVS and Target
▪ Passed USDm 1 in revenues
▪ Launching in Walmart in June
Brands
BRAND
PROFIT
MARKETING
RETAILER
MARGIN
AKER MARGIN
COGS
MARKETING
RETAILER
MARGIN
AKER MARGIN
COGS
Traditional Kori
12
75
8690
17
33
2017 2018 2019 Q1 2020
Q1 2019
+9 %
+89 %
1. Full year 2019 included

2
INVESTMENT HIGHLIGHTS
13

AKER BIOMARINE INVESTMENT HIGHLIGHTS
UNDERDEVELOPED MARKET WITH IMMENSE GROWTH POTENTIAL DUE TO HEALTH MEGATRENDS AND GLOBAL PROTEIN SHORTAGE
KRILL BASED INGREDIENTS ARE UNIQUELY POSITIONED DUE TO SUPERIOR NUTRITIONAL PROFILE AND PROVEN HEALTH BENEFITS, PROTECTED BY INTELLECTUAL PROPERTY
INHERENT HIGH ENTRY BARRIERS COMBINED WITH UNIQUE INFRASTRUCTURE AND TECHNOLOGY SECURES LASTING LEADERSHIP IN THE INDUSTRY
SUSTAINABILITY AT THE CORE OF THE BUSINESS – DEDICATED CONTRIBUTOR TO ACHIEVING THE UN SUSTAINABLE DEVELOPMENT GOALS
HIGHLY VISIBLE PATH TO REALIZING SIGNIFICANT GROWTH THROUGH NEW MARGIN ENHANCING SEGMENTS
STRONG FINANCIAL PROFILE WITH COMPANY SET FOR FURTHER GROWTH ON THE BACK OF SIGNIFICANT INVESTMENTS
1
2
3
4
5
6
14

HEALTH CRISIS FOOD PRODUCTION PARADOX
AKER BIOMARINE IS WELL POSITIONED TO CAPITALIZE ON THE GROWING NEED FOR SUSTAINABLE FOOD AND HEALTH PRODUCTS 1
15
Exploitation of farmable land
is already unsustainable…
…and we are not using our
oceans effectively
5986 92
26
10976
‘30E‘15
13
‘90
7
Global fish stock
Mill. tonnes live weight3
Aquacu
lture
Wild
catch
337
58
42
10
7
5
Beef
Pork
Poultry
Krill oil
Salmon
Krill meal
Greenhouse gas intensity
T CO2e / T Edible protein2050
People10bn
Protein
demand +100%
Food
production+70%
93% of fish stocks are
maximally or over exploited
Dramatic increase in deaths from chronic
diseases across the world1
57 m
70%
2018
Global deaths
With a substantial cost for societies, people
and companies
945 billion USD estimated annual global health care costs
of high BMI (2020)2
1.65 trillion USD spend on treating chronic disease in the
US and expected to reach more than 6 trillion USD by 20503
Lifestyle
diseases
Leading causes of death
!!!
!
Sources: 1. “Global Burden of Disease”, The Lancet via. Healthdata.org, 2017, 2. “Calculating the costs of the consequences of obesity”, Worldobesity.org, 2017, “The Case for Enhancing the Congressional Budget Analysis Process”,
Partnership to fight chronic disease 3. FAO, State of Global fisheries, 2019

AKER BIOMARINE HAS INVESTED SIGNIFICANTLY IN R&D AND IP TO UNCOVER THE IMMENSE HEALTH AND NUTRITION POTENTIAL FROM KRILL 2
16
Pre 08 2008 2009 2010 2011 2012 2013 2014 2015 2016 2017 2018 2019 2020 2021
Heart health
& metabolic
syndrome
Joints &
inflammation
Woman
Brain
Safety and
fundamental
Confidential
Confidential
Confidential
Confidential
Confidential
Confidential
Confidential
Confidential
Confidential
Confidential
Confidential
Confidential
Confidential
Confidential
Confidential
Confidential
Confidential
Confidential
Confidential
Confidential
Confidential
Confidential
Confidential
Confidential
Confidential
Confidential
Confidential
Confidential
Confidential
Confidential
Confidential
Confidential
Confidential
Confidential
Confidential
Confidential
Confidential
Confidential
Confidential Confidential
Confidential
Confidential
Confidential
Confidential
Confidential
Confidential
Confidential
Confidential
Confidential
Confidential
Confidential
Confidential
Confidential
Dog
Chicken
Confidential Confidential Confidential Confidential Confidential
ConfidentialConfidential
Salmonids
Marine,
freshwater
fish and
others
Shrimp
Confidential
Confidential
Confidential
Confidential
Confidential
Confidential
Confidential
Confidential
Confidential
Confidential
Confidential
Confidential
Confidential
Confidential
Confidential
Confidential
Confidential
Confidential
Confidential
Confidential
Confidential
Confidential
Confidential
Confidential
Confidential
Confidential
Confidential
Confidential
Confidential
Confidential
ConfidentialConfidential
Confidential
Confidential
Confidential
Confidential
Confidential
Confidential
Confidential
Confidential
Confidential
Confidential
Confidential
Confidential
Confidential
Confidential
Confidential
Confidential
Confidential
Confidential
Confidential
Confidential
Confidential
Confidential Confidential Confidential
Confidential
Confidential
Confidential
Confidential
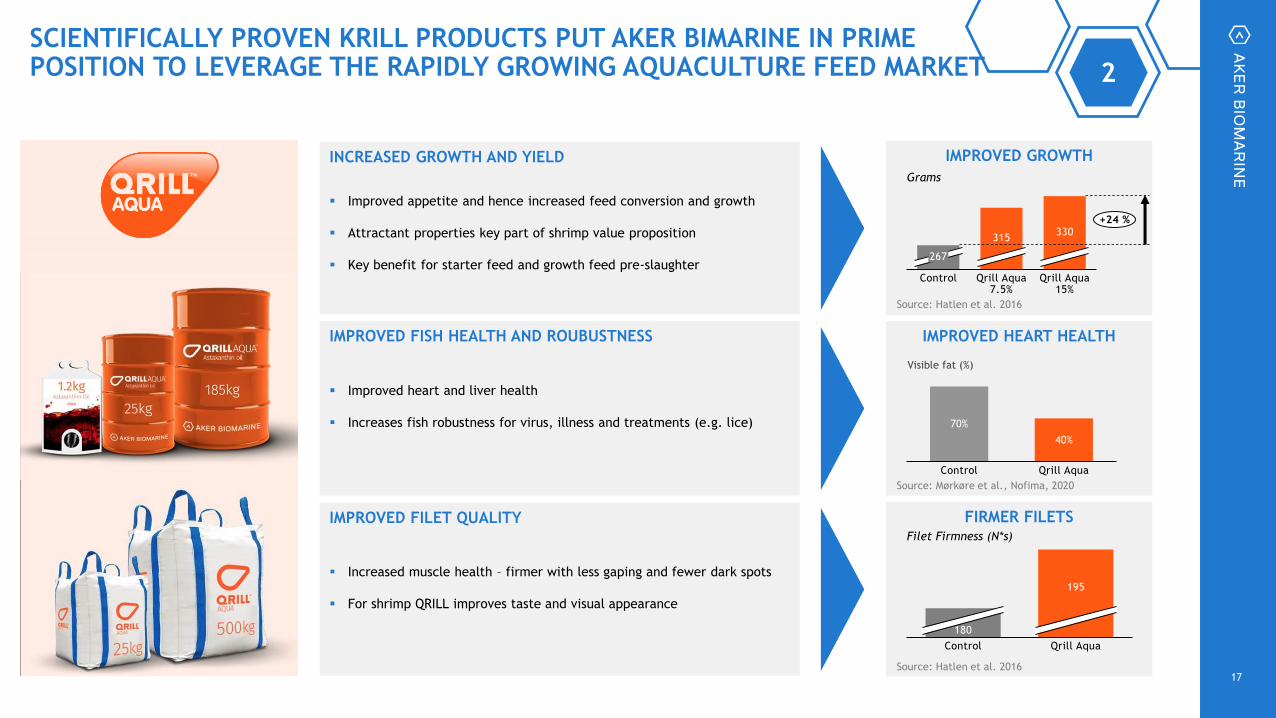
SCIENTIFICALLY PROVEN KRILL PRODUCTS PUT AKER BIMARINE IN PRIME POSITION TO LEVERAGE THE RAPIDLY GROWING AQUACULTURE FEED MARKET 2
IMPROVED GROWTH
IMPROVED HEART HEALTH
FIRMER FILETS
267
Control
315
Qrill Aqua7.5%
330
Qrill Aqua15%
+24 %
INCREASED GROWTH AND YIELD
▪ Improved appetite and hence increased feed conversion and growth
▪ Attractant properties key part of shrimp value proposition
▪ Key benefit for starter feed and growth feed pre-slaughter
IMPROVED FISH HEALTH AND ROUBUSTNESS
▪ Improved heart and liver health
▪ Increases fish robustness for virus, illness and treatments (e.g. lice)
IMPROVED FILET QUALITY
▪ Increased muscle health – firmer with less gaping and fewer dark spots
▪ For shrimp QRILL improves taste and visual appearance
180
Control
195
Qrill Aqua
17
Filet Firmness (N*s)
Grams
Source: Hatlen et al. 2016
Source: Mørkøre et al., Nofima, 2020
Source: Hatlen et al. 2016
70%
40%
Qrill AquaControl
Visible fat (%)

QRILL PET IS PROVEN TO HAVE SUPERIOR HEALTH BENEFITS FOR DOGS, REPRESENTING THE FIRST PET TARGET GROUP FOR AKER BIOMARINE 2
OMEGA-3 PHOSPHOLIPIDS FROM QRILL PET REDUCE
INFLAMMATION AND MUSCLE DAMAGE AFTER DOG SLED RACEPOSITIVE HEALTH BENEFITS
▪ The nutritional ingredients in the QRILL Pet has a range of positive health benefits for the
dog
▪ The power of QRILL Pet is the unique Omega-3 phospholipids and proteins
▪ The best delivery form for EPA and DHA - better uptake than other omega-3 sources
▪ Represents the building blocks of all cell membranes
▪ In addition, QRILL Pet also has other key nutritional benefits
▪ Krill is rich in highly palatable marine proteins
▪ Astaxanthin keeps products fresh and stable over time – natural preservative
▪ Choline an essential nutrient that has multiple physiological roles in the body
18
74
37
17
Control QRILL Pet
4.2x
2.9x
Pre-race
Post- race
Reducing inflammation
C-reactive protein (PMOL/L)
99 100
716
516
Control QRILL Pet
6.9x
4.1x
Pre-race
Post- race
Reducing muscle damage
Creatine kinase (IU/L)
Source: Burri et al. 2018 Res Vet Sci (Results from the 1600 km Iditarod race)

SUPERBA’S STRONG VALUE PROPOSITION HAS LEAD TO A GROWTH SIGNIFICANTLY HIGHER THAN THE INDUSTRY AS A WHOLE
SUPERBA GROWTH (2017-2019) CAGR
17
MT
19
+12%
Volume growth
CONTINUED GROWTH IN THE DIETARY
SUPPLEMENTS INDUSTRY
44
65 68 71 7578
82
1510 1611 12 1413 17 18 2119 20 22 23 24
+4%
+5%
USDbn
Dietary Supplements - Global retail value
Source: Euromonitor, 2020
OMEGA-3 FATTY ACIDS EPA & DHA
One of the most researched nutrients with a wide range of
health benefits from heart, eyes, liver, skin, joint, inflammation
and brain
BETTER DELIVERY FORM1
Phospholipids help omega-3 integrate into the cell membranes
and gives a significant better delivery to the body’s cells and
organs compared to other omega-3 sources
ESSENTIAL NUTRIENT2
Choline is an essential nutrient, vital for many body functions
such as nerve signalling, liver and muscle functioning.
90% of the US population is deficient in Choline
NATURAL PRESERVATION
Natural antioxidant astaxanthin protects the krill oil from
oxidation, eliminating the need to add preservatives
NO FISHY AFTERTASTE
The phospholipid form means that the oil mixes well with the
stomach contents, preventing unpleasant aftertaste, digestive
issues and improves consumer experience
2
19SourceS: 1. Ramprasath et. Alt 2013; 2. Jensen, H.H.; Batres-Marquez, S.P.; Carriquiry, A.; Schalinske, K.L. Choline in the diets of the us population: Nhanes, 2003-2004. FASEB J 2007, 21, LB46. and Fischer, L.M.; daCosta, K.A.;
Kwock, L.; Stewart, P.W.; Lu, T.S.; Stabler, S.P.; Allen, R.H.; Zeisel, S.H. Sex and menopausal status influence human dietary requirements for the nutrient choline. Am J Clin Nutr 2007, 85, 1275-1285.

LARGE ENTRY BARRIERS SECURE AKER BIOMARINE’S LONG TERM POSITION AS UNDISPUTED LEADER IN SUSTAINABLE KRILL HARVESTING
LARGE ENTRY BARRIERS SECURE AKER BIOMARINE’S LONG TERM
POSITION AS UNDISPUTED LEADER IN SUSTAINABLE KRILL HARVESTING
Krill harvest in Area 48 and 58 and precautionary quota‘000 MT
3
20
South Korea
Norway (Aker BioMarine)
Ukraine
China
Chile
Total
69% 31%
UNBEATABLE EFFICIENCIES IN THE FISHERIES
>1200 patent
claims
76 patent
familiesENFORCED IP-PORTFOLIO
2020
153 161 201 235388111 142
170359 360 308 243
892 892 892 892 892
16 17 1918
62
20*
99108
Remaning quota in area 58.4.1 and 58.4.2
Aker BioMarine
Others
Remaning quota in area 48
Total expected 2020 krill harvest by vessel
*Harvesting levels for 2020 are illustrative and based on estimates
Source: CCMLAR

SUSTAINABILITY AT THE CORE OF THE BUSINESS – DEDICATED CONTRIBUTOR TO ACHIEVING THE UN SUSTAINABLE DEVELOPMENT GOALS (1/2)
P I O N E E R I N G
S U S TA I N A B L E
F I S H E R I E S
D O I N G M O R E
A N D B E T T E R
W I T H L E S S
4
21
ECO-HARVESTING
ELIMINATES BY-CATCH
CONTRIBUTE TO ANTARCTIC
SCIENCE
QUOTA
<1%STRICT REGULATIONS FOR
KRILL HARVESTING
CERTIFIED FOR SUSTAINABLE
FISHERY & NGO PARTNERSHIPS
TRANSPARENCY FROM OCEAN
TO END-CONSUMER
MACHINE LEARNING TO
MINIMIZE INDUSTRIAL IMPACT
30% REDUCTION IN C02-
EMISSIONS
TECHNOLOGY TO BETTER CARE
FOR FISHERY MANAGEMENT

SUSTAINABILITY AT THE CORE OF THE BUSINESS – DEDICATED CONTRIBUTOR TO ACHIEVING THE UN SUSTAINABLE DEVELOPMENT GOALS (2/2)
I N G R E D I E N T
F O R A M O R E
S U S TA I N A B L E
A Q U A C U LT U R E
D E D I C AT E D TO
I M P R O V I N G
H U M A N H E A LT H
4
22
5 1042
58
337
PorkSalmonKrill Poultry Beef
INCREASING EFFICIENCY AND
HEALTH OF AQUACULTURE
REDUCING PRESSURE ON
OVERFISHED FISH STOCKS
KRILL, THE WORLDS LARGEST
BIOMASS
=
325 millionextra meals
Regular feed
Qrill Aqua
+18%
INCREASE IN GROWTH
(GRAMS)
9000 studies
document the effects of
Omega-3’s
HEART LUNG DIABETES
OMEGA-3 HELPS PREVENT
LIFESTYLE DISEASES
CONTRIBUTING TO SCIENCE,
KNOWLEDGE AND INNOVATION
IMPACT FOR
VULNERABLE GROUPS
SPENT ON
OMEGA 3’S
SAVED* BY
SOCIETY
60 clinical studies
15 PHD’s
AKBM
ROLE
GREENHOUSE GAS INTENSITY
(t CO2e / t EDIBLE PROTEIN)
THE WORLD NEEDS SUSTAINABLE
SOURCES OF PROTEIN
* Source: Food Supplements Europe “Healthcare Cost Savings of Omega 3 Food Supplements in the European Union”

CLEAR MARGIN POTENTIAL FROM INNOVATIONS
AND A MOVE TO HIGHER MARGIN END-MARKETS
HIGHLY VISIABLE PATH TO REALIZING SIGNIFICANT GROWTH THROUGH NEW MARGIN ENHANCING SEGMENTS
Sources: Aker BioMarine internal analysis, Euromonitor international, 2018/2019
5
DEVELOPING A NEW DOG FOOD
BUSINESS TO TAP INTO THE USDbn
90 GLOBAL PET FOOD MARKET
▪ 225m dog owners globally
spending increasing time and
resources on their pets
▪ Premium dog food is the largest
growth segment the last years,
with growth expected to
accelerate
▪ The experience from Kori will be
utilized to secure world class
execution and speed to market
▪ First sale to retail planned in
2022
23
DEVELOPING A PROTEIN POWDER TO UTILIZE MORE OF
THE KRILL AND LIFT MEAL MARGIN
▪ Aker BioMarine is working on a project to use krill protein that currently
goes to the aqua market for human consumption
▪ Technical proof of concept validated with pilot scale production on-going
▪ Launch plant design in-progress to validate technology, costs and initiate
market development
▪ Investment in Launch plant in 2021 of USDm 13.5 with up to 100 MT of
annual capacity, investment in commercial plant mainly in 2023 and 2024
at USDm 75 with 5,000 MT annual capacity
Margin uplift
per kg krill meal(Product sales price less product unit
cost times the yield from krill meal)
Aqua feedingredients
Pet foodingredients
Proteinpowder
ingredients
Krill oilsupplementingredients
Krill oilsupplement
branded
19 2421 2220 23
33 35 38 40 43 46+7%
Sports products
Nutrition DrinksMeal replacement
Supplements
Global Protein Product
Revenue USDbn
21 23 25 2927
Plant capacity
MT
Commercial plant capacity
Launch plant capacity
Demand
5,000
100
56 %39 %
5 %
US Dog Food sales
Revenue 2019, USDbn
USDbn
23.6
Premium
5.2%
Medium
3.6%
Economy
(2.7%)
CAGR 2015-2019x%
New business
model
Existing
business
Model
Existing technical
or knowledge
competences
New technical or
knowledge
competences
Fundamental
research
Confidential
Established MarketDevelopment Exploration
Executing on a range of innovation types

STRONG REVENUE AND EBITDA GROWTH AS THE COMPANY IS CLOSE TO FULLY INVESTED AND READY TO REAP THE REWARDS
REVENUE
USDm
EBITDA, adjusted
USDm
6
124
154
246
39
71
+41%
+80%
18
39
53
3
13
1917 Q1 1918 Q1 20
+74%
+268%
▪ Strong revenue growth due to increasing production capacity through new vessel, better contracts and improved product mix with higher prices achieved
▪ Lang included from March 2019
▪ Antarctic Endurance with full production in 2021
▪ Q1 generally a seasonally slower quarter
▪ Rapid EBITDA growth as scale has been reached
▪ Increasing margin trend set to continue driven by improved product mix and further economies of scale
24
1917 Q1 1918 Q1 20

3
STRATEGY AND BUSINESS PLAN
25

STRATEGIC PRIORITIES AND PROJECTS DRIVING AKER BIOMARINE’S GROWTH AMBITIONS
MAINTAINING OUR LEADERSHIP IN KRILL FISHERIES1
KEEPING AN ACTIONABLE INNOVATION PIPELINE WITH IMMENSE POTENTIAL2
BUILDING CLOSER RELATIONSHIPS WITH THE END-CONSUMER5
EXPANDING INTO A NEW B2C PET FOOD BUSINESS6
CONTINUING TO ATTRACT AND RETAIN GREAT PEOPLE7
DEVELOPING A BEST IN CLASS PROTEIN POWDER FOR PEOPLE3
CAPITALIZING ON THE GROWING IMPORTANCE OF PRIVATE LABEL4
26

ADDITIONAL UPSIDE5 YEAR ASPIRATION ILLUSTRATIVE EBITDA DEVELOPMENTUSDm
5 YEAR ASPIRATION TO BUILD A USDM 200 EBITDA COMPANY WITH A STRONG CONSUMER BRAND
53
20202019 2021 2022 2024
BRANDED PRODUCTS
▪ Epion targets to be a USDm ~100
business in 2024 contributing 0 in
EBITDA due to marketing
reinvestments
▪ Expanded into dog food with
estimated launch in 2022
STRONG INNOVATION PIPELINE
▪ Full commercial launch of protein
products
▪ Other candidates for new products
identified and under development
21%
EBITDA margin
27
USDM 200
IN EBITDA
STRONG OWN
BRAND WITH
SIGNIFICANT
EBITDA
POTENTIAL
~30%
Note: The targets indicated represent the Company's current goals, and should not be construed as estimates or guiding for future developments

GROWTH SUPPORTED BY CLEARLY VISIBLE DRIVERS
28
2019 2020 2023 - 2024
Harvesting
capacity
increase
~41,000 mt
Antarctic Endurance at
~22% of total capacity
of ~32,000 mt
~60,000 mt
Antarctic Endurance at
~75% of total capacity
of ~32,000 mt
Building
own brands
operation
Very high brands growth
Brands making up
50%+ of revenues
in 2024
Epion targets to be a
USDm ~100 brand
company by 2025
96 MUSDKO, ingredients segment
Very highon the back of demand growth
and development of the market
Growth on
products with
higher prices
40,872 mtVery high
on the back of
capacity increase
~74,000 mt
Lang net sales
of USDm 82
Launch of Epion
Very high brands growth
Stable
Lower growth
Organic growth ~15%~10 – 15%
without further capacity
expansions
~20 – 30%on the back of capacity increase with highest growth in 2020
2021
~74,000 mt
Antarctic Endurance at
~95% of total capacity
of ~32,000 mt
Double digit growthon the back of demand growth
and development of the market
Double digit growthon the back of
capacity increase
2022
~74,000 mt
Antarctic Endurance at
~100% of total capacity
of ~32,000 mt
Lower growth
Lower growth
~15 – 20%without further capacity
expansions
Note: The targets indicated represent the Company's current goals, and should not be construed as estimates or guiding for future developments

4
FINANCIALS
29

AKER BIOMARINE HAS EXPERIENCED LIMITED IMPACT FROM THE COVID-19 CRISIS
HARVESTING AND MEAL PRODUCTION
Harvesting and producing as planned
Plans in place and initiated for crew change and access to
spare parts and consumables
KRILL OIL PRODUCTION
Producing as planned and classified as an essential business
Critical function contingency plan in place
Sufficient stock of spare parts and consumables
OUTBOUND LOGISTICS
Able to deliver to all customers, but experiencing some
delays, limited exposure to air freight
HEALTH SUPPLEMENTS MARKET
No observed negative impact on sales
Increase in orders from customers retailing online
Expect neutral impact on demand
AQUACULTURE MARKET
No observed negative impact on sales
Expect knock-on effect from HORECA on premium segments
Expect positive long-term impact from acceleration of
healthy food focus in key markets
▪ A vertically integrated value chain reduces risk to business continuity
▪ Currency and fuel exposure make Aker BioMarine counter cyclical
▪ Established a team late February to take necessary mitigating actions and monitor the situation
▪ Revenues in April 2020 of USDm 24.5 versus April 2019 of USDm 18.7 (+31%)
IMPACT ON OUR BUSINESS
30

MAJORITY OF REVENUE FROM LONG TERM
CONTRACTS
▪ Customer contracts based on fixed prices and de-
coupled from the commodity market, ensuring less
volatile revenue and more predictability
▪ 57% of volume is bound to long-term contracts (3-5
years), with the majority of remaining volumes on
shorter contracts with predictable volumes and only 9%
traded in the spot market
STRONG REVENUE VISIBILITY THROUGH LONG TERM CONTRACTS AND RELATIONSHIPS
31
Ingredients contract base1
% of revenue
Long-term contracts
57%
1 year contracts and/or
predictable volumes
33%
Spot market9%
1Data for Aker BioMarine only, 22020 contracted revenues for Aker BioMarine (certain customers are part of the same corporate group), 3Based on 2020 contracted revenues for Lang
DIVERSIFIED CUSTOMER BASE AND STRONG RELATIONSHIPS WITH KEY CUSTOMERS
▪ Diversified customer base with top 20 customers
accounting for ~70% of revenue
▪ Customer base further diversified across geographies
▪ Unique access to 85% of the US retail market and strong
relationships with the largest retailers
Customer 117,3%
Customer 214,0%
Customer 38,0%
Customer 47,7% Customer 5
4,7%
Remaining top 20
customers19,0%
Other accounts
29,4%
Ingredients customer base2
% of revenue
Customer 126,0%
Customer 218,8%
Customer 317,2%
Customer 413,0%
Customer 512,0%
Other accounts
13,1%
Brands customer base3
% of revenue

SIGNIFICANT TOP-LINE GROWTH AND STRONG GROSS MARGINS
32
REVENUE AND GROSS MARGIN DEVELOPMENT
124,2
154,2
246,0
39,2
70,7
34,1%
42,4% 40,6%
33,7% 35,1%
2017 2018 2019 Q1 2019 Q1 2020
Revenue Gross margin (%)
▪ Lead time of ~6 months from production to revenue recognition
▪ Significant revenue increase in 2019 due to inclusion of Lang from 1
March 2019 (implied full year revenue of USDm 253)
▪ Increased margins on Qrill Aqua due to decoupling strategy
▪ Increased krill oil sales in 2019 and Q1 2020 with krill oil accounting for
~64% of total revenues in Q1 2020
▪ In Q1 2020 the gross margin was 61% on krill oil with zero margin on
Qrill Aqua due to seasonality
▪ Brands revenue account for 30-40% of overall revenues
▪ The group targets to increase gross margin to up to ~45% during the
next 5 year period
Revenue and gross margin development
USDm
COMMENTARY

PRODUCTION VOLUME DEVELOPMENT PER
VESSEL
OFFSHORE PRODUCTION VOLUME
DEVELOPMENT PER PRODUCT
KRILL OIL INGREDIENT REVENUE
DEVELOPMENT
POSITIVE PRODUCTION VOLUME DEVELOPMENT WITH INCREASED CAPACITY FROM ANTARCTIC ENDURANCE
29,2
36,6
40,9
16,4 17,4
2017 2018 2019 Q1 2019 Q1 2020
Antarctic Sea Saga Sea Antarctic Endurance
33
▪ Season from mid December until September, followed by
shipyard
▪ Antarctic Endurance in production from mid February 2019,
repairs and non-fishing periods throughout the season
▪ On average 20 fewer fishing days Q1 2020 than in Q1 2019 for
Antarctic Sea and Saga Sea primarily due to weather
conditions in Antarctica
Total production per vessel
Thousand MT
29,2
36,640,9
16,4 17,4
2017 2018 2019 Q1 2019 Q1 2020
Qrill Aqua Nutra Qrill Pet
Total offshore production volume by product
Thousand MT
▪ Average yield from raw krill to meal of 18% and 14% from
meal to oil
▪ Growing share of Nutra production due to increasing krill oil
demand and production in Houston
▪ Nutra meal used to produce krill oil where QHP is also an
outcome with a yield of 75%
▪ Variations between total catch volume and production
volume mainly explained by the high water content of krill
(~85%) which is removed when krill is processed to meal
Total krill oil sales
M USD
Vessels in yard
until mid-January
2020 resulting in
lower volumes
+40%
+6%
+40%
+6% 59
75
96
16
26
2017 2018 2019 Q1 2019 Q1 2020
+63%
+63%

INCREASING GROSS MARGIN FOR AQUA AND PET
UNIT ECONOMICS HAVE SHOWN IMPROVEMENT, WITH REVENUE MIX INCREASING PRICES AND SCALE REDUCING COSTS
34
INCREASING GROSS MARGIN FOR SUPERBA
▪ Aker BioMarine has been able to increase gross margin in the offshore production
segment mainly due to increased prices from new contract structures and
premiumification of its products
▪ In the longer historical context, cost per unit has come down significantly due to
increased efficiency and expertise
▪ Significant cost advantage compared to competitors due to specialised vessels with
on-board production, and integrated value chain
▪ 2019 not fully representative as certain increased costs from Endurance had not yet
translated into higher sold volumes
▪ Increased gross margin due to significant cost reductions over the last few years
▪ Substantial cost advantage compared to competitors due to company’s unique plant in
Houston
▪ 2019 not fully representative as increased costs from Endurance had not yet
translated into higher sold volumes
Price / MT
2017 20192018
0%
20192017 2018
+6%
Unit cost / MT
2017 2018 2019
+1%
20182017 2019
-15%
Price / MT
Unit cost / MT

HISTORICAL OPEX DEVELOPMENT
COST BASE PRIMARILY DRIVEN BY SALARIES, PROFESSIONAL SERVICES, DIRECT PRODUCTION COSTS AND FUEL
35
Opex, by cost category
USDm
100,4
124,2
167,8
36,4 46,0
2017 2018 2019 Q1 2019 Q1 2020
SG&A Direct production cost offshore Onshore Fuel Encapsulation Juvel
SG&A BREAKDOWN BY COST CATEGORY (2019)
Salaries35,7%
Professional services25,2%
Freight9,7%
Sales and marketing
7,6%
Other5,0%
Consumables/ analysis
4,7%
Warehouse4,6%
Office3,8%
Travel3,7%
▪ SG&A also impacted by inclusion of Lang in 2019
▪ Significant transaction related cost in 2018 and 2019 as well
as higher volumes sold impacting logistics and handling
related costs
▪ R&D cost of 7% of total SG&A in 2019
▪ SG&A around 30% of total sales 2017-2019, including Epion
and Lang. Expected to increase in 2020 due to marketing
spend of USDm ~15 related to Kori launch
▪ Professional services includes external engineering
▪ ~70% of opex in ingredient segment is allocated to inventory due to time period between production and sales, hence the figures
to not match the overall P&L. In addition, certain special operating items, such as the Juvel opex is included in “Other operating
income/ (cost), net”
▪ Direct production cost offshore includes crew salaries, packaging, tramper cost, as well as consumables and repair and
maintenance on the vessels - increase in 2019 due to inclusion of Antarctic Endurance and more volume produced
▪ Fuel cost driven by higher production - primarily MGO consumption where fuel cost has increased from USD ~595/MT in 2017 to
755 in 2019, fuel cost in Q1-2020 reduced to USD 729/MT, same trend in medium term. The vessels will consume around 35,000
MT fuel annually going forward. Aker BioMarine has hedged its fuel costs for 2021 – 2024, please see details in the appendix
▪ Onshore costs includes salary and direct production cost such as ethanol, utilities, inventory tax and waste treatment -
significant increase in production volumes from 2017 main driver behind cost increase
▪ Juvel is defined as a special operating item, in 2018 and 2019 costs include crew salaries, docking cost, repair and maintenance
and consumables - vessel sold in April 2020
▪ Fixed costs of approximately 65%
USD
76.5m
2019 SG&A, by cost category
USDm

▪ Target to reach ~30% EBITDA margin from 2022 onwards
▪ Gradually increasing from 2020 onwards
▪ Margin improvements driven by economies of scale and positive mix effects from selling more
volume of higher margin products
▪ In 2018 EBITDA adjustments include transaction related costs on the Enzymotec, Neptune and
Lang transactions amounting to USDm 2.6, as well as Juvel operating cost amounting to USDm
4.0.
▪ Transaction related costs in relation to the Lang Pharma acquisition have been booked as an
operating expense and recognized in the EBITDA
▪ Following a fire in 2018, Juvel has not been used in the ordinary course of business in 2019. The
vessel will be sold in 2020, hence operating costs will not be incurred in the future
▪ Material non-recurring legal costs have been incurred in relation to a legal dispute regarding
Juvel production related patents
▪ Material costs relating to the Epion launch, such as employment of Epion management team,
R&D, general start-up costs, and significant market development costs
STRONG EBITDA GROWTH WITH MARGIN IMPROVEMENTS DRIVEN BY SCALE AND POSITIVE EFFECTS FROM ENHANCED PRODUCT MIX
45,7
53,0
1,3
3,4
1,8
0,8
EBITDA 2019 Lang transactionrelated cost
Epion marketinglaunch US
Juvel operatingcost
Legal cost Adj. EBITDA 2019
36
HISTORICAL EBITDA DEVELOPMENT EBITDA ADJUSTEMENTS
17,6
39,4
53,0
3,4
12,7
14,1%
25,6% 21,6%
8,8%
17,9%
2017 2018 2019 Q1 2019 Q1 2020
Adj. EBITDA Adj. EBITDA %
2019 EBITDA adjustments
USDm
Adjusted EBITDA
USDm+202%
+268%
Note: The targets indicated represent the Company's current goals, and should not be construed as estimates or guiding for future developments
45,7
53,0
1,3
3,4
1,8
0,8
EBITDA 2019 Lang transactionrelated cost
Epion marketinglaunch US
Juvel operatingcost
Legal cost Adj. EBITDA 2019

STRONG GROWTH IN REVENUE AND EBITDA ACROSS SEGMENTS
124,2154,2
177,2
32,5 41,6
2017 2018 2019 Q1 2019 Q1 2020
37
INGREDIENTS BRANDS
REVENUE
Brands segment revenue development1
USDm
EBITDA
Brands segment unadjusted EBITDA development1
USDm
REVENUE
Ingredients segment revenue development
USDm
EBITDA
Ingredients segment unadjusted EBITDA development
USDm
▪ 11% increase in Qrill meal from
2017 to 2019, price and volume
driven
▪ 28% increase in Krill oil from 2017
to 2019, following strategic
acquisitions of Enzy, Neptune and
organic growth
▪ 7% volume driven decrease in
Qrill meal revenue QoQ offset by
a 62% increase in krill oil
▪ Strong demand for krill oil in
South-Korea
▪ Driven by strong krill oil sales
with higher margins
▪ Continued strong EBITDA in 2020,
despite significantly higher
marketing cost
▪ Lang has uninterrupted YOY sales
growth; successfully maturing
customers offerings (SKUs) and
expanded customer portfolio
▪ COVID-19 demand lift seen in
March and pallet promotions
driving a record quarter for Lang
▪ Stable cost base and gross margin
▪ Success with Costco and new
SKUs to Walmart driving positive
EBITDA contribution
▪ Some COVID-19 related
improvements in Q1 2020 EBITDA
such as reduced travel costs
82,2 6,7
75,285,9 90,1
17,332,7
2017 2018 2019 Q1 2019 Q1 2020
Contribution to Aker BioMarine Lang stand-alone revenue
17,2
33,140,3
1,07,2
13,9% 21,5% 22,7%
3,1%
17,2%
2017 2018 2019 Q1 2019 Q1 2020
EBITDA EBITDA %
7,9 0,6
7,3 8,9 8,6
1,0
5,7 9,8% 10,3% 9,6%
6,1%
17,4%
2017 2018 2019 Q1 2019 Q1 2020
Lang stand-alone EBITDA Contribution to Aker BioMarineEBITDA %
+43%
+28%
+20%
+89%
+134%
+622%
+17%
+443%
1Brands (Lang) included from March 2019 in the reported figures
Note: Revenue excludes eliminations of USDm 13.4 in 2019 and USDm 3.6 in Q1 2020, EBITDA excludes eliminations of USDm 2.5 in 2019 USDm 1.2 in Q1 2020
124,2154,2
177,2
32,5 41,6
2017 2018 2019 Q1 2019 Q1 2020

PROFIT & LOSS STATEMENT
38
Depreciation, amortization and impairment (non producing assets)
▪ Depreciation on producing assets (e.g. vessels and the Houston facility) is included in COGS -~20% of COGS is historic depreciation
▪ However, impairment charges on fixed assets, such as the Juvel impairment of USDm 5.9m recognized in 2019, are included
▪ Acquired customer portfolios from Enzymotech, Neptune and Lang are amortized over a 10 year period from transaction date
▪ Total depreciation of USDm ~8 on a quarterly basis, taking into account Antarctic Provider. Depreciation on producing assets are inventoried and consequently included in COGS when products are sold
▪ Total quarterly amortization of around USDm 4 and is related to customer portfolios and Orochem technology
Other operating income/(cost), net
▪ Other income, such as insurance settlements and royalty revenue as well as inventory adjustments and leasing reclassification
▪ Juvel operating costs from 2018 is included as other operating cost
Net financial items
▪ Interest rates to external lenders and Aker ASA, as well as FX effects
▪ In 2019 Aker ASA converted NOK 1bn of debt to equity, reducing interest expense
▪ Net financial items to increase by USDm 3.5 p.a. once Antarctic Provider is delivered
▪ Net financial items in 2020 is expected around USDm 14 (not including FX effects) on an annual basis. In the medium term, once Antarctic Provider has been delivered, net financial items is expected at USDm 18
Tax expense
▪ In certain jurisdictions the group pay sales tax
▪ In the US the Group pays state tax based on nexus (employees or inventory), whereas Federal tax is offset by tax losses carried forward
▪ Significant historical net operating losses in Norway and US of NOKm 1,723 and USDm 30 respectively. Total tax expense in 2020 and medium term is consequently expected to be limited on a yearly basis until carry forward losses are fully utilized. The tax assets from the historical net operating losses are currently not reflected in the balance sheet
▪ Potential upside of NOKm 296 if current tax case in Norway is successful
COMMENTARYUSD thousands 2017 2018 2019 Q1 2019 Q1 2020
Net sales 124,154 154,182 246,170 39,207 70,742
Cost of goods sold (81,768) (88,829) (145,901) (26,009) (45,899)
Gross profit 42,386 65,352 100,269 13,198 24,843
SG&A (37,001) (44,686) (76,464) (15,185) (19,853)
Depreciation, amortization and impairment (2,528) (5,539) (17,822) (1,277) (4,027)
Other operating income/(cost), net (4,538) (4,869) (3,221) (706) (811)
Operating profit (1,681) 10,259 2,762 (3,970) 152
Net financial items (15,072) (11,540) (26,097) (3,879) (1,558)
Tax expense (1,011) 259 (415) (91) (311)
Net profit (loss) (17,764) (1,022) (23,751) (7,941) (1,717)
EBITDA reconciliation
Net profit (loss) (17,764) (1,022) (23,751) (7,941) (1,717)
Tax expense 1,011 (259) 415 91 311
Net financial items 15,072 11,540 26,097 3,879 1,558
Depreciation, amortization and impairment 18,896 22,860 42,924 5,598 11,515
EBITDA (unadjusted) 17,215 33,120 45,687 1,628 11,668

HISTORICAL CAPEX DEVELOPMENT
111,2
64,5
176,1
145,8
5,2
2017 2018 2019 Q1 2019 Q1 2020
Offshore Onshore M&A Other
CAPEX OVERVIEW
39
Capex
USDm
COMMENTARY
▪ Over the last 10 years, Aker BioMarine has invested USDm ~600 in fixed assets, majority
being vessels
▪ USDm 314 invested since 2015 in fixed assets
▪ The first instalment was paid on Antarctic Endurance in 2017 and a second in 2018, in
2019 Antarctic Endurance was delivered with a final instalment of USDm 94.6
▪ In 2018 the Group acquired Enzymotec’s krill oil business for USDm 26.4 as well as
capacity increase project in Houston for USDm ~6.0 and the Flexitech production
technology from Orochem for USDm 2.4
▪ Total investment into the Houston plant amounts to USDm ~71 since day 1
▪ The first instalment on Antarctic Provider of USDm 6.5 was paid in March 2019, an
additional USDm 9.7 was paid in April 2020 (a total of USDm 16.2 paid) – remaining take-
out in 2021 of USDm 54
▪ Provider will replace leased vessel, reduce opex and increase catch capacity due to more
logistics capacity
▪ Growth capex of USDm 93.3 and maintenance capex of USDm 17.9 in 2017 - higher than
usual due to classing of both vessels and new living quarters on Antarctic Sea
▪ Growth capex of USDm 52.2 and 108.0 and maintenance capex of USDm 12.2 and 18.9 in
2018 and 2019, respectively
▪ Expected maintenance capex of USDm ~10 p.a. from 2020. Finalising of Antarctic
Provider in 2021 and investment in protein launch plant of USDm 13.5 in 2020 driving
growth investments
▪ As scale is further achieved on the investments, the ROCE is targeted to reach up to 15%
Potential investment opportunities
▪ Protein commercial plant (USDm 75) in 2023/2024 in order to launch full scale production
of the protein product for humans
▪ Superba oil line II (USDm 80-90) in 2022/2023 in order to build redundancy on the
Superba production
▪ New fishing vessel to replace Saga and Antarctic (USDm 130 – 150)
Maintenance capex
of USD 12.2m and
18.9m in 2018 and
2019, respectively

CASH FLOW
40
▪ COMMENTSCOMMENTARYUSD thousands 2017 2018 2019 Q1 2019 Q1 2020
Profit (loss) before tax (16,753) (1,281) (23,750) (7,850) (3,030)
Depreciation and amortization 17,123 21,961 36,776 5,598 11,515
Interest expenses/ income, net 10,717 12,101 21,699 3,148 6,339
Other P&L items with no cash flow effect 2,901 (1,502) 7,115 170 (5,169)
Funds provided from operating activities 13,988 31,279 41,839 1,066 9,655
Change in receivables (5,050) (5,664) (10,585) (3,488) 3,019
Change in inventory 2,837 (7,506) (19,336) (2,137) (1,212)
Change in payables and other working capital items 5,833 60 14,905 (13,590) (3,751)
Change in working capital 3,620 (13,111) (15,016) (19,215) (1,945)
Interest paid (7,587) (10,523) (16,520) 1,595 (4,399)
Interest income received - 161 1,084 1,097 243
Tax (846) 87 920 (91) 907
Cash flow from operations 9,175 7,894 12,307 (15,549) 4,462
▪ D&A increase driven by investments done over 2017-2019
▪ Interest expense increase due to above mentioned investments, funded primarily though loans.
Other P&L items in 2019, mainly relates to Juvel impairment of USDm 5.9, in addition to foreign
exchange effects
▪ Higher accounts receivables balance following increased revenue
▪ Inventory has increased to better hold and maintain a safety stock, especially within the feed
segment
▪ Payables: Generally increased cost base, and more vessels drive development, where Q4 are at
high levels due to yardstay in Q4 giving negative cash impact in Q1
▪ Same trend for interest paid as with interest expense, however lower as interests to Aker ASA
accumulates and are payable upon repayment of loan
▪ State Tax payments in US drives the majority of the taxes paid
▪ Negative cash flow from operations in Q1-19 due to acquisition accounting of Lang, as well as
significant payments during the first quarter following an extensive shipyard in 2018

BALANCE SHEET
41
Inventory
▪ The ingredient segment has a complex value chain with production in stages. In accordance with IFRS, actual
production expenses are capitalized to inventory each quarter and new weighted average cost is calculated at the
end of each quarter. Weighted average cost at quarter end is used as COGS in the following quarter. Production
expenses include direct production cost and depreciation, ~20% of inventory holding cost is depreciation. Lead time
varies from 6-9 months, depending on product. Significant build up of inventory over time, especially Qrill Aqua
Intangible assets
▪ Include goodwill from the Natural, Lang and Enzymotec transactions, in total USDm 94.6. As part of the Lang,
Neptune and Enzymotech transactions USDm 82.0 has been recognized as customer portfolios and trademarks. The
acquisition of the Flexitech technology in Houston in 2018 has been recognized as an intangible asset with USDm 2.0
Interest bearing debt
▪ Includes fair value earn-out liability of USDm 48 following the Lang transaction. Full earn-out recognized as of 31
December 2019 and Q1-20. The nominal amount to be paid, through 2021-2023, depends on Lang achieving future
financial targets, and could range from 0 to a maximum of USDm 50 if all targets are met. Future earn out payments
of USDm 22 in 2021, USDm 23 in 2022 and USDm 5 in 2023 based on the current business plan, funded by cash flow
from operations and RCF increase
▪ In order to enable the Company to access foreign capital while remaining in compliance with its fishing licenses, The
Resource Group TRG AS, owns through its fully owned company Antarctic Harvesting Holding AS 60% of the shares in
Aker BioMarine Antarctic AS. The Company has all voting rights except for certain fundamental matters which require
consent from both shareholders. Accounted as a USDm 1.3 interest bearing debt
Other non-interest bearing debt
▪ Includes fair value earn-out liability of USDm 48 following the Lang transaction to be paid out from 2021. Full earn-
out recognized as of 31 December 2019 and Q1-20. The nominal amount to be paid, through 2021-2023, depends on
Lang achieving future financial targets, and could range from 0 to a maximum of USDm 50 if all targets are met.
Based on the current business plan, the earn-out will be paid in full
Net working capital
▪ NWC has steadily increased over the past 3 years driven by higher accounts receivable and accounts payables
balances that follows the development in revenues and costs, while inventory balances have increased due to
inventory buildup. The Group has also increased the number of operational vessels from Q1 2019 which has resulted
in further inventory build-up in relation to both fuel and production consumables contributing to an increasing
amount of working capital tied up
Shares
▪ 69,053,544 shares, each with a par value of NOK 6.00
Off balance sheet commitments
▪ The Lang transaction also includes a milestone payment of USDm 10 to be paid in 2021 if certain milestones are
reached. The milestone payment is a consideration for services related to the introduction of Kori in the US. The
milestone payment will be recognized as a liability once the milestones are met. The potential payment will be
covered by funds from operations
▪ As of 31 December 2019, the Group had USDm 60 in commitments for further investments in Antarctic Provider to be
delivered in 2021. The commitment is fully funded
COMMENTARYUSD thousands 2017 2018 2019 Q1 2019 Q1 2020
ASSETS
Cash and cash equivalents 2,715 2,515 13,610 6,360 11,690
Accounts receivable and prepaid expenses 33,970 35,223 74,265 49,933 55,682
Inventories 36,198 43,704 94,725 77,526 96,537
Total current assets 72,883 81,442 182,600 133,819 163,909
Other non-interest bearing non-current receivables 2,304 2,266 404 2,323 1,257
Intangible assets 95,421 114,157 190,297 176,999 186,516
Property plant and equipment 206,804 232,383 318,921 325,737 330,493
Total non-current assets 304,529 348,806 509,623 505,058 517,566
TOTAL ASSETS 377,412 430,248 692,223 638,877 682,176
LIABILITIES AND OWNERS’ EQUITY
Accounts payable and other payables 31,110 28,409 51,994 36,432 47,277
Interest-bearing current liabilities 16,812 25,944 47,591 38,568 48,917
Total current liabilities 47,922 54,353 99,585 74,999 96,189
Other non-interest bearing non-current liabilities 11,871 17,657 65,618 38,660 65,340
Interest-bearing debt 258,322 179,424 372,473 352,875 367,831
Total non-current liabilities 270,193 197,081 438,091 391,535 433,171
TOTAL LIABILITIES 318,115 251,434 537,676 466,535 529,366
Total equity 59,297 178,814 154,547 172,342 152,816
TOTAL EQUITY AND LIABILITIES 377,412 430,248 692,223 638,877 682,176

ADDITIONAL INFORMATION
42

FUEL HEDGING
▪ In order to hedge its fuel expenses going forward, Aker BioMarine has purchased call options for 100% of its expected consumption during 2021 – 2024:
▪ 37,757 MT in 2021 at USD/MT of 378
▪ 33,332 MT in 2022 at USD/MT of 412
▪ 33,370 MT in 2023 at USD/MT of 550
▪ 33,206 MT in 2024 at USD/MT of 580
▪ Still exposed to spread between Rotterdam index and the local price in Montevideo that historically have been 200 - 300 USD/MT
▪ The call options have a total costs of USDm 9.0 and will be expensed as an Opex item in the P&L in Q2 2020
▪ Aker BioMarine has not hedged its consumption for 2020
43

LONG SEASON LASTING UP TO 10 MONTHS
VESSELS FISH AND PRODUCE CONTINUOUSLY DURING THE ~10 MONTH SEASON
▪ Season starts in December and ideally lasts until around the middle of September, but varies from year to year mostly due to weather conditions
▪ Vessels fish for krill almost continuously during the season
▪ Support vessel meet the fishing vessels at sea, bringing supplies, collecting products and switching out crews
▪ Aquatic drones and other technologies used to track and predict location of krill swarms
44
Dec Jan Feb Mar Apr May Jun Jul Aug Sep Oct NovActivity
Yard
Fishing season
10,7
21,319,8
22,519,7 21,0
16,2
10,7 10,4 9,1
1,50,0
Dec Jan Feb Mar Apr May Jun Jul Aug Sep Oct Nov
Average monthlycatch volumes('15-'18)
2017 2018 2019
Metric tonnes
Operative vessels 2 2 31
Total catch 171,554 207,259 232,368
Total offshore production 29,123 36,561 40,872
USD thousand
Total salaries 14,923 18,249 21,866
Fuel cost 11,470 18,980 19,042
Direct production cost 3,311 5,243 3,321
Other opex 11,227 13,656 18,637
Total offshore opex 40,931 56,127 62,866
SUMMARY OF VESSEL ECONOMICS
Seasonal
variation
▪ Vast majority of products, in terms of mass, are finalized on-board the vessels
▪ Superba krill oil for human consumption refined at plant in Houston
▪ Generally, six months between catch and revenue recognition
1. Endurance operated at low capacity according to plan, catching a total of ~44 tonnes

P&L RECONCILIATION
45
Revenue reconciliation
USDm 2017 2018 2019 Q1 2019 Q1 2020
Ingredients 124.2 154.2 177.2 32.5 41.6
Brands - - 82.2 6.7 32.7
Eliminations - - (13.4) - (3.6)
Reported revenues 124.2 154.2 246.0 39.2 70.7
EBITDA reconciliation
USDm 2017 2018 2019 Q1 2019 Q1 2020
Ingredients 17.2 33.1 40.3 1.0 7.2
Brands - - 7.9 0.6 5.7
Eliminations - - (2.5) (1.2)
Reported EBITDA 17.2 33.1 45.7 1.6 11.7
Adjustments 0.3 6.3 7.3 1.8 1.0
Adjusted EBITDA 17.6 39.4 53.0 3.4 12.7
Breakdown of reported COGS
USDm 2017 2018 2019 Q1 2019 Q1 2020
“Traditional” COGS items 65.4 71.5 121.1 21.6 38.4
Depreciation on producing assets 16.4 17.3 25.1 4.4 7.5
Reported COGS 81.8 88.8 146.2 26.0 45.9
Note: Brands (Lang) included from March 2019 in the reported figures
Reconciliation of reported COGS
USDm 2017 2018 2019 Q1 2019 Q1 2020
Reported COGS (ex. dep. on producing assets) 65.4 71.5 121.1 21.6 38.4
Unit economic COGS (ex. dep. on producing
assets) 63.4 79.5 91.5 21.2 26.1
Deviation 2.0 (8.0) 29.7 0.4 12.3
Commentary to the reported COGS reconciliation
▪ Reported COGS is derived from historic weighted average production cost.
▪ The unit economics COGS is the current period production cost that will be released as
Reported COGS upon sale of the product

DEBT FACILITIES
46
COMMENTS
USDm Amount (m)
Drawn,
Q1’20 (m) Currency Interest rate Bank Maturity Instalments
Corporate secured RCF 120.0 120.0 USD 3m Libor + 3.4% DNB, Rabo Apr 2023 Bullet
Overdraft facility 15.0 3.4 USD 3m Libor + 2.5% DNB Running Bullet
Saga Sea secured vessel loan 2.0 2.1 USD 3m Libor + 3.95% Caterpillar May 2022 Quarterly
Antarctic Sea secured vessel loan I 58.5 58.5 NOK 5.2% fixed Innovasjon Norge Sept 2026 Semi annual
Antarctic Sea secured vessel loan II 30.7 30.7 NOK 5.2% fixed Innovasjon Norge Nov 2026 Semi annual
Antarctic Sea secured vessel loan III 6.0 6.0 NOK 4.7% fixed Innovasjon Norge Nov 2023 Semi annual
Endurance secured vessel loan 103.0 103.0 USD CIRR (3.13%) DNB, GIEK, EKN Jan 2031 Quarterly
Provider secured vessel loan (Q2’21) 60.0 0.0 USD 3m Libor + 2.9% DNB, GIEK, EKN Jan 2033 Quarterly
LANG acquisition financing 52.9 52.9 USD 3m Libor + 3.25% DNB, Rabo Dec 2021 Bullet
LANG RCF 35.0 12.8 USD 3m Libor + 2.5% DNB, Rabo Dec 2021 BB / Bullet
Shareholder loan 89.8 89.8 USD Libor + 5.0% Aker ASA Mar 2022 Bullet
Other (leasing facility, etc) N/A 24.0 USD
▪ Annual debt repayment of approximately USDm 17

PASSIONATE EMPLOYEES WHO GO ABOVE AND
BEYOND TO REALIZE OUR COMMON GOALS
CONTINUING TO BUILD A UNIQUE CULTURE THAT ATTRACTS TALENTED EMPLOYEES AND CREATES AN ENGAGED ORGANIZATION
AKBM’S UNIQUE CULTURE DESCRIBES US
WHEN WE ARE AT OUR BEST
TREATING AND INVESTING IN PEOPLE AS OUR
MOST IMPORTANT ASSET
Source: “Engage Your Employees to See High Performance and
Innovation”, Gallup, 2020
▪ We go out of our way to attract and find talented
employees
▪ New employees are taken through a thorough on-
boarding camp
▪ We use a variety of tools and formats suited
for different learning styles to train and develop
employees
▪ “LEAD” program to develop and enable managers to
lead the AKBM way
▪ Innovative ideas come from inter-departmental,
multinational teams with employees in all age groups
w. 51 2019
78 %
15 %Global
average
47

ANTARCTIC KRILL FISHERY A-RATED: THE WORLD’S MOST
SUSTAINABLE REDUCTION FISHERY FOR 5 SUCCEEDING YEARS
AKER BIOMARINE IS TAILORING ITS 2030 TARGETS AND
REPORTING REGIME TO MEET THE FUTURE ESG EXPECTATIONS
AKER BIOMARINE CERTIFIED FOR INDUSTRY LEADERSHIP ON SUSTAINABLE FISHERIES –SUSTAINABILITY COMMITMENT EVIDENT FROM FOCUS ON GREEN INVESTMENTS
48
A Very-well-managed fisheries
B1 Reasonably managed fisheries with stock in good condition
B2 Reasonably managed fisheries
DD Fisheries with high uncertainty
C Poorly managed fisheries
▪ First mover on in-depth evaluation against EU taxonomy/Cicero Shades of Green conducted in June 2020.
The Shades of Green rating is limited to reduction of CO2 emissions and not ESG in total
▪ Sector transition is critical to meet the growing demand for food in the years to come and Aker BioMarine’s
business model delivers product lines directly into the transition towards more sustainable food systems
balanced with environmental and health needs
▪ High commitment to sustainability is highlighted by the Cicero Shades of Green investments rating
▪ Qrill Aqua recognized as a contributor to reduced CO2 emissions by Cicero Shades of Green as it replaces
alternative protein sources with greater CO2 footprint (e.g. soy). Superba does not reduce CO2 emissions and
thus rated light brown. Positive contribution from krill oil in reducing lifestyle diseases not accounted for in
the Shades of Green rating as scope of the rating is limited to reduction of CO2 emissions
▪ 2030 reduction targets and supporting policies to align with EU taxonomy objectives in place - integration
with planning of all investments
▪ Automated reporting on key impact areas (CO2, water and plastic) to report annual progress against 2030
reduction targets to internal and external stakeholders
AKER BIOMARINE’S FISHERY AND PRODUCTION
CERTIFIED BY THE MSC AND FRIENDS OF THE SEA (FoS)
MSC Principles
Fail
(>60)
Best
practice
(60-80)
State of
the art
(80-100)
Sustainability of the stock - -89
Ecosystem impacts - - 97
Effective management - - 96
Shades of Green by annual revenue 2019 Shades of Green by annual investments 2019
Dark Green Medium Green Light Green Light Brown Medium Brown Dark Brown
Shades of Green evaluation only
takes into account CO2 emissions,
not other ESG factors

COMPETITIVE LANDSCAPE
49
CURRENT ANTARCTIC KRILL FISHERIES BY VALUE CHAIN CAPABILITIESGLOBAL OMEGA 3 INGREDIENTS1 FOR HUMAN
CONSUMPTION
Sources: 1) “Ingredient market report 2017-18”, GOED, 2019 2) Soy Bean Meal, US Dep, of Agriculture, May 2020, Fish meal, “Statistical Yearbook 2018”, IFFO, 2019, Krill Meal = 2019 AKBM prod. Excl. Nutra, Insect meal, “The
European Insect Sector today”, IPIFF, 2019
FEED INGREDIENT PRODUCTION FOR ANIMAL
CONSUMPTION
Planned or typical value chain capability Current value chain capability
Catch
MT ‘000
Harvesting Logistics R&D DistributionKrill oil production
extraction
New projects are typically announced or started every couple of years, but few have historically come to fruition
33
6
Fish Meal*
237,470
Soy Bean
Meal
AKBM
Krill meal
EU
Insect meal
5,801
Krill
USDm
110,351Others
MT
1,377
102
111,210
859
1,275
Market share by source, 2018
Billion MT by source, 2019
Various int. nat.
projectsNA
CNFC
Lianoning Pelagic
Fisheries (Liaoyu)
Chonghe (CMI)
50
Insung
Dongwon
43
IRF22
Pesca Chile21
Various subject to
financingNA
AKER BIOMARINE243

RETAIL MARKET SHARES – HUMAN SUPPLEMENTS AND PET FOOD
50
US DOG FOOD MARKET SHARE (USD) – TOTAL RETAIL SALES OF USDbn 22.31US OMEGA-3 MARKET SHARE (USD)
34%
18%16%
11%
4%
14%
Nature Made
Schiff
Smarty Pants
Sundown
Natures Bounty
Private Label
3%
Other
BRAND USD RANKING
52w ending March 2020 (Omega-3 only)
1 Nature Made (USDm 113)
2 Schiff (USDm 61)
3 Natures Bounty (USDm 54)
4 Private Label (USDm 38)
5 Smarty Pants (USDm 12)
6 Sundown (USDm 9)
7 Other (USDm 48)
Source: IRI Total Mulo (All IRI Covered Retailers) (Incl. Walmart, CVS, Sam’s and
more)
1) Total retail sales in 2018
Source: Dog food in the US 2019 - Euromonitor, June 2019
Mars Inc
General Mills Inc
Nestlé SA
Private label
Colgate-Palmolive Co
JM Smucker Co
Others
21.6%
20.3%
15.2%
11.7%
10.8%
8.2%7.1%
‘18 market
share
0
10
20
30
2010 2012 2014 2016 2018
Mark
et
share
(%)
