comparative assessment of human and farm animal …archimer.ifremer.fr/doc/00000/11071/11297.pdf ·...
TRANSCRIPT

Ple
ase
note
that
this
is a
n au
thor
-pro
duce
d P
DF
of a
n ar
ticle
acc
ept
ed fo
r pu
blic
atio
n fo
llow
ing
peer
rev
iew
. The
def
initi
ve p
ub
lish
er-a
uthe
ntic
ated
ve
rsio
n is
ava
ilab
le o
n th
e pu
blis
her
Web
site
1
FEMS Microbiology Ecology June 2009, Volume 68, Issue 3, pages 351–362 http://dx.doi.org/10.1111/j.1574-6941.2009.00671.x © 2009 Federation of European Microbiological Societies. Published by Blackwell Publishing Ltd. All rights reserved This is the pre-peer reviewed version of the following article, which has been published in final form at http://onlinelibrary.wiley.com
Archimerhttp://archimer.ifremer.fr
Comparative assessment of human and farm animal faecal microbiota using real-time quantitative PCR
Jean-Pierre Furet1, *, Olivier Firmesse1, Michèle Gourmelon2, Chantal Bridonneau1, Julien Tap1,
Stanislas Mondot1, Joël Doré1, Gérard Corthier1
1 INRA, U910, Unité d'Ecologie et de Physiologie du Système Digestif, Jouy-en-Josas, France 2 IFREMER, Laboratoire de Microbiologie EMP/MIC, Plouzané, France
*: Corresponding author : Jean-Pierre Furet, email address : [email protected]
Abstract:
Pollution of the environment by human and animal faecal pollution affects the safety of shellfish, drinking water and recreational beaches. To pinpoint the origin of contaminations, it is essential to define the differences between human microbiota and that of farm animals. A strategy based on real-time quantitative PCR (qPCR) assays was therefore developed and applied to compare the composition of intestinal microbiota of these two groups. Primers were designed to quantify the 16S rRNA gene from dominant and subdominant bacterial groups. TaqMan® probes were defined for the qPCR technique used for dominant microbiota. Human faecal microbiota was compared with that of farm animals using faecal samples collected from rabbits, goats, horses, pigs, sheep and cows. Three dominant bacterial groups (Bacteroides/Prevotella, Clostridium coccoides and Bifidobacterium) of the human microbiota showed differential population levels in animal species. The Clostridium leptum group showed the lowest differences among human and farm animal species. Human subdominant bacterial groups were highly variable in animal species. Partial least squares regression indicated that the human microbiota could be distinguished from all farm animals studied. This culture-independent comparative assessment of the faecal microbiota between humans and farm animals will prove useful in identifying biomarkers of human and animal faecal contaminations that can be applied to microbial source tracking methods.
Keywords: quantitative PCR; faecal microbiota; human; farm animals

3
Introduction 1
Faecal pollution in coastal or fresh waters leads to human disease and economic losses such 2
as closure of commercial shellfish-harvesting and recreational and bathing areas. Recent 3
incidents include the isolation of human enteric viruses and bacteria such as norovirus, 4
hepatitis A virus, and Salmonella from coastal waters and shellfish which were implicated in 5
shellfish-borne outbreaks after oyster consumption (Potasman et al., 2002, Martinez-Urtaza et 6
al., 2004). In light of this risk to health and safety, it is important to identify the source of 7
faecal contamination to better facilitate resource management and remediation. 8
Faecal contamination of water resources is currently evaluated by employing culturing 9
methods to detect and enumerate living facultative-anaerobic bacteria, such as Escherichia 10
coli, enterococci, or faecal coliforms. Samples are normally obtained from shellfish or 11
directly from bathing waters (Directives 2006/113/CE; 2006/7/CE). The species traditionally 12
used as faecal indicators, however, have limitations owing to several factors including 1) their 13
short survival time in an open-water environment, 2) their ability to proliferate in soil, sand or 14
sediments absent any point-source faecal contamination, 3) the low levels of correlation with 15
the actual presence of pathogens, 4) the underestimation of true bacterial presence through 16
omission of non-cultivable bacteria, 5) their inability to track the source of faecal 17
contamination because coliforms and enterococci are common to all mammalian hosts 18
(Roszak & Colwell, 1987; Pommepuy et al., 1996; Gordon & Cowling, 2003; Wheeler et al., 19
2003; Hörman et al., 2004; Savichtcheva & Okabe, 2006). In order to overcome these 20
shortcomings, alternative methods and indicators must be developed. Potential alternative 21
indicators of faecal contamination could be anaerobic bacteria such as Bacteroides and 22
Bifidobacterium which are more abundant in the faeces of warm-blooded animals than E. coli 23
(Fiksdal et al., 1985; Suau et al., 1999). Importantly, these species have been shown to exhibit 24
host-specific adaptation on the genetic level (Dick et al., 2005). While these bacteria are 25

4
fastidious to enumerate with conventional culture techniques, they can nonetheless be easily 1
detected using current molecular methods. Since uncultivated bacteria represent 70 to 80% of 2
the total human microbiota, culture-independent methods of analysis based on 16S ribosomal 3
RNA have been developed (Suau et al., 1999; Eckburg et al., 2005). These studies showed 4
that the most highly represented bacterial groups in human stools were the Clostridium leptum 5
and the Clostridium coccoides groups of the Firmicutes followed by the 6
Bacteroides/Prevotella group and the Bifidobacterium genus (Harmsen et al., 2002; Lay et 7
al., 2005a). Studies involving domestic animal microbiota are less numerous and are mainly 8
focused on the phylogenetic diversity of the intestinal bacterial community in pigs, cattle and 9
chicken (Lan et al., 2002; Leser et al., 2002; Ozutsumi et al., 2005). Recently, specific qPCR 10
approaches were used to estimate a limited number of bacterial species or groups of faecal 11
microbiota (Matsuki et al., 2004, Seurinck et al., 2005, Reischer et al., 2006). 12
The work presented here seeks to establish a more comprehensive dataset in comparing 13
human and farm animal microbiota. To this end, we developed and optimized a qPCR-based 14
approach which was subsequently applied to analyze faecal samples collected from humans 15
and farm animals. Using such molecular techniques we overcome the limits of traditional 16
faecal indicators, including culturing methods, which consistently underestimate faecal 17
population. The development and application of our qPCR systems quantifies faecal bacteria 18
groups in human and animal faecal samples and provides essential information concerning 19
potential alternative faecal indicators and host-specific bacterial groups. 20
21
Materials and Methods 22
DNA extraction from faecal samples 23
The DNA extracts from faecal samples of 21 human stools were prepared as previously 24
described (Godon et al., 1997, Lay et al., 2005b). Faecal samples from five individual animals 25
5
were collected for each of six farm species (rabbit, goat, horse, pig, sheep and cow) and stored 1
at -80°C immediately after sampling. Total cellular DNA was extracted from 0.2 g of animal 2
faecal material using the G’NOME® kit (BIO 101, La Jolla, CA) with modifications. Faecal 3
samples were homogenized in the supplied Cell Suspension Solution. Cell Lysis/Denaturing 4
Solution was then added and the samples incubated at 55 °C for 2 hours. To improve cellular 5
lysis, 750 µl of 0.1-mm-diameter silica beads were added, and agitation carried out at 6
maximum speed for 10 minutes in a Beadbeater (Biospec, Bartlesville, OK). 7
Polyvinylpolypyrrolidone (15 mg) was added to ensure removal of polyphenol contamination 8
that could inhibit subsequent qPCR reactions. Samples were vortexed and centrifuged at 9
20,000 × g for 3 minutes and the supernatant was recovered. The remaining pellet was 10
washed with 400 µl of TENP (50 mM Tris (pH8), 20 mM EDTA (pH8), 100 mM NaCl, 1 % 11
polyvinylpolypyrrolidone) and centrifuged at 20,000 × g for 3 minutes. The washing step was 12
repeated once more and the resulting supernatants pooled. Nucleic acids were precipitated by 13
addition of 1 volume isopropanol, storage at -20°C for 20 minutes, and centrifugation at 14
20,000 × g for 10 minutes. The pellet was resuspended in 400 µl of distilled water plus 100 µl 15
of Salt-Out Mixture and incubated at 4°C for 10 minutes. Samples were spun for 10 minutes 16
at maximum speed, and the supernatant containing the DNA was transferred to a clean 1.5ml 17
microcentrifuge tube. DNA was precipitated with 2 volumes of 100% Ethanol at room 18
temperature for 5 minutes followed by centrifugation at 16,000 × g for 5 minutes. DNA was 19
resuspended in 150µl of TE Buffer. DNA solutions were stored at -20°C for later analysis. 20
21
Validation of the G’NOME DNA extraction method 22
We compared our DNA extraction method to our former reference (Godon et al., 1997). Two 23
series of DNA extracts from 12 human faecal samples were prepared by each method. The 24
6
All-Bacteria primers (Table 1) were used to perform PCR to compare both DNA extraction 1
protocols and to validate our method. 2
3
Performance of the real-time qPCR protocol in artificial mixtures. 4
To validate the performance of our modified G’NOME DNA extraction protocol and to 5
facilitate real-time qPCR methods, we employed an approach whereby individual samples 6
were spiked with a measured quantity of a known bacterial species. Briefly, several tubes (1 7
ml) of pure culture Lactococcus lactis were centrifuged. Pelleted cells were either stored pure 8
at -80°C or used to spike otherwise Lactococci-free faecal samples before storage. Total 9
bacterial DNA from 6 pellets and 12 spiked faecal samples was extracted. The resulting levels 10
of Lc. lactis were assessed by real-time qPCR using species-specific 16S rDNA primers 11
(Llac05-F: AGCAGTAGGGAATCTTCGGCA and Llac02-R: 12
GGGTAGTTACCGTCACTTGATGAG). The quantitative results from bacterial pellets and 13
spiked faecal samples were compared to validate the performance of our protocol. 14
15
Oligonucleotide primers and probes 16
TaqMan® qPCR was adapted to quantify total bacteria population in addition to the dominant 17
(>1% of faecal bacteria population) bacterial species C. coccoides, C. leptum, 18
Bacteroides/Prevotella and Bifidobacterium. Quantitative PCR using SYBR-Green® was 19
performed for the sub-dominant bacterial species Escherichia coli, Streptococcus salivarius, 20
for the previously described Enterococcus group, and for the 21
Lactobacillus/Leuconostoc/Pediococcus group. Primers and probes used in this study (Table 22
1) were designed based on 16S rRNA sequences (EMBL database) aligned with the program 23
Clustal W (Thompson et al., 1994). Primer design was carried out using Primer-Express 24
version 2.0 (Applied-Biosystems). The specificity of the primers and probes was tested by 25

7
submitting the sequences to the Probe Match program (Ribosomal Database Project II; 1
Maidak et al., 2001). Prior to laboratory testing, OligoCheck 2
(http://www.cf.ac.uk/biosi/research/biosoft) was used to examine the in silico performance of 3
the PCR systems against 5127 sequences of 16S rDNA from type-strains of intestinal 4
bacteria. The TaqMan® probes were synthesized by Applied-Biosystems Applera-France. 5
Primers were purchased from MWG (MWG-Biotech AG, Ebersberg, Germany). Primer and 6
probe specificities were further assessed using the real-time qPCR protocol against a series of 7
selected cultured strains (Table 3). 8
9
Real-time qPCR 10
Real-time qPCR was performed using an ABI 7000 Sequence Detection System with software 11
version 1.2.3 (Applied-Biosystems). Amplification and detection were carried out in 96-well 12
plates with TaqMan® Universal PCR 2X Master Mix (Applied-Biosystems) or with SYBR-13
Green® PCR 2X Master Mix (Applied-Biosystems). Each reaction was run in duplicate in a 14
final volume of 25 µl with 0.2 µM final concentration of each primer, 0.25 µM final 15
concentration of each probe and 10µl of appropriate dilutions of DNA samples. 16
Amplifications were carried out using the following ramping profile: 1 cycle at 95°C for 10 17
min, followed by 40 cycles of 95°C for 30 sec, 60°C for 1 min. For SYBR-Green® 18
amplifications, a melting step was added to improve amplification specificity. 19
20
Bacterial strains and growth conditions 21
The various bacterial strains used to control for the specificity of the primers and probes in 22
this study are shown in Table 3. Bacterial strains were either available in our laboratory 23
collection or were otherwise obtained from the German Collection of Microorganisms and 24
Cell Cultures (DSMZ). Bacteria were cultured aerobically or anaerobically on selective broth 25

8
as recommended by DSMZ. For each culture, the total number of bacteria, in terms of colony 1
forming units (CFU), was determined by plating. Aliquots of 1 ml of culture were centrifuged 2
at 12,000 × g for 3 minutes and the bacterial pellets were stored at -80°C prior to use. 3
4
Bacterial DNA extraction, standard curves and quantification 5
Bacterial genomic DNA used to generate standard curves was extracted twice with the Wizard 6
Genomic DNA Purification Kit (Promega) following the manufacturer’s instructions. For the 7
quantification of bacterial species and groups, standard curves were generated from serial 8
dilutions of a known concentration of genomic DNA from each species or group. Standard 9
curves were generated by plotting threshold cycles (Ct) versus bacterial quantity (CFU). The 10
total number of bacteria (CFU) was interpolated from the averaged standard curves as 11
previously described (Lyons et al., 2000). When PCR was performed on unknown faecal 12
samples, we used these standard curves to quantify each bacterial population. The lower limit 13
for detection for bacterial enumeration with good precision is 106 bacteria per gram of stool. 14
15
Normalization of Q-PCR results 16
In human and animal microbiota, All-bacteria results are presented as the mean of the log10 17
value ± SEM. To overcome the fact that faecal samples may contain more or less water, we 18
have normalized the data for each faecal sample. The level for each bacterial species or group 19
was subtracted by the level of All-bacteria content. The data are given as the log no. of 20
bacteria per gram of faecal sample. 21
22
Statistics 23
In comparing the human microbiota to those of animals, a one-way ANOVA test was 24
performed using JMP® software (Abacus Concepts, Berkeley, CA). When ANOVA indicated 25

9
a significant result, values were subsequently compared using non-parametric tests 1
(Wilcoxon). Statistical significance was accepted at P<0.05 (P value adjustment method: 2
Holm). Partial Least Squares (PLS) regression was also used (Moulin-Schouleur et al., 2006) 3
to assess the differences between human and farm animal microbiota (variables Y) on the 4
basis of the qPCR results (variables X). PLS predictive models using PLS regression were 5
established using the SIMCA software, version 8.1 (UMETRI, Umeå, Sweden). The PLS 6
regression between variables X and variables Y yielded the PLS components. These 7
components described the variables X and explained the variables Y. The number of useful 8
PLS components was determined by cross-validation (SIMCA-P 9.0, 2001). The X-loadings 9
and the Y-loadings were noted w* and c, respectively. Groups of strains were presented as 10
situated on a plane defined by the PLS components. The predictive quality of the model was 11
evaluated using the R2Y coefficient which corresponded to the proportion of the variance of 12
variables Y explained by variables X. 13
14
Results 15
Validation and performance of DNA extraction 16
Total bacteria counts, as measured by qPCR, performed on DNA extractions obtained using 17
the former reference method of Godon (1997) and our modified G’NOME method were 18
highly similar. Total bacteria levels in the two series of DNA preparations were 11.55 ± 0.1 19
and 11.44 ± 0.1 logs of enumerated bacterial for the Godon and G’NOME methods, 20
respectively, with no statistical difference. This result indicates that the performance of our 21
technique is equivalent to that of Godon (1997). 22
23
Performance of the real-time qPCR protocols in artificial mixtures 24

10
Population levels of Lc. lactis determined using qPCR on Lc. lactis bacterial pellets and 1
spiked faecal samples were 9.31 ± 0.35 and 9.05 ± 0.39 logs of bacteria, respectively. No 2
significant difference between the two was observed. This result further confirmed the robust 3
nature of the real-time qPCR assay coupled with our DNA extraction method for 4
quantification of bacterial population levels in faecal samples. 5
6
Validation of primers and probes 7
The specificity of all PCR systems (Table 1) was tested by submitting each oligonucleotide 8
sequence to the Probe Match Program (Ribosomal Database Project II) (Maidak et al., 2001). 9
This program identifies the target species, if any, matching each PCR system (Table 2). The 10
results from a complementary program, OligoCheck details the number and position of any 11
mismatches (Table 2; positions of mismatches are provided in a supplementary Table S1). 12
We tested the resulting PCR systems specificity against DNA extracted from pure cultures of 13
48 different strains of bacterial (Table 3). All positive and negative PCR assay results 14
corroborated our in silico predictions. For the Lactobacillus group, it was not possible to 15
design genus-specific primers since Leuconostoc was also detected by the PCR system (Table 16
3). 17
18
Composition of human faecal microbiota assessed by qPCR 19
For the different targeted bacterial groups, qPCR systems were validated using genomic DNA 20
extracted from the faecal microbiota of healthy human subjects. These results defined a 21
“standard” profile for dominant and sub-dominant groups present in the human intestinal 22
microbiota. Dominant species or groups are defined as those found to represent 1% (- 2.0 log 23
no. of bacteria) or more of the faecal bacteria population. C. leptum, C. coccoides and 24
Bacteroides/Prevotella groups are dominant populations (Table 4). Thus, the Bifidobacterium 25

11
population, having a value of -2.4, suggests a sub-dominant population of human microbiota. 1
This microbiota profile was subsequently used in comparisons against that of farm animals. 2
3
Comparison of bacterial populations in stools from human and farm animals 4
Differences in the bacterial composition of animal stool samples compared to those found in 5
the human faecal microbiota were assessed using qPCR (Table 4). Global One-way ANOVA 6
testing showed significant differences in bacterial compositions between the two groups. 7
The non-parametric Wilcoxon test was used to reveal whether each Q-PCR system allows for 8
discrimination of the bacterial population of humans and animals. This statistical test can also 9
show how animal microbiota differs from human. The C. leptum qPCR system revealed 10
several significant differences between human and horse, cow, goat, and sheep microbiota 11
(Table 4). When comparing results between human and rabbit microbiota for the C. leptum 12
group, no significant difference was observed (Table 4). 13
Although unable to distinguish between the microbiota of human and pig, the C. coccoides 14
group qPCR system produced significantly different results for all other animals, with values 15
being higher than that of human (Table 4). 16
The Bacteroides/Prevotella group displayed the same type of enrichment as C. coccoides for 17
horse, cow, goat and sheep microbiota. Two exceptions were noted however, in rabbit and 18
pig, where no statistically difference with respect to human samples was observed (Table 4). 19
We also found the Bifidobacterium genus to vary significantly in the faeces of horse, cow, 20
sheep and pig compared to human (Table 4). The Bifidobacterium population in goat and 21
rabbit faeces were similar in relation to human and showed the lowest normalized data (Table 22
4). 23
The Lactobacillus/Leuconostoc/Pediococcus group failed to discriminate the microbiota of 24
animals and human, with the sole exception being for pig samples. It is important to note that 25

12
the targeted lactobacilli population in pig microbiota showed the lowest normalized result 1
(Table 4). 2
The E. coli species qPCR system could distinguish human and animal microbiota except in 3
the cases of goat and sheep. Our study showed that the E. coli value in pig microbiota is the 4
lowest (-2.7 log no of bacteria) when compared to those of animals and humans, and was not 5
detected in the faecal samples of rabbit (Table 4). S. salivarius species was also not detected 6
in faecal samples of rabbit, in addition to being absent from both sheep and pig. Nevertheless, 7
the results show that S. salivarius can be used to distinguish the human microbiota from those 8
of horse, cow and goat (Table 4). S. salivarius was more abundant in human faecal samples 9
than in the other faecal samples. The Enterococcus species could not be detected in any 10
animal faecal sample in contrast to its presence in human samples (Table 4). 11
PLS regression analysis based on faecal microbiota composition assessed using real-time 12
qPCR confirmed that the human faecal microbiota could be clearly differentiated from that of 13
farm animals in the 95% probability region (Fig.1A). The first two components of the PLS 14
model explained 85% of the variation of the Y-matrix, indicating a good separation of the 15
human group compared to the groups of farm animals. The X-loadings (w*) corresponding to 16
faecal microbiota quantifications and the Y-loadings (c) corresponding to the human and farm 17
animal groups are presented in Figure 1B. PLS regression analysis demonstrated that the C. 18
coccoides group, Enterococcus genus and S. salivarius species characterize the human faecal 19
microbiota and Lactobacillus/Leuconostoc/Pediococcus characterize the pig faecal 20
microbiota. 21
22
Discussion 23
Pollution by human and animal faeces harbouring potential human pathogens represents a 24
serious environmental threat that affects many natural waters. Waters contaminated with 25

13
human faeces, in particular, are generally considered to represent a greater risk for human 1
health as they contain human-specific enteric pathogens (Baudart et al., 2000; Koopmans & 2
Duizer, 2004; Godfree & Farrell, 2005). Animals can also serve as reservoirs for numerous 3
enteric pathogens (Hancock et al., 2001; Brown et al., 2004; Cox et al., 2005). Given this 4
complex situation, the ability to accurately track faecal contamination in the environment and 5
identify its origin is of great importance. The key points of such a technique are the choice of 6
reliable and differential faecal indicators and the development of quantitative Microbial 7
Source Tracking methods. 8
To address these requirements, a robust and reproducible protocol is required to quantify 9
bacterial species and groups in faecal samples originating from different possible 10
contamination sources. Matsuki and colleagues (2004) were the first to apply qPCR, based on 11
16S rRNA gene quantification, to analyze the diversity of human intestinal Bifidobacterium. 12
In our work, employing an optimized protocol, we quantified equivalent numbers of 13
Bifidobacterium in human samples, compared with Matsuki et al. This corroborative result 14
gave us confidence in expanding the use of the qPCR technique to compare the whole human 15
faecal microbiota to that of animals. 16
One additional variable that, in some cases, could influence the measurement and comparison 17
of different groups of bacteria is the water content of each faecal sample. Low water content, 18
for example, could contribute to the high bacterial concentration observed in goat and sheep 19
samples. To overcome this potential variable, we normalized our data using All-bacteria 20
populations. 21
As discussed below, our data are consistent with a number of smaller-scale investigations 22
which focused on individual farm species or targeted groups of bacteria. In our study, we 23
observed that the pig faecal microbiota is characterized by a population of 24
Lactobacillus/Leuconostoc/Pediococcus higher than that found in other animals or humans. 25

14
Given the value of -1.2 log no. of bacteria, this population could be considered dominate in 1
pig microbiota. These data are in agreement with the observation by Castillo et al. (2006) 2
showing a high level of Lactobacillus in the upper gastrointestinal tract of pig. These results, 3
combined with those obtained for E. coli, suggest that both populations can be considered 4
important in pig microbiota. 5
Canzi et al. (2000) enumerated Bacteroides and Clostridium in rabbit faeces. We also found 6
the same range of populations for the Bacteroides/Prevotella group. However, for 7
Clostridium populations, our study indicated higher colonization levels (about 6 logs higher) 8
than those observed by these authors. This discrepancy could be due to methodological 9
differences as Canzi et al. used spore enumerations for their Clostridia estimation. The fact 10
that our technique enumerates vegetative cells as well as non-cultivable bacteria is the most 11
likely explanation for the higher concentration observed. Moreover, our PCR system also 12
detected Eubacteria and Ruminococci species which are part of the Clostridium group. 13
For equine microbiota, our results are consistent with a previous study (Daly and Shirazi-14
Beechey, 2003) where the authors used oligonucleotide probes in hybridization assays. Daly 15
and Shirazi-Beechey found no Bifidobacterium and observed that the Eubacterium rectale-16
Clostridium coccoides group, combined with Spirochaetaceae and the Cytophaga-17
Flexibacter-Bacteroides assemblage, represented the largest colonized populations (10 to 18
30%). The authors further noted that the Bacillus-Lactobacillus-Streptococcus group with 19
Fibrobacter constituted 1 to 10% of the total microbiota in horse samples. 20
It is likely that the bacterial biodiversity of the equine microbiota compared with human 21
contributes to the significant differences in bacterial quantification. Quantitative PCR 22
developed to detect intestinal bacteria in human samples further highlight the species 23
specificity of our protocols and the fact that the bacterial biodiversity of the equine microbiota 24
is notably different from that of human. 25

15
Several studies have also reported on the bovine intestinal microbiota. Stahl and co-workers 1
(1988) used species- and group-specific 16S rRNA targeted probes for enumeration of two 2
species (Fibrobacter succinogenes and Lachnospira ruminicola) in the rumen of animals 3
treated with antibiotics. Tajima (2001) used qPCR to quantify several Prevotella and some 4
Ruminococcus, Fibrobacter, and Eubacterium species in the rumen. In 2005, An et al. 5
estimated the prokaryote diversity in the rumen of yak (Bos grunniens) and Jinnan cattle (Bos 6
taurus) by 16S rRNA sequence homology analysis. Their results showed a prevalence of 7
Bacteroides, however, no sequence was related to Ruminococcus albus (a species of the C. 8
leptum group) in the yak and cow rumen. In our study, the level of Bacteroides/Prevotella 9
population presents a normalized difference of -2.3 log no. of bacteria and can not be regarded 10
as a dominant population, while C. leptum group shows only -1.0 log no. of bacteria and is 11
part of the dominant population. Whitford (1998) and Ozutsumi (2005) presented a 12
phylogenetic analysis of rumen bacteria by comparative sequence analysis of cloned 16S 13
rDNA. Approximately 30% of the sequences were related to bacteria of the 14
Bacteroides/Prevotella group, most of which clustered with Prevotella ruminicola. The 15
remaining sequences clustered with members of the Clostridium genus. The differences 16
observed with our findings are likely due to different technical approaches and/or diversity of 17
microbiota among bovine herds. 18
To our knowledge, no previous study has used qPCR techniques to describe and compare the 19
intestinal microbiota between animal and human. Our qPCR systems, checked in silico by 20
OligoCheck against RDP databases, were successfully able to discriminate different intestinal 21
microbiota. 22
Our global comparison between human and farm animal microbiota provides data to select 23
host-specific bacterial groups and alternative faecal indicators from all hosts considered. 24

16
Our PLS regression analysis showed that C. coccoides group, Enterococcus genus and S. 1
salivarius species could be considered as specific markers for human faecal microbiota and 2
that Lactobacillus/Leuconostoc/Pediococcus can be used as a specific marker of pig 3
microbiota. 4
The C. leptum group was found to have the lowest normalized data in humans and animals 5
and thus represents a promising candidate for use as a reliable faecal indicator. It is largely 6
distributed among animal species and in humans and has also been linked with diseases 7
(Manichanh et al., 2006; Sokol et al., 2006). Our study also shows high concentrations of 8
Bacteroides/Prevotella and Bifidobacterium in all host faecal samples tested. Such anaerobic 9
bacteria do not persist for long periods of time in aerobic waters and are generally unable to 10
multiply in such conditions (Fiksdal et al., 1985; Kreader, 1998). These inherent 11
physiological characteristics make the Bacteroides and Bifidobacterium excellent candidates 12
for detecting faecal contamination in the environment. Integrated within these two dominant 13
bacterial groups are several species that were found to be host-specific in several studies 14
(Bernhard & Field, 2000a; Bonjoch et al., 2004; Dick et al., 2005). Host-specific Bacteroides 15
markers were developed (Bernhard & Field, 2000b; Dick et al., 2005) and applied in a 16
watershed in the USA (Shanks et al., 2006). They were also validated on French faecal and 17
environmental samples (Gourmelon et al., 2007). Quantitative PCR assays are currently in 18
progress and some results have already been published for human and bovine-specific 19
Bacteroides (Seurinck et al., 2005; Reischer et al., 2006). 20
Among the teams who have studied the microbiota of animals over the last decade none, up to 21
now, has presented a global comparison of the faecal microbiota composition of humans and 22
animals. Our results are thus promising in advancing the goal to define a discrete set of host-23
specific faecal microbiota biomarkers. Additional investigations are continuing to refine a set 24
of comprehensive, reliable, and predictive host-specific markers. 25

17
1
Acknowledgments: The authors thank Valeria Dellaretti Guimarães and Sean P Kennedy for 2
critical reading of this manuscript. 3
4
References 5 6 An D, Dong X & Dong Z (2005) Prokaryote diversity in the rumen of yak (Bos grunniens) 7
and Jinnan cattle (Bos taurus) estimated by 16S rDNA homology analyses. Anaerobe 4: 207-8
215. 9
Baudart J, Gradulos J, Barusseau JP & Lebaron P (2000) Salmonella spp. and fecal coliform 10
loads in coastal waters from a point vs. nonpoint source of pollution. J Environ Qual 29: 241-11
250. 12
Bernhard AE & Field KG (2000a) Identification of nonpoint sources of fecal pollution in 13
coastal waters by using host-specific 16S ribosomal DNA genetic markers from fecal 14
anaerobes. Appl Environ Microbiol 66: 1587-1594. 15
Bernhard AE & Field KG (2000b) A PCR assay to discriminate human and ruminant feces on 16
the basis of host differences in Bacteroides-Prevotella genes encoding 16S rRNA. Appl 17
Environ Microbiol 66: 4571-4574. 18
Bonjoch X, Ballesté E & Blanch AR (2004) Multiplex PCR with 16S rRNA gene-targeted 19
primers of Bifidobacterium spp. to identify sources of fecal pollution. Appl Environ Microbiol 20
70: 3171-3175. 21
Brown PE, Christensen OF, Clough HE, Diggle PJ, Hart CA, Hazel S, Kemp R, 22
Leatherbarrow AJH, Moore A, Sutherst J, Turner J, Williams NJ, Wright EJ & French NP 23
(2004) Frequency and Spatial Distribution of Environmental Campylobacter spp. Appl 24
Environ Microbiol 70: 6501-6511. 25
Canzi E, Zanchi R, Camaschella P, Cresci A, Greppi GF, Orpianesi C, Serrantoni M & Ferrari 26
A (2000) Modulation by lactic-acid bacteria of the intestinal ecosystem and plasma 27
cholesterol in rabbit fed a casein diet. Nutrition Research 22: 1329-1340. 28
Castillo M, Martin-Orue SM, Manzanilla EG, Badiola I, Martin M & Gasa J (2006) 29
Quantification of total bacteria, enterobacteria and lactobacilli populations in pig digesta by 30
real-time PCR. Vet. Microbiol. 114: 165-170. 31
18
Cox P, Griffith M, Angles M, Deere D & Ferguson C (2005) Concentrations of pathogens and 1
indicators in animal feces in the Sydney watershed. Appl Environ Microbiol 71:5929-5934. 2
Daly K & Shirazi-Beechey SP (2003) Design and evaluation of group-specific 3
oligonucleotide probes for quantitative analysis of intestinal ecosystems: their application to 4
assessment of equine colonic microflora. FEMS Microbiology Ecology 44: 243-252. 5
Dick LK, Bernhard AE, Brodeur TJ, Santo Domingo JW, Simpson JM, Walters SP & Field 6
KG (2005) Host distributions of uncultivated fecal Bacteroidales bacteria reveal genetic 7
markers for fecal source identification. Appl Environ Microbiol 71: 3184-3191. 8
Directive 2006/7/EC of the European Parliament and of the Council of 15 February 2006 9
concerning the management of bathing water quality and repealing Directive 76/160/EEC. 10
Off. J. Eur. Union. L64:37-51. 11
Directive 2006/113/EC of the European Parliament and of the Council of 12 December 2006 12
on the quality required of shellfish waters. 27/12/2006. Off. J. Eur. Union. L376:14-20. 13
Eckburg PB, Bik EM, Bernstein CN, Purdom E, Dethlefsen L, Sargent M, Gill SR, Nelson 14
KE & Relman DA (2005) Diversity of the human intestinal microbial flora. Science 308: 15
1635-1638. 16
Fiksdal L, Maki JS, LaCroix SJ & Staley JT (1985) Survival and detection of Bacteroides 17
spp., prospective indicator bacteria. Appl Environ Microbiol 49: 148-150. 18
Franks AH, Harmsen HJ, Raangs GC, Jansen GJ, Schut F & Welling GW (1998) Variations 19
of bacterial populations in human feces measured by fluorescent in situ hybridization with 20
group-specific 16S rRNA-targeted oligonucleotide probes. Appl Environ Microbiol 64: 3336-21
3345. 22
Furet JP, Quenee P & Tailliez P (2004) Molecular quantification of lactic acid bacteria in 23
fermented milk products using real-time quantitative PCR. Int J Food Microbiol 2: 197-207. 24
Godfree A & Farell J (2005) Processes for managing pathogens. J Environ Qual 34: 105-113. 25
Godon JJ, Zumstein E, Dabert P, Habouzit F & Moletta R (1997) Molecular microbial 26
diversity of an anaerobic digestor as determined by small-subunit rDNA sequence analysis. 27
Appl Environ Microbiol 63: 2802-2813. 28
Gordon DM & Cowling A (2003) The distribution and genetic structure of Escherichia coli in 29
Australian vertebrates: host and geographic effects. Microbiology 149: 3575-3586. 30
Gourmelon M, Caprais MP, Ségura R, Le Mennec C, Lozach S, Piriou JP & Rincé A (2007) 31
Evaluation of two library-independent microbial source tracking methods to identify sources 32
of fecal contamination in French estuaries. Appl Environ Microbiol 73: 4857-4866. 33
19
Hancock D, Besser T, Lejeunes J, Davis M & Rice D (2001) The control of VTEC in the 1
animal reservoir. Int J Food Microbiol 66: 71-78. 2
Harmsen HJ, Raangs GC, He T, Degener JE & Welling GW (2002) Extensive set of 16S 3
rRNA-based probes for detection of bacteria in human feces. Appl Environ Microbiol 6: 4
2982-2990. 5
Holland PM, Abramson RD, Watson R & Gelfand DH. (1991) Detection of specific 6
polymerase chain reaction product by utilizing the 5'----3' exonuclease activity of Thermus 7
aquaticus DNA polymerase. Proc Natl Acad Sci U S A. 15: 7276-80. 8
Hörman A, Rimhanen-Finne R, Maunula L, von Bonsdorff CH, Torvela H, Heikinheimo A & 9
Hänninen ML (2004) Campylobacter spp., Giardia spp., Cryptosporidium spp., noroviruses, 10
and indicator organisms in surface water in southwestern Finland, 2000-2001. Appl Environ 11
Microbiol 70: 87-95. 12
Huijsdens XW, Linkens RK, Mak M, Neuwissen SG, Vanderbroucke-Grauls CM & 13
Savelkoul PH. (2002) Quantification of bacteria adherent to gastrointestinal Mucosa by real-14
time PCR. J Clin Micobiol 40:4423-4427. 15
Koopmans M & Duizer E (2004) Foodborne viruses: an emerging problem. Int J Food 16
Microbiol 90: 23-41. 17
Kreader CA (1998) Persistence of PCR-detectable Bacteroides distasonis from human feces 18
in river water. Appl Environ Microbiol 64: 4103-4105. 19
Lan PTN, Hayashi H, Sakamoto M & Benno Y (2002) Phylogenetic analysis of cecal 20
microbiota in chicken by the use of 16S rDNA clone libraries. Microbiol Immunol 46: 371-21
382. 22
Lay C, Sutren M, Rochet V, Saunier K, Dore J & Rigottier-Gois L (2005a) Design and 23
validation of 16S rRNA probes to enumerate members of the Clostridium leptum subgroup in 24
human faecal microbiota. Environ Microbiol 7: 933-946. 25
Lay C, Rigottier-Gois L, Holmstrom K, Rajilic M, Vaughan EE, de Vos WM, Collins MD, 26
Thiel R, Namsolleck P, Blaut M & Dore J (2005b) Colonic microbiota signatures across five 27
northern European countries. Appl Environ Microbiol 7: 4153-4155. 28
Leser TD, Amenuvor JZ, Jensen TK, Lindecrona RH, Boye M & Moller K (2002) Culture-29
independent analysis of gut bacteria: the pig gastrointestinal tract microbiota revisited. Appl 30
Environ Microbiol 68: 673-690. 31
Lyons SR, Griffen AL & Leys EJ (2000) Quantitative real-time PCR for Porphyromonas 32
gingivalis and total bacteria. J Clin Microbiol 6: 2362-2365. 33

20
Maidak BL, Cole JR, Lilburn TG, Parker CT Jr, Saxman PR, Farris RJ, Garrity GM, Olsen 1
GJ, Schmidt TM & Tiedje JM (2001) The RDP-II (Ribosomal Database Project). Nucleic 2
Acids Res 1: 173-174. 3
Manz W, Amann R, Ludwig W, Vancanneyt M & Schleifer KH. (1996) Application of a suite 4
of 16S rRNA-specific oligonucleotide probes designed to investigate bacteria of the phylum 5
Cytophaga-Flavobacter-Bacteroides in the natural environment. Microbiology 142: 1097-6
106. 7
Manichanh C, Rigottier-Gois L, Bonnaud E, Gloux K, Pelletier E, Frangeul L, Nalin R, Jarrin 8
C, Chardon P, Marteau P, Roca J & Dore J (2006) Reduced diversity of fecal microbiota in 9
Crohn’s disease revealed by a métagenomic approach. Gut 55: 2005-2011. 10
Martinez-Urtaza J, Saco M, de Novoa J, Perez-Pineiro P, Peiteado J, Lozano-Leon A & 11
Garcia-Martin O (2004) Influence of environmental factors and human activity on the 12
presence of salmonella serovars in a marine environment. Appl Environ Microbiol 70: 2089-13
2097. 14
Matsuki T, Watanabe K, Fujimoto J, Kado Y, Takada T, Matsumoto K & Tanaka R (2004) 15
Quantitative PCR with 16S rRNA-gene-targeted species-specific primers for analysis of 16
human intestinal bifidobacteria. Appl Environ Microbiol 70: 167-173. 17
Moulin-Schouleur M, Schouler C, Tailliez P, Kao MR, Bree A, Germon P, Oswald E, Mainil 18
J, Blanco M & Blanco J (2006) Common Virulence Factors and Genetic Relationships 19
between O18:K1:H7 Escherichia coli Isolates of Human and Avian Origin. J Clin Microbiol 20
10: 3484–3492. 21
Ozutsumi Y, Hayashi H, Sakamoto M, Itabashi H & Benno Y (2005) Culture-independent 22
analysis of fecal microbiota in cattle. Biosci Biotechnol Biochem 9: 1793-1797. 23
Pommepuy M, Butin M, Derrien A, Gourmelon M, Colwell RR & Cormier M (1996) 24
Retention of enteropathogenicity by viable but nonculturable Escherichia coli exposed to 25
seawater and sunlight. Appl Environ Microbiol 62: 4621-4626. 26
Potasman I, Paz A & Odeh M (2002) Infectious outbreaks associated with bivalve shellfish 27
consumption: a worldwide perspective. Clin Infect Dis 35: 921-928. 28
Reischer GH, Kasper DC, Steinborn R, Mach RL & Farnleitner AH (2006) Quantitative PCR 29
method for sensitive detection of ruminant fecal pollution in freshwater and evaluation of this 30
method in Alpine karstic regions. Appl Environ Microbiol 72: 5610-5614. 31

21
Rinttilä T, Kassinen A, Malinen E, Krogius L & Palva A (2004) Development of an extensive 1
set of 16S rDNA-targeted primers for quantification of pathogenic and indigenous bacteria in 2
faecal samples by real-time PCR. J. Appl Microbiol 97: 1166-1177. 3
Roszak DB & Colwell RR (1987) Metabolic activity of bacterial cells enumerated by direct 4
viable count. Appl Environ Microbiol 53: 2889-2893. 5
Savichtcheva O & Okabe S (2006) Alternative indicators of fecal pollution: Relations with 6
pathogens and conventional indicators, current methodologies for direct pathogen monitoring 7
and future application perspectives. Wat Res 40: 2463-2476. 8
Seurinck S, Defoirdt T, Verstraete W, & Siciliano SD (2005) Detection and quantification of 9
the human-specific HF183 Bacteroides 16S rRNA genetic marker with real-time PCR for 10
assessment of human faecal pollution in freshwater. Environ Microbiol 7: 249-259. 11
Shanks OC, Nietch C, Simonich M, Younger M, Reynolds D & Field KG (2006) Basin-wide 12
analysis of the dynamics of fecal contamination and fecal source identification in Tillamook 13
Bay, Oregon. Appl Environ Microbiol 72: 5537-5546. 14
SIMCA-P9.0. 2001. A new standard in multivariate data analysis. In User's guide and tutorial. 15
Umetrics, Umeå, Sweden. p. 122. 16
Sokol H, Seksik P, Rigottier-Gois L, Lay C, Lepage P, Podglajen I, Marteau P & Dore J 17
(2006) Specificities of the fecal microbiota in inflammatory Bowel Disease. Inflamm Bowel 18
Dis 12: 106-111. 19
Stahl DA, Flesher B, Mansfield HR & Montgomery L (1988) Use of phylogenetically based 20
hybridization probes for studies of ruminal microbial ecology. Appl Environ Microbiol 5: 21
1079-1084. 22
Suau A, Bonnet R, Sutren M, Godon JJ, Gibson GR, Collins MD & Dore J (1999) Direct 23
analysis of genes encoding 16S rRNA from complex communities reveals many novel 24
molecular species within the human gut. Appl Environ Microbiol 65: 4799–4807. 25
Suzuki MT, Taylor LT & DeLong EF (2000) Quantitative analysis of small-subunit rRNA 26
genes in mixed microbial populations via 5'-nuclease assays. Appl Environ Microbiol 11: 27
4605-14. 28
Tajima K, Aminov RI, Nagamine T, Matsui H, Nakamura M & Benno Y (2001) Diet-29
dependent shifts in the bacterial population of the rumen revealed with real-time PCR. Appl 30
Environ Microbiol 6: 2766-2774. 31

22
Thompson JD, Higgins DG & Gibson TJ (1994) CLUSTAL W: improving the sensitivity of 1
progressive multiple sequence alignment through sequence weighting, position-specific gap 2
penalties and weight matrix choice. Nucleic Acids Res 22: 4673-80. 3
Wheeler AE, Burke J & Spain A (2003) Fecal indicator bacteria are abundant in wet and at 4
freshwater beaches. Water Res 37: 3978-3982. 5
Whitford MF, Foster RJ, Beard CE, Gong J & Teather RM (1998) Phylogenetic analysis of 6
rumen bacteria by comparative sequence analysis of cloned 16S rRNA genes. Anaerobe 4: 7
153-163. 8

23
Table 1: Group and species-specific 16S rRNA-targeted primers and probes used in this 1 study. Probe sequences are in bold. 2 3
Target organism Primer
and probe Sequence 5’- 3’ Source of reference
All-bacteria (*) F_Bact 1369 CGG TGA ATA CGT TCC CGG
R_Prok1492 TAC GGC TAC CTT GTT ACG ACT T
P_TM1389F 6FAM-CTT GTA CAC ACC GCC CGT C
(Suzuki et al., 2000)
C. leptum F_Clept 09 CCT TCC GTG CCG SAG TTA
R_Clept 08 GAA TTA AAC CAC ATA CTC CAC TGC TT
P-Clep 01 6FAM-CAC AAT AAG TAA TCC ACC
This study
Bifidobacterium F_Bifid 09c CGG GTG AGT AAT GCG TGA CC
R_Bifid 06 TGA TAG GAC GCG ACC CCA
P_Bifid 6FAM-CTC CTG GAA ACG GGT G
This study
C. coccoides F_Ccoc 07 GAC GCC GCG TGA AGG A
R_Ccoc 14 AGC CCC AGC CTT TCA CAT C This study
P_Erec482(*) VIC-CGG TAC CTG ACT AAG AAG (Franks et al., 1998)
Bacteroides/ F_Bacter 11 CCT WCG ATG GAT AGG GGT T
Prevotella R_Bacter 08 CAC GCT ACT TGG CTG GTT CAG This study
P_Bac303(*) VIC-AAG GTC CCC CAC ATT G (Manz et al., 1996)
E. coli E.coli F CAT GCC GCG TGT ATG AAG AA
E.coli R CGG GTA ACG TCA ATG AGC AAA (Huijsdens et al., 2002)
Lactobacillus/ F_Lacto 05 AGC AGT AGG GAA TCT TCC A
Leuconostoc/ Pediococcus
R_Lacto 04 CGC CAC TGG TGT TCY TCC ATA TA This study
S. salivarius Stherm 03 TTA TTT GAA AGG GGC AAT TGC T
Stherm 08 GTG AAC TTT CCA CTC TCA CAC (Furet et al., 2004)
Enterococcus F_Entero CCC TTA TTG TTA GTT GCC ATC ATT
R_Entero ACT CGT TGT ACT TCC CAT TGT (Rinttilä et al., 2004)
4 (*) modified from reference 5 6 7

24
Table 2: Bacterial target species for group or species specific primers 1 2
PCR systems Target species* C. leptum group Clostridium leptum$(1), C. methylpentosum(2), C. sporosphaeroides (2), Faecalibacterium
prausnitzii $(1). Ruminococcus albus$(0), R. callidus(0), R. flavefaciens(0), R. bromii(1). Others: see TableS1
C. coccoides group
Clostridium coccoides$(0), C. aerotolerans(3), C. indolis(4), C. algidixylanolyticum(4), C. aminophilum (2), C. aminovalericum(5), C. amygdalium (4), C. bolteae(5), C. celerecrescens(4), C. clostridioforme(2), C. hathewayi(3), C. herbivorans(2), C. hylemonae(2),C. jejuense(2), C. lentocellum(5), C. nexile(2), C. oroticum(7), C. populeti(2), C. proteoclasticum(2), C. scindens(2), C. saccharolyticum(4), C. sphenoides(4), C. symbiosum(2), C. xylanolyticum(4), C. xylanovorans(2). Eubacterium rectale$(2), E. hallii(3), E. ruminantium(2), E. cellulosolvens(3), E. contortum(3), E. eligens(4), E. ramulus(4), E. xylanophilum(3). Ruminococcus. gnavus$(2), R. hansenii$(0), R. luti(0), R. obeum(2), R. hydrogenotrophicus(3), R. lactaris(2), R. schinkii(2), R. torques(3). Others: see TableS1
Bacteroides/ Prevotella group
Bacteroides fragilis$(0), B. vulgatus$(1), B. uniformis$(2), B. eggerthii$(2), B. ovatus$(1), B. thetaiotaomicron$(0), B. caccae$(1), B. acidifaciens(2), B. stercoris(0), B. plebeius(0), B. splanchnicus(5), B. salyersiae(0), B. nordii(0), B. plebeius(0), B. coprocola(0), B. massiliensis(1), B. intestinalis(2), B. finegoldii(0), B. dorei(2), Parabacteroides distasomis(1). Prevotella albensis$(4), P. bivia(5), P. Bryantii(4), P. buccalis(5), P. denticola(5), P. disiens(5), P. enoeca(5), P. heparinolytica(0), P. intermedia(4), P. melaninogenica(5), P. multiformis(4), P. nigrescens(5), P. oris(6), P. oulorum(5), P. pallens(5), P. salivae(5), P. tannerae(1), P. veroralis(5), P. zoogleoformans(0).
Bifidobacterium genus
Bifidobacterium adolescentis$(0), B. longum XX bv infantis$(0), B. animalis(0), B. breve$(1), B. choerinum(0), B. gallicum(0), B. thermacidophilum(0), B. boum(0), B. merycicum(0), B. ruminantium(0), B. angulatum(0), B. pseudocatenulatum(0), B. dentium(0), B. gallinarum(0), B. saeculare(0), B. pullorum(0), B. longum(0), B. pseudolongum(0), B. indicum(1), B. bifidum(1), B. catenulatum(2), B. asteroides(1), B. coryneforme(0), B. cuniculi (1), B. minimum(0), B. scardovii(0), B. psychraerophilum(2), B. subtile(0). Others: see TableS1
Lactobacillus/ Leuconostoc/ Pediococcus group
Lactobacillus acidophilus$(0), L. casei$(0), L.paracasei$(0), L. delbrueckii$(0), L. fermentum$(0), L. helveticus$(0), L. johnsonii$(0), L. plantarum$(0), L. rhamnosus$(0), L. crispatus$(0), L. salivarius$(0), L. gasseri$(0), L. mucosae$(0), L. acetotolerans(0), L. acidifarinae(0), L. acidipiscis(0), L. agilis(0), L. alimentarius(0), L. amylophilus(0), L. amylovorus(0), L. antri(0), L. aviarius(0), L. bifermentans(0), L. brevis(0), L. buchneri(0), L. coleohominis(0), L. collinoides(0), L. concavus(0), L. coryniformis(0), L. curvatus(0), L. durianis(0), L. equi(0), L. farciminis(0), L. fornicalis(0), L. fructivorans(0), L. frumenti(0), L. fuchuensis(0), L. gallinarum(2), L. gastricus(0), L. graminis(0), L. hammesii(0), L. harbinensis(0), L. hilgardii(0), L. homohiochii(1), L. ingluviei(0), L. intestinalis(0), L. jensenii(0), L. kalixensis(0), L. keferi(0), L. kefiranofaciens(0), L. kimchii(0), L. kitasatonis(0), L. kunkeei(0), L. lindneri(2), L. malefermentans(0), L. mali(0), L. manihotivorans(0), L. mindensis(0), L. murinus(0), L. pontis(0) L. oligofermentans(0), L. oris(0), L. panis(0), L. pantheris(0), L. parabrevis(0), L. parabuchneri(0), L. paracollinoides(0), L. parakefiri(0), L. paralimentarius(0), L. paraplantarum(0), L. pentosus(0), L. perolens(0), , L. rennini(0), L. reuteri(0), L. pseudomesenteroides(0), L. rossii(0), L. ruminis(0), L. sakei(0),L. saerimneri(0), L. salivarius(0), L. sanfranciscensis(2), L. vini(0), L. satsumensis(0), L. sharpeae(0), L. siligionis(0), L. sobrius(0), L. spicheri(0), L. suebicus(0), L. vaccinostercus(0), L. vaginalis(1), L. versmoldensis(0), L. zeae(0).

25
Leuconostoc mesenteroides$(0), Ln pseudomesenteroides$(1), Ln durionis(1), Ln fructosum(1), Ln ficulneum(1), Ln gelidum(1), Ln gasicomitatum(1), Ln inhae(1), Ln gelidum(1), L. kimchii(1), Ln lactis(0), Ln pseudoficulneum(1), L. fallax(1). Pediococcus inopinatus(0), P. parvulus(0), P. celliocola(0), P. acidilactici(0), P. pentosaceus(0), P. claussenii(0), P. stilesii(0), P. dextrinicus(0).
*: Target species were obtained by using Probe Match program (Ribosomal Database 1
Project II) (Maidak et al., 2001) by checking each probe and primers with the following 2
data set options: Strain: type, Source: isolates, Size: ≥ 1200 and < 1200 nt, Quality: good. 3
Homology of the TaqMan probe was absolute as previously described (Holland et al., 4
1991). OligoCheck v1 (http://www.cf.ac.uk/biosi/research/biosoft) was used to assist in 5
primer design and to confirm the specificity of primers and probes. The maximum 6
mismatch number determined by Oligocheck for the Type-strain sequences is shown in 7
brackets. The positions of mismatches are showed in the supplementary file (Table S1). 8
$ : Species tested as control in real-time qPCR (cf. Table 3). 9
10

26
Table 3. Specificity of oligonucleotide primers and probes in real-time PCR assessed using pure bacterial culture DNA. 1 a + : positive, -: negative. * Abbreviations ATCC, DSM, VPI and NCTC referred to the strain names in commercial collections. 2 UEPSD and CNRZ corresponded to two INRA collections in Jouy-en-Josas. 3 4
PCR results with each primer set a
Strain Origin* Bacteria C.
leptum C.
coccoides Bacteroides/ Prevotella
Bifido- bacterium
E. coli
S. salivarius
Lactobacillus/ Leuconostoc/Pediococcus
Entero- coccus
Clostridium leptum ATCC 29065 + + - - - - - - - Faecalibacterium prausnitzii UEPSD L43 + + - - - - - - - Ruminococus albus UEPSD M30 + + - - - - - - - Clostridium coccoides ATCC 29236 + - + - - - - - - Ruminococus gnavus ATCC 29149 + - + - - - - - - Ruminococus hansenii DSM 20583T + - + - - - - - - Eubacterium rectale UEPSD A4 + - + - - - - - - Bacteroides fragilis ATCC43185 + - - + - - - - - Bacteroides ovatus ATCC 8483 + - - + - - - - - Bacteroides thetaiotaomicron ATCC 29148 + - - + - - - - - Bacteroides uniformis ATCC 8492 + - - + - - - - - Bacteroides vulgatus ATCC 8482 + - - + - - - - - Bacteroides caccae ATCC 43185 + - - + - - - - - Bacteroides eggerthii UEPSD L78 + - - + - - - - - Prevotella oralis DSM 20702T + - - + - - - - - Prevotella buccae DSM 20615 + - - + - - - - - Prevotella albensis DSM 11730T + - - + - - - - - Bifidobacterium adolescentis ATCC15703 + - - - + - - - - Bifidobacterium breve ATCC15700 + - - - + - - - - Biffidobacterium infantis ATCC 15697 + - - - + - - - - Escherichia coli UEPSD S123 + - - - - + - - -

27
Streptococcus salivarius DSM 20067 + - - - - - + - - Streptococcus thermophilus DSM 20259 + - - - - - + - - Streptococcus vestibularis DSM 5636T + - - - - - + - - Lactobacillus acidophilus UEPSD R52 + - - - - - - + - Lactobacillus casei CNRZ + - - - - - - + - Lactobacillus paracasei CNRZ + - - - - - - + - Lactobacillus delbrueckii CNRZ + - - - - - - + - Lactobacillus fermentum CNRZ + - - - - - - + - Lactobacillus johnsonii CNRZ + - - - - - - + - Lactobacillus plantarum CNRZ + - - - - - - + - Lactobacillus rhamnosus UEPSD R11 + - - - - - - + - Lactobacillus helveticus CNRZ + - - - - - - + - Lactobacillus crispatus DSM 20584 T + - - - - - - + - Lactobacillus salivarius DSM 20555 T + - - - - - - + - Lactobacillus gasseri DSM 20243 T + - - - - - - + - Lactobacillus mucosae DSM 13345 T + - - - - - - + - Leuconostoc mesenteroides CNRZ + - - - - - - + - Ln pseudomesenteroides CNRZ + - - - - - - + - Enterococcus faecium UEPSD L99 + - - - - - - - + Enterococcus faecalis UEPSD L98 + - - - - - - - + Clostridium perfringens ATCC 13124 + - - - - - - - - Clostridium sordelii VPI 9048 + - - - - - - - - Atopobium parvulum UEPSD B69 + - - - - - - - - Atopobium vaginae DSM 15829 T + - - - - - - - - Atopobium rimae DSM 7090 T + - - - - - - - - Clostridium bifermentans NCTC 506 + - - - - - - - - Streptococcus gordonii DSM 6777 T + - - - - - - - -
1 2

28
Table 4: Composition of human faecal microbiota compared to farm animal microbiota. 1 n represents the numbers of studied samples. 2 (a) All-bacteria results obtained by qPCR were expressed as the mean of the log10 value ± SEM. 3 (b) Results were expressed as the mean of the log10 value ± SEM of normalized data, calculated as the log no. of targeted bacteria minus the log 4 of All-bacteria number. 5 The reference for the statistics is with human faecal samples. The non parametric Wilcoxon test was performed if the One-way ANOVA for the 6 bacterial group was significant. 7 Data not sharing the same letter within a column are significantly different to the human population, at P<0.05. 8 9 10
TaqMan detection SYBR-Green detection
n
Al l-bacteria (a)
C. leptum group (b)
C. coccoides group (b)
Bacteroides/ Prevotella group (b)
Bifidobacterium genus (b)
Lactobacillus/ Leuconostoc/ Pediococcus group (b)
E. coli (b)
S. salivarius species (b)
Enteroccocus genus (b)
Human 21 11.5 ± 0.1 -0.7 ± 0.05 (A) -1.3 ± 0.08 (A) -1.5 ± 0.06 (A) -2.4 ± 0.33 (A) -3.9 ± 0.13 (A) -3.8 ± 0.34 (A) -3.1 ± 0.12 (A) -5.0 ± 0.15
Horse 5 11.5 ± 0.1 -1.5 ± 0.06 (B) -2.2 ± 0.18 (B) -2.3 ± 0.04 (B) -4.8 ± 0.13 (B) -2.4 ± 0.82 (A) -5.0 ± 0.03 (B) -5.2 ± 0.20 (B) Not detected
Cow 5 11.4 ± 0.1 -1.0 ± 0.03 (B) -2.6 ± 0.03 (B) -2.3 ± 0.01 (B) -3.6 ± 0.37 (B) -3.1 ± 0.06 (A) -5.0 ± 0.31 (B) -5.0 ± 0.04 (B) Not detected
Goat 5 12.0 ± 0.1 -1.0 ± 0.07 (B) -2.2 ± 0.11 (B) -2.4 ± 0.19 (B) -1.8 ± 0.26 (A) -3.2 ± 0.78 (A) -4.5 ± 0.48 (A) -4.3 ± 0.43 (B) Not detected
Rabbit 5 11.7 ± 0.1 -0.7 ± 0.03 (A) -1.9 ± 0.03 (B) -1.2 ± 0.09 (A) -1.6 ± 0.07 (A) -5.1 ± 0.59 (A) Not detected Not detected Not detected
Sheep 5 11.9 ± 0.1 -1.0 ± 0.05 (B) -2.7 ± 0.08 (B) -2.4 ± 0.08 (B) -4.2 ± 0.11 (B) -5.3 ± 0.60 (A) -4.1 ± 0.52 (A) Not detected Not detected
Pig 5 11.9 ± 0.1 -1.2 ± 0.11 (B) -1.7 ± 0.35 (A) -1.9 ± 0.17 (A) -3.4 ± 0.69 (B) -1.2 ± 0.54 (B) -2.7 ± 0.06 (B) Not detected Not detected
11 12

29
Figure legend. 1
2
Figure 1. PLS discrimination between microbiota of human and farm animals. 3
A. Relationship between faecal microbiota (variables X) and human or farm animals 4
(variables Y) using PLS regression. The cross-validation led to two components represented 5
here as t(1) and t(2). The corresponding PLS model explains 80.0 % of the variation of the Y-6
matrix. The 95 % probability region defined by the model is delimited by the ellipse. The 7
human ( ) group (n=21) can be distinguished and is delimited by the black square. : cow 8
(n=5); : horse (n=5); : pig (n=5); : rabbit (n=5); : sheep (n=5); goat (n=5). 9
B. The window shows the X-loadings (w*) of the X variables (faecal microbiota 10
quantifications) and the Y-loadings (c) of the Y variables (human and animal groups), and 11
thereby shows the correlation between X and Y. The X (black triangles) and Y (black circles) 12
variables combine in the projections, and the X variables relate to the Y variables, as shown in 13
the figure. The C. coccoides group, S. salivarius species and Enterococcus genus, significant 14
for the discrimination of human and farm animals, and the 15
Lactobacillus/Leuconostoc/Pediococcus group, characterizing the pig microbiota, are denoted 16
by large black triangles (small black triangles represent less significant X variables).17

30
A 1
2
3 4 5 B 6
7 8
Figure 1. 9
-3
0 1 2 3
1 2 3 4 PLS component t[1] : R2Y = 0,79
-2 -1
-4 -3 -2 -1 0
Human Goat Pig Sheep Cow Horse Rabbit
w*c[1]
C. leptum
C. coccoides
Bacteroides/ Prevotella
Bifidobacterium
Lactobacillus/ Leuconostoc/ Pediococcus E. coli
S. salivarius Enterococcus
Horse
Cow Goat
Rabbit
Sheep
Pig
Human
-0.7
0.0 -0.1 -0.2 -0.3 -0.4 -0.5 -0.6
0.1 0.2 0.3 0.4 0.5 0.6
-0.5 -0.4 -0.3 -0.2 -0.1 0.0 0.1 0.2
PLS
com
pone
nt t[
2] :
R2Y
= 0
.09
w*c
[2]

Table S1: Sequence alignment of the species targeted by OligoCheck software showing sequence
differences. Only those nucleotides that are different from the target sequence for each organism are
shown.
(1). As indicated, there were two exceptions to the rule of absolute homology for the TaqMan probes
based on this silico assessment. The type strain P. oralis DSM20702T and the strain P. buccae
DSM20615 have one and two C/T mismatches, respectively, and are positive in PCR assays (Table 3).
PCR assays: positive: positive PCR, negative: negative PCR, nt: no tested
Clostridium leptum group
EMBL F_Clept09 primer P_Clept01 probe R_Clept08 primer Species
Access Number
5’ 3’ CCTTCCGTGCCGSAGTTA
5’ 3’ CACAATAAGTAATCCACC
5’ 3’ GAATTAAACCACATACTCCACTGCTT
PCR assay
Clostridium C. leptum C. methylpentosum C. sporosphaeroides F. prausnitzii Ruminococcus R. callidus R. flavefaciens R. albus R. bromii Eubacterium Eub. siraeum Other genera Ac. elongatum Anaerotruncus colihominis An. pentosovorans An. Agile
AJ305238 Y18181 M59116 AJ413954 L76596 L76603 L76598 L76600 L34625 AY487928 AJ315980 X97852 X98011
--C---------------
---T------G----- -N----------G----- -----A------------
------------------ ------------------ ------------------ ------------G-----
------------------
------------------ ------------------ -T---------------- -TC---------------
------------------ ------------------ ------------------ ------------------
------------------ ------------------ ------------------ ------------------
------------------
------------------ ------------------ ------------------ ------------------
-------------------------- -------------------------- -------------------------- --------------------------
-------------------------- -------------------------- -------------------------- --------------------------
--------------------------
-------------------------- -------------------------- -------------------------- --------------------------
positive nt nt positive nt nt positive nt nt nt nt nt nt
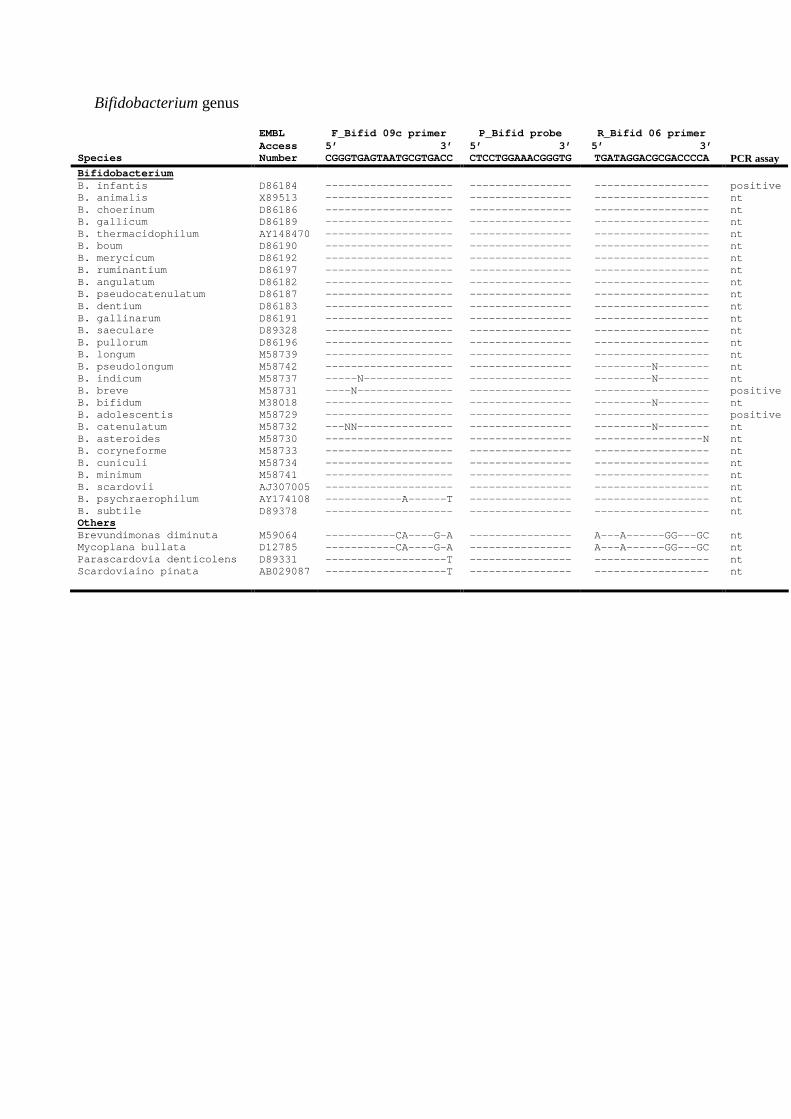
Bifidobacterium genus
EMBL F_Bifid 09c primer P_Bifid probe R_Bifid 06 primer Species
Access Number
5’ 3’ CGGGTGAGTAATGCGTGACC
5’ 3’ CTCCTGGAAACGGGTG
5’ 3’ TGATAGGACGCGACCCCA
PCR assay
Bifidobacterium B. infantis B. animalis B. choerinum B. gallicum B. thermacidophilum B. boum B. merycicum B. ruminantium B. angulatum B. pseudocatenulatum B. dentium B. gallinarum B. saeculare B. pullorum B. longum B. pseudolongum B. indicum B. breve B. bifidum B. adolescentis B. catenulatum B. asteroides B. coryneforme B. cuniculi B. minimum B. scardovii B. psychraerophilum B. subtile Others Brevundimonas diminuta Mycoplana bullata Parascardovia denticolens Scardoviaino pinata
D86184 X89513 D86186 D86189 AY148470 D86190 D86192 D86197 D86182 D86187 D86183 D86191 D89328 D86196 M58739 M58742 M58737 M58731 M38018 M58729 M58732 M58730 M58733 M58734 M58741 AJ307005 AY174108 D89378 M59064 D12785 D89331 AB029087
-------------------- -------------------- -------------------- -------------------- -------------------- -------------------- -------------------- -------------------- -------------------- -------------------- -------------------- -------------------- -------------------- -------------------- -------------------- -------------------- -----N-------------- ----N--------------- -------------------- -------------------- ---NN--------------- -------------------- -------------------- -------------------- -------------------- -------------------- ------------A------T --------------------
-----------CA----G-A -----------CA----G-A -------------------T -------------------T
---------------- ---------------- ---------------- ---------------- ---------------- ---------------- ---------------- ---------------- ---------------- ---------------- ---------------- ---------------- ---------------- ---------------- ---------------- ---------------- ---------------- ---------------- ---------------- ---------------- ---------------- ---------------- ---------------- ---------------- ---------------- ---------------- ---------------- ----------------
---------------- ---------------- ---------------- ----------------
------------------ ------------------ ------------------ ------------------ ------------------ ------------------ ------------------ ------------------ ------------------ ------------------ ------------------ ------------------ ------------------ ------------------ ------------------ ---------N-------- ---------N-------- ------------------ ---------N-------- ------------------ ---------N-------- -----------------N ------------------ ------------------ ------------------ ------------------ ------------------ ------------------
A---A------GG---GC A---A------GG---GC ------------------ ------------------
positive nt nt nt nt nt nt nt nt nt nt nt nt nt nt nt nt positive nt positive nt nt nt nt nt nt nt nt nt nt nt nt

Clostridium coccoides group
EMBL F_Ccocc07 primer P_Erec482 probe R_Ccocc14 primer Species
Access Number
5’ 3’ GACGCCGCGTGAAGGA
5’ 3’ CGGTACCTGACTAAGAAG
5’ 3’ AGCCCCAGCCTTTCACATC
PCR assay
Clostridium C. coccoides C. aerotolerans C. algidixylanolyticum C. aminophilum C. aminovalericum C. amygdalinum C. bolteae C. celerecrescens C. clostridioforme C. hathewayi C. herbivorans C. hylemonae C. indolis C. jejuense C. lentocellum C. nexile C. oroticum C. populeti C. proteoclasticum C. saccharolyticum C. scindens C. sphenoides C. symbiosum C. xylanolyticum C. xylanovorans Eubacterium E.hallii E.ruminantium E. cellulosolvens E. contortum E. eligens E. ramulus E. rectale E. xylanophilum Ruminococcus R.gnavus R.hansenii R.hydrogenotrophicus R.lactaris R.luti R.obeum R.schinkii R.torques Others Coprococcus catus Coprococcus eutactus Desulfotomaculum guttoideum Dorea formicigenerans Dorea longicatena Hespellia porcina Hespellia stercorisuis Lachnobacterium bovis Lachnospira pectinoschiza Pseudobutyrivibrio ruminis Roseburia cecicola Roseburia intestinalis Syntrophococcus sucromutans Acetitomaculum ruminis Anaerostipes caccae Catonella morbi
M59090 X76163 AF092549 L04165 X73436 AY353957 AJ508452 X71848 M59089 AJ311620 L34418 AB023973 Y18184 AY494606 X71851 X73443 M59109 X71853 U37378 Y18185 AF262238 X73449 M59112 X71855 AF116920 L34621 AB008552 X71860 L34615 L34420 L34623 L34627 L34628 L76597 M59114 X95624 L76602 AJ133124 L76601 X94965 D14137 AB038359 D14148 Y11568 L34619 AJ132842 AF445239 AF445264 AF298663 L14675 X95893 L14676 AJ312385 Y18191 M59083 AJ270487 X87151
---------------- ------------GT-- ------------CT-- ------------GC-- ------------GT-- ------------CT-- ------------GT-- ------------GT-- ------------GT-- ------------GT-- ------------GT-- ---------------- ------------GT-- ------------GT-- ---------------- ------------GC-- ---------------- ------------GT-- ------------GT-- ------------GT-- ---------------- ------------GT-- ------------GT-- ------------GT-- ------------GT-- A-----------GT-- ------------GT-- ------------GT-- ---------------- ------------GT-- ------------GC-- ------------GC-- ------------GT-- ------------GC-- ---------------- ---------------- ------------GC-- ---------------- ---------------- ---------------- ------------GC-- ---------------- G—C---------GT-- ------------GT-- ---------------- ---------------- ---------------- ---------------- ------------AC-- ------------GT-- ------------GC-- ------------GC-- ------------GC-- ------------GT-- A-T---------AG-- ------------GT-- ------------GT--
------------N----- ------------------ ------------------ ------------------ ------------------ ------------------ ------------------ ------------------ ------------------ ------------------ ------------------ ------------------ ------------------ ------------------ ------------------ ------------------ ------------------ ------------------ ------------------ ------------------ ------------------ ------------------ ------------------ ------------------ ------------------ ------------------ ------------------ ------------------ ------------------ ------------------ ------------------ ------------------ ------------------ ------------------ ------------------ ------------------ ------------------ ------------------ ------------------ ------------------ ------------------ ----------------- ------------------ ------------------ ------------------ ------------------ ------------------ ------------------ ------------------ ------------------ ------------------ ------------------ ------------------ ------------------ ------------------ ------------------ ------------------
--N---------------- --------G-------TC- ------G-G-------TC- ------G-G---------- ------G--NN-----AC- ------G-G-------TC- -----TG-GT------T-- ------G-G-------TC- ------G-G---------- ------G-G-------T-- --A---------C------ ------G-G---------- ------G-G-------TC- ------G-G---------- ------TAAA-------T- ------G-G---------- ---NNNNNNG--------- ------G-G---------- ------G-G---------- ------G-G-------TC- ------G-G---------- ------G-G-------TC- ------G-G---------- ------G-G-------TC- ------G-G---------- ------G------------ ------G--A--------- ------A-GT------T-- ------G-GT--------- ------N-AT------T-- ---N--G-G-------A-- ------G-G---------- ------GN-T--------- N-N---------------- ------------------- ------TA--------A-- ------G-G---------- ------------------- ------C---------A-- ------T---------A-- ------G-GT--------- ------G--NN-----T-- ------G--A------T-- ------G-G-------TC- -----AT---------T-- -----GG-CT--------- ------G-G---------- ------G-G---------- ------G-G---------- ------G-G---------- ------G-G---------- ------G-N---------- ------G-G---------- ------G-G---------- G-----N-GA--------- ------G-G-------T-- ------CTG---C---TCT
positive nt nt nt nt nt nt nt nt nt nt nt nt nt nt nt nt nt nt nt nt nt nt nt nt nt nt nt nt nt nt positive nt positive positive nt nt nt nt nt nt nt nt nt nt nt nt nt nt nt nt nt nt nt nt nt nt

Bacteroides / Prevotella group
EMBL F_Bacter 11 primer P_Bact303 probe R_Bacter 08 primer Species
Access Number
5’ 3’ CCTWCGATGGATAGGGGTT
5’ 3’ AAGGTCCCCCACATTG
5’ 3’ CACGCTACTTGGCTGGTTCAG
PCR assay
Bacteroides B. acidifaciens B. caccae B. coprocola B. dorei B. eggerthii B. finegoldii B. fragilis B. intestinalis B. massiliensis B. nordii B. ovatus B. plebeius B. salyersiae B. splanchnicus B. stercoris B. thetaiotaomicron B. uniformis B. vulgatus Parab. distasonis Prevotella Prevotella albensis P. bivia P. bryantii P. buccae (1) P. buccalis P. denticola P. disiens P. enoeca P. heparinolytica P. intermedia P. melaninogenica P. multiformis P. nigrescens P. oralis (1) P. oris P. oulorum P. pallens P. salivae P. tannerae P. veroralis P. zoogleoformans
AB021164 X83951 AB200224 AB242142 L16485 AB222699 X83935 AB214328 AY126616 AY608697 X83952 AB200217 AY608696 L16496 X83953 L16489 L16486 M58762 M86695 AJ011683 L16475 AJ006457 L16478 L16476 L16467 L16483 AJ005635 L16487 X73965 L16469 AB182483 L16471 L16480 L16474 L16472 Y13105 AB108826 AJ005634 L16473 L16488
A-A---------------- A------------------ ------------------- T-A---------------- T-A---------------- ------------------- ------------------- A-A---------------- T------------------ ------------------- A------------------ ------------------- ------------------- A-G-T---A-G-------- ------------------- ------------------- ---N--------N------ T------------------ --G----------------
--G-----CAG-------- G-A-----CAG-------- --G-----CAG-------- --------C-G-------- G-G-----CAG-------- G-G-----CAG-------- G-A-----CAG-------- G-A-----CAG-------- ------------------- G-------CAG-------- G-A-----CAG-------- G-------CAG-------- G-G-----CAG-------- G-A-----C-G-------- G-GN----CAG-------- G-A-----CAG-------- G-N-----CAG-------- G-A-----CAG-------- ----------G-------- G-G-----CAG-------- -------------------
---------------- ---------------- ---------------- ---------------- ---------------- ---------------- ---------------- ---------------- ---------------- ---------------- ---------------- ---------------- ---------------- ---------------- ---------------- ---------------- ---------------- ---------------- ----------------
---------------- ---------------- ---------------- ----C--------C-- ---------------- ---------------- ---------------- ---------------- ---------------- ---------------- ---------------- ---------------- ---------------- -------------C-- ---------------- ---------------- ---------------- ---------------- ---------------- ---------------- ----------------
--------------------- --------------------- --------------------- --------------------- --------------------- --------------------- --------------------- --------------------- --------------------- --------------------- --------------------- --------------------- --------------------- -----A--------------- --------------------- --------------------- -----N--------------- --------------------- -----A---------------
--------------------- --------------------- --------------------- --------------------- --------------------- --N------------------ --------------------- --------------------- --------------------- --------------------- --------------------- --------------------- --------------------- --------------------- --------------------- --------------------- --------------------- --------------------- --------------------- --------------------- ---------------------
positive positive nt nt positive nt positive nt nt nt positive nt nt nt nt positive positive positive nt positive nt nt positive nt nt nt nt nt nt nt nt nt positive nt nt nt nt nt nt nt

Lactobacillus / Leuconostoc / Pediococcus group
EMBL F_lacto05 primer R_LactoO4 Primer Species
Access number
5’ 3’ AGCAGTAGGGAATCTTCCA
5’ 3’ CGCCACTGGTGTTCYTCCATATA
PCR assay
Lactobacillus L. acetotolerans L. acidifarinae L. acidipiscis L. acidophilus L. agilis L. algidus L. alimentarius L. amylophilus L. amylovorus L. animalis L. antri L. aviarius L. bifermentans L. brevis L. buchneri L. casei L. coleohominis L. collinoides L. concavus L. coryniformis L. crispatus L. curvatus L. delbrueckii L. durianis L. equi L. farciminis L. fermentum L. fornicalis L. fructivorans L. frumenti L. fuchuensis L. gallinarum L. gasseri L. gastricus L. graminis L. hammesii L. harbinensis L. helveticus L. hilgardii L. homohiochii L. ingluviei L. intestinalis L. jensenii L. johnsonii L. kalixensis L. keferi L. kefiranofaciens L. kimchii L. kitasatonis L. kunkeei L. lindneri L. malefermentans L. mali L. manihotivorans L. mésenteroides L. mindensis L. mucosae L. murinus L. oligofermentans L. oris L. panis L. pantheris L. parabrevis L. parabuchneri L. paracasei L. paracollinoides L. parakefiri L. paralimentarius L. paraplantarum L. pentosus
M58801 AJ632158 AB023836 m58802 M58803 AB033209 M58804 M58806 m58805 M58807 AY253659 M58808 M58809 ab070611 M58811 D16548 AM113776 AB005893 AY683322 AJ575741 y17362 AJ270951 x52654 AJ315640 AB048833 M58817 af522394 Y18654 m58818 AJ250074 AB063479 AJ242968 m58820 AY253658 AM113778 AJ632219 AB196123 ay369116 M58821 AM113780 AF317702 aj306299 AF243176 aj002515 AY253657 AJ621553 AM113781 AF183558 AB107638 Y11374 X95421 AM113783 M58824 AF000162 m23035 AJ313530 AF126738 M58826 AY733084 X94229 X94230 AF413523 AM158249 AY026751 d79212 AJ786665 AY026750 AJ417500 AJ306297 D79211
------------------- ------------------- ------------------- ----N-------------- ------------------- ------------------- ------------------- ------------------- ------------------- ----------N-------N ------------------- ------------------- ------------------- ------------------- ------------------- ------------------- ------------------- ------------------- ------------------- ------------------- ------------------- ------------------- ------------------- ------------------- ------------------- ------------------- ------------------- ------------------- ------------------- ------------------- ------------------- -A----------------C ------------------- ------------------- ------------------- ------------------- ------------------- ------------------- ------------------- ------------------- ------------------- ------------------- ------------------- ------------------- ------------------- ------------------- ------------------- ------------------- ------------------- ------------------- ------------------- ------------------- ------------------- ------------------- T------------------ ------------------- ------------------- ------------------- ------------------- ------------------- ------------------- ------------------- ------------------- ------------------- ------------------- ------------------- ------------------- ------------------- ------------------- -------------------
----------------------- ----------------------- ----------------------- ----------------------- ----------------------- ---------------A------- ----------------------- ----------------------- ----------------------- ----------------------- ----------------------- ----------------------- ----------------------- ----------------------- ----------------------- ----------------------- ----------------------- ----------------------- ----------------------- ----------------------- ----------------------- ----------------------- ----------------------- ----------------------- ----------------------- ----------------------- ----------------------- ----------------------- ----------------------- ----------------------- ----------------------- ----------------------- ----------------------- ----------------------- ----------------------- ----------------------- ----------------------- ----------------------- ----------------------- ---------------A------- ----------------------- ----------------------- ----------------------- ----------------------- ----------------------- ----------------------- ----------A------------ ----------------------- ----------------------- ----------------------- --------------C-T------ ----------------------- ----------------------- ----------------------- ----------------------- ----------------------- ----------------------- ----------------------- ----------------------- ----------------------- ----------------------- ----------------------- ----------------------- ----------------------- ----------------------- ----------------------- ----------------------- ----------------------- ----------------------- -----------------------
nt nt nt positive nt nt nt nt nt nt nt nt nt nt nt positive nt nt nt nt positive nt positive nt nt nt positive nt nt nt nt nt positive nt nt nt nt positive nf nf nf nf nf positive nt nt nt nt nt nt nt nt nt nt nt nt positive nt nt nt nt nt nt nt positive nt nt nf nt nt

L. perolens L. plantarum L. pontis L. pseudomesenteoides L. rennini L. reuteri L. rhamnosus L. rossii L. ruminis L. saerimneri L. sakei L. salivarius L. sanfranciscensis L. satsumensis L. sharpeae L. siligionis L. sobrius L. spicheri L. suebicus L. vaccinostercus L. vaginalis L. versmoldensis L. vini L. zeae Leuconostoc Leuco mesenteroides Leuco pseudomesenteroides Pediococcus P.inopinatus P.parvulus P.cellicola P.acidilactici P.pentosaceus P.claussenii P.stilesii P.dextrinicus Enterococcus E.aquimarinus E.asini E.avium E.caccae E.canintestini E.casseliflavus E.cecorum E.devriesei E.dispar E.durans E.faecalis E.faecium E.gilvus E.hermanniensis E.hirae E.italicus E.malodoratus E.moraviensis E.mundtii E.pallens E.phoeniculicola E.pseudoavium E.raffinosus E.ratti E.silesiacus E.sulfureus E.termitis E.villorum Others Lactoccocus lactis Streptococcus thermophilus
Y19167 D79210 AJ422032 ab023237 AJ576007 l23507 m58815 AJ564009 m58828 AY255802 ay204897 af089108 X76327 AB154519 m58831 DQ168027 AY700063 AJ534844 AJ306403 AM113786 x61136 AJ496791 AJ576009 D86516 m23035 ab023237 AJ271383 D88528 AY956788 M58833 M58834 AJ621555 AJ973157 D87679 AJ877015 Y11621 AF133535 AY943820 AJ888906 Y18161 AF061009 AJ891167 AF061007 AJ420801 af515223 AJ276355 AY033814 AY396047 AJ276356 AJ582753 AF061012 AF286831 AF061013 AY033815 AY028437 AF061002 Y18296 AF326472 AM039966 X55133 AM039968 AF335596 M58836 x68418
------------------- ------------------- ------------------- ------------------- ------------------- ------------------- ------------------- ------------------- ------------------- ------------------- ------------------- ------------------- ------------------- ------------------- ------------------- ------------------- ------------------- ------------------- ------------------- ------------------- ------------------- ------------------- ------------------- ------------------- ------------------- T------------------ ------------------- ------------------- ------------------- ------------------- ------------------- ------------------- ------------------- ------------------- -----------------GG -----------------GG -----------------GC -----------------GC -----------------GC -----------------GC -----------------GC -----------------GC -----------------GC -----------------GC -----------------GC -----------------GC -----------------GC -----------------GC -----------------GC -----------------GC -----------------GC -----------------GC -----------------GC -----------------GC -----------------GC -----------------GC -----------------GC -----------------GC -----------------GC -----------------GC -----------------GC -----------------GC -----------------GC -----------------GC
----------------------- ----------------------- ----------------------- ----------------------- ----------------------- ----------------------- ----------------------- ----------------------- ----------------------- ----------------------- ----------------------- ----------------------- --------------C-T------ ----------------------- ----------------------- ----------------------- ----------------------- ----------------------- ----------------------- ----------------------- ---------------------N- ----------------------- ----------------------- ----------------------- ----------------------- ----------------------- ----------------------- ----------------------- ----------------------- ----------------------- ----------------------- ----------------------- ----------------------- ----------------------- ----------------------- ----------------------- ----------------------- ----------------------- ----------------------- ----------------------- ----------------------- ----------------------- ----------------------- ----------------------- ----------------C------ ----------------------- ----------------------- ----------------------- ----------------------- ----------------------- ----------------------- ----------------------- ----------------------- ----------------------- ----------------------- ----------------------- ----------------------- ----------------------- ----------------------- ----------------------- ----------------------- ----------------------- ------C-------C-------- ------C---------C------
nt positive nt nt nt nt positive nt nt nt nt positive nt nt nt nt nt nt nt nt nt nt nt nt positive positive nt nt nt nt nt nt nt nt nt nt nt nt nt nt nt nt nt nt negative negative nt nt nt nt nt nt nt nt nt nt nt nt nt nt nt nt nt negative