comparative carbon footprints of metallurgical … carbon footprints of metallurgical ... impact on...
TRANSCRIPT

Comparative Carbon Footprints of Metallurgical
Coke and Anthracite for Blast Furnace
and Electric Arc Furnace Use.
Archival Report
Prepared for Blaschak Coal Corp.
Schobert International LLC
Jordan, Minnesota
Harold Schobert, Chief Scientist
Nita Schobert, President
September 2015
Table of Contents
Executive summary ………………………………………………………………………… 1 Introductory discussion ……………………………………………………………………. 3
1. How this report is structured ………………………………..………………. 3
2. Approach ………………………………………………………………………….. 3
3. Introduction ………………………………………………………..…………….. 4
3.1. The concept of carbon footprint ………………………………….. 4 3.2. Selection of coals for this project …………………………………. 5 Part 1. The Blast Furnace Case ………………………………………………………….. 7
4. Coal mining ………………………………………………………………………. 7 4.1. Results: emissions and carbon footprint for mining ……….. 7 4.2. Discussion of results for mining …………………………………. 7
5. Coal preparation and washing ………………………………………………. 9
5.1. Results: emissions and carbon footprint for coal preparation 9
5.2. Discussion of results for coal preparation ..……………………. 9
6. Transportation …………………………………………………………………… 10
6.1. Results: emissions and carbon footprint for transportation 10
6.2. Discussion of results for coal transportation …………………. 11
7. Coke Production …………………………………………............................ 12 7.1. Introductory comments on metallurgical coke production … 12 7.2. Results: emissions and carbon footprint for coke production 13 7.3. Discussion of results for metallurgical coke production ……. 14 7.4. Ancillary Operations ………………………………………………… 16 7.5. Anthracite ……………………………………………………………… 16
8. Blast furnace operation ………………………………………….………….... 17 8.1. Introductory comments on blast furnaces …………………….. 17 8.2. Results: emissions and carbon footprint for furnace operation 17
8.3. Discussion of results for blast furnace operation ……………. 18
9. Carbon footprint determination ..…… ……………………………………… 24 9.1. Results: comparison of carbon footprints ……………………... 24 9.2. Discussion of comparative carbon footprints …………………. 25
10. Partial replacement of coke by anthracite ……………………………… 26 10.1. Brief review of use of anthracite in blast furnaces ………… 27
10.2. Mechanical properties of coke affecting use in blast furnaces 28 10.3. Comparative properties of anthracite ……………………….. 28 10.4. Comparative summary of anthracite and coke properties … 31 10.5. Estimation of coke replacement by anthracite ……………….. 33 10.6. Impact of partial replacement of coke on carbon footprint. 34 Part 2. The Electric Arc Furnace Case …………………………………………………… 36
11. Anthracite as carbon in electric arc furnaces …………………………….. 36 11.1. Introductory comments on electric arc furnaces …..……….… 36 11.2. Sources of furnace emissions ……………………………………… 37 11.3. Flux ………………………………………………………………………. 38 11.4. Carbon application in EAF operation ……………..……………… 39 11.5. Results for comparative carbon footprints in an EAF ………… 40
11.6. Discussion of comparative carbon footprints in an EAF …….. 42 Summary and recommendations ………………………………………………………….. 47
12. Summary …………………………………………………………………………... 47 13. Recommendations …………………………………………………………........ 47 Bibliography …………………………………………………………………………………….. 50 14. References cited in report ………………………………………………………. 50 15. Sources used for background information …………………………………. 57 Glossary ………………………………………………………………………………………….. 61 Appendix …………………………………………………………………………………………. 68 Definitions of symbols and abbreviations …………………………………………………. 75
1
Comparative Carbon Footprints of Metallurgical Coke
and Anthracite for Blast Furnace and Arc Furnace Use.
Archival Report
Prepared by Harold Schobert
Chief Scientist
Schobert International LLC
September 2015
Executive Summary
This project compared the carbon footprints of using traditional metallurgical coke
relative to using Pennsylvania produced anthracite in two applications in the iron and
steel industry: use as a fuel and reducing agent in blast furnaces, and use as an
injection carbon in electric arc furnaces. A carbon footprint is the annual total of all
greenhouse gases emitted to the atmosphere from a process. This project focused on
starting with mining coal, washing the coal at a site near the mine, transporting the coal
to an integrated steel mill that has captive coke oven batteries, producing coke (in the
case of bituminous coal), and using the coke or anthracite in a blast furnace to produce
hot metal, or in an arc furnace to produce liquid steel. Two hypothetical integrated steel
mills were considered, one with by-product recovery coke ovens in southwestern
Pennsylvania, and the other with heat-recovery coke ovens in northwestern Indiana.
In both cases, replacement of metallurgical coke with anthracite in blast furnace
applications would result in a significant reduction of carbon footprint. In the more
favorable case—the hypothetical steel mill using heat-recovery ovens—replacing
metallurgical coke with anthracite would reduce the carbon footprint by 652,000 tons
of carbon dioxide equivalent per year. This is roughly the same as the carbon footprints
of 13,600 households, or of 77,000 motor vehicles. This calculated reduction in carbon
dioxide emission is for one blast furnace, producing 4000 tons of hot metal per day, in
one steel mill; far greater reductions could be achieved by use of anthracite in more
furnaces and mills.
In electric arc furnace applications, anthracite also enjoys an advantage relative to
metallurgical coke, but the advantage is not so great. The difference comes from two
factors: the use of carbon per ton of steel produced in an electric arc furnace is much
smaller than the use of fuel per ton of hot metal in a blast furnace; and the overwhelming
impact on carbon footprint for electric arc furnaces is due to their huge electricity
consumption, some 300 kilowatt-hours per ton of steel.
In all cases, carbon dioxide is by far the largest contributor to the carbon footprint.
Contributions from methane and nitrous oxide proved to be very small compared to
carbon dioxide. No data were found for any of the other greenhouse gases. The major
advantage for anthracite in reducing carbon footprint comes from the fact that it does
not need to be passed through coke ovens before being used. An additional advantage
2
is that Pennsylvania anthracite is produced primarily in surface mines, which have
much less gas emission than do underground mines. (More than half of the production
of the bituminous metallurgical coals considered in this project is from underground
mines.) In the other segments—washing, transportation, and blast furnace use—the
differences between anthracite and metallurgical coke are small, sometimes favoring
one, and sometimes the other. For the segments other than coking, different
assumptions regarding coal provenance and properties, steel mill locations, or blast
furnace operating conditions might have reversed an apparent advantage for anthracite
or coke, in favor of the other fuel.
Bituminous coals and iron ore were presumed to come from sources currently producing
high tonnages of these materials. Coals were selected as ones known to produce good-
quality coke for blast furnace use. Whenever a range of values on composition,
properties, or conditions was available, the median value was usually selected. The
intent was to produce a base-case comparison using plausible coals, ores, fluxes, and
operating conditions. Later studies, if warranted, could tweak any of these values to see
how the carbon footprint would change in various “what if” scenarios.
This project did not examine the carbon footprints for mining ore or flux; for preparation
and transportation of ore and flux; or for any of the downstream operations involved in
converting hot metal from the blast furnace, or liquid steel from the arc furnace into
finished steel products.
3
Introductory Discussion
1. How This Report Is Structured
This report consists of four major sections: the main body, a bibliography, a glossary,
and an appendix.
The main body of the report presents the key findings, the assumptions used in arriving
at those findings, and relevant background information on coke, blast furnace
technology, and arc furnace technology to provide context. The main body is divided
into two parts, the first relating to the blast furnace case, and the second to the electric
arc furnace case. Each of these parts has sections or subsections for a presentation of
results, often in tabular form, followed by an explanation of how those results were
arrived at, including the assumptions that were made. Also, many of the sections
include some brief background discussion of the technology being covered in that
section, to provide context.
The bibliography contains, first, all of the sources used for specific pieces of information
cited in the main body; and, second, a supplemental list of resources that were used for
general background information. Terms that might not be familiar to all readers are
defined in a glossary; the first time these terms are used in the report they are identified
in bold font. Many of the major findings represent the last step of a sequence of
calculations; the results of intermediate steps are provided in tables in an appendix. A
separate appendix provides definitions or explanations of the symbols and abbreviations
used, with the exception of chemical formulas.
2. Approach
In conducting this work, the primary concerns were to arrive at findings that had not
been pre-judged in favor of anthracite or of bituminous coal, and that the cases
considered be realistic and plausible. To achieve that, the following tactics were used:
Wherever possible, actual operating data were used, provided by Blaschak Coal
Corp., or data that were obtained for specific, existing equipment and published
in the professional literature.
Other needed data were obtained from state or federal agency reports, from
papers or monographs in the professional literature, or from manufacturer’s
literature.
When the literature presented a range of numerical values, in almost all cases
the median value was selected, to minimize chances of inadvertently biasing the
results either high or low. The few cases in which a different choice was made are
identified in the text.
Further working assumptions included
The analysis would be done for the domestic U.S. industry only; i.e., the
possibility of using imported coke would not be considered.
4
The same ore would be fed to both coke and anthracite blast furnaces in each
case, and the same scrap to arc furnaces. The analysis also relied on values that
would be reasonable or typical cases for compositions of fuels, ores, fluxes, and
steel scrap; operating conditions of blast furnaces, coke ovens and arc furnaces;
and allowances for ancillary equipment.
The operating conditions for the coke and anthracite blast furnaces and electric
arc furnaces would be as similar as possible.
The quality of hot metal or liquid steel produced would be as identical as possible
in all cases.
Physical constants and conversion factors needed for the calculations were taken from
standard sources, such as the Handbook of Chemistry and Physics or the Handbook of
Engineering Fundamentals. Most numerical conversions from one system of units to
another were done using the on-line tool Digital Dutch Converter
(http://www.digitaldutch.com/unitconverter.htm).
3. Introduction
3.1. The concept of carbon footprint
The purpose of this project was to determine and compare carbon footprints for two
potential applications of anthracite in the steel industry. The first was smelting iron ore
using conventional blast furnace technology employing metallurgical coke, compared
with using anthracite as a complete or partial replacement for coke. The second was for
the use of anthracite instead of coke as a carbon addition in electric arc furnaces.
The Environmental Protection Agency defines the term carbon footprint as “The total
amount of greenhouse gases that are emitted into the atmosphere each year by a
person, family, building, organization or company. [It] includes greenhouse gas
emissions from fuel that an individual burns directly… It also includes greenhouse
gases that come from producing…goods or services…including emissions from power
plants that make electricity, factories that make products, and landfills where trash gets
sent” [EPA, 2013]. The same resource states that, “Greenhouse gases include carbon
dioxide, methane, nitrous oxide, ozone, chlorofluorocarbons, hydrochlorofluorocarbons,
hydrofluorocarbons, perfluorocarbons, [and] sulfur hexafluoride” [EPA, 2013].
All but the first three compounds on the EPA list were ignored completely. It is possible
that tiny emissions of some of these other compounds could occur. For example, ozone
can be generated in the sparks of electric motors, and chlorofluorocarbons were once
used in air conditioning equipment, emitted by occasional leaks. However, during the
literature search no useful data were found relative to emissions of these gases in the
various operations examined for this project.
The present project focused very heavily on carbon dioxide, because CO2 data would be
the most readily available or easily calculated, and because it was anticipated that CO2
emissions would dominate by far the total of greenhouse gases. This anticipation was
borne out by the limited amount of data that were found for greenhouse gases other
5
than CO2, as is mentioned in various sections later in this report. It was also borne out
by the fact that, when data were available for the three gases, CO2 invariably dominated.
All greenhouse gases other than carbon dioxide are characterized in terms of carbon
dioxide equivalent, or CO2-e. This parameter—called the global warming potential—
accounts for the fact that different greenhouse gases differ in their abilities to trap heat
radiated into the atmosphere. The CO2-e value for a given greenhouse gas is found by
multiplying the emissions of that gas by a factor that accounts for the heat-trapping
ability of that gas in comparison to carbon dioxide. For methane, the global warming
potential is 21, and for nitrous oxide, 310. The CO2-e value of CO2 itself is 1.
The definition of carbon footprint refers to total greenhouse gases emitted on a yearly
basis. To provide a convenient basis for an initial comparison, the carbon dioxide,
methane, and nitrous oxide emissions have been calculated on the basis of one ton of
hot metal produced in a blast furnace, or one ton of liquid steel from an arc furnace.
Then, in converting these emissions of individual greenhouse gases to carbon footprint,
CO2-e values were calculated and converted to an annual basis.
Based on these working assumptions, overall coal-to-hot metal process could be broken
down into several components, each of which will have characteristic greenhouse gas
emissions and carbon footprints. These components are:
Mining the coals used for coke production and mining the anthracite.
Preparation (i.e., washing) of the coals in mine-mouth preparation plants.
Transportation of washed coals to integrated steel mills.
For the bituminous coal cases, handling, size reduction, blending, and coking of
the coals in each type of coke oven battery.
Use of the coke or of anthracite in a blast furnace to produce hot metal.
Section 10 discusses the possibility of replacing only a portion of the coke in a blast
furnace with anthracite.
Similar to the blast furnace case, the scrap-to-liquid steel process would rely on a
comparable sequence of components, but with a different last step:
Use of the coke or of anthracite as an injection carbon in an electric arc furnace
to produce liquid steel.
3.2. Selection of coals for this project
The objective of this work was to compare carbon footprints for using anthracite or
metallurgical coke in two applications: as fuel in a blast furnace, and as injection carbon
in an electric arc furnace. The anthracite selected for this project was from the Lattimer
mine, for which useful data were provided by Blaschak Coal Corp. [Lowe, 2014a, 2014b;
Meyer, 2014]. Metallurgical coke is a product made from bituminous coal, or, nowadays,
from blends of bituminous coals.
Up to forty coals have been blended for use in a single coke oven battery. The base case
for this project presumed a blend of two coals, 70% high-volatile bituminous coal from
eastern Kentucky and 30% low-volatile bituminous coal from southern West Virginia.
6
This is similar to a coal blend that is known to have been used successfully at an
integrated steel plant in the U.S. [Munson et al., 1978], so it is established that quality
coke can be manufactured from such a blend.
The Kentucky coal selected was Lower Elkhorn, assumed to be mined and prepared in,
and shipped from, Pike County, Kentucky. This choice was based on two considerations:
Pike County has the highest coal production of any of the counties in the eastern
Kentucky coalfield [Kentucky, 2014], and the main body of the Lower Elkhorn deposit
is located in Pike County [Eble and Weisenfluh, 2012]. The low-volatile coal was selected
as Pocahontas No. 3 from McDowell County, West Virginia. Pocahontas No. 3 is one of
the best-studied coals in the U.S. McDowell County produces some 4.5 million tons of
coal per year [West Virginia, 2012], so represents a plausible source for the low-volatile
coal.
Assuming that these coals would be used in a 70:30 blend, a weighted-average
composition of the blend can be calculated from the compositions of the individual coals.
The results are given in the Appendix as Table A-1. The carbon content of coke varies
somewhat with the nature of the parent coals, and also varies with the ash value of the
coke. As explained later (Section 8.3.1), the expected ash values of the cokes in this
project are 12.4% for by-product recovery oven coke and 13.0% for heat-recovery oven
coke. Cokes with ≈12% ash are reported to contain 85% carbon (dry basis) [Chen et al.,
2009; Sun et al., 2012]. Correcting for the slightly higher ash values expected for cokes
in this project, this literature value is equivalent to 84.6% carbon for by-product
recovery oven coke, and to 84.0% carbon for heat-recovery oven coke.
7
Part 1. The Blast Furnace Case
4. Coal Mining
Two factors contribute to the carbon footprint of mining: emissions associated with the
mining operations, and gases in the coal that could be released as it is mined. The
former includes, for example, carbon dioxide emissions from diesel fuel used in trucks
or machinery or associated with generation of electricity using in mining. In the latter
case, both carbon dioxide and methane can be found in coal mines.
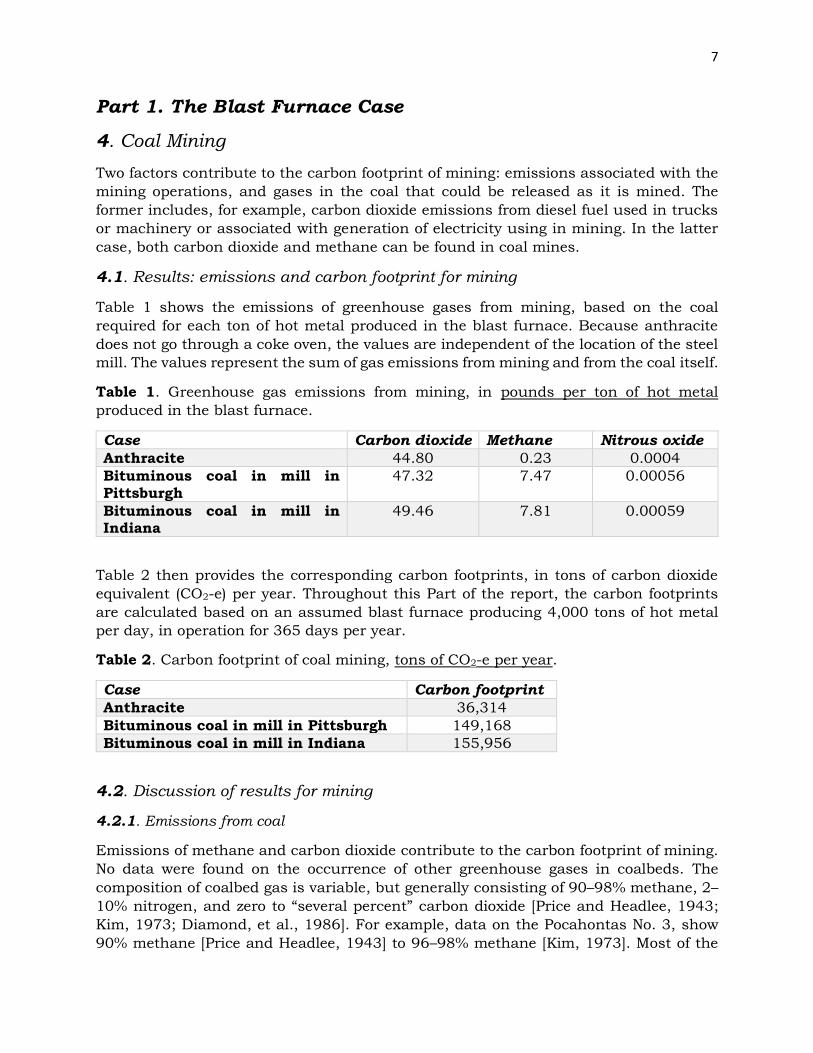
4.1. Results: emissions and carbon footprint for mining
Table 1 shows the emissions of greenhouse gases from mining, based on the coal
required for each ton of hot metal produced in the blast furnace. Because anthracite
does not go through a coke oven, the values are independent of the location of the steel
mill. The values represent the sum of gas emissions from mining and from the coal itself.
Table 1. Greenhouse gas emissions from mining, in pounds per ton of hot metal
produced in the blast furnace.
Case Carbon dioxide Methane Nitrous oxide
Anthracite 44.80 0.23 0.0004
Bituminous coal in mill in Pittsburgh
47.32 7.47 0.00056
Bituminous coal in mill in Indiana
49.46 7.81 0.00059
Table 2 then provides the corresponding carbon footprints, in tons of carbon dioxide
equivalent (CO2-e) per year. Throughout this Part of the report, the carbon footprints
are calculated based on an assumed blast furnace producing 4,000 tons of hot metal
per day, in operation for 365 days per year.
Table 2. Carbon footprint of coal mining, tons of CO2-e per year.
Case Carbon footprint
Anthracite 36,314
Bituminous coal in mill in Pittsburgh 149,168
Bituminous coal in mill in Indiana 155,956
4.2. Discussion of results for mining
4.2.1. Emissions from coal
Emissions of methane and carbon dioxide contribute to the carbon footprint of mining.
No data were found on the occurrence of other greenhouse gases in coalbeds. The
composition of coalbed gas is variable, but generally consisting of 90–98% methane, 2–
10% nitrogen, and zero to “several percent” carbon dioxide [Price and Headlee, 1943;
Kim, 1973; Diamond, et al., 1986]. For example, data on the Pocahontas No. 3, show
90% methane [Price and Headlee, 1943] to 96–98% methane [Kim, 1973]. Most of the
8
remainder is nitrogen, with small amounts of carbon dioxide. Data on gas emissions
from all the coals of interest in this study are shown in Table A-2 [Diamond, et al., 1986].
Based on this information, coalbed gas composition was taken to be 95% methane, 1%
carbon dioxide, and 4% nitrogen.
Pennsylvania anthracite is extracted primarily from surface mines, but bituminous
metallurgical coal is obtained from both surface and underground mines [e.g.
ArcelorMittal, 2015; Walter Energy, 2015]. This is an important distinction, because
underground coal mining releases much more gas than does surface mining, by roughly
a factor of 15 [Irving and Tailakov, 2003]. The median value for emission from surface
mining is 1.6 pounds of methane per ton of coal; for underground mining, 25 pounds of
methane per ton of coal. The surface mining value was used directly for anthracite. For
bituminous coal, a weighed value was calculated for Pike County, Kentucky and for
McDowell County, West Virginia, based on the production from surface and
underground mines in those counties [EIA, 2014c]. The results for each county were
then used to determine the weighted average methane emission, based on a 70:30 blend
of the two coals. The emission for the bituminous case is 14.7 pounds of methane per
ton of coal.
4.2.2. Emissions from mining operations.
Data on energy use in anthracite mining were provided by Blaschak Coal Corp. [Lowe,
2014b]. Information on gallons of diesel fuel per prepared ton of coal, and kilowatt-hours
per prepared ton collected over a 34-month period was used to calculate the geometric
means [Hazen, 1967] of these two parameters. For the Lattimer mine site, during the
period January 2012 to October 2014, geometric means were 5.3 gallons of diesel fuel
and 1.2 kilowatt-hours per ton of prepared coal.
Based on Energy Information Agency data [EIA 2014b], greenhouse gas emissions for
electricity generation would be 1.5 pounds of carbon dioxide per ton of prepared coal,
and negligible amounts of methane and nitrous oxide, 0.00001 pound and 0.00002
pound, respectively. For diesel fuel consumption, emissions would be 118 pounds of
CO2, 0.02 pounds of CH4, and 0.001 pounds of N2O per ton of prepared coal, using data
from Beckstrom [2008].
Data for surface mining of bituminous coal in West Virginia were taken from a twelve-
month (January to December 2011) study on production, consumption, and cost of
energy at one mine [Kecojevic et al., 2014]. This study included contributions from diesel
fuel, electricity, explosives, and gasoline. To have results that could be compared to the
anthracite case, we ignored the data for explosives and gasoline. Energy production from
explosives accounted for about 6% of the total, and gasoline only about 2% [Kecojevic
et al., 2014]. During the twelve-month study period, this mine produced 2.9 million tons
of coal, and shifted 42 million cubic yards of overburden, mostly sandstone [Kecojevic
et al., 2014]. The latter figure is equivalent to 93 million tons of overburden, based on
the median bulk density of West Virginia sandstones [Manger, 1963].
For this operation, annual consumption of diesel fuel and electricity [Kecojevic et al.,
2014] was equivalent to 899,000,000 Btu and 57,667 kilowatt-hours, respectively. On
a ton of coal basis, the energy consumption is 2.41 gallons of diesel fuel (from the
9
heating value per gallon of diesel fuel [Oak Ridge National Laboratory, 2011] and 19.9
kWh of electricity. While these data are for a bituminous coal surface mine in West
Virginia, the mines in eastern Kentucky are similar [Kecojevic, 2015], so the same data
were used for both.
5. Coal Preparation and Washing
A major objective of coal preparation is to reduce the amount of non-combustible, ash-
forming constituents in the as-mined coal. In most coals, much of the sulfur is contained
in the mineral pyrite, so coal preparation or washing also reduces sulfur content. Coal
preparation may also involve size reduction and, depending on the intended use of the
coal, possibly other operations, such as agglomeration of fine particles. Usually, coal
preparation plants are located close to the mine.
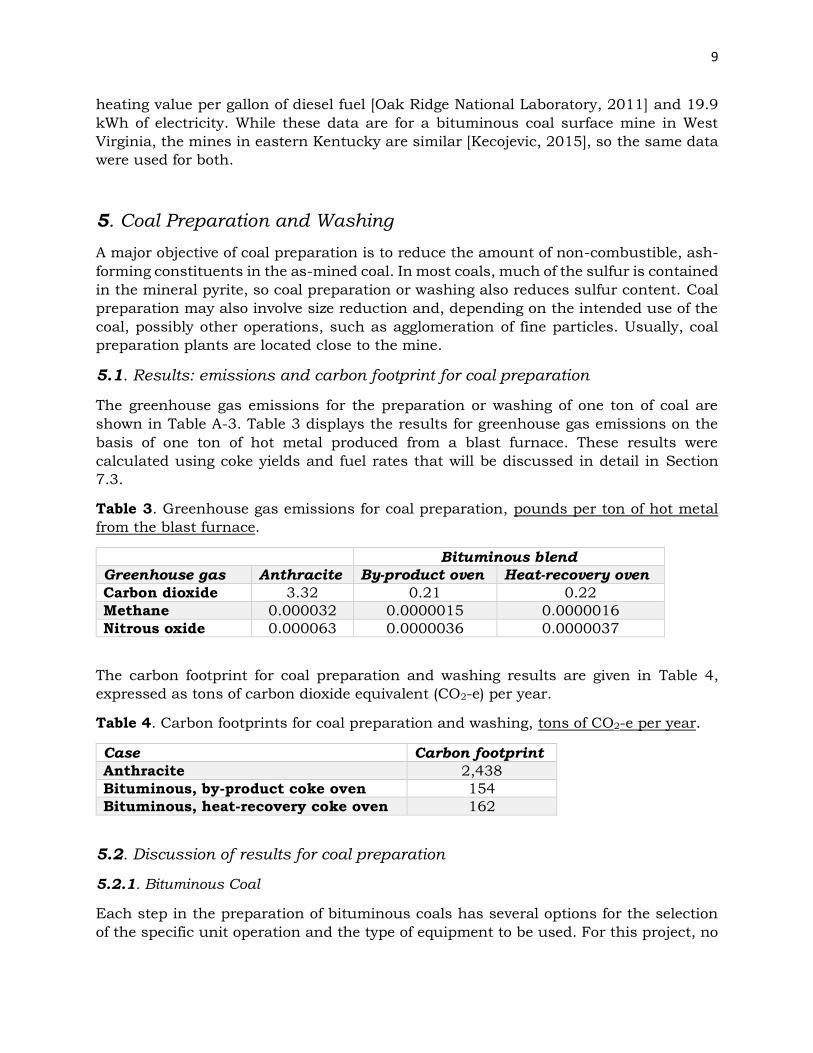
5.1. Results: emissions and carbon footprint for coal preparation
The greenhouse gas emissions for the preparation or washing of one ton of coal are
shown in Table A-3. Table 3 displays the results for greenhouse gas emissions on the
basis of one ton of hot metal produced from a blast furnace. These results were
calculated using coke yields and fuel rates that will be discussed in detail in Section
7.3.
Table 3. Greenhouse gas emissions for coal preparation, pounds per ton of hot metal
from the blast furnace.
Bituminous blend
Greenhouse gas Anthracite By-product oven Heat-recovery oven
Carbon dioxide 3.32 0.21 0.22
Methane 0.000032 0.0000015 0.0000016
Nitrous oxide 0.000063 0.0000036 0.0000037
The carbon footprint for coal preparation and washing results are given in Table 4,
expressed as tons of carbon dioxide equivalent (CO2-e) per year.
Table 4. Carbon footprints for coal preparation and washing, tons of CO2-e per year.
Case Carbon footprint
Anthracite 2,438
Bituminous, by-product coke oven 154
Bituminous, heat-recovery coke oven 162
5.2. Discussion of results for coal preparation
5.2.1. Bituminous Coal
Each step in the preparation of bituminous coals has several options for the selection
of the specific unit operation and the type of equipment to be used. For this project, no
10
attempt was made to optimize a preparation flowsheet for the hypothetical blend of
bituminous coals. Electricity requirements for coal preparation [Spath, et al. [1999],
were corrected to an as-received coal basis using published values of moisture and ash
for the two coals [Eble and Weisenfluh, 2012; Ode, 1967], and converted to units of
kilowatt-hours per ton of as-received coal. Values of greenhouse gas emissions per
kilowatt-hour of electricity generated [EIA, 2014a] were apportioned 70% to generation
in Kentucky and 30% to West Virginia (Table A-4). As will be explained in Section 7.3,
1.43 tons of coal are required to produce a ton of coke in a by-product recovery coke
oven, and 1.49 in a heat-recovery oven. Also, 0.356 tons of coke are needed to make one
ton of hot metal. The slightly higher carbon footprint for the heat-recovery oven case is
a result of the smaller coke yield in this type of oven.
5.2.2. Anthracite
Electricity consumption data for the St. Nicholas breaker, operated by Blaschak Coal
Corp., were supplied the company [Lowe, 2014b]. The median value for a sixteen-month
period was 8.21 kilowatt-hours per prepared ton. This figure includes electricity
consumption for lighting, heaters, and other ancillary uses. Emission factors for
electricity generation in Pennsylvania were applied [EIA, 2014a]. Production of a ton of
hot metal requires 0.373 tons of anthracite. It is not clear why the carbon footprint
result is much higher than for bituminous coal, though both sets of results will be seen
to be insignificant compared to results shown later for coking.
With regard to size preparation, the average size of blast-furnace coke is 2.05 inches,
with a range of 1.77–2.36 inches [Cheng, 2001]. This fits reasonably well with stove
anthracite 1.62–2.44 inches. Included in the specification was an average of 1% by
weight, with a tolerance of ≤4%, of +4 inch coke (i.e., broken anthracite), and an average
8% by weight, with a tolerance of ≤11%, of –1 inch (roughly pea) [Cheng, 2001].
6. Transportation
6.1. Results: emissions and carbon footprint for coal transportation
All coal shipments were assumed to be made by rail in trains hauled by conventional
diesel-electric locomotives. The principal contribution to carbon footprint is the CO2
emission from burning the diesel fuel. There are also very small contributions from
methane and nitrous oxide [Beckstrom, 2008]. For the purpose of this study, the
potential of using biodiesel fuel, which could have a lower carbon footprint, was not
considered. A secondary contribution to carbon footprint would be from machinery used
for loading and unloading the coal.
As explained in Section 7, metallurgical coke is made by two technologies: by-product
recovery coke ovens and heat-recovery ovens. To avoid the implication that a particular
steel company was being singled out either for criticism or for favorable treatment, no
specific, existing integrated steel mills were used as the basis for the study. Rather, it
was assumed that a hypothetical integrated mill with by-product coke ovens would be
in southwestern Pennsylvania in the Pittsburgh area, and a different facility with heat-
11
recovery ovens would be in northwestern Indiana in the area around Gary and East
Chicago. It was also assumed that these hypothetical steel mills would have captive coke
oven batteries. There would be no additional rail haul from the coke plant to the blast
furnace. Anthracite was assumed to be shipped to the same plants, where it would by-
pass the coke ovens and be fed directly to the blast furnace.
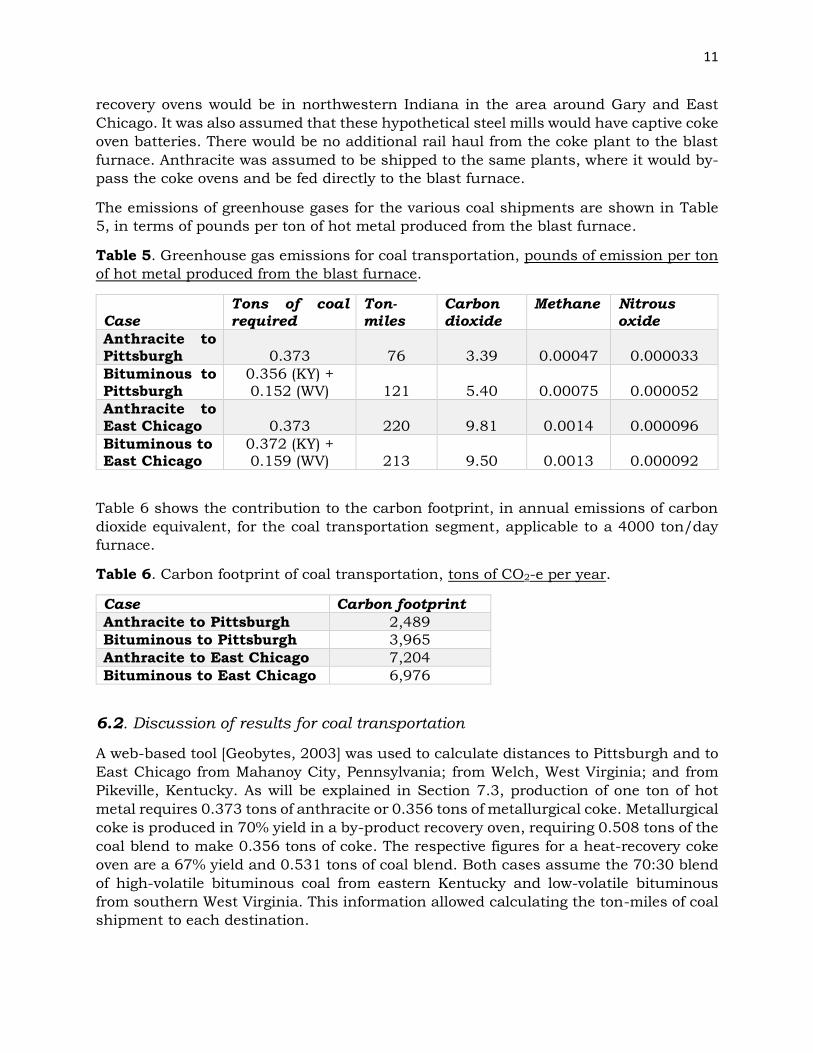
The emissions of greenhouse gases for the various coal shipments are shown in Table
5, in terms of pounds per ton of hot metal produced from the blast furnace.
Table 5. Greenhouse gas emissions for coal transportation, pounds of emission per ton
of hot metal produced from the blast furnace.
Case
Tons of coal
required
Ton-
miles
Carbon
dioxide
Methane Nitrous
oxide
Anthracite to Pittsburgh
0.373
76
3.39
0.00047
0.000033
Bituminous to Pittsburgh
0.356 (KY) + 0.152 (WV)
121
5.40
0.00075
0.000052
Anthracite to East Chicago
0.373
220
9.81
0.0014
0.000096
Bituminous to East Chicago
0.372 (KY) + 0.159 (WV)
213
9.50
0.0013
0.000092
Table 6 shows the contribution to the carbon footprint, in annual emissions of carbon
dioxide equivalent, for the coal transportation segment, applicable to a 4000 ton/day
furnace.
Table 6. Carbon footprint of coal transportation, tons of CO2-e per year.
Case Carbon footprint
Anthracite to Pittsburgh 2,489
Bituminous to Pittsburgh 3,965
Anthracite to East Chicago 7,204
Bituminous to East Chicago 6,976
6.2. Discussion of results for coal transportation
A web-based tool [Geobytes, 2003] was used to calculate distances to Pittsburgh and to
East Chicago from Mahanoy City, Pennsylvania; from Welch, West Virginia; and from
Pikeville, Kentucky. As will be explained in Section 7.3, production of one ton of hot
metal requires 0.373 tons of anthracite or 0.356 tons of metallurgical coke. Metallurgical
coke is produced in 70% yield in a by-product recovery oven, requiring 0.508 tons of the
coal blend to make 0.356 tons of coke. The respective figures for a heat-recovery coke
oven are a 67% yield and 0.531 tons of coal blend. Both cases assume the 70:30 blend
of high-volatile bituminous coal from eastern Kentucky and low-volatile bituminous
from southern West Virginia. This information allowed calculating the ton-miles of coal
shipment to each destination.

12
Carbon dioxide emissions for coal shipments were determined from recent data from
the Burlington Northern Santa Fe railroad, which claims to be able to move one ton of
freight 500 miles on one gallon of diesel fuel [BNSF, 2014]. Other methods are available
[e.g., GHG, 2005], but it seemed most plausible to accept operating data from a major
coal-hauling railroad. The emissions of carbon dioxide, methane, and nitrous oxide were
taken from Beckstrom [2008].
Different assumptions used in determining fuel rates, plant locations, and the number
and sources of the bituminous coals would result in different values of the emissions
for coal transportation. Regardless, the calculated values shown in Tables 5 and 6 are
small in comparison to other results shown in later sections, and have correspondingly
small impact on the final carbon footprint.
7. Coke Production
7.1. Introductory comments on metallurgical coke production
Because anthracite would be used directly in the blast furnace with no heat treatment
or coking beforehand, this section applies only to the bituminous coal — metallurgical
coke case. In this segment of the chain very significant differences between metallurgical
coke and anthracite emerge. Because anthracite is not coked, the carbon dioxide
emission for the anthracite case is nearly zero, compared to values shown below for the
coke case. (There is a very small contribution for coal unloading and handling in the
anthracite case.) Also, there is significant carbon loss in the production of coke; the
yield of coke per unit of bituminous coal is about 65–75%.
Production of coke involves heating bituminous coal, or a blend of coals, in the absence
of air to temperatures above 1800° F. Several by-products are formed in addition to the
desired coke. They include coke oven gas, a complex mixture of condensable organic
compounds referred to as coal tar, a second mixture of condensable organic compounds
called light oil, ammonium sulfate, and a watery phase called ammonia liquor that
contains various dissolved compounds. Coke oven gas is a useful fuel. In the late
nineteenth century it was learned that many components of tar, light oil, and ammonia
liquor are either valuable chemical products in their own right or useful for making
other marketable products. It made good sense to capture, separate, and sell these
materials.
Two approaches are used to make metallurgical coke. The more common one uses by-
product recovery coke ovens. As their name implies, they are designed to facilitate
capturing useful by-products. From their peculiar geometry—tall and deep but very
thin—they are sometimes called slot-type coke ovens. The latter part of the twentieth
century saw increasing concern about the environmental impact of by-product recovery
ovens. This concern led to the introduction of ovens in which all of the volatile
components of the coal, which contribute to forming gas, light oil, and tar, would be
burned in the freeboard inside the coke oven. Such ovens are sometimes called non-
recovery coke ovens. Since the burning of these volatile materials provides considerable
13
heat that helps the coking process, the ovens are also known as heat-recovery ovens.
(An alternative approach to heat-recovery coke-making uses the heat from the burning
volatiles to raise steam to be used for electricity generation [Quanci, 2011]. For the
present study, we considered only the case in which all of the volatiles are consumed
inside the oven.)
By-product recovery and heat-recovery ovens have slightly different yields of coke. In a
by-product recovery oven, many volatile materials containing carbon leave the oven
itself; in a heat-recovery oven, these materials are burned inside the oven. As a result,
the two kinds of coke ovens have different carbon footprints.
Production of coke suitable for use in blast furnaces is accompanied by the formation
of a small quantity of coke breeze, particles of coke too small for use in the furnace,
usually less than half-inch size. (As mentioned above, the average size of furnace coke
is about two inches.) The yield of coke breeze is small, e.g. 0.05 ton of coke breeze per
ton of coal coked [Sweetser, 1938]. Coke breeze is an excellent solid fuel, having various
applications, such as in sintering iron ore. Because the yield of coke breeze is very small
compared to that of furnace coke, and because it will likely be used as a fuel anyway,
no separate calculation was made for the carbon dioxide from coke breeze; it was
counted with the furnace coke.
In addition to the coke ovens themselves, a coke plant has numerous pieces of
mechanized equipment for unloading coal, blending, primary crushing, screening,
pulverizing, and bulk density control [Sundholm et al., 1999]. It was assumed that the
energy requirements for these pieces of equipment, and the carbon dioxide emissions
that could be ascribed to them, would be the same for both kinds of coke ovens. Further,
since anthracite would need to be unloaded, even though it does not pass through coke
ovens, emissions for coal unloading and handling were included in the anthracite case.
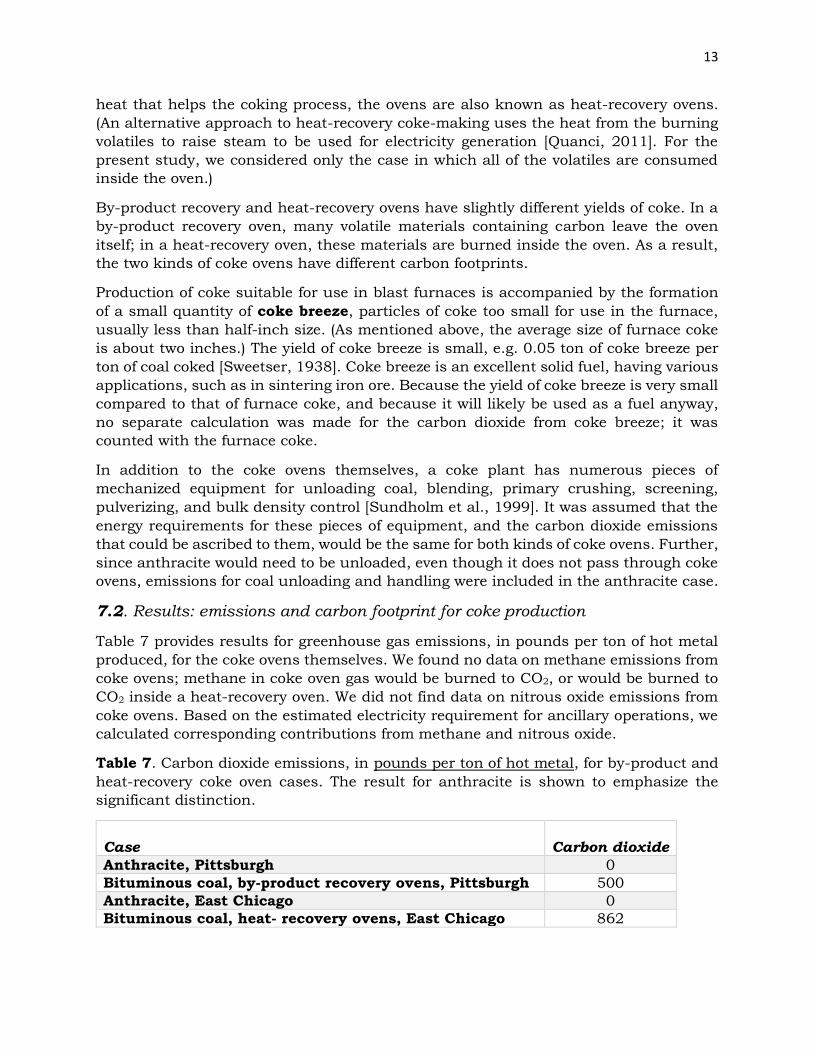
7.2. Results: emissions and carbon footprint for coke production
Table 7 provides results for greenhouse gas emissions, in pounds per ton of hot metal
produced, for the coke ovens themselves. We found no data on methane emissions from
coke ovens; methane in coke oven gas would be burned to CO2, or would be burned to
CO2 inside a heat-recovery oven. We did not find data on nitrous oxide emissions from
coke ovens. Based on the estimated electricity requirement for ancillary operations, we
calculated corresponding contributions from methane and nitrous oxide.
Table 7. Carbon dioxide emissions, in pounds per ton of hot metal, for by-product and
heat-recovery coke oven cases. The result for anthracite is shown to emphasize the
significant distinction.
Case
Carbon dioxide
Anthracite, Pittsburgh 0
Bituminous coal, by-product recovery ovens, Pittsburgh 500
Anthracite, East Chicago 0
Bituminous coal, heat- recovery ovens, East Chicago 862
14
The greenhouse gas emissions attributable to the electricity consumed in ancillary
operations for each of these cases are much smaller than for the coke ovens themselves.
The results for the ancillary operations are given in Table A-5.
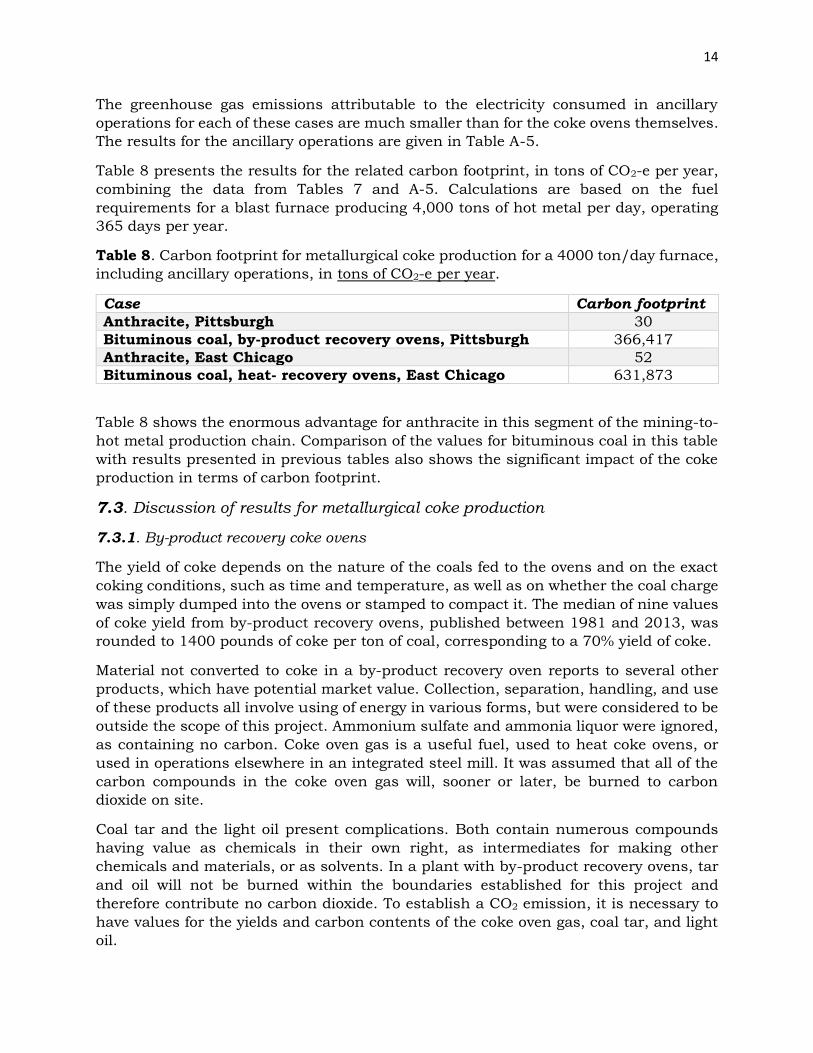
Table 8 presents the results for the related carbon footprint, in tons of CO2-e per year,
combining the data from Tables 7 and A-5. Calculations are based on the fuel
requirements for a blast furnace producing 4,000 tons of hot metal per day, operating
365 days per year.
Table 8. Carbon footprint for metallurgical coke production for a 4000 ton/day furnace,
including ancillary operations, in tons of CO2-e per year.
Case Carbon footprint
Anthracite, Pittsburgh 30
Bituminous coal, by-product recovery ovens, Pittsburgh 366,417
Anthracite, East Chicago 52
Bituminous coal, heat- recovery ovens, East Chicago 631,873
Table 8 shows the enormous advantage for anthracite in this segment of the mining-to-
hot metal production chain. Comparison of the values for bituminous coal in this table
with results presented in previous tables also shows the significant impact of the coke
production in terms of carbon footprint.
7.3. Discussion of results for metallurgical coke production
7.3.1. By-product recovery coke ovens
The yield of coke depends on the nature of the coals fed to the ovens and on the exact
coking conditions, such as time and temperature, as well as on whether the coal charge
was simply dumped into the ovens or stamped to compact it. The median of nine values
of coke yield from by-product recovery ovens, published between 1981 and 2013, was
rounded to 1400 pounds of coke per ton of coal, corresponding to a 70% yield of coke.
Material not converted to coke in a by-product recovery oven reports to several other
products, which have potential market value. Collection, separation, handling, and use
of these products all involve using of energy in various forms, but were considered to be
outside the scope of this project. Ammonium sulfate and ammonia liquor were ignored,
as containing no carbon. Coke oven gas is a useful fuel, used to heat coke ovens, or
used in operations elsewhere in an integrated steel mill. It was assumed that all of the
carbon compounds in the coke oven gas will, sooner or later, be burned to carbon
dioxide on site.
Coal tar and the light oil present complications. Both contain numerous compounds
having value as chemicals in their own right, as intermediates for making other
chemicals and materials, or as solvents. In a plant with by-product recovery ovens, tar
and oil will not be burned within the boundaries established for this project and
therefore contribute no carbon dioxide. To establish a CO2 emission, it is necessary to
have values for the yields and carbon contents of the coke oven gas, coal tar, and light
oil.

15
The yield of light oil is about 1% of the coal charged. About 90% of light oil consists of
benzene, toluene, and xylenes in proportion of about 11:2:1 [Perch and Muder, 1974].
Assuming that these compounds constituted all of the light oil, its weighted average
carbon content would be 91.1%. (This is calculated from the known carbon contents of
the three compounds.) A coke yield of 70% requires 1.43 tons of coal; a 1% yield of light
oil is 28.6 pounds of light oil. From its carbon content, light oil represents 26 pounds of
carbon per ton of coke that do not contribute to carbon dioxide formation.
Coal tar yield is about 5% of the coal charged [Grangier and Gibson, 1981]. Distillation
of tar yields a distillable fraction and a non-distillable pitch. Based on reported carbon
contents for each fraction [Dickakian, 1984; Granda et al., 2003], and the proportion of
pitch in tar [Perch and Mulder, 1974], the weighted average carbon content of coal tar
is 92.8%.
In some plants, tar has been used as fuel, either by injecting it into the tuyeres of the
blast furnace, or in other applications where a cheap fuel is needed. Where markets
exist, the value of tar as a source of chemicals outweighs its value as an inexpensive
fuel. For this project, it was assumed that all of the tar would go to chemical markets,
and would not contribute to carbon dioxide emissions. This is the most favorable case
for the by-product recovery ovens, because if some of the tar were to be used as fuel, it
would contribute to a slight increase in carbon dioxide.
Producing a ton of coke in a by-product recovery oven at 70% yield requires 1.43 tons
of coal. From the known carbon content of the coal blend (Table A-1), this is equivalent
to 1.12 tons of carbon. The carbon content of the coke (Section 3.2) shows that a ton of
coke retains 0.85 tons of carbon, and light oil and tar retain an additional 0.01 and 0.07
tons, respectively. The difference between the carbon charged to the oven with the coal,
and that accounted for in coke, light oil, and tar is 0.195 tons per ton of coke.
This amount of carbon (0.195 tons) leaves the oven as carbon-containing compounds in
coke oven gas. This gas is a good fuel, with various applications in a steel mill. The
compounds in the gas will, sooner or later, become carbon dioxide when the gas is
burned. The carbon in coke oven gas is equivalent to a carbon dioxide production of
0.715 tons of CO2 per ton of coke produced. Using a coke rate of 0.356 tons per ton of
hot metal, the carbon dioxide emission is 0.25 tons, or 500 pounds, per ton of hot metal.
7.3.2. Heat-recovery coke ovens
The coke yield from heat-recovery ovens is approximately 2–4% lower than from by-
product recovery ovens [Quanci, 2011]. Using the yield from a by-product recovery oven
as a basis, a 3% reduction applied to heat-recovery ovens represents a yield of 67%, or
1340 lbs/ton.
Based on this yield, producing a ton of coke in a heat-recovery oven requires 1.49 tons
of coal blend. Following the same reasoning as in the previous section, this is equivalent
to charging 1.17 tons of carbon. Coke retains 0.84 tons of carbon. The difference, i.e.,
the carbon lost, is in the volatiles that are burned inside the oven, and is assumed to
be converted completely to carbon dioxide. For a coke rate of 0.356, the carbon dioxide
emission is 862 pounds of CO2 per ton of hot metal. This value is higher than for the
16
by-product recovery oven case because the by-product recovery oven gives a higher coke
yield, temporarily “locking up” more carbon in the coke, and because the by-product
light oil and tar incorporate carbon that does not contribute to carbon dioxide.
7.4. Ancillary operations
Coal as received must be unloaded, blended in beds or stockpiles, crushed, screened,
pulverized, and the pulverized material re-blended [Sundholm et al., 1999]. Then the
prepared coal is loaded into a larry car for charging into the coke ovens. Once the
formation of coke is complete, the oven is “pushed” to remove the coke. These operations
all require various kinds of machinery, most of which are operated by electricity. The
electricity consumption is estimated to be 3.5 kilowatt-hours per ton of coal coked. The
details of this estimation are presented in Table A-6 in the Appendix.
Three caveats apply. First, the values pertain to by-product coke oven operation and are
assumed to be comparable for a heat-recovery oven. We did not find data for ancillary
operations in a heat-recovery oven plant. Second, the data came mostly from
manufacturers’ or vendors’ information. No attempt was made to optimize a design for
the equipment to be used in the various steps in coal handling mentioned above; energy
savings possibly could be achieved by careful selection of pieces of equipment of similar
size, to integrate with the other equipment. Third, no estimate was made of energy usage
after the coke oven has been pushed, such as moving of hot coke to the quenching
station, quenching the coke, transporting it to the coke wharf, and subsequent
screening, handling, and conveying.
It was assumed that electricity used in the coke plants would be generated in the state
in which the plant is located. This assumption provides a basis for determining the
carbon dioxide emissions assigned to electricity consumption, from Energy Information
Administration [EIA, 2014a] data. The differences result from the slightly greater
amount of coal needed to produce a ton of coke in a heat-recovery oven, and from the
higher emissions for electricity generation to supply a plant in northwestern Indiana,
compared to one in the Pittsburgh area.
7.5. Anthracite
Anthracite does not pass through a coking operation, so its related carbon dioxide
emission would be zero. Anthracite still has to be unloaded and handled at the steel
mill, so an allowance was made for energy consumption in coal unloading, and for a
balance-of-plant estimate to include weighing equipment, conveyors, and similar items.
Coal unloading and balance of plant amount to 0.1 kilowatt-hour per ton of anthracite.
Then, as above, appropriate data for Indiana and Pennsylvania [EIA, 2014a] could be
used to calculate the greenhouse gas emissions.
17
8. Blast Furnace Operation
8.1. Introductory comments on blast furnaces
A blast furnace is basically a vertical chemical reactor in which four ingredients—iron
ore, flux, fuel (metallurgical coke in all current U.S. operations), and air—react to
produce three products—hot metal (or pig iron), slag, and the top gas that exits the top
of the furnace. Blast furnaces are counter-current reactors, in which the air blast flows
upward, while the fuel, ore, and flux move downward. They are approximately cylindrical
(“approximately” because the diameter varies with height inside the furnace). The
Association for Iron and Steel Technology information on blast furnace capacities in the
U.S. [AIST, 2011] show a median capacity of 3487 tons of hot metal per day, and a mean
value of 4381. It was assumed that the blast furnaces in this study would have
capacities of 4000 tons of hot metal per day.
8.2. Results: emissions and carbon footprint for blast furnace operation
The dominant contributions to emissions are the fuel, for which nearly all of the carbon
eventually becomes carbon dioxide, and the flux, which undergoes a thermal breakdown
to calcium and/or magnesium oxides and carbon dioxide. Any methane produced from
reactions in the blast furnace will be consumed, either in the furnace or by using top
gas as a fuel, and will wind up as carbon dioxide. We did not find data on nitrous oxide
emissions from blast furnaces.
Table 9 provides information on the carbon dioxide emissions for blast furnace operation
in the four cases considered, and then presents the related carbon footprint information,
in tons of CO2-e per year, based on a 4000 ton/day blast furnace.
Table 9. Carbon dioxide emissions from blast furnace operation, in pounds of CO2 per
ton of hot metal, and carbon footprint, in tons of CO2-e per year.
Case CO2 from fuel CO2 from flux Total CO2 Carbon footprint
Anthracite and Pennsylvania limestone
2,020 127 2,147 1,576,310
By-product recovery coke and Pennsylvania limestone
1,894 122 2,016 1,471,680
Anthracite and Illinois limestone
2,020 162 2,182 1,592,860
Heat-recovery coke and Illinois limestone
1,878 171 2,049 1,495,770
Table 9 shows about an 8% difference in carbon footprint between the lowest and
highest values, to the apparent disadvantage of anthracite. However, these results
18
represent relatively small differences between large numbers, and depend on many
assumptions mentioned in the following section. The conservative position would be
that the four results are essentially equal.
8.3. Discussion of results for blast furnace operation
8.3.1. Effect of blast furnace ingredients
8.3.1.1 Iron ore. For a fair comparison, it was assumed that the same ore would be used
in each case considered in this study. The carbon footprint of ore production,
preparation, and transportation was not considered as part of this study. However, the
composition of the ore determines the amount of flux required and affects the fuel rate
to the furnace, so ore composition impacts the overall carbon footprint.
The ore selected for this study was pelletized taconite from the Mesabi Range in
Minnesota. Pellets are the dominant form of iron ore in the United States [Proveromo,
1999], and Minnesota is the dominant producer [Explore Minnesota, 2013]. In some
operations, flux is added to the pellets. For this study, it was assumed that pellets would
not contain flux, because it was anticipated that metallurgical coke and anthracite,
having different quantities and compositions of ash, would require different amounts of
flux; therefore it would be a cleaner calculation to assume that the necessary flux would
be added as such, and that none would come in with the ore pellets. The median values
of data on the composition of pelletized taconite ores without flux [Proveromo 1999] are
given in Table A-7.
All of the iron in the ore is reduced to metal [Burgo, 1999]. From Table A-7, it requires
1.46 tons of ore to produce a ton of hot metal, accounting for the carbon and silicon
that will be expected in the metal. (These amount to 4.3% and 0.56%, respectively.)
Much the manganese and all of the phosphorus are reduced and enter the metal [Burgo,
1999]. All of the aluminum, calcium, and magnesium oxides, along with unreduced
portions of silicon and manganese oxides, make up the gangue and enter the slag.
8.3.1.2. Fuel. In this report, the term fuel means metallurgical coke or anthracite. When
one or the other of these is meant specifically, it will be referred to by name. Fuel is a
major contributor to carbon dioxide emissions from the furnace.
Fuel serves four chemical functions in the blast furnace: it provides heat necessary to
melt the iron and slag; carbon monoxide produced from burning the fuel is the primary
agent for converting ore to metal; CO also reduces portions of manganese, silicon, and
phosphorus in the ore; and some carbon from the fuel enters the metal. Fuel also serves
a mechanical function, providing physical support for the burden (fuel, ore, and
limestone) above it, maintaining a permeable bed so that the air blast can pass upward
and the molten iron and slag can percolate downward. The mechanical aspects will be
discussed in greater detail in Section 10.3.2.
Fuel consumption is critical, since all of the carbon in the fuel, except the relatively
small amount that dissolves into the iron, eventually reports as CO2. Consumption is
referred to as the fuel rate, expressed as tons of fuel consumed per ton of hot metal
produced. Since nowadays metallurgical coke is almost universally used as blast
19
furnace fuel, the term coke rate is commonly encountered. In 2011 and 2012, the
average coke rate in American blast furnaces was 0.356 tons of coke per net ton of hot
metal [Wozek, 2013].
All of the carbon charged to the furnace, except for the small amount dissolved in the
metal, exits as carbon-containing compounds in the top gas. (Small amounts of
unburned carbon in, or floating on, the slag were ignored, as were small amounts that
might be blown out of the furnace in the top gas.) By far the dominant carbon
compounds in the gas are carbon monoxide and dioxide. Although it has a low calorific
value, top gas is used as a fuel, in part because it is “free.” Because it is likely to be used
as a fuel somewhere in the plant, e.g. for firing coke ovens, it is assumed that all of the
carbon in the gas will be converted to CO2.
Based on the coke rate mentioned above, use of by-product recovery coke results in
charging 0.301 tons of carbon per ton of metal. Of this, 0.043 tons will be retained as
dissolved carbon in the hot metal. (Much of this carbon could be removed from the metal
in some downstream operation in the steel mill, but is outside the boundaries of this
project.) The difference of 0.258 tons is equivalent to 0.947 tons of carbon dioxide
emitted per ton of metal. The same approach for heat-recovery oven coke shows a CO2
emission of 0.939 tons per ton of hot metal. These results are essentially identical.
To arrive at an “anthracite rate,” the anthracite must fulfill the same chemical roles as
coke: it must provide the same amount of heat, and must provide the same amount of
carbon monoxide. The starting point to determining the amount of anthracite needed is
to find out the amounts of heat and carbon monoxide obtained from coke. The most
recent data give a gross calorific value of 13,110 Btu/lb and carbon content of 89.6%
on a dry basis [Moore, 2011]. Also, this calorific value agrees quite well with the median
of six values reported from 1984 to 2014 (13,118 Btu/lb).
To produce comparable amounts of carbon monoxide, the carbon provided to the
furnace by the coke would have to be replaced by the same quantity of carbon from
anthracite. A given weight of air blast will burn the same amount of carbon, regardless
of the form of the fuel [Perrott and Kinney, 1923; Sweetser, 1935]. This is borne out by
tests in which metallurgical coke and anthracite briquettes showed the same “carbon
rates,” (1313±64 lb/ton) [Eckerd et al., 1964], in an experimental furnace with sintered
iron ore, regardless of which one was used as fuel. (These old data also show how the
coke rate has improved greatly in the past fifty years.)
Calorific value and carbon content data used for Lattimer Mammoth vein coarse blend
anthracite were provided by Blaschak Coal Corp. [Lowe, 2014a. At a coke rate of 0.356,
metallurgical coke produces 9,334,320 Btu and provides 638 lb of carbon per ton of hot
metal. With anthracite, the same amount of heat would need 702 lb, but supplying the
same amount of carbon would take 745 lb, the latter figure being equivalent to an
anthracite rate of 0.373. Because the fuel must supply both the carbon and the heat,
the latter, higher value was used in all subsequent calculations.
The same approach was used to determine the carbon dioxide emission as discussed
above for the by-product recovery oven coke. The anthracite rate, its carbon content,
and the carbon dissolved in the hot metal were all known. The resulting CO2 emission
20
is 1.01 tons per ton of hot metal. This is higher than results for the two cases with coke
discussed above, but the differences among the three are so small that, essentially, they
are identical. Slight fluctuations in fuel rate, carbon content of the fuel, and amount of
carbon retained in the metal could change any of these CO2 emission values, and change
the relative ranking of the three fuels.
8.3.1.3. Flux. Besides the desired iron oxides, ore always contains a variety of minerals
and oxides of other metals, such as manganese. Collectively, the unwanted portions of
the ore—i.e., the “non-iron” portions—are the gangue. To avoid contaminating the metal,
the components of the gangue need to melt to produce a non-metallic slag, which can
be withdrawn from the furnace separately. Ash-forming constituents of the fuel also
contribute to the slag. Flux facilitates melting the gangue, and keeps the viscosity of
the slag low enough to make it easy to tap from the furnace. Usually the flux is
limestone (calcium carbonate, CaCO3), or sometimes dolomite (calcium magnesium
carbonate, CaMg(CO3)2).
In addition to facilitating melting and controlling viscosity, flux also affects the chemical
behavior of the slag, to control the partitioning of various elements—notably sulfur and
silicon—between the hot metal and slag. The issue of adjusting slag composition to
control the partitioning of silicon and sulfur between slag and metal was not considered
as part of this project.
Limestone and dolomite undergo thermal breakdown (also called calcination) in the
blast furnace. For example, limestone converts to calcium oxide and carbon dioxide, i.e.
CaCO3 → CaO + CO2. Therefore, flux contributes directly to CO2 emissions. It has been
established that 100% of the carbon in the flux reports as CO2 [Langdon, 1910; Forsythe
et al., 1922]. Since anthracite and coke contain different amounts of ash-forming
components, with different compositions, the flux required in each case will be different.
Generally, flux is obtained from sources near the steel mill, to minimize shipping costs.
Based on locations where carbonates are mined for chemical use [Barnes and Smith,
2001], the Vanport limestone in Butler County, Pennsylvania would be the closest likely
source of flux for a plant in the Pittsburgh area. Vanport limestone also occurs in
Mahoning County, Ohio [Wolfe, 2008], which would be another plausible source for a
plant in or near Pittsburgh. The median composition of six limestone samples from
Butler County is shown in Table A-8 [O’Neill, 1976].
In the Gary–East Chicago area, a likely source of flux would be northeastern Illinois.
This would involve a shorter rail haul to a plant than would limestone coming out of
south-central Indiana. Also, much of the limestone quarried in Indiana is so-called
dimension stone used in buildings, assumed to be more expensive than commodity
limestone to be used as blast-furnace flux. Data for limestone from DuPage County,
Illinois were used [Lamar, 1957]; the median composition of seven samples is reported
in Table A-8.
The two fluxes are different chemically. The Pennsylvania limestone is quite pure
calcium carbonate, while the Illinois material is a dolomitic limestone, high in
magnesium. (Many informal terms are used for these materials; e.g. calcium oxide from
nearly pure calcium carbonate is sometimes called Hi-Cal lime, and, from dolomite,
21
Dolomitic lime [Horsman, 2013].) Both, however, contain a high proportion of total
carbonates, so any silica, alumina, and iron oxide in the flux do not add greatly to the
slag.
The information in Table A-8 allows calculation of the CO2 emitted per weight of flux
used, shown in Table A-9. This is not the contribution of the flux to the carbon footprint,
but is needed to calculate that contribution.
It was assumed that the composition of ash in the coke would be the weighted average
composition of the ashes of the two coals. This is given in the Appendix in Table A-10.
For Lower Elkhorn coal, the composition was taken as the median of six samples from
Pike County, Kentucky [Eble and Weisenfluh, 2012]. Data for Pocahontas No. 3 ash are
median values for twelve samples [Trent et al. 1982]. Data on “representative mineral
analysis of ash” supplied by Blaschak Coal Corp. [Lowe, 2014a] are given for anthracite.
Finding the amount of ash from coke requires knowing the ash value of the coal blend
fed to the coke ovens and the yield of coke. The ash value was determined as the
weighted average of values for a 70:30 blend of Lower Elkhorn and Pocahontas No. 3
coals. The relevant data and calculated values for the blend are shown in Table A-1; the
median values from Eble and Weisenfluh [2012] and Trent et al. [1982] were used for
the individual coals.
Coke yields and the ash value of the coal blend used to produce the coke allow
calculating the percent of ash in the coke and the amount of ash that a ton of coke
contributes to the slag. These results are provided in Table A-11. The same calculation
was done for anthracite.
The other major contribution to the slag is gangue. Determining this contribution must
recognize that portions of the silicon and manganese in the gangue are reduced in the
furnace and wind up in the iron. (Minor or trace elements in the ore, such as chromium
and vanadium, might also be reduced, but have been neglected completely in this
project.) About 65–75% of the manganese in the ore is reduced [Burgo, 1999], but this
is not so important as the silicon, which, as explained below, affects the quantity of flux
needed. Phosphorus is completely reduced [Burgo, 1999]. The other components shown
in Table A-7 will not be reduced at all.
Reduction of silica (SiO2) to silicon depends on such factors as the chemical composition
of the slag and the amount of carbon dissolved in the iron. The median of six values
[Higuchi et al., 1978; Burgo, 1999] for the percent silicon in hot metal is 0.56% silicon.
From information in the previous paragraphs, 1.46 tons of ore (or 1 ton of hot metal)
produces 153 pounds of gangue, having composition shown in Table A-12.
Knowing the coke rate, the amount of gangue expected, and the compositions of each
(Tables A-10 and 12), it is possible to calculate the composition of the slag from the
weighted average of the compositions of coke ash and gangue and for anthracite ash
and gangue. These calculated slag compositions are given in Table A-13.
22
Calculating the amount of flux required for each of these slags is done on the basis of
the basicity ratio of the slag, defined [Biswas, 1981] as the ratio of calcium and
magnesium oxides to silicon and aluminum oxides, i.e.,
Basicity ratio = (CaO + MgO) / (SiO2 + Al2O3)
In this equation, the molecular formulas represent the weight percent of the respective
constituents in the slag. To assure that the melting temperature and viscosity of the
slag are both low enough that they will cause no operational problems in the furnace,
the basicity ratio should be in the range 0.9–1.2 [Biswas, 1981].
Any natural limestone, including the fluxes selected for this project, contains small
quantities of silicon and aluminum oxides as impurities, as shown in Table A-8. A
portion of the calcium and magnesium oxides will be consumed in reacting with these
impurities. This complication is compensated for by calculating the available lime
remaining after calcium and magnesium react with the silicon and aluminum oxides
[Sweetser, 1938]. Calculations of basicity ratio and available lime use calcium and
magnesium expressed as oxides, but the standard way of giving the composition of
limestones (e.g., Table A-8) reports them as carbonates. Flux compositions from Table
A-8 were recalculated as oxides, following a standard method [Sweetser, 1938], the
results being shown in Table A-14. The results in Table A-14 make it possible to
calculate the available lime for each flux, shown in Table A-15.
Knowing the total available lime then allows calculating the amount of flux required for
each slag to achieve a basicity ratio of 1.1. The two values are 1.54 pounds of flux per
pound of slag for the heat-recovery coke plus DuPage limestone case; and 1.28 pounds
of flux per pound of slag for by-product recovery coke plus Butler limestone.
Finally, it is possible to calculate the slag rate, the sum of the weights of ash from coke,
gangue, and flux minus the CO2 from decomposition of the carbonates, and to calculate
the CO2 emission due to the flux. These results are shown in Table A-16, on the basis
of the pounds of each entity required or emitted per ton of hot metal produced. Both
sets of information assume a coke rate of 0.356 tons of coke per ton of hot metal, and
an ore requirement of 1.46 tons per ton of metal.
The slag rates shown in Table A-16 provide a useful “reality check.” A published material
balance for a blast furnace shows a slag rate of 447 pounds per ton of hot metal [Burgo,
1999]. The close agreement with values calculated for this report (408 and 454 lbs/ton,
Table A-16) is likely a lucky accident of arithmetic, since the published work assumed
a different coke rate and a mixture of different kinds of ore than the values used in this
project. However, the fact that calculated and published values of the slag rates agree
even to one significant digit suggests that the calculated values are plausible.
The same approach applies to anthracite, with the results shown in Table A-17. When
comparing anthracite with coke and using the same flux, the values of carbon dioxide
emission are only slightly different. For example, with DuPage County, Illinois flux, the
emissions are 171 lb per ton of hot metal for heat-recovery oven coke and 162 lb for
anthracite. For all practical purposes, these values are identical. Ash composition of a
given coal can vary, even within a single seam, as can the composition of a given deposit
23
of limestone or dolomite. Small departures from the values of ash and flux compositions
used in this study would result in variations in the calculated carbon dioxide emission.
8.3.1.4. Air Blast. The furnace ingredient used in greatest quantity by weight is air.
Before it enters the furnace, the air blast is preheated. The necessary heat is supplied
by burning top gas, supplemented with coke oven gas if needed. We assume complete
combustion of all of the top gas used preheating the blast. Any top gas not used in
preheating the blast finds other fuel uses elsewhere in the plant. Therefore, all of the
carbon in the top gas reports as CO2 and contributes to the carbon footprint. This
amount of carbon dioxide was calculated with the top gas (below). “Approximately the
same volume of air” is required to combust anthracite as for metallurgical coke in a
blast furnace [Sweetser, 1938]. We assume that the carbon footprint for heating the
blast is the same in the anthracite and metallurgical coke cases.
8.3.2. Effect of blast furnace products
8.3.2.1. Hot metal. Depending on the tapping temperature, hot metal contains between
2.5% and 4.5% of carbon. The specific value is largely independent of the operating
conditions of the furnace and of the composition of the burden. The value of 4.3% carbon
is considered to be that “normally present” [Joseph, 1969]. Also, 4.3% is the carbon
content of the eutectic point of the iron–carbon system [Biswas, 1981]. We assumed
the same metal composition for both the metallurgical coke and the anthracite cases.
Carbon in the iron does not contribute to the carbon footprint within the boundary
conditions of this project, but must be accounted for in determining the total amount of
fuel needed. Carbon removed when converting hot metal to steel is outside the scope of
the project.
Hot metal also contains small amounts of manganese, silicon, and phosphorus, reduced
from their respective oxides in the ore. The carbon used for liberating these elements
from their oxides contributes to the carbon footprint and is included in the overall
calculation.
8.3.2.2. Slag. The carbon content of slag is essentially zero. Small pieces of fuel might
be carried out of the furnace with the slag as it is tapped, but this event would not be
part of the ordinary, routine operation of a furnace. We assume a carbon content of zero
for slags for both metallurgical coke and anthracite cases.
8.2.3.2. Top Gas. The composition of top gas depends on the composition of the various
components of the burden and on the operating conditions of the furnace. An example
top gas composition could be about 24% carbon monoxide, 17% carbon dioxide, 1–2%
hydrogen, and 58% nitrogen [Christie et al., 1972]. Some of CO2 comes from calcination
of the flux inside the furnace. All the CO and the remaining CO2 comes from combustion
of the fuel. Therefore, all of the carbon in the fuel, except the portion used for
carburization of the hot metal, reports to the top gas. (An additional amount of CO2
would form the ore used was an iron carbonate, but such ores are not customarily used
in American blast furnaces [McMullen, 1936].)

24
All of the carbon compounds in the top gas eventually report as CO2 once the gas is
used for its fuel applications. This means that all of the carbon in the fuel—again
excepting the small amount that enters the hot metal—reports as CO2 and represents a
major contribution to the carbon footprint. Operational data show that the amount of
carbon in the fuel that can be accounted for as carbon in iron plus top gas is 97–100%
[Langdon, 1910].
9. Carbon Footprint Determination
9.1. Results: comparison of carbon footprints for metallurgical coke and anthracite
Table 10 summarizes the carbon footprint results for the individual segments of mining,
preparation or washing, transportation, coke production, and blast furnace operation.
The results are in tons of carbon dioxide equivalent per year.
Table 10. Carbon footprints for mining through hot metal production, tons CO2-e per
year. These results are based on a blast furnace producing 4,000 tons of hot metal per
day for 365 days per year.
Case:
Operation:
Anthracite,
steel mill in Pittsburgh
area
Bituminous coal, by-
product
ovens, Pittsburgh
area
Anthracite,
steel mill in East
Chicago
Bituminous
coal, heat
recovery ovens, East
Chicago
Mining 36,314 149,168 36,314 155,956
Preparation/washing 2,438 154 2,438 162
Transportation 2,489 3,965 7,204 6,976
Coking 30 366,417 52 631,873
Blast furnace 1,576,310 1,471,680 1,592,860 1,495,770
TOTAL 1,617,581 1,991,384 1,638,868 2,290,737
There are clear advantages for the anthracite case, but they derive largely from the fact
that anthracite does not go through a coke oven and additionally from anthracite being
produced primarily in surface mines, which have much lower gas emissions than
underground mines. For most of the other operations, the results are sufficiently close
that, likely, a different choice of coals, plant locations, fluxes, ores, or many other
variables could not only change the numerical results but also alter the relative rankings
among these four cases.
25
9.2. Discussion of comparative carbon footprints for metallurgical coke and
anthracite
9.2.1. Carbon dioxide
Carbon dioxide emissions were calculated on the basis of pounds of CO2 emitted per ton
of hot metal produced.
9.2.2. Methane
We accounted for methane emissions coal mining, from coke ovens, and methane in the
top gas from the blast furnace.
Coke oven gas contains about 30% methane [Lehrman et al., 1999]. Several sources
either do not report methane in top gas, or indicate that its concentration is nil. Since
coke oven gas is a good fuel gas, we presumed that all of the carbon compounds in it
would be converted to carbon dioxide when used as a fuel somewhere inside the steel
mill. Therefore, any carbon in methane is accounted for as part of the carbon dioxide
emissions.
Small methane emissions are associated with electricity generation. According to the
Energy Information Agency, these amount to 0.0143 pounds of methane per megawatt-
hour for Indiana, and 0.0107 lbs/MWh for Pennsylvania [EIA, 2014a]. To use the by-
product recovery oven case as an example, the methane emission per ton of hot metal
is 0.00002 pounds. The global warming potential of methane is 21 [EPA, 2014], meaning
that this emission of methane would be equivalent to 0.0004 pounds of carbon dioxide
per ton of hot metal. Numerical values for the other cases will be different, but,
regardless, the results are negligible compared to the carbon dioxide emissions.
Methane emissions can come from transportation. From the BNSF experience of 500
ton-miles per gallon of diesel fuel, methane emissions for the cases in this project range
from 0.01 pounds of methane per ton of hot metal (for bituminous coal transported to
Pittsburgh) to 0.05 pounds per ton of hot metal (for anthracite to East Chicago). Though
larger than the results for electricity generation, these figures are still very small.
9.2.3. Nitrous oxide
Nitrogen forms six oxides. Of these, the one of concern as a greenhouse gas is nitrous
oxide, N2O. Its global warming potential is 310 [EPA, 2014], indicating that it is a very
potent greenhouse gas. Several other nitrogen oxides, particularly nitric oxide, NO, and
nitrogen dioxide, NO2, are formed in combustion processes. They are a problem
primarily because of their role in formation of acid rain. Often the oxides other than
nitrous oxide are lumped together as NOx. They do not appear to be greenhouse gases.
Combustion of fuels is the primary source of nitrous oxide relevant to this project; this
could include use of blast-furnace gas and top gas in the steel mill, as well as electricity
generation. Data on nitrous oxide emissions for electricity generation were taken from
the Energy Information Agency [EIA, 2014a] and amount to 0.0323 pounds of nitrous
oxide per megawatt-hour in Indiana, and 0.0203 in Pennsylvania.

26
Nitrous oxide emissions, expressed as equivalent carbon dioxide for the electricity
generation requirements explained above range from 0.01 pounds of CO2-e to 0.03
pounds per ton of hot metal. The lowest value is for the bituminous coal to by-product
coke ovens in Pittsburgh case, and the highest, for anthracite to East Chicago.
No nitrous oxide emissions were reported from by-product recovery coke ovens
[Berdowski et al., 2003]. A more recent publication does not even list nitrous oxide
among thirteen components of coke oven gas [Vallero, 2014]. We were unable to find
data on production of nitrous oxide from the combustion of coke-oven gas or of top gas.
Nitrous oxide emissions also come from transportation. With the BNSF figure of 500
ton-miles per gallon, and coke yields and fuel rates described earlier, nitrous oxide
ranges from 0.04 pounds of equivalent carbon dioxide per ton of hot metal (for
bituminous coal transported to Pittsburgh) to 0.19 pounds of CO2-e per ton of hot metal
(for anthracite to East Chicago). Though larger than the results for electricity generation,
these figures are still very small.
9.2.4. Calculation of carbon footprint
Carbon footprint is to be calculated on a per-year basis, as stated in the definition of
given in the Introduction. Although modern blast furnaces are capable of producing
10,000 tons of hot metal per day, the mean value for furnaces operating in the U.S. is
4,381, and the median is 3,487 [AIST, 2011]. Taking a furnace offline for repairs is a
difficult and expensive job, so it is desired to keep blast furnaces running for several
years, if possible, between shutdowns and major overhauls. For calculating carbon
footprints of the four cases in this study, we assumed a daily production of 4,000 tons
of hot metal for 365-day operation. The calculated carbon footprints are given in Table
10. To provide some context for these results, the total carbon footprint of the entire
United States is reported to be 7,432,000,000 tons [EPA-OPA, 2015].
The estimated carbon footprint of a typical household in the United States is 48 tons
CO2-e per year [Jones, 2011]. Replacement of coke from a heat-recovery oven by
anthracite in a hypothetical steel mill in northwestern Indiana, results in a CO2-e saving
of 651,869 tons, equivalent to 13,580 households. Assuming four people per household,
completely replacing the heat-recovery-oven coke in one blast furnace in one steel mill
with anthracite would reduce annual equivalent carbon dioxide emissions by an amount
equal to the household carbon footprint (i.e., not including transportation or civic
infrastructure) for a city of about 55,000 people, roughly the size of Hoboken, Pocatello,
or Decatur. This CO2-e saving is equivalent to the carbon footprints of about 77,000
typical motor vehicles, at 8.5 tons of CO2-e per vehicle [Fuel Economy, 2014].
10. Partial replacement of coke by anthracite
The whole sequence of analyses leading up to the results in Table 10 did not address
the issue of whether there are physical limitations on operating a modern blast furnace
with anthracite. If there are, then a related question would be whether it is possible to
replace at least a fraction—and if so, what fraction—of coke with anthracite. These
27
questions focus on the mechanical roles of fuel in the blast furnace: providing structural
support to the burden in the shaft of the furnace, and insuring that the bed remains
permeable, to allow air blast to pass upward, and slag and hot metal to flow downward.
As discussed below, some authorities consider that anthracite cannot be used in a large,
modern blast furnace, because anthracite near the bottom of the furnace will experience
significant size degradation, severely reducing permeability of the bed. Small changes
in coke size for particles below about two inches are known to have a significant effect
on permeability [Perch, 1981]. But, even if size degradation of anthracite did occur, it
does not necessarily rule out the possibility that a portion of the coke in the burden
could be replaced by anthracite, still providing a positive effect on the carbon footprint.
To address the question of how much coke could be replaced by anthracite without
negatively affecting operation, three issues were considered: the alleged causes of poor
performance of anthracite; the mechanical properties of coke important in a blast
furnace; and the comparative values of such properties for anthracite.
The heyday of anthracite-fueled blast furnaces in the U.S. was in the nineteenth
century, with a dwindling few continuing in use into the 1920s. By modern standards,
these furnaces were very small, in some cases with an output of two tons of hot metal
per day. Modern process-control instrumentation didn’t exist. Many comments reported
below come from literature pertaining to furnaces and operating practices of a century
ago. However, the mechanical load (e.g., in pounds per square inch) on the fuel particles
in the hearth of the furnace is just about the same in modern furnaces as in early
furnaces; and useful gas-flow data are given on the basis of unit cross-sectional area,
applicable to furnaces of any size. Therefore the early literature can still be relevant.
10.1. Review of use of anthracite in blast furnaces
At the peak of the anthracite furnace era, 121 furnaces operating on anthracite
produced an average of about 20,000 tons of pig iron annually per furnace. (As noted
above, a large modern blast furnace makes about 10,000 tons of hot metal per day; the
mean for American furnaces is 4,381.) Even a century ago, metallurgical coke accounted
for about 90% of blast furnace fuel, the small balance divided between anthracite and
charcoal [Forsythe et al., 1922]. Anthracite pieces of “fist” to “head” size were used.
Trials of anthracite as a blast-furnace fuel prior to 1833 invariably failed. Successful
use of anthracite was achieved by employing a pre-heated blast in the furnace [Craig et
al., 1969]. This suggests that the problem with the earliest trials may have been the
chemical reactivity of anthracite in air. Since modern blast furnaces use a pre-heated
blast, this issue should no longer be a consideration.
In the 1880s and ‘90s, blast furnaces operating on “mixtures containing ⅛ to ½
anthracite with coke” (i.e. 12–50% anthracite) were more common than those running
only on anthracite [Clendenin, 1969]. The move away from anthracite to a preference
for coke was tied to steady increases in size and production rates in blast furnaces. The
difficulty was attributed to the tendency of anthracite lumps to decrepitate on heating.
Breakage of fuel, whether coke or anthracite, in the furnace leads to numerous
problems, including choking, the production of coke mess, increased pressure drop
through the furnace, and loss of fines in the top gas.

28
10.2. Mechanical properties of coke affecting use in blast furnaces
Many factors influence coke strength, including the blending ratio of the coals charged
to the coke oven, particle size distribution of the coals, oven temperature and soaking
time in the oven, and even the oven dimensions [Biswas, 1981]. During its trip through
the blast furnace, fuel experiences various mechanical and thermal stresses. The
machinery for charging the fuel imposes impact and abrasion stresses. Down to the
bosh, the fuel must withstand crushing forces imposed by the weight of the burden.
Also, in this region the fuel might be attacked by carbon dioxide, “dissolving” carbon by
the reaction CO2 + C → 2 CO. Loss of carbon reduces the strength of the solid fuel pieces.
In the bosh, fuel is heated very rapidly to temperatures around 2750° F. There, it is
subjected to thermal shock. Resistance to thermal shock is critical, because at this
point the iron and slag have melted, so the fuel is the only solid material providing
support for the burden, thereby maintaining permeability of the bed. Impact strength,
abrasion resistance, crushing or compression strength, thermal shock resistance, and
resistance to carbon dioxide attack are all important properties.
Literature up to the early 1940s “indicates that the structural properties of coke are of
the greatest importance in determining blast-furnace properties but does not indicate
which ones of that class are important” [Mayer, 1945]. Literature also cautions that,
“…when…more economic methods of operation are being sought for blast furnaces, it
now seems apparent that further testing procedures, more relevant to the high-
temperature portion of coke behavior, are needed. … it is not possible to predict the
thermal behavior of coke merely from ambient-temperature tests. …it has not yet been
possible to carry out rigorous scientific tests relating the performance of large modern
blast furnaces to specific measured coke properties. Until this can be done, it will not
be possible to establish a sound scientific basis either for coke quality or for standard
quality control methods for coke” [Grangier and Gibson, 1981]. In the discussion that
follows, suggestions or conclusions have been reached that seem reasonable, based on
what can be found in the literature, but many of which eventually need to be tested in
actual practice.
10.3. Comparative properties of anthracite for use in blast furnaces
10.3.1. Reactivity
10.3.1.1. Reactivity to air. Any gas-solid reaction is limited by the amount of solid surface
exposed to the gaseous mixture. All other factors being equal, the greater the exposed
surface, the faster the rate of reaction. The literature cautions that “an almost infinite
variety of reactivity tests have been elaborated for coke, depending on the particular
application of the coke in which the worker was interested or on his personal
idiosyncrasies and preferences” [Mayers, 1945]. Further, our literature search found
very little work that directly compares anthracite and metallurgical coke in the same
test, regardless of the details of the test.
For coals, most of the total surface area is the surfaces or walls of the pores in the solid
piece of coal. Metallurgical coke has a so-called cellular structure, meaning that the
solid has a large number of pores (hence large surface area) easily accessed by reactive
29
gases. Anthracite does not have this structure, so is consumed more slowly than coke
at identical conditions of blast [Johnson, 1918; Forsythe et al., 1922]. To maintain the
same furnace throughput with anthracite as with coke, the temperature and pressure
of the air blast must be increased [Forsythe et al., 1922]; from a different perspective,
at comparable air blast conditions, furnace output would be reduced [Johnson, 1918].
Some anthracite vs. coke head-to-head comparison data comes from measuring the
temperature to which a sample must be heated until it takes off on a temperature rise
of 135° F (75°C) per minute. The sample temperature at the onset of this temperature
rise is called the T75. Anthracite showed a T75 of 800° F, while three samples of coke had
T75 values in the range 970–1110° F [Mayers, 1945]. (The sources of the anthracite and
cokes were not reported.) These limited data indicate that anthracite is actually more
reactive in air than is coke.
The critical air blast (CAB) test also measures reactivity in air, though it has been
questioned how well it applies to blast-furnace fuels [Perch, 1981]. The test measures
the minimum rate of air flow required to keep a bed of fuel alight for twenty minutes,
with fuel particle size, packing, and bulk density all standardized [Mayers, 1945; Smith
and Wilkinson, 1962]. The smaller the value, the greater the reactivity. CAB results
depend on the mean particle size of the samples. For 0.1-inch samples, anthracite has
a CAB value of 0.08 cubic feet of air per minute; for blast-furnace coke, the value is 0.10
ft3/min [Perch, 1981]. This test also shows anthracite to be more reactive in air than
coke. (Again, the sources of the anthracite and cokes were not reported, but are likely
from the U.K.)
10.3.1.2. Reactivity to carbon dioxide. Ideally, a good blast furnace fuel should be highly
reactive in air and nearly inert toward carbon dioxide. This is difficult to achieve in
practice.
Carbon reacts with carbon dioxide according to the equation C + CO2 → 2 CO, known
as the Boudouard reaction. It is undesirable, for several reasons. Loss of carbon from
the solid fuel into the gas phase as carbon monoxide reduces the mechanical strength
of fuel particles. The Boudouard reaction is endothermic, so that if it occurred
extensively, it could alter the heat balance or temperature distribution in the furnace.
Although CO is the primary reactant for reducing iron oxides to iron metal, reduction is
not as efficient if CO is produced in regions of the furnace where it cannot be used
optimally.
Many tests has been developed for measuring reactivity of carbon materials toward CO2.
Their significance, and their applicability to the behavior of fuel in blast furnace
conditions, has been questioned in various detailed reviews [e.g., Mayers, 1945;
Thibault, 1963; Perch, 1981]. “[I]t is significant that there is no ASTM or ISO standard
for its [reactivity with CO2] determination” [Perch, 1981].
An extensive review indicates that “the reactivities to air, to oxygen, to carbon dioxide,
and to steam are all parallel” [Mayers, 1945]. Based on that finding, and the indications
of greater reactivity for anthracite in air, it is reasonable to expect that anthracite would
also be more reactive than coke toward CO2. Results from a head-to-head comparison
of anthracite and coke, in the same apparatus under the same conditions, showed that

30
more anthracite reacted with CO2 than did coke at 1650–1740° F, and that the reaction
of anthracite with CO2 started at a lower temperature than with coke [Keene et al., 1934].
However, a more recent monograph indicates that anthracites have “poor reactivity” in
the Boudouard reaction [Higman and van der Burgt, 2008]. If this latter observation is
correct, it indicates that anthracite approaches the ideal of being reactive in air and
unreactive toward carbon dioxide. A conservative provisional conclusion is that the
differences between metallurgical coke and anthracite may not be so great that one
would be at a significant disadvantage vis-à-vis the other.
10.3.2. Mechanical strength
10.3.2.1. Abrasion resistance and impact strength. Abrasion resistance and impact
strength are determined from the same test procedure. Abrasion resistance relates to
hardness, and impact strength measures resistance to fracturing. For blast-furnace
cokes, these properties are often measured in so-called drum tests, in which a sample
is placed in a drum and rotated. Drum size, sample weight, particle size, rotation speed,
and number of revolutions are all standardized. After the test, the weights of fractions
retained on (or in some tests, passing) particular screen sizes are related to abrasion
resistance and impact strength. Specifically, the American Society for Testing and
Materials standard calls for a 10-kilogram (22 lb.) sample of 3 × 2-inch material, placed
in a 36-inch diameter, 18-inch long drum and then rotated at 25 rpm for 1400
revolutions. After the test, the amount of +1-inch material is defined to be the stability
factor (indicating resistance to fracture), and the amount of +¼-inch is defined to be the
hardness factor (indicating abrasion resistance) [Perch, 1981].
The bulk density of dry coal used for producing coke relates to the stability and hardness
factors [Perch, 1981]. Although anthracite is not coked, it is possible, but not proven,
that bulk density might relate to these factors for anthracite. Based on the published
graphical relationship [Perch, 1981], a bulk density for anthracite of 50 lb/ft3 [Meyers,
2014] corresponds to a stability factor in the range 54–61(median 58), and a hardness
factor in the range 66–68 (median 67). For comparison, coke sampled from 13 plants in
the years 1966 to 1975 had a stability factor of 51–62, average 56; and a hardness factor
of 62–73, average 68 [Perch, 1981]. Recent data from the American Iron and Steel
Institute show a mean stability factor of 60 [Valia, 2015]. The stability and hardness of
anthracite are nearly identical with the values for coke.
Friability measures the ease with which a piece of material can be crumbled. Testing of
seven coals, including Pennsylvania and Welsh anthracites, in seven different friability
tests showed that Pennsylvania anthracite was the least friable in the six of the seven
tests, and was referred to as “tough, hard anthracite” [Gilmore, et al., 1935]. Testing of
117 American coals in one type of friability test showed that anthracites were less friable
than bituminous coals [Yancey et al., 1932].
10.3.2.2. Compressive strength. The average compressive strength of anthracite from the
northern field is 6000 pounds per square inch, as determined from measurements on
423 samples [Yancey and Geer, 1945]. Welsh anthracite showed values of 5550 psi for
twenty samples tested perpendicular to the bedding planes, and 5280 psi for another
twenty tested parallel to the bedding planes [Evans and Pomeroy, 1966]. These values
31
are essentially identical, within limits of experimental precision. Earlier data for five
samples of Mammoth seam anthracite, supplied from different collieries, show lower
values, a median of about 2300 psi [Daniels and Moore, 1907]. Because of the large
number of samples tested, the Yancey and Geer [1945] data are likely the most reliable.
Tests conducted at 3000° F show values of “resistance to compression” of 5930 psi for
one sample of anthracite, superior to values of 3340 and 5290 psi for two samples of
coke obtained from one company [Thibault, 1963].
Most measurements of the compressive strength of coals rely on carefully prepared
specimens, usually cylinders or cubes. In blast furnace practice, the fuel is in lumps of
various shapes. For two British bituminous coals, compressive strengths of irregular
lumps were 1.7–2.0 times larger than strengths of cubes of the same coal [Evans and
Pomeroy, 1966]; for one other coal, strengths of lumps and cubes were about the same.
Based on these limited observations, laboratory measurements on regularly shaped
specimens might be considered to be a minimum value for the behavior expected for
irregular lumps of the same coal.
The pressure on coke pieces in a 1920-era blast furnace was estimated to be 35–40
pounds per square inch [Perrott and Fieldner, 1923]. (The pressure comes from the
weight of the burden above the furnace hearth.) Using data for a 2009-era blast furnace
[Geerdes et al., 2009], the burden would exert a pressure of 31 psi, if the hearth were
covered completely by fuel particles. It is highly unlikely that irregular lumps of a
material could cover a surface completely. If two-thirds to three-quarters of the hearth
was covered, the pressure on the fuel particles would be 41–46 psi. In the highly
improbable scenario that the load on the particles was underestimated by a factor of ten
(so that it was actually ≈450 psi) and at the same time the compressive strength of
anthracite was overestimated by a factor of ten (so that it was really only ≈600 psi),
anthracite should still be strong enough to avoid being crushed by the weight of the
burden in the furnace. Compressive strength considerations should not place anthracite
at a disadvantage relative to coke.
10.3.2.3. Thermal shock resistance. Problems with anthracite as a blast-furnace fuel
have been ascribed to its tendency to decrepitate, splinter, or crack at high temperatures
[Kreisinger et al., 1916; Forsythe, 1922]. Anthracite splinters into fine particles, a “state
of fine division,” at high temperatures [Forsythe et al., 1922]. The breakdown into
smaller particles allows them to fill void spaces between the larger ones. These void
spaces provide passages for the air blast; if they are filled, air flow is restricted and a
higher pressure would be needed to overcome resistance and drive the blast through
the furnace [Johnson, 1918]. Decrepitation is also implicated in the operational problem
of scaffolding, which upsets furnace operation [Johnson, 1918]. As discussed below, it
is likely that thermal shock is responsible for the various observations of anthracite
breaking down in the blast furnace hearth.
10.4. Comparative summary of anthracite and coke properties
Table 11, on the following page, summarizes the discussion in this section.
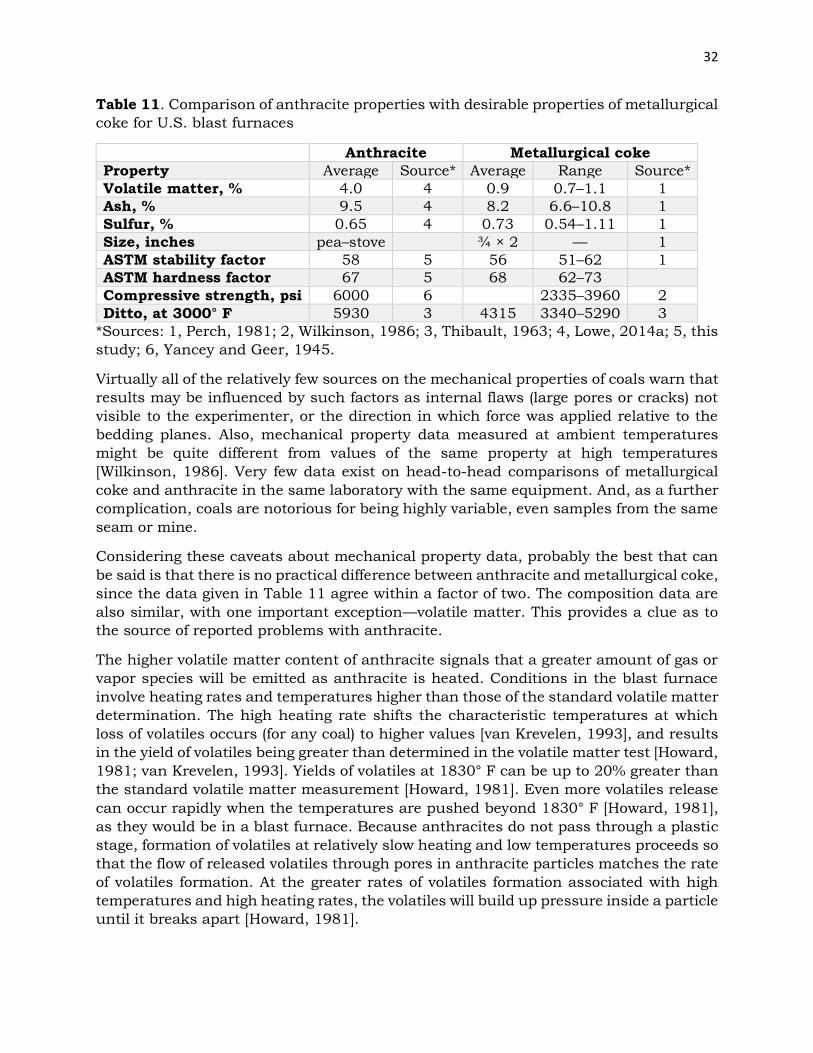
32
Table 11. Comparison of anthracite properties with desirable properties of metallurgical
coke for U.S. blast furnaces
Anthracite Metallurgical coke
Property Average Source* Average Range Source*
Volatile matter, % 4.0 4 0.9 0.7–1.1 1
Ash, % 9.5 4 8.2 6.6–10.8 1
Sulfur, % 0.65 4 0.73 0.54–1.11 1
Size, inches pea–stove ¾ × 2 — 1
ASTM stability factor 58 5 56 51–62 1
ASTM hardness factor 67 5 68 62–73
Compressive strength, psi 6000 6 2335–3960 2
Ditto, at 3000° F 5930 3 4315 3340–5290 3
*Sources: 1, Perch, 1981; 2, Wilkinson, 1986; 3, Thibault, 1963; 4, Lowe, 2014a; 5, this
study; 6, Yancey and Geer, 1945.
Virtually all of the relatively few sources on the mechanical properties of coals warn that
results may be influenced by such factors as internal flaws (large pores or cracks) not
visible to the experimenter, or the direction in which force was applied relative to the
bedding planes. Also, mechanical property data measured at ambient temperatures
might be quite different from values of the same property at high temperatures
[Wilkinson, 1986]. Very few data exist on head-to-head comparisons of metallurgical
coke and anthracite in the same laboratory with the same equipment. And, as a further
complication, coals are notorious for being highly variable, even samples from the same
seam or mine.
Considering these caveats about mechanical property data, probably the best that can
be said is that there is no practical difference between anthracite and metallurgical coke,
since the data given in Table 11 agree within a factor of two. The composition data are
also similar, with one important exception—volatile matter. This provides a clue as to
the source of reported problems with anthracite.
The higher volatile matter content of anthracite signals that a greater amount of gas or
vapor species will be emitted as anthracite is heated. Conditions in the blast furnace
involve heating rates and temperatures higher than those of the standard volatile matter
determination. The high heating rate shifts the characteristic temperatures at which
loss of volatiles occurs (for any coal) to higher values [van Krevelen, 1993], and results
in the yield of volatiles being greater than determined in the volatile matter test [Howard,
1981; van Krevelen, 1993]. Yields of volatiles at 1830° F can be up to 20% greater than
the standard volatile matter measurement [Howard, 1981]. Even more volatiles release
can occur rapidly when the temperatures are pushed beyond 1830° F [Howard, 1981],
as they would be in a blast furnace. Because anthracites do not pass through a plastic
stage, formation of volatiles at relatively slow heating and low temperatures proceeds so
that the flow of released volatiles through pores in anthracite particles matches the rate
of volatiles formation. At the greater rates of volatiles formation associated with high
temperatures and high heating rates, the volatiles will build up pressure inside a particle
until it breaks apart [Howard, 1981].
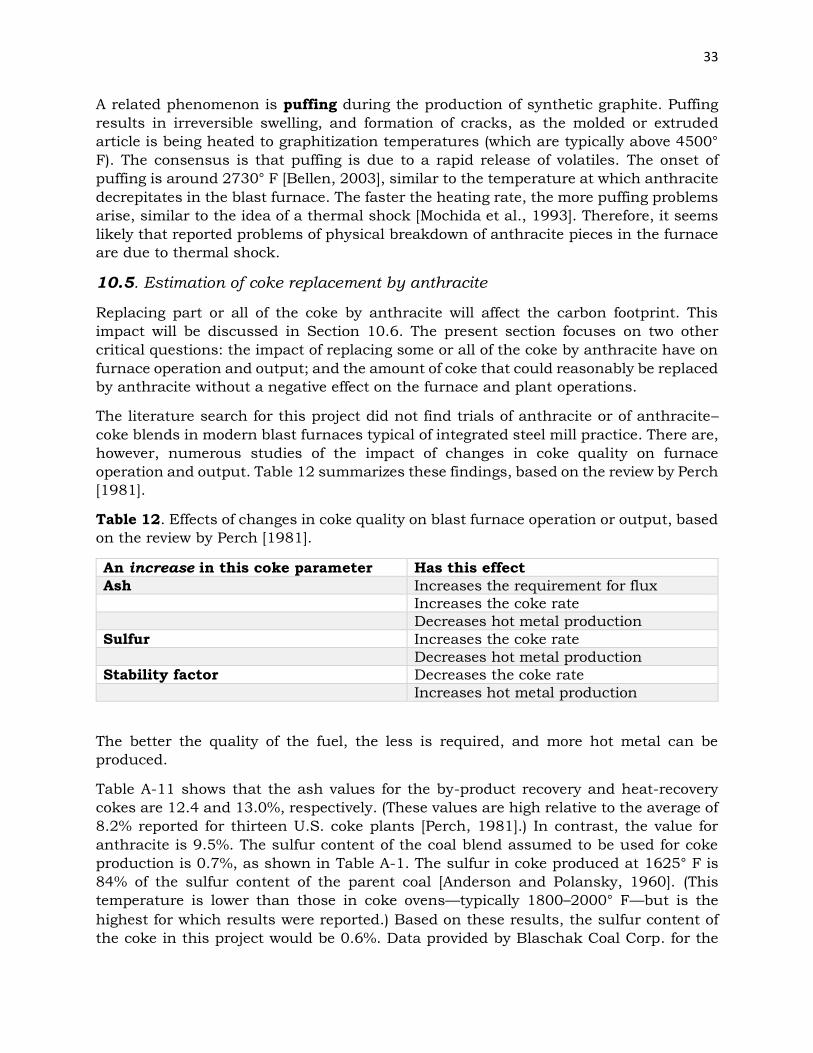
33
A related phenomenon is puffing during the production of synthetic graphite. Puffing
results in irreversible swelling, and formation of cracks, as the molded or extruded
article is being heated to graphitization temperatures (which are typically above 4500°
F). The consensus is that puffing is due to a rapid release of volatiles. The onset of
puffing is around 2730° F [Bellen, 2003], similar to the temperature at which anthracite
decrepitates in the blast furnace. The faster the heating rate, the more puffing problems
arise, similar to the idea of a thermal shock [Mochida et al., 1993]. Therefore, it seems
likely that reported problems of physical breakdown of anthracite pieces in the furnace
are due to thermal shock.
10.5. Estimation of coke replacement by anthracite
Replacing part or all of the coke by anthracite will affect the carbon footprint. This
impact will be discussed in Section 10.6. The present section focuses on two other
critical questions: the impact of replacing some or all of the coke by anthracite have on
furnace operation and output; and the amount of coke that could reasonably be replaced
by anthracite without a negative effect on the furnace and plant operations.
The literature search for this project did not find trials of anthracite or of anthracite–
coke blends in modern blast furnaces typical of integrated steel mill practice. There are,
however, numerous studies of the impact of changes in coke quality on furnace
operation and output. Table 12 summarizes these findings, based on the review by Perch
[1981].
Table 12. Effects of changes in coke quality on blast furnace operation or output, based
on the review by Perch [1981].
An increase in this coke parameter Has this effect
Ash Increases the requirement for flux
Increases the coke rate
Decreases hot metal production
Sulfur Increases the coke rate
Decreases hot metal production
Stability factor Decreases the coke rate
Increases hot metal production
The better the quality of the fuel, the less is required, and more hot metal can be
produced.
Table A-11 shows that the ash values for the by-product recovery and heat-recovery
cokes are 12.4 and 13.0%, respectively. (These values are high relative to the average of
8.2% reported for thirteen U.S. coke plants [Perch, 1981].) In contrast, the value for
anthracite is 9.5%. The sulfur content of the coal blend assumed to be used for coke
production is 0.7%, as shown in Table A-1. The sulfur in coke produced at 1625° F is
84% of the sulfur content of the parent coal [Anderson and Polansky, 1960]. (This
temperature is lower than those in coke ovens—typically 1800–2000° F—but is the
highest for which results were reported.) Based on these results, the sulfur content of
the coke in this project would be 0.6%. Data provided by Blaschak Coal Corp. for the
34
Lattimer Mammoth Vein coarse blend indicate a sulfur content of 0.65% on a dry basis
[Lowe, 2014a], essentially identical with that of coke. As discussed in Subsection
10.3.2.1, the stability factor of anthracite is slightly higher than that of coke, 58 vs. 56,
respectively. The lower ash, comparable sulfur, and higher stability factor for anthracite
indicate that there would be no negative impact on furnace operation from substituting
anthracite for coke, based on these factors.
The mechanical properties of anthracites are comparable to those of metallurgical coke
(Table 11). It seems that the best explanation for the furnace problems that have been
ascribed to anthracite is decrepitation due to thermal shock, which results from the
rapid, and comparatively high, release of volatiles. Even the standard volatile matter
test results are about four times higher for anthracite than for coke.
Determination of the effect of thermal shock decrepitation on anthracite use in a blast
furnace depends on how the particle size distribution changes when the anthracite
experiences thermal shock; on the reduction of bed permeability and hindrance air flow
due to the changed distribution of particle size; and on the amount of reduced
permeability that can be tolerated while still maintaining acceptable operation. The
second and third points are addressed in the literature pertaining to the flow of gases
through packed beds of solids.
A study of gas flow in a bed of broken solids, designed to relate closely to blast-furnace
operations, warns that “…the problem…is too complex to lend itself readily to complete
analysis” [Furnas, 1929]. Nevertheless, this study does show a relationship between
pressure drop and gas flow rate for various size distributions of broken solid particles.
Breakdown of fuel particles in the furnace hearth impacts passage of the air blast
through the furnace. As the particles get smaller, flow rate decreases if the pressure
drop across the bed is constant, and if the flow rate is constant, pressure drop increases.
We found no data on the distribution of sizes produced by thermal-shock shattering of
anthracite particles, so it is not possible to estimate the particle size in the fuel bed after
thermal shock has occurred. The flow of gases through beds of solids is thoroughly
discussed in engineering handbooks [e.g., Drew and Genereaux, 1941; Boucher and
Alves, 1973]. If the shift in particle size distribution were known, it could be used to
determine the change in pressure drop through the blast furnace. This could help
pinpoint the percentage of anthracite, in a blend with coke, which could be tolerated
before operating problems would occur.
Lacking good quantitative data on the shift in particle size distribution and how that
shift would affect the air blast, it seems best to fall back on existing historical data,
which show successful furnace operation with 12–50% anthracite mixed with coke
[Clendenin, 1969]. Possibly (though not proven or even mentioned in literature we
found) this range of values may reflect the natural variability in anthracites. The impact
of this blending on the carbon footprint will be discussed in the section that follows.
10.6. Impact of partial replacement of coke on carbon footprint
From Figure 1, replacing coke from heat-recovery ovens with anthracite would reduce
annual CO2-e by about 38,000 to 78,000 tons per year; this represents the minimum

35
case. By replacing 50% of coke with anthracite, the reduction in carbon footprint would
be about 160,000 tons per year using by-product recovery oven coke, and 326,000 tons
per year in a plant using heat recovery oven coke. The low end represents a saving
equivalent to the carbon footprints of 800–1600 households. Substitution of 50% of heat
recovery oven coke with anthracite represents a reduction of carbon footprint equivalent
to nearly 7,000 households, or 38,000 vehicles. These figures reinforce the key finding
of this project: whenever metallurgical coke can be displaced by anthracite, there will
be a saving in carbon footprint, most of which comes from the fact that anthracite does
not need to pass through a coking process.
Figure 1. Reductions in carbon footprint that could be attained by replacing a
percentage of metallurgical coke with anthracite, based on calculations for one furnace
with capacity of 4,000 tons of hot metal per day.
0
50000
100000
150000
200000
250000
300000
350000
0 10 20 30 40 50 60
Car
bo
n f
oo
tpri
nt
red
uct
ion
, to
ns
CO
2-e
per
yea
r
Percent replacement of coke by anthracite
heat-recoverycoke
by-productrecovery coke
36
Part 2. The Electric Arc Furnace Case
11. Anthracite as charge carbon in electric arc furnaces
11.1. Introductory comments on electric arc furnaces
Electric arc furnaces (EAFs) currently account for 60% of steel production in the United
States [AISI, 2014]. Electric-furnace steel is used in such products as reinforcing bar,
structural steel pieces, and steel plates. Specialty products, such as stainless steel, can
also be made in EAFs.
EAFs are cylindrical vessels with a hemispherical bottom, and a domed or flattened
spherical lid. The bottom sections of the furnace are refractory-lined. Above the slag
line, the furnace is mainly made of water-cooled panels. EAFs operating on DC use a
single electrode, while those running on AC have three electrodes. Electrodes enter the
furnace through openings in the lid. EAFs are built in a wide range of sizes; in a modern
steel mill a “mid-sized” furnace is said to have a production capacity of 88 tons of liquid
steel per charge [Miller et al., n.d.]. For this report, a furnace capacity of 100 tons has
been assumed, and, analogous to the blast furnace case, emissions have been
calculated on the basis of one ton of liquid steel produced.
The most important and most commonly used charge material for an EAF is scrap steel
[Goel et al., 2005]. Scrap comes from many sources, including reject material from the
plant itself, turnings or cuttings from machining operations, and merchant scrap. Other
charge materials include sponge iron and, especially in integrated plants, some hot
metal from the blast furnace. If EAFs are used to make special alloy steels, including
stainless steels, ferroalloys will be added to attain the desired composition. For this
project, it was assumed that the desired EAF product would be a regular carbon steel,
eliminating dealing with ferroalloys. In addition to the metallic components, EAFs are
also charged with slag-forming materials (oxides or carbonates of calcium and/or
magnesium) and with carbon. Because both the slag-formers and the carbon are
important to this project, they will be discussed separately below.
EAF operation can also involve injection of oxygen through lances, the use of oxygen-
fuel burners, or both. Burners provide additional heat to the furnace. Oxygen lances
help cut up pieces of scrap, and the reaction of iron with oxygen provides even more
heat to the furnace.
EAFs are prodigious consumers of electricity, up to about 400 kilowatt-hours per ton of
steel produced [Miller et al., n.d.]. The median value for 17 EAFs is 310 kilowatt-hours
per ton of steel [Jones et al., 2012]. To put this figure in context, the annual power
consumption for an EAF producing a million tons of steel per year is comparable to the
power requirement for a small town, about 40 megawatts [Jones et al., 2012]. In regions
where the electricity is generated primarily in plants burning coal (or other fossil fuels),
power generation will be a significant contribution to the carbon footprint. This is likely
to be the case for the two hypothetical integrated steel mills in this project.
37
11.2. Sources of furnace emissions
EAFs produce various fumes and gaseous emissions, including fine particulates, carbon
monoxide and dioxide, nitrogen oxides (NOx), and volatile organic compounds (VOCs).
These occur as primary emissions, when power is on and the furnace is in operation,
and as secondary emissions during charging or tapping. Modern EAFs are equipped
with systems to capture and deal with the emissions. Numerous designs are used; a
popular approach is the direct evacuation system (DES). The DES attaches a water-
cooled duct to a hole in the lid of the furnace, to direct gases and fumes to particulate
collection and gas cleaning equipment.
Both carbon monoxide and carbon dioxide are produced in an EAF. Oxygen lancing
readily converts carbon in the metal charge, or carbon added to the furnace, to CO.
Oxygen-fuel burners will produce CO2 from the fuel. Some VOCs, discussed more fully
below, might burn inside the furnace.
During EAF operation, graphite electrodes are consumed at their tips and along their
sidewalls, representing another source of CO or CO2. Graphite consumption depends
the amount of time the power is on to the furnace, the current in each phase (for three-
phase AC), the number of tons melted per batch and per hour, the time from one tapping
of the furnace to the next, and the surface area of the electrodes [Jones et al., 2012].
Graphite loss from electrode tips is thought to be due to sublimation of carbon, while
loss from sidewalls is due to oxidation of carbon to carbon dioxide. Likely, carbon
subliming from electrode tips will eventually become carbon dioxide in the furnace or in
downstream operations. Electrode consumption contributes to the carbon footprint of
the EAF.
Because carbon monoxide is lethal, any CO that escapes the furnace must be destroyed.
The easy way is to burn CO to CO2. Heat from burning CO downstream of the furnace
in the DES is wasted. Alternatively, so-called post-combustion methods can be used to
burn most of the CO in the freeboard of the furnace. In that case, heat would be
recovered in the furnace, be transferred back to the bath, and serve as an extra energy
source for the furnace. Regardless of whether CO is converted in the furnace or in the
DES, it is reasonable to assume that carbon converted to CO eventually becomes CO2,
contributing to the carbon footprint.
Scrap may have varying amounts of organic compounds associated with it. For example,
turnings from the machining of steel items can be contaminated with oil. From a furnace
operation standpoint, this is of concern because the oil might increase the sulfur input
to the furnace [Goel et al., 2005]. But, with respect to carbon footprint, VOCs are of
concern because they likely will be burned to CO2, either in the furnace or in the DES.
A source of calcium and/or magnesium will be charged as a flux for the slag and to
adjust slag composition to control partitioning of various elements, such as sulfur,
silicon, and manganese, between the slag and the steel. The materials used as a source
of calcium or magnesium are limestone, lime, dolomite, or magnesite (magnesium
carbonate, MgCO3) [Miller et al., n.d.]. As discussed in Section 8.3.1.3, limestone
decomposes to lime and carbon dioxide; dolomite or magnesite experience analogous
reactions. Limestone, dolomite, or magnesite used as flux contribute to the carbon
38
footprint. While limestone occurs in nature, lime is manufactured by heating or
“burning” limestone in kilns. (This is a misleading term, because there is no actual
combustion of the limestone.) Production of lime releases CO2 to the atmosphere, but
this process would not likely be done in the steel mill. The CO2 will have been driven off
at the site where the lime is produced, along with CO2 from burning fuels for process
heat.
Forming and maintaining a slag layer is important in EAF operation. When components
of scrap such as silicon, phosphorus, or manganese are oxidized during operation, their
respective oxides are chemically incorporated into the slag. The slag layer covers the
arc, increasing heat transfer to the molten metal while decreasing radiative heat transfer
to the furnace roof and walls. These effects help to stabilize the arc, resulting in greater
electrical and thermal efficiency, and reduce damage to the roof and walls from the
radiated heat.
11.3. Flux
As discussed in Section 8.3.1.3, flux has the primary role of interacting with gangue
and ash to produce a material with melting point and viscosity low enough to assure
trouble-free removal from the blast furnace. This is just as true of EAF operation as of
blast furnaces. In an EAF, three additional considerations are important, not discussed
with respect to blast furnaces.
First, during the melting period, some components of steel—silicon, manganese,
phosphorus, and sulfur—are oxidized and enter the slag as their respective oxides.
Usually it is desired to keep these elements in the slag, rather than having them re-
enter the molten steel. In slag chemistry, oxides of these impurity elements are acids,
so retaining their oxides in the slag is facilitated if the slag is basic. Calcium and/or
magnesium oxides from the flux help adjust the slag basicity to accomplish this.
Because it is possible to manipulate slag composition to control partitioning of elements
such as silicon and manganese between the slag and the metal, the EAF is not just a
device for melting steel, but also helps to refine the metal at the same time.
Second, in EAF operation it is helpful to produce a foam of slag, as explained in Section
11.5.1 below. Adding flux helps adjust the viscosity and surface tension of the slag—
both of which relate to slag composition—to allow good slag foaming.
Third, most EAFs are lined with refractories that are chemically basic. Acidic slag would
readily corrode the refractory lining. Addition of basic fluxes, to maintain a basic slag,
increases the longevity of the lining. Slag forms from ash associated with the injection
carbon and from oxidation of components of the steel, as mentioned above. Also, some
iron in the charge will be oxidized unavoidably, and enter the slag as FeO. For this
project, it was assumed that the injection carbons would be anthracite or metallurgical
coke from by-product recovery or from heat-recovery coke ovens. The ash compositions
of these materials are given in Table A-10.
The many possible sources of metal charged to the EAF—including a very wide variety
of scrap steels—make it difficult to delineate specific contributions to slag from
impurities in the metal. Jones et al. [2012] provided a “typical slag composition” for EAF
39
operation, which shows 5–15% SiO2, 10–30% FeO, and 2–5% MnO entering the slag.
The midpoints of each, i.e. 10% SiO2, 20% FeO, and 3.5% MnO, were selected as
reasonable composition values. These values are also in reasonable agreement with the
slag composition from an operating 99-ton EAF [Apfel, 2011], as will be discussed below.
11.4. Carbon applications in EAF operation
The nomenclature for carbons added to an EAF is somewhat ambiguous. This report
relies primarily on the definitions provided by Fish [2003]. First, charge carbon is added
to the furnace to consume excess oxygen and maintain a reducing atmosphere during
melt-down of the charge. This helps to minimize the oxidation (and hence waste) of iron
or added alloys during the melting process. Because this carbon is sacrificed just to
maintain a desired furnace atmosphere, some sources refer to it as sacrificial carbon.
Second, foamy slag carbon is injected into the furnace to generate a foam that helps
protect the electrodes and enhance the efficiency of heat transfer to the bath. This
carbon addition usually occurs in conjunction with the injection of oxygen into the
furnace, so it is also known as injection carbon. Third, carbon is also used to recarburize
the metal. However, it appears to be common practice to do the recarburization in the
ladle, downstream of the EAF. Therefore, carbon used in this application is outside the
parameters of this project, which ends with molten steel exiting the EAF. Unfortunately,
some sources use the term “charge carbon” to refer to carbon added for both purposes;
other sources use “injection carbon” as the general term for all carbon applications in
an EAF. Another complication arises from the practice of injecting coal into the tuyeres
of a blast furnace, a strategy known as pulverized coal injection (PCI). In some sources
the term “injection carbon” is used for PCI, which is completely outside the parameters
of this project.
Many materials are used as steelmaking carbons in an EAF: anthracite, metallurgical
coke, petroleum coke, crushed electrodes, and graphite [Goel et al., 2005; Jones et al.,
2012]. Petroleum coke was not considered in this project, because it is a by-product of
refining operations; no one would build and operate a refinery primarily to make coke.
In contrast, companies do build and operate coke oven batteries for the purpose of
making metallurgical coke. Metallurgical coke used as injection carbon in an EAF is
usually in the form of coke breeze. Crushed electrodes come from in-house scrap, so
were also not considered in this project.
Generally, the carbon content of scrap steel fed to an EAF will be lower than in the hot
metal from a blast furnace. Because downstream finishing operations that produce the
final, marketable steel products remove some carbon from the metal, charge carbon is
added to the EAF (or, in many cases, to the ladle), to insure that the carbon content of
the molten product will be higher than the desired level in the finished steel [Jones et
al., 2012]. EAF operation has evolved to use more and more oxygen, for oxygen lancing
and for oxygen-fuel burners, and this trend has resulted in the need to add greater
amounts of charge carbon.
The amount of charge carbon needed is determined by the carbon content of the steel
scrap fed to the furnace, by the oxygen usage during furnace operation, and by the
desired carbon content of the molten metal to be tapped from the furnace [Jones et al.,
40
2012]. Current rates of injection carbon addition, 4.4 to 26.4 pounds per ton of molten
metal produced [Jones et al., 2012], represents a carbon consumption much smaller
than the coke rate of 712 pounds (0.356 tons) per ton of hot metal in a blast furnace.
Specifications for coke breeze used as EAF carbon are 1–2% moisture, 1–3.5% volatile
matter, 86–88% fixed carbon, and 9–12% ash [Jones et al., 2012]. A sulfur content below
0.1% has been recommended, and a size less than 6 mm (quarter-inch) [Goel et al.,
2005]. With respect to the sulfur specification, the value of 0.1% given here is cited
verbatim from the original literature [Goel et al., 2005], but it should be recognized that
this value is considerably lower than typical ranges of 0.5–1.1% sulfur for blast-furnace
coke [e.g., Perch, 1981]. An argument against using “coal powder” (the source did not
specify the rank of the coal) is the “varying ash and sulfur content” [Goel et al., 2005].
This points out the importance of offering a product that is very consistent in
composition over a long period of time.
Anthracite specifications from Carbone [2015] show three size ranges of charge coal,
10–30/40 mm, 30/40–70 mm, and 70-120 mm. The smallest product has a maximum
moisture content of 7.0%; the two others, 6.0%. The injection coal has a maximum
moisture content of 3.5% [Carbones, 2015].
Carbon used for re-carburizing the metal will not contribute to the carbon footprint.
This carbon is locked up in the steel and will not escape as carbon dioxide or other
greenhouse gases. For this reason, the Environmental Protection Agency does not
include carbon used for re-carburizing the EAF product to contribute to CO2 emissions
[EPA, 2003]. However, the amount of charge carbon used for re-carburization has a
secondary contribution to the carbon footprint, because it still has to be mined, washed,
and transported to the steel mill.
As mentioned above, it is important to get the maximum amount of heat generated from
the arc into the furnace charge, which becomes the molten bath in the furnace. This is
helped by making sure that the arc is covered by a layer of slag. The slag layer reduces
loss of heat by radiation to the furnace interior, increasing the proportion of heat that
goes into the bath. Oxygen, injected at the same time as foamy slag carbon, reacts with
carbon to produce carbon monoxide, which foams the slag.
Carbon reacts also with iron oxides in the slag also to form carbon monoxide, without
oxygen injection. Iron oxides are formed from oxidation of some of the scrap, and enter
the slag phase. Reaction of carbon with iron oxides converts iron in the oxide back to
metal, and produces carbon monoxide that foams the slag. Carbon monoxide helps as
well to flush dissolved nitrogen and hydrogen from the molten steel [Jones et al., 2012].
Inclusions of metal oxides in the steel can also be flushed out of the metal by the CO.
11.5. Results: comparative carbon footprints for metallurgical coke and anthracite
in an EAF
Because the focus was on the use of anthracite or metallurgical coke as injection carbon,
results only for the carbon will be presented first, in Table 13. Before injection carbon
is ready to be put into the EAF, it must go through the same sequence of mining,
preparation, transportation, and coking (for the bituminous coals) as has already been
41
discussed. The same assumptions and data were used in the injection carbon case as
used previously. As will be explained below, the amounts of injection carbons used were
selected to give the same amount of carbon monoxide in the furnace in each case, and
therefore the actual use of injection carbon has the same impact on carbon footprint,
as will be noted from Table 13.
Table 13. Carbon footprints for the production and use of EAF carbons, in units of tons
of CO2-e per year. Calculations for an EAF producing 81.5 tons of steel per heat, 16
heats per day, 365 days per year.
Case:
Operation:
Anthracite
in Pittsburgh
mill
By-product
recovery
coke in Pittsburgh
mill
Anthracite
in East Chicago
mill
Heat-recovery
coke in East Chicago mill
Mining 600 2,397 600 2,527
Preparation 36 2 36 2
Drying 182 0 182 0
Transportation 36 64 109 114
Coking 0.4 5,882 0.7 10,237
Use in EAF 25,992 25,992 25,992 25,992
TOTAL 26,846 34,337 26,920 38,872
Anthracite clearly enjoys an enormous advantage by not being coked, and by virtue of
being produced primarily from surface mines, which carries over to the total carbon
footprint for production and use of the carbon. However, the CO2 emission when the
carbon is actually used dominates this case.
The injection carbon is not the only source of greenhouse gas emissions for an EAF. To
get a complete picture, Table 14 shows results when the other sources of greenhouse
gases are included. As explained below, it was assumed that electrode wastage, the use
of oxy-fuel burners, and oil contamination of scrap charged to the furnace would be the
same in each case.
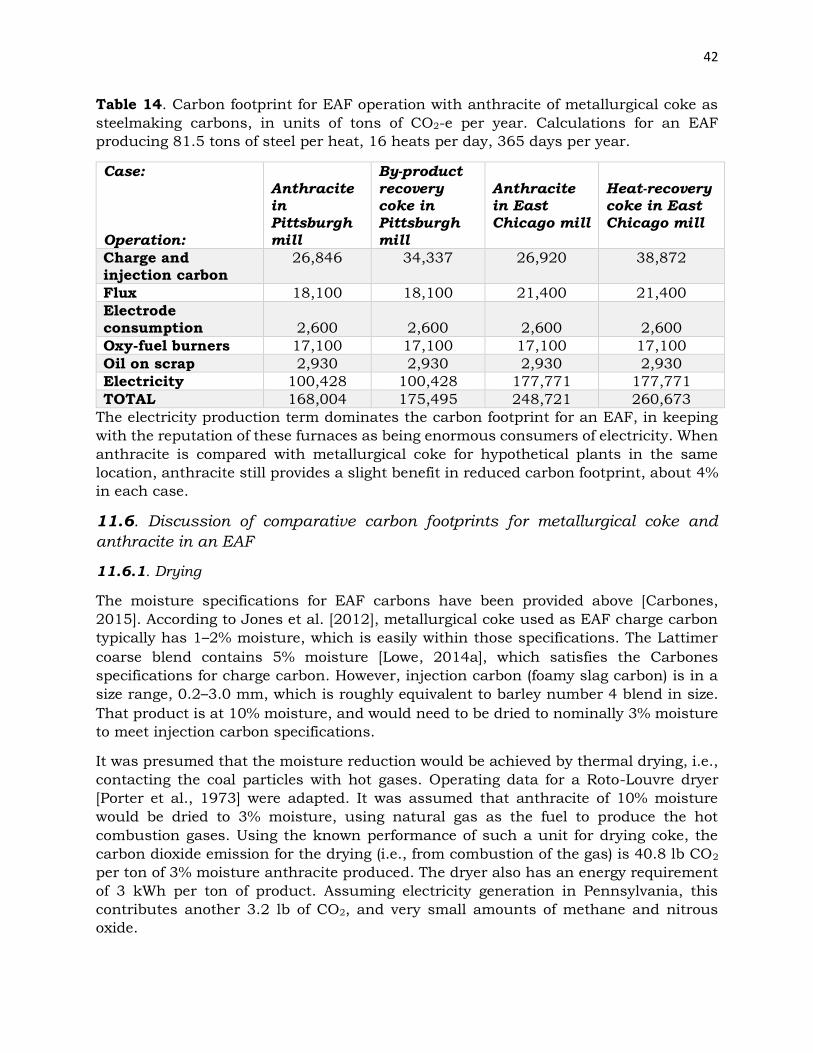
42
Table 14. Carbon footprint for EAF operation with anthracite of metallurgical coke as
steelmaking carbons, in units of tons of CO2-e per year. Calculations for an EAF
producing 81.5 tons of steel per heat, 16 heats per day, 365 days per year.
Case:
Operation:
Anthracite in
Pittsburgh
mill
By-product
recovery coke in
Pittsburgh
mill
Anthracite in East
Chicago mill
Heat-recovery coke in East
Chicago mill
Charge and injection carbon
26,846 34,337 26,920 38,872
Flux 18,100 18,100 21,400 21,400
Electrode consumption
2,600
2,600
2,600
2,600
Oxy-fuel burners 17,100 17,100 17,100 17,100
Oil on scrap 2,930 2,930 2,930 2,930
Electricity 100,428 100,428 177,771 177,771
TOTAL 168,004 175,495 248,721 260,673
The electricity production term dominates the carbon footprint for an EAF, in keeping
with the reputation of these furnaces as being enormous consumers of electricity. When
anthracite is compared with metallurgical coke for hypothetical plants in the same
location, anthracite still provides a slight benefit in reduced carbon footprint, about 4%
in each case.
11.6. Discussion of comparative carbon footprints for metallurgical coke and
anthracite in an EAF
11.6.1. Drying
The moisture specifications for EAF carbons have been provided above [Carbones,
2015]. According to Jones et al. [2012], metallurgical coke used as EAF charge carbon
typically has 1–2% moisture, which is easily within those specifications. The Lattimer
coarse blend contains 5% moisture [Lowe, 2014a], which satisfies the Carbones
specifications for charge carbon. However, injection carbon (foamy slag carbon) is in a
size range, 0.2–3.0 mm, which is roughly equivalent to barley number 4 blend in size.
That product is at 10% moisture, and would need to be dried to nominally 3% moisture
to meet injection carbon specifications.
It was presumed that the moisture reduction would be achieved by thermal drying, i.e.,
contacting the coal particles with hot gases. Operating data for a Roto-Louvre dryer
[Porter et al., 1973] were adapted. It was assumed that anthracite of 10% moisture
would be dried to 3% moisture, using natural gas as the fuel to produce the hot
combustion gases. Using the known performance of such a unit for drying coke, the
carbon dioxide emission for the drying (i.e., from combustion of the gas) is 40.8 lb CO2
per ton of 3% moisture anthracite produced. The dryer also has an energy requirement
of 3 kWh per ton of product. Assuming electricity generation in Pennsylvania, this
contributes another 3.2 lb of CO2, and very small amounts of methane and nitrous
oxide.
43
11.6.2. Slag foaming
By definition, a foam is a gas-liquid mixture in which the volume of gas is larger than
that of the liquid [de Decker and Boonstra, 1971]. Two assumptions were made about
the slag foam: first, that EAF operation would expect the same volume of slag foam
regardless of which foamy slag carbon was used; second, to achieve the same volume of
foam, it would be important to generate the same volume of CO from each carbon. A
comparison of anthracite and metallurgical coke with regard to slag foaming comes
down to the relative quantities needed to generate the same volume of carbon monoxide,
which depends on their carbon contents. It was also assumed that the EAF would be at
the same temperature and pressure when using anthracite or coke, so that the volume
of carbon monoxide would depend only on the mass produced.
For the range of injection plus charge carbon usage of 4.4 to 26.4 pounds per ton of
steel produced [Jones et al., 2012], the mid-point would be 15.4. Using coke from by-
product recovery ovens as the base case, with 84.6% carbon, dry basis (Section 5,
above), this charge will generate 30.4 pounds of carbon monoxide per ton of steel. Coke
from heat-recovery ovens, with 84.0% carbon, dry basis, requires 15.5 pounds of coke
to generate the same quantity of CO. Lattimer Mammoth vein anthracite, 85.6% carbon
dry basis [Lowe, 2014a], would require 15.2 pounds.
For the 100-ton capacity EAF assumed in this project, the amounts of foamy slag
carbons required to maintain slag foaming at a consistent level would be 1540 pounds
of by-product recovery coke, 1550 pounds of heat-recovery coke, or 1520 pounds of
anthracite. Switching completely from coke to anthracite would require no adjustments
to materials handling equipment or procedures. Because these amounts have been
calculated to generate a comparable amount of carbon monoxide for slag foaming, in
each case the carbon dioxide emissions attributable to converting CO to CO2 would be
the same, i.e., 4780 pounds of CO2 from the 100-ton EAF, or 47.8 pounds per ton of
steel produced.
Table A-11 shows that ash yields from by-product recovery coke, heat-recovery coke,
and anthracite are different. The weights of slag produced, at the charge rates discussed
above, will be also be different, as will the volumes of slag. A melt phase formed from
the ashes of coke or anthracite with nominally 10% iron oxide would have a density of
172 pounds per cubic foot [Turkdogan and Fruehan, 2012]. Anthracite ash would
produce about 25% less volume of slag than ash from by-product recovery coke. These
data are summarized in Table A-18. A minimum slag volume is desired in EAF operation
[anon., 2003], so this result is an apparent advantage for anthracite compared to coke.
However, as explained next, ash contributed from injection carbon represents only a
very small fraction of the slag in an EAF, so distinctions between ash yields from the
various carbons are “in the noise.”
11.6.3. Slag chemistry
To calculate carbon footprint, the quantity of slag produced and the amount of flux
required must be known. The versatility of the EAF provides a very large number of
possible scenarios for slag production and composition. To establish a baseline, two
assumptions were made: that the EAFs would be used to produce carbon steel (not

44
specialty alloys); and, that it would be reasonable to adopt published operating data for
an existing EAF of similar size.
Slag amounts to 299 pounds per ton of steel, based on data for a 99-ton EAF [Apfel,
2011]. When iron is oxidized to iron oxide (FeO), the oxide enters the slag and represents
a yield loss of iron metal; i.e., 100 tons of scrap input does not result in 100 tons of
liquid steel output. The extent of iron oxidation is related to the amount of dissolved
oxygen.
The median carbon content for sixteen grades of electric-furnace steel is 0.185%
[Eshbach and Souders, 1975], equivalent to 0.015% dissolved oxygen [Goel et al., 2005].
Based on the relationships of dissolved oxygen to FeO formation [anon., 2003], this
dissolved oxygen is equivalent to 23.7% FeO in the slag. Loss of iron to the slag amounts
to 18.5% (because FeO is 78% Fe), equivalent to a yield of liquid metal of 81.5%. Using
the slag rate discussed above, a furnace making 81.5 tons of molten product will
produce 12.2 tons of slag.
From the quantities of foamy slag carbons required and their respective ash yields, the
amount of ash—assumed to melt directly to slag—is 0.07–0.10 tons. Since the total slag
production is 12.2 tons, the advantage enjoyed by anthracite is swamped by the much
larger amount of slag coming from the oxidation of components of the charge and from
the flux. Slag contributed by the injection and charge carbon amounts only to about
0.8% of the total slag.
Data from the 99-ton EAF [Apfel, 2011] includes a slag composition, shown in Table A-
19. (These data only sum to 81.5%, for which Apfel gives no reason. The data were used
in the subsequent calculations because they presumably represent a direct analysis of
a slag from an actual operating EAF.) The amount of material coming from the flux—
calcium and magnesium oxides—is, in total, 32.6%, so the balance must come from
oxidation of the charge.
Two further assumptions were made: first, flux would be added as limestone, and not
“burned” to calcium and magnesium oxides; and second, calcium and magnesium have
equivalent chemical effects in the slag. The second assumption is supported by the
literature [e.g., Turkdogan and Fruehan, 2012] and from the mathematical form of
formulas for calculation of slag basicity [anon., 2003]. The flux must supply 3.98 tons
(i.e., 32.6% of 12.2 tons) of calcium and magnesium oxides.
Butler County, Pennsylvania limestone supplies 0.943 tons of calcium carbonate and
0.014 tons of magnesium carbonate per ton of limestone (Table A-8), equivalent to 0.535
tons of (CaO + MgO). Hence 3.98 tons of this flux will be required. The carbon dioxide
emission from conversion of the carbonates to oxides totals 3.13 tons, or 0.038 tons
CO2 per ton of steel produced. Treating data for DuPage County, Illinois limestone in
the same way results in 0.491 tons (CaO + MgO) per ton of flux, and CO2 emissions of
3.64 tons, or 0.045 tons of CO2 per ton of steel.
45
11.6.4. Comparison of anthracite and metallurgical coke in EAF operation
Anthracite can be used as injection and charge carbon in an electric arc furnace.
Nothing in the literature, or in the findings of this project, suggests otherwise. The
amount that would be used is similar to the amount of metallurgical coke that could be
used. An EAF facility could switch to the use of anthracite without requiring any
changes to materials handling equipment or procedures. Use of coal in EAFs has been
criticized because of variable quality of the coal [Goel et al., 2005]. However, this
represents a potential opportunity in that a demonstrated ability to deliver a product of
consistent quality over a long period of time could represent a good selling point.
In any application in which anthracite can displace metallurgical coke, there will always
be an advantage to anthracite, in terms of carbon footprint, because the coking
operation is eliminated. In EAF operations, the amount of injection carbon used is much
smaller than fuel consumption in a blast furnace. While the carbon footprint advantage
for anthracite is real, it is not so dramatic as in the blast furnace case. Any slight
differences in slag behavior caused by differences in ash composition of anthracite or
metallurgical coke will be swamped by the small quantity of injection-carbon ash relative
to the slag coming from the oxidation of components of the charge and from the flux.
11.6.5. Changes in carbon footprint by replacement of coke with anthracite
Carbon footprints for carbon applications in an EAF include contributions from mining,
washing, and transportation of the coal; coking the bituminous coals; consumption of
the injection and charge carbons in the furnace; drying the anthracite to be used as
injection carbon; and from the flux. Although the contribution of injection carbon ash
to the slag is only a tiny fraction of the total weight of slag, the furnace flux requirement
was included in the carbon footprint calculations to comparable with the blast furnace
case. The significant amount of electricity consumed by an EAF was also included.
Subsection 11.6.2 showed that carbon dioxide emissions associated with slag foaming
would be identical regardless of the carbon used, assuming that the objective is to
generate the same volume of carbon monoxide for foaming in each case. The CO2
emission would be 48 pounds per ton of steel produced.
The CO2 emissions associated with mining, washing, transporting, and coking the
injection carbons also must be accounted for. The CO2 emissions per pound of the two
types of coke and of anthracite, combined with the amounts of these materials discussed
above, make it possible to determine emissions, per ton of steel produced, for mining,
washing, transporting, and coking each of the carbons. The key difference is that
anthracite does not pass through a coke oven, with some additional advantage from the
fact that the anthracite is primarily surface-mined.
Converting emissions on a ton of steel basis to a carbon footprint was done by assuming
that the yield of liquid steel would be 81.5 tons per heat, running 16 one-hour heats per
day, and 365-day operation. A furnace this size could require only some 60 minutes
between charging cold scrap and tapping molten steel [Miller et al., n.d.] It was
presumed that maintenance could be done during the roughly eight hours of down time
46
per day (alternatively, the furnace could operate for 24 heats per day for some period of
time, and then be taken out of service for several days of maintenance).
EAF operation inevitably results in wastage of graphite from the electrodes due to
oxidation. EPA data for electrode loss is 0.0015 tonnes of carbon per tonne of steel [EPA,
2003]. For an assumed 100-ton EAF, the carbon dioxide produced would be 0.55 tons,
or 0.0055 tons of CO2 (11 pounds) per ton of steel from the furnace.
Supplemental oxy-fuel burners “are now almost standard equipment” on EAFs [Jones
et al., 2012]. The natural gas used in these burners displaces a portion of the more
expensive electricity and graphite electrodes. A 100-ton furnace would have a burner
power of about 14 MW [Jones et al., 2012]. For 60-minute operation, energy
consumption is 14 MWh. Gas consumption, based on handbook density and heating
value, is 2140 pounds. Complete combustion produces 5883 pounds of carbon dioxide.
For a liquid metal yield of 81.5 tons, the CO2 emission per ton of steel is 72 pounds.
Scrap steel, especially merchant scrap, could have oil or grease on it. Burning these
lubricants in the furnace, or final destruction of VOCs (from the lubricants) in the DES,
will contribute some CO2. There appears to be no plausible way to estimate this
contribution. Even if a value for the proportion of merchant scrap in the total furnace
charge were assumed, unfortunately, no quantitative data are given for allowable oil or
grease contamination among the 125 different classifications of ferrous metal scrap
[ISRI, 2014]. All is that is said about machine shop turnings is that they must be free of
“excessive oil” [ISRI, 2014], without defining the term excessive. As an arbitrary
estimate, it was assumed that one ton of scrap would be wetted with a half-gallon of
lubricating oil, of 88.6% carbon content. Complete burning of the oil would contribute
12.3 pounds of carbon dioxide per ton of steel.
As noted above, median electricity consumption in EAFs is about 310 kilowatt-hours
per ton of steel produced. An additional 25% was estimated to cover ancillary
requirements, such as operation of the charging machinery, for a total of 388 kWh.
Then, the Energy Information Agency data [EIA, 2014a] for greenhouse gas emissions
for electricity generation in Pennsylvania and Indiana allowed determining the
emissions of carbon dioxide, methane, and nitrous oxide for the EAF electricity
consumption.
In 2012, the total U.S. steel production from EAFs was 52,414,000 tons [Norris, 2013].
If all electric furnaces used anthracite as the injection carbon the reduction of carbon
footprint would amount to about 650,000 tons CO2-e per year (using the Pittsburgh-
area mill as a base case), and would create a yearly demand for 900,000 tons of
anthracite.
47
Summary and Recommendations
12. Summary
This project has shown that there are significant reductions in carbon footprint that
could be achieved by replacing metallurgical coke by anthracite in blast furnaces. There
is also a reduction achievable by using anthracite in place of metallurgical coke as
injection carbon in an electric arc furnace, but in this case other contributions to the
carbon footprint overwhelm the comparatively small gains provided by anthracite.
These conclusions pertain to the boundaries established for this work: mining coal for
delivery to integrated steel mills in southwestern Pennsylvania and northwestern
Indiana, bituminous coal passing through by-product recovery and heat recovery coke
ovens, and the coke or anthracite being used in a blast furnace to produce iron, and
used as injection carbon in an electric arc furnace. Other potential contributions to the
carbon footprint were assumed to be outside the boundaries of the present project, such
as mining ore and flux and transporting them to the mills, producing graphite electrodes
for arc furnaces, and further processing of hot metal from the blast furnace or molten
steel from the arc furnace into finished, marketable steel products. Likely, these values
would be nearly identical regardless of whether anthracite or coke was used.
Though there is a clear advantage for anthracite relative to metallurgical coke, the main
source of that advantage is the fact that anthracite does not need to pass through a
coke oven before going to the blast furnace. Also, Pennsylvania anthracite is primarily
surface mined, with less methane release than from underground mines. Other places
in the coal-to-hot metal or coal-to-liquid steel chain show smaller advantages for
anthracite, but a conservative approach would consider these to be apparent
advantages. Possibly if different assumptions had been made regarding, say, number
and sources of bituminous coals, choice of available fluxes, or ash compositions, the
apparent small advantages for anthracite might have become small advantages for
metallurgical coke instead. However, there does not seem to be any likely change in
blast furnace or coke-making technology that could overcome the significant advantage
that comes from not having to process anthracite in a coke oven.
13. Recommendations
Anthracite is a unique material that has many possibilities for direct use, or conversion
to, value-added products [Andrésen et al., 2004]. The suggestions given below are
confined only to topics relevant to the present project.
It appears that the possible replacement of metallurgical coke by anthracite, either
partially or entirely, hinges on the thermal shock resistance of anthracite pieces in the
blast furnace. We could find no data to test our hypothesis that thermal shock is the
culprit, or on the particle size distribution of the shattered pieces after thermal shock
breaking has occurred. If there was interest in moving into the blast furnace market,
some tests of thermal shock and particle size distribution would be worth doing. They
would not require very sophisticated equipment, other than a high-temperature furnace.
48
Literature from the first half of the last century has contradictory information about the
suitability of anthracite as a blast furnace fuel. According to one source it is less
desirable than either coke or charcoal [Forsythe, 1922]; but another says, “the
characteristics of anthracite as a metallurgical fuel are not fully recognized,” and that,
“anthracite makes better pig iron than does coke” [Sweetser, 1938]. Since both authors
appear to be among the top-flight blast furnace technologists of their era, possibly their
strongly differing opinions derive from different quality anthracite used by each. This
raises the question of how the properties of anthracite, relevant to its ability to replace
coke, vary from one mine or seam to another. It also raises the question of whether there
are characteristics of anthracite that are measured routinely, such as the proximate or
ultimate analysis data, which might serve as predictors for some of the other properties
that relate to its possible use as blast-furnace fuel.
Anthracite briquettes can be used in a blast furnace as a replacement for coke [Eckerd
et al., 1964]. Though a higher blast temperature was required for anthracite than for
coke, otherwise the fuel rates, hot metal production rates, and slag volumes were
comparable to those obtained with coke. There was little evidence for breakage due to
heat. Possibly the use of briquettes would address the concerns about thermal shock.
It would be necessary to account for some increase in carbon dioxide emissions for the
various operations used in briquetting, but likely even the increased CO2 emissions
would be less than those from coke ovens.
If thermal shock due to rapid volatiles emission is indeed a stumbling block for using
anthracite in blast furnaces, the use of calcined anthracite might prove feasible. Loss of
volatiles, plus the energy required for the calcining, would add to the carbon footprint,
diminishing somewhat the advantage of anthracite relative to coke. There are a few
reports in the literature relating to addition of anthracite to a coke oven, as one of the
coals used in the blend. We did not follow up the effects of either calcining or blending
anthracite into a coke oven, with respects to impacts on carbon footprint. Both represent
potential ways of getting anthracite into the coke market.
On a visit to Minnesota’s Iron Range mining operations, we were informed that the
production of taconite pellets involves mixing the ore with, among other things, coke
[Herrmann, 2014]. The literature on iron ores and their preparation [e.g., Poveromo,
1999] suggests that this is not done; only bentonite clay and lime are used. However,
production of sintered ore involves addition of about five percent of “coke breeze or
anthracite” [Poveromo, 1999]. No information was obtained on whether coke breeze and
anthracite are interchangeable, or whether there are advantages of one relative to the
other. Pelletized ore is dominant in North America, but sintered ore dominates in most
other countries [Poveromo, 1999]. Further investigation might indicate possibilities for
increased use of anthracite at the expense of coke breeze.
Anthracite seems to be entirely suitable for use as an injection carbon in arc furnaces.
Because some literature sources suggest that “coal” (not indicating its rank) is not
desirable because of its variable quality, the demonstrated ability to supply a consistent
product over a period of time would be a good marketing point.

49
A larger market for anthracite in arc-furnace applications would be in manufacture of
graphite electrodes. Various attempts in this area have shown some potential for using
anthracite in electrode manufacture. To our knowledge, none has ever been carried
forward to make trial electrodes that could be tested in even a pilot-scale arc furnace.
With some additional developmental work in this area, there might be a possible
opportunity for a joint venture with a carbon company.
50
Bibliography
14. References cited in report
AISI (American Iron and Steel Institute), 2014. How steel is made.
http://www.steel.org/Making%20Steel/How%20Its%20Made.aspx
AIST (Association for Iron and Steel Technology), 2011. 2011 North American blast
furnace roundup. https://bookstore.aist.org/BookContents/PR-RU2011-3 1 Sample
Page.pdf
Ameco, 2007. Ameco expanding technologies.
www.ameco-tm.com/china/Ameco_global_product.pdf
American Process Systems, 2008. The next generation in mixing.
www.cmtnc.com/OptimaBlend.pdf
Anderson, R.A.; Polansky, T.S., 1960. Changes in coal sulfur during carbonization.
College of Mineral Industries (The Pennsylvania State University) Experiment Station
Special Report No. SR-19.
Andrésen, J.M.; Burgess, C.E.; Pappano, P.J.; Schobert, H.H., 2004. New directions for
non-fuel uses of anthracite. Fuel Processing Technology, vol. 85, pp. 1373-1392.
Anonymous, 2003. Steel plant training course. Section II. What is slag?
http://anfacal.org/media/Biblioteca_Digital/Siderurgica_y_Metalurgica/Steel_Plant_T
raining_Course.pdf
Anval, 2010. Bulk density chart. www.anval.net/downloads/bulkdensitychart.pdf
Apfel, J., 2011. Electric arc furnace slag—a product not waste: saving or earning money
by using slag as building material. Badische Stahl-Engineering GmbH Report.
http://www.bse-
kehl.de/wEnglisch/Downloads/publications_pdf/Electric_Arc_Furnace_Slag___a_prod
uct_not_waste.pdf
ArcelorMittal, 2015. Our mining operations. http://corporate.arcelormittal.com/what-
we-do/mining/operations
Barnes, J.H.; Smith, R.C., 2001. The nonfuel mineral resources of Pennsylvania.
Pennsylvania Geological Survey Educational Series No. 12.
Beckstrom, C., 2008. Calculation methodology for greenhouse gas emissions.
http://www.portoflosangeles.org/EIR/SPWaterfront/DEIR/AppxD4_GHG.pdf
Bellen, M., 2003. Graphite production and further processing.
www.carbonandgraphite.org/pdf/graphite_production.pdf.
Berdowski, J.J.M.; Verhoeve, P.; Veldt, C., 2003. Solid fuel transformation plants.
www.eea.europa.eu/.../group_04.pdf
51
Biswas, A.K., 1981. Principles of Blast Furnace Ironmaking. Cootha Publishing House:
Brisbane; p. 9, 302, 413.
BNSF, 2014. BNSF customers reduce CO2 emissions by more than 30 million metric
tons in 2013 shipping by rail. www.bnsf.com/media/news-
release/2014/march/2014.03-06a.html
Boucher, D.F.; Alves, G.E., 1973. Fluid and particle mechanics. In: Chemical Engineers’
Handbook (Perry, R.H.; Chilton, C.H., eds.) McGraw-Hill: New York; Section 5.
Bruce, J.M., 1978. The Orgreave project. In: Coal, Coke, and the Blast Furnace. The
Metals Society: London; pp. 132-134.
Burgo, J.A., 1999. The manufacture of pig iron in the blast furnace. In: The Making,
Shaping and Treating of Steel. Ironmaking Volume. (Wakelin, D.W., ed.) Association for
Iron and Steel Technology: Warrendale, PA; Chapter 10.
Carbones Holding Gmbh, 2015. Anthracite charge coal; Anthracite injection coal.
www.carbones.at/eng/Products/Anthracite-coal
Chen, Y.; Guo, Z.; Wang, Z.; Feng, G., 2009. NOx reduction in the sintering process.
International Journal of Minerals, Metallurgy, and Materials, vol. 16, pp. 143-148.
Cheng, A., 2001. Coke quality requirement for blast furnace. Part 7. Iron & Steelmaker,
vol. 28, no. 7, pp. 75-77.
Christie, D.H.; Kearton, C.J.; Thomas, R., 1972. Practical application of mathematical
models in ironmaking. In: Blast Furnace Technology: Science and Practice. (Szekely, J.,
ed.) Marcel Dekker: New York; pp. 115-170.
Clendenin, J.D., 1969. Coal and coke. In: Blast Furnace—Theory and Practice
(Strassburger, J.H., ed.) Gordon and Breach: New York; Chapter VIII.
Craig, G.H.; Holowaty, M.O.; Squarcy, C.M., 1969. Blast-furnace history. In: Blast
Furnace—Theory and Practice (Strassburger, J.H., ed.) Gordon and Breach: New York;
Chapter I.
Dalian Huarui, 2014. Coke oven machinery.
Huaruijiaolu,en.alibaba.com/product/971057509-
291183775/5_5m_Coal_Cum_Coke_Pushing_Car_For_Coke_Oven_Battery.html
Daniels, J.; Moore, L.D., 1907. The ultimate crushing strength of coal. Engineering and
Mining Journal vol. 83, pp. 263-268.
de Decker, K.; Boonstra, B.B., 1971. Gas dispersions. Two-phase systems involving gas.
In: Elasticity, Plasticity and Structure of Matter. (Houwink, R.; de Decker, H.K., eds.)
Cambridge University Press: Cambridge; p. 149.
Diamond, W.P.; LaScola, J.; Hymon, D.H., 1986. Results of direct-method determination
of the gas content of U.S. coalbeds. U.S. Bureau of Mines Information Circular No. 9067.
52
Dickakian, G., 1984. A pitch from coal distillate feedstock. U.S. Patent Application No.
EP0099753 A1.
Drew, T.B.; Genereaux, R.P., 1941. Flow of fluids. In: Chemical Engineers’ Handbook
(Perry, J.H., ed.) McGraw-Hill: New York; Section 6.
DTS, 2013. Bulk material handling equipment.
www.dneprotechservice.com/upload/DTSGroup-
BulkMaterialHandlingEquipment_LQ_pdf.
Eble, C.; Weisenfluh, J., 2012. Metallurgical coal resources in eastern Kentucky.
energy.ky.gov/fossil/Documents/MetCoalResourcesinKentucky.pdf
Eckerd, J.W.; McKeever, R.E.; Sanner, W.S.; Woolf, P.L., 1964. Anthracite metallurgical
briquets as blast furnace fuel. U.S. Bureau of Mines Report of Investigations No. 6383.
EIA, 2014a. Voluntary reporting of greenhouse gases program.
http://www.eia.gov/oiaf/1605/ee-factors.html
EIA, 2014b. State electricity profiles. www.eia.gov/electricity/state/
EIA, 2014c. Coal production and number of mines by state, county, and mine type,
2013. http://www.eia.gov/coal/annual/pdf/table2.pdf
EPA (Environmental Protection Agency), 2003. Direct emissions from iron and steel
production.
http://www.epa.gov/climateleadership/documents/resources/ironsteel.pdf
EPA, 2013. Glossary of climate change terms.
http://www.epa.gov/climatechange/glossary.html#C
EPA, 2014. Overview of greenhouse gases.
http://epa.gov/climatechange/ghgemissions/gases/ch4.html
EPA-OAP, 2015. Inventory of U.S. greenhouse gas emissions and sinks, 1990-2013.
http://www.epa.gov/climatechange/pdfs/usinventoryreport/US-GHG-Inventory-
2015-Main-Text.pdf.
Eshbach, O.W.; Souders, M., 1975. Handbook of Engineering Fundamentals. Wiley: New
York; p. 1360-1363.
Evans, I.; Pomeroy, C.D., 1966. The Strength, Fracture and Workability of Coal.
Pergamon Press: Oxford; Chapter 3.
“Explore Minnesota: Iron Ore”, 2013. mn.gov/irrb/images/IronOre.pdf
Fish, L., 2003. Carbons for steelmaking.
www.asbury.com/ppt/CarbonsForSteelmaking.ppt
Forsythe, R.; Meissner, C.A.; Mohr, J.A., 1922. The Blast Furnace and the Manufacture
of Pig Iron. U.P.C. Book Company: New York; p. 65-69, 82.
53
Fritz, S.G., 2000. Diesel fuel effects on locomotive exhaust emissions. Southwest
Research Institute Report No. 08.02062.
Fuel Economy, 2014. Reduce climate change.
http://www.fueleconomy.gov/feg/climate.shtml
Furnas, C.C., 1929. Flow of gases through beds of broken solids. U.S. Bureau of Mines
Bulletin 307.
Geerdes, M.; Toxopeus, H.; van der Vliet, C., 2009. Modern Blast Furnace Ironmaking.
IOS Press: Amsterdam; Chapter 2.
Geobytes, 2003. City distance tool. www.geobytes.com/CityDistanceTool.htm
GHG, 2005. Calculating CO2 emissions from mobile sources.
www.ghgprotocol.org/files/ghgp/tools/co2-mobile.pdf.
Gilmore, R.E.; Nicolls, J.H.H.; Connell, G.P., 1935. Coal friability tests. Canada
Department of Mines Division of Fuel Testing Report No. 762.
Goel, S.K.; Kapoor, M.L.; Mathur, V.N.S.; Kaushel, G.C., 2005. Production of Quality
Steels in Mini Steel Plants. Khanna Publishers: Delhi; p. 37-40, 53, 64.
Grainger, L.; Gibson, J., 1981. Coal Utilisation: Technology, Economics and Policy.
Graham and Trotman: London; p. 139-140, 153.
Granda, M.; Santamaría, R.; Menéndez, R., 2003. Coal tar pitch: Composition and
pyrolysis behavior. In: Chemistry and Physics of Carbon, Volume 28. (Radovic, L.R.,
2003) CRC Press: Boca Raton, FL; Chapter 4.
Hazen, S.W., 1967. Some statistical techniques for analyzing mine and mineral-deposit
sample and assay data. U.S. Bureau of Mines Bulletin No. 621.
Herrmann, R., 2014. Personal communication on production of taconite pellets,
Biwabik, Minnesota, September 20.
Higuchi, M.; Iizuba, M.; Kuroda, K.; Nakayama, N.; Saito, H., 1978. Coke quality
required for operation of large blast furnaces. In: Coal, Coke, and the Blast Furnace. The
Metals Society: London; pp. 19-28.
Higman, C.; van der Burgt, M., 2008. Gasification. Gulf Professional Publishing:
Burlington, MA; p. 38.
Horsman, M., 2013. The importance of lime. https://www.harrells.com/blog/im-lime
Howard, J.C., 1981. Fundamentals of coal pyrolysis and hydropyrolysis. In: Chemistry
of Coal Utilization. Second Supplemental Volume. (Elliott, M.A., ed.) Wiley: New York;
Chapter 12.
Institute of Scrap Recycling Industries, 2014. Scrap Specifications Circular 2014. ISRI:
Washington.
54
Irving, W.; Tailakov, O., 2003. CH4 emissions: Coal mining and handling.
http://www.ipcc-nggip.iges.or.jp/public/gp/bgp/2_7_Coal_Mining_Handling.pdf
Johnson, J.E., 1918. The Principles, Operation and Products of the Blast Furnace.
McGraw-Hill: New York; p. 79-80. (Our copy is a digitized reprint from General Books
LLC: Memphis, 2012—page numbers refer to the reprint.)
Jones, J.A.T.; Bowman, B.; Lefrank, P.A., 2012. Electric furnace steelmaking. In: The
Making, Shaping and Treating of Steel—Steelmaking and Refining Volume. (Fruehan,
R.J., ed.) Association for Iron and Steel Technology: Warrendale, PA; Chapter 10.
Jones, C.M., 2011. Carbon footprint of typical U.S. household.
http://coolclimate.berkeley.edu/footprint
Joseph, T.L., 1969. The blast-furnace process. In: Blast Furnace—Theory and Practice.
(Strassberger, J.H., ed.) Gordon and Breach: New York; Chapter II.
Kecojevic, V., 2015. West Virginia University. Email correspondence, February 5.
Kecojevic, V.; Vukotic, I.; Komljenovic, D., 2014. Production, consumption, and cost of
energy for surface mining of bituminous coal. Mining Engineering vol. 66, pp. 51-57.
Keene, W.L.; Turner, H.G.; Scott, G.S., 1934. Reactivity of anthracite with carbon
dioxide. Transactions of the American Institute of Mining and Metallurgical Engineers vol.
108, pp. 303-323.
Kentucky, 2014. Kentucky coal facts 2014.
Energy.ky.gov/CoalFactsLibrary/KentuckyCoalFacts-14thEdition(2014).pdf
Kim, A.G., 1973. The composition of coalbed gas. U.S. Bureau of Mines Report of
Investigations No. 7762.
Kreisinger, H.; Ovitz, F.K.; Augustine, C.E., 1916. Combustion in the fuel bed of hand-
fired furnaces. U.S. Bureau of Mines Technical Paper No. 137.
Lamar, J.E., 1957. Chemical analyses of Illinois limestones and dolomites. Illinois
Geological Survey Report of Investigations No. 200.
Langdon, N.M., 1910. The limit of fuel economy in the iron blast furnace. Transactions
American Institute of Mining Engineers, vol. 40, pp. 614-635.
Lehrman, A.; Blumenschein, C.D.; Doran, D.J.; Stewart, S.E., 1999. Steel plant fuels
and water requirements. In: The Making, Shaping and Treating of Steel. Ironmaking
Volume. (Wakelin, D.W., ed.) Association for Iron and Steel Technology: Warrendale, PA;
Chapter 6.
Lowe, T., 2014a. Blaschak Coal Corporation. Email correspondence, July 9.
Lowe, T., 2014b. Blaschak Coal Corporation. Email correspondence, July 31.
Lowe, T., 2014c. Blaschak Coal Corporation. Email correspondence, December 4.
55
Manger, G.E., 1963. Porosity and bulk density of sedimentary rocks. U.S. Geological
Survey Bulletin No. 1144-E.
Mayers, M.A., 1945. The physical properties and reactivity of coke. In: Chemistry of Coal
Utilization (Lowry, H.H., ed.) Wiley: New York; Chapter 24.
McMullen, O.W., 1936. Metallurgy of Iron and Steel. International Textbook Company:
Scranton, PA; p. 2.
Meyer, A., 2014. Blaschak Coal Corporation. Email correspondence, December 8.
Miller, F.P.; Vandome, A.F.; McBrewster, J., n.d. Electric Arc Furnace. Alphascript
Publishing, Books on Demand: Norderstedt, Germany; pp. 3-4.
Mochida, I.; Fujimoto, K.; Oyama, T., 1993. Chemistry in the production and utilization
of needle coke. In: Chemistry and Physics of Carbon. Volume 24 (Thrower, P.A., ed.) CRC
Press: Boca Raton, FL; Chapter 3.
Moore, D., 2011. Coke data. www.cementkilns.co.uk/data.coke.html
Munson, J.G.; McHenry, W.L.; Brayton, W.E.; Shoenberger, R.W., 1978. Coal preheating
for better blast-furnace coke. In: Coal, Coke, and the Blast Furnace. The Metals Society:
London; pp. 124-131.
Norris, P., 2013. Steel Statistical Yearbook 2013. World Steel Association: Brussels; p.
23, 89.
Oak Ridge National Laboratory, 2011. Lower and higher heating values of gas, liquid,
and solid fuels.
http://cta.ornl.gov/bedb/appendix_a/Lower_and_Higher_Heating_Values_of_Gas_Liqu
id_and_Solid_Fuels.pdf
Ode, W.H., 1967. Coal. In: Marks’ Standard Handbook for Mechanical Engineers.
(Baumeister, T., ed.) McGraw-Hill: New York; p. 7-4.
O’Neill, B.J., 1976. The distribution of limestones containing at least 90 percent CaCO3
in Pennsylvania. Pennsylvania Department of Environmental Resources Mineral
Resources Report No. 50.
Pennsylvania Crusher, 2004. “Handbook of crushing.” Pennsylvania Crusher: Broomall,
PA, Bulletin No. 4050D.
Perch, M.; Muder, R.E., 1974. “Coal carbonization and recovery of coal chemicals.” In:
Riegel’s Handbook of Industrial Chemistry. (Kent, J.A., ed.) Van Nostrand Reinhold: New
York; Chapter 8.
Perch, M., 1981. Solid products of pyrolysis. In: Chemistry of Coal Utilization, Second
Supplemental Volume (Elliott, M.A., ed.) Wiley: New York; Chapter 15.
Perrott, G.St.J.; Fieldner, A.G., 1923. The properties of metallurgical coke. Proceedings,
American Society for Testing and Materials vol. 23, Part II, pp. 475-493.
56
Perrott, G.S.; Kinney, S.P., 1923. Combustion of coke in blast-furnace hearth.
Transactions American Institute of Mining Engineers, vol. 69, pp. 543ff.
Porter, H.F.; McCormick, P.Y.; Lucas, R.L., Walls, D.F., 1973. Gas-solid systems. In:
Chemical Engineers’ Handbook (Perry, R.H.; Chilton, C.H., eds.) McHraw-Hill: New York;
Section 20.
Poveromo, J.J., 1999. Iron ore. In: The Making, Shaping and Treating of Steel.
Ironmaking Volume. (Wakelin, D.W., ed.) Association for Iron and Steel Technology:
Warrendale, PA; Chapter 8.
Price, P.H.; Headlee, A.J.W., 1943. Natural coal gas in West Virginia. Bulletin of the
American Association of Petroleum Geologists. vol. 27, pp. 529-537.
Quanci, J.F., 2011. Recent trends in heat-recovery cokemaking processes.
http://www.abmbrasil.com.br/cim/download/RecentTrendsinHeatRecoveryCokemaki
ng_JohnQuanci.pdf
Sandvik, 2009. CM400 series hammer mills.
www.miningandconstruction.sandvik.com/sandvik/0120/Poland/5004947.nsf/Alldoc
s/Products*5CCrushers*and*screens*5CHammer*mills*2
Smith, T.; Wilkinson, H.C., 1962. The measurement of reactivity of coke; (a)
Development of a shortened C.A.B. test; (b) Examination of an alternative method for
reactivity measurements. Journal of the Institute of Fuel vol. 35, pp. 220-224.
Spath, P.L.; Mann, M.K.; Kerr, D.R., 1999. Life cycle assessment of coal-fired power
production. National Renewable Energy Laboratory Report No. NREL/TP-570-25119.
Sun, L.; Liu, Y.; Zhai, C.; Zhou, H., 2012. Process simulation of an integrated coke dry
quenching combined gasification. Petroleum and Coal. Vol. 54, pp. 34-41.
Sundholm, J.L.; Valia, H.S.; Kiessling, F.J.; Richardson, J.; Buss, W.E., Worberg, R.;
Schwarz, U.; Baer, H.; Calderon, A.; DiNitto, R.G., 1999. Manufacture of metallurgical
coke and recovery of coal chemicals. In: The Making, Shaping and Treating of Steel.
Ironmaking Volume. (Wakelin, D.W., ed.) Association for Iron and Steel Technology:
Warrendale, PA; Chapter 7.
Sweetser, R.H., 1909. Charcoal and coke as blast furnace fuels. Transactions American
Institute of Mining Engineers, vol. 39, pp. 228-235.
Sweetser, R.H., 1935. Blast furnace fuels—anthracite coal. Transactions American
Institute of Mining and Metallurgical Engineers, vol. 116, pp. 53-63.
Sweetser, R.H., 1938. Blast Furnace Practice. McGraw-Hill: New York; p. 119, 120, 127,
134, 147, 170, 340.
Thibault, C.G., 1963. Solid products of carbonization. In: Chemistry of Coal Utilization,
Supplemental Volume (Lowry, H.H., ed.) Wiley: New York; Chapter 12.
57
Trent, V.A.; Medlin, J.H.; Coleman, S.L.; Stanton, R.W., 1982. Chemical analyses and
physical properties of 12 coal samples from the Pocahontas field, Tazewell County,
Virginia, and McDowell County, West Virginia. U.S. Geological Survey Bulletin No. 1528.
Turkdogan, E.T.; Fruehan, R.J., 2012. Fundamentals of iron and steelmaking. In: The
Making, Shaping and Treating of Steel—Steelmaking and Refining Volume. (Fruehan,
R.J., ed.) Association for Iron and Steel Technology: Warrendale, PA; Chapter 2.
Valia, H.S., 2015. Coke production for blast furnace ironmaking.
http://www.steel.org/Making%20Steel/How%20Its%20Made/Processes/Processes%2
0Info/Coke%20Production%20For%20Blast%20Furnace%20Ironmaking.aspx
Vallero, D., 2014. Fundamentals of Air Pollution. Academic Press: San Diego; p. 209.
Van Krevelen, D.W., 1993. Coal: Typology – Physics – Chemistry – Constitution. Elsevier:
Amsterdam; Chapter 23.
Wakelin, D.H. (editor), 1999. The Making, Shaping and Treating of Steel. Association for
Iron and Steel Technology: Warrendale, PA.
Walter Energy, 2015. Coal operations. http://walterenergy.com/business-profile/our-
operations/coal-operations/
West Virginia, 2012. 2012 Coal production and employment by county.
www.wvminesafety.org/STATS.HTM
Wilkinson, H.C., 1986. The high temperature properties of coke. Commission of the
European Communities Technical Coal Research Report No. EUR 10430 EN.
Wolfe, M.E., 2008. High-calcium limestones in Ohio. Ohio Department of Natural
Resources Geofacts No. 25.
Wozek, J., 2013. The Sun Coke energy perspective.
www.thecoalinstitute.org/ckfinder/userfiles/files/JWozekSunCokeNCCISpring2013.p
df
Yancey, H.F.; Geer, M.R., 1945. Hardness, strength, and grindability of coal. In:
Chemistry of Coal Utilization (Lowry, H.H., ed.) Wiley: New York; Chapter 5.
Yancey, H.F.; Johnson, K.A.; Selvig, W.A., 1932. Friability, slacking characteristics, low-
temperature carbonization assay, and agglutinating value of Washington and other
coals. U.S. Bureau of Mines Technical Paper No. 512.
15. Sources used for background information
(The resources listed below were read and reviewed as sources of general information on
the topics of this report, but did not contain data or information specifically cited in the
text of the report.)
Anonymous, 2011. BNSF touts ‘green’ performance. World Trade, vol. 100, p. 12.
58
Belden, A.W., 1913. Metallurgical coke. U.S. Bureau of Mines Technical Paper No. 50.
Berczynski, F.A., 1972. The blast furnace—a transition. In: Blast Furnace Technology:
Science and Practice. (Szekely, J., ed.) Marcel Dekker: New York; pp. 337-374.
Brown, D.C.; Kinsey, F.W., 1969. General considerations of blast furnace burden
materials. In: Blast Furnace—Theory and Practice. (Strassberger, J.H., ed.) Gordon and
Breach: New York; Chapter III.
Chace, F.M.; Stone, J.G., 1969. Iron ore and fluxstones. In: Blast Furnace—Theory and
Practice. (Strassberger, J.H., ed.) Gordon and Breach: New York; Chapter IV.
Chang, R.; Tikkanen, W., 1988. The Top Fifty Industrial Chemicals. Random House: New
York; Chapter 5.
Craig, G.H.; Holowaty, M.D.; Squarcy, C.M., 1969. Blast-furnace history. In: Blast
Furnace—Theory and Practice. (Strassberger, J.H., ed.) Gordon and Breach: New York;
Chapter I.
Elliott, J.F.; Popper, J., 1972. A mass-transport model of erosion of the carbon hearth
of the iron blast furnace. In: Blast Furnace Technology: Science and Practice. (Szekely,
J., ed.) Marcel Dekker: New York; pp. 171-200.
EPA, 2009. Coalbed methane outreach program.
http://www.epa.gov/coalbed/basic.html
Evans, I.; Pomeroy, C.D., 1958. The strength of cubes of coal in uniaxial compression.
In: Mechanical Properties of Non-Metallic Brittle Materials. (Walton, W.H., ed.)
Interscience Publishers: New York; Chapter 1.
Gilmore, R.E.; Nicolls, J.H.H., 1937. Significance of friability and size stability tests on
coal. American Society for Testing and Materials Proceedings vol. 37, pp. 421-435.
Griffith, W.; Connor, E.T.; Holmes, J.A.; Darton, N.H., 1912. Mining conditions under
the city of Scranton, Pa. U.S. Bureau of Mines Bulletin No. 25, pp. 77-82.
Gudenau, H.W.; Meier, L.; Schemann, V., 1998. Coke quality requirements for modern
blast furnace operation. Proceedings, 2nd International Conference on the Science and
Technology of Ironmaking. pp. 1067-1072.
Harbison-Walker Refractory Company, 1911. A Study of the Blast Furnace. Caxton
Company: Cleveland.
Heyman, J., 1999. The Science of Structural Engineering. Imperial College Press: London.
Himmelblau, D.M., 1982. Basic Principles and Calculations in Chemical Engineering.
Prentice-Hall: Englewood Cliffs, NJ; Chapter 2.
Jeran, P.W.; Lawhead, D.H.; Irani, M.C., 1976. Methane emissions from an advancing
coal mine section in the Pittsburgh coal bed. U.S. Bureau of Mines Report of
Investigations No. 8132.
59
Kambara, K.; Hagiwara, T.; Shigami, A.; Kondo, S.; Kanayamo, Y.; Wakabayashi, K.;
Hiramoto, N., 1977. Dissection of blast furnaces and their internal state. Transactions
of the Iron and Steel Institute of Japan vol. 17, pp. 371-380.
Kirchgessner, D.A.; Piccot, S.D.; Masemore, S.S., 2000. An improved inventory of
methane emissions from coal mining in the United States.
http://www.epa.gov/ttnchie1/ap42/ch14/related/mine.pdf
Kissell, F.N. (ed.), 2006. Handbook for methane control in coal mining. Department of
Health and Human Services Information Circular No. 9486.
Kissell, F.N.; Doul, M., 1974. The effect of coal breakage on methane emission.
Transactions—Society of Mining Engineers of AIME. vol. 256, pp. 182-184.
Kissell, F.N.; McCulloch, C.M.; Elder, C.H., 1973. The direct method of determining
methane content of coalbeds for ventilation design. U.S. Bureau of Mines Report of
Investigations No. 7767.
Kraner, H.M.; Baab, K.A., 1969. “Blast-furnace and stove refractories.” In: Blast
Furnace—Theory and Practice. (Strassberger, J.H., ed.) Gordon and Breach: New York;
Chapter X.
Kwasniewski, M., 2009. Testing and modeling of the anisotropy of tensile strength of
rocks. Proceedings, International Conference on Rock Joints and Jointed Rock Masses pp.
1-8.
Murray, P.; Williams, J.; Livey, D.T., 1958. Factors affecting the thermal shock
resistance of high-temperature materials. In: Mechanical Properties of Non-Metallic
Brittle Materials. (Walton, W.H., ed.) Interscience Publishers: New York; Chapter 15.
Nichols, H.W., 1922. “Models of blast furnaces for smelting iron.” Field Museum of
Natural History: Chicago; 10 pp.
O’Neill, H., 1937. The indentation hardness of coal. Journal of the Institute of Fuel vol.
10, p. 351.
Powell, K.A.; Rice, O.P., 1969. “Blast-furnace design, construction and equipment.” In:
Blast Furnace—Theory and Practice. (Strassberger, J.H., ed.) Gordon and Breach: New
York; Chapter IX.
Ramsey, J.W.; Brady, G.A.; Eckerd, J.W., 1965. “Relation of density and porosity data
to structural features of anthracite.” U.S. Bureau of Mines Report of Investigations No.
6657.
Sasaki, K.; Nakatani, F.; Katano, M.; Watanabe, M.; Shimoda, T.; Yokotani, K.; Ito, T.;
Yokoi, T., 1977. Investigation of quenched No. 2 blast furnace at Kokura Works.
Transactions of the Iron and Steel Institute of Japan vol. 17, pp. 252-261.
Sasaki, M.; Ono, K.; Suzuki, A.; Ohuno, Y.; Yoshizawa, K., 1977. Formation and melt-
down of softening-melting zone in blast furnace. Transactions of the Iron and Steel
Institute of Japan vol. 17, pp. 391-400.
60
Vogel, J.C.; Quass, F.W., 1937. The friability of South African coals. Journal of the
Chemical, Metallurgical and Mining Society of South Africa vol. 37, pp. 469-478, 553-556.
Wagner, H.C., 1953. “Constitution diagrams of Pennsylvania anthracite.” U.S.
Geological Survey Bulletin No. 945-A.
Yancey, H.F.; Zane, R.E., 1933. Comparison of methods for determining the friability of
coal. U.S. Bureau of Mines Report of Investigations No. 3215.
Zabetakis, M.G.; Moore, T.D.; Nagel, A.E.; Carpetta, J.E., 1972. Methane emission in
coal mines: Effects of oil and gas wells. U.S. Bureau of Mines Report of Investigations No.
7658.
61
Glossary
Ammonia liquor. A water solution that condenses from the vapor products leaving a by-
product recovery coke oven. It contains a variety of dissolved compounds, of which the
most important are various salts of ammonia. The ammonia is recovered for various
commercial uses, such as fertilizer production.
Available lime. (Also known as available base) The amount of calcium and magnesium
oxides remaining in a flux after reaction with the silicon and aluminum oxide impurities
in the flux material. Only the available base, not the total calcium or magnesium, is
available to act as a flux for the gangue and fuel ash.
Basicity ratio. In slag chemistry, this term refers to the ratio of calcium plus magnesium
oxides—which are considered to be bases—to silicon plus aluminum oxides in the slag.
The basicity ratio has been used to develop various empirical predictors of such slag
properties as viscosity and freezing temperature.
Battery. An individual coke oven is far too small to keep up with the demand for coke in
a blast furnace. It is standard practice to build coke ovens in multiple units, sometimes
thirty or more, side-by-side. The collective set of coke ovens is called a battery.
Bedding plane. In sedimentary rocks, including coals, the bedding plane is a surface
that separates one layer of the material that deposited eons ago from the preceding and
following layers. Bedding planes can sometimes be conspicuous to the unaided eye, and
often a material will break or split readily along the direction of the bedding plane.
Biodiesel. A diesel fuel made from naturally occurring plant oils, such as soybean oil. It
is sometimes argued that biodiesel is “carbon-neutral” in that the carbon dioxide
produced when it is burned as a fuel is removed from the atmosphere by the next year’s
crop of the plants.
Bosh is the hottest region of a blast furnace, where the reactions between the fuel and
air blast are occurring, and where the molten iron and slag accumulate.
Burden. In a blast furnace, burden is the collective term representing the amount of ore,
coke, and flux charged to the furnace.
By-product recovery coke oven. Currently the standard technology for production of
metallurgical coke, these ovens are configured so that—as the name implies—valuable
by-products, such as coal tar, light oils, and coke-oven gas, can be recovered and used
elsewhere or sold. Because of their tall, narrow configuration, by-product recovery coke
ovens are also sometimes called slot-type coke ovens.
Calcination. Generally, the thermal treatment of a mineral or ore that is intended to
cause a chemical decomposition of the material. The important calcination reaction in
blast-furnace chemistry is the conversion of natural carbonate fluxes, i.e., limestone or
dolomite, to the respective calcium and magnesium oxides, with the release of carbon
dioxide.
62
Carbon footprint. The total amount of greenhouse gases are emitted each year by a
person, family, building, organization or company, including greenhouse gas emissions
from fuel burned directly, greenhouse gases from producing…goods or services, and
emissions from power plants.
Charge carbon is carbon added to an electric arc furnace to consume excess oxygen and
maintain a reducing atmosphere during melt-down of the charge. Some sources use the
term sacrificial carbon for this application. Also, it should be noted that some literature
sources use the term charge carbon as a generic term for all carbon used in an electric
arc furnace, to include carbon used for recarburization of the metal and for producing
slag foam, which helps with heat transfer to the molten bath.
Choking is an upset or disturbance in blast furnace operation because the flow of molten
metal and/or slag through the coke bed into the hearth is impeded. Choking could lead
to a build-up of solidified slag or metal on the walls of the furnace hearth. Several factors
could contribute to furnace choking, one being the breakage of coke pieces in the lower
regions of the furnace shaft.
CO2-e. The carbon dioxide equivalent to an amount of greenhouse gas emitted. The
greenhouse gas emission is multiplied by the global warming potential to obtain the
carbon dioxide equivalent. For example, methane has a global warming potential of 21,
so an emission of 2 pounds of methane would be 42 pounds of equivalent carbon dioxide
(CO2-e).
Coal tar. A complex mixture of hundreds of organic compounds produced during
operation of a by-product coke oven, which separates by condensation from the vapors
leaving the oven. It is highly viscous, dark colored, denser than water, and has a
characteristic odor. A great many useful compounds or products can be recovered from
coal tar, including as examples naphthalene and creosote oil.
Coke breeze. Pieces of coke obtained from the coke oven that are too small (typically less
than half-inch) for use in the blast furnace. Coke breeze can be used elsewhere in the
plant and for sintering iron ore. In the old literature this material is sometimes called
coke braize.
Coke mess is a problem caused by the discharge of a large amount of fine coke along
with the metal and/or slag. One of the causes of coke mess is the trapping of small coke
particles in the slag. Coke mess results in delays in furnace operation, because it is not
possible to seal the tap hole until the troughs through which the slag or metal would
flow are thoroughly cleaned.
Coke oven gas. One of the several products of the by-product recovery coke oven. A
complex mixture of about a dozen compounds, of which the principal carbon-containing
compounds are carbon monoxide, carbon dioxide, methane, ethane, ethylene, and
acetylene. Coke oven gas is a useful fuel gas for heating coke ovens or other applications
in a steel mill, especially since it is “free” (i.e., it will be produced anyway during the
operation of the coke ovens).
63
Coke rate. The amount of coke needed to produce a given quantity of hot metal,
commonly expressed in units of tons of coke per ton of hot metal.
Coke wharf. An inclined platform, often relatively long but narrow, that receives the
quenched coke and temporarily retains it until it moves on for conveying and screening.
Dolomite. A very common rock-forming mineral of which usually 90% is a calcium
magnesium carbonate, often represented as CaMg(CO3)2. It is used as a flux in blast
furnace operations to reduce the melting temperature and viscosity of the slag, and
works by increasing the basicity ratio (see above) of the slag.
Dolomitic lime. A mixture of calcium and magnesium oxides produced by calcining
dolomite (calcium magnesium carbonate).
Emission factor. Broadly, an emission factor is a factor that relates the amount of a
pollutant (in this study, a greenhouse gas) to its effect or activity when released. This
relates to the concept of a carbon dioxide equivalent, CO2-e, defined above.
Endothermic. A chemical reaction that absorbs heat as it proceeds, i.e., for which heat
must be supplied in for it to occur. By far the most important of the endothermic
reactions in a blast furnace is the reduction of iron oxides.
Eutectic. In a simple two-component system, the eutectic is the lowest temperature at
which solid and liquid can be in equilibrium; in other words, it is the lowest
melting/freezing temperature in the system. Assuming that the pressure does not
change, there can only be one eutectic point in any given two-component system.
Ferroalloy is a generic term for alloys of iron with other elements, such as chromium,
vanadium, or manganese. Ferroalloys are used as additives in steelmaking operations
when it is desired to increase the amount of one or more alloying elements in the steel.
When a specific ferroalloy is referred to, it is identified as ferromanganese, ferrochrome,
etc.
Foamy slag carbon is carbon added to an electric arc furnace to produce a foamy slag,
which helps to increase the proportion of heat transferred to the molten bath, and to
reduce the proportion of heat lost by radiation to the furnace interior. The foamy slag
carbon is oxidized to gaseous carbon monoxide, which is the material actually
responsible for generating the foam. Because this form of carbon is usually injected into
the furnace when oxygen is also injected, it is also called injection carbon.
Fuel rate. This term was invented for this study to be used in a general sense when
either metallurgical coke or anthracite could be meant. It seemed more convenient than
something like metallurgical coke and/or anthracite.
Flux. Generally, a flux is any material that is used to reduce melting temperature and/or
reduce the viscosity of a liquid material. In blast furnace technology, the fluxes used are
naturally occurring carbonate rocks, limestone (calcium carbonate) or dolomite (calcium
magnesium carbonate).
Gangue. The portion of ore that has no value, but is unavoidably mined with the desired
components of the ore. In this specific case, gangue would be those minerals in the ore
64
that do not contain iron. Various processes are used to separate and remove the gangue;
in blast furnaces the gangue in iron ore is melted to form slag.
Geometric mean. In contrast to the familiar arithmetic mean, or average, which is
calculated by adding all the data and dividing by the number of observations, the
geometric mean is determined by multiplying all the data and then, for n observations,
calculating the n-th root of the product. The geometric mean is preferred when the
various observations do not increase or decrease by the same amount from one to
another, and, relative to the arithmetic mean, is less affected by extreme values in the
data. An alternative method for calculating the geometric mean is to sum the logarithms
of all the data, divide the sum by n, and take the antilogarithm of the quotient.
Global warming potential. A measure of the amount of energy that a particular gas (e.g.,
methane) would absorb in a hundred years, relative to carbon dioxide. If some
greenhouse gas has a global warming potential of, say, 50, one unit weight of that gas
would be equivalent to 50 units of carbon dioxide.
Greenhouse gas. A gas that traps energy, primarily infrared radiation, in the
atmosphere. The best-known greenhouse gas is carbon dioxide. Methane and nitrous
oxide also act as greenhouse gases. Many other compounds do as well, but only carbon
dioxide, methane, and nitrous oxide were considered for this project.
Heat-recovery coke oven. An emerging technology for production of metallurgical coke.
Unlike the by-product coke oven (defined above), in a heat-recovery coke oven all of the
volatile components of the coal are burned inside the oven to provide the heat necessary
to convert coal to coke. There are no chemical by-products. However, some of the heat
produced by the burning volatiles can be recovered and used, e.g., to raise steam.
Because no chemical products are recovered, these ovens are sometimes also known as
non-recovery coke ovens.
Hi-Cal lime. The oxide produced by calcining limestone, or nearly pure calcium
carbonate. Unlike Dolomitic lime (defined above), Hi-Cal lime is essentially pure calcium
oxide with minimal amounts of oxides of other elements, such as magnesium.
Hot metal. The primary product of the blast furnace, being approximately 95% iron,
with 2–5% carbon and smaller amounts of silicon, manganese, and phosphorus. In
many integrated steel mills the hot metal is never allowed to solidify, but is sent
immediately in the liquid form to one or more steel-making operations.
Injection carbon. This form of carbon is injected into the electric arc furnace during
operation, along with oxygen injection. A major function of injection carbon is to create
a foamy slag. Commonly used forms of injection carbon are metallurgical coke,
petroleum coke, and anthracite.
Larry car. Sometimes also referred to simply as a larry, this car travels on rails along
the top of a coke oven battery, carrying the weighed amount coal that will then be
charged into the ovens.
Light oil. One of the products of a by-product recovery coke oven. Light oil is a complex
mixture of condensable organic compounds, with a boiling range of ambient to 200°C
65
(390° F). The principal valuable components include benzene, toluene, and xylenes,
although several hundred compounds have been identified in light oil. Light oil floats on
water, a property that gives it its name and helps distinguish it from coal tar (above).
Lime, throughout this report, refers to calcium oxide, CaO, which is the product of
heating limestone. There is possible confusion because of the terminology surrounding
lime and its production. Limestone, CaCO3, is decomposed to lime, CaO, and carbon
dioxide. Because this process is commonly but incorrectly called “burning,” CaO is
sometimes referred to as “burnt lime.” It is also known as “quicklime.” CaO reacts with
moisture in the air, or by deliberate addition of water, to produce calcium hydroxide,
Ca(OH)2, which unfortunately is also often called “lime.” Calcium hydroxide is also
known as “slaked lime,” to distinguish it from burnt lime.
Limestone. A rock that consists primarily of calcium carbonate, CaCO3, and various
minor constituents. Limestone is used as a flux in blast furnaces to reduce viscosity
and melting temperature of the slag, by increasing the basicity ratio (see above) of the
slag.
Pelletizing. A process for preparing ore for shipment and use in a blast furnace. The iron
ore is ground and then concentrated to enhance the amount of iron oxide; then the
finely pulverized ore is mixed with clay and lime, and treated at mild temperature to
form roughly spherical pellets of about quarter- to half-inch diameter.
Pig iron. The solidified metal product (hot metal) from a blast furnace. If the hot metal
is not going to be used directly, as in an integrated steel mill, it is poured into molds
where it is allowed to solidify for re-melting later or shipment to a different location.
Using considerable imagination, the solidified metal in the mold resembles a sow
nursing a litter of baby pigs, hence the name pig iron.
Pitch, in the context of this project, refers to the non-distillable portion of coal tar
produced from by-product coke ovens. Pitch has a wide variety of uses, from preparing
mixtures for roofing to being one of the key ingredients in making synthetic graphite.
The word pitch is also encountered in the petroleum and wood-products industries, but
the various kinds of pitches have different compositions, properties, and uses.
Puffing is an undesirable effect in the production of synthetic graphite articles, such as
arc-furnace electrodes. When the temperature of the article reaches about 1500° C
(2730° F), a release of volatiles causes an irreversible volume expansion, possibly
accompanied by cracking. There is not a consensus in the literature regarding the
source of the volatiles, but it seems likely to be compounds of nitrogen and/or sulfur
that are strongly bonded to the chemical structure of the coal or coke.
Pushing. A standard method for removing coke from the oven when the coking process
is complete. The coke is literally pushed from the oven using a hydraulic ram.
Quenching. With respect to metallurgical coke, the rapid reduction of the temperature
hot coke pushed out of the oven, to prevent it from catching on fire. The common
practice in the U.S. is to spray the hot coke with water.
66
Scaffolding in a blast furnace is a condition in which material builds up on the furnace
walls, either as a lump or even a complete ring around the furnace wall. The scaffold
retards the flow of the burden downward through the furnace, and, in extreme cases
combined with a high-pressure air blast, can even stop the movement of the burden
completely.
Sintering. In general, sintering is a process in which small particles grow—either
deliberately or accidentally—by contacting other particles and forming, at high
temperature, a partially molten material that acts to “glue” the smaller particles together
into larger aggregations. In the context of this project, sintering is a process for
preparing iron ore for shipment and use in a blast furnace, somewhat similar to
pelletizing (above). Ore is ground to a fine powder, concentrated to enhance the amount
of iron oxide, mixed with clay, lime and coke, and treated at high temperature (up to
2000° F) to form particles of about quarter-inch to inch size.
Slag rate. The amount of slag produced in the furnace, often expressed as the weight of
slag per weight of hot metal.
Sponge iron is a product of the reduction of iron ore in the solid state, i.e. without the
melting processes that occur in a blast furnace. As oxygen is chemically removed from
the ore, the solid iron is very porous, looking like a sponge—hence the name. When a
gaseous fuel is used to make sponge iron, the still-hot, solid product is compressed to
make it more dense, giving a product called hot briquetted iron, HBI. If a non-coking
coal is used to make the sponge iron, the product is called direct reduced iron, DRI.
Taconite. An iron ore occurring in large deposits in Minnesota, one of the most important
ores in the U.S. The principal iron-containing component is magnetite, Fe3O4, which is
mixed with some 50% silica in the native condition. Taconite is customarily beneficiated
by pelletizing or sintering (see above) prior to shipping and use.
Thermal shock is the breakage of a solid piece that is subjected to a sudden, rapid
temperature change. Differences in the rate and extent of thermal expansion inside the
material, as the piece adjusts to the new temperature, set up stresses that could be
great enough to cause cracking or shattering. An example is the cracking of a drinking
glass by putting ice and a cold liquid into a hot glass that has just come out of the
dishwasher.
Tonne. The term used for a metric ton, or one thousand kilograms. A tonne is 1.102
short tons (2000 pounds) or 0.98 long tons (2240 pounds). Throughout this report, the
word tonne denotes a metric ton, and ton, a short ton.
Top gas. The gas exiting the furnace, containing nitrogen, carbon monoxide, and carbon
dioxide as the principal components. It can be used as a fuel in various applications in
a steel mill, such as for heating coke ovens.
Tuyeres. Nozzles extending into the furnace, through which the air blast is injected. In
some furnaces, supplemental fuel is also injected through the tuyeres.
67
Viscosity. Resistance to flow. The viscosity of all liquids increases as the temperature
drops. (This is the scientific basis of the folk saying that someone is “slower than
molasses in January.”)
Volatile organic compounds, commonly known as VOCs, are a class of compounds that
vaporize fairly readily at ordinary temperatures, i.e., they have a high vapor pressure.
Hundreds of compounds can be considered to be VOCs. Some of these compounds are
considered to be hazardous air pollutants. Consequently VOC emissions are a concern
for environmental and workplace safety reasons.
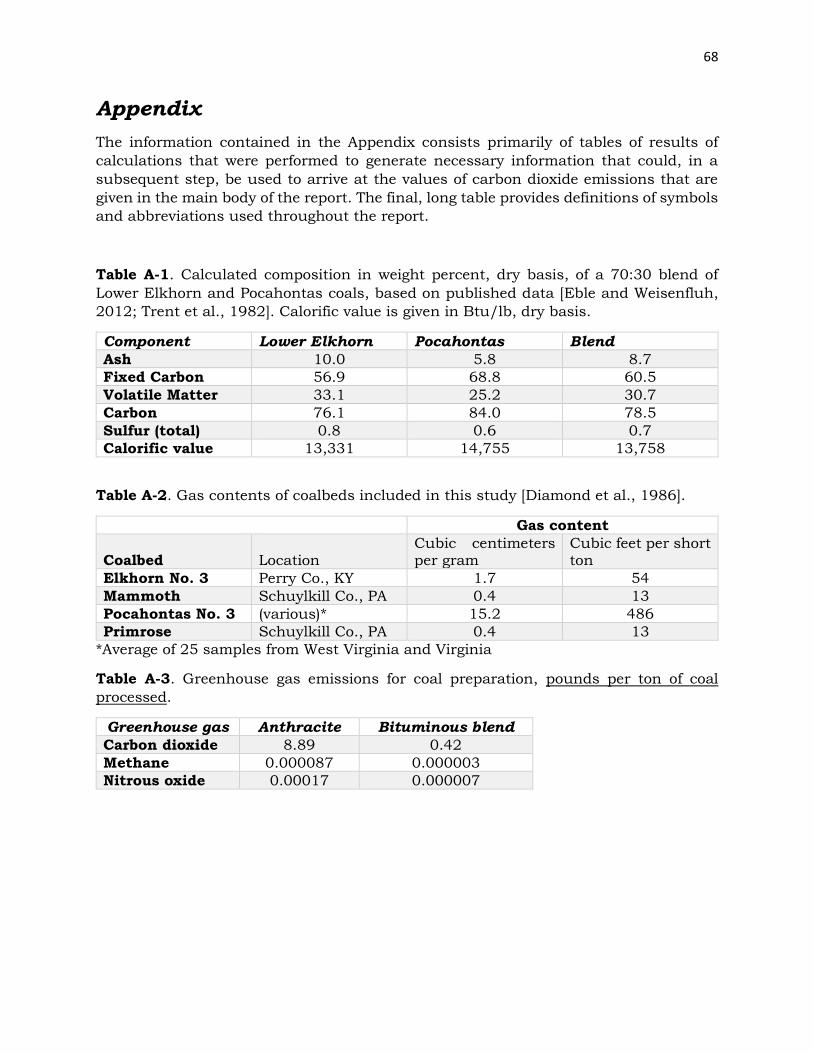
68
Appendix
The information contained in the Appendix consists primarily of tables of results of
calculations that were performed to generate necessary information that could, in a
subsequent step, be used to arrive at the values of carbon dioxide emissions that are
given in the main body of the report. The final, long table provides definitions of symbols
and abbreviations used throughout the report.
Table A-1. Calculated composition in weight percent, dry basis, of a 70:30 blend of
Lower Elkhorn and Pocahontas coals, based on published data [Eble and Weisenfluh,
2012; Trent et al., 1982]. Calorific value is given in Btu/lb, dry basis.
Component Lower Elkhorn Pocahontas Blend
Ash 10.0 5.8 8.7
Fixed Carbon 56.9 68.8 60.5
Volatile Matter 33.1 25.2 30.7
Carbon 76.1 84.0 78.5
Sulfur (total) 0.8 0.6 0.7
Calorific value 13,331 14,755 13,758
Table A-2. Gas contents of coalbeds included in this study [Diamond et al., 1986].
Gas content
Coalbed
Location
Cubic centimeters per gram
Cubic feet per short ton
Elkhorn No. 3 Perry Co., KY 1.7 54
Mammoth Schuylkill Co., PA 0.4 13
Pocahontas No. 3 (various)* 15.2 486
Primrose Schuylkill Co., PA 0.4 13
*Average of 25 samples from West Virginia and Virginia
Table A-3. Greenhouse gas emissions for coal preparation, pounds per ton of coal
processed.
Greenhouse gas Anthracite Bituminous blend
Carbon dioxide 8.89 0.42
Methane 0.000087 0.000003
Nitrous oxide 0.00017 0.000007
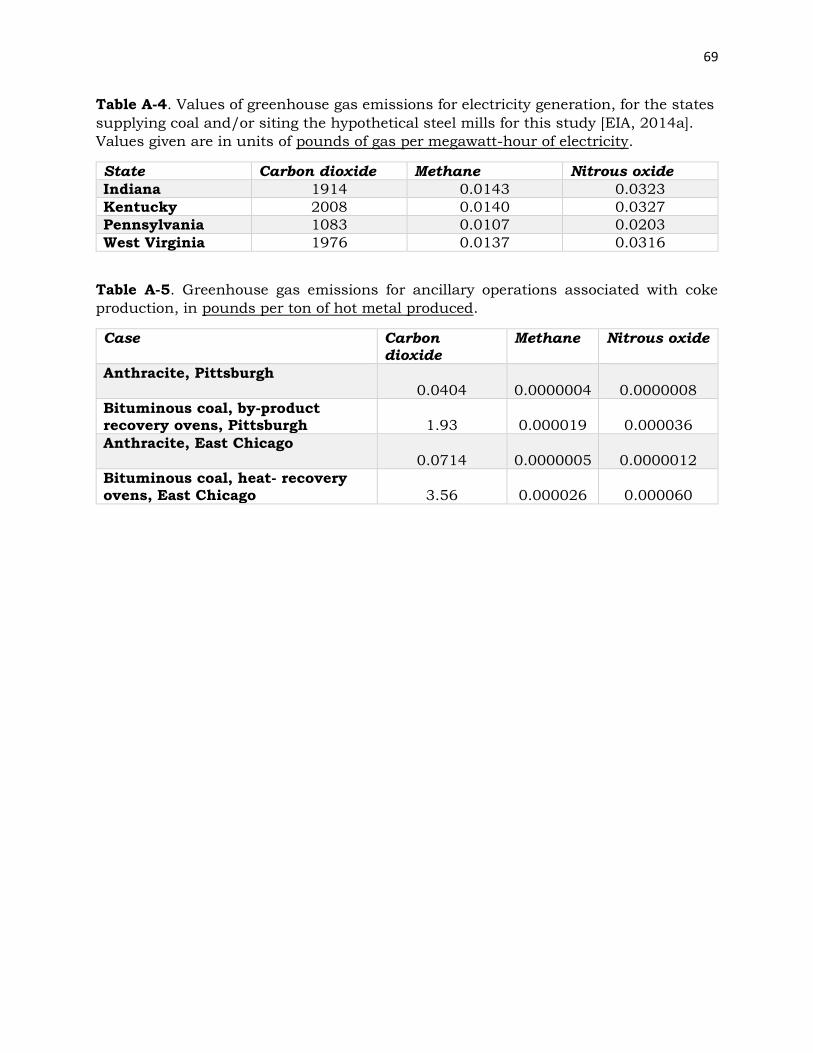
69
Table A-4. Values of greenhouse gas emissions for electricity generation, for the states
supplying coal and/or siting the hypothetical steel mills for this study [EIA, 2014a].
Values given are in units of pounds of gas per megawatt-hour of electricity.
State Carbon dioxide Methane Nitrous oxide
Indiana 1914 0.0143 0.0323
Kentucky 2008 0.0140 0.0327
Pennsylvania 1083 0.0107 0.0203
West Virginia 1976 0.0137 0.0316
Table A-5. Greenhouse gas emissions for ancillary operations associated with coke
production, in pounds per ton of hot metal produced.
Case Carbon dioxide
Methane Nitrous oxide
Anthracite, Pittsburgh 0.0404
0.0000004
0.0000008
Bituminous coal, by-product recovery ovens, Pittsburgh
1.93
0.000019
0.000036
Anthracite, East Chicago 0.0714
0.0000005
0.0000012
Bituminous coal, heat- recovery ovens, East Chicago
3.56
0.000026
0.000060
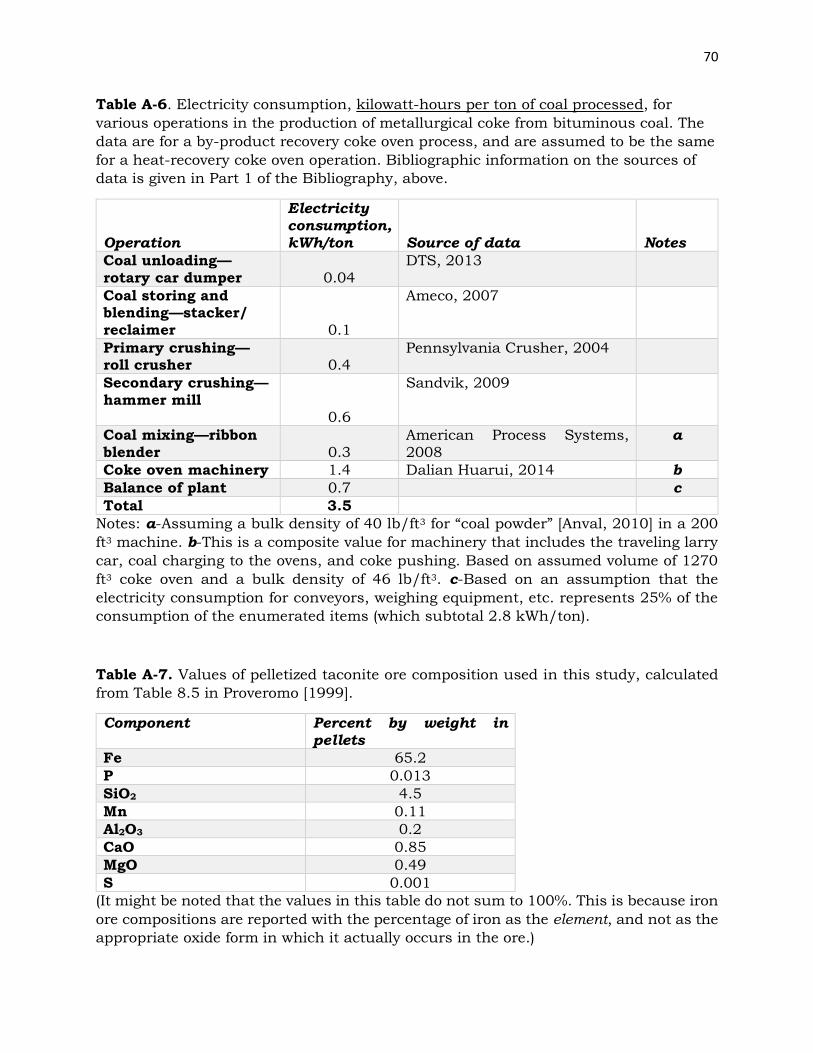
70
Table A-6. Electricity consumption, kilowatt-hours per ton of coal processed, for
various operations in the production of metallurgical coke from bituminous coal. The
data are for a by-product recovery coke oven process, and are assumed to be the same
for a heat-recovery coke oven operation. Bibliographic information on the sources of
data is given in Part 1 of the Bibliography, above.
Operation
Electricity
consumption,
kWh/ton
Source of data
Notes
Coal unloading—rotary car dumper
0.04
DTS, 2013
Coal storing and blending—stacker/ reclaimer
0.1
Ameco, 2007
Primary crushing—roll crusher
0.4
Pennsylvania Crusher, 2004
Secondary crushing—hammer mill
0.6
Sandvik, 2009
Coal mixing—ribbon blender
0.3
American Process Systems, 2008
a
Coke oven machinery 1.4 Dalian Huarui, 2014 b
Balance of plant 0.7 c
Total 3.5
Notes: a-Assuming a bulk density of 40 lb/ft3 for “coal powder” [Anval, 2010] in a 200
ft3 machine. b-This is a composite value for machinery that includes the traveling larry
car, coal charging to the ovens, and coke pushing. Based on assumed volume of 1270
ft3 coke oven and a bulk density of 46 lb/ft3. c-Based on an assumption that the
electricity consumption for conveyors, weighing equipment, etc. represents 25% of the
consumption of the enumerated items (which subtotal 2.8 kWh/ton).
Table A-7. Values of pelletized taconite ore composition used in this study, calculated
from Table 8.5 in Proveromo [1999].
Component Percent by weight in
pellets
Fe 65.2
P 0.013
SiO2 4.5
Mn 0.11
Al2O3 0.2
CaO 0.85
MgO 0.49
S 0.001
(It might be noted that the values in this table do not sum to 100%. This is because iron
ore compositions are reported with the percentage of iron as the element, and not as the
appropriate oxide form in which it actually occurs in the ore.)
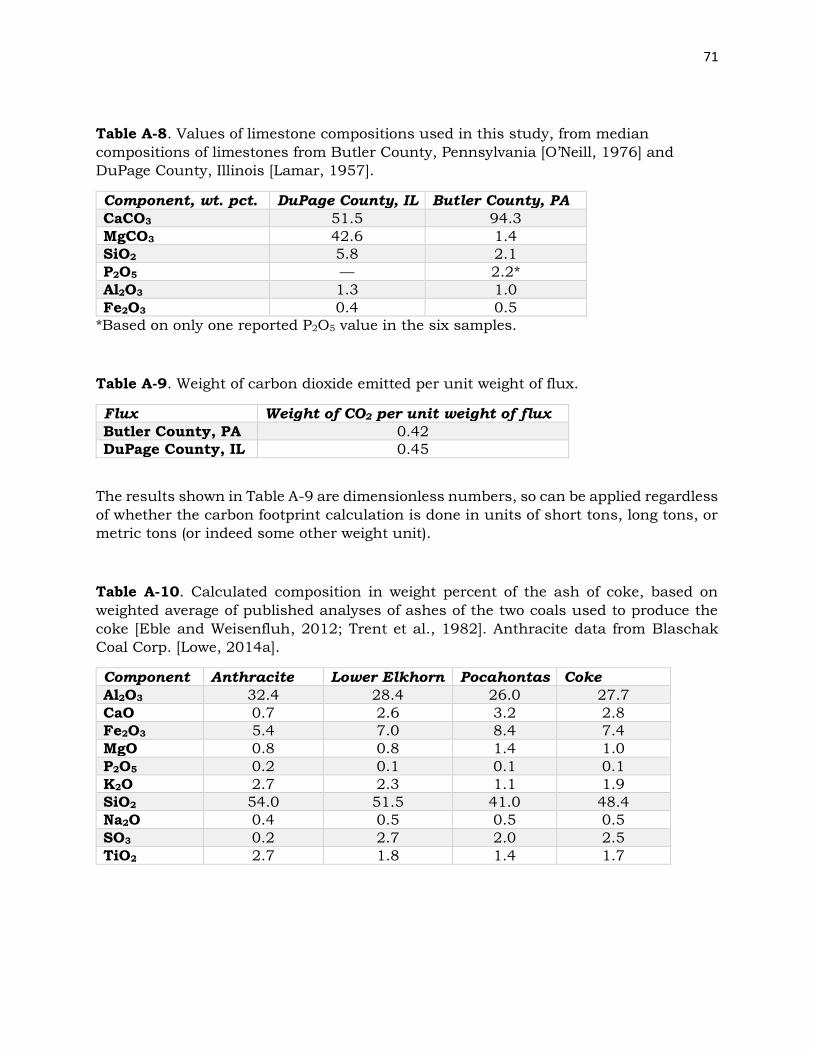
71
Table A-8. Values of limestone compositions used in this study, from median
compositions of limestones from Butler County, Pennsylvania [O’Neill, 1976] and
DuPage County, Illinois [Lamar, 1957].
Component, wt. pct. DuPage County, IL Butler County, PA
CaCO3 51.5 94.3
MgCO3 42.6 1.4
SiO2 5.8 2.1
P2O5 — 2.2*
Al2O3 1.3 1.0
Fe2O3 0.4 0.5
*Based on only one reported P2O5 value in the six samples.
Table A-9. Weight of carbon dioxide emitted per unit weight of flux.
Flux Weight of CO2 per unit weight of flux
Butler County, PA 0.42
DuPage County, IL 0.45
The results shown in Table A-9 are dimensionless numbers, so can be applied regardless
of whether the carbon footprint calculation is done in units of short tons, long tons, or
metric tons (or indeed some other weight unit).
Table A-10. Calculated composition in weight percent of the ash of coke, based on
weighted average of published analyses of ashes of the two coals used to produce the
coke [Eble and Weisenfluh, 2012; Trent et al., 1982]. Anthracite data from Blaschak
Coal Corp. [Lowe, 2014a].
Component Anthracite Lower Elkhorn Pocahontas Coke
Al2O3 32.4 28.4 26.0 27.7
CaO 0.7 2.6 3.2 2.8
Fe2O3 5.4 7.0 8.4 7.4
MgO 0.8 0.8 1.4 1.0
P2O5 0.2 0.1 0.1 0.1
K2O 2.7 2.3 1.1 1.9
SiO2 54.0 51.5 41.0 48.4
Na2O 0.4 0.5 0.5 0.5
SO3 0.2 2.7 2.0 2.5
TiO2 2.7 1.8 1.4 1.7
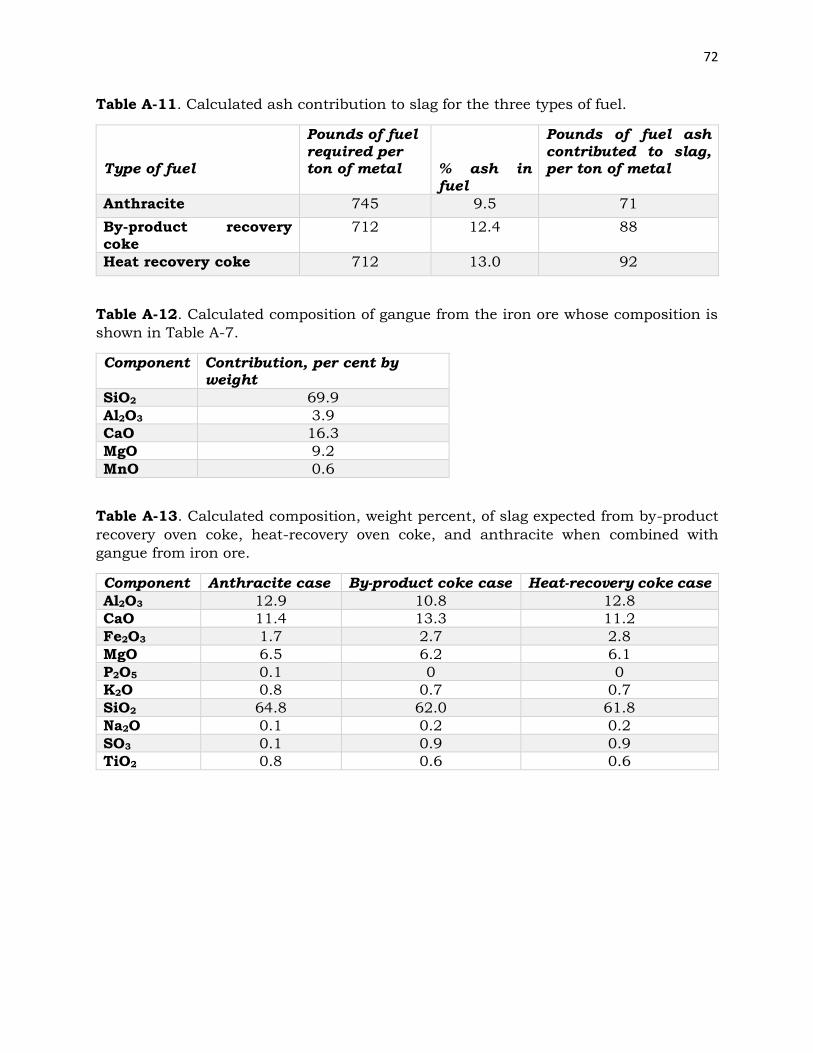
72
Table A-11. Calculated ash contribution to slag for the three types of fuel.
Type of fuel
Pounds of fuel
required per ton of metal
% ash in
fuel
Pounds of fuel ash
contributed to slag, per ton of metal
Anthracite 745 9.5 71
By-product recovery coke
712 12.4 88
Heat recovery coke 712 13.0 92
Table A-12. Calculated composition of gangue from the iron ore whose composition is
shown in Table A-7.
Component Contribution, per cent by weight
SiO2 69.9
Al2O3 3.9
CaO 16.3
MgO 9.2
MnO 0.6
Table A-13. Calculated composition, weight percent, of slag expected from by-product
recovery oven coke, heat-recovery oven coke, and anthracite when combined with
gangue from iron ore.
Component Anthracite case By-product coke case Heat-recovery coke case
Al2O3 12.9 10.8 12.8
CaO 11.4 13.3 11.2
Fe2O3 1.7 2.7 2.8
MgO 6.5 6.2 6.1
P2O5 0.1 0 0
K2O 0.8 0.7 0.7
SiO2 64.8 62.0 61.8
Na2O 0.1 0.2 0.2
SO3 0.1 0.9 0.9
TiO2 0.8 0.6 0.6
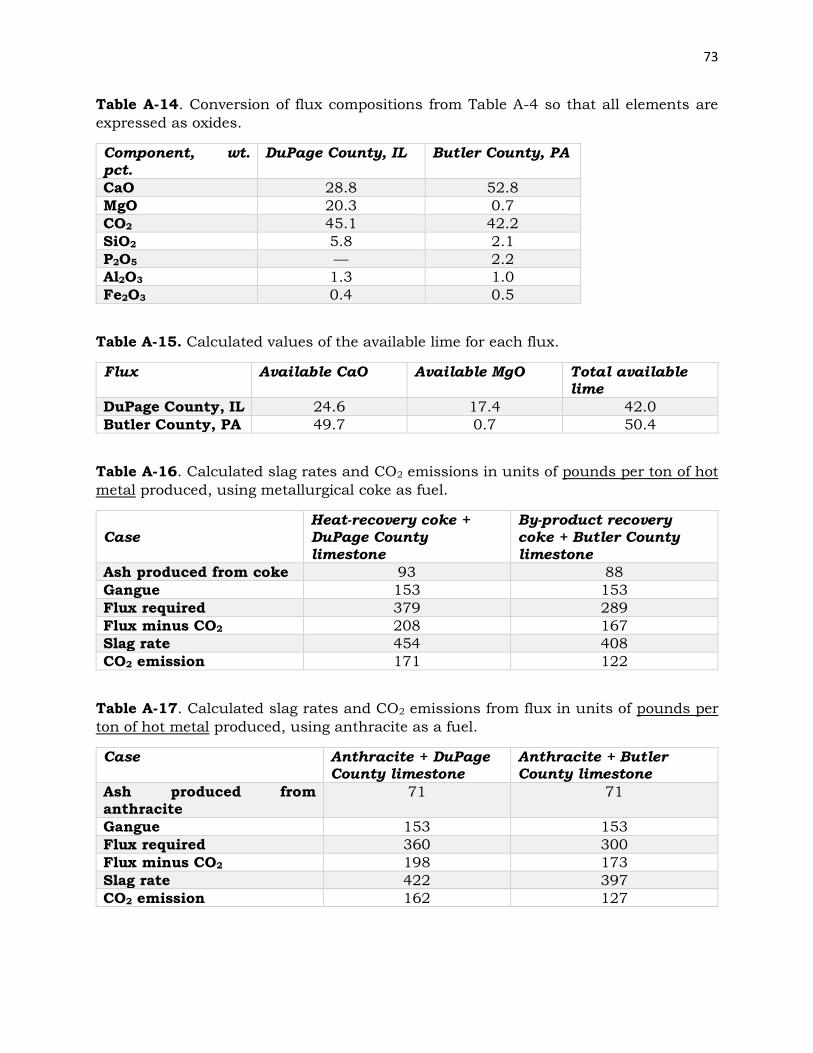
73
Table A-14. Conversion of flux compositions from Table A-4 so that all elements are
expressed as oxides.
Component, wt.
pct.
DuPage County, IL Butler County, PA
CaO 28.8 52.8
MgO 20.3 0.7
CO2 45.1 42.2
SiO2 5.8 2.1
P2O5 — 2.2
Al2O3 1.3 1.0
Fe2O3 0.4 0.5
Table A-15. Calculated values of the available lime for each flux.
Flux Available CaO Available MgO Total available lime
DuPage County, IL 24.6 17.4 42.0
Butler County, PA 49.7 0.7 50.4
Table A-16. Calculated slag rates and CO2 emissions in units of pounds per ton of hot
metal produced, using metallurgical coke as fuel.
Case
Heat-recovery coke +
DuPage County
limestone
By-product recovery
coke + Butler County
limestone
Ash produced from coke 93 88
Gangue 153 153
Flux required 379 289
Flux minus CO2 208 167
Slag rate 454 408
CO2 emission 171 122
Table A-17. Calculated slag rates and CO2 emissions from flux in units of pounds per
ton of hot metal produced, using anthracite as a fuel.
Case Anthracite + DuPage County limestone
Anthracite + Butler County limestone
Ash produced from
anthracite
71 71
Gangue 153 153
Flux required 360 300
Flux minus CO2 198 173
Slag rate 422 397
CO2 emission 162 127
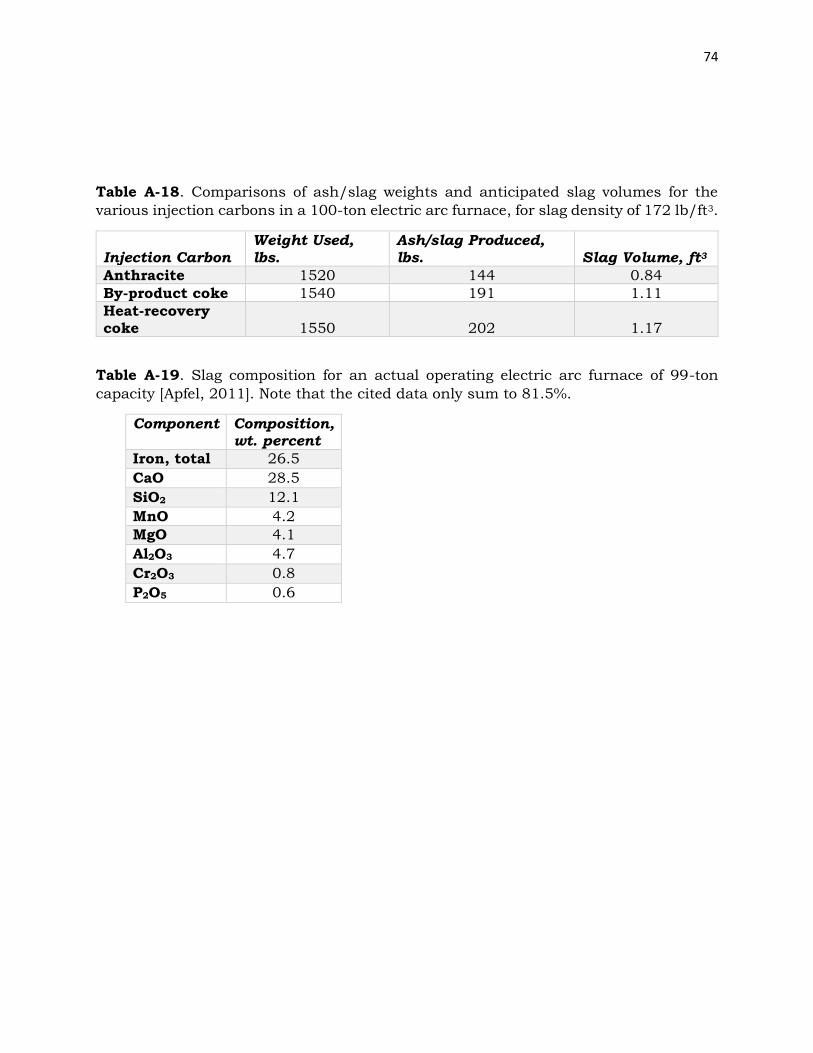
74
Table A-18. Comparisons of ash/slag weights and anticipated slag volumes for the
various injection carbons in a 100-ton electric arc furnace, for slag density of 172 lb/ft3.
Injection Carbon
Weight Used,
lbs.
Ash/slag Produced,
lbs.
Slag Volume, ft3
Anthracite 1520 144 0.84
By-product coke 1540 191 1.11
Heat-recovery coke
1550
202
1.17
Table A-19. Slag composition for an actual operating electric arc furnace of 99-ton
capacity [Apfel, 2011]. Note that the cited data only sum to 81.5%.
Component Composition, wt. percent
Iron, total 26.5
CaO 28.5
SiO2 12.1
MnO 4.2
MgO 4.1
Al2O3 4.7
Cr2O3 0.8
P2O5 0.6
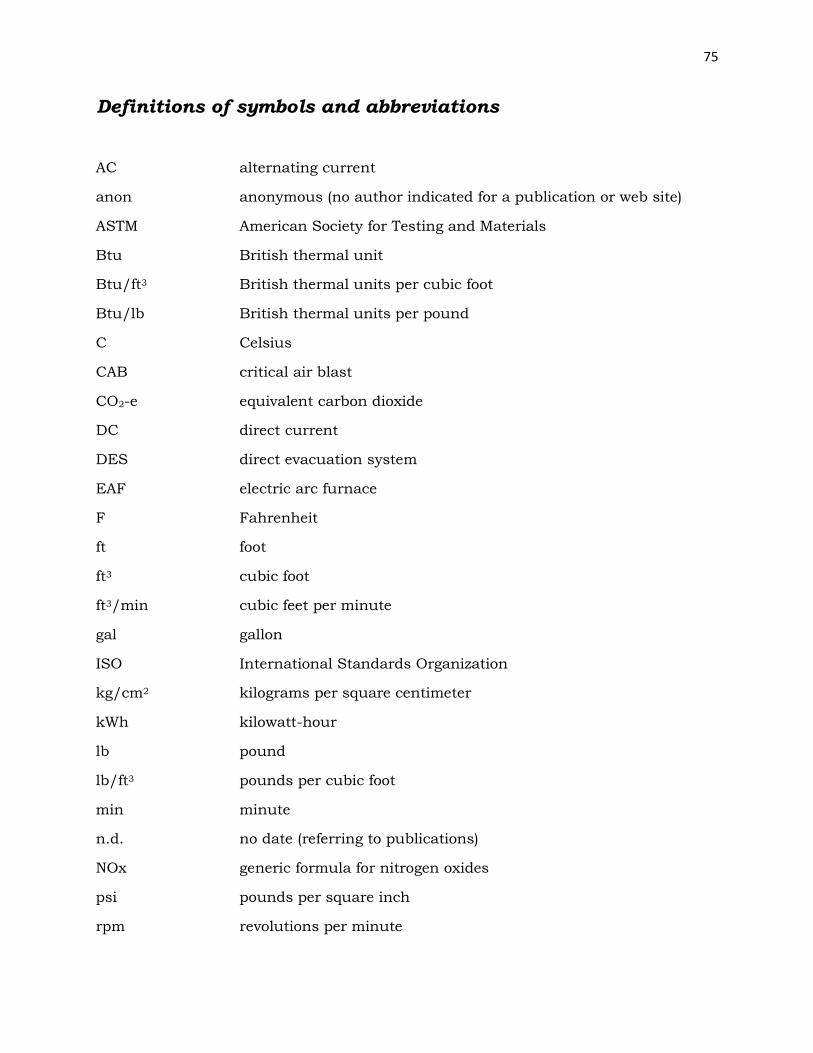
75
Definitions of symbols and abbreviations
AC alternating current
anon anonymous (no author indicated for a publication or web site)
ASTM American Society for Testing and Materials
Btu British thermal unit
Btu/ft3 British thermal units per cubic foot
Btu/lb British thermal units per pound
C Celsius
CAB critical air blast
CO2-e equivalent carbon dioxide
DC direct current
DES direct evacuation system
EAF electric arc furnace
F Fahrenheit
ft foot
ft3 cubic foot
ft3/min cubic feet per minute
gal gallon
ISO International Standards Organization
kg/cm2 kilograms per square centimeter
kWh kilowatt-hour
lb pound
lb/ft3 pounds per cubic foot
min minute
n.d. no date (referring to publications)
NOx generic formula for nitrogen oxides
psi pounds per square inch
rpm revolutions per minute

76
T75 sample temperature at the onset of a 75°C/min temperature rise
U.K. United Kingdom
VOC volatile organic compounds