comparative civilian labor force statistics, 10 … · comparative civilian labor force statistics,...
TRANSCRIPT

Comparative Civilian Labor Force Statistics, 10 Countries, 1960-2004
In November 2005, data for France, Germany, and the United Kingdom were revised
through 2004 and released to the public. These data are available on the Foreign Labor Statistics website at http://www.bls.gov/fls/home.htm, in the section “Get Detailed FLS
Statistics.” Data for these three countries no longer correspond to the data shown in this report. The next complete update is scheduled for Spring 2006.
Monthly updates to unemployment rates are available on the Foreign Labor Statistics website at http://www.bls.gov/fls/home.htm, in the section “Labor Force, Employment,
and Unemployment--International Statistics.”
Prepared by: U.S. Department of Labor Bureau of Labor Statistics Office of Productivity and Technology May 13, 2005

CONTENTS
Page Contents....................................................................................................................................................................................1 General Notes...........................................................................................................................................................................2 Country Notes...........................................................................................................................................................................4 Tables 1. Civilian Working Age Population Approximating U.S. Concepts, 1960-2004......................................................................9 2. Civilian Labor Force, Employment, and Unemployment Approximating U.S. Concepts, 1960-2004................................10 3. Civilian Labor Force, Employment, and Unemployment Published by Originating Country, 1960-2004...........................14 4. Civilian Labor Force Participation Rates Approximating U.S. Concepts by Sex, 1960-2004............................................19 5. Civilian Employment-Population Ratios Approximating U.S. Concepts by Sex, 1960-2004..............................................22 6. Civilian Employment Approximating U.S. Concepts by Economic Sector, 1960-2004......................................................25 7. Percent Distribution of Civilian Employment Approximating U.S. Concepts by Economic Sector, 1960-2004.................30 8. Civilian Unemployment Rates Approximating U.S. Concepts by Sex, 1960-2004............................................................34 9. Civilian Unemployment Rates Approximating U.S. Concepts by Age, 2000-04................................................................36 Spring 2005. This report has been reformatted. Table 2 in previous reports is now divided into tables 2 and 3. Table 9 in previous reports now appears as table B on page 4 of the General Notes. Data for 1959 have been omitted so that all historical series now begin with 1960.
- 1 -

GENERAL NOTES
This document presents selected international labor force statistics for 10 countries: the United States, Canada, Australia, Japan, and 6 European countries. The data are adjusted to approximate U.S. concepts except for the data in table 3, which are published by the originating country. ADJUSTMENTS The U.S. concepts that form the basis of the international comparisons are described below. • Civilian noninstitutional working age population. Included are persons 16 years of age and older who are not inmates of institutions and who are not on active duty in the Armed Forces. • Employed persons. All persons who, during the reference week, (a) did any work at all (at least 1 hour) as paid employees, worked in their own business, profession, or on their own farm, or worked 15 hours or more as unpaid workers in an enterprise operated by a member of the family, and (b) all those who were not working but who had jobs or businesses from which they were temporarily absent because of vacation, illness, bad weather, childcare problems, maternity or paternity leave, labor-management dispute, job training, or other family or personal reasons, whether or not they were paid for the time off or were seeking other jobs. • Unemployed persons. All persons who had no employment during the reference week, were available for work, except for temporary illness, and actively seeking work during the 4-week period ending with the reference week. Persons who were waiting to be recalled to a job from which they had been laid off need not have been looking for work to be classified as unemployed. For more detail of U.S. concepts, see the Bureau of Labor Statistics Handbook of Methods, Chapter 1, “Labor force data derived from the Current Population Survey,” on the Internet at http://www.bls.gov/opub/hom/homtoc.htm. The foreign country data are adjusted as closely as possible to U.S. concepts with the exception of lower age limits and the treatment of layoffs. Lower age limits are adjusted to the age at which compulsory schooling ends, rather than the U.S. lower age limit of 16 (see Population Coverage section for exceptions). In the United States, persons on layoff are classified as unemployed because of weak job attachment; however, in some countries, persons on layoff are classified as employed because of strong job attachment. In addition, for some countries, no adjustment is made for deviations from U.S. concepts in the treatment of unpaid family workers, persons waiting to start a new job, and passive jobseekers. In the United States, job search must be "active," such as placing or answering advertisements; simply reading ads is not enough to qualify as active job search. Canada and the European countries classify passive jobseekers as unemployed. An adjustment is made to exclude them in Canada, but not in the European countries, where the phenomenon is much less prevalent. Australia and Japan exclude passive jobseekers, in accordance with the U.S. concept. These "unadjusted" differences have a negligible effect on the comparisons. For further information on comparability issues, see Constance Sorrentino, "International unemployment rates: how comparable are they?" Monthly Labor Review, June 2000, pp. 3-20, on the Internet at http://www.bls.gov/opub/mlr/2000/06/art1full.pdf. For most countries, the adjusted unemployment rates are close to or identical with the published rates in recent years. However, there were greater differences historically. Significant differences remain for three countries: Canada, Germany, and Sweden. The Country Notes section explains the adjustments made. BREAKS IN SERIES Various changes, such as changes in national data sources and BLS adjustment methods, created breaks in the historical continuity of series for all countries except Japan. An asterisk * appears next to the data point where there is a break in series. Some breaks are inconsequential, while others represent a significant discontinuity in the series. The Country Notes section explains the more recent breaks in series and measures their impact, where overlapping data are available. POPULATION COVERAGE Data refer to the civilian noninstitutional working age population except in Japan and Germany, where the institutional population is included. The lower age limit for the United States is 16. The lower age limits for the other countries vary over years within a country, across countries, and between published data and data adjusted to U.S. concepts. The data are adjusted to the age at which compulsory schooling ends in each country, except for Canada and the Netherlands. For Canada for 1976 onward, data are adjusted to cover persons ages 16 and over, whereas the age at which compulsory schooling ends remains at 15. For the Netherlands, from 1975 onward, data are adjusted to cover persons ages 15 and over, whereas the age at which compulsory full-time schooling ends is now 16. See table A below for lower age limits by country for published and adjusted statistics.
- 2 -

Table A. Lower Age Limits for the Published and Adjusted Statistics
Country Published Adjusted Country Published Adjusted
United States 16 16Canada Italy 1960-65 14 15 1960-92 14 14 1966-75 15 15 1993-present 15 15 1976-present 15 16 NetherlandsAustralia 15 15 1973-74 13 14Japan 15 15 1975-87 14 15France 1988-present 15 15 1960-67 14 16 Sweden 16 16 1968-present 15 16 United KingdomGermany 1960-72 15 15 1960-74 14 15 1973-present 16 16 1975-83 14/15 15 1984-present 15 15
NAICS The employment data by sector (tables 6 and 7) for the United States and Canada are classified using the North American Industry Classification System (NAICS). The federal statistical agencies of the United States, Canada, and Mexico developed NAICS. This new classification provides better comparability in statistics for business activity across North America. Employment data by sector for 2000 forward for the United States and for 1976 forward for Canada are shown based on the 2002 NAICS. Employment data by sector for all other countries in this report are shown based on the International Standard Industrial Classification. OTHER COMPARATIVE SERIES Three organizations compile internationally comparable monthly and annual series of unemployment rates for selected countries:
• The BLS publishes unemployment rates adjusted to U.S. concepts, as shown in this compendium. • The Organization for Economic Cooperation and Development (OECD) publishes "Standardized Unemployment
Rates" (SURS) for 27 member countries.1 The SURS are adjusted to International Labor Office (ILO) concepts, which are more general than U.S. concepts.
• The Statistical Office of the European Communities (EUROSTAT) publishes comparable unemployment rates for European Union countries based on their own interpretation of ILO concepts. Since 1992,2 EUROSTAT concepts are close to U.S. concepts, but some differences remain.
In 1996, the OECD adopted the comparable unemployment rates produced by EUROSTAT for the European Union countries and revised its historical series to be in accord with EUROSTAT. Therefore, the OECD SURS are now identical to the EUROSTAT standardized unemployment rates for the European Union countries. Monthly updates to the SURS are available on the Internet at http://www.oecd.org/statistics/news-releases. The following table compares the unemployment rates published by BLS and those published by OECD and EUROSTAT for the most recent three years.
1 See OECD, Quarterly Labor Force Statistics, Appendix section. 2 1993 for Italy.
- 3 -

Table B. BLS and OECD Comparative Civilian Unemployment Rates, 2002-04
United Nether- UnitedYear States Canada Australia Japan France Germany Italy lands Sweden Kingdom
BLS Series (Approximating U.S. Concepts)
2002 5.8 7.0 6.4 5.4 9.0 8.7 8.7 2.7 5.1 5.22003 6.0 6.9 6.1 5.3 9.6 9.7 8.5 3.8 5.8 5.02004 5.5 6.4 5.5 4.8 9.8 9.8 8.1 4.7 6.6 4.8
OECD SURS (1)
2002 5.8 7.7 6.4 5.4 8.9 8.2 8.6 2.7 4.9 5.12003 6.0 7.6 6.1 5.3 9.5 9.1 8.4 3.8 5.6 5.02004 5.5 7.2 5.5 4.7 9.6 9.5 8.0 4.7 6.4 4.6
(1) For the European Union countries, the denominator of the rate excludes conscripts but includes career military residing in privatehouseholds.
ACKNOWLEDGMENT The sources of data in this compendium of labor statistics are primarily national statistical sources, as well as the OECD and EUROSTAT.
COUNTRY NOTES The following notes by country describe adjustments made to unemployment rates and the impact of breaks in series. UNITED STATES Published unemployment rates are from a monthly labor force survey, the Current Population Survey (CPS). Adjustments. None. Breaks. While current survey concepts and methods are very similar to those introduced at the inception of the CPS in 1940, several changes have been made over the years to improve the accuracy and usefulness of the data. These methodological changes and others, such as the introduction of new population controls from the decennial censuses, can affect historical comparability. Most changes had small effects on historical comparability. Although also small in impact, the 1990 and 1994 breaks reflect major changes in methodology, and they are described below. In 1994, a major redesign of the labor force survey questionnaire and collection methodology was introduced. Revised population estimates based on the 1990 Census and adjusted for the estimated undercount were also incorporated for data from 1990 onward. Therefore, data for 1994 onward are not strictly comparable with data for 1993 and earlier years because of the redesign, and data for 1990 onward are not strictly comparable with data for 1989 and earlier years because of the introduction of the 1990 census-based population controls. The introduction of the population controls increased the 1990 employment by 879,000 and increased the overall unemployment rate by 0.1 percentage point. There was no effect on the female participation rate or the female employment-population ratio for 1990. The redesign effect on employment cannot be precisely determined, but it raised the overall unemployment rate by 0.1 percentage point. For a description of all the changes in the CPS over time and their impact, see Historical Comparability in the “Household Data” section of the BLS publication, Employment and Earnings, on the Internet at http://www.bls.gov/cps/eetech_methods.pdf. Employment data by sector (tables 6 and 7) from 2000 forward are shown on the 2002 NAICS. Before 2000, the data are shown on the 1987 Standard Industrial Classification (SIC) basis. For 2000-02, the change from the 1987 SIC basis to the NAICS 2002 basis decreased employment in all sectors except services. In 2000, on the 1987 SIC basis, agriculture represented 2.6 percent of all civilian employment; industry, 22.2 percent; manufacturing (a subsector of industry), 14.8
- 4 -

percent; and services, 75.2 percent. In 2000, on the 2002 NAICS basis, agriculture represented 1.8 percent of all civilian employment; industry, 22.0 percent; manufacturing, 14.4 percent; and services, 76.2 percent. CANADA Published unemployment rates are from a monthly labor force survey. Adjustments. For 1976 onward, five adjustments are made:
• 15 year olds are excluded. • Passive jobseekers are excluded. • Persons waiting to start a new job who did not seek work in the past four weeks are excluded. • Persons unavailable for work due to personal or family responsibilities are excluded. • Full-time students looking for full-time work are included.
The adjustments lowered the annual average unemployment rate by 0.1-0.4 percentage point in the 1980s, by 0.4-1.0 percentage point in the 1990s, and by 0.7-0.8 percentage point in the 2000s. Statistics Canada provides BLS with the Canadian unemployment rates adjusted to U.S. concepts for 1976 onward. For further information, see Constance Sorrentino, "International unemployment rates: how comparable are they?" Monthly Labor Review, June 2000, pp. 3-20, on the Internet at http://www.bls.gov/opub/mlr/2000/06/art1full.pdf. Breaks. The 1966 break in the published series reflects a change in the definition of the labor force. In 1976, there are breaks in both the published and adjusted series. Beginning in 1976, Canadian data are adjusted to more closely approximate U.S. concepts, as described above. In addition, figures are revised after census population estimates become available. Canadian data were last benchmarked to the 2001 census population counts, for 1976 onward. Employment data by sector (tables 6 and 7) for 1976 forward are shown on the 2002 NAICS. These data are also benchmarked to the 2001 Census population counts. Data prior to 1976 are shown on the Canadian SIC. A comparison between NAICS 2002 and the Canadian SIC of the employment distribution in manufacturing for 1998 shows that manufacturing is 15.7 percent of total employment on the SIC basis and 15 percent on the NAICS basis. AUSTRALIA Published unemployment rates are from a labor force survey that began as a quarterly survey in 1964 and became monthly in 1978. Adjustments. No adjustments are made. The Australian unemployment rate is virtually unchanged when U.S. concepts are applied. Breaks. A redesigned labor force survey questionnaire was introduced in April 2001 that allowed for a closer application of ILO guidelines. Australia revised the data back to April 1986 based on the 2001 changes, creating a break in series in 1986 for both the published and adjusted series. The redesign lowered the unemployment rate by 0.2 percentage point for 1986. A reclassification of persons waiting to start a new job from “not in the labor force” to “unemployed” could only be incorporated for April 2001 forward, creating a small break in the unemployment series. The reclassification increased the adjusted unemployment rate by 0.1 percentage point in 2001. The 1964 break in the published and adjusted unemployment rates reflects a change in source. The Australian labor force survey was initiated in 1964. Unemployment rates for 1960-63 were estimated by an Australian researcher. JAPAN Published unemployment rates are from a monthly labor force survey. Adjustments. Two adjustments are made in the Japanese labor force data:
• Family workers who worked less than 15 hours per week are excluded. • The National Defense Force is excluded.
The number of unemployed is not adjusted. The adjustments made result in unemployment rates that are virtually the same as the published rates. Unemployment rates by sex (table 8) for 1994-2000 are from Toshihiko Yamagami, "Underutilization of labor resources in Japan and the United States," Monthly Labor Review, April 2002, pp. 25-43, on the Internet at http://www.bls.gov/opub/mlr/2002/04/art3full.pdf. Rates for 2001-04 were updated and provided to BLS by Mr. Yamagami.
- 5 -

Mr. Yamagami uses special tabulations from the Special Survey of the Labor Force Survey, which has more detailed information on job search. Breaks. None. FRANCE Published unemployment rates are estimates of unemployment under ILO concepts based on a combination of sources, including monthly employment office registrations, quarterly establishment surveys, and a labor force survey that was annual and is now continuous. Adjustments. Adjusted data are based on labor force survey statistics. Two adjustments are made in the French labor force data:
• Persons under age 16 are excluded prior to 1992. From 1992 onward, the number of employed under age 16 had virtually no impact on the unemployment rate so this adjustment is no longer made.
• The Armed Forces is excluded. Breaks. The 1982 break in the adjusted employment and unemployment series reflects the introduction of a new questionnaire and the implementation of definitions recommended by the ILO. France incorporated the 1999 population census results for 1990 forward, creating a break in series in 1990. Furthermore, for 1990 onward, BLS adjustment methods for unemployment are revised: The labor force survey results from OECD were replaced with those from EUROSTAT, whose definitions are closer to U.S. concepts. The EUROSTAT source showed a lower unemployment rate by 0.5 percentage point in 1990. For the published employment and unemployment series, there are breaks in 1968 and 2001. The 1968 break reflects a change in the source for published data. For 1968 forward, employment data are based on the French statistical institute (Institut National de la Statistique et des Etudes Economiques, or INSEE) data; unemployment data are based on the INSEE series using ILO concepts. Prior to 1968, published employment and unemployment data are from the OECD. The 2001 break reflects an improvement in INSEE’s estimation method. GERMANY Published unemployment rates are based on a combination of sources, including the registered unemployed and employment data from an establishment survey. From 1991 onward, the labor force is calculated as all civilian employed plus the registered unemployed. Prior to 1991, for former West Germany, the labor force is calculated as civilian employed wage and salary workers plus the registered unemployed. Adjustments. Adjusted data are based on labor force survey statistics. Two adjustments are made in the German labor force survey data:
• Prior to 1991, family workers who worked less than 15 hours per week were excluded. • The career military is excluded.
Breaks. The 1983 break in the adjusted series reflects a change in data source from the Microcensus, the German labor force survey, to the EUROSTAT labor force survey. This change lowered the adjusted unemployment rate in 1983 by 0.3 percentage point, from 7.2 to 6.9 percent. The 1991 break reflects the introduction of comparative labor force measures for Germany (unified). Data for years prior to 1991 relate to former West Germany. In 1991, the adjusted unemployment rate was revised from 4.3 to 5.6 percent because of the inclusion of former East Germany. The 1999 break reflects the incorporation of an improved method of data calculation and a change in coverage to persons living in private households only. There is a break in the published unemployment rate series in 1991 as noted above. The German Statistical Office did not revise employment data by sector for the years 1971-79. Consequently, data for Germany for these years in tables 6 and 7 are not available. ITALY Published unemployment rates are from a continuous labor force survey that was quarterly before 2004. Adjustments. Adjusted data are based on labor force survey statistics. Although these data are closely comparable in definitions with U.S. data in recent years, two adjustments are made:
• The career military is excluded. • Unpaid family workers working less than 15 hours per week are excluded.
- 6 -

Breaks. The 1986 break reflects a change in the survey questionnaire resulting in a significant increase in the number of people reported as seeking work in the past 30 days. This change raised the Italian unemployment rate approximating U.S. concepts by 1.2 percentage points in 1986, from 6.3 to 7.5 percent. In 1991, the method of weighting sample data was revised. The impact was an increase in the adjusted unemployment rate by approximately 0.3 percentage point, from 6.6 to 6.9 percent in 1991. In October 1992, the Italian statistical institute (Istituto Nazionale di Statistica, or ISTAT) revised its survey methodology, changed coverage to exclude 14 year olds, and restricted the definition of unemployment to include only those who were actively looking for a job within the 30 days preceding the reference period and who were available for work. In 2004, the survey was redesigned to be a continuous labor force survey and to more closely follow ILO and EUROSTAT recommendations. Data were revised back to October 1992. BLS adjustment methods have varied to incorporate these changes. BLS incorporates the October 1992 revisions for 1993 onward. The unemployment rate in 1993 is about half a percentage point higher than the unemployment rate prior to all of these revisions. NETHERLANDS Published unemployment rates are based on a combination of sources, including the registered unemployed, wage and salary workers (from an establishment survey), and a labor force survey that has varied from annual to quarterly to monthly. Adjustments. Adjusted data are based on labor force survey statistics. For 1983 onward, the annual average of registered unemployed is adjusted to U.S. concepts on the basis of the European Community labor force survey, as annualized by EUROSTAT. Prior to 1983, the adjustment method is based on the results of the then-biennial Dutch labor force survey. For all years, two adjustments are made:
• The career military is excluded. • Unpaid family workers working less than 15 hours per week are excluded.
No adjustment is made for the age at which compulsory schooling ends. In the 1990’s, the compulsory school age limit was raised. Young persons must attend school full time until they are age 16 and part time until the end of the school year in which they reach age 17. Over the years, adjusted rates have varied from higher than to lower than the published rates. More substantial adjustments were made in the earlier years. During the last few years, adjusted and published rates are very close. Breaks. The 1983 break reflects a change in sources. Labor force data from the national statistical office were replaced with EUROSTAT data. Employment figures based on man-year employment data were replaced with data from the Dutch Survey of Employed Persons. The impact of the changes was a decrease in the adjusted unemployment rate by about 2 percentage points in 1983. The 1988 break is due to the introduction of a new survey questionnaire in 1992 that allowed for a closer application of ILO guidelines. EUROSTAT revised the Dutch series back to 1988. The 1988 revised unemployment rate is 7.2 percent; the previous figure for 1988 was 9.3 percent. There are two breaks in series for published employment. The 1987 break reflects the introduction of a continuous labor force survey, which began that year. The 1992 break reflects changes in the labor force survey definitions. There are also two breaks in series for published unemployment. The 1975 break reflects a change in the enumeration of the registered unemployed. The 1988 break reflects the incorporation of data from the labor force survey with data on the registered unemployed from the public employment offices. SWEDEN Published unemployment rates are based on a labor force survey that began as a quarterly survey in 1961, became monthly in 1970, and continuous in 1993. Adjustments. Adjusted data are based on labor force survey statistics. For 1987 forward, an adjustment is made to include full-time students seeking work and available for work who are counted as not in the labor force in Sweden. In addition, two adjustments are made to the labor force for all years:
• The career military is excluded. • Persons age 65 and over are included.
Sweden imposes an upper age limit of 64 (prior to 1986, the upper age limit was 74). BLS makes adjustments to include persons 65 and over for all series except for employment data by sector (tables 6 and 7). The upper age limit for sector data is 74 for all years.
- 7 -

Breaks. The 1986 break in the published series is due to a change in population coverage from 16-74 years to 16-64 years. The 1987 break in all series is due to the introduction of a new questionnaire in the Swedish labor force survey. Questions regarding current availability were added and the period of active work-seeking was reduced from 60 days to 4 weeks. These changes lowered Sweden's 1987 unemployment rate by 0.4 percentage point. In 1993, Sweden implemented a new reference week system to cover all 52 weeks of the year rather than one week each month and introduced new estimation procedures. These changes were taken back to 1987 onward and had the effect of raising the unemployment rate between 0.2 and 0.5 percentage point for the years prior to 1993. Beginning in 1987, BLS adjusts the Swedish data to classify students who also sought work as unemployed. The adjustment raised the unemployment rate by 0.1 percentage point in 1987 and by 1.8 percentage points in 1994, when unemployment was higher. In 2004, the national unemployment rate was adjusted from 5.5 to 6.6 percent because of the inclusion of students. The net effect of the 1987 and 1993 changes and the BLS adjustment for students seeking work lowered Sweden's 1987 unemployment rate from 2.3 to 2.2 percent. UNITED KINGDOM For 1971 onward, published unemployment rates are based on a labor force survey that was biennial for 1979-83, annual for 1984-91, and continuous for 1992 onward, as well as Office for National Statistics (ONS) estimates. Prior to 1971, published unemployment rates are based on statistics of monthly claimants for unemployment benefits, calculated as a percent of the total labor force. Adjustments. Adjusted data are based on labor force survey statistics from 1971 onward, and for prior years, on population census and sample census statistics in combination with other sources. For 1971 onward, the only adjustment made is to exclude the career military. Breaks. The 1971 break is due to the introduction by ONS of a new historical series for 1971-91. This series is now consistent with the series for 1992 and later years; data for 1971 onward now comply with the current ILO definition of unemployment. Also, the definition of employment includes unpaid family workers. ONS adjusted the data for discontinuities in the existing pre-1992 Labor Force Survey series. ONS estimates are based on a combination of labor force survey data and administrative data. For the detailed methodology underlying the estimates, see Paul Doyle, “Consistent Historical Time Series of Labour Market Data,” on the Internet at http://www.statistics.gov.uk/articles/labour_market_trends/Consistent_Time_Series_web_article.pdf.
- 8 -

Table 1. Civilian Working Age Population Approximating U.S. Concepts, 1960-2004 (in thousands)
United Nether- UnitedYear States Canada Australia Japan France Germany Italy lands Sweden Kingdom
1960 117,245 11,494 NA 64,990 31,369 43,436 37,130 NA 5,514 38,9521961 118,771 11,708 NA 65,820 31,596 43,647 37,358 NA 5,577 39,2871962 120,153 * 11,940 NA 67,330 32,319 43,972 37,815 NA 5,643 39,8041963 122,416 12,179 NA 69,170 33,166 44,232 38,083 NA 5,703 40,0361964 124,485 12,453 7,668 71,000 33,717 44,525 38,515 NA 5,769 40,281
1965 126,513 12,755 7,830 72,650 34,219 44,909 38,724 NA 5,840 40,4811966 128,058 13,083 8,023 74,090 34,606 45,174 39,276 NA 5,909 40,6311967 129,874 13,444 8,208 75,340 34,995 45,111 39,456 NA 5,957 40,7791968 132,028 13,805 8,403 76,550 35,362 45,163 39,833 NA 5,994 40,8741969 134,335 14,162 8,612 77,580 35,742 45,570 39,781 NA 6,039 41,006
1970 137,085 14,528 8,819 78,610 36,151 46,094 40,279 NA 6,106 41,1011971 140,216 14,872 9,036 79,560 36,577 46,687 40,385 NA 6,158 40,405 *1972 144,126 * 15,186 9,238 80,470 36,965 47,100 40,780 NA 6,179 40,5721973 147,096 15,526 9,425 82,150 37,352 47,594 41,186 9,750 6,199 40,7491974 150,120 15,924 9,614 83,170 37,711 47,904 41,745 9,885 6,224 40,920
1975 153,153 16,323 9,763 84,190 38,020 48,018 42,131 9,803 6,257 41,1101976 156,150 16,582 * 9,957 85,160 38,330 48,128 42,312 9,960 6,287 41,3391977 159,033 16,964 10,136 86,070 38,679 48,418 42,529 10,103 6,321 41,6161978 161,910 17,302 10,406 87,020 39,008 48,788 43,000 10,256 6,360 41,9111979 164,863 17,663 10,575 88,000 39,371 49,255 43,436 10,415 6,396 42,235
1980 167,745 18,032 10,778 89,080 39,750 49,849 43,860 10,588 6,441 42,5771981 170,130 18,398 10,994 89,930 40,114 50,344 44,184 10,744 6,479 42,8761982 172,271 18,716 11,204 90,920 40,476 50,714 44,847 10,871 6,514 43,0901983 174,215 18,981 11,401 92,080 40,828 50,928 45,457 10,996 6,553 43,3351984 176,383 19,220 11,602 93,230 41,165 51,112 45,853 11,131 6,586 43,604
1985 178,206 19,459 11,826 94,410 41,500 51,261 46,174 11,271 6,606 43,8711986 180,587 * 19,715 12,074 * 95,630 41,846 51,467 46,628 11,403 6,634 44,0941987 182,753 19,985 12,326 96,960 42,217 51,643 46,986 11,543 6,678 44,3031988 184,613 20,257 12,593 98,250 42,605 51,893 47,778 11,649 6,715 44,4631989 186,393 20,540 12,823 99,500 43,008 52,279 47,660 11,749 6,766 44,609
1990 189,164 * 20,852 13,051 100,650 43,358 53,135 48,016 11,837 6,823 44,7121991 190,925 21,175 13,227 101,750 43,653 66,487 * 48,044 * 11,942 6,857 44,8001992 192,805 21,459 13,391 102,590 43,922 67,083 48,203 12,028 6,879 44,8601993 194,838 21,731 13,561 103,460 44,168 67,709 47,122 * 12,112 6,888 44,8991994 196,814 * 21,994 13,729 104,200 44,407 68,022 47,424 12,196 6,936 45,095
1995 198,584 22,274 13,936 104,860 44,638 68,240 47,697 12,268 6,963 45,1051996 200,591 22,575 14,117 105,470 44,885 68,498 47,904 12,333 6,971 45,2631997 203,133 * 22,866 14,321 106,370 45,176 68,797 48,091 12,396 6,982 45,4251998 205,220 23,131 14,525 107,040 45,475 68,914 48,273 12,472 7,004 45,5961999 207,753 * 23,390 14,698 107,590 45,763 69,187 48,384 12,543 7,055 45,807
2000 212,577 * 23,692 14,902 108,120 46,040 69,365 48,564 12,628 7,035 46,0632001 215,092 24,033 15,138 108,620 46,342 69,600 48,748 12,718 7,108 46,3742002 217,570 24,395 15,384 109,030 46,631 69,900 48,897 12,809 7,100 46,6622003 221,168 * 24,711 15,613 109,380 46,837 70,160 48,901 12,876 7,140 46,9542004 223,357 * 25,036 15,825 109,660 47,093 NA 49,001 12,916 7,186 47,252
NA = Not available.* Indicates a break in series. See section on breaks in the Country Notes on pages 4-8 for more information.
- 9 -

Table 2. Civilian Labor Force, Employment, and Unemployment Approximating U.S. Concepts, 1960-2004
United Nether- UnitedYear States Canada Australia Japan France Germany Italy lands Sweden Kingdom
(1) (1) (1)
Civilian Labor Force (thousands)
1960 69,628 6,462 NA 44,120 18,520 25,990 20,820 NA 3,669 24,1301961 70,459 6,575 NA 44,610 18,530 26,160 20,830 NA 3,695 24,3801962 70,614 * 6,670 NA 45,040 18,720 26,210 20,680 NA 3,718 24,7201963 71,833 6,805 NA 45,430 19,100 26,290 20,240 NA 3,725 24,9401964 73,091 6,994 4,559 46,040 19,430 26,270 20,220 NA 3,720 25,070
1965 74,455 7,207 4,689 46,780 19,650 26,360 19,900 NA 3,744 25,2401966 75,770 7,493 4,862 47,850 19,850 26,290 19,620 NA 3,795 25,3201967 77,347 7,747 5,022 48,810 20,070 25,730 19,800 NA 3,773 25,2901968 78,737 7,951 5,140 49,690 20,190 25,690 19,780 NA 3,822 25,1801969 80,734 8,194 5,284 50,140 20,470 25,960 19,620 NA 3,851 25,160
1970 82,771 8,395 5,478 50,730 20,800 26,240 19,720 NA 3,909 25,1101971 84,382 8,639 5,624 51,120 21,000 26,380 19,660 NA 3,955 25,381 *1972 87,034 * 8,897 5,752 51,320 21,150 26,470 19,450 NA 3,963 25,5101973 89,429 9,276 5,901 52,590 21,430 26,780 19,590 5,210 3,971 25,7311974 91,949 9,639 6,053 52,440 21,660 26,660 19,900 5,290 4,036 25,806
1975 93,775 9,974 6,169 52,530 21,770 26,430 20,090 5,340 4,123 25,9391976 96,158 10,368 * 6,244 53,100 22,050 26,290 20,290 5,390 4,148 26,0311977 99,009 10,661 6,358 53,820 22,380 26,330 20,510 5,480 4,168 26,1161978 102,251 * 11,022 6,443 54,610 22,540 26,520 20,570 5,540 4,203 26,2341979 104,962 11,392 6,519 55,210 22,780 26,860 20,850 5,640 4,262 26,470
1980 106,940 11,725 6,693 55,740 22,930 27,260 21,120 5,870 4,312 26,7581981 108,670 12,080 6,810 56,320 23,090 27,540 21,320 6,090 4,327 26,8721982 110,204 12,145 6,910 56,980 23,320 * 27,710 21,410 6,150 4,350 26,6641983 111,550 12,372 6,997 58,110 23,400 27,670 * 21,590 6,120 * 4,369 26,6951984 113,544 12,588 7,135 58,480 23,560 27,800 21,670 6,200 4,385 27,363
1985 115,461 12,835 7,300 58,820 23,620 28,020 21,800 6,250 4,418 27,5811986 117,834 * 13,089 7,585 * 59,410 23,760 28,240 22,290 * 6,380 4,443 27,7461987 119,865 13,345 7,754 60,050 23,890 28,390 22,350 6,500 4,437 * 28,0191988 121,669 13,590 7,970 60,860 23,980 28,610 22,660 6,342 * 4,494 28,3571989 123,869 13,851 8,224 61,920 24,170 28,840 22,530 6,416 4,552 28,677
1990 125,840 * 14,043 8,440 63,050 24,165 * 29,410 22,670 6,657 4,594 28,7731991 126,346 14,136 8,486 64,280 24,330 39,075 * 22,940 * 6,756 4,591 28,5441992 128,105 14,143 8,557 65,040 24,445 39,005 22,910 6,921 4,520 28,2141993 129,200 14,233 8,613 65,470 24,490 39,102 22,771 * 7,014 4,444 28,0941994 131,056 * 14,336 8,770 65,780 24,676 39,074 22,592 7,152 4,418 28,124
1995 132,304 14,439 8,995 65,990 24,743 38,980 22,574 7,208 4,460 28,1351996 133,943 14,604 9,115 66,450 24,985 39,142 22,674 7,301 4,459 28,2431997 136,297 * 14,863 9,204 67,200 25,109 39,415 22,749 7,536 4,418 28,4061998 137,673 * 15,115 9,339 67,240 25,434 39,754 23,000 7,617 4,402 28,4781999 139,368 * 15,389 9,414 67,090 25,764 39,375 * 23,172 7,848 4,430 28,782
2000 142,583 * 15,632 9,590 66,990 26,078 39,301 23,357 8,149 4,489 28,9572001 143,734 15,892 9,752 66,860 26,354 39,456 23,520 8,338 4,530 29,0902002 144,863 16,367 9,907 66,240 26,686 39,499 23,728 8,285 4,544 29,3402003 146,510 * 16,729 10,092 66,010 26,870 39,591 24,021 8,353 4,567 29,5622004 147,401 * 16,956 10,244 65,760 NA 39,698 24,065 8,457 4,576 29,748
Continued on the following page.
- 10 -

Table 2. Civilian Labor Force, Employment, and Unemployment Approximating U.S. Concepts, 1960-2004--Continued
United Nether- UnitedYear States Canada Australia Japan France Germany Italy lands Sweden Kingdom
(1) (1) (1)
Civilian Employment (thousands)
1960 65,778 6,042 NA 43,370 18,250 25,710 20,060 NA 3,606 23,6001961 65,746 6,136 NA 43,970 18,300 26,000 20,160 NA 3,640 23,9001962 66,702 * 6,302 NA 44,460 18,450 26,060 20,100 NA 3,663 24,0501963 67,762 6,454 NA 44,860 18,800 26,170 19,760 NA 3,663 24,1201964 69,305 6,688 4,496 45,490 19,190 26,170 19,680 NA 3,662 24,450
1965 71,088 6,944 4,628 46,210 19,340 26,290 19,210 NA 3,700 24,7001966 72,895 7,242 4,785 47,210 19,530 26,220 18,890 NA 3,736 24,7601967 74,372 7,451 4,928 48,180 19,650 25,390 19,130 NA 3,693 24,4701968 75,920 7,593 5,046 49,100 19,640 25,400 19,080 NA 3,737 24,3701969 77,902 7,832 5,188 49,560 19,990 25,790 18,940 NA 3,778 24,390
1970 78,678 7,919 5,388 50,140 20,270 26,100 19,080 NA 3,850 24,3301971 79,367 8,104 5,517 50,470 20,420 26,220 19,020 NA 3,854 24,323 *1972 82,153 * 8,344 5,601 50,590 20,540 26,280 18,710 NA 3,856 24,3941973 85,064 8,761 5,765 51,920 20,840 26,590 18,870 5,050 3,873 24,7851974 86,794 9,125 5,891 51,710 21,030 26,240 19,280 5,100 3,956 24,857
1975 85,846 9,284 5,866 51,530 20,860 25,540 19,400 5,070 4,056 24,7651976 88,752 9,652 * 5,946 52,030 21,030 25,400 19,500 5,100 4,082 24,6181977 92,017 9,825 6,000 52,720 21,220 25,430 19,670 5,210 4,093 24,6461978 96,048 * 10,124 6,038 53,370 21,320 25,650 19,720 5,260 4,109 24,7811979 98,824 10,561 6,111 54,040 21,390 26,080 19,930 5,350 4,174 25,038
1980 99,303 10,872 6,284 54,600 21,440 26,490 20,200 5,520 4,226 24,9251981 100,397 11,192 6,416 55,060 21,330 26,450 20,280 5,550 4,219 24,2631982 99,526 10,847 6,415 55,620 21,390 * 26,150 20,250 5,520 4,213 23,7891983 100,834 10,936 6,300 56,550 21,380 25,770 * 20,320 5,420 * 4,218 23,6141984 105,005 11,211 6,494 56,870 21,200 25,830 20,390 5,490 4,249 24,122
1985 107,150 11,526 6,697 57,260 21,150 26,010 20,490 5,650 4,293 24,4301986 109,597 * 11,873 6,984 * 57,740 21,240 26,380 20,610 * 5,740 4,326 24,5851987 112,440 12,222 7,142 58,320 21,320 26,590 20,590 5,850 4,340 * 25,0791988 114,968 12,590 7,413 59,310 21,520 26,800 20,870 5,884 * 4,410 25,9121989 117,342 12,865 7,734 60,500 21,850 27,200 20,770 5,989 4,480 26,595
1990 118,793 * 12,956 7,877 61,700 22,081 * 27,950 21,080 6,267 4,513 26,7201991 117,718 12,748 7,698 62,920 22,120 36,871 * 21,360 * 6,383 4,447 26,0141992 118,492 12,632 7,660 63,620 22,002 36,390 21,230 6,549 4,265 25,3911993 120,259 12,694 7,699 63,820 21,714 35,989 20,543 * 6,572 4,028 25,1651994 123,060 * 12,960 7,942 63,860 21,750 35,756 20,171 6,664 3,992 25,691
1995 124,900 13,185 8,256 63,900 21,956 35,780 20,030 6,730 4,056 25,6961996 126,708 13,309 8,364 64,200 22,039 35,637 20,120 6,858 4,019 25,9451997 129,558 * 13,607 8,444 64,900 22,169 35,508 20,165 7,163 3,973 26,4181998 131,463 * 13,946 8,618 64,450 22,597 36,061 20,366 7,321 4,034 26,6911999 133,488 * 14,314 8,762 63,920 23,053 36,042 * 20,613 7,595 4,117 27,056
2000 136,891 * 14,676 8,989 63,790 23,693 36,236 20,969 7,912 4,229 27,3732001 136,933 14,866 9,091 63,460 24,128 36,346 21,356 8,130 4,303 27,6042002 136,485 15,221 9,271 62,650 24,293 36,061 21,665 8,059 4,310 27,8172003 137,736 * 15,579 9,481 62,510 24,293 35,754 21,973 8,035 4,303 28,0792004 139,252 * 15,864 9,677 62,630 NA 35,796 22,105 8,061 4,276 28,334
Continued on the following page.
- 11 -

Table 2. Civilian Labor Force, Employment, and Unemployment Approximating U.S. Concepts, 1960-2004--Continued
United Nether- UnitedYear States Canada Australia Japan France Germany Italy lands Sweden Kingdom
(1) (1) (1)
Unemployment (thousands)
1960 3,852 420 NA 750 270 280 760 NA 63 5301961 4,714 439 NA 660 230 160 670 NA 55 4801962 3,911 368 NA 590 270 150 580 NA 55 6701963 4,070 351 NA 590 300 120 480 NA 62 8301964 3,786 306 63 540 240 100 540 NA 58 620
1965 3,366 263 61 570 310 70 690 NA 44 5401966 2,875 251 76 650 320 70 730 NA 59 5701967 2,975 296 94 630 420 340 670 NA 80 8301968 2,817 358 94 590 550 290 700 NA 85 8101969 2,832 362 96 570 480 170 680 NA 73 770
1970 4,093 476 91 590 530 140 640 NA 59 7701971 5,016 535 107 640 580 160 640 NA 101 1,059 *1972 4,882 553 150 730 610 190 740 NA 107 1,1161973 4,365 515 136 680 590 190 720 160 98 9461974 5,156 514 162 730 630 420 620 190 80 949
1975 7,929 690 302 1,000 910 890 690 270 67 1,1741976 7,406 716 * 298 1,080 1,020 890 790 290 66 1,4141977 6,991 836 358 1,100 1,160 900 840 270 75 1,4701978 6,202 898 405 1,240 1,220 870 850 280 94 1,4531979 6,137 831 408 1,170 1,390 780 920 290 88 1,432
1980 7,637 854 409 1,140 1,490 770 920 350 86 1,8331981 8,273 887 394 1,260 1,760 1,090 1,040 540 108 2,6091982 10,678 1,298 495 1,360 1,930 * 1,560 1,160 630 137 2,8751983 10,717 1,437 697 1,560 2,020 1,900 * 1,270 700 * 151 3,0811984 8,539 1,377 641 1,610 2,360 1,970 1,280 710 136 3,241
1985 8,312 1,309 603 1,560 2,470 2,010 1,310 600 125 3,1511986 8,237 1,216 601 * 1,670 2,520 1,860 1,680 * 640 117 3,1611987 7,425 1,123 612 1,730 2,570 1,800 1,760 650 97 * 2,9401988 6,701 1,000 558 1,550 2,460 1,810 1,790 458 * 84 2,4451989 6,528 986 490 1,420 2,320 1,640 1,760 427 72 2,082
1990 7,047 * 1,087 563 1,340 2,084 * 1,460 1,590 390 81 2,0531991 8,628 1,388 788 1,360 2,210 2,204 * 1,580 * 373 144 2,5301992 9,613 1,511 897 1,420 2,443 2,615 1,680 373 255 2,8231993 8,940 1,538 914 1,660 2,776 3,113 2,227 * 442 416 2,9301994 7,996 * 1,376 829 1,920 2,926 3,318 2,421 489 426 2,433
1995 7,404 1,254 739 2,100 2,787 3,200 2,544 478 404 2,4391996 7,236 1,295 751 2,250 2,946 3,505 2,555 443 440 2,2981997 6,739 * 1,256 759 2,300 2,940 3,907 2,584 374 445 1,9871998 6,210 * 1,169 721 2,790 2,837 3,693 2,634 296 368 1,7881999 5,880 * 1,075 652 3,170 2,711 3,333 * 2,559 253 313 1,726
2000 5,692 * 956 602 3,200 2,385 3,065 2,388 237 260 1,5842001 6,801 1,026 661 * 3,400 2,226 3,109 2,164 208 227 1,4862002 8,378 1,146 636 3,590 2,393 3,438 2,062 227 234 1,5242003 8,774 * 1,150 611 3,500 2,577 3,838 2,048 318 264 1,4842004 8,149 * 1,092 567 3,130 2,630 3,899 1,960 396 300 1,414
Continued on the following page.
- 12 -

Table 2. Civilian Labor Force, Employment, and Unemployment Approximating U.S. Concepts, 1960-2004--Continued
United Nether- UnitedYear States Canada Australia Japan France Germany Italy lands Sweden Kingdom
(1) (1) (1)
Civilian Unemployment Rate (percent)
1960 5.5 6.5 1.6 1.7 1.5 1.1 3.7 NA 1.7 2.21961 6.7 6.7 3.0 1.5 1.2 0.6 3.2 NA 1.5 2.01962 5.5 5.5 2.9 1.3 1.4 0.6 2.8 NA 1.5 2.71963 5.7 5.2 2.3 1.3 1.6 0.5 2.4 NA 1.7 3.31964 5.2 4.4 1.4 * 1.2 1.2 0.4 2.7 NA 1.6 2.5
1965 4.5 3.6 1.3 1.2 1.6 0.3 3.5 NA 1.2 2.11966 3.8 3.4 1.6 1.4 1.6 0.3 3.7 NA 1.6 2.31967 3.8 3.8 1.9 1.3 2.1 1.3 3.4 NA 2.1 3.31968 3.6 4.5 1.8 1.2 2.7 1.1 3.5 NA 2.2 3.21969 3.5 4.4 1.8 1.1 2.3 0.6 3.5 NA 1.9 3.1
1970 4.9 5.7 1.6 1.2 2.5 0.5 3.2 NA 1.5 3.11971 5.9 6.2 1.9 1.3 2.8 0.6 3.3 NA 2.6 4.2 *1972 5.6 6.2 2.6 1.4 2.9 0.7 3.8 NA 2.7 4.41973 4.9 5.5 2.3 1.3 2.8 0.7 3.7 3.1 2.5 3.71974 5.6 5.3 2.7 1.4 2.9 1.6 3.1 3.6 2.0 3.7
1975 8.5 6.9 4.9 1.9 4.2 3.4 3.4 5.1 1.6 4.51976 7.7 6.9 * 4.8 2.0 4.6 3.4 3.9 5.4 1.6 5.41977 7.1 7.8 5.6 2.0 5.2 3.4 4.1 4.9 1.8 5.61978 6.1 8.1 6.3 2.3 5.4 3.3 4.1 5.1 2.2 5.51979 5.8 7.3 6.3 2.1 6.1 2.9 4.4 5.1 2.1 5.4
1980 7.1 7.3 6.1 2.0 6.5 2.8 4.4 6.0 2.0 6.91981 7.6 7.3 5.8 2.2 7.6 4.0 4.9 8.9 2.5 9.71982 9.7 10.7 7.2 2.4 8.3 * 5.6 5.4 10.2 3.1 10.81983 9.6 11.6 10.0 2.7 8.6 6.9 * 5.9 11.4 * 3.5 11.51984 7.5 10.9 9.0 2.8 10.0 7.1 5.9 11.5 3.1 11.8
1985 7.2 10.2 8.3 2.7 10.5 7.2 6.0 9.6 2.8 11.41986 7.0 9.3 7.9 * 2.8 10.6 6.6 7.5 * 10.0 2.6 11.41987 6.2 8.4 7.9 2.9 10.8 6.3 7.9 10.0 2.2 * 10.51988 5.5 7.4 7.0 2.5 10.3 6.3 7.9 7.2 * 1.9 8.61989 5.3 7.1 6.0 2.3 9.6 5.7 7.8 6.7 1.6 7.3
1990 5.6 * 7.7 6.7 2.1 8.6 * 5.0 7.0 5.9 1.8 7.11991 6.8 9.8 9.3 2.1 9.1 5.6 * 6.9 * 5.5 3.1 8.91992 7.5 10.7 10.5 2.2 10.0 6.7 7.3 5.4 5.6 10.01993 6.9 10.8 10.6 2.5 11.3 8.0 9.8 * 6.3 9.4 10.41994 6.1 * 9.6 9.4 2.9 11.9 8.5 10.7 6.8 9.6 8.7
1995 5.6 8.7 8.2 3.2 11.3 8.2 11.3 6.6 9.1 8.71996 5.4 8.9 8.2 3.4 11.8 9.0 11.3 6.1 9.9 8.11997 4.9 8.4 8.3 3.4 11.7 9.9 11.4 5.0 10.1 7.01998 4.5 7.7 7.7 4.1 11.2 9.3 11.5 3.9 8.4 6.31999 4.2 7.0 6.9 4.7 10.5 8.5 * 11.0 3.2 7.1 6.0
2000 4.0 6.1 6.3 4.8 9.1 7.8 10.2 2.9 5.8 5.52001 4.7 6.5 6.8 * 5.1 8.4 7.9 9.2 2.5 5.0 5.12002 5.8 7.0 6.4 5.4 9.0 8.7 8.7 2.7 5.1 5.22003 6.0 6.9 6.1 5.3 9.6 9.7 8.5 3.8 5.8 5.02004 5.5 6.4 5.5 4.8 9.8 9.8 8.1 4.7 6.6 4.8
NA = Not available.* Indicates a break in series. See section on breaks in the Country Notes on pages 4-8 for more information.(1) Data approximating U.S. concepts are identical to published data shown in table 3 for all years for the United States and Australiaand for 1966 to 1975 for Canada.
- 13 -

Table 3. Civilian Labor Force, Employment, and Unemployment Published by Originating Country, 1960-2004
United Nether- UnitedYear States Canada Australia Japan France Germany Italy lands Sweden Kingdom
(1) (1) (1)
Labor Force (2) (thousands)
1960 69,628 6,411 NA 45,110 18,887 26,518 21,545 4,192 3,662 24,0721961 70,459 6,521 NA 45,620 18,870 26,772 21,535 4,235 3,688 24,3511962 70,614 * 6,615 NA 46,140 19,024 26,845 21,306 4,319 3,712 24,6281963 71,833 6,748 NA 46,520 19,377 26,930 20,852 4,381 3,720 24,7671964 73,091 6,933 4,559 47,100 19,664 26,922 20,870 4,467 3,718 24,953
1965 74,455 7,141 4,689 47,870 19,857 27,034 20,612 4,512 3,742 25,1391966 75,770 7,493 * 4,862 48,910 20,014 26,962 20,367 4,555 3,792 25,2371967 77,347 7,747 5,022 49,830 20,198 26,409 20,507 4,580 3,775 25,1051968 78,737 7,951 5,140 50,610 21,462 * 26,291 20,555 4,620 3,822 25,0221969 80,734 8,194 5,284 50,980 21,631 26,535 20,369 4,670 3,855 25,028
1970 82,771 8,395 5,478 51,530 21,740 26,817 20,436 4,725 3,913 25,0011971 84,382 8,639 5,624 51,860 21,883 26,957 20,404 4,762 3,961 25,582 *1972 87,034 * 8,897 5,752 51,990 22,214 27,121 20,272 4,781 3,970 25,6941973 89,429 9,276 5,901 53,260 22,433 27,433 20,448 4,780 3,977 25,9631974 91,949 9,639 6,053 53,100 22,718 27,411 20,650 4,807 4,043 25,919
1975 93,775 9,974 6,169 53,230 22,990 27,184 20,861 4,900 4,129 26,0541976 96,158 10,491 * 6,244 53,780 23,205 27,034 21,177 4,932 4,155 26,1931977 99,009 10,785 6,358 54,520 23,489 27,038 21,476 4,972 4,174 26,2401978 102,251 * 11,155 6,443 55,320 23,519 27,212 21,577 5,030 4,209 26,3521979 104,962 11,537 6,519 55,960 23,891 27,528 21,898 5,101 4,268 26,541
1980 106,940 11,879 6,693 56,500 24,122 27,948 22,171 5,296 4,318 26,8631981 108,670 12,236 6,810 57,070 24,196 28,305 22,439 5,552 4,332 27,0931982 110,204 12,302 6,910 57,740 24,339 28,558 22,416 5,665 4,356 26,8921983 111,550 12,528 6,997 58,890 24,347 28,605 22,697 5,624 4,375 26,6531984 113,544 12,748 7,135 59,270 24,435 28,659 22,933 5,669 4,391 27,485
1985 115,461 13,012 7,300 59,630 24,577 28,897 23,117 5,710 4,424 27,7101986 117,834 * 13,272 7,585 * 60,200 24,776 29,188 23,467 * 5,760 4,386 * 27,8371987 119,865 13,527 7,754 60,840 24,826 29,386 23,669 6,395 * 4,373 * 28,0921988 121,669 13,779 7,970 61,660 24,806 29,607 23,988 6,543 4,420 28,4391989 123,869 14,051 8,224 62,700 24,978 29,799 23,870 6,623 4,475 28,815
1990 125,840 * 14,240 8,440 63,840 24,984 30,369 23,925 6,784 4,524 28,9251991 126,346 14,332 8,486 65,050 24,994 41,056 * 24,245 * 6,934 4,506 28,8071992 128,105 14,329 8,557 65,780 25,175 40,856 24,257 7,054 * 4,428 28,4281993 129,200 14,430 8,613 66,150 25,305 40,784 22,992 * 7,009 4,320 28,2341994 131,056 * 14,563 8,770 66,450 25,377 41,002 22,814 7,124 4,266 28,201
1995 132,304 14,673 8,995 66,660 25,515 40,994 22,784 7,361 4,320 28,2021996 133,943 14,835 9,115 67,110 25,804 41,235 22,883 7,472 4,310 28,3451997 136,297 * 15,059 9,204 67,870 25,751 41,593 22,968 7,629 4,264 28,4921998 137,673 * 15,297 9,339 67,930 25,902 41,895 23,225 7,761 4,255 28,4971999 139,368 * 15,575 9,414 67,790 26,100 42,176 23,406 7,898 4,309 28,811
2000 142,583 * 15,842 9,590 67,660 26,272 42,641 23,598 8,020 4,362 29,0712001 143,734 16,111 9,752 67,520 26,425 * 42,763 23,769 8,109 4,414 29,1222002 144,863 16,580 9,907 66,890 26,653 42,732 23,975 8,250 4,420 29,4042003 146,510 * 16,954 10,092 66,660 26,760 42,623 24,289 NA 4,451 29,6482004 147,401 * 17,183 10,244 66,420 26,858 NA 24,365 NA 4,459 29,821
Continued on the following page.
- 14 -

Table 3. Civilian Labor Force, Employment, and Unemployment Published by Originating Country, 1960-2004--Continued
United Nether- UnitedYear States Canada Australia Japan France Germany Italy lands Sweden Kingdom
(1) (1) (1)
Employment (2) (thousands)
1960 65,778 5,965 NA 44,360 18,611 26,247 20,330 4,162 3,599 23,7111961 65,746 6,055 NA 44,980 18,629 26,591 20,427 4,213 3,633 24,0111962 66,702 * 6,225 NA 45,560 18,748 26,690 20,337 4,297 3,657 24,1561963 67,762 6,375 NA 45,950 19,066 26,744 20,045 4,356 3,659 24,2261964 69,305 6,609 4,496 46,550 19,413 26,753 19,966 4,445 3,660 24,570
1965 71,088 6,862 4,628 47,300 19,541 26,887 19,502 4,487 3,698 24,8001966 72,895 7,242 * 4,785 48,270 19,688 26,801 19,175 4,519 3,733 24,8691967 74,372 7,451 4,928 49,200 19,762 25,950 19,401 4,505 3,695 24,5481968 75,920 7,593 5,046 50,020 20,362 * 25,968 19,383 4,552 3,737 24,4471969 77,902 7,832 5,188 50,400 20,633 26,356 19,209 4,621 3,782 24,453
1970 78,678 7,919 5,388 50,940 20,949 26,668 19,325 4,679 3,854 24,3891971 79,367 8,104 5,517 51,210 21,008 26,772 19,295 4,700 3,860 24,559 *1972 82,153 * 8,344 5,601 51,260 21,382 26,875 18,976 4,673 3,862 24,5391973 85,064 8,761 5,765 52,590 21,532 27,160 19,145 4,670 3,879 24,9861974 86,794 9,125 5,891 52,370 21,722 26,829 19,539 4,672 3,962 24,985
1975 85,846 9,284 5,866 52,230 21,479 26,110 19,635 4,640 4,062 24,9651976 88,752 9,748 * 5,946 52,710 21,551 25,974 19,757 4,654 4,088 24,7881977 92,017 9,917 6,000 53,420 21,809 26,008 19,938 4,701 4,099 24,7991978 96,048 * 10,220 6,038 54,080 21,950 26,219 20,017 4,757 4,115 24,8861979 98,824 10,669 6,111 54,790 21,898 26,657 20,212 4,821 4,180 25,136
1980 99,303 10,984 6,284 55,360 22,105 27,059 20,487 4,970 4,232 25,2151981 100,397 11,305 6,416 55,810 21,840 27,033 20,544 5,072 4,225 24,5491982 99,526 10,944 6,415 56,380 21,895 26,725 20,493 5,010 4,219 24,0671983 100,834 11,022 6,300 57,330 21,923 26,347 20,557 4,950 4,224 23,6301984 105,005 11,302 6,494 57,660 21,654 26,393 20,629 4,980 4,255 24,208
1985 107,150 11,627 6,697 58,070 21,631 26,593 20,735 5,076 4,299 24,5541986 109,597 * 11,987 6,984 * 58,530 21,748 26,960 20,857 * 5,155 4,269 * 24,6831987 112,440 12,334 7,142 59,110 21,835 27,157 20,837 5,773 * 4,281 * 25,0311988 114,968 12,708 7,413 60,110 22,050 27,364 21,103 5,934 4,342 25,9131989 117,342 12,986 7,734 61,280 22,348 27,761 21,004 6,065 4,408 26,709
1990 118,793 * 13,079 7,877 62,490 22,579 28,486 21,304 6,268 4,449 26,9221991 117,718 12,851 7,698 63,690 22,591 38,454 * 21,592 * 6,444 4,373 26,3651992 118,492 12,720 7,660 64,360 22,460 37,878 21,459 6,576 * 4,195 25,6321993 120,259 12,782 7,699 64,500 22,171 37,365 20,765 * 6,571 3,964 25,2811994 123,060 * 13,044 7,942 64,530 22,186 37,304 20,393 6,631 3,926 25,451
1995 124,900 13,271 8,256 64,570 22,449 37,382 20,240 6,838 3,988 25,7311996 126,708 13,392 8,364 64,860 22,463 37,270 20,328 6,983 3,963 26,0001997 129,558 * 13,677 8,444 65,570 22,605 37,208 20,384 7,206 3,922 26,4481998 131,463 * 14,019 8,618 65,140 22,950 37,616 20,591 7,425 3,979 26,7131999 133,488 * 14,390 8,762 64,620 23,403 38,077 20,847 7,622 4,068 27,052
2000 136,891 * 14,759 8,989 64,460 23,969 38,752 21,210 7,758 4,159 27,4342001 136,933 14,947 9,091 64,120 24,426 * 38,911 21,604 7,888 4,239 27,6912002 136,485 15,308 9,271 63,300 24,577 38,671 21,913 7,990 4,244 27,8612003 137,736 * 15,665 9,481 63,160 24,589 38,246 22,241 NA 4,234 28,1592004 139,252 * 15,950 9,677 63,290 24,547 NA 22,404 NA 4,213 28,382
Continued on the following page.
- 15 -

Table 3. Civilian Labor Force, Employment, and Unemployment Published by Originating Country, 1960-2004--Continued
United Nether- UnitedYear States Canada Australia Japan France Germany Italy lands Sweden Kingdom
(1) (1) (1)
Unemployment (3) (thousands)
1960 3,852 446 NA 750 276 271 1,215 29 63 3611961 4,714 466 NA 660 241 181 1,108 21 55 3401962 3,911 390 NA 590 276 154 969 21 55 4721963 4,070 374 NA 590 311 186 807 24 62 5411964 3,786 324 63 540 251 169 904 21 58 383
1965 3,366 280 61 570 316 147 1,110 25 44 3391966 2,875 251 * 76 650 326 161 1,192 36 59 3681967 2,975 296 94 630 436 459 1,106 75 80 5571968 2,817 358 94 590 559 * 323 1,172 68 85 5751969 2,832 362 96 570 475 179 1,160 49 73 575
1970 4,093 476 91 590 543 149 1,111 45 59 6121971 5,016 535 107 640 589 185 1,109 62 101 1,023 *1972 4,882 553 150 730 610 246 1,296 108 107 1,1551973 4,365 515 136 680 592 273 1,303 110 98 9771974 5,156 514 162 730 649 582 1,111 135 80 933
1975 7,929 690 302 1,000 942 1,074 1,226 260 * 67 1,0891976 7,406 744 * 298 1,080 1,027 1,060 1,420 278 66 1,4051977 6,991 868 358 1,100 1,190 1,030 1,538 271 75 1,4411978 6,202 934 405 1,240 1,241 993 1,560 273 94 1,4661979 6,137 868 408 1,170 1,404 876 1,686 281 88 1,405
1980 7,637 895 409 1,140 1,511 889 1,684 325 86 1,6481981 8,273 931 394 1,260 1,797 1,272 1,895 480 108 2,5441982 10,678 1,358 495 1,360 1,943 1,833 1,923 655 137 2,8241983 10,717 1,506 697 1,560 2,043 2,258 2,140 801 151 3,0231984 8,539 1,446 641 1,610 2,393 2,265 2,304 822 136 3,278
1985 8,312 1,385 603 1,560 2,475 2,304 2,381 761 125 3,1561986 8,237 1,286 601 * 1,670 2,524 2,228 2,611 * 711 117 * 3,1541987 7,425 1,193 612 1,730 2,564 2,229 2,832 686 92 * 3,0611988 6,701 1,071 558 1,550 2,452 2,242 2,885 433 * 78 2,5261989 6,528 1,065 490 1,420 2,316 2,038 2,865 390 67 2,106
1990 7,047 * 1,161 563 1,340 2,197 1,883 2,621 346 75 2,0041991 8,628 1,481 788 1,360 2,339 2,602 * 2,653 * 319 133 2,4421992 9,613 1,609 897 1,420 2,570 2,978 2,799 336 233 2,7961993 8,940 1,648 914 1,660 2,907 3,419 2,227 * 415 356 2,9531994 7,996 * 1,519 829 1,920 3,049 3,698 2,421 486 340 2,750
1995 7,404 1,402 739 2,100 2,886 3,612 2,544 464 332 2,4701996 7,236 1,443 751 2,250 3,083 3,965 2,555 440 347 2,3441997 6,739 * 1,382 759 2,300 3,107 4,385 2,584 375 342 2,0451998 6,210 * 1,278 721 2,790 2,989 4,279 2,634 286 276 1,7831999 5,880 * 1,185 652 3,170 2,833 4,099 2,559 222 241 1,759
2000 5,692 * 1,084 602 3,200 2,504 3,889 2,388 187 203 1,6382001 6,801 1,164 661 * 3,400 2,325 * 3,852 2,164 146 175 1,4312002 8,378 1,272 636 3,590 2,448 4,061 2,062 170 176 1,5422003 8,774 * 1,289 611 3,500 2,664 4,377 2,048 255 217 1,4892004 8,149 * 1,234 567 3,130 2,727 4,381 1,960 NA 246 1,438
Continued on the following page.
- 16 -

Table 3. Civilian Labor Force, Employment, and Unemployment Published by Originating Country, 1960-2004--Continued
United Nether- UnitedYear States Canada Australia Japan France Germany Italy lands Sweden Kingdom
(1) (1) (1)
Unemployment Rate (4) (percent)
1960 5.5 7.0 1.6 1.7 1.5 1.3 5.6 0.9 1.7 1.61961 6.7 7.2 3.0 1.5 1.3 0.8 5.1 0.6 1.5 1.51962 5.5 5.9 2.9 1.3 1.5 0.7 4.5 0.6 1.5 2.01963 5.7 5.5 2.3 1.3 1.6 0.8 3.9 0.7 1.7 2.41964 5.2 4.7 1.4 * 1.2 1.3 0.8 4.3 0.6 1.6 1.8
1965 4.5 3.9 1.3 1.2 1.6 0.7 5.4 0.7 1.2 1.51966 3.8 3.4 * 1.6 1.4 1.6 0.7 5.9 1.0 1.6 1.51967 3.8 3.8 1.9 1.3 2.2 2.1 5.4 2.0 2.1 2.31968 3.6 4.5 1.8 1.2 2.7 * 1.5 5.7 1.8 2.2 2.51969 3.5 4.4 1.8 1.1 2.3 0.9 5.7 1.3 1.9 2.5
1970 4.9 5.7 1.6 1.2 2.5 0.7 5.4 1.1 1.5 2.61971 5.9 6.2 1.9 1.3 2.7 0.8 5.4 1.6 2.5 4.0 *1972 5.6 6.2 2.6 1.4 2.8 1.1 6.4 2.8 2.7 4.51973 4.9 5.5 2.3 1.3 2.7 1.2 6.4 2.8 2.5 3.81974 5.6 5.3 2.7 1.4 2.9 2.6 5.4 3.5 2.0 3.6
1975 8.5 6.9 4.9 1.9 4.2 4.7 5.9 5.0 * 1.6 4.21976 7.7 7.1 * 4.8 2.0 4.6 4.6 6.7 5.3 1.6 5.41977 7.1 8.0 5.6 2.0 5.2 4.5 7.2 5.1 1.8 5.51978 6.1 8.4 6.3 2.3 5.4 4.3 7.2 5.1 2.2 5.61979 5.8 7.5 6.3 2.1 6.0 3.8 7.7 5.1 2.1 5.3
1980 7.1 7.5 6.1 2.0 6.4 3.8 7.6 5.9 2.0 6.11981 7.6 7.6 5.8 2.2 7.6 5.5 8.4 9.1 2.5 9.41982 9.7 11.0 7.2 2.4 8.2 7.5 8.6 12.6 3.1 10.51983 9.6 12.0 10.0 2.7 8.5 9.1 9.4 17.0 3.5 11.31984 7.5 11.3 9.0 2.8 10.0 9.1 10.0 17.3 3.1 11.9
1985 7.2 10.6 8.3 2.6 10.3 9.3 10.3 15.9 2.8 11.41986 7.0 9.7 7.9 * 2.8 10.4 9.0 11.1 * 14.7 2.7 * 11.31987 6.2 8.8 7.9 2.9 10.5 8.9 12.0 13.9 2.1 * 10.91988 5.5 7.8 7.0 2.5 10.0 8.7 12.0 7.7 * 1.8 8.91989 5.3 7.6 6.0 2.3 9.4 7.9 12.0 6.9 1.5 7.3
1990 5.6 * 8.2 6.7 2.1 8.9 7.2 11.0 5.9 1.7 6.91991 6.8 10.3 9.3 2.1 9.4 6.4 * 10.9 * 5.4 3.0 8.51992 7.5 11.2 10.5 2.2 10.3 7.7 11.5 5.3 5.3 9.81993 6.9 11.4 10.6 2.5 11.6 8.9 9.7 * 6.5 8.2 10.51994 6.1 * 10.4 9.4 2.9 12.1 9.6 10.6 7.5 8.0 9.8
1995 5.6 9.6 8.2 3.2 11.4 9.4 11.2 7.0 7.7 8.81996 5.4 9.7 8.2 3.4 12.1 10.4 11.2 6.6 8.1 8.31997 4.9 9.2 8.3 3.4 12.1 11.4 11.3 5.5 8.0 7.21998 4.5 8.4 7.7 4.1 11.5 11.1 11.3 4.1 6.5 6.31999 4.2 7.6 6.9 4.7 10.8 10.5 10.9 3.1 5.6 6.1
2000 4.0 6.8 6.3 4.7 9.5 9.6 10.1 2.6 4.7 5.62001 4.7 7.2 6.8 * 5.0 8.7 * 9.4 9.1 2.0 4.0 4.92002 5.8 7.7 6.4 5.4 9.1 9.8 8.6 2.3 4.0 5.22003 6.0 7.6 6.1 5.3 9.8 10.5 8.4 3.4 4.9 5.02004 5.5 7.2 5.5 4.7 10.0 10.5 8.0 NA 5.5 4.8
Continued on the following page.
- 17 -

Table 3. Civilian Labor Force, Employment, and Unemployment Published by Originating Country, 1960-2004--Continued
Footnotes:
NA = Not available.
* Indicates a break in series. See section on breaks in the Country Notes on pages 4-8 for more information.
(1) Published data are identical to data approximating U.S. concepts shown in table 2 for all years for the United States and Australiaand for 1966 to 1975 for Canada.
(3) For the United States, Canada, Australia, Japan, Italy, and Sweden, unemployment as recorded by labor force surveys; for France, annual estimates of seasonally adjusted monthly unemployment; for Germany, the registered unemployed; for the Netherlands, a combination of registered unemployed and unemployment as recorded by labor force surveys since 1988; for Netherlands for previous years, the registered unemployed; for the United Kingdom for 1984 forward, unemployment as recorded by labor force surveys; for the United Kingdom for 1971-83, estimated by the Office for National Statistics using time series modeling; and for the United Kingdom for previous years, registered claimants for unemployment benefits.
(4) For the United States, Canada, Australia, and France, unemployment as a percent of the civilian labor force; for Japan, Italy, and Sweden, unemployment as a percent of the civilian labor force plus career military personnel; for Germany, registered unemployed as a percent of the civilian labor force since 1991, for previous years, registered unemployed as a percent of civilian employed wage and salary workers plus the unemployed; for the Netherlands, national estimates of the unemployed as a percent of the total labor force since 1988, for previous years, registered unemployed as a percent of wage and salary workers plus the unemployed; for the United Kingdom, unemployment as a percent of the civilian labor force plus military personnel since 1971 and for previous years, registered claimants for unemployment benefits as a percent of the civilian labor force plus military personnel. Published unemployment rates shown for Germany, the Netherlands, and prior to 1971 for the United Kingdom cannot be derived by dividing published unemployment by published labor force because of these differences in the definition of the national unemployment rate. For France for 1968 onward, publishedunemployment rates also cannot be derived by dividing published unemployment by published labor force because unemploymentand labor force are based on different concepts.
(2) Including military personnel for Japan, Germany, Italy, and Sweden. Published labor force shown for France and the Netherlands cannot be derived by adding published employment and published unemployment because labor force is estimated by the OECD using labor force survey sources, whereas unemployment is estimated by national statistical agencies with statistics from a variety of sources, including those of the registered unemployed. For other countries, subtotals may not add to totals because of rounding.
- 18 -

Table 4. Civilian Labor Force Participation Rates Approximating U.S. Concepts by Sex, 1960-2004
United Nether- UnitedYear States Canada Australia Japan France Germany Italy lands Sweden Kingdom
Both Sexes
1960 59.4 56.2 NA 67.9 59.5 59.8 56.1 NA 66.5 61.91961 59.3 56.2 NA 67.8 58.9 59.9 55.8 NA 66.3 62.11962 58.8 55.9 NA 66.9 57.9 59.6 54.7 NA 65.9 62.11963 58.7 55.9 NA 65.7 57.5 59.4 53.1 NA 65.3 62.31964 58.7 56.2 59.5 64.8 57.6 59.0 52.5 NA 64.5 62.2
1965 58.9 56.5 59.9 64.4 57.4 58.7 51.4 NA 64.1 62.41966 59.2 57.3 60.6 64.6 57.3 58.2 50.0 NA 64.2 62.31967 59.6 57.6 61.2 64.8 57.4 57.0 50.2 NA 63.3 62.01968 59.6 57.6 61.2 64.9 57.1 56.9 49.7 NA 63.8 61.61969 60.1 57.9 61.4 64.6 57.3 57.0 49.3 NA 63.8 61.4
1970 60.4 57.8 62.1 64.5 57.5 56.9 49.0 NA 64.0 61.11971 60.2 58.1 62.2 64.3 57.4 56.5 48.7 NA 64.2 62.8 *1972 60.4 58.6 62.3 63.8 57.2 56.2 47.7 NA 64.1 62.91973 60.8 59.7 62.6 64.0 57.3 56.3 47.6 53.4 64.1 63.11974 61.2 60.5 63.0 63.1 57.4 55.7 47.7 53.5 64.8 63.1
1975 61.2 61.1 63.2 62.4 57.2 55.0 47.7 54.5 65.9 63.11976 61.6 62.5 * 62.7 62.4 57.5 54.6 48.0 54.1 66.0 63.01977 62.3 62.8 62.7 62.5 57.8 54.4 48.2 54.2 65.9 62.81978 63.2 63.7 61.9 62.8 57.7 54.4 47.8 54.0 66.1 62.61979 63.7 64.5 61.6 62.7 57.8 54.5 48.0 54.2 66.6 62.7
1980 63.8 65.0 62.1 62.6 57.5 54.7 48.2 55.4 66.9 62.81981 63.9 65.6 61.9 62.6 57.5 54.7 48.3 56.7 66.8 62.71982 64.0 64.9 61.7 62.7 57.5 * 54.6 47.7 56.6 66.8 61.91983 64.0 65.2 61.4 63.1 57.2 54.3 * 47.5 55.7 * 66.7 61.61984 64.4 65.5 61.5 62.7 57.2 54.4 47.3 55.7 66.6 62.8
1985 64.8 65.9 61.7 62.3 56.8 54.7 47.2 55.5 66.9 62.91986 65.3 66.4 62.8 * 62.1 56.7 54.9 47.8 * 56.0 67.0 62.91987 65.6 66.7 62.9 61.9 56.5 55.0 47.6 56.3 66.4 * 63.21988 65.9 67.1 63.3 61.9 56.2 55.1 47.4 54.4 * 66.9 63.81989 66.5 67.4 64.1 62.2 56.1 55.2 47.3 54.6 67.3 64.3
1990 66.5 * 67.3 64.7 62.6 55.7 * 55.3 47.2 56.2 67.3 64.41991 66.2 66.7 64.2 63.2 55.7 58.8 * 47.7 * 56.6 67.0 63.71992 66.4 65.9 63.9 63.4 55.7 58.1 47.5 57.5 65.7 62.91993 66.3 65.5 63.5 63.3 55.4 57.8 48.3 * 57.9 64.5 62.61994 66.6 * 65.1 63.9 63.1 55.6 57.4 47.6 58.6 63.7 62.4
1995 66.6 64.8 64.5 62.9 55.4 57.1 47.3 58.8 64.1 62.41996 66.8 64.6 64.6 63.0 55.7 57.1 47.3 59.2 64.0 62.41997 67.1 64.9 64.3 63.2 55.6 57.3 47.3 60.8 63.3 62.51998 67.1 65.3 64.3 62.8 55.9 57.7 47.6 61.1 62.8 62.51999 67.1 65.7 64.0 62.4 56.3 56.9 * 47.9 62.6 62.8 62.8
2000 67.1 65.8 64.4 62.0 56.6 56.7 48.1 64.5 63.8 62.92001 66.8 65.9 64.4 61.6 56.9 56.7 48.2 65.6 63.7 62.72002 66.6 66.7 64.4 60.8 57.2 56.5 48.5 64.7 64.0 62.92003 66.2 67.3 64.6 60.3 57.4 56.4 49.1 64.9 64.0 63.02004 66.0 67.3 64.7 60.0 NA NA 49.1 65.5 63.7 63.0
Continued on the following page.
- 19 -
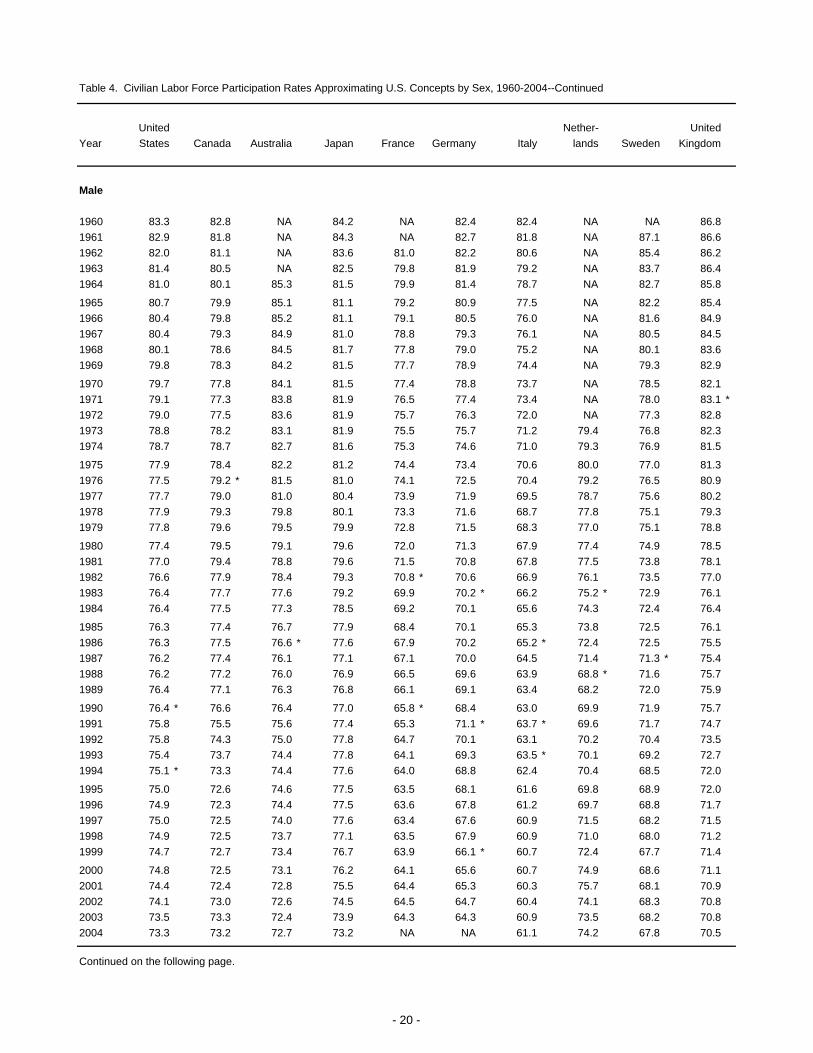
Table 4. Civilian Labor Force Participation Rates Approximating U.S. Concepts by Sex, 1960-2004--Continued
United Nether- UnitedYear States Canada Australia Japan France Germany Italy lands Sweden Kingdom
Male
1960 83.3 82.8 NA 84.2 NA 82.4 82.4 NA NA 86.81961 82.9 81.8 NA 84.3 NA 82.7 81.8 NA 87.1 86.61962 82.0 81.1 NA 83.6 81.0 82.2 80.6 NA 85.4 86.21963 81.4 80.5 NA 82.5 79.8 81.9 79.2 NA 83.7 86.41964 81.0 80.1 85.3 81.5 79.9 81.4 78.7 NA 82.7 85.8
1965 80.7 79.9 85.1 81.1 79.2 80.9 77.5 NA 82.2 85.41966 80.4 79.8 85.2 81.1 79.1 80.5 76.0 NA 81.6 84.91967 80.4 79.3 84.9 81.0 78.8 79.3 76.1 NA 80.5 84.51968 80.1 78.6 84.5 81.7 77.8 79.0 75.2 NA 80.1 83.61969 79.8 78.3 84.2 81.5 77.7 78.9 74.4 NA 79.3 82.9
1970 79.7 77.8 84.1 81.5 77.4 78.8 73.7 NA 78.5 82.11971 79.1 77.3 83.8 81.9 76.5 77.4 73.4 NA 78.0 83.1 *1972 79.0 77.5 83.6 81.9 75.7 76.3 72.0 NA 77.3 82.81973 78.8 78.2 83.1 81.9 75.5 75.7 71.2 79.4 76.8 82.31974 78.7 78.7 82.7 81.6 75.3 74.6 71.0 79.3 76.9 81.5
1975 77.9 78.4 82.2 81.2 74.4 73.4 70.6 80.0 77.0 81.31976 77.5 79.2 * 81.5 81.0 74.1 72.5 70.4 79.2 76.5 80.91977 77.7 79.0 81.0 80.4 73.9 71.9 69.5 78.7 75.6 80.21978 77.9 79.3 79.8 80.1 73.3 71.6 68.7 77.8 75.1 79.31979 77.8 79.6 79.5 79.9 72.8 71.5 68.3 77.0 75.1 78.8
1980 77.4 79.5 79.1 79.6 72.0 71.3 67.9 77.4 74.9 78.51981 77.0 79.4 78.8 79.6 71.5 70.8 67.8 77.5 73.8 78.11982 76.6 77.9 78.4 79.3 70.8 * 70.6 66.9 76.1 73.5 77.01983 76.4 77.7 77.6 79.2 69.9 70.2 * 66.2 75.2 * 72.9 76.11984 76.4 77.5 77.3 78.5 69.2 70.1 65.6 74.3 72.4 76.4
1985 76.3 77.4 76.7 77.9 68.4 70.1 65.3 73.8 72.5 76.11986 76.3 77.5 76.6 * 77.6 67.9 70.2 65.2 * 72.4 72.5 75.51987 76.2 77.4 76.1 77.1 67.1 70.0 64.5 71.4 71.3 * 75.41988 76.2 77.2 76.0 76.9 66.5 69.6 63.9 68.8 * 71.6 75.71989 76.4 77.1 76.3 76.8 66.1 69.1 63.4 68.2 72.0 75.9
1990 76.4 * 76.6 76.4 77.0 65.8 * 68.4 63.0 69.9 71.9 75.71991 75.8 75.5 75.6 77.4 65.3 71.1 * 63.7 * 69.6 71.7 74.71992 75.8 74.3 75.0 77.8 64.7 70.1 63.1 70.2 70.4 73.51993 75.4 73.7 74.4 77.8 64.1 69.3 63.5 * 70.1 69.2 72.71994 75.1 * 73.3 74.4 77.6 64.0 68.8 62.4 70.4 68.5 72.0
1995 75.0 72.6 74.6 77.5 63.5 68.1 61.6 69.8 68.9 72.01996 74.9 72.3 74.4 77.5 63.6 67.8 61.2 69.7 68.8 71.71997 75.0 72.5 74.0 77.6 63.4 67.6 60.9 71.5 68.2 71.51998 74.9 72.5 73.7 77.1 63.5 67.9 60.9 71.0 68.0 71.21999 74.7 72.7 73.4 76.7 63.9 66.1 * 60.7 72.4 67.7 71.4
2000 74.8 72.5 73.1 76.2 64.1 65.6 60.7 74.9 68.6 71.12001 74.4 72.4 72.8 75.5 64.4 65.3 60.3 75.7 68.1 70.92002 74.1 73.0 72.6 74.5 64.5 64.7 60.4 74.1 68.3 70.82003 73.5 73.3 72.4 73.9 64.3 64.3 60.9 73.5 68.2 70.82004 73.3 73.2 72.7 73.2 NA NA 61.1 74.2 67.8 70.5
Continued on the following page.
- 20 -

Table 4. Civilian Labor Force Participation Rates Approximating U.S. Concepts by Sex, 1960-2004--Continued
United Nether- UnitedYear States Canada Australia Japan France Germany Italy lands Sweden Kingdom
Female
1960 37.7 30.1 NA 52.7 NA 41.1 32.3 NA NA 39.81961 38.1 31.0 NA 52.4 NA 41.0 32.5 NA 46.1 40.11962 37.9 31.3 NA 51.3 38.2 40.7 31.6 NA 47.1 40.51963 38.3 31.9 NA 50.0 38.2 40.7 29.7 NA 47.6 40.71964 38.7 32.9 33.8 49.3 38.2 40.3 28.8 NA 46.8 41.2
1965 39.3 33.8 34.8 48.8 38.2 40.0 27.8 NA 46.6 41.71966 40.3 35.4 36.3 49.2 38.2 39.4 26.5 NA 47.3 42.11967 41.1 36.5 37.8 49.6 38.5 38.4 26.6 NA 46.7 41.91968 41.6 37.1 38.3 49.2 38.8 38.5 26.5 NA 48.0 41.91969 42.7 38.0 39.0 48.8 39.2 38.5 26.6 NA 48.8 42.0
1970 43.3 38.3 40.4 48.7 39.8 38.4 26.4 NA 50.0 42.21971 43.4 39.4 41.0 47.7 40.2 38.5 26.3 NA 50.9 44.6 *1972 43.9 40.2 41.2 46.8 40.6 39.0 25.6 NA 51.5 44.91973 44.7 41.9 42.4 47.3 41.0 39.5 26.1 28.5 51.7 45.81974 45.7 43.0 43.5 45.7 41.4 39.4 26.5 28.7 53.3 46.4
1975 46.3 44.4 44.5 44.8 41.7 39.3 26.8 29.5 55.2 46.61976 47.3 46.2 * 44.3 44.9 42.6 39.3 27.6 29.9 55.9 46.71977 48.4 47.0 44.8 45.7 43.3 39.3 28.9 30.6 56.7 46.91978 50.0 48.5 44.5 46.4 43.7 39.6 28.8 31.1 57.5 47.41979 50.9 49.8 44.3 46.6 44.3 39.9 29.5 32.1 58.5 48.0
1980 51.5 51.0 45.5 46.6 44.5 40.3 30.1 34.3 59.3 48.61981 52.1 52.3 45.5 46.7 45.0 40.7 30.4 36.7 60.1 48.61982 52.6 52.2 45.4 47.0 45.6 * 40.7 30.3 37.9 60.5 48.11983 52.9 53.0 45.5 48.0 45.8 40.5 * 30.5 37.1 * 60.8 48.41984 53.6 53.9 46.1 47.8 46.3 40.7 30.5 38.0 61.1 50.2
1985 54.5 54.9 47.1 47.6 46.4 41.1 30.7 37.9 61.5 50.81986 55.3 55.6 49.3 * 47.6 46.7 41.4 31.9 * 40.2 61.7 51.41987 56.0 56.5 49.9 47.6 47.0 41.7 32.1 41.8 61.8 * 52.11988 56.6 57.3 50.8 47.9 47.0 42.3 32.3 40.7 * 62.4 52.91989 57.4 58.0 52.2 48.5 47.0 42.7 32.5 41.5 62.7 53.6
1990 57.5 58.4 53.2 49.1 46.8 * 43.6 32.7 43.1 62.9 54.01991 57.4 58.3 53.0 49.7 47.2 47.7 * 33.2 * 44.0 62.4 53.61992 57.8 57.7 53.0 49.9 47.6 47.4 33.3 45.3 61.2 53.11993 57.9 57.6 52.8 49.6 47.7 47.2 34.5 * 46.2 60.1 53.21994 58.8 * 57.3 53.6 49.5 48.0 47.1 34.2 47.2 59.2 53.5
1995 58.9 57.2 54.7 49.3 48.2 47.1 34.4 48.1 59.5 53.51996 59.3 57.2 54.9 49.3 48.6 47.4 34.7 49.0 59.4 53.81997 59.8 57.6 54.8 49.6 48.6 47.8 34.9 50.5 58.6 54.21998 59.8 58.3 55.0 49.4 49.1 48.3 35.6 51.4 58.0 54.41999 60.0 58.9 55.0 48.9 49.4 48.3 * 36.2 53.1 58.1 54.9
2000 59.9 59.3 55.8 48.6 49.9 48.4 36.6 54.5 59.2 55.22001 59.8 59.6 56.3 48.5 50.1 48.6 37.2 55.7 59.6 55.22002 59.6 60.7 56.4 47.9 50.7 48.8 37.6 55.6 60.0 55.52003 59.5 61.6 57.1 47.7 51.0 49.1 38.3 56.5 59.9 55.62004 59.2 61.7 57.0 47.6 NA NA 38.2 57.0 59.7 55.9
NA = Not available.* Indicates a break in series. See section on breaks in the Country Notes on pages 4-8 for more information.
- 21 -

Table 5. Civilian Employment-Population Ratios Approximating U.S. Concepts by Sex, 1960-2004
United Nether- UnitedYear States Canada Australia Japan France Germany Italy lands Sweden Kingdom
Both Sexes
1960 56.1 52.6 NA 66.7 58.6 59.2 54.0 NA 65.4 60.61961 55.4 52.4 NA 66.8 58.2 59.6 54.0 NA 65.3 60.81962 55.5 52.8 NA 66.0 57.1 59.3 53.2 NA 64.9 60.41963 55.4 53.0 NA 64.9 56.6 59.2 51.9 NA 64.2 60.21964 55.7 53.7 58.6 64.1 56.9 58.8 51.1 NA 63.5 60.7
1965 56.2 54.4 59.1 63.6 56.4 58.5 49.6 NA 63.4 61.01966 56.9 55.4 59.6 63.7 56.4 58.0 48.1 NA 63.2 60.91967 57.3 55.4 60.0 64.0 56.2 56.3 48.5 NA 62.0 60.01968 57.5 55.0 60.1 64.1 55.5 56.2 47.9 NA 62.3 59.61969 58.0 55.3 60.2 63.9 55.9 56.6 47.6 NA 62.6 59.5
1970 57.4 54.5 61.1 63.8 56.0 56.6 47.4 NA 63.1 59.21971 56.6 54.5 61.0 63.4 55.8 56.2 47.1 NA 62.6 60.2 *1972 57.0 54.9 60.6 62.9 55.5 55.8 45.9 NA 62.4 60.11973 57.8 56.4 61.2 63.2 55.8 55.9 45.8 51.8 62.5 60.81974 57.8 57.3 61.3 62.2 55.7 54.8 46.2 51.6 63.6 60.7
1975 56.1 56.9 60.1 61.2 54.8 53.2 46.0 51.7 64.8 60.21976 56.8 58.2 * 59.7 61.1 54.8 52.8 46.1 51.2 64.9 59.61977 57.9 57.9 59.2 61.3 54.8 52.5 46.3 51.6 64.8 59.21978 59.3 58.5 58.0 61.3 54.6 52.6 45.9 51.3 64.6 59.11979 59.9 59.8 57.8 61.4 54.2 52.9 45.9 51.4 65.3 59.3
1980 59.2 60.3 58.3 61.3 53.8 53.1 46.1 52.1 65.6 58.51981 59.0 60.8 58.4 61.2 53.1 52.5 45.9 51.7 65.1 56.61982 57.8 58.0 57.3 61.2 52.7 * 51.6 45.2 50.8 64.7 55.21983 57.9 57.6 55.3 61.4 52.3 50.6 * 44.7 49.3 * 64.4 54.51984 59.5 58.3 56.0 61.0 51.4 50.5 44.5 49.3 64.5 55.3
1985 60.1 59.2 56.6 60.7 50.9 50.7 44.4 50.1 65.0 55.71986 60.7 60.2 57.8 * 60.4 50.7 51.3 44.2 * 50.3 65.2 55.81987 61.5 61.2 57.9 60.1 50.4 51.5 43.8 50.7 65.0 * 56.61988 62.3 62.2 58.9 60.4 50.4 51.6 43.7 50.5 * 65.7 58.31989 63.0 62.6 60.3 60.8 50.7 52.0 43.6 51.0 66.2 59.6
1990 62.8 * 62.1 60.4 61.3 50.9 * 52.6 43.9 52.9 66.1 59.81991 61.7 60.2 58.2 61.8 50.7 55.5 * 44.5 * 53.5 64.9 58.11992 61.5 58.9 57.2 62.0 50.1 54.2 44.0 54.4 62.0 56.61993 61.7 58.4 56.8 61.7 49.2 53.2 43.6 * 54.3 58.5 56.01994 62.5 * 58.9 57.8 61.3 49.0 52.6 42.5 54.6 57.6 57.0
1995 62.9 59.2 59.2 60.9 49.2 52.4 42.0 54.9 58.3 57.01996 63.2 59.0 59.3 60.9 49.1 52.0 42.0 55.6 57.7 57.31997 63.8 59.5 59.0 61.0 49.1 51.6 41.9 57.8 56.9 58.21998 64.1 60.3 59.3 60.2 49.7 52.3 42.2 58.7 57.6 58.51999 64.3 61.2 59.6 59.4 50.4 52.1 * 42.6 60.6 58.4 59.1
2000 64.4 61.9 60.3 59.0 51.5 52.2 43.2 62.7 60.1 59.42001 63.7 61.9 60.1 58.4 52.1 52.2 43.8 63.9 60.5 59.52002 62.7 62.4 60.3 57.5 52.1 51.6 44.3 62.9 60.7 59.62003 62.3 63.0 60.7 57.1 51.9 51.0 44.9 62.4 60.3 59.82004 62.3 63.4 61.2 57.1 NA NA 45.1 62.4 59.5 60.0
Continued on the following page.
- 22 -

Table 5. Civilian Employment-Population Ratios Approximating U.S. Concepts by Sex, 1960-2004--Continued
United Nether- UnitedYear States Canada Australia Japan France Germany Italy lands Sweden Kingdom
Male
1960 78.9 76.9 NA 82.8 NA 81.8 79.5 NA NA 85.01961 77.6 75.8 NA 83.2 NA 82.3 79.4 NA 86.3 84.91962 77.7 76.3 NA 82.7 80.1 81.8 78.6 NA 84.2 83.91963 77.1 76.1 NA 81.5 79.0 81.6 77.6 NA 82.6 83.51964 77.3 76.5 84.5 80.6 79.2 81.1 77.0 NA 81.6 83.7
1965 77.5 76.9 84.4 80.2 78.4 80.7 75.2 NA 81.5 83.51966 77.9 77.1 84.2 80.1 78.2 80.3 73.5 NA 80.6 82.91967 78.0 76.3 83.8 80.0 77.7 78.2 73.9 NA 78.9 81.51968 77.8 75.1 83.5 80.7 76.3 78.1 73.0 NA 78.2 80.61969 77.6 74.9 83.2 80.5 76.5 78.5 72.4 NA 77.8 80.0
1970 76.2 73.4 83.2 80.5 76.3 78.4 71.9 NA 77.4 79.21971 74.9 72.7 82.7 80.9 75.3 77.1 71.6 NA 76.2 80.1 *1972 75.0 73.0 82.0 80.6 74.4 75.8 69.9 NA 75.4 79.61973 75.5 74.3 81.8 80.8 74.2 75.3 69.3 77.3 75.1 79.91974 74.9 74.9 81.1 80.5 73.9 73.5 69.4 77.1 75.6 79.0
1975 71.7 73.5 79.1 79.5 72.1 70.9 68.8 76.9 76.0 77.91976 72.0 74.2 * 78.3 79.2 71.8 70.3 68.5 75.9 75.6 76.71977 72.8 73.3 77.3 78.7 71.2 69.9 67.5 75.7 74.5 75.91978 73.8 73.4 75.5 78.2 70.4 69.7 66.8 75.0 73.5 75.31979 73.8 74.3 75.3 78.2 69.6 69.8 66.3 74.3 73.7 75.0
1980 72.0 74.0 75.1 77.9 68.9 69.6 66.0 74.1 73.6 73.31981 71.3 73.9 75.1 77.8 67.5 68.5 65.6 72.2 72.0 70.11982 69.0 69.3 73.4 77.4 66.3 * 67.0 64.4 69.5 71.3 68.01983 68.8 68.3 70.1 77.1 65.2 65.8 * 63.5 67.4 * 70.4 66.71984 70.7 68.9 70.5 76.4 63.6 65.7 62.9 66.6 70.2 67.2
1985 70.9 69.4 70.6 75.9 62.4 65.8 62.5 67.6 70.5 67.21986 71.0 70.3 70.8 * 75.4 61.9 66.4 61.8 * 66.7 70.6 66.61987 71.5 71.0 70.3 74.9 61.2 66.2 60.9 66.1 69.7 * 67.21988 72.0 71.7 71.0 75.0 61.1 66.0 60.4 65.2 * 70.3 69.01989 72.5 71.7 72.1 75.1 61.2 65.9 59.9 65.0 70.9 70.3
1990 72.0 * 70.5 71.4 75.4 61.4 * 65.6 60.0 67.0 70.6 70.01991 70.4 67.6 68.2 75.8 60.6 67.9 * 60.6 * 66.9 69.2 67.31992 69.8 65.7 66.6 76.1 59.4 66.3 59.8 67.3 65.7 64.81993 70.0 65.2 66.0 75.9 57.8 64.7 58.8 * 66.2 61.6 63.71994 70.4 * 65.9 67.2 75.4 57.4 63.8 57.2 66.2 61.0 64.8
1995 70.8 66.0 68.2 75.0 57.4 63.1 56.2 65.9 62.1 64.81996 70.9 65.7 68.1 74.9 57.0 62.1 55.8 66.3 61.6 64.91997 71.3 66.3 67.7 74.9 56.8 61.3 55.5 68.8 61.1 65.91998 71.6 66.7 67.9 73.9 57.4 61.9 55.4 68.9 62.1 66.31999 71.6 67.5 68.2 73.0 58.1 60.7 * 55.5 70.7 62.7 66.7
2000 71.9 68.1 68.4 72.5 59.2 60.6 55.8 73.2 64.3 66.92001 70.9 67.7 67.7 71.5 59.8 60.2 56.0 74.1 64.5 66.92002 69.7 67.9 67.8 70.4 59.3 59.0 56.3 72.2 64.4 66.72003 68.9 68.3 68.1 69.9 58.7 57.8 56.9 70.8 63.9 66.92004 69.2 68.6 68.8 69.6 NA NA 57.1 71.0 63.1 66.9
Continued on the following page.
- 23 -

Table 5. Civilian Employment-Population Ratios Approximating U.S. Concepts by Sex, 1960-2004--Continued
United Nether- UnitedYear States Canada Australia Japan France Germany Italy lands Sweden Kingdom
Female
1960 35.5 28.6 NA 51.8 NA 40.4 31.0 NA NA 38.91961 35.4 29.4 NA 51.6 NA 40.7 31.1 NA 45.0 39.31962 35.6 29.9 NA 50.6 37.4 40.4 30.4 NA 46.3 39.41963 35.8 30.5 NA 49.3 37.2 40.4 28.8 NA 46.5 39.41964 36.3 31.6 32.9 48.7 37.5 40.1 27.7 NA 46.0 40.1
1965 37.1 32.6 34.0 48.1 37.3 39.9 26.6 NA 45.8 40.81966 38.3 34.2 35.4 48.4 37.2 39.3 25.2 NA 46.4 41.21967 39.0 35.1 36.6 48.9 37.2 38.0 25.3 NA 45.6 40.71968 39.6 35.5 37.1 48.7 37.1 38.0 25.1 NA 47.0 40.81969 40.7 36.2 37.7 48.3 37.7 38.2 25.1 NA 47.9 41.1
1970 40.8 36.1 39.3 48.2 38.1 38.1 25.0 NA 49.1 41.21971 40.4 36.8 39.7 47.2 38.4 38.2 24.9 NA 49.5 42.3 *1972 41.0 37.4 39.6 46.2 38.7 38.6 24.1 NA 50.0 42.61973 42.0 39.1 40.9 46.8 39.2 39.1 24.5 27.3 50.3 43.61974 42.6 40.2 41.7 45.1 39.4 38.7 25.1 27.1 52.0 44.2
1975 42.0 40.8 41.4 44.0 39.2 37.9 25.3 27.1 54.0 44.21976 43.2 42.6 * 41.5 44.1 39.6 37.8 25.8 27.3 54.7 44.01977 44.5 42.9 41.5 44.9 40.0 37.7 26.9 28.2 55.4 44.01978 46.4 44.0 41.0 45.5 40.4 37.9 26.9 28.4 56.1 44.41979 47.5 45.7 40.7 45.7 40.5 38.4 27.3 29.2 57.2 45.0
1980 47.7 46.9 41.9 45.7 40.3 38.9 27.9 31.0 58.0 45.11981 48.0 48.2 42.1 45.7 40.2 38.7 28.0 31.9 58.5 44.31982 47.7 47.0 41.5 45.9 40.5 * 38.1 27.7 32.8 58.4 43.51983 48.0 47.3 40.8 46.7 40.7 37.3 * 27.6 31.9 * 58.6 43.31984 49.5 48.2 41.8 46.5 40.6 37.3 27.6 32.7 59.1 44.4
1985 50.4 49.4 43.0 46.3 40.5 37.6 27.8 33.4 59.7 45.21986 51.4 50.5 45.1 * 46.2 40.7 38.0 28.1 * 34.7 60.1 45.81987 52.5 51.7 45.8 46.2 40.7 38.5 28.3 35.8 60.5 * 46.91988 53.4 53.0 47.0 46.6 40.9 39.0 28.3 36.5 * 61.2 48.51989 54.3 53.9 48.8 47.4 41.2 39.7 28.6 37.5 61.7 49.9
1990 54.3 54.1 49.5 48.0 41.6 * 40.9 29.2 39.4 61.8 50.31991 53.7 53.1 48.4 48.6 41.7 44.3 * 29.7 * 40.5 60.6 49.61992 53.8 52.3 48.0 48.7 41.7 43.4 29.7 42.1 58.4 49.11993 54.1 51.9 47.7 48.3 41.4 42.7 29.7 * 42.7 55.5 49.01994 55.3 * 52.3 48.8 48.0 41.4 42.3 29.2 43.5 54.3 49.8
1995 55.6 52.6 50.5 47.7 41.8 42.7 29.1 44.2 54.7 49.81996 56.0 52.5 50.6 47.7 42.0 42.8 29.4 45.2 53.9 50.31997 56.8 53.0 50.5 47.9 42.1 42.7 29.6 47.1 53.0 51.01998 57.1 54.1 51.0 47.4 42.8 43.5 30.1 48.8 53.4 51.41999 57.4 55.1 51.3 46.6 43.4 44.1 * 30.8 50.7 54.2 52.0
2000 57.5 56.0 52.5 46.4 44.5 44.4 31.6 52.4 56.1 52.52001 57.0 56.2 52.6 46.2 45.1 44.8 32.7 54.0 56.8 52.72002 56.3 57.1 52.9 45.4 45.6 44.7 33.3 53.9 57.1 53.02003 56.1 58.0 53.6 45.3 45.7 44.6 34.0 54.2 56.8 53.22004 56.0 58.3 53.8 45.5 NA NA 34.2 54.0 56.1 53.5
NA = Not available. * Indicates a break in series. See section on breaks in the Country Notes on pages 4-8 for more information.
- 24 -

Table 6. Civilian Employment Approximating U.S. Concepts by Economic Sector, 1960-2004 (in thousands)
United Nether- UnitedYear States Canada Australia Japan France Germany Italy lands Sweden Kingdom
(1) (1)
Civilian Employment (2)
1960 65,778 5,965 NA 43,370 18,595 25,877 20,064 4,576 3,581 23,6601965 71,088 * 6,862 4,614 46,200 19,540 26,368 19,210 4,933 3,680 24,7761970 78,678 7,919 5,388 50,140 20,328 26,107 19,083 5,156 3,836 24,3811971 79,367 8,104 5,517 50,470 20,440 26,222 19,016 5,152 3,842 24,1661972 82,153 * 8,344 5,601 50,580 20,570 26,290 18,710 5,136 3,845 24,1411973 85,064 8,761 5,765 51,900 20,863 26,593 18,874 5,135 3,861 24,7161974 86,794 9,125 5,891 51,710 21,057 26,247 19,284 5,119 3,944 24,803
1975 85,846 9,284 5,866 51,530 20,864 25,536 19,395 5,109 4,044 24,7231976 88,752 9,748 * 5,946 52,020 21,016 25,395 19,504 5,142 4,070 24,5041977 92,017 9,917 6,000 52,720 21,186 25,426 19,668 5,199 4,081 24,5381978 96,048 * 10,220 6,038 53,360 21,263 25,646 19,725 5,265 4,097 24,6971979 98,824 10,669 6,111 54,040 21,305 26,074 19,932 5,382 4,162 25,078
1980 99,303 10,984 6,284 54,600 21,334 26,486 20,195 5,520 4,214 25,0041981 100,397 11,305 6,416 55,060 21,203 26,453 20,279 5,542 4,207 24,0101982 99,526 10,944 6,415 55,620 21,240 * 26,149 20,246 5,475 4,201 23,5841983 100,834 11,022 6,300 56,550 21,167 25,765 20,320 5,459 4,206 23,3051984 105,005 11,302 6,494 56,870 20,981 25,826 20,392 5,528 4,237 23,854 *
1985 107,150 11,627 6,697 57,260 20,916 26,018 20,492 5,624 4,281 24,2501986 109,597 * 11,987 6,984 * 57,740 20,957 26,383 20,614 5,720 4,314 24,3801987 112,440 12,334 7,142 58,320 21,023 26,584 20,591 5,773 * 4,328 * 24,7541988 114,968 12,708 7,413 59,310 21,196 26,799 20,868 5,933 4,398 25,7081989 117,342 12,986 7,734 60,500 21,457 27,201 20,773 6,065 4,468 26,549
1990 118,793 * 13,079 7,877 61,700 22,076 * 27,952 21,080 6,267 4,501 26,8181991 117,718 12,851 7,698 62,920 22,114 36,871 * 21,364 * 6,444 4,435 26,3021992 118,492 12,720 7,660 63,630 22,000 36,390 21,233 6,518 * 4,253 25,671 *1993 120,259 12,782 7,699 63,820 21,714 35,989 20,543 * 6,571 4,015 25,3811994 123,060 * 13,044 7,942 63,860 21,745 35,756 20,171 6,631 3,981 25,599
1995 124,900 13,271 8,256 63,900 21,956 35,780 20,030 6,838 4,044 25,8911996 126,708 13,392 8,364 64,200 22,036 35,637 20,120 6,983 4,007 26,1911997 129,558 * 13,677 8,444 64,900 22,176 35,508 20,165 7,207 3,961 26,6951998 131,463 * 14,019 8,618 64,450 22,597 36,061 20,366 7,424 4,023 27,0051999 133,488 * 14,390 8,762 63,930 23,054 36,042 * 20,613 7,623 4,105 27,315
2000 136,891 * 14,759 8,989 63,790 23,695 36,236 20,969 7,757 4,217 27,6772001 136,933 14,947 9,091 63,460 24,123 36,346 21,356 7,888 4,291 27,9672002 136,485 15,308 9,271 62,650 24,262 36,061 21,665 7,989 4,299 28,3232003 137,736 * 15,665 9,481 62,510 24,296 35,754 21,973 NA 4,290 28,6232004 139,252 * 15,950 9,677 62,625 NA 35,686 22,105 NA 4,264 NA
Continued on the following page.
- 25 -

Table 6. Civilian Employment Approximating U.S. Concepts by Economic Sector, 1960-2004 (in thousands)--Continued
United Nether- UnitedYear States Canada Australia Japan France Germany Italy lands Sweden Kingdom
(1) (1)
Agriculture (3)
1960 5,552 795 NA 12,800 4,180 3,567 6,514 469 564 1,1181965 4,477 * 694 448 10,500 3,473 2,840 5,031 391 418 9521970 3,567 604 434 8,490 2,751 2,218 3,839 329 314 7841971 3,510 607 426 7,840 2,612 NA 3,817 322 300 7641972 3,598 * 575 442 7,310 2,468 NA 3,546 317 287 7351973 3,572 573 424 6,810 2,345 NA 3,431 311 276 7361974 3,613 579 410 6,540 2,242 NA 3,362 306 264 699
1975 3,505 564 407 6,380 2,156 NA 3,231 303 261 6871976 3,453 568 * 392 6,210 2,082 NA 3,201 295 254 6851977 3,426 555 400 6,110 2,013 NA 3,100 292 248 6841978 3,550 * 544 384 6,100 1,954 NA 3,032 297 250 6801979 3,508 563 399 5,860 1,908 NA 2,962 291 242 666
1980 3,529 562 410 5,510 1,854 1,373 2,870 285 237 6541981 3,519 570 419 5,330 1,791 1,335 2,704 288 237 6391982 3,570 559 415 5,250 1,732 * 1,289 2,502 288 236 6321983 3,541 572 418 5,060 1,677 1,247 2,500 287 230 6221984 3,469 564 405 4,860 1,627 1,209 2,390 288 218 622 *
1985 3,338 652 414 4,820 1,582 1,163 2,262 289 208 5711986 3,350 * 574 429 * 4,700 1,534 1,141 2,214 287 204 5411987 3,400 568 415 4,640 1,479 1,093 2,139 285 * 194 * 5721988 3,326 564 435 4,480 1,425 1,050 2,037 285 193 6011989 3,378 555 429 4,390 1,368 1,000 1,927 287 192 593
1990 3,394 * 550 441 4,270 1,258 * 965 1,879 292 178 5771991 3,429 561 423 3,990 1,202 1,514 * 1,807 * 295 168 5981992 3,425 546 406 3,910 1,152 1,392 1,734 267 * 162 571 *1993 3,300 553 411 3,650 1,096 1,269 1,352 * 262 159 5211994 3,586 * 555 406 3,550 1,047 1,187 1,280 271 154 535
1995 3,592 537 410 3,510 1,013 1,127 1,208 264 143 5341996 3,570 531 421 3,390 987 1,073 1,155 278 131 5121997 3,538 * 526 433 3,320 972 1,035 1,122 275 122 4971998 3,509 * 538 424 3,250 962 1,022 1,083 252 119 4661999 3,416 * 518 435 3,160 943 1,026 * 1,022 247 128 426
2000 2,464 * 489 446 3,080 922 959 1,007 264 122 4272001 2,299 423 440 2,970 905 952 1,009 237 111 3912002 2,311 425 413 2,810 887 909 982 248 106 3932003 2,275 * 431 374 2,780 870 875 959 NA 107 3582004 2,232 * 422 367 2,706 NA 864 981 NA 106 NA
Continued on the following page.
- 26 -

Table 6. Civilian Employment Approximating U.S. Concepts by Economic Sector, 1960-2004 (in thousands)--Continued
United Nether- UnitedYear States Canada Australia Japan France Germany Italy lands Sweden Kingdom
(1) (1) (5)
Industry (4)
1960 21,995 1,906 NA 12,380 6,976 11,905 6,855 1,786 1,419 10,9001965 24,311 * 2,233 1,653 15,010 7,486 12,497 7,174 1,952 1,550 11,1171970 26,080 2,360 1,866 17,880 7,812 12,706 7,586 1,933 1,456 10,5311971 25,182 2,383 1,895 18,140 7,869 NA 7,613 1,881 1,424 10,1561972 25,827 * 2,439 1,877 18,290 7,929 NA 7,463 1,829 1,396 9,9401973 27,258 2,586 1,924 19,210 8,076 NA 7,450 1,801 1,401 10,1101974 27,213 2,688 1,942 19,020 8,131 NA 7,609 1,755 1,434 10,080
1975 25,301 2,613 1,850 18,370 7,883 NA 7,630 1,697 1,449 9,6321976 26,310 2,694 * 1,846 18,520 7,810 NA 7,521 1,662 1,416 9,3451977 27,343 2,696 1,825 18,510 7,773 NA 7,612 1,666 1,375 9,3241978 28,809 * 2,766 1,772 18,550 7,650 NA 7,570 1,673 1,328 9,3121979 29,797 2,907 1,770 18,740 7,540 NA 7,578 1,670 1,326 9,344
1980 29,136 2,959 1,798 19,180 7,475 11,373 7,694 1,642 1,327 9,0591981 28,995 3,004 1,814 19,300 7,266 11,162 7,642 1,573 1,286 8,2421982 27,070 2,696 1,759 19,210 7,139 * 10,806 7,523 1,505 1,237 7,8171983 27,016 2,643 1,634 19,470 6,941 10,473 7,347 1,488 1,223 7,4531984 28,617 2,716 1,657 19,630 6,692 10,399 7,036 1,508 1,228 8,106 *
1985 28,805 2,767 1,703 19,820 6,485 10,437 6,890 1,494 1,244 8,1281986 29,130 * 2,869 1,728 * 19,760 6,365 10,521 6,816 1,493 1,258 8,0331987 29,209 2,952 1,757 19,560 6,262 10,493 6,710 1,517 * 1,242 * 7,8461988 29,676 3,070 1,818 20,120 6,206 10,463 6,783 1,524 1,246 8,1441989 30,051 3,138 1,919 20,600 6,246 10,588 6,749 1,568 1,269 8,388
1990 29,834 * 3,062 1,880 20,890 6,343 * 10,875 6,842 1,620 1,268 8,3501991 28,452 2,821 1,741 21,520 6,254 14,661 * 6,913 * 1,613 1,207 7,8811992 27,853 2,706 1,707 21,850 6,038 14,152 6,847 1,597 * 1,087 7,406 *1993 27,659 2,635 1,730 21,670 5,731 13,611 6,599 * 1,577 982 7,1791994 28,319 * 2,715 1,778 21,490 5,574 13,098 6,470 1,519 956 6,895
1995 28,788 2,806 1,809 21,160 5,574 12,648 6,359 1,555 1,011 6,9041996 29,030 2,817 1,811 21,130 5,488 12,273 6,302 1,558 1,008 7,0171997 29,771 * 2,929 1,810 21,250 5,411 12,033 6,260 1,604 992 7,0091998 29,871 * 3,017 1,817 20,420 5,409 12,121 6,312 1,606 1,001 7,0361999 29,622 * 3,122 1,809 19,990 5,413 11,959 * 6,339 1,641 996 6,936
2000 30,050 * 3,223 1,901 19,710 5,510 11,897 6,353 1,656 999 6,8542001 29,127 3,234 1,844 19,120 5,589 11,731 6,413 1,679 995 6,7822002 27,716 3,326 1,892 18,170 5,538 11,403 6,485 1,626 969 6,6312003 27,565 * 3,369 1,932 17,800 5,472 11,008 6,602 NA 944 6,5592004 27,791 * 3,437 2,002 17,301 NA 10,796 6,650 NA 935 NA
Continued on the following page.
- 27 -

Table 6. Civilian Employment Approximating U.S. Concepts by Economic Sector, 1960-2004 (in thousands)--Continued
United Nether- UnitedYear States Canada Australia Japan France Germany Italy lands Sweden Kingdom
(1) (1) (6)
Manufacturing
1960 17,149 1,471 NA 9,430 5,250 8,901 4,813 1,326 1,133 8,5171965 19,190 * 1,636 1,207 11,450 5,373 9,480 4,894 1,410 1,200 8,6661970 20,746 1,768 1,312 13,750 5,593 10,305 5,293 1,381 1,064 8,4651971 19,606 1,766 1,330 13,820 5,676 NA 5,329 1,348 1,054 8,2021972 19,943 * 1,823 1,316 13,810 5,749 NA 5,217 1,310 1,046 7,9341973 21,054 1,927 1,346 14,420 5,882 NA 5,259 1,298 1,066 7,9791974 21,025 1,978 1,351 14,250 5,953 NA 5,420 1,287 1,120 8,030
1975 19,457 1,871 1,249 13,430 5,798 NA 5,424 1,251 1,138 7,6541976 20,261 1,861 * 1,262 13,440 5,745 NA 5,406 1,214 1,100 7,4111977 20,889 1,849 1,254 13,350 5,721 NA 5,437 1,206 1,060 7,4611978 21,784 * 1,914 1,199 13,220 5,640 NA 5,380 1,196 1,023 7,4271979 22,459 2,035 1,198 13,290 5,556 NA 5,364 1,183 1,026 7,395
1980 21,942 2,080 1,222 13,630 5,495 8,998 5,433 1,176 1,025 7,0811981 21,817 2,080 1,230 13,800 5,321 8,828 5,328 1,155 984 6,3651982 20,286 1,873 1,190 13,740 5,249 * 8,567 5,228 1,098 946 6,0051983 19,946 1,843 1,122 14,010 5,136 8,284 5,074 1,069 941 5,6681984 20,995 1,920 1,125 14,330 4,997 8,285 4,876 1,084 953 5,916 *
1985 20,879 1,924 1,125 14,480 4,853 8,403 4,761 1,094 968 5,9681986 20,962 * 2,011 1,135 * 14,390 4,749 8,515 4,715 1,110 984 5,9651987 20,935 2,038 1,149 14,200 4,638 8,506 4,636 1,121 * 953 * 5,7131988 21,320 2,106 1,184 14,500 4,569 8,479 4,719 1,113 956 5,9981989 21,652 2,134 1,215 14,800 4,588 8,594 4,726 1,157 968 6,010
1990 21,346 * 2,054 1,184 15,010 4,642 * 8,839 4,755 1,196 943 5,9701991 20,580 1,899 1,107 15,460 4,577 11,315 * 4,729 * 1,178 884 5,7181992 20,120 1,824 1,094 15,650 4,431 10,731 4,676 1,189 * 804 5,440 *1993 19,711 1,787 1,087 15,260 4,223 10,099 4,952 * 1,160 734 5,3381994 20,157 * 1,828 1,118 14,920 4,108 9,525 4,891 1,105 726 4,905
1995 20,493 1,907 1,119 14,520 4,115 9,017 4,831 1,122 770 4,9421996 20,518 1,926 1,123 14,420 4,073 8,643 4,781 1,107 773 5,0761997 20,835 * 2,016 1,143 14,390 4,035 8,521 4,746 1,128 763 5,0241998 20,733 * 2,102 1,106 13,790 4,047 8,688 4,820 1,129 770 5,0241999 20,070 * 2,202 1,071 13,410 4,031 8,591 * 4,820 1,147 759 4,900
2000 19,644 * 2,254 1,129 13,180 4,081 8,646 4,796 1,160 761 4,7522001 18,434 2,230 1,095 12,800 4,127 8,626 4,774 1,147 751 4,6152002 17,233 2,291 1,106 11,990 4,059 8,491 4,814 1,116 722 4,4432003 16,902 * 2,283 1,085 11,750 3,971 8,249 4,863 NA 696 4,2682004 16,484 * 2,297 1,093 11,466 NA 8,090 4,821 NA 683 NA
Continued on the following page.
- 28 -

Table 6. Civilian Employment Approximating U.S. Concepts by Economic Sector, 1960-2004 (in thousands)--Continued
United Nether- UnitedYear States Canada Australia Japan France Germany Italy lands Sweden Kingdom
(1) (1)
Services (7)
1960 38,212 3,264 NA 18,190 7,314 10,405 6,696 2,322 1,598 11,6421965 42,301 * 3,934 2,514 20,690 8,581 11,031 7,005 2,587 1,713 12,7091970 49,031 4,955 3,088 23,770 9,765 11,183 7,658 2,894 2,066 13,0661971 50,675 5,114 3,196 24,490 9,959 NA 7,586 2,949 2,118 13,2461972 52,728 * 5,330 3,282 24,980 10,173 NA 7,701 2,990 2,162 13,4661973 54,234 5,602 3,417 25,880 10,442 NA 7,993 3,023 2,184 13,8701974 55,968 5,858 3,539 26,150 10,684 NA 8,313 3,058 2,246 14,024
1975 57,040 6,107 3,609 26,780 10,825 NA 8,534 3,109 2,334 14,4041976 58,989 6,486 * 3,708 27,290 11,124 NA 8,782 3,185 2,400 14,4741977 61,248 6,666 3,775 28,100 11,400 NA 8,956 3,241 2,458 14,5301978 63,689 * 6,910 3,882 28,710 11,659 NA 9,123 3,295 2,519 14,7051979 65,519 7,199 3,942 29,440 11,857 NA 9,392 3,421 2,594 15,068
1980 66,638 7,463 4,076 29,910 12,005 13,740 9,631 3,593 2,650 15,2911981 67,883 7,731 4,183 30,430 12,146 13,956 9,933 3,681 2,684 15,1291982 68,886 7,689 4,241 31,160 12,369 * 14,054 10,221 3,682 2,728 15,1351983 70,277 7,807 4,248 32,020 12,549 14,045 10,473 3,684 2,753 15,2301984 72,919 8,022 4,432 32,380 12,662 14,218 10,966 3,732 2,791 15,126 *
1985 75,007 8,208 4,580 32,620 12,849 14,418 11,340 3,841 2,829 15,5511986 77,117 * 8,544 4,827 * 33,280 13,058 14,721 11,584 3,940 2,852 15,8061987 79,831 8,814 4,970 34,120 13,282 14,998 11,742 3,971 * 2,892 * 16,3361988 81,966 9,074 5,160 34,710 13,565 15,286 12,048 4,124 2,959 16,9631989 83,913 9,293 5,386 35,510 13,843 15,613 12,097 4,210 3,007 17,568
1990 85,565 * 9,467 5,556 36,540 14,475 * 16,112 12,359 4,355 3,055 17,8911991 85,837 9,469 5,534 37,410 14,658 20,696 * 12,644 * 4,536 3,060 17,8231992 87,214 9,468 5,547 37,870 14,810 20,846 12,652 4,654 * 3,004 17,694 *1993 89,300 9,594 5,558 38,500 14,887 21,109 12,592 * 4,732 2,874 17,6811994 91,155 * 9,774 5,758 38,820 15,124 21,471 12,421 4,841 2,871 18,169
1995 92,520 9,928 6,037 39,230 15,369 22,005 12,463 5,019 2,890 18,4531996 94,108 10,044 6,132 39,680 15,561 22,291 12,663 5,147 2,868 18,6621997 96,249 * 10,222 6,201 40,330 15,793 22,440 12,783 5,328 2,847 19,1891998 98,083 * 10,464 6,377 40,780 16,226 22,918 12,971 5,566 2,903 19,5031999 100,450 * 10,750 6,518 40,780 16,698 23,057 * 13,252 5,735 2,981 19,953
2000 104,377 * 11,047 6,642 41,000 17,263 23,380 13,609 5,837 3,096 20,3962001 105,507 11,290 6,807 41,370 17,629 23,663 13,934 5,972 3,185 20,7942002 106,458 11,557 6,966 41,670 17,837 23,749 14,198 6,115 3,224 21,2992003 107,896 * 11,865 7,175 41,930 17,954 23,871 14,412 NA 3,239 21,7062004 109,229 * 12,091 7,308 42,618 NA 24,026 14,474 NA 3,223 NA
NA = Not available.* Indicates a break in series. See section on breaks in the Country Notes on pages 4-8 for more information.
Classification System (NAICS).
(3) Agriculture, forestry, hunting, and fishing. (4) Manufacturing, mining, and construction.(5) Prior to 1993, public utilities are included in industry. In 1993, public utilities accounted for 1.0 percent of total employment.(6) For 1993 forward, some mining is included in manufacturing.(7) Transportation, communication, public utilities, trade, finance, public administration, private household services, and miscellaneousservices.
(2) Employment totals differ from those in table 2 for Canada, France, the Netherlands, Sweden, and the United Kingdom, because sectoral data for these countries have not been fully adjusted for comparability with U.S. definitions. Sectoral data in table 6 correspond with the published employment series in table 2 for Canada and for the Netherlands for 1987 onward. Prior to 1987, some adjustments were made for Netherlands. For France, employment totals in table 6 differ from those in table 2 because detailed data by sector have not been updated to correspond with employment totals shown in table 2. For Sweden, sectoral data in table 6 include persons aged 16-74 years; data in table 2 are for persons aged 16 and older. For the United Kingdom, the employment totals in table 6 differ from those in table 2 because the data sources differ. Because of rounding, subtotals may not add to totals.
(1) Data for 2000 forward for the United States and for 1976 forward for Canada are shown based on the 2002 North American Industry
- 29 -

Table 7. Percent Distribution of Civilian Employment Approximating U.S. Concepts by Economic Sector, 1960-2004
United Nether- UnitedYear States Canada Australia Japan France Germany Italy lands Sweden Kingdom
(1) (1)
Civilian Employment (2)
EachYear
100.0 100.0 100.0 100.0 100.0 100.0 100.0 100.0 100.0 100.0
Agriculture (3)
1960 8.4 13.3 NA 29.5 23.2 13.8 32.5 10.2 15.7 4.71965 6.3 * 10.1 9.7 22.7 17.8 10.8 26.2 7.9 11.4 3.81970 4.5 7.6 8.1 16.9 13.5 8.5 20.1 6.4 8.2 3.21971 4.4 7.5 7.7 15.5 12.8 NA 20.1 6.3 7.8 3.21972 4.4 * 6.9 7.9 14.5 12.0 NA 19.0 6.2 7.5 3.01973 4.2 6.5 7.4 13.1 11.2 NA 18.2 6.1 7.1 3.01974 4.2 6.3 7.0 12.6 10.6 NA 17.4 6.0 6.7 2.8
1975 4.1 6.1 6.9 12.4 10.3 NA 16.7 5.9 6.5 2.81976 3.9 5.8 * 6.6 11.9 9.9 NA 16.4 5.7 6.2 2.81977 3.7 5.6 6.7 11.6 9.5 NA 15.8 5.6 6.1 2.81978 3.7 * 5.3 6.4 11.4 9.2 NA 15.4 5.6 6.1 2.81979 3.5 5.3 6.5 10.8 9.0 NA 14.9 5.4 5.8 2.7
1980 3.6 5.1 6.5 10.1 8.7 5.2 14.2 5.2 5.6 2.61981 3.5 5.0 6.5 9.7 8.4 5.0 13.3 5.2 5.6 2.71982 3.6 5.1 6.5 9.4 8.2 * 4.9 12.4 5.3 5.6 2.71983 3.5 5.2 6.6 8.9 7.9 4.8 12.3 5.3 5.5 2.71984 3.3 5.0 6.2 8.5 7.8 4.7 11.7 5.2 5.1 2.6 *
1985 3.1 5.6 6.2 8.4 7.6 4.5 11.0 5.1 4.9 2.41986 3.1 * 4.8 6.1 * 8.1 7.3 4.3 10.7 5.0 4.7 2.21987 3.0 4.6 5.8 8.0 7.0 4.1 10.4 4.9 * 4.5 * 2.31988 2.9 4.4 5.9 7.6 6.7 3.9 9.8 4.8 4.4 2.31989 2.9 4.3 5.5 7.3 6.4 3.7 9.3 4.7 4.3 2.2
1990 2.9 * 4.2 5.6 6.9 5.7 * 3.5 8.9 4.7 4.0 2.21991 2.9 4.4 5.5 6.3 5.4 4.1 * 8.5 * 4.6 3.8 2.31992 2.9 4.3 5.3 6.1 5.2 3.8 8.2 4.1 * 3.8 2.2 *1993 2.7 4.3 5.3 5.7 5.0 3.5 6.6 * 4.0 4.0 2.11994 2.9 * 4.3 5.1 5.6 4.8 3.3 6.3 4.1 3.9 2.1
1995 2.9 4.0 5.0 5.5 4.6 3.1 6.0 3.9 3.5 2.11996 2.8 4.0 5.0 5.3 4.5 3.0 5.7 4.0 3.3 2.01997 2.7 * 3.8 5.1 5.1 4.4 2.9 5.6 3.8 3.1 1.91998 2.7 * 3.8 4.9 5.0 4.3 2.8 5.3 3.4 3.0 1.71999 2.6 * 3.6 5.0 4.9 4.1 2.8 * 5.0 3.2 3.1 1.6
2000 1.8 * 3.3 5.0 4.8 3.9 2.6 4.8 3.4 2.9 1.52001 1.7 2.8 4.8 4.7 3.8 2.6 4.7 3.0 2.6 1.42002 1.7 2.8 4.5 4.5 3.7 2.5 4.5 3.1 2.5 1.42003 1.7 * 2.8 3.9 4.4 3.6 2.4 4.4 NA 2.5 1.32004 1.6 * 2.6 3.8 4.3 NA 2.4 4.4 NA 2.5 NA
Continued on the following page.
- 30 -

Table 7. Percent Distribution of Civilian Employment Approximating U.S. Concepts by Economic Sector, 1960-2004--Continued
United Nether- UnitedYear States Canada Australia Japan France Germany Italy lands Sweden Kingdom
(1) (1) (5)
Industry (4)
1960 33.4 32.0 NA 28.5 37.5 46.0 34.2 39.0 39.6 46.11965 34.2 * 32.5 35.8 32.5 38.3 47.4 37.3 39.6 42.1 44.91970 33.1 29.8 34.6 35.7 38.4 48.7 39.8 37.5 38.0 43.21971 31.7 29.4 34.3 35.9 38.5 NA 40.0 36.5 37.1 42.01972 31.4 * 29.2 33.5 36.2 38.5 NA 39.9 35.6 36.3 41.21973 32.0 29.5 33.4 37.0 38.7 NA 39.5 35.1 36.3 40.91974 31.4 29.5 33.0 36.8 38.6 NA 39.5 34.3 36.4 40.6
1975 29.5 28.1 31.5 35.6 37.8 NA 39.3 33.2 35.8 39.01976 29.6 27.6 * 31.0 35.6 37.2 NA 38.6 32.3 34.8 38.11977 29.7 27.2 30.4 35.1 36.7 NA 38.7 32.0 33.7 38.01978 30.0 * 27.1 29.3 34.8 36.0 NA 38.4 31.8 32.4 37.71979 30.2 27.2 29.0 34.7 35.4 NA 38.0 31.0 31.9 37.3
1980 29.3 26.9 28.6 35.1 35.0 42.9 38.1 29.7 31.5 36.21981 28.9 26.6 28.3 35.1 34.3 42.2 37.7 28.4 30.6 34.31982 27.2 24.6 27.4 34.5 33.6 * 41.3 37.2 27.5 29.4 33.11983 26.8 24.0 25.9 34.4 32.8 40.6 36.2 27.3 29.1 32.01984 27.3 24.0 25.5 34.5 31.9 40.3 34.5 27.3 29.0 34.0 *
1985 26.9 23.8 25.4 34.6 31.0 40.1 33.6 26.6 29.1 33.51986 26.6 * 23.9 24.7 * 34.2 30.4 39.9 33.1 26.1 29.2 32.91987 26.0 23.9 24.6 33.5 29.8 39.5 32.6 26.3 * 28.7 * 31.71988 25.8 24.2 24.5 33.9 29.3 39.0 32.5 25.7 28.3 31.71989 25.6 24.2 24.8 34.0 29.1 38.9 32.5 25.9 28.4 31.6
1990 25.1 * 23.4 23.9 33.9 28.7 * 38.9 32.5 25.8 28.2 31.11991 24.2 22.0 22.6 34.2 28.3 39.8 * 32.4 * 25.0 27.2 30.01992 23.5 21.3 22.3 34.3 27.4 38.9 32.2 24.5 * 25.6 28.8 *1993 23.0 20.6 22.5 34.0 26.4 37.8 32.1 * 24.0 24.5 28.31994 23.0 * 20.8 22.4 33.7 25.6 36.6 32.1 22.9 24.0 26.9
1995 23.0 21.1 21.9 33.1 25.4 35.3 31.7 22.7 25.0 26.71996 22.9 21.0 21.7 32.9 24.9 34.4 31.3 22.3 25.2 26.81997 23.0 * 21.4 21.4 32.7 24.4 33.9 31.0 22.3 25.0 26.31998 22.7 * 21.5 21.1 31.7 23.9 33.6 31.0 21.6 24.9 26.11999 22.2 * 21.7 20.6 31.3 23.5 33.2 * 30.8 21.5 24.3 25.4
2000 22.0 * 21.8 21.1 30.9 23.3 32.8 30.3 21.3 23.7 24.82001 21.3 21.6 20.3 30.1 23.2 32.3 30.0 21.3 23.2 24.32002 20.3 21.7 20.4 29.0 22.8 31.6 29.9 20.4 22.5 23.42003 20.0 * 21.5 20.4 28.5 22.5 30.8 30.0 NA 22.0 22.92004 20.0 * 21.5 20.7 27.6 NA 30.3 30.1 NA 21.9 NA
Continued on the following page.
- 31 -

Table 7. Percent Distribution of Civilian Employment Approximating U.S. Concepts by Economic Sector, 1960-2004--Continued
United Nether- UnitedYear States Canada Australia Japan France Germany Italy lands Sweden Kingdom
(1) (1) (6)
Manufacturing
1960 26.1 24.7 NA 21.7 28.2 34.4 24.0 29.0 31.6 36.01965 27.0 * 23.8 26.2 24.8 27.5 36.0 25.5 28.6 32.6 35.01970 26.4 22.3 24.4 27.4 27.5 39.5 27.7 26.8 27.7 34.71971 24.7 21.8 24.1 27.4 27.8 NA 28.0 26.2 27.4 33.91972 24.3 * 21.8 23.5 27.3 27.9 NA 27.9 25.5 27.2 32.91973 24.8 22.0 23.3 27.8 28.2 NA 27.9 25.3 27.6 32.31974 24.2 21.7 22.9 27.6 28.3 NA 28.1 25.1 28.4 32.4
1975 22.7 20.2 21.3 26.1 27.8 NA 28.0 24.5 28.1 31.01976 22.8 19.1 * 21.2 25.8 27.3 NA 27.7 23.6 27.0 30.21977 22.7 18.6 20.9 25.3 27.0 NA 27.6 23.2 26.0 30.41978 22.7 * 18.7 19.9 24.8 26.5 NA 27.3 22.7 25.0 30.11979 22.7 19.1 19.6 24.6 26.1 NA 26.9 22.0 24.7 29.5
1980 22.1 18.9 19.4 25.0 25.8 34.0 26.9 21.3 24.3 28.31981 21.7 18.4 19.2 25.1 25.1 33.4 26.3 20.8 23.4 26.51982 20.4 17.1 18.6 24.7 24.7 * 32.8 25.8 20.1 22.5 25.51983 19.8 16.7 17.8 24.8 24.3 32.2 25.0 19.6 22.4 24.31984 20.0 17.0 17.3 25.2 23.8 32.1 23.9 19.6 22.5 24.8 *
1985 19.5 16.5 16.8 25.3 23.2 32.3 23.2 19.5 22.6 24.61986 19.1 * 16.8 16.3 * 24.9 22.7 32.3 22.9 19.4 22.8 24.51987 18.6 16.5 16.1 24.3 22.1 32.0 22.5 19.4 * 22.0 * 23.11988 18.5 16.6 16.0 24.4 21.6 31.6 22.6 18.8 21.7 23.31989 18.5 16.4 15.7 24.5 21.4 31.6 22.8 19.1 21.7 22.6
1990 18.0 * 15.7 15.0 24.3 21.0 * 31.6 22.6 19.1 21.0 22.31991 17.5 14.8 14.4 24.6 20.7 30.7 * 22.1 * 18.3 19.9 21.71992 17.0 14.3 14.3 24.6 20.1 29.5 22.0 18.2 * 18.9 21.2 *1993 16.4 14.0 14.1 23.9 19.4 28.1 24.1 * 17.7 18.3 21.01994 16.4 * 14.0 14.1 23.4 18.9 26.6 24.2 16.7 18.2 19.2
1995 16.4 14.4 13.6 22.7 18.7 25.2 24.1 16.4 19.0 19.11996 16.2 14.4 13.4 22.5 18.5 24.3 23.8 15.9 19.3 19.41997 16.1 * 14.7 13.5 22.2 18.2 24.0 23.5 15.7 19.3 18.81998 15.8 * 15.0 12.8 21.4 17.9 24.1 23.7 15.2 19.1 18.61999 15.0 * 15.3 12.2 21.0 17.5 23.8 * 23.4 15.0 18.5 17.9
2000 14.4 * 15.3 12.6 20.7 17.2 23.9 22.9 15.0 18.0 17.22001 13.5 14.9 12.0 20.2 17.1 23.7 22.4 14.5 17.5 16.52002 12.6 15.0 11.9 19.1 16.7 23.5 22.2 14.0 16.8 15.72003 12.3 * 14.6 11.4 18.8 16.3 23.1 22.1 NA 16.2 14.92004 11.8 * 14.4 11.3 18.3 NA 22.7 21.8 NA 16.0 NA
Continued on the following page.
- 32 -

Table 7. Percent Distribution of Civilian Employment Approximating U.S. Concepts by Economic Sector, 1960-2004--Continued
United Nether- UnitedYear States Canada Australia Japan France Germany Italy lands Sweden Kingdom
(1) (1)
Services (7)
1960 58.1 54.7 NA 41.9 39.3 40.2 33.4 50.7 44.6 49.21965 59.5 * 57.3 54.5 44.8 43.9 41.8 36.5 52.4 46.5 51.31970 62.3 62.6 57.3 47.4 48.0 42.8 40.1 56.1 53.9 53.61971 63.8 63.1 57.9 48.5 48.7 NA 39.9 57.2 55.1 54.81972 64.2 * 63.9 58.6 49.4 49.5 NA 41.2 58.2 56.2 55.81973 63.8 63.9 59.3 49.9 50.1 NA 42.3 58.9 56.6 56.11974 64.5 64.2 60.1 50.6 50.7 NA 43.1 59.7 56.9 56.5
1975 66.4 65.8 61.5 52.0 51.9 NA 44.0 60.9 57.7 58.31976 66.5 66.5 * 62.4 52.5 52.9 NA 45.0 61.9 59.0 59.11977 66.6 67.2 62.9 53.3 53.8 NA 45.5 62.3 60.2 59.21978 66.3 * 67.6 64.3 53.8 54.8 NA 46.3 62.6 61.5 59.51979 66.3 67.5 64.5 54.5 55.7 NA 47.1 63.6 62.3 60.1
1980 67.1 67.9 64.9 54.8 56.3 51.9 47.7 65.1 62.9 61.21981 67.6 68.4 65.2 55.3 57.3 52.8 49.0 66.4 63.8 63.01982 69.2 70.3 66.1 56.0 58.2 * 53.7 50.5 67.3 64.9 64.21983 69.7 70.8 67.4 56.6 59.3 54.5 51.5 67.5 65.5 65.41984 69.4 71.0 68.2 56.9 60.3 55.1 53.8 67.5 65.9 63.4 *
1985 70.0 70.6 68.4 57.0 61.4 55.4 55.3 68.3 66.1 64.11986 70.4 * 71.3 69.1 * 57.6 62.3 55.8 56.2 68.9 66.1 64.81987 71.0 71.5 69.6 58.5 63.2 56.4 57.0 68.8 * 66.8 * 66.01988 71.3 71.4 69.6 58.5 64.0 57.0 57.7 69.5 67.3 66.01989 71.5 71.6 69.6 58.7 64.5 57.4 58.2 69.4 67.3 66.2
1990 72.0 * 72.4 70.5 59.2 65.6 * 57.6 58.6 69.5 67.9 66.71991 72.9 73.7 71.9 59.5 66.3 56.1 * 59.2 * 70.4 69.0 67.81992 73.6 74.4 72.4 59.5 67.3 57.3 59.6 71.4 * 70.6 68.9 *1993 74.3 75.1 72.2 60.3 68.6 58.7 61.3 * 72.0 71.6 69.71994 74.1 * 74.9 72.5 60.8 69.6 60.0 61.6 73.0 72.1 71.0
1995 74.1 74.8 73.1 61.4 70.0 61.5 62.2 73.4 71.5 71.31996 74.3 75.0 73.3 61.8 70.6 62.6 62.9 73.7 71.6 71.31997 74.3 * 74.7 73.4 62.1 71.2 63.2 63.4 73.9 71.9 71.91998 74.6 * 74.6 74.0 63.3 71.8 63.6 63.7 75.0 72.2 72.21999 75.3 * 74.7 74.4 63.8 72.4 64.0 * 64.3 75.2 72.6 73.0
2000 76.2 * 74.8 73.9 64.3 72.9 64.5 64.9 75.2 73.4 73.72001 77.1 75.5 74.9 65.2 73.1 65.1 65.2 75.7 74.2 74.42002 78.0 75.5 75.1 66.5 73.5 65.9 65.5 76.5 75.0 75.22003 78.3 * 75.7 75.7 67.1 73.9 66.8 65.6 NA 75.5 75.82004 78.4 * 75.8 75.5 68.1 NA 67.3 65.5 NA 75.6 NA
NA = Not available.* Indicates a break in series. See section on breaks in the Country Notes on pages 4-8 for more information.
Classification System (NAICS).(2) Because of rounding, subtotals may not add to totals.(3) Agriculture, forestry, hunting, and fishing. (4) Manufacturing, mining, and construction.(5) Prior to 1993, public utilities are included in industry. In 1993, public utilities accounted for 1.0 percent of total employment.(6) For 1993 forward, some mining is included in manufacturing.(7) Transportation, communication, public utilities, trade, finance, public administration, private household services, and miscellaneousservices.
(1) Data for 2000 forward for the United States and for 1976 forward for Canada are shown based on the 2002 North American Industry
- 33 -

Table 8. Civilian Unemployment Rates Approximating U.S. Concepts by Sex, 1960-2004
United Nether- UnitedYear States Canada Australia Japan France Germany Italy lands Sweden Kingdom
(1)
Male
1960 5.4 7.1 NA NA NA 0.8 3.4 NA NA 2.11961 6.4 7.3 NA NA NA 0.5 2.9 NA 1.0 1.91962 5.2 6.0 NA NA 1.0 0.4 2.4 NA 1.4 2.71963 5.2 5.5 NA NA 1.1 0.4 2.1 NA 1.4 3.41964 4.6 4.5 0.9 NA 0.9 0.3 2.2 NA 1.4 2.4
1965 4.0 3.7 0.9 NA 1.0 0.2 3.0 NA 0.8 2.11966 3.2 3.3 1.1 NA 1.1 0.3 3.2 NA 1.3 2.31967 3.1 3.9 1.3 NA 1.5 1.4 2.9 NA 2.0 3.51968 2.9 4.6 1.2 NA 1.9 1.0 2.9 NA 2.3 3.61969 2.8 4.3 1.2 NA 1.5 0.6 2.7 NA 1.8 3.5
1970 4.4 5.6 1.1 1.2 1.5 0.5 2.5 NA 1.4 3.51971 5.3 6.0 1.3 1.2 1.7 0.5 2.5 NA 2.4 3.6 *1972 5.0 5.8 1.9 1.5 1.8 0.7 2.9 NA 2.5 3.91973 4.2 4.9 1.6 1.3 1.6 0.6 2.7 2.6 2.2 3.01974 4.9 4.8 1.9 1.4 1.8 1.5 2.3 2.8 1.7 3.0
1975 7.9 6.2 3.8 1.8 3.0 3.3 2.5 3.9 1.4 4.11976 7.1 6.3 * 3.9 2.2 3.1 3.0 2.7 4.1 1.3 5.21977 6.3 7.3 4.6 2.0 3.6 2.9 2.8 3.8 1.5 5.31978 5.3 7.5 5.4 2.2 3.9 2.7 2.8 3.6 2.1 5.11979 5.1 6.7 5.2 1.9 4.4 2.3 3.0 3.6 1.9 4.9
1980 6.9 6.9 5.1 1.7 4.4 2.3 2.9 4.2 1.7 6.71981 7.4 7.0 4.8 2.0 5.5 3.3 3.3 6.9 2.4 10.31982 9.9 11.1 6.4 2.1 6.3 * 5.0 3.8 8.6 3.0 11.61983 9.9 12.2 9.7 2.5 6.7 6.2 * 4.1 10.4 * 3.4 12.31984 7.4 11.1 8.7 2.5 8.2 6.2 4.2 10.4 3.0 12.0
1985 7.0 10.4 7.9 2.4 8.8 6.2 4.2 8.4 2.8 11.81986 6.9 9.4 7.6 * 2.4 8.9 5.5 5.2 * 7.9 2.6 11.81987 6.2 8.3 7.6 2.5 8.7 5.4 5.5 7.4 2.2 * 10.91988 5.5 7.2 6.6 2.5 8.1 5.3 5.5 5.3 * 1.8 8.81989 5.2 7.1 5.6 2.0 7.4 4.6 5.4 4.8 1.5 7.4
1990 5.7 * 7.9 6.6 1.9 6.6 * 4.2 4.8 4.1 1.8 7.41991 7.2 10.5 9.7 1.8 7.2 4.6 * 4.9 * 3.9 3.4 9.91992 7.9 11.7 11.2 1.8 8.1 5.5 5.3 4.1 6.7 11.81993 7.2 11.5 11.3 2.0 9.8 6.7 7.4 * 5.5 11.0 12.41994 6.2 * 10.2 9.8 2.3 10.3 7.3 8.4 6.1 11.0 10.11995 5.6 9.1 8.6 2.5 9.6 7.3 8.7 5.5 9.9 10.1
1996 5.4 9.3 8.5 2.8 10.3 8.4 8.8 4.8 10.4 9.51997 4.9 8.8 8.5 2.8 10.3 9.4 8.8 3.7 10.4 7.91998 4.4 8.1 8.0 3.2 9.7 8.9 8.9 3.0 8.7 7.01999 4.1 7.3 7.1 3.9 9.1 8.1 * 8.6 2.3 7.4 6.6
2000 3.9 6.4 6.5 4.3 7.7 7.6 7.9 2.2 6.2 6.02001 4.8 6.9 7.0 * 4.0 7.1 7.8 7.2 2.0 5.3 5.62002 5.9 7.6 6.6 4.7 8.1 8.9 6.8 2.5 5.6 5.72003 6.3 7.3 6.0 4.5 8.7 10.1 6.6 3.6 6.3 5.62004 5.6 6.8 5.4 4.2 NA NA 6.5 4.3 6.9 5.1
Continued on the following page.
- 34 -

Table 8. Civilian Unemployment Rates Approximating U.S. Concepts by Sex, 1960-2004--Continued
United Nether- UnitedYear States Canada Australia Japan France Germany Italy lands Sweden Kingdom
(1)
Female
1960 5.9 4.9 NA NA NA 1.5 4.1 NA NA 2.31961 7.2 5.0 NA NA NA 0.8 4.1 NA 2.4 2.01962 6.2 4.4 NA NA 2.3 0.8 3.8 NA 1.7 2.71963 6.5 4.4 NA NA 2.5 0.6 3.2 NA 2.2 3.31964 6.2 4.1 2.6 NA 1.9 0.5 3.8 NA 1.8 2.51965 5.5 3.5 2.4 NA 2.4 0.3 4.4 NA 1.7 2.11966 4.8 3.4 2.7 NA 2.6 0.3 4.9 NA 2.0 2.11967 5.2 3.7 3.2 NA 3.4 1.1 4.7 NA 2.3 2.91968 4.8 4.4 3.2 NA 4.3 1.3 5.2 NA 2.1 2.51969 4.7 4.7 3.2 NA 3.8 0.7 5.4 NA 1.9 2.31970 5.9 5.8 2.8 2.2 4.2 0.6 5.2 NA 1.7 2.31971 6.9 6.6 3.1 3.0 4.6 0.8 5.2 NA 2.8 5.1 *1972 6.6 7.0 3.9 3.4 4.7 0.8 5.9 NA 3.0 5.11973 6.0 6.7 3.6 2.6 4.6 0.9 6.2 4.3 2.8 4.81974 6.7 6.4 4.1 3.2 4.7 1.8 5.2 5.6 2.4 4.71975 9.3 8.1 7.0 3.9 6.1 3.5 5.8 8.2 2.0 5.11976 8.6 7.9 * 6.4 3.9 7.0 3.9 6.5 8.6 2.0 5.81977 8.2 8.8 7.5 4.3 7.6 4.3 6.8 7.6 2.2 6.21978 7.2 9.1 7.9 4.3 7.7 4.2 6.8 8.6 2.4 6.21979 6.8 8.3 8.2 4.1 8.6 3.9 7.3 8.8 2.3 6.21980 7.4 7.9 7.9 3.3 9.5 3.6 7.4 9.7 2.3 7.11981 7.9 7.8 7.4 3.5 10.6 4.8 8.1 12.9 2.7 8.81982 9.4 10.1 8.5 3.5 11.1 * 6.5 8.6 13.3 3.4 9.51983 9.2 10.8 10.4 3.7 11.2 7.9 * 9.4 13.9 * 3.5 10.51984 7.6 10.7 9.5 3.3 12.4 8.5 9.4 13.9 3.2 11.61985 7.4 10.0 8.8 3.1 12.8 8.6 9.4 11.9 2.9 11.01986 7.1 9.2 8.5 * 3.3 12.9 8.1 11.8 * 13.7 2.7 10.91987 6.2 8.6 8.3 3.7 13.4 7.8 12.0 14.2 2.2 * 10.01988 5.6 7.6 7.5 3.2 12.9 7.8 12.3 10.4 * 1.9 8.31989 5.4 7.2 6.5 3.0 12.3 7.2 12.1 9.7 1.7 7.11990 5.5 * 7.5 6.8 2.7 11.2 * 6.1 10.8 8.6 1.8 6.81991 6.4 9.0 8.7 2.4 11.5 7.0 * 10.4 * 8.0 2.8 7.51992 7.0 9.4 9.5 2.5 12.3 8.4 10.8 7.2 4.5 7.71993 6.6 9.9 9.7 3.0 13.2 9.6 13.8 * 7.5 7.6 7.91994 6.0 * 8.8 9.0 3.4 13.8 10.1 14.6 7.9 8.2 6.91995 5.6 8.1 7.7 3.3 13.3 9.4 15.4 8.1 8.1 6.91996 5.4 8.3 7.8 3.7 13.5 9.6 15.3 7.7 9.3 6.41997 5.0 8.0 7.9 3.8 13.3 10.6 15.4 6.6 9.7 5.91998 4.6 7.3 7.4 3.7 12.9 9.8 15.4 5.0 8.0 5.41999 4.3 6.6 6.7 4.7 12.2 8.9 * 14.8 4.4 6.7 5.22000 4.1 5.8 6.1 4.9 10.8 8.1 13.7 3.8 5.3 4.92001 4.7 6.0 6.5 * 4.6 10.0 7.9 12.2 3.1 4.7 4.52002 5.6 6.4 6.2 5.4 10.0 8.4 11.5 3.0 4.7 4.52003 5.7 6.4 6.1 5.2 10.6 9.2 11.4 4.0 5.2 4.42004 5.4 6.0 5.7 4.9 NA NA 10.6 5.1 6.1 4.3
NA = Not available. * Indicates a break in series. See section on breaks in the Country Notes on pages 4-8 for more information.(1) Data are for February or March. Data for 1993-2000 are from Toshihiko Yamagami and published in the Monthly Labor Review,April 2002. Data for 2001-04 were updated and provided to BLS by Mr. Yamagami. See Country Notes on page 5.
- 35 -

Table 9. Civilian Unemployment Rates Approximating U.S. Concepts by Age, 2000-04
Age United Nether- UnitedGroup States Canada Australia Japan France Germany Italy lands Sweden Kingdom
(1) (1)
2000
All working ages 4.0 6.1 6.3 4.8 10.3 7.8 10.2 3.3 5.8 5.5 Under 25 years 9.3 11.7 12.1 9.3 20.8 8.6 NA 6.1 12.1 12.5 Teenagers (2) 13.1 15.4 16.1 12.3 26.1 8.1 NA 9.4 18.1 NA 20-24 years 7.2 9.4 9.1 8.7 19.4 8.9 NA 3.9 9.6 NA 25 years and over 3.0 5.1 4.9 4.2 9.2 7.7 NA 2.8 5.1 4.2
2001
All working ages 4.7 6.5 6.8 * 5.1 8.7 7.9 9.2 2.6 5.0 5.1 Under 25 years 10.6 11.9 13.6 * 9.7 18.2 8.4 NA 5.2 11.8 12.0 Teenagers (2) 14.7 15.6 17.8 * 12.4 23.2 7.1 NA 7.5 16.9 NA 20-24 years 8.3 9.6 10.4 * 9.1 16.9 9.1 NA 3.5 9.6 NA 25 years and over 3.7 5.4 5.2 * 4.5 7.7 7.8 NA 2.1 4.2 3.8
2002
All working ages 5.8 7.0 6.4 5.4 8.8 8.7 8.7 2.8 5.1 5.2 Under 25 years 12.0 12.8 12.9 10.0 19.2 10.1 NA 5.1 13.1 12.2 Teenagers (2) 16.5 17.2 17.0 13.0 24.1 8.1 NA 7.2 19.0 NA 20-24 years 9.7 10.1 9.9 9.4 17.9 11.0 NA 3.5 10.6 NA 25 years and over 4.6 5.9 4.9 4.9 7.6 8.5 NA 2.4 4.2 3.9
2003
All working ages 6.0 6.9 6.1 5.3 9.1 9.7 8.5 3.7 5.8 5.0 Under 25 years 12.4 12.8 12.2 10.3 19.2 11.2 NA 6.4 14.0 12.4 Teenagers (2) 17.5 17.3 16.0 12.2 24.2 7.9 NA 9.4 19.3 NA 20-24 years 10.0 10.0 9.4 9.9 18.0 12.6 NA 4.1 11.7 NA 25 years and over 4.8 5.7 4.6 4.7 7.9 9.5 NA 3.2 4.8 3.7
2004
All working ages 5.5 6.4 5.5 4.8 9.7 NA 8.1 4.8 6.6 4.8 Under 25 years 11.8 12.4 11.6 9.6 21.5 NA NA 8.6 17.2 12.3 Teenagers (2) 17.0 17.1 15.8 12.0 26.6 NA NA 10.9 22.8 NA 20-24 years 9.4 9.6 8.5 9.1 20.4 NA NA 6.9 14.9 NA 25 years and over 4.4 5.3 4.1 4.2 8.3 NA NA 4.1 5.3 3.3
NA = Not available.* Indicates a break in series. See section on breaks in the Country Notes on pages 4-8 for more information.(1) Data are for the Spring.(2) 16- to 19-year-olds in the United States, Canada, France, Sweden, and the United Kingdom; 15- to 19-year-olds in Australia, Japan, Germany, Italy, and the Netherlands.
- 36 -