comparative cost - benefit analysis of fresh and seed …
TRANSCRIPT

COMPARATIVE COST - BENEFIT ANALYSIS OF FRESH AND SEED OKRO PRODUCTION AT KPANDO IN THE VOLTA REGION
BY
SAMUEL SAKYI OWUSU
THIS DISSERTATION IS SUBMITTED TO THE UNIVERSITY OF GHANA, LEGON IN PARTIAL FULFILMENT OF THE REQUIREMENT FOR THE
AWARD OF MASTER OF ARTS DEGREE IN AGRICULTURAL ADMINISTRATION
DEPARTMENT OF AGRICULTURAL ECONOMICS AND AGRIBUSINESS, UNIVERSITY OF GHANA, LEGON
DECEMBER 2002
University of Ghana http://ugspace.ug.edu.gh

35 /,as © o fc . /
_G3 7 4 9 4 1
University of Ghana http://ugspace.ug.edu.gh
I, SAMUEL SAKYI OWUSU, author o f this dissertation “COMPARATIVE COST -
BENEFIT ANALYSIS OF FRESH AND SEED OKRO PRODUCTION AT KPANDO IN
THE VOLTA REGION”, do hereby declare that, with the exception o f ideas and quotations
which have been duly acknowledged, the work presented in this dissertation was done entirely
by me in the Department o f Agricultural Economics and Agribusiness, University o f Ghana,
Legon, from September 2001 to December 2002.
This work has never been presented either in whole or in part for any other degree in this
University or elsewhere.
DECLARATION
SAMUEL SAKYI OWUSU
(STUDENT)
This dissertation has been submitted for examination with my approval as supervisor.
M R D. P. K. AMEGASHIE
(SUPERVISOR)
University of Ghana http://ugspace.ug.edu.gh

DEDICATION
TO THE OW USU FAMILY
University of Ghana http://ugspace.ug.edu.gh

I am greatly indebted to my supervisor Mr. D. P. K. Amegashie for his guidance, patience,
encouragement, constructive criticisms, and suggestions. I also w ish to express my heartfelt
appreciation to Mr. A. Mensah-Bonsu who started the work with me but had to leave for a
programme outside the country.
I am grateful to Mr. Emmanuel Adika and Mr. Ibrahim Addy o f the Agricultural Economics
Library and Faculty o f Agriculture Library respectively for helping me assess information from
the library.
To my colleagues (MA / M. Phil. Agricultural Administration Class o f 2001 / 2002), thanks for
your encouragement and concern. God richly bless you all.
I apologize to all those who in diverse ways have contributed to this work but whose names
have not been mentioned and to them 1 say, thank you.
ACKNOWLEDGEMENT
Samuel Sakyi Owusu
December 2002
University of Ghana http://ugspace.ug.edu.gh
ABSTRA CT
Okro is an important crop in the diet o f many Ghanaians and the economy o f Ghana.
Fresh okro contains some amount o f protein, carbohydrates, vitamins A and C w ith traces
o f B vitamins, as well as calcium phosphorus and iron. The problems o f removal o f
subsidies on agricultural inputs, poor market price o f fresh okro, and nematode problem
had resulted in low net income from fresh okro enterprise. Although Ghana has a high
potential o f producing both fresh and seed okro, m ost farmers are currently in the
production o f fresh okro. Farmers take into consideration the relative profitability o f
alternative enterprises open to them before selecting those to invest in. This present study
compares the costs and benefits as well as the profitability o f fresh and seed okro
production. Data were collected through the use o f structured questionnaires administered
to ninety farmers. The profitability o f the enterprises were compared, using net income,
benefit-cost ratio, and return on sale concepts. Sensitivity analysis was carried out to take
care o f risk and uncertainties on the conclusions drawn on the acceptability o f the
enterprises. The study revealed that fresh production cost lesser than seed okro
production per unit. Although both fresh and seed okro production are profitable, seed
okro production is more profitable than fresh okro in the rainy season. Dry season fresh
okro fruits production reaps higher returns than rainy season fresh okro fruits production.
Major constraints in okro production are attributed to increasing pests and diseases, high
cost o f agro-chemical and poor market price. In the light o f the above find in gs o f the
present study, it was recommended that extension education be intensified eradicate the
major constraints to okro production so as to increase the net income.
University of Ghana http://ugspace.ug.edu.gh
PageDECLARATION iDEDICATION iiACKNOW LEDGEMENT iiiABSTRACT ivLIST OF TABLES AND FIGURES viLIST OF ABBREVIATIONS vii
CHAPTER 1. INTRODUCTION
1.1 Background 11.2 Problem Statement 21.3 Objectives o f the Study 31.4 Justification o f the Study 31.5 Scope and Limitation o f the Study 51.6 Organization o f the Study 6
2. LITERATURE REVIEW
2.1 Introduction 72.2 Fresh and Seed Okro Production 72.3 Importance o f Fresh and Seed Okro 92.4 Performance Indicators For Farm Production 10
2.4.1 Concept o f Farm Budgeting 112.4.2 Concept o f Depreciation 122.4.3 Cost o f Production and Return on Sale 142.4.4 Benefit-Cost Ratio 14
2.5 Changes in Key Variables on Crop Profitability 152.6 Crop Profitability 17
3. METHODOLOGY
3.1 Theoretical Framework 193.2 Identification o f Variables 203.3 Method o f Data Analysis 203.4 Comparing Profitability Estimates 24
3.4.1 Net Income 243.4.2 Benefit-Cost Ratio 253.4.3 Return on Sale 26
3.5 Sensitivity Analysis 26
TABLE OF CONTENTS
v
University of Ghana http://ugspace.ug.edu.gh

3.6 Statistical Test 273.6.1 Measures o f Variability 273.6.2 Test o f Hypothesis 28
3.7 Data Sources 303.8 The Survey 30
4. RESULTS AND DISCUSSIONS
4.1 Introduction 314.2 Fixed Cost Estimates 314.3 Variable Cost Estimates 334.4 Total Cost Estimates 354.5 Total Revenue Estimates o f Okro Production 364.6 N et Revenue Estimates o f Okro Production 384.7 Benefit-Cost Ratio 39
4.7.1 Discounted Cash Flow 394.8 Return on Sale 414.9 Sensitivity Analysis 424.10 Constraints to Okro Production 46
4.10.1 Disease and Pest Problems 474.10.2 High Cost o f Agro-chemicals 474.10.3 Poor Market Price 48
4.11 Suggested Strategies for Solving the Problems 48
5. SUMMARY, CONCLUSIONS, AND RECOMMENDATIONS
5.1 Summary 505.2 Conclusions 515.3 Recommendations 51
REFERENCES 53APPENDICES 57
vi
University of Ghana http://ugspace.ug.edu.gh

Tables
Table 1.1
Table 4.1
Table 4.2
Table 4.3
Table 4.4
Table 4.5
Table 4.6
Table 4.7
Table 4.8
Table 4.9
Table 4.10
Table 4.11
Table 4.12
FiguresFigure 1.
Page
Proximate Composition o f Okro Seed 10
Fixed Cost Estimates per Hectare o f Fresh and Seed Okro Production 33
Variable Cost Estimates per Hectare o f Fresh and Seed Okro Production 34
Total Cost Estimates per Hectare o f Fresh and Seed Okro Production 36
Total Revenue Estimates per Hectare o f Fresh and Seed Okro Production 36
Financial Cash Flow 39
Benefit-Cost Ratio o f Fresh and Seed Okro Production 41
Summary o f Enterprise Return on Sale 42
Sensitivity Analysis at a 10% Increase in Costs 44
Sensitivity Analysis at a 10% Reduction in Benefits 44
Sensitivity Analysis at a 50% Increase in Discount Factor 44
Sensitivity Analysis at a 10% Increase in Costs, 10% Reduction in Benefits,and 50% Increase in Discount Factor Simultaneously 45
Enterprise Benefit-Cost Ratios 46
Constraints to Okro Production 46
LIST OF TABLES AND FIGURES
vii
University of Ghana http://ugspace.ug.edu.gh

LIST OF ABBREVIATIONS
MOFA Ministry o f Food and Agriculture
> Greater than
= Equals
sp Species
Z Summation
N.P.K. Nitrogen, Phosphorus, and Potassium
DF Discount factor
Ben. Benefit
Red. Reduction
Std. Dev. Standard deviation
C Var. Coefficient o f variation
viii
University of Ghana http://ugspace.ug.edu.gh

CHAPTER ONE
INTRODUCTION
1.1 Background
Okro (.Abelmoschus esculentus, (L) Moench), originated from Tropical Africa and
was taken to other parts o f the world by the Portuguese (Purseglove, 1986;
Sinnadurai, 1992). It belongs to the Malvaceae family. The Americans call the crop
okra, and is called ladies finger by the British (Sinnadurai, 1992). In Ghana okro is
one of the most widely grown vegetables. The crop grows well throughout the year in
West Africa, producing good yields if the soil is fertile and there is sufficient moisture
in the soil (Thompson and Kelly, 1957). It is a very important crop in the diet o f many
Ghanaians and hence its importance in the economy o f Ghana. Nutritionally both the
leaf and fruits are eaten as vegetables. The leaves are used as spinach. Fresh okro is
used in the preparation o f stew and soup in Ghana and throughout West Africa. The
fresh fruits contain some amount o f protein, carbohydrates, vitamins A and C with
traces of B vitamins. It is also a good source o f calcium, phosphorus and iron. Roasted
and ground seeds are used in cooking and for edible oil extraction (Martin and
Roberte, 1978). In Ghana, almost every agricultural commodity has become a
potential export crop because of the effort to narrow the gap between the traditional
export crops like cocoa and coffee, and food crops (MOFA, 1990). Government effort
to promote non-traditional exports started as far back as 1960 (Dzokoto, 1990).
Recent decline in world price o f traditional crops has made the government to
encourage farmers to diversify into the production o f non-traditional crops like okro,
pineapple, pawpaw, and mango, among others.
1
University of Ghana http://ugspace.ug.edu.gh
1.2 Problem Statement
The construction o f the hydroelectric dam at Akosombo affected the people of
Kpando. Their standard of living reduced due to destruction o f their farms, and other
dam-induced losses. The Kpando Irrigation project was therefore initiated to assist
farmers who had suffered dam-induced losses during the construction o f the dam to
earn extra income. Okro is one of the crops cultivated in the area. High quality seeds
are needed for the cultivation o f okro so as to obtain high yield o f okro fruits.
Sometimes, seed required for planting is obtained from the previous harvest, a
practice that is generally unacceptable since it generates into impure seeds with
reduced quality as compared with the original seeds. The output or yield o f okro is
affected by the quality o f seeds used during planting. Poor quality seed used as a
planting material will give rise to poor yield, and a good quality seed is likely to give
rise to a good crop yield. A good quality seed is therefore needed for achieving a high
yield of both fresh and seed okro. A good quality seed is one that has high viability
(usually 85% and above), high vigour, free from seed borne diseases and free from
noxious weed seeds (Dzietror, 1995). Although Ghana has a high potential o f
producing both fresh okro fruits and seed okro, in the rainy and dry seasons, most
farmers are currently in the production o f fresh fruits. During the period o f glut for the
fresh fruits, a farmer decides whether to sell at a reduced price or keep the fruits for
seeds. Relevant data and analysis is needed before an investment decision could be
made on the better alternative, that is, the production o f fresh fruits or seed. The cost
of project inputs keeps rising as a result of the macro-economic policy o f removal of
subsidies on agricultural inputs, coupled with the falling value o f the cedi against the
major currencies, such as the dollar and pound. With the problems o f removal o f
subsidies on agricultural inputs, reduced area o f production, declining yields, poor
2
University of Ghana http://ugspace.ug.edu.gh
market prices, pests and diseases, the present study addresses the following pertinent
questions, in an attempt to identify the two options and compare their costs and
benefits:
1. What are the costs o f fresh and seed okro production?
2. What are the benefits o f fresh and seed okro production?
3. How profitable is it to produce fresh and seed okro?
4. What factors militate against the production o f fresh and seed okro?
1.3 Objectives of the Study
The general objective of the study is to compare the costs and benefits o f fresh and
seed okro production at Kpando in the Volta Region o f Ghana.
The specific objectives addressed by the present study in order to achieve the general
objective are:
1. To estimate the costs and returns o f fresh and seed okro production.
2. To assess the relative profitability o f fresh and seed okro production.
3. To identify the constraints militating against the production o f fresh and seed
okro.
1.4 Justification of the Study
Kpando district has been identified as a potential vegetable production area in the
Volta Region that can be developed to increase supply o f fresh okro to both domestic
and export markets. Propagation o f okro is by seed, and the supply o f high viable seed
for planting needs to be increased. High viable seeds are seeds with a germination
percentage greater than 80%. Although Ghana has a high potential o f producing both
3
University of Ghana http://ugspace.ug.edu.gh

fresh okro fruits and high viable okro seeds (Dzietror, 1995, Owusu, 1999), a greater
quantity o f high viable okro seed is imported. Investment in fresh okro fruits as well
as seed okro production is therefore worth investigating.
The study will offer reliable information on the profitability o f fresh and seed okro
production to small-scale farmers. The determinants o f crop profitability are yield of
crop, price per unit o f output, variable costs, labour and machinery cost (Bernard,
1990). Introduction o f a new technology, variable cost reduction, and increasing price
per unit of output are among the interventions geared towards increases in crop
profitability. Investment in fresh and seed okro production is a matter o f choice. Farm
investment analysis should confirm that adoption o f a new technology will really be
financially worthwhile, for farmers can respond to financial incentives only when it is
truly remunerative for them to do so.
The present study will also provide reliable information needed for farm planning by
the small-scale risk-preferred, risk-neutral, and risk-averse okro farmer. Farmers live
in a particular cultural and risk environment. Although a risk-neutral okro farmer
could use only the profitability figures for farm planning, a risk-averse okro farmer
will have to know the risk level associated with the investment before making a
decision on the line o f action to take.
There is little study done on the performance of okro production at Kpando. It is
hoped that, this work will help to bridge the gap in research and also serve as a data
source for interested investors and a database for policy formulation and
implementation at Kpando, and Ghana as a whole.
4
University of Ghana http://ugspace.ug.edu.gh

1.5 Scope and Limitation of the Study
This current study considered the cost and benefit of fresh and seed okro production
for a year. Data for the major season as well as the minor season were used for the
2001 production year.
The geographical area o f this study is the Kpando district in the Volta Region of
Ghana. The district is one o f the administrative districts in the Volta Region. Kpando
and Hohoe lie adjacent to each other in the middle o f the region. The district, lies
within the transitional zone o f the country. The transitional zone experiences average
annual rainfall of 1200 mm to 1300 mm. Although crops grown in the area includes
okro, garden eggs, tomatoes, maize and cowpea in rainy season cultivation, okro
production has assumed a greater prominence under the irrigation scheme and has
become a major income earner for the farmers in dry season cultivation. Economic
activities undertaken in the study area include farming, marketing, and processing.
The main food crops grown are cassava, maize and yam. The main items processed
are cassava, which is processed into gari. Palm fruit is also processed into palm oil
locally called “dzomi”. For marketing, the main items traded are yam, dzomi, gari,
beans, groundnuts, water yam, tomatoes, pepper, garden eggs and okro.
The quantitative data obtained from farmers were mere approximations often recalled
from memory. This is because most of the farmers hardly kept records on the exact
quantities of inputs used and output realised. However, the combined use of
questionnaire information, personal interviews, and observations where necessary
5
University of Ghana http://ugspace.ug.edu.gh

were made to ensure least distortions in information gathered. Limit o f time made it
impossible to investigate the enterprise over a longer period o f time. Another limiting
factor o f the study is that, the resources available to each farmer differ both in
quantity and quality. The managerial potential and objectives also differed. For fear of
being asked to pay taxes, some farmers are reluctant to disclose information on their
income, payment of social security and other financial obligations as well as
production data.
1.6 Organisation of the Study
The report of the present study is divided into five chapters. Chapter one above is the
introductory chapter. It gives the background information, problem statement,
objectives and relevance or justification of the research undertaken. Chapter two
provides a summary o f the pertinent literature as related to the research topic. In
Chapter three, the methodology and analytical concepts o f the study are outlined.
Results of the study and discussion o f the results are presented in Chapter four. This is
followed by the conclusions and recommendations, which are presented in Chapter
five.
6
University of Ghana http://ugspace.ug.edu.gh

CHAPTER TWO
LITERATURE REVIEW
2.1 Introduction
This chapter reviews literature relating to fresh and seed okro production, importance
o f fresh and seed okro, and performance indicators o f an enterprise. It also reviews
methods, which have been used by previous researchers to compare the profitability
of two or more farm production enterprises.
2.2 Fresh and Seed O kro Production
Major areas o f okro cultivation include the Northern Savanna Zones (Northern, Upper
East and Upper West Regions), Transitional and Coastal Savanna Zones (Brong
Ahafo, Greater Accra, and Volta Regions). A thorough land preparation is necessary
for okro establishment. It grows best in a sandy loam soil into which well-rotted
compost has been incorporated. Early ploughing followed by harrowing twice at two
weeks interval is ideal for uniform land preparation. This allows for uniform
germination and subsequent destruction o f weed seeds before planting (Irvine, 1969;
Rice, Rice and Tindall 1986; Sinnadurai, 1992). Armah-Agyemang (1990) reported
that, the ideal time to plant okro in the tropics is after March during the rainy season.
Dry season planting is done between November and December. Under irrigation,
planting is done at any time of the year. Propagation o f okro is by seed. Seeds are
soaked in water for twenty-four hours prior to sowing to increase the rate o f
germination and germination percentage (Adjei-Twum, 1962).
7
University of Ghana http://ugspace.ug.edu.gh
Physiological maturity in okro is about 14 days after which ripening o f the fruit
begins. Seed development in okro reduces the growth and yield o f the plant. (Ewete,
Taylor and Cheda 1980). There is sequential ripening o f okro fruits on the plant in
most of the cultivars. Further ripening after maturity consists mainly o f desiccation
with little transfer o f nutrient into the seed. Maturity o f the fruit is associated with the
fruit becoming grey or brown depending on variety (Kohle and Chavan, 1969;
Herklots, 1972; George, 1985; Anoglo, 1990). The matured seed vary in colour from
dark green to black.
Okro is picked when it is matured. Fruit and seed maturity in okro differs among the
varieties. Fruits are picked when they are still young and tender, and eaten as
vegetable. Fruit readily snaps at this stage (Sinnadurai, 1992). It is useless to pick
over matured fruits, because consumers reject such fruits. These fruits can be left on
the plant for seeds (Purseglove, 1974; Tindall, 1983). Delaying picking until seed is
matured and dried might result in yield losses due to lodging and shattering. Seed is
extracted when fruit becomes dry and brittle. Seed yield o f 1500 kilogrammes per
hectare has been reported in the United States o f America. The yield o f okro seed of
different varieties is estimated to range from 900 - 1200 kg/ ha (Herklots, 1972).
Although the seed of okro are comparatively short lived, Martin et al (1981) showed
that low temperature (5 °C) and low moisture content permitted conservation for 11
years. Seeds left in the fruit for storage should be dusted with an insecticide to prevent
weevil infestation (Norman, 1992). Seeds begin to deteriorate shortly after they reach
physiological maturity in the field (Chauchan and Bhanderi 1971; Ellis and Roberts,
1980). The rate o f deterioration is positively related to temperature and moisture
content at least to a critical moisture content (Ibrahim and Roberts, 1983).
8
University of Ghana http://ugspace.ug.edu.gh

Deterioration leads to death o f the seed. Ellis and Roberts (1982) reported that many
sub-cellular changes occur while seed deteriorates and this results in slower
germination and poor vigour, which could affect crop yield. Increase in temperature
within certain limits will increase the rate o f respiration, which produces heat. Okro
seed is a bad conductor o f heat due to its hard seed coat (Christensen, 1974). If this
heat generated is not conducted away, condensation takes place, which can lead to
loss in seed viability (Salunkhe, 1986). Kozlowski (1972) reported that seeds showing
marked reduction in non-soluble carbohydrate and protein germinate poorly.
The most common and dangerous pest o f okro is the flea beetle, Fruitagrica sjostedti,
followed by aphids, cotton stainers and caterpillars. Aphids and cotton stainers suck
sap from shoots causing stunted or abnormal growth. Caterpillars damage flower buds
and young fruits, which drop prematurely. Seed bugs, Oxycarenus spp, is also a major
pest, which feed on developing fruits. Fruit yield and seed viability can be severely
reduced as a result o f feeding o f these seed bugs. Diseases o f okro include fusarium
wilt, fruit spot, root rot, and stem rot. Others include powdery mildew and cercospora
leafspot (Charles and Sherf, 1960; Hill and Waller, 1988).
2 3 Im portance of Fresh and Seed O kro
Leaf of okro is used as spinach or fodder for goat. Fresh fruit o f okro is used in the
preparation of stew and soup in Ghana and throughout West Africa. Fresh fruits
contain some amount o f protein, carbohydrates, vitamins A and C with traces o f B
vitamins. It is also a good source o f calcium, phosphorus and iron. Roasted and
ground seeds are used in cooking and for edible oil extraction (Ramadan, Khalifa and
9
University of Ghana http://ugspace.ug.edu.gh

Aboul-Nasr, 1997). Seeds contain other components in addition to oil, as shown in
Table 1.1 below.
Table 1.1 Proximate Composition o f Okro Seeds.
Moisture (%) Protein (%) Oil (%) Ash (%) Crude (%) Carbohydrate (%)
9.77 23.56 21.29 4.46 16.66 24.26Source: Berry et al, 1988.
In Ghana, almost every agricultural commodity has become a potential export crop
because of the effort to narrow the gap between the traditional export crops like cocoa
and coffee, and food crops. Okro is one o f the non-traditional export crops being
promoted in Ghana to generate more foreign exchange revenue.
2.4 Performance Indicators For Farm Production
Investment appraisal has many dimensions. These are technical, financial, economic
and social appraisal. The basic aim o f technical appraisal is to find out whether the
physical inputs available can be effectively combined to produce the desired outputs
in a given environment. Data for technical appraisal is from various technical groups
o f specialists such as agricultural engineering, soil science and agronomy. The basic
aim of financial appraisal is to find out whether the industry or project is financially
viable, to ensure the availability of funds necessary for project implementation, and its
subsequent operation and maintenance. The appraisal is carried out using discounted
and undiscounted methods. Four discounted measures available for use are the net
Present Value (NPV), Internal Rate o f Return (IRR), Benefit-Cost Ratio (B/C), and
Net Benefit Investment ratio (N/K). Undiscounted methods, also known as traditional
investment appraisal techniques, include Simple Rate of Return and the Payback
10
University of Ghana http://ugspace.ug.edu.gh

Period. Financial ratios that can be used to judge profitability include return on sales,
return on equity, and return on assets (Bernard, 1990).
2.4.1 Concept of Farm Budgeting
Farm budgeting is a way to estimate the profitability o f a plan, or a proposed change
in a plan, before making a decision and implementing it. Examples include enterprise
budgeting, partial budgeting and whole farm budgeting. Whole farm budgets are used
to derive performance standards. Farm budgeting is a standard farm management
technique, which was introduced in the 1960s. Researchers however shifted from
whole farm budgeting to enterprise budgeting except in areas where there was
intensive intercropping (Carl and Doyce, 1982). Bernard (1990) defined an enterprise
as a well-defined production unit, which differs from other production units either by
the level o f returns to fixed resources or by the end product. The base unit for a n .
enterprise budget is typically one acre for crops and one head for livestock. Using
these common units permits an easy and fair comparison across different enterprises.
The primary purpose o f an enterprise budget is to estimate costs, returns, and profit or
net income per acre or per head for the enterprise.
A prominent problem in the use o f budgets in analysis is the valuation o f inputs and
outputs. Small-scale farmers generally purchase few inputs and retain a major portion
o f farm output for family consumption. The value researchers assign to inputs and
outputs become subjective. Another problem is the valuation o f family labour in the
construction of farm and enterprise budgets. Despite the stress on data and problem of
valuation, farm budgeting is a valuable tool o f analysis (Ruthenberg, 1980).
Budgeting is found to be invaluable in farm survey research because they could be
11
University of Ghana http://ugspace.ug.edu.gh

constructed relatively quickly and the training requirement for building and
interpreting budgets are fairly easy relative to programming and regression methods.
2.4.2 Concept of Depreciation
Depreciation is the slowly using up or loss in value o f an asset due to age and use o f
the asset. Depreciation is also defined as the estimated outlay in current prices, which
will be required if fanners were to replace the plant and equipment used up during the
year (USDA, 1975). Used depreciation is a function o f time while time depreciation is
the result of obsolescence and occurs regardless of the use o f the machine.
Obsolescence is the loss in value o f the asset as a result o f technological
improvements resulting in the production o f better machines. Fixed costs comprise
cost of inputs that do not vary with the level o f output or production in the short run
that is period o f time in which one or more o f the inputs do not change. Fixed cost is
also known as common cost. Examples o f fixed cost items include administrative and
office expenses such as accountancy fees, telephone bills and post bills; general
overheads such as car expenses, road and other rates, licenses, and general insurance;
cost o f owning fixed assets like machines and building such as depreciation (Johnson,
1990).
The three main causes o f depreciation are wear and tear with use, obsolescence, and
gradual deterioration with age. Wear and tear is the loss o f value caused by ordinary
use as distinct from damage resulting from carelessness or accidents. Ovenden (1961)
suggested that under inflationary conditions the calculation o f depreciation should be
ideally based on current prices of the items. Ways of estimating depreciation o f farm
assets include the following:
12
University of Ghana http://ugspace.ug.edu.gh

i. Straight-line method or fixed instalment method.
ii. Reducing or diminishing balance method.
iii. Sum of year’s digit method.
iv. Annual revaluation method
The straight-line method is the simplest. This method assumes that assets will
depreciate evenly throughout its lifespan. It is expressed as:
Depreciation = (Purchase price - sal vage value) / lifespan o f asset.
2.43 Cost of Production and Return on Sale
This is a term used to describe the average cost o f producing one unit o f a commodity.
Cost o f production is estimated as:
Cost o f production = Total cost / Area under cultivation
Cost o f production is a useful concept particularly when marketing the product. Any
time the product can be sold for more than its cost o f production, a profit is being
made.
Return on sales show how large an operating margin the enterprise has on its sales.
This is determined by dividing the net income by the revenue. The lower the return on
sales, the greater the sales that must be made to make an adequate return on
investment. High return on sales o f an enterprise indicates larger operating margin of
the enterprise per unit of sales, and therefore the more attractive the investment.
13
University of Ghana http://ugspace.ug.edu.gh

2.4.4 Benefit-Cost Ratio
Benefit-cost ratio is a profitability indicator, which expresses the relationship between
the sum of net benefits and capital costs over the life of a project. If the ratio is greater
than one, it implies that the farmer benefits from the farm enterprise. If the ratio is less
than one, it implies that the farmer is not benefiting from the farm enterprise. If the
ratio is equal to one, it implies that the farmer is at break-even point, where he neither
gains nor loses. Various researchers to determine profitability had used the ratio.
Asare (2000) used the ratio in his research work, “Cost-Benefit Analysis o f Citrus
Production in the Eastern Region of Ghana”, and had a benefit-cost ratio o f 1.48. This
ratio is greater than one and implies that citrus production is profitable. Amoako
(1997) and Ofori (1997) also used the ratio in their research work and had a benefit-
cost ratio of 1.85 and 1.68 respectively. These ratios are also greater than one and
imply that the project is profitable.
2.5 Changes in Key Variables on Crop Profitability
The manager’s job is to make decisions in an environment o f risk and uncertainty.
Risk refers to a situation where the exact outcome is not known, but the probabilities
associated with the possible outcomes, estimated objectively with data are known.
Uncertainty refers to situations where the probabilities of the outcome are not known
but estimated subjectively. Production of agricultural commodities depend to a large
extent on some prevailing natural conditions like temperature, rainfall and humidity in
a developing country like Ghana. Most Ghanaian okro farmers rely solely on the
weather for production. An adverse condition like an outbreak o f disease, reduction in
the total amount o f rainfall will reduce the yield o f the crop and consequently reduce
gross revenue that will be derived from the production of okro. Farm investment, such
14
University of Ghana http://ugspace.ug.edu.gh
as growing of crops may result in a range o f possible yield, net returns, and gross
returns. Drought, pest and diseases, price uncertainty and yield influence the
outcomes. Any expected increase in income from farming, therefore, entails some
risks. Depending on the risk attitude o f the individual farmer, a farmer is either risk-
averse, risk-neutral, or risk-preferrer. A risk-averse farmer is one who is a caution
individual with preference for less risky sources o f income. A risk-neutral individual
makes his decisions without regard to the risks involved. Risk-preferrers, on the other
hand tend to be adventuresome with their liking for risky farm ventures and
investment.
There are various methods for assessing risk at the farm level. These include the
range, expected value, coefficient o f variation, maximin approach and sensitivity
analysis.
The range is a measure of variability and is the difference between the highest
possible net returns or yields and the lowest possible net returns from the production
of okro. A high value implies that the outcome can vary widely. A risk-averse okro
farmer may prefer strategies with lower range.
The expected value is found by summing the products of each possible outcome times
the probability as follows: IR j = ZiPiR], where IR j is the expected value, Pi is the
probability of each net return and R( is the net returns. The probabilities associated
with each net returns can be established by farmers based on subjective judgement or
from historical frequencies over a period of time. Probabilities used in risk analysis
must all be non-negative (Pi 2 0) and must sum up to one (X,P, = 1). An expected
15
University of Ghana http://ugspace.ug.edu.gh

value o f X cedis in terms o f net returns, implies that on the average, the net returns of
okro production is X cedis per hectare. The risk-averse farmer prefers high expected
value in terms o f net returns.
The coefficient o f variation is the standard deviation divided by the expected value. If
the coefficient o f variation o f a net return o f fresh okro production is 0.13 and that of
seed okro production is 0.25, then it implies that it is riskier to produce seed okro than
fresh okro in terms of net returns variability.
The maximin approach is a method that examines different strategies for only the
worst possible outcomes such as the worst profit or net returns in severe drought
years. The farm strategy that gives the best result in the worst years is chosen farmer
who is assumed to be risk-averse.
Sensitivity analysis is a modelling and risk assessment procedure in which changes
are made to significant variables in order to determine the effect o f these changes on
the planned outcome. This analysis is usually applied to one estimate at a time
although it can be applied to each estimate simultaneously.
2.6 Crop Profitability
The determinants of crop profitability are yield o f crop, price per unit o f output,
variable costs, labour and machinery costs. A rewarding way to increase crop
profitability is to increase crop yield. The yield o f a crop depends on planting o f
quality seeds, planting of crop at the right time, application o f the correct quantities of
fertilizer and insecticides, control o f weeds on time and the technique employed in
16
University of Ghana http://ugspace.ug.edu.gh
harvesting o f the produce among others. High crop yield will increase crop
profitability when the price o f the product is not reduced significantly (Bernard,
1990).
Introducing a new technique of production, such as introducing irrigation, using a
different type of chemical control and using a new seed variety for planting could lead
to an increase in crop profitability. The marginal revenue in this case should be high
enough to cover the marginal cost. Crop rotation and timeliness o f operations are also
relevant factors to consider in any intervention to increase crop profitability. Crop
rotation is the growing o f crop in a sequence on the same piece o f land. It maintains
soil fertility and increases yield o f crops.
Obtaining a higher price for the output and reducing variable cost o f production are
also vital way for increasing the profitability o f crops. Higher price o f output could be
achieved by improving time o f marketing and quality o f produce (Bernard, 1990).
Opportunities existing for variable cost reduction include, soil analysis in order to
avoid wasting fertilizer. Although there is cost associated with soil analysis, the
overall effect per hectare is low as compared to the wastage o f fertilizer per hectare.
Economising in the use o f fertilizer by placement rather than broadcasting is also a
way to avoid wasting fertilizer in the cultivation o f okro in order to reduce variable
cost of production. Timely cultivation of the crop to avoid the cost o f weedkillers is
also necessary to reduce variable cost o f production. Timely cultivation will also
reduce competition o f the crop with weedkillers. Yield o f crop is then increased and
profitability is increased when the marginal revenue in this case is high enough to
cover the marginal cost.
17
University of Ghana http://ugspace.ug.edu.gh
Profitability of a farm enterprise may be raised, by increasing the total gross margin
of the farm. Total gross margin of a farm is increased when the gross margins of
existing enterprises are increased. It could be also be increased by substituting one or
more enterprises for one or more others, or expanding an existing enterprise or
reducing a new one without reducing other enterprises. The change will increase crop
profitability only if the fixed cost is not raised significantly (Bernard, 1990; Johnson,
1990).
18
University of Ghana http://ugspace.ug.edu.gh

CHAPTER THREE
METHODOLOGY
3.1 Theoretical Framework
Financial analysis is aimed at determining the project’s financial profitability on the
basis o f actual or market prices and is the approach followed in the present study to
compare the profitability o f fresh and seed okro production. Profitability can be
measured in absolute terms or in ratio (Londurback and Dominic, 1982). Net income
or profit is an absolute measure o f profitability and is given by the difference between
gross farm income and total farm expenses (Dillion and Herdaker, 1993). A positive
net income of an enterprise implies the production process is profitable and a negative
net income implies the production process is not profitable. Ratios measuring
profitability include the benefit-cost ratio and return on sales. The benefit-cost ratio is
obtained by dividing the present worth o f benefit stream by the present worth o f cost
stream. The selection criteria is to accept all projects with a ratio o f one or greater
than one, and reject all projects with a ratio less than one. According to Gittinger
(1982), return on sales, is one o f the important ratios that can be used as a measure of
profitability. Return on sales shows the magnitude o f the operating margin o f an
enterprise per unit o f sales. High return on sales implies high operating margin, and
high profitability o f the enterprise. The lower the return on sales the lower the
operating margin and the lower the profitability o f the enterprise. This ratio is most
useful when comparing industries or enterprises in the same sector, and when
analysing results o f past operations and comparing projection for future expansion.
19
University of Ghana http://ugspace.ug.edu.gh

3.2 Identification of Variables
Input and output variables were carefully identified to measure the performance of
each enterprise. Input variables identified include seed for planting, fertilizer,
fungicides, insecticides, weedicides, land, labour, and baskets used by the farmer per
acre of land. Output variables include total quantity o f produce from each enterprise
and the price. Total quantity of fresh okro produced is made up o f quantities sold,
given out as gifts, and that consumed by farmer and family. Total quantity o f seed
okro produced is made up of quantities sold, given out as gifts, and quantities used as
seeds by fanner for planting. Labour activities identified in the production o f fresh
okro and seed okro include ploughing, harrowing, seeding (seed planting), irrigating,
weeding, fungicide application, weedicide application, insecticide application, and
shelling of dry fruits.
3.3 Method of Data Analysis
Average cost and average returns per acre o f each enterprise were estimated for each
farm size from the data collected. These results were then used to estimate total cost
and total returns associated with the whole enterprise separately.
In this study, the farm budget procedure was adopted to estimate the profitability o f
each enterprise separately. The first specific objective, which is to estimate the cost of
fresh and seed okro production was achieved by adding total variable cost to the total
fixed cost o f production in each enterprise separately. Total cost (TC) o f production is
the sum o f total variable cost (TVC) and total fixed cost (TFC).
20
University of Ghana http://ugspace.ug.edu.gh
Variable costs comprise cost of all inputs that vary with the level of output in the short
run, and are consumed in the production season. Variable inputs in irrigated
agriculture include seeds, fertilizer (N. P. K., sulphate o f ammonia, potassium nitrate),
cymethoate, karate, Dithane M45, labour, hiring o f knapsack sprayer and tractor. Cost
o f variable inputs, were valued at the prices farmers paid for the adoption o f these
inputs, that is, at market prices. The actual quantities o f inputs used in the production
process were used to compute the total cost o f the input and not the total quantity o f
input purchased. The sum of all the costs of these variable inputs gave the total
variable cost o f production. This was estimated separately for each farmer and
enterprise. For a farmer, variable cost o f production per unit area was estimated by
dividing the variable cost by the area under cultivation.
Fixed costs comprise cost of all inputs that do not vary with the level o f output or
production in the short run. Fixed inputs identified in the study include land, hoes,
irrigation water, baskets, and cutlasses. In the study, irrigation water is treated as a
fixed cost item because at Kpando Torkor, farmers are charged a fixed amount for
water supplied during the whole production period. Fixed cost was estimated in terms
o f the value o f the fixed input used, during a single production period, that is, the sum
of the depreciated value o f the input over time. The straight-line method was used to
account for the value o f fixed assets such as cutlass and hoe. This method spreads the
cost o f a fixed asset in equal amounts over the economic period o f usage. It is
expressed as:
D = (OC - SV) / N
Where,
D = value of depreciation.
21
University of Ghana http://ugspace.ug.edu.gh

OC = ori ginal cost o f asset.
SV = salvage value
N = expected lifespan of asset.
The salvage value is assumed to be zero since traditional farmers hardly sell or use the
farm tool for other economic purposes after its economic life. The expected life o f the
assets is assumed to be two years for a cutlass or a hoe. The annual depreciation o f the
assets was evaluated and added to cost o f irrigation and land (rent) to get the total
fixed cost. For a farmer, fixed cost o f production per unit area was estimated by
dividing fixed cost by the area under cultivation. Cost o f production per hectare was
estimated as:
Cp _ TVC [ TFC A A
Where,
CP = Cost of production per hectare.
TC = Total cost
TVC = Total variable cost
TFC = Total fixed cost
A = Area under cultivation in hectares
22
University of Ghana http://ugspace.ug.edu.gh

To estimate the benefits or total revenue (TR) of fresh and seed okro production, the
total quantity of produce was multiplied by the unit price. Total quantity o f fresh okro
produced was estimated from quantities given out as gifts, fresh fruits consumed at
home and quantities sold. The sum o f these was used as the total quantity o f fresh
okro produced. Total quantities o f fresh okro produced were recorded in baskets (one
basket is approximately equal to 20.0 kg). For a farmer, total revenue per unit area
was estimated as:
Q* P
Where,
77? = -A
TR = Total revenue per hectare.Q = Total quantities of fresh okro in baskets.P = Price o f fresh okro in baskets.A = Area under cultivation in hectares.
Quantity of seed okro produced was estimated from quantities given out as gifts,
seeds used for next season planting and quantity sold. The sum o f these was used as
the total quantity o f seed produced. Quantities o f seed okro were recorded in bottles
(680 ml beer bottle). Unit price of seed okro, and the total quantity of seed okro
produced were used to estimate total revenue o f seed okro. Fresh and seed okro were
valued at farm gate price, because retailers usually visited most farmers on the farm
and in houses. Retailers buy the produce and send it to the market for sale.
For a fanner, total revenue per unit area was estimated as:
0 * P TR = ^ — —A
Where,TR = Total revenue per hectare.Q = Total quantities of seed okro in bottles.P = Price of seed okro in bottles.A = Area under cultivation in hectares.
23
University of Ghana http://ugspace.ug.edu.gh

3.4 Comparing Profitability Estimates
To compare the profitability of fresh and seed okro production, the net income
(profit), the benefit-cost concept, and return on sale concept were used.
3.4.1 Net Income
The difference between average revenue and average farm expenses is the average net
income of an enterprise. Net income (profit) is given mathematically as:
Where,
n = Net income per enterprise
TR = Total revenue per farmer
TFC = Total fixed cost per farmer
TVC = Total variable cost per farmer
N = number o f fanners (1,2, 3 , . . . N farmers)
A given enterprise is accepted if the profit figure estimated is positive; this indicates
profit. The enterprise is rejected if the profit figure estimated is negative, and this
indicates a loss. The higher the. profit of an enterprise, the better the enterprise.
24
University of Ghana http://ugspace.ug.edu.gh

3.4.2 Benefit-Cost Ratio
Benefit-cost ratio was calculated for each enterprise, that is, fresh okro production
and seed okro production. Benefit-cost ratio is a discounted measure o f investment or
project worth. The ratio was estimated as:
Where,
B/C = Benefit-Cost ratio
B, = average total benefit
Ct = average total cost
r = opportunity cost o f capital
t = time in years (1, 2 ... n)
n = fourth and final year o f project
If the ratio is greater than one, it means the farmer benefits from the farm enterprise.
If the ratio is less than one, then the farmer is not benefiting from the enterprise. If the
ratio is equal to one, it means the farmer is at break-even point, where he neither gains
nor loses.
25
University of Ghana http://ugspace.ug.edu.gh

3.4.3 Return on Sale
Comparison of profitability of the two enterprises was also addressed by using return
on sales. Return on sale (ROS) is given as:
ROS = n/ATR
17= Net income per hectare of an enterprise
ATR = Average total revenue per hectare of an enterprise
Return on sales shows how large an operating margin, the enterprise has on sales. An
enterprise having a low return on sales implies that, greater quantity of the commodity
or produce from the enterprise must be sold to make an adequate return on
investment. High return on sales of an enterprise indicates larger operating margin of
the enterprise per unit o f sales, and therefore the more attractive the investment.
3.5 Sensitivity Analysis
Sensitivity analysis takes care o f risks and uncertainties about the conclusions drawn
on the acceptability of okro enterprise under unfavourable conditions. Cost
projections are inevitably subject to high degree o f uncertainty about what will
actually happen. Unfavourable climatic conditions, pests and diseases can result in
low yield of okro. Low yield and low price o f okro fruits can result in low benefit in
okro production. Okro farmers may borrow from the bank to invest in okro
production. A substantial increase in interest rate can erode earnings from the
enterprise. A reworking of the analysis was carried out to see what happens when
interest rate, revenue, and cost changes for fresh and seed okro. The sensitivity
University of Ghana http://ugspace.ug.edu.gh

analysis was therefore undertaken to determine the effect o f the following on the
profitability of both fresh and seed okro enterprises:
1. A 10% reduction in total revenue in both fresh and seed okro production.
2. A 10% increase in total cost in both fresh and seed okro production.
3. A 50% increase in interest rate.
3.6 Statistical Test
The mean was used as a measure o f central tendency. In this study, measures o f
dispersion used include variance, standard deviation, and coefficient o f variation.
Coefficient o f variation is used to measure the relative variability o f the data set. The
measures o f central tendency and dispersion were used together because the picture of
variability o f a data set is given by the two measures more than the use o f the central
tendency alone. The mean values o f average cost, total revenue, and net revenue of
fresh and seed okro production were compared using the t-distribution to test for
difference between means.
3.6.1 Measures of Variability
The coefficient o f variation was used to assess variability o f the data sets o f seed and
fresh okro production. It was computed separately for the components o f fixed and
variable cost for each o f the enterprises. Coefficient o f variation (CV) is estimated as:
27
University of Ghana http://ugspace.ug.edu.gh

Where.
SD = Sample standard deviation.
X = Sample mean.
A higher value of coefficient o f variation implies that there is a higher relative
variability, and a lower value o f coefficient o f variation implies that there is a lower
relative variability.
3.6.2 Test of Hypothesis
The following null hypotheses (H0) were tested against their corresponding alternate
hypotheses (Hi):
i. Ho : The mean total costs o f fresh and seed okro production are not different.
Hi : The mean total costs o f fresh and seed okro production are different.
ii. Ho: The mean total revenue o f fresh and seed okro are not different.
H] : The mean total revenue o f fresh and seed okro are different.
iii Ho : The mean net revenue of fresh okro production is equal to that of
seed okro production.
Hi : The mean net revenue of fresh okro production is less than that o f seed
okro production.
28
University of Ghana http://ugspace.ug.edu.gh
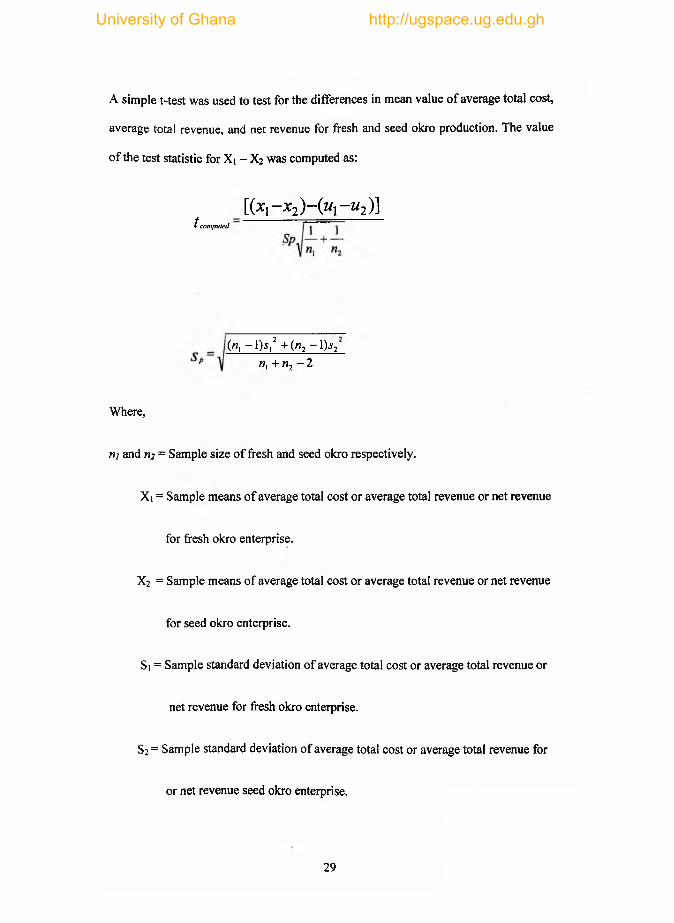
A simple t-test was used to test for the differences in mean value of average total cost,
average total revenue, and net revenue for fresh and seed okro production. The value
o f the test statistic for Xi - X2 was computed as:
Where,
m and ri2 = Sample size o f fresh and seed okro respectively.
Xi = Sample means o f average total cost or average total revenue or net revenue
for fresh okro enterprise.
X2 = Sample means o f average total cost or average total revenue or net revenue
for seed okro enterprise.
51 = Sample standard deviation of average total cost or average total revenue or
net revenue for fresh okro enterprise.
52 = Sample standard deviation of average total cost or average total revenue for
or net revenue seed okro enterprise.
[ { x x- x 2) - { u x- u 2)\t computed
(«, ~ l ) j ,2 + ( » 2 - l ) j 2
k, + n, - 2
29
University of Ghana http://ugspace.ug.edu.gh

U, = Population means o f average total cost or average total revenue or net
revenue for fresh okro enterprise.
U2 = Population means o f average total cost or average total revenue or net
revenue for seed okro enterprise.
The values of Ut - U2 were substituted from the null hypotheses (Ho).
3.7 Data Sources
The prices and quantities o f inputs used were obtained from the fanners. Data to
estimate cost and revenue were obtained through the use o f structured questionnaires.
Where necessary, similar data was obtained from dealers in okro inputs. This was
done to check the accuracy o f information or data obtained from the farmers. Where
large differences existed, the suppliers’ figures or data was used for input cost, whiles
farmers’ figures were used for output.
3.8 The Survey
A structured questionnaire was used for the survey. Disorganization o f fanners
thought was avoided by carefully arranging the questions. A list was prepared for all
fresh okro farmers and seed okro farmers. A farmer was randomly selected from the
first four names through balloting. Every third name on the list was subsequently
selected and interviewed. A total of 90 farmers, 30 for each enterprise, were selected
for interviewing, constituting about 48 percent o f the entire population.
30
University of Ghana http://ugspace.ug.edu.gh

CHAPTER FOUR
RESULTS AND DISCUSSION
4.1 Introduction
This chapter is aimed at presenting and analyzing the results o f the study. It begins by
discussing plot size and total cost estimates for both fresh and seed okro production in
the two seasons, that is, rainy season and dry season production. It includes the
analysis o f fixed cost and variable cost o f both enterprises. It continues by analyzing
the total revenue and net revenue estimates derived from the production o f fresh and
seed okro. Results on profitability estimates are also presented and discussed. The
chapter ends by discussing problems facing the production of fresh and seed okro.
Fresh okro fruits and seed okro are the major reasons for producing okro by different
farmers in the study area in the rainy season, but in the dxy season the major reason
for producing okro is for the fresh immature fruits. Costs and revenue estimates o f
fresh immature okro fruits and seed okro production in the same season were
therefore compared.
4.2 Plot Size per Farmer by Enterprise
A summary o f mean plot size by enterprise is presented in Table 4.0. Among the
enterprises, mean plot size for seed okro is the lowest at 0.3 hectares. This is followed
by fresh okro production in the rainy season, which registered a mean plot size o f 0.5.
Fresh okro production in the dry season registered a mean plot size o f 0.6. This
implies that farmers produce seed okro on a smaller size o f plot as compared to fresh
okro production. Mean plot sizes for individual fresh okro farmers in the rainy season
ranged from 0.3 to 0.6, with a coefficient o f variation of 21.81%. Plot sizes for
31
University of Ghana http://ugspace.ug.edu.gh

individual seed okro farmers in the same season ranged from 0.2 to 0.4, with a
coefficient of variation of 28.72%. This implies that the data set for seed okro
production showed variability more than the data set for fresh okro in the same
season. Plot sizes for individual fresh okro farmers in the dry season on the other hand
ranged from 0.3 to 0.8, with a coefficient o f variation of 27.69%.
Table 4.0Mean Plot Size by Enterprise
Rainy Season Dry SeasonFresh Okro Plot Size
(Ha)Seed Okro Plot Size
(Ha)Fresh Okro Plot Size
(Ha)Mean 0.5 Mean 0.3 Mean 0.6C Var. 0.2181 C Var. 0.2872 C Var. 0.2769Min. 0.3 Min, 0.2 Min. 0.3Max. 0.6 Max. 0.4 Max. 0.8Source: Appendix 1
4.3 Fixed Cost Estimates of O kro Production
The summary of fixed cost estimates for fresh and seed okro production in the rainy
and dry seasons is presented in Table 4.1. The Table showed that total fixed costs for
individual fresh okro farmers ranged from 00.37 million to 00.71 million in the rainy
season, with a mean o f 00.61 million. Total fixed costs for individual seed okro
farmers in the same season, on the other hand ranged from 00.62 million to 00.78
million, with a mean o f 00.68 million. Further analysis reveals that the total fixed cost
represents 11.87 percent of the total cost of producing fresh okro fruit in the rainy
season and 12.43 percent for seed okro production. The close relationship o f the
figures is due to the fact that the tools and equipment used for the production o f fresh
and seed okro are almost the same in the study area. Therefore any intervention to
reduce total fixed cost o f producing fresh okro could be applied to seed okro
production, in order to increase farmer’s net income.
32
University of Ghana http://ugspace.ug.edu.gh

Table 4.1Fixed Cost Estimates Per Hectare of Fresh and Seed Okro ProductionCost Items Rainy Season Dry Season
Fresh Okro (0*000,000)
Seed Okro (0’OOO,OOO)
Fresh Okro (0’OOO,OOO)
Rent:Mean 0.16 0.16 0.16Coeff. of Variation 0 0 0Min. . - -
Max. - - -Depreciation:Mean 0.45 0.53 0.43Coeff. of Variation 0.1309 0.0962 0.1358Min. 0.22 0.46 0.36Max 0.55 0.63 0.65Irrigation:Mean 0.20 flatCoeff. of Variation - - 0Min. - - 0.20Max - - 0.20Total:Mean 0.61 0.68 0.78Coeff. of Variation 0.0973 0.0742 0.0741Min. 0.37 0.62 0.72Max 0.71 0.78 1.01Source: Appendices 3, 4, and 5.
The coefficient of variation for fresh okro production is 9.73 percent compared with a
coefficient o f variation o f 7.42 percent for seed okro production. Since the coefficient
of variation o f total fixed cost for seed okro production has a lower value than the
coefficient o f variation o f total fixed cost for fresh okro production, total fixed cost
for seed okro production has a lower relative spread than total fixed cost o f fresh okro
production.
The study revealed that, dry season okro production is focused on fresh okro fruit
production. Total fixed costs of individual fresh okro fruit fanners in the dry season
ranged from 00.72 million to 01.01 million, with a mean o f 00.78 million, and a
coefficient o f variation of 7.41 percent. Total fixed cost is about 13.73 percent o f the
total cost.
33
University of Ghana http://ugspace.ug.edu.gh

4.3 Variable Cost Estimates of O kro Production
Variable costs vary with changes in output, and it is a very important component to
consider in making production decisions. A summary o f total variable cost estimates
for fresh okro fruit and seed okro production are presented in Table 4.2.
Table 4.2Variable Cost Estimates Per Hectare for Fresh and Seed OkroCost Item Rainy Season Dry Season
Fresh Okro (£’000,000)
Seed Okro (£’000,000)
Fresh Okro (£’000,000)
Labour:Mean 2.37 3.14 3.27Coeff. o f Variation 0.0460 0.2154 0.1975Min. 2.26 2.25 2.27Max 2.64 4.98 6.42Fertilizer:Mean 0.40 0.44 0.45Coeff. of Variation 0.1599 0.0649 0.1568Min. 0.24 0.39 0.13Max 0.51 0.50 0.55Agro-chemical:Mean 0.70 0.72 0.71Coeff. of Variation 0.0608 0.0319 0.1358Min. 0.57 0.68 0.25Max 0.75 0.79 0.78Planting material:Mean 0.35 0.38 0.35Coeff. of Variation 0.1023 0.0529 0.2019Min. 0.28 0.29 0.03Max 0.40 0.41 0.47Transport:Mean 0.11 0.12 0.12Coeff. of Variation 0.1592 0.1189 0.1689Min. 0.08 0.09 0.09Max 0.15 0.14 0.18Total variable cost: Mean 4.53 4.79 4.90Coeff. of Variation 0.0355 0.1433 0.1389Min. 4.15 3.74 3.68Max 4.86 6.62 8.03Source: Appendices 6, 7, and 8.
The total variable cost per hectare o f fresh okro production in the rainy season ranged
from £4.15 million to £<£4.86 million, with a mean o f 04.53 million and a coefficient
34
University of Ghana http://ugspace.ug.edu.gh

of variation of 3.55 percent. Unlike fresh fruit production, total variable cost for seed
okro production ranged from 03.74 million to £6.62 million, with a mean of 04.79 and
a coefficient of variation o f 14.33 percent. Variable cost accounts for 88.13 percent o f
the total cost of fresh okro fruit and 87.57 percent for seed okro production in the
rainy season. In general, the variable cost of seed okro production is higher than
production of fresh okro. This could be due to imputed labour cost associated with
threshing dried fruits and drying of seed okro. Total variable cost for dry season fresh
okro production ranged from 03.68 million to 08.03 million, with a mean o f 04.89
million and a coefficient o f variation of 13.89 percent. Variable cost accounts for
86.27 percent o f the total cost. About 66.73 percent o f the variable cost is attributed to
labour cost. Reduction in labour cost could reduce the variable cost, which will
increase net income.
4.4 Total Cost Estimates
Total cost of producing fresh and seed okro is presented in Table 4.3. The total cost o f
producing fresh okro fruits ranged from 04.52 million to 5.48 million, with a mean
total cost o f 5.14 million, whiles total cost o f producing seed okro ranged from 04.42
million to 07.35 million, with a mean total cost o f 5.47 million. The coefficient of
variation for fresh okro is 3.80 percent, and that for seed okro is 12.66 percent. This
implies that there is higher relative variability in the sample of total cost o f producing
seed okro than fresh okro. The critical values o f t for d f = 58 and 0.025 in each tail o f
the t-distribution are -2.00 and 2.00. The value o f the test statistics t for Xi - X2 is
-2.516. Because the value of the test statistic t = -2.516 falls in the rejection region,
the null hypothesis is rejected. Consequently it’s concluded that the mean total cost o f
producing fresh and seed okro are different.
35
University of Ghana http://ugspace.ug.edu.gh

Table 4.3Summary of Total Cost Estimates per Hectare (In Million Cedis)
Rainy Season Dry SeasonFresh Okro Seed Okro Fresh Okro
Total Fixed Cost: Mean 0.61 0.68 0.78Coeff. o f Variation 0.0973 0.0742 0.0741Min. 0.37 0.62 0.72Max 0.71 0.78 1.01Total Variable Cost:Mean 4.53 4.79 4.90Coeff. of Variation 0.0355 0.1433 0.1389Min. 4.15 3.74 3.68Max 4.86 6.62 8.03Total Cost: Mean 5.14 5.47 5.68Coeff. o f Variation 0.0380 0.1266 0.1187Min. 4.52 4.42 4.49Max 5.48 7.35 8.80Source: Appendices 9 ,10, and 11.
The higher cost o f seed okro production as compared to the fresh okro could be due to
labour costs associated with threshing of dried fruits, drying o f seeds and purchase o f
680 ml beer bottle. These activities are not undertaken in fresh okro production.
4.5 Total Revenue Estimates of Okro Production
Total revenue for fresh okro fruit ranged from 05.30 million to 08.40 million (see
Table 4.4), with a mean o f 06.67 million and coefficient o f variation o f 12.70 percent
for the sample. Unlike fresh okro, seed okro registered a range o f total revenue from
06.70 million to 09.55 million, with a mean o f 08.30 million. The coefficient of
variation for the sample is 7.25 percent.
The total revenue for seed okro production is about 01.63 million higher than that o f
fresh okro fruits production. This could be due to price variability o f fresh and seed
36
University of Ghana http://ugspace.ug.edu.gh

okro over the same period of study. The critical values o f t for d f = 58 and 0.005 in
each tail o f the t-distribution are -2.66 and 2.66. The value of the test statistics t for
X| - X2 is -8.581. Because the value o f the test statistic t = -8.581 falls in the rejection
region, the null hypothesis is rejected. Consequently it’s concluded that the mean total
revenue of fresh and seed okro are different.
Table 4.4Mean Total Revenue per Hectare of Fresh and Seed Okro Production (In Million Cedis)_______________ ______________________________________ ________
Rainy Season Dry SeasonFresh Okro Seed Okro Fresh Okro
Total Revenue:Mean 6.67 8.30 10.41Coeff. o f Variation 0.1270 0.0725 0.1121Min. 5.30 6.70 8.13Max 8.40 9.55 11.75Total Cost:Mean 5.14 5.47 5.68Coeff. of Variation 0.0380 0.1266 0.1187Min. 4.52 4.42 4.49Max 5.48 7.35 8.80Net Revenue:Mean 1.53 2.82 4.73Coeff. of Variation 0.5776 0.3529 0.2949Min. 2.19 0.73 1.72Max 3.41 5.05 6.39
Source: Appendices 12, 13, 14, 15, 16 and 17.
There is a higher relative variability in the total revenues o f fresh okro as compared to
seed okro. Total revenue for dry season fresh okro production ranged from (48.13
million to 011.75 million, with a mean of £ 10.41 million, and a coefficient o f
variation of 11.21 percent. The high total revenue derived from dry season fresh okro
production could be due to high price o f the produce. A basket o f fresh okro was sold
for 060,000.00 in the dry season. This high price could be due to demand exceeding
supply of fresh okro in the study area.
37
University of Ghana http://ugspace.ug.edu.gh

4.6 Net Revenue Estimates
Net revenue per hectare o f fresh and seed okro production is presented in Table 4.4.
The net revenue for fresh okro ranged from £2.19 million to £3.41 million, with a
mean of £1.53 million, but net revenue for seed okro ranged from £0.73 million to
£5.05 million, with a mean of £2.82 million. The coefficient o f variation o f fresh okro
is higher, 57.76 percent, than seed okro with a coefficient o f variation o f 35.29
percent. The critical values of t for d f = 58 of the t-distribution is -2.392. The value of
the test statistics t for Xi - X2 is -5.304. Because the value o f the test statistic t =
-5.304 falls in the rejection region, the null hypothesis is rejected. Consequently it’s
concluded that the mean net revenue o f seed okro production is higher than that of
fresh okro production. Although total cost for seed okro production was higher than
fresh okro, net revenue for seed okro is high. This is due to the high total revenue
from the production o f seed okro. Net revenue o f dry season fresh okro enterprise
ranged from £1.72 million to £6.39 million, with a mean o f £4.73 million / ha and a
coefficient o f variation o f 29.49 . percent. Further analysis revealed that the returns
from dry season fresh okro fruits production (£4.73 million / ha) are higher than that
o f rainy season fresh okro fruit production, which is £1.53 million / ha. Okro fanners
in the area could expand their farm for the production of fresh okro in the dry season
as an attempt to raise their net income. A leguminous crop such as groundnut or
cowpea could be cultivated in the rainy season and fresh okro also cultivated in the
dry season in a rotation system on the same piece of land. This system will raise the
fertility o f the soil and reduce total cost o f fertilizer application. Net revenue to the
dry season okro farmer could be raised in this system.
38
University of Ghana http://ugspace.ug.edu.gh

4.7 Benefit-Cost Ratio
Benefit-cost ratio was calculated for each enterprise, that is fresh okro fruits
production, and seed okro production in the rainy season as well as dry season fresh
okro fruit production. The ratio was estimated as:
B / C = benefit-cost ratio.
B,= average benefit.
C, = average cost.
r = discount factor,
t = time in years.
4.7.1 Discounted Cash Flow
The financial cash flow was discounted at the opportunity cost o f capital and
projected in Table 4.5. The farmers used their own resources as a source o f capital
invested in the 2001-growing season. The rate o f return on equity capital was assumed
to be the opportunity cost of investing their money in 91-day Treasury bill. The
interest rate on a 91-day Treasuiy bill for the period was 29.7 percent. The cash flow
was therefore discounted at 29.7 percent. The benefit-cost ratio for rainy season fresh
okro production is 1.33. 1.33 is greater than one by 0.33. This implies that in real
terms, every cedi invested in the production of fresh okro fruits would yield an
average return of 0.33 of a cedi in the end. The benefit-cost ratio for rainy season seed
okro production is 1.38. 1.38 is greater than one by 0.38. This implies that in real
N
Where,
39
University of Ghana http://ugspace.ug.edu.gh

terms, every cedi invested in the production of seed okro fruits would yield an
average return of 0.38 of a cedi in the end. Further analysis revealed that 1.38 is
greater than 1.33 by 0.05. This implies that in real terms, every cedi invested in both
enterprises (fresh orkro and seed okro enterprises) in the rainy season, seed okro
would yield an average return of 0.05 o f a cedi higher than what fresh okro would
yield at the end. The benefit-cost ratio for dry season fresh okro production is 1.80.
1.80 is greater than one by 0.80. This implies that in real terms, every cedi invested in
the production of fresh okro fruits would yield an average return of 0.80 of a cedi in
the end. Dry season production o f fresh okro is higher (0.47) than rainy season fresh
okro fruit production. This implies that a cedi invested in the production of fresh okro
in the rainy or dry season, dry season fresh okro fruits production would yield 0.47,
higher than rainy season fresh okro fruit production in the end.
Table 4.5The Financial Cash Flow (£’000,000)Season Enterprise Year Benefits Costs Discount
at factor 29.7%
Presentworthbenefits
Presentworthcosts
Rainyseason
Fresh okro 2001 6.67 5.00 0.7710 5.142600 3.85502002 6.67 5.00 0.5945 3.965315 2.97252003 6.67 5.00 0.4583 3.056861 2.29152004 6.67 5.00 0.3534 2.357178 1.7670Total 14.521920 10.8860
Seed okro 2001 8.30 6.01 0.7710 6.39930 4.633712002 8.30 6.01 0.5945 4.93435 3.5729452003 8.30 6.01 0.4583 3.80389 2.7543832004 8.30 6.01 0.3534 2.93322 2.123934Total 18.07076 13.08497
Dryseason
Fresh okro 2001 10.41 5.77 0.7710 8.026110 4.448672002 10.41 5.77 0.5945 6.188745 3.4302652003 10.41 5.77 0.4583 4.770903 2.6443912004 10.41 5.77 0.3534 3.678894 2.039118Total 22.66465 12.56244
Source: Appendices 17 and 18.
40
University of Ghana http://ugspace.ug.edu.gh

Table 4.6Benefit-Cost Ratio of Fresh and Seed Okro ProductionType o f Season Rainy Season Dry SeasonType of Enterprise Fresh Okro Fruit Seed Okro Fresh Okro FruitTotal present worth benefit (B)
14.521920 18.07076 22.66465
Total present worthcost (C)
10.8860 13.08497 12.56244
Benefit-cost Ratio (B /C )
1.33 1.38 1.80
Source: Computed from Table 4.5.
4.8 Return on Sale
Return on sale (ROS) for rainy season fresh okro production was estimated as:
y N R ROS = N
Where,
NR = Net revenue per farmer.
TR = Total revenue per farmer.
N = Number o f fanners
The summary of return on sale for the enterprises is presented in Table 4.5. Return on
sale for fresh okro fruit is 0.23, and that for seed okro is 0.34. High return on sale of
an enterprise indicates larger operating margin of the enterprise per unit sales, and
therefore the more attractive the investment in such an enterprise. This implies that
investment in seed okro production could be more attractive than investment in fresh
okro fruits production.
41
University of Ghana http://ugspace.ug.edu.gh
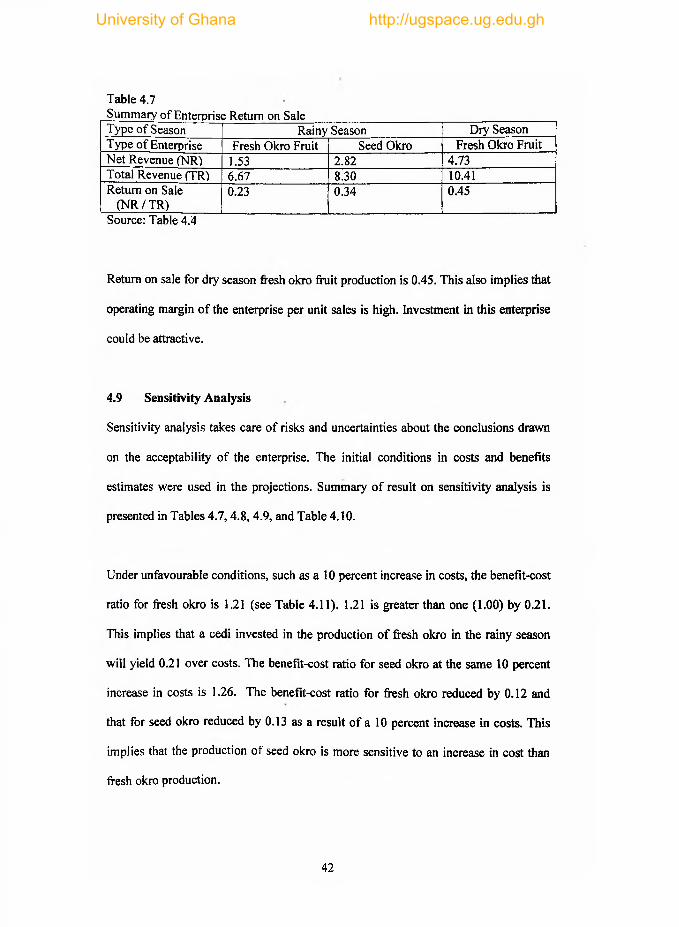
Table 4.7
Summary of Enterprise Return on SaleType of Season Rainy Season Dry SeasonType of Enterprise Fresh Okro Fruit Seed Okro Fresh Okro FruitNet Revenue (NR) 1.53 2.82 4.73Total Revenue (TR) 6.67 8.30 10.41Return on Sale
(N R /TR )0.23 0.34 0.45
Source: Table 4.4
Return on sale for dry season fresh okro fruit production is 0.45. This also implies that
operating margin o f the enterprise per unit sales is high. Investment in this enterprise
could be attractive.
4.9 Sensitivity Analysis
Sensitivity analysis takes care of risks and uncertainties about the conclusions drawn
on the acceptability of the enterprise. The initial conditions in costs and benefits
estimates were used in the projections. Summary o f result on sensitivity analysis is
presented in Tables 4.7,4.8, 4.9, and Table 4.10.
Under unfavourable conditions, such as a 10 percent increase in costs, the benefit-cost
ratio for fresh okro is 1.21 (see Table 4.11). 1.21 is greater than one (1.00) by 0.21.
This implies that a cedi invested in the production o f fresh okro in the rainy season
will yield 0.21 over costs. The benefit-cost ratio for seed okro at the same 10 percent
increase in costs is 1.26. The benefit-cost ratio for fresh okro reduced by 0.12 and
that for seed okro reduced by 0.13 as a result o f a 10 percent increase in costs. This
implies that the production of seed okro is more sensitive to an increase in cost than
fresh okro production.
42
University of Ghana http://ugspace.ug.edu.gh

The benefit-cost ratio for fresh okro as a result of a 10 percent reduction in revenue is
1.20, and that for seed okro is 1.24. This indicates the acceptability of both fresh and
seed okro production. It implies that a cedi invested in the production o f fresh okro
will yield 0.20 over costs at the end. On' the other hand a cedi invested in the
production o f seed okro will yield 0.24 over costs at the end. Further analysis revealed
that the benefit-cost ratio o f a 10 percent increase in costs for fresh okro is 1.21, and
that of a 10 percent reduction in benefits is 1.20. Again, the benefit-cost ratio o f a 10
percent increase in costs for seed okro is 1.26, and that o f a 10 percent reduction in
revenue is 1.24. In both cases, the ratio is lower at 10 percent reduction in benefits
than at a 10 percent increase in costs. This implies that the production o f fresh and
seed okro are more sensitive to a reduction in benefits more than an increase in costs.
The benefit-cost ratio o f a 50 percent increase in discount factor for fresh okro and
seed okro in the rainy season are 1.33 and 1.38 respectively. It is 1.80 for fresh okro
in the diy season. This implies that a cedi invested in the production o f fresh and seed
okro in the rainy season will yield 0.33 and 0.38 respectively, dry season fresh okro
production will yield 0.80 at the end. Considering fresh okro production in the dry
season, a 10 percent increase in costs, a 10 percent reduction in benefits and a 50
percent increase in discount factor, resulted in a benefit-cost ratio o f 1.55, 1.62, and
1.80 respectively. This implies that an increase in costs is more sensitive to the
production of fresh okro than a reduction in benefits. The least sensitive factor is an
increase in discount factor. Farmers can therefore borrow from the banks to expand
their farms. This will in turn increase their profit margin at the end. More attention
should be paid to general sanitation and the use o f high yielding variety in an attempt
to increase the benefits derived from the production o f both fresh and seed okro.
43
University of Ghana http://ugspace.ug.edu.gh

Table 4.8Sensitivity analysis at a 10% Increase in CostsSeason Enterprise Year Benefits Costs Discount
factor at 29.7%
Presentworthbenefits
Presentworthcosts
Rainyseason
Fresh okro 2001 6.67 5.50 0.7710 5.14257 4.240502002 6.67 5.50 0.5945 3.96532 3.269752003 6.67 5.50 0.4583 3.05686 2.520652004 6.67 5.50 0.3534 2.35718 1.94370Total 14.5219 11.9746
Seed okro 2001 8.30 6.61 0.7710 6.39930 5.096312002 8.30 6.61 0.5945 4.93435 3.929652003 8.30 6.61 0.4583 3.80389 3.029362004 8.30 6.61 0.3534 2.93322 2.33597Total 18.0708 14.3913
Dryseason
Fresh okro 2001 10.41 6.73 0.7710 8.02611 5.188832002 10.41 6.73 0.5945 6.18875 4.000992003 10.41 6.73 0.4583 4.77090 3.084362004 10.41 6.73 0.3534 3.67889 2.37838Total 22.6647 14.6526
Source: Computed from Table 4.5
Table 4.9Sensitivity analysis at a 10% Reduction in BenefitsSeason Enterprise Year Benefits Costs Discount
factor at 29.7%
Presentworthbenefits
Presentworthcosts
Rainyseason
Fresh okro 2001 6.00 5.00 0.7710 4.626 3.85502002 6.00 5.00 0.5945 3.567 2.97252003 6.00 5.00 0.4583 2.7498 2.29152004 6.00 5.00 0.3534 2.1204 1.767Total 13.0632 10.886
Seed okro 2001 7.47 6.01 0.7710 5.75937 4.633712002 7.47 6.01 0.5945 4.44092 3.572952003 7.47 6.01 0.4583 3.4235 2.754382004 7.47 6.01 0.3534 2.6399 2.12393Total 16.2637 13.085
Dryseason
Fresh okro 2001 9.37 5.77 0.7710 7.22427 4.448672002 9.37 5.77 0.5945 5.57047 3.430272003 9.37 5.77 0.4583 4.29427 2.644392004 9.37 5.77 0.3534 3.31136 2.03912Total 20.4004 12.5624
Source: Computed from Table 4.5
44
University of Ghana http://ugspace.ug.edu.gh

Table 4.10Sensitivity analysis at a 50% Increase in Discount FactorSeason Enterprise Year Benefits Costs Discount
factor at 44.55%
Presentworthbenefits
Presentworthcosts
Rainyseason
Fresh okro 2001 6.67 5.00 0.6918 4.614306 3.45902002 6.67 5.00 0.4786 3.192262 2.39302003 6.67 5.00 0.3311 2.208437 1.65552004 6.67 5.00 0.229 1.52743 1.1450Total 11.54244 8.6525
Seed okro 2001 8.30 6.01 0.6918 5.74194 4.1577182002 8.30 6.01 0.4786 3.97238 2.8763862003 8.30 6.01 0.3311 2.74813 1.9899112004 8.30 6.01 0.229 1.9007 1.37629Total 14.36315 10.40031
Dryseason
Fresh okro 2001 10.41 5.77 0.6918 7.201638 3.9916862002 10.41 5.77 0.4786 4.982226 2.7615222003 10.41 5.77 0.3311 3.446751 1.9104472004 10.41 5.77 0.229 2.38389 1.32133Total 18.01451 9.984985
Source: Computed from Table 4.5
Table 4.11Sensitivity analysis at a 10% Increase in Costs, 10% Reduction in Benefits, and 50% Increase in Discount Factor Simultaneously_______ ______________________ _____ _Season Enterprise Year Benefits Costs Discount
factor at 44.55%
Presentworthbenefits
Presentworthcosts
Rainyseason
Fresh okro 2001 6.00 5.50 0.6918 4.1508 3.80492002 6.00 5.50 0.4786 2.8716 2.63232003 6.00 5.50 0.3311 1.9866 1.821052004 6.00 5.50 0.2290 1.374 1.2595Total 10.383 9.51775
Seed okro 2001 7.47 6.61 0.6918 5.167746 4.5727982002 7.47 6.61 0.4786 3.575142 3.1635462003 7.47 6.61 0.3311 2.473317 2.1885712004 7.47 6.61 0.2290 1.71063 1.51369Total 12.92684 11.43861
Dryseason
Fresh okro 2001 9.37 6.73 0.6918 6.482166 4.6558142002 9.37 6.73 0.4786 4.484482 3.2209782003 9.37 6.73 0.3311 3.102407 2.228303-2004 9.37 6.73 0.2290 2.14573 1.54117Total 16.21479 11.64627
Source: Computed from Table 4.5
45
University of Ghana http://ugspace.ug.edu.gh

Table 4.12Enterprise Benefit-Cost RatiosType of Season Rainy Season Dry SeasonType of Enterprise Fresh Okro Fruit Seed Okro Fresh Okro FruitSensitivity Factor 10%
incr.incosts
10%red.inben.
50%incr.inDF
10%incr.incosts
10%red.inben.
50%incr.inDF
10%incr.incosts
10%red.inben.
50%incr.inDF
Total present worth benefit (B )
14.52 13.06 11.54 18.07 16.26 14.36 22.67 20.40 18.02
Total present worth cost (C)
11.98 10.89 8.65 14.39 13.09 10.40 14.65 12.56 9.99
Benefit-cost Ratio(B /C )
1.21 1.20 1.33 1.26 1.24 1.38 1.55 1.62 1.80
Source: Computed from Tables 4.7,4.8, and 4.9
4.10 Constraints to Okro Production.
Figure 4.1 shows constraints faced by okro farmers interviewed in the study area. Pest
and disease problems, high cost of agro-chemical, and poor market price are the
problems facing the production of okro in the study area.
Fig. 4.1
Constraint to Okro Production
S Percentage
Pest and disease High cost of agro-chemical Poor market price
Constraint
46
University of Ghana http://ugspace.ug.edu.gh

4.10.1 Disease and Pest Problem
Most farmers interviewed mentioned the nematode problem as the main constraint to
production. Nematodes are tiny soil borne worms, which attack and nibble at the roots
o f the plant, sucking out nutrients from the roots and thereby causing root malfunction
through rot. The effect becomes severe only when there is a prolonged drought. The
main symptom observed is wilting and finally dying of crops. Farmers, sometimes
wrongly attribute this dying of crops to water shortages. The most problematic
nematode in okro is root knot nematode, Meloidogyne spp. The general effect is that
the life span o f the crop is reduced especially whenever water supply is limited.
Ladybird beetle was found to be a major insect pest in the study area. Okro is attacked
by a myriad o f pests, such as Podagrica uniformis, Spodoptera littoralis, and Sylepta
doogata.
Although there are various ways o f controlling the pest and disease problems, most
farmers interviewed adopted the use o f insecticide to control pest on their farms.
Other effective ways o f controlling pest and disease problem are by providing
unattractive environment for both the larvae and the adult. This could be achieved by
making sure that their alternative host plants such as weeds o f the malvaceae and
cotton plants do not grow nearby, by clean weeding, and general removal of breeding
sites, such as old stubbles.
4.10.2 High Cost of Agro-chemicals
Many okro farmers interviewed reported that agro-chemicals are expensive and not
readily available. None o f the farmers interviewed used weedicides to control weeds.
Weeds were controlled by the use of cutlass or hoe. Agro-chemicals, such as
47
University of Ghana http://ugspace.ug.edu.gh

insecticides and fungicides were used to control pest and diseases on the farm.
Although, planting trap crops such as Crotalaria spp and African marigold after the
growing season can prevent nematode infestations, none of the farmers interviewed
used this method to reduce the incidence of nematode infestation on their farms.
4.10.3 Poor market price of produce
Farmers in the study area reported that poor or low market price o f okro affected their
net income. Obtaining higher price for okro can increase the net income in okro
production. A high price is obtained when the bargaining power o f the farmers is
good. This could be achieved by group action o f all okro fanners in the area. Price of
okro fruits determined in this way is higher than when individual fanners determine
price. Many agricultural markets such as marketing o f okro resemble competitive
market model. Competitive market assumes that there are so many producers and
buyers of a commodity such that interaction o f the sellers and buyers in the market
produce one price which an individual seller or buyer cannot change alone. Contract
agreement with an agency or individual to sell okro can also help the farmer to reduce
price risk.
4.11 Suggested Strategies for Solving the Problems
The farmers made both collective and individual effort to solve the above-mentioned
problems encountered on their farms. Almost all the farmers, 95.71% used Furadan, a
nematicide, to control nematode but were not very successful. As an attempt to
minimize nematode infestation, farmers in the study area followed a fellow
programme. Only about 37% of the farmers fallowed their plots. According to these
farmers, they had this knowledge from the extension agents in the area. The result
48
University of Ghana http://ugspace.ug.edu.gh
possibly implies that about 63% o f the farmers do not consciously know that the
fallow period is meant to reduce nematode infestation. 3.3% of the farmers suggested
the use of neem extract for the control o f pest and diseases on the farm. This also
suggest that about 96.7% of the farmers do not know about the efficacy and use of
neem extract to control pest and diseases on crops. Farmers suggested assistance from
government and non-governmental organizations for the export o f fresh okro. This
according to them could increase net income. Studying o f price and market trends
may help to stabilize net income by taking advantage o f higher prices o f okro fruits
and lower prices o f farm inputs for okro production. Information may be obtained
from the District Agricultural Extension Office, District Agricultural Economics
Office, by regular visits to traditional markets and other okro farmers in other district
or region. Another way to obtain high price is to improve on the quality o f okro
produced in the area. It should be noted that although extra cost is incurred, the extra
returns makes the extra cost worthwhile.
49
University of Ghana http://ugspace.ug.edu.gh

CHAPTER FIVE
SUMMARY, CONCLUSIONS AND RECOMMENDATIONS
5.1 Summary
The study revealed that total cost associated with the production o f fresh okro is lower
(05.14 million / ha) than that (05.47 million / ha) associated with the production o f seed
okro in the rainy season. Total revenue was also found to be lower (06.67 million / ha) in
fresh okro fruit production than in seed okro production, which is about 08.30 million /
ha. Net income for seed okro production was found to be higher (02.82 million / ha) than
that for fresh okro production, which is 01.53 million / ha. This implies that the higher
cost incurred in the production o f seed okro is adequately rewarded with higher returns.
Therefore, despite the higher cost associated with the production o f seed okro it is still
more profitable to invest in it than the relatively low cost o f producing fresh okro in the
rainy season.
The study also revealed that a major reason for producing okro in the dry season is for the
fresh and not for seed in the study area. This could be due to demand exceeding supply o f
fresh okro in the dry season. Total cost, revenue, and net income for this enterprise are
05.68 million / ha, 010.41 million / ha, and 04.73'million / ha respectively.
Sensitivity analysis carried out to take care o f risks and uncertainties revealed that the
production o f fresh and seed okro are all profitable under unfavourable conditions such as
a 10 percent increase in costs, a 10 percent reduction in benefits, and a 50 percent
50
University of Ghana http://ugspace.ug.edu.gh

5.2 Conclusion
On the basis o f the foregoing results, it can be stated that both fresh and seed okro
production in the rainy and dry seasons are profitable. It can also be stated that dry season
production o f fresh okro is more profitable than production in the rainy season. Again,
seed okro production is more profitable than the production o f fresh okro in the same
rainy season. Okro farmers could therefore strategically invest more in seed okro
production in the rainy season and fresh okro production in the dry season to increase
their net income. The success o f this investment could be attributed to pricing o f the
products, which is affected by demand and supply o f the products. Demand for fresh okro
in the dry season far exceeds supply o f the product. Lack o f well co-ordinated and well-
defined marketing rules and practices by majority o f the farmers could be a reason
attributed to the inability o f most farmers to make high profits. The study also revealed
that 80% o f the people actively involved in okro production are not trained farmers.
Knowledge about okro production was gained through practice and experience.
Considering their backgrounds, any bad practices are passed on from farm hand to
farmhand, without any question.
5.3 Recommendations
In the light o f the above findings o f the present study the following recommendations are
made:
1. Nematode infestation is a problem in the study area, and it is recoinmended that;
increase in discount factor. Further analysis revealed that reduction in benefits is more
sensitive than an increase in costs. The least sensitive factor is an increase in interest rate.
51
University of Ghana http://ugspace.ug.edu.gh

* There should be intensification o f extension education on planting o f trap
crops such as Crotalaria sp and African marigold after the growing season to
reduce the incidence o f nematode infestation.
■ As a form o f incentives to okro farmers, the government through the Ministry
o f Food and Agriculture, and the Universities should organize seminars and
short courses on eradication o f nematode infestation and other pest and
diseases problems. This will in the long run improve the skills o f okro
farmers.
■ There should be intensification o f extension education on land fallowing.
Fallowing is one o f the methods used to reduce the incidence o f nematode and
also to improve soil fertility.
The problem o f high cost o f agro-chemicals could be reduced by education on the
use o f neem extract to control pest. Neem tree was found to be abundant in the
area. This implies that access to the leaf or seed, which is mainly used for the
preparation o f the extract, is not a problem.
Poor market price o f the products, which is one o f the major factors leading to
low net revenue could be overcome by studying price trends in the district and
region to take advantage o f high price o f okro fruits. The introduction o f exotic
varieties for trials and a possible way o f exporting the crop should therefore be
considered in the study area.
52
University of Ghana http://ugspace.ug.edu.gh
REFERENCES
Adjei-Twum, D. C. (1962). The Effects o f Seed treatments on the Germination o f Okra (Hibiscus esculentus) seeds. Diploma in Tropical Agric. Dissertation. University o f Science & Technology, Kumasi Ghana.
Amoako, M. G. (1997). Benefit-Cost Analysis o f Fresh M ilk Processing at Agricultural Research Station, Nungua. Unpublished B. Sc. Dissertation. Faculty o f Agriculture, University o f Ghana, Legon.
Anaglo, J. N. (1990). Yield Reduction Due to Time o f Harvesting Okro(Abelmoschus esculentus), (L) Moench. B. Sc. Dissertation. Faculty o f Agriculture, University o f Ghana, Legon.
Armah-Agyeman, G. C. (1990). Evaluation o f Eight Lines o f Okro (Abelmoschus esculentus), (L) Moench, for Yield and other Agronomic Characters. B. Sc. Dissertation, School o f Agriculture, University o f Cape Coast.
Arthur, J. D. (1968). “Experience with Farm Management Analysis Technique in Kenya”. East A frica Journal o f Rural Development. No. 1 ,2 : 22 -32 .
Asare, S. N. (2000). Cost-Benefit Analysis o f Citrus Production in the Eastern Region o f Ghana: Case o f Okumaning and Nkwantanang in the Kwaebibirem District. M. A. A. Dissertation, Faculty o f Agriculture, University o f Ghana, Legon.
Bernard, C. S. and Nix, J. S. (1990). Farm Planning and Control. Cambridge University Press. 257pp
Berry, S. K,; Kolra, C. L.; Sehgal, R. C.; Kulkami, S. G. and Sukhvirkour, M. R. S.(1988). Quality Characteristics o f Seed o f Five Okra (Abelmoschus esculentus), (L) Moench), cultivars.,/. Food Science Technology. 25 : 303 - 305.
Carl, K. E. and Doyce, C. B. (1982). Research on Agricultural Development inSub-sahara Africa: Critical survey. Department o f Agricultural Economics, Michigan State University, East Lansing, U. S. A.
Charles, C. and Sherf, A. F. (1960). Vegetable D iseases and their Control. The Ronald Press Company. 70pp.
Chauchan, K. S. and Bhanderi, Y. M. (1971). Fruit development and germinationstudies on okro (Abelmoschus esculentus), (L) Moench). India Journal Agric. Science. 1:833pp.
Christensen, C. M. (1974). Storage o f cereal grain and their products. American Association o f Cereal Chemist Inc. America. 517pp.
53
University of Ghana http://ugspace.ug.edu.gh

Cobley, L. S. and Steele, W. M. (1976). An Introduction to the Botany o f Tropical Crops. 2nd ed. Longman Group Ltd. London. 371pp.
Dillion, J. L. and Hardaker, J. B. (1993). Farm management and research forsmall farmer development. Food and Agriculture o f the United Nations.
Djokoto, J. G. (1990). Government Policy and Non Traditional Agricultural Export Earnings. A Dissertation Submitted to the Department o f Agricultural Economics and Farm Manaigement, University o f Ghana.
Dzietror, A. (1995). It pays to plant good quality seeds. Legon Agricultural Research and Extension Journal. 4 :1 2 3 -1 2 4 .
Ellis, R. H. and Roberts, E. H. (1980). Toward a rational basis fo r testing seed quality. Seed Production Buttermorths, London, 635pp.
Ellis, R. H. and Roberts, E. H. (1982). The quantification o f ageing and survival in orthodox seeds. Seed Science Technology. 9:373 - 409.
Ewete, F. K.; Taylor, T. A. and Cheda, H. R. (1980). “Determination o f the period toharvest okra (Abelmoschus esculentus), (L) Moench), for seed” . Ghana Journal Agric.Sc. 1 3 :1 0 7 -1 1 0 .
George, R. A. T. (1985). Vegetable Seed Production. Longman Group UK Ltd. 318pp.
Gittinger, J. P. (1982). Economic Analysis o f Agricultural Projects. 2nd ed. John Hopkins University Press, Baltimore and London.
Herklots, G. A. C. (1972). Vegetables in South-East Asia. South China M orning Press Ltd., Hong Kong. 144pp.
Hill, D. S. and Waller, J. M. (1988). “Pest and diseases o f tropical crops” . Longman Scientific and Technical J. 2:233 -234.
Irvine, F. R. (1970). West African Crops. Oxford University Press, London.
Johnson, D. T. (1990). The Business o f Farming. A Guide to Farm Business Management in the Tropics. 2nd Ed. M acMillan Pulishers Ltd. Londonand Basingstoke. 87 - 94pp.
Kohle, A. K. and Chavan, V. M. (1969). “Development o f fruits yielding capacity and influence o f fruit maturity on the reproductive and vegetative behaviour o f okra” . India Journal o f Agric. Sc. 37 : 155 - 166.
Kozlowski, T. T. (1972). Seed Biology. Academic Press. London. 447pp.
54
University of Ghana http://ugspace.ug.edu.gh

Londerback, J. G. and Dominiac, G. F. (1982). Managerial Accounting. 3rd ed. Kent Publishing Company, Bosh Massachsetts.
Martin, F. W. and Roberte, R. (1978). Vegetables fo r Hot Hum id Tropics. Longman Green and Co. Ltd. London. 346pp.
Norman, J. C. (1992). Tropical Vegetable Crops. Arthur H. Stockwell Ltd. Great Britain. 187pp.
Ofori, Y. (1997). Benefit-Cost Analysis o f Rabbit Production. Unpublished B. Sc. Dissertation, Department o f Agricultural Economy and Farm Management, University o f Ghana, Legon.
Olayemi, J. K. (1974). Cost and Reyums to Cocoa and Alternate Crops in Western N igeria Institute o f Statistics and Economic Research, Legon.
Ovenden, A. E. (1981). Cost and Earnings Investigations o f Primary Enterprises.Unpublished B. Sc. Dissertation. Faculty o f Agriculture, University o f Ghana, Legon.
Owusu, S. S (1999), Harvesting okro: Appropriate Date for Picking Fruits for Seed. Unpublished B. Sc. Dissertation, Faculty o f Agriculture, University o f Ghana, Legon.
Perkins, D. Y.; C. Julian, and S. L. Dallyn (1952). “Influence o f Fruit Maturity on the Vegetative and Reproductive Behaviour o f Okro”. Proc. Am. Soc. Hort. Sc. 60 : 3 1 1 -3 1 4
Purseglove, J. Y. (1968). Tropical Crops Dicot 2. Longman Green and Co. Ltd., London. 719pp.
Purseglove, J. Y. (1986). Tropical Crops Dicot 2. Longman Green and Co. Ltd., London. 562pp.
Ramadan, B. R.; Khalifa, A. H. and Aboul-Nasr, M. H. (1997). “Composition o f Okro Seed oil”. A ssiut Journal o f Agric. Sc. 28: 153 - 156.
Rice, R. P.; Rice, L.W. and Tindall, H. D. (1986). Fruit and Vegetable Reproduction In Africa. The M acMillan Press Ltd. London and Basingstokr. 371pp.
Ruthemberg, H. (1968). Small Holder Farming and Small Holder Development in Tanzania: Ten case studies. Munich, W est Germany.
Salunkhe, D. K. and Desai, B. B. (1986). Postharvest Biotechnology o f Oil Seeds. C. R. C. Press, Inc. 571pp.
55
University of Ghana http://ugspace.ug.edu.gh

Sinnadurai, S. (1992). Vegetable Cultivation. Asempa Publishers, Accra, Ghana. 208pp.
Thompson, H. C. and Kelly, C. W. (1957). Vegetable Crops. M cGraw Hill, London.611pp.
Tindall, H. D. (1968). Commercial Vegetable Growing. Oxford University Press, London, U. K.
Tindall, H. D. (1983). Vegetables in the Tropics. The English Language Book Society. MacMillan. 415pp.
Sinnadurai, S. (1974). Studies on Ghanaian Okro (Abelmoschus esculentus), (L)Moench), Cultivars. Proc. 11th Biennial Conference. Ghana Science Association,Kumasi.
56
University of Ghana http://ugspace.ug.edu.gh
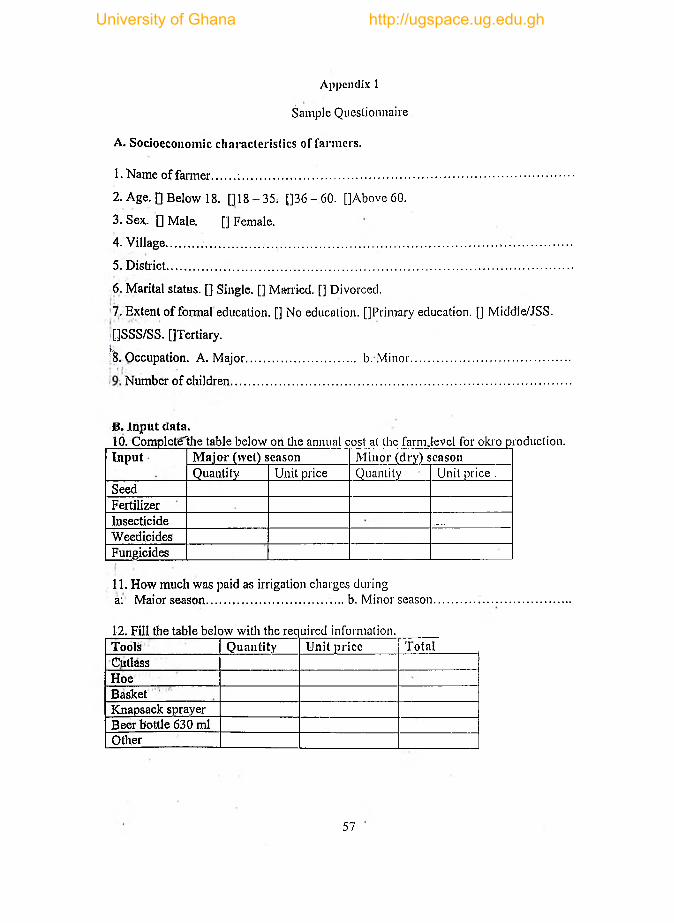
Appendix 1
Sample Questionnaire
A. Socioeconomic characteristics of farm ers.
1. N am e o f farm er ...........................................................................................................
2. Age. [] Below 18. []18 - 35. Q 3 6 -6 0 . []Above 60.
3. Sex. [] Male. [] Female.
4. V illage ................... ...........................................................................................................
5. District....................................................................................................................................
6. M arital status. [] Single. [] Married. [] Divorced.
7. Extent o f formal education. [] No education. []Prim ary education. [] M iddle/JSS.
[]SSS/SS. [JTertiary.l-: .!8. Occupation. A. M ajor....................................... b. M inor........................................................
Number o f children................................................................................................................
Ji. JlnpUt d a ta .lQ. C om plctelhe table below on the annual cost al the farm.level for okro production.Input M ajor (wet) season M inor (dry) season
Quantity Unit price Quantity Unit price .SeedFertilizerInsecticide ..WeedicidesFungicides
11. How much was paid as irrigation charges during a: Maior season................ b. Minor season
12. Fill the table below with the req uired information.Tools Q uantity Unit price TotalCutlassHoeBasketKnapsack sprayerBeer bottle 630 mlOther
57
University of Ghana http://ugspace.ug.edu.gh

13. Complete the table below on activities performed on the okro farm by different family and hired lab o u r.______________________ ____________________________Activities M aior season M inor season
Family labour Hired labour Family labour Mired labor r
Month
No. ofmembers
No. o fworkershired
No.ofdaysw kd
Mrs.wkd/day
Month
No. o f members
No. o fworkershired
No.o fdaysw kd
I It'S, wktl /day
PloughingHarrowingPlanting . . .
Weedicideappl.Hand-weedingFertilizerappl.Insecticideappl.Fungicideappl.Harvesting fresh okroHarvesting dried okroShellingIrrigation
14. What is the size o f your farm under okro cultivation? .....................................................
15.i. Do you pay rent on the farm you arc cultivating okro on? [] Yes. []No.ii. If yes, how much rent do you pay annually.....................................................................iii. If no, why (tick one of the options below).l.[]owner occupier 2.[]family land 3.[Jollier specify.....................................................
16. i. How much did you spend on transport of inputs to your farm this season?..............ii. How-much did you spend on your own transporlalion'lo your farm this season? ...
C. Output data.17. a. Fresh okro production.Providb information on quantity of produce sold, given out as gifts, and for home consumption ill the table below for the 2001 production year:---______________________
Q uantity of proc uce per acreM ajo r season M inor seasonMarketsales
Given out as gift
Fam ilyconsumption
Used as seed
Marketsales
G iven out as fii fl
Familyconsum ption
Used as seed
58
University of Ghana http://ugspace.ug.edu.gh
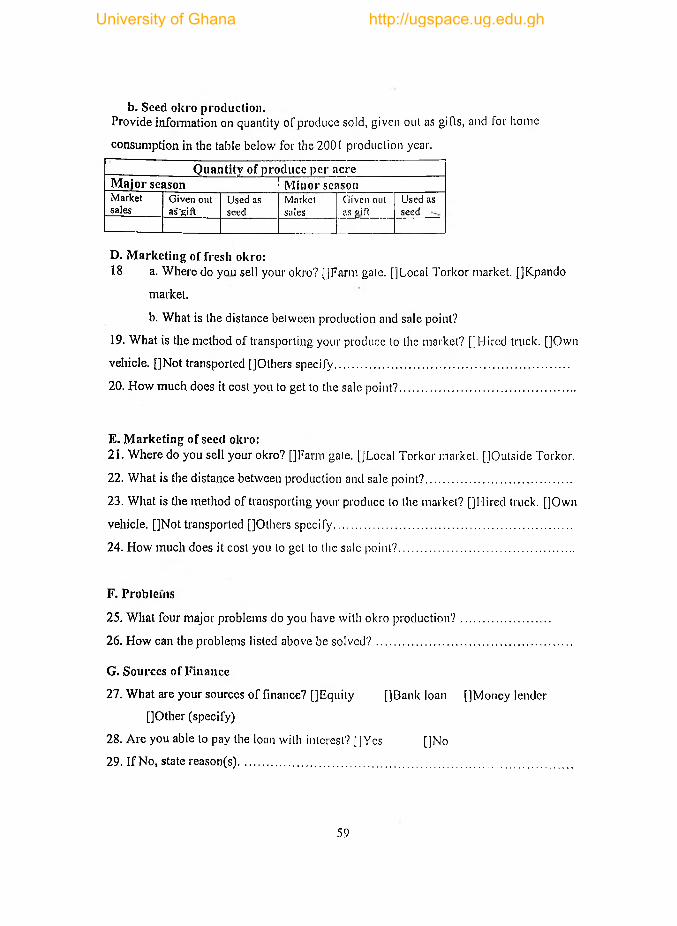
b. Seed okro production.Provide inform ation on quantity o f produce sold, given out as gifts, and for home
consumption in the table below for the 2001 production year.
Q uantity of produce per acreM a jor season M inor seasonMarketsales
Given out as"'si ft
Used as seed
Marketsales
Given out as f»ift
Used as seed
D. M arketing of fresh okro:18 a. W here do you sell your okro? [JFarm gale. []Local Torkor market. []Kpando
market.
b. W hat is the distance between production and sale point?
19. W hat is the m ethod o f transporting your produce to the market? [JHired truck. []Own
vehicle. []Not transported [JOthers specify ....................................................................................
20. How m uch does it cost you to get to the sale point?..............................................................
E. M arketing of seed okro:21. W here do you sell your okro? [JFarm gale. QLocal Torkor market. []Outside Torkor.
22. W hat is the distance between production and sale po in t?....................................................
23. W hat is the m ethod o f transporting your produce to the market? f]Hired truck. []Own
vehicle. []Not transported [JOthers specify .....................................................................................
24. How m uch does it cost you to get to the sale point?..............................................................
F. Problems
25. W hat four major problem s do you have with okro p ro d u ctio n ?................................
26. How can the problem s listed above be so lv e d ? ......................................................................
G. Sources of Finance
27. W hat are your sources o f finance? [] Equity []Bank loan []M oncy lender
[JOther (specify)
28. A re you able to pay the loan with interest? [JYcs []No
29. I f No, state reason(s).......................................................................................................................
59
University of Ghana http://ugspace.ug.edu.gh

Append ix 1
PLOT SIZE PER FARM ER BY ENTERPRISERainv Season Dry Season
Fresh Okro Seed Okro Fresh Okro
Respondent Plot Size (Ha)
Respondent Plot Size (Ha)
Respondent Plot Size (Ha)
001 0 .4 031 0 .4 061 0.8002 0 .4 032 0.2 062 0.4003 0.3 033 0.3 063 0,7004 0 .5 034 0.4 064 0.7005 0.4 035 0.2 065 0 .8006 0.6 036 0.3 066 0.3007 0 .5 037 0.3 067 0.6008 0 .6 038 0.3 068 0 .7009 0 .5 039 0.2 069 0.7010 0 .5 040 0.3 070 0 .6011 0.3 041 0.2 071 0.6012 0.6 042 0.2 072 0.7013 0 .5 043 0.3 073 0.6014 0 .3 044. 0.2 074 0.4015 0 .3 045 0.2 075 0.4016 0 .5 046 0.3 076 0 .6017 0.4 047 0.4 077 0 .4018 0 .5 048 0.2 078 0.4019 0 .6 049 0.2 079 o .5 n020 0 .4 050 0.3 080 0.7021 0 .4 051 0.4 081 0.8022 0 .5 052 0.2 082 0.4023 0 .5 053 0.4 083 0 .4024 0 .3 054 0.3 084 0.6025 0 .5 055 0.2 085 0.8026 0 .4 056 0.2 086 0.7027 0 .5 057 0.2 087 0 .3028 0.6 058 0.2 088 0.4029 0.6 059 0.3 089 0.7030 0 .4 060 0.4 090 0.7Total 13.8 Total 8.2 Total 17.4Mean (X) 0 .46 Mean 0 .27 Mean 0.58Std. Dev. 0 .1 0 0 3 Std. Dev. 0 .0 7 8 5 Std. Dev. 0 .1 6 0 6C Var. 0.2181 C Var. 0 .2872 C Var. 0 .2769Min. 0 .3 Min. 0 .2 Min. 0 .3Max. 0 .6 Max. 0.4 Max. 0.8Source: Com puted From Field Data
60
University of Ghana http://ugspace.ug.edu.gh

Appendix 2 FIXED COST ESTIM ATES PER HECTARE ■OR FRESH OKRO FARMERS IN THE
Respondent Rent Depreciation Total Fixed Cost001 0.16 0.45 0.61002 0.16 0.43 0.59003 0.16 0.38 0.53004 0.16 0.46 0.62005 0.16 0.48 0.60006 0.16 0.44 0.59007 0.16 0.49 ■ 0.64008 0.16 0.55 0.71009 0.16 0.46 0.61010 0.16 0.53 0.68011 0.16 0.45 0.60012 0.16 0.48 0.63013 0.16 0.46 0.61014 0.16 0.53 0.68015 0.16 0.47 0.63016 0.16 0.46 0.60017 0.16 0.45 0.61018 0.16 0.48 0.64019 0.16 0.48 0.63020 0.16 0.38 0.53021 0.16 0.47 0.63022 0.16 0.53 0.68023 0.16 0.47 0.63024 0.16 0.43 0.58025 0.16 0.43 0.58026 0.16 0.46 . 0.62027 0.16 0.43 0.58028 0.16 0.48 0.63029 0.16 0.45 0.61030 0.16 0.22 0.37Total 4.80 13.58 18.30Mean (X) 0.16 0.45 0.61Std. Dev. (SD) 0 0.06 0.06C Var. (SD / X) 0 0.1309 0.0973Min. 0.16 0.22 0.37Max. 0.16 0.55 0.71Source: Com puted from Field Data
University of Ghana http://ugspace.ug.edu.gh

Append ix 3F IX E D C O S T E S T IM A T E S P E R H E C T A R E F O R I N D IV ID U A L S E E D O K R O
F A R M E R S IN T H E R A IN Y S E A S O N ( IN M 1 L L 1 Q N C E D I S ) __________________
Respondent Rent Depreciation Total Fixed Cost031 0.16 0.46 0.62032 0.16 0.50 0.65033 0.16 0.60 0.76034 V 0.16 0.50 0.66035 0.16 0.53 0.69036 0.16 0.61 0.77037 0.16 0.47 0.63038 0.16 0.61 0.77039 0.16 0.62 0.77040 0.16 0.54 0.69041 0.16 0.63 6.78042 0.16 0.46 0.61043 0.16 0.60 0.76044 0.16 0.50 0.65045 0.16 0.50 0.65046 0.16 0.58 0.74047 0.16 0.50 0.65048 0.16 0.56 0.72049 0.16 0.47 0.63050 0.16 0.49 0.64051 0.16 .0.53 0.68052 0.16 0.50 0.65053 0.16 0.50 0.65054 0.16 0.54 0.69055 0.16 0.49 0.64056 0.16 0.51 0.67057 0.16 0.51 0.66058 0.16 0.50 0.65059 0.16 0.52 0.68060 0.16 0.57 0.73Total 4.80 15.S4 20.53Mean (X) 0.16 0.53 0.68Std. Dev. (SD) 0 0.05 0.05C Var. (SD/X) 0 0.0962 0.0742Min. 0.16 0.46 0.62Max. 0.16 0.63 0.78Source: Com puted from Field Data
62
University of Ghana http://ugspace.ug.edu.gh

Append ix 4
F IX E D C O S T E S T IM A T E S P E R H E C T A R E F O R F R E S H O K R O F A R M E R S IN T H E
D R Y S E A S O N ( IN M I L L IO N C E D IS ) _____________ _____________ ___________________
Respondent Rent Jrrigalion Charges Depreciation Total Fixed Cost
061 0.16 0.20 0.41 0.76062 0.16 0.20 0.40 0.76063 0.16 0.20 0.36 0.72064 0.16 0.20 0.38 0.74065 0.16 0.20 0.3.8- 0.74066 0.16 0.20 0.65 1.01067 0.16 0.20 0.39 0.75068 0.16 0.20 0.46 0.80069 0.16 0.20 0.40 0.75070 0.16 0.20 0.38 0.73071 0.16 0.20 0.46 0.80072 0.16 0.20 0.38 0.73073 0.16 0.20 0.53 0.88074 0.16 0.20 0.38 0.73075 0.16 0.20 0.46 0.80076 0.16 0.20 0.39 0.75077 0.16 0.20 0.53 0.88078 0.16 0.20 0.41 0.76079 0.16 0.20 0.40 0.76080 0.16 0.20 ' 0.43 0.78081 0.16 0.20 0.42 0.78082 0.16 0.20 0.43 0.78083 0.16 0.20 0.46 0.82084 0.16 0.20 0.43 0.78085 0.16 0.20 0.39 0.74086 0.16 0.20 0.43 0.78087 0.16 0.20 0.45 0.81088 0.16 0.20 0.46 0.80089 0.16 0.20 0.45 0.80090 0.16 0.20 0.44 0.79Total 4.80 6.00 12.83 23.51M ean (X) 0.16 0.20 0.43 0.78Std. Dev. (S D )" 0 0 0.06 0.06C Var. (SD / X) 0 0 0.1358 0.0740Min. 0.16 0.20 0.36 0.72Max. 0.16 0.20 0.65 1.01Source: Com puted from Field Data
63
University of Ghana http://ugspace.ug.edu.gh

Append ix 5
V A R I A B L E C O S T E S T IM A T E S P E R H E C T A R E F O R F R E S H O K R O F A R M E R S IN
T H E R A I N Y S E A S O N ( IN M IL L IO N C l iD I S ] ^ ________________________ _____
Respondent Labour Fertilizer A grochemical
PlantingMaterial
Transport Total Variabl e Cost
001 2.30 0.43 0.68 0.35 0.11 4.46
002 2.33 0.49 0.70 0.38 0.11 4.60
003 2.50 0.40 0.75 0.35 0.10 4.63
004 2.28 0.50 0.75 0.40 0.08 4.63 !
005 2.33 0.51 0.68 0.35 0.12 4.57006 2.50 0.43 0.68 0.30 0.15 4.69007 2.33 0.40 0.75 0.40 0.11 4.73008 2.48 0.43 0.70 0.35 0.11 4.67009 2.33 0.50 0.68 0.30 0.10 4.59010 2.63 0.43 0.70 0.40 0.08 4.85011 2.33 0.42 0.68 0.35 0.12 4.48012 2.28 0.28 0.75 0.34 0.13 4.38013 2.33 0.43 0.75 0.35 0.10 4.67014 2.63 0.45 0.68 0.35' 0.13 4.87015 2.33 0.26 0.70 0.30 0.09 4.29016 2.42 0.36 0.70 0.36 0.11 4.57017 2.33 0.44 0.57 0.28 0.09 4.35018 2.28 0.36 0.75 [0.30 0.09 4.42019 2.33 0.42 0.68 0.37- 0.08 4.41020 2.39 0.44 0.70 0.30 0.11 4.54021 2.30 0.24 0.70 0.38 0.10 4.39022 2.64 0.36 0.68 0.30 0.09 4.71023 2.35 0.40 0.63 0.36 0.12 4.42024 2.28 0.42 0.75 0.30 0.10 4.42025 2.34 0.39 0.73 0.40 0.09 4.58026 2.30 0.38 0.73 0.32 0.09 4.40027 2.33 0.36 0.75 0.39 0.12 4.55028 2.34 0.38 0.73 0.37 0.09 4.51029 2.26 0.36 0.68 0.36 0.11 4.15030 2.27 0.40 0.65 0.36 0.09 4.40Total 70.99 12.02 20.99 10.40 3.20 135.87
M ean (X) 2.37 0.40 0.70 0.35 0.11 4.53Std Dev. (SD) 0.11 0.06 0.04 0.04 0.01 0.16C Var. (SD / X) 0.0460 0.1599 0.0608 0.1023 0.1592 0.0355Min. 2.20 0.24 0.57 0.28 0.08 4.15Max. 2.64 0.51 0.75 0.40 0.15 4.86Source: Com puted from Field Data
04
University of Ghana http://ugspace.ug.edu.gh

Append ix 6
THE RAINY SEASON (IN MILLION CEDIS).Respondent Labour Fertilizer A gro
chemicalPlantingMaterial
Transport TotalVariableCost
031 2.53 0.42 0.71 0.38 0.11 4.14032 2.99 0.43 0.73 0.38 0.11 4.63033 2.78 0.48 0.70 0.36 0.13 4.43034 2.59 0.43 0.73 0.39 0.10 4.22035 2.25 0.39 0.70 0.29 0.11 3.74036 2.46 0.45 0.73 0.40 0.11 4.15037 3.19 0.43 0.71 0.38 0.10 4.81038 2.99 0.45 0.72 0.37 0.13 4.66039 4.20 0.43 0.73 0.39 0.09 5.84040 3:03 0.41 0.71 0.37. 0.12 4.64041 2.54 0.45 0.79 0.39 0.10 4.26042 2.59 0.43 0.74 0.38 0.11 4.25043 3.88 0.46 0.71 0.41 0.11 5.58044 2.56 0.48 0.71 0.38 0.09 4.21045 2.78 0.41 0.73 0.37 0.10 4.39046 2.63 0.45 0.71 0.39 0.10 4.28047 4.24 0.40 0.72 0.38 0.13 5.87048 2.54 0.47 0.71 0.37 0.10 4.18049 3.11 0.45 0.68 0.39 0.10 4.73050 3.70 0.43 0.79 0.40 0.13 5.46051 4.13 0.50 0.71 0.37 0.10 5.79052 2.75 0.50 0.73 0.38 0.09 4.44053 4.00 0.44 0.72 0.39 0.11 5.66054 3.03 0.45 0.73 0.40 0.10 4.70055 3.11 0.40 0.72 0.39 0.11 4.73056 3.06 0.39 0.76 0.38 0.11 4.69057 2.55 0.44 0.71 0.38 0.14 l4.22058 3.07 0.45 0.72 0.37 0.10 4.71059 3.90 0.43 0.72 0.38 0.13 5.56060 4.98 0.46 0.72 0.36 0.11 6.62Total 94.09 13.18 21.71 11.35 3.27 143.60M ean (X) 3.14 0.44 0.72 0.39 0.11 4.79Std. Dev. (SD) 0.68 0.03 0.02 0.02 0.01 0.7C Var. (S D /X ) 0.2154 0.0649 0.0319 0.0529 0.1189 0.1433Min. 2.25 0.39 0.68 0.29 0.09 3.74Max. 4.98 0.50 0.79 0.41 0.14 6.62Source: Com puted from Field Data
65
University of Ghana http://ugspace.ug.edu.gh
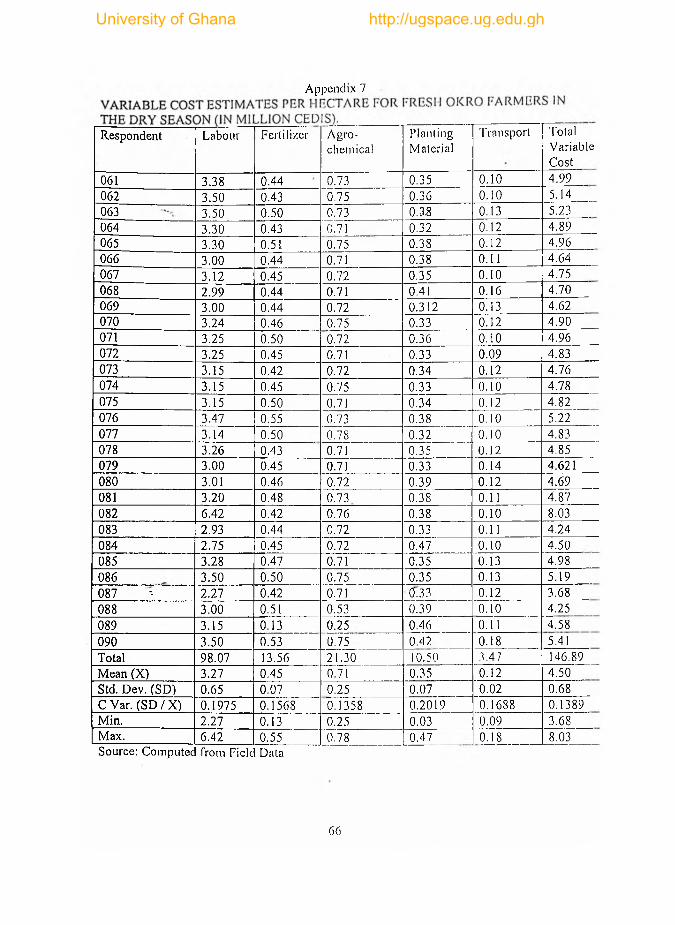
Append ix 7
Respondent Labour Fertilizer A grochemical
PlantingMaterial
Transport TotalVariableCost
061 3.38 0.44 0.73 0.35 0.10 4.99062 3.50 0.43 0.75 0.36 0.10 5.14063 3.50 0.50 0.73 0.3.8 0.13 5.23064 3.30 0.43 0.71 0.32 0.12 4.89065 3.30 0.51 0.75 0.38 0.12 4.96066 3.00 0.44 0.71 0.38 0.11 4.64067 3.12 0.45 0.72 0.35 0.10 4.75068 2.99 0.44 0.71 0.41 0.16 4.70069 3.00 0.44 0.72 0.312 0.13 4.62070 3.24 0.46 0.75 0.33 0.12 4.90071 3.25 0.50 0.72 0.36 0.10 4.96072 3.25 0.45 0.71 0.33 0.09 4.83073 3.15 0.42 0.72 0.34 0.12 4.76074 3.15 0.45 0.75 0.33 0.10 4.78075 3.15 0.50 0.71 0.34 0.12 4.82076 3.47 0.55 0.73 0.38 0.10 5.22077 3.14 0.50 0.78 0.32 0.10 4.83078 3.26 0.43 0.71 0.35 0.12 4.85079 3.00 0.45 0.71 0.33 0.14 4.621080 3.01 0.46 0.72 0.39 0.12 4.69081 3.20 0.48 0.73 0.38 0.11 4.87082 6.42 0.42 0.76 0.38 0.10 8.03083 2.93 0.44 0.72 0.33 0.11 4.24084 2.75 0.45 0.72 0.47 0.10 4.50085 3.28 0.47 0.71 0.35 0.13 4.98086 3.50 0.50 0.75 0.35 0.13 5.19087 -- 2.27 0.42 0.71 0.33 0.12 3.68088 3.00 0.51 0.53 0.39 0.10 4.25089 3.15 0.13 0.25 0.46 0.11 4.58090 3.50 0.53 0.75 0.42 0.18 5.41Total 98.07 13.56 21.30 10.50 3.47 146.89Mean (X) 3.27 0.45 0.71 0.35 0.12 4.50Std. Dev. (SD) 0.65 0.07 0.25 0.07 0.02 0.68C Var. (SD / X) 0.1975 0.1568 0.1358 0.2019 0.1688 0.1389Min. 2.27 0.13 0.25 0.03 0.09 3.68Max. 6.42 0.55 0.78 0.47 0.18 8.03Source: Com puted from Field Data
66
University of Ghana http://ugspace.ug.edu.gh

Append ix 8T O T A L C O S T E S T IM A T E S P E R H E C T A R E F O R F R E S H O K R O F A R M E R S IN T H E
R A IN Y S E A S O N ( IN M I L L IO N C E D I S ) . ____________________ _________________________
Respondent Total Fixed Cost Total Variable Cost Total Cost001 0.61 4.46 5.07002 0.59 4.60 5.18003 0.53 4.63 5.16004 0.62 4.63 5.24005 0.59 4.57 5.16006 0.64 4.69 5.33007 0.71 4.73 5.44008 0.61 4.67 5.28009 0.68 4.59 5.27010 0.60 4.85 5.45011 0.63 4.48 5.11012 0.61 4.38 4.99013 0.68 4.67 5.34014 0.63 4.87 5.48015 0.60 4.29 4.89016 0.61 4.57 5.17017 0.64 4.35 4.98018 0.63 4.42 5.05019 0.53 4.41 4.94020 0.63 4!54 5.17021 0.68 4.39 5.07022 0.63 4.71 5.33023 0.58 4.42 5.00024 0.58 4.42 5.00025 0.62 4.58 5.20026 0.58 4.40 4.98027 0.63 4.55 5.18028 0.61 4.51 5.12029 0.37 4.15 4.52030 0.62 4.40 5.02Total 18.30 135.87 154.14M ean (X) 0.61 4.53 5.14Std. Dev. (SD) 0.06 0.16 0.2C Var. (SD / X) 0.0973 0.0355 0.0380M in. 0.37 4.15 4.52Max. 0.71 4.86 5.48Source: Com puted from Field Data
University of Ghana http://ugspace.ug.edu.gh

Append ix 9T O T A L C O S T E S T IM A T E S P E R H E C T A R E F O R S E E D O K R O F A R M E R S IN T H E
R A IN Y S E A S O N ( IN M I L L IO N C E D I S ) . ___________________________________________
Respondent Total Fixed Cost Total Variable Cost Total Cost031 0.62 4.14 4.76032 0.65 4.63 5.28033 0.76 4.43 5.19034 0.66 4.22 4.87035 0.69 3.74 4.42036 0.77 4.15 4.92037 0.63 4.81 5.44038 0.77 4.66 5.42039 0.77 5.84 6.61040 0.69 4.64 5.33041 0.78 4.26 5.04042 0.61 4.25 4.87043 0.76 5.58 6.33044 0.65 4.21 4.86045 0.65 4.39 5.04046 0.74 4.28 5.05047 0.65 5.87 6.52048 0.72 4.18 4.90049 0.63 4.73 5.36050 0.64 5.46 6.10051 0.68 5.79 6.47052 0.65 4.44 5.10053 0.65 5.66 6.31054 0.69 4.70 5.40055 0.64 4.73 5037056 0.67 4.69 5.36057 0.66 4.22 4.88058 0.65 4.71 5.37059 0.68 5.56 6.24060 ■0.73 6.62 7.35Total 20.53 143.60 164.13Mean (X) 0.68 4.79 5.47Std. Dev. (SD) 0.05 0.7 0.69C Var. (S D /X ) 0.0742 0.1433 0.1266Min. 0.62 3.74 4.42Max. 0.78 6.62 7.35Source: Com puted from Field Data
08
University of Ghana http://ugspace.ug.edu.gh

Append ix 10T O T A L C O S T E S T IM A T E S P E R H E C T A R E F O R F R E S H O K R O F A R M E R S IN T H E
D R Y S E A S O N ( IN M I L L IO N C E D IS ) .
Respondent Total Fixed Cost Total Variable Cost Total Cost061 0.76 4.99 5.75062 0.76 5.14 5.90063 0.72 5.23 5.95064 0.74 4.89 5.62065 0.74 4.96 5.69066 1.01 4.64 5.64067 0.75 4.75 5.49068 0.80 4.70 5.50069 0.75 4.62 5.37070 0.73 4.90 5.63071 0.80 4.96 5.76072 0.73 4.83 5.56073 0.88 4.76 5.64074 0.73 4.78 5.51075 0.80 4.82 5.62076 0.75 5.22 5.98077 0.88 4.83 5.72078 0.76 4.85 5.61079 0.76 4.621 5.38080 0.78 4.69 5.47081 0.78 4.87 5.65082 0.78 8.03 8.81083 0.82 4.24 5.06084 0.78 4.50 5.28085 0.74 4.98 5.72086 0.78 5.19 5.97087 0.81 3.68 4.49088 0.80 4.25 5.05089 0.80 4.58 5.39090 0.79 5.41 6.20Total 23.51 146.89 170.41M ean (X) 0.78 4.50 5.68Std. Dev. (SD) 0.06 0.68 0.67C Var. (SD / X) 0.0741 0.1389 0.1187Min. 0.72 3.68 4/1 9Max. 1.01 8.03 8.SOSource: Com puted from Field Data
69
University of Ghana http://ugspace.ug.edu.gh

Appendix 1 1T O T A L R E V E N U E E S T IM A T E S P E R H E C T A R E F O R F R E S H O IC R O F A R M E R S IN
T H E R A IN Y S E A S O N . ____________________________ _____________
Respondent Quantity of Fresh Okro Produced (In Baskets)
Pricc Per Basket (£ ’000)
Quantity Used as Seed (in 680 ml bottles)
Price Per Bottle (£ ’000)
Total Revenue ( f 000,000)
001 165 35 2.5 20 5.83002 155 45 3.8 20 7.05003 137.5 45 3.8 20 6.26
• 004 165 40 1.3 20 6.63005 170 35 3.8 20 6.03006 160 40 3.8 20 6.48007 170 35 13 20 5.98008 165 35 2.5 20 5.83009 170 45 3.8 20 7.73010 150 45 1.9 20 6.79011 175 40 3.8 20 7.08012 175 35 3.5 20 6.20013 142.5 40 2.5 20 5.75014 125 45 3.8 20 5.70015 175 45 2.5 20 7.93016 148 40 1.9 20 5.96017 185 45 3.5 20 8.40018 198 30 3.8 20 6.02019 155 35 1.9 20 5.46020 180 40 3.8 20 7.28021 135 45 3.8 20 6.15022 175 35 2.5 20 6.17023 170 40 1.9 20 6.84024 165 45 3.8 20 7.50025 165 45 19 20 7.46026 175 40 2.5 20 7.05027 165 45 3 20 7.49028 194 40 2.5 20 7.81029 150 35 2.5 20 5.30030 175 45 4.5 20 7.97Total 4935 1209.9 88.4 600 200.1M ean (X) 164.5 40.33 2.94 20 6.67Std. Dev. (SD) 16.58 4.54 0.90 0 0.85C Var. (SD / X) 0.1008 0.1125 0.3057 0 0.1270Min. 125 30 1.3 20 5.30Max. 198 45 4.5 20 8.40Source: Com puted from Field Data
70
University of Ghana http://ugspace.ug.edu.gh

Appendix 12TOTAL REVENUE ESTIMATES PER HECTARE FOR SEED OKRO FARMERS INTHE RAINY SEASONRespondent Quantity of
Fresh Okro Produced (In Baskets)
Price PerBasket(jzi’000)
Quantity Used as Seed (In Bottles)
Price Per Bottle
Total Revenue (^ ’000,000)
031 V 50 25 367.5 20 8.60
032 52.5 30 382.5 20 9.23033 60 25 402.5 20 9.55034 50 20 352.5 20 8.05035 52.5 30 395 20 9.48036 45 35 360 20 8.78037 40 25 390 20 8.80038 45 25 352.5 20 8.18039 37.5 25 340 20 7.74040 52.5 30 360 20 8.78041 35 35 340 20 8.03042 40 25 365 20 8.30043 45 35 355 20 8.68044 45 25 345 20 8.03045 40 20 360 20 8.00046 50 30 342.5 20 8.35047 55 25 372.5 20 8.83048 60 30 320 . 20 8.20049 45 25 360 20 8.33050 40 25 350 20 8.00051 45 25 360 20 8.33052 50 30 260 20 6.70053 40 25 320 20 7.40054 37.5 30 310 20 7.33055 32.5 25 385 20 8.51056 45 25 355 20 8.23057 30 30 375 20 8.40058 30 25 350 20 7.75059 40 20 372.5 20 8.25060 35 25 360 20 8.08Total 1325.1 804.9 10659.9 600 249Mean (X) 44.17 26.83 355.33 20 8.30Std. Dev. (SD) 8.02 4.04 27.81 0 0.60C Var. (SD / X) 0.1817 0.1507 0.0783 0 0.0724Min. 30 20 260 20 6.70Max. 60 35 402.5 20 9.55Source: Com puted from Field Data
71
University of Ghana http://ugspace.ug.edu.gh

Appendix 13TOTAL REVENUE ESTIMATES PER HECTARE FOR FRESH OKRO FARM ERS INi n c j j k x oJc/voLRespondent
JINQuantity of Fresh Okro Produced
PricePerBasket
Quantity Used as Seed (In
Price Per Bottle
TotalRevenue(^ ’000,000)
(In Baskets) U'000) Bottles)061 180 60 1.3 20 10.83062 180 60 2.5 20 10.85063 185 60 2.5 20 11.15064 190 60 1.3 20 11.43065 180 60 1.9 20 10.84066 175 60 2.5 20 10.55067 185 60 2.5 20 11.15068 190 60 3.8 20 11.48069 180 60 1.3 20 10.83070 190 i_60 2.5 20 11.45071 195 60 2.5 20 11.75072 185 60 1.3 20 11.13073 135 60 1.9 20 8.14074 180 60 1.9 20 10.84075 185 60 1.3 20 11.13076 135 60 3.8 20 8.18077 185 60 3.8 20 11.17078 180 60 5.0 20 10.90079 135 60 1.3 20 8.13080 180 60 2.5 20 10.85081 142 60 5.0 20 8.65082 175 60 1.3 20 10.53083 180 60 3.8 20 10.88084 135 60 2.0 20 8.14085 175 60 2.0 20 10.54086. 150 60 4.0 20 9.08087 180 60 2.0 20 10.84088 190 60 2.0 20 11.44089 180 60 2.5 20 10.85090 143 60 2.0 20 8.59Total 5180.1 1800 75 600 3123M ean (X) 172.67 60 2.5 20 10.41Std. Dev. (SD) 19.50 0 1.08 "0 1.17C Var. (SD / X) 0.1129 0 0.4377 0 0.1121Min. 135 60 1.3 20 8.13Max. 190 60 5.0 20 11.75Source: Com puted from Field Data
72
University of Ghana http://ugspace.ug.edu.gh
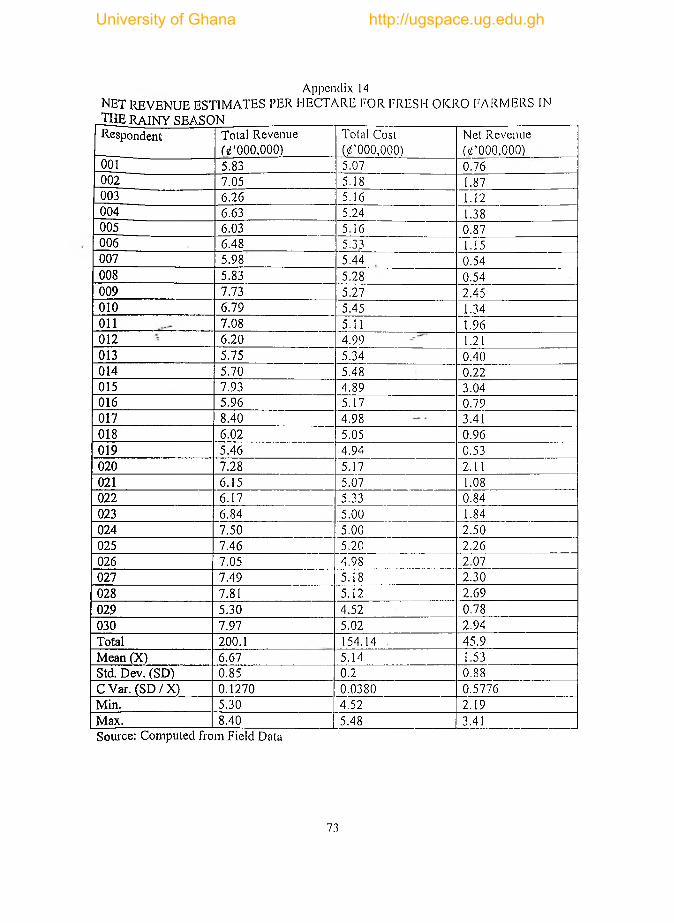
Append ix 14
N E T R E V E N U E E S T IM A T E S P E R H E C T A R E F O R F R E S H O K R O F A R M E R S IN
I H E R A I N Y S E A S O N ______________________________________________________________
Respondent Total Revenue (tf’000,000)
Total Cost (^ ’000,000)
Net Revenue (tf’000,000)
001 5.83 5.07 0.76002 7.05 5.18 1.87003 6.26 5.16 1.12004 6.63 5.24 .1.38005 6.03 5.16 0.87006 6.48 5.33 1.15007 5.98 5.44 0.54008 5.83 5.28 0.54009 7.73 5.27 2.45010 6.79 5.45 1.34011 7.08 5.11 1.96012 6.20 4.99 1.21013 5.75 5.34 0.40014 5.70 5.48 0.22015 7.93 4.89 3.04016 5.96 5.17 0.79017 8.40 4.98 3.41018 6.02 5.05 0.96019 5.46 4.94 0.53020 7.28 5.17 2.11021 6.15 5.07 1.08022 6.17 5.33 0.84023 6.84 5.00 1.84024 7.50 5.00 2.50025 7.46 5.20 2.26026 7.05 4.98 2.07027 7.49 5.18 2.30028 7.81 5.12 2.69029 5.30 4.52 0.78030 7.97 5.02 2.94Total 200.1 154.14 . 45.9Mean (X) 6.67 5.14 1.53Std. Dev. (SD) 0.85 0.2 0.88C Var. (SD / X) 0.1270 0.0380 0.5776Min. 5.30 4.52 2.19Max. 8.40 5.48 3.41Source: Com puted from Fie ld Data
73
University of Ghana http://ugspace.ug.edu.gh

Appendix 15N E T R E V E N U E E S T IM A T E S P E R H E C T A R E F O R S E E D O K R O F A R M E R S IN
T H E R A IN Y S E A S O N _____________________________________________________________
Respondent Total Revenue Total Cost Net Revenue(^ ’000,000) (0’OOO,OOO) (* ’000.000)
031 8.60 4.76 3.84032 9.23 5.28 3.94033 9.55 5.19 4.36034 8.05 4.87 3.18035 9.48 4.42 5.05036 8.78 4.92 3.86037 8.80 5.44 3.36038 8.18 5.42 2.75039 7.74 6.61 1.13040 8.78 5.33 3.44041 8.03 5.04 2.98042 8.30 4.87 3.43043 8.68 6.33 2.34044 8.03 4.86 3.16045 8.00 5.04 2.96046 8.35 5.05 3.33047 8.83 6.52 2.31048 8.20 4.90 3.30049 8.33 5.36 1 2.96050 8.00 6.10 1.90051 8.33 6.47 1.85052 6.70 5 .10 1.60053 7.40 6 .3 1 1.09054 7.33 5.40 1.93055 8.51 5037 3.14056 8.23 5.36 2.S7057 8.40 4.88 3.52058 7.75 5.37 2.38059 8.25 6.24 2.01060 8.08 7.35 0.73Total 249 16 4 .13 84.6Mean (X) 8.30 5.47 2.82Std. Dev. (SD) 0.60 0.69 1.0C Var. (SD / X) 0.0724 0 .1266 0.3529Min. 6.70 4.42 0.73Max. 9.55 7.35 5.05Source: Com puted from Field Dala
University of Ghana http://ugspace.ug.edu.gh

NET REVENUE ESTIMATES PER HECTARE F( THE DRY S E A S O N _
Appendix 16
Respondent Total Revenue ( f ’000,000)
Total Cost (('’000,000)
Net Revenue (eS’000,000) ’
061 10.83 5.75 5.08062 10.85 5.90 4.95063 11.15 5.95 5.20064 11.43 5.62 5.80065 10.84 5.69 5.14066 10.55 5.64 4.91067 11.15 . 5.49 5.66068 11.48 5.50 5.97069 10.83 5.37 5.46070 11.45 5.63 5.82071 11.75 5.76 5.99072 11.13 5.56 5.57073 8.14 5.64 2.50074 10.84 5.51 5.33075 11.13 5.62 5.51076 8.18 5.98 2.20077 11.17 5.72 5.46078 10.90 5.61 5.29079 8.13 5.38 2.75080 10.85 5.47 5.38081 8.65 5.65 3.05082 10.53 8.81 1.72083 10.88 5.06 5.82084 8.14 5.28 2.86085 10.54 5.72 4.82086 9.08 5.97 3.11087 10.84 4.49 6.35088 11.44 5.05 6.39089 10.85 5.39 5.46090 8.59 6.20 2.39Total 312.3 170.41 141.9M ean (X) 10.41 5.68 4.73Std. Dev. (SD) 1.17 0.67 1.39C Var. (SD / X) 0.1121 0.1187 0.2949M in. 8.13 4.49 1.72Max. 11.75 8.80 6.39Source: Com puted from Field Data
75
University of Ghana http://ugspace.ug.edu.gh

Appendix 17 CAPITAL AND OPERATING COSTSItem Rainy Season Dry Season 1
Fresh Okro (£ ’000,000)
Seed Okro (£'000,000)
Fresh Okro (£ ’000,000)
C ap ita l Costs:Tools & Equipment 0.91 1.06 0.86Rent 0.16 0.16 0.16Irrigation Charges - - 0.20Sub-Total 1.07 1.22 1.22
O perating Costs:P lanting M aterial 0.35 0.39 0.33Labour 2.37 3.14 3.27Fertilizer 0.40 0.44 0.45Agro-Chemical 0.70 0.72 0.71Transport 0.11 0.10 0.12Sub-Total 3.93 4.79 4.88
Total 5.00 6.01 6.00Source: Com puted from Field Data
Appendix 18 FINANCIAL BENEFITS FROM SALESItem Rainy Season Dry Season
Fresh Okro ($<’000,000)
Seed Okro ' (£ ’000,000)
Fresh Okro (£ ’000,000)
Quantity o f fresh okro produced (baskets per hectare)
164.50 44.17 172.67
Price per basket 0.04 0.03 0.06Q uantity o f seed okro produced (680 m l bottle per hectare)
2.95 355.33 2.47
Price per bottle 0.02 0.02 0.02Total sales 6.67 8.30 10.41Source: Com puted from Field Data
University of Ghana http://ugspace.ug.edu.gh