comparative dosimetry for 68ga-dotatate: impact of using...
TRANSCRIPT

Comparative Dosimetry for 68Ga-DOTATATE: Impactof Using Updated ICRP Phantoms, S Values, andTissue-Weighting Factors
Anders Josefsson1, Robert F. Hobbs1,2, Sagar Ranka1, Bryan C. Schwarz3, Donika Plyku1, Jose Willegaignon de Amorimde Carvalho4, Carlos Alberto Buchpiguel4, Marcelo Tatit Sapienza4, Wesley E. Bolch3, and George Sgouros1
1Russell H. Morgan Department of Radiology and Radiological Science, School of Medicine, Johns Hopkins University, BaltimoreMaryland; 2Department of Radiation Oncology, School of Medicine, Johns Hopkins University, Baltimore Maryland; 3Department ofBiomedical Engineering, University of Florida, Gainesville, Florida; and 4Instituto do Cancer do Estado de S~ao Paulo, School ofMedicine, S~ao Paulo University, S~ao Paulo, Brazil
The data that have been used in almost all calculations of MIRDS value absorbed dose and effective dose are based on stylized
anatomic computational phantoms and tissue-weighting factors
adopted by the International Commission on Radiological Pro-tection (ICRP) in its publication 60. The more anatomically realistic
phantoms that have recently become available are likely to provide
more accurate effective doses for diagnostic agents. 68Ga-DOTA-
TATE is a radiolabeled somatostatin analog that binds with highaffinity to somatostatin receptors, which are overexpressed in
neuroendocrine tumors and can be used for diagnostic PET/CT-
based imaging. Several studies have reported effective doses for68Ga-DOTATATE using the stylized Cristy–Eckerman (CE) phan-toms from 1987; here, we present effective dose calculations
using both the ICRP 60 and more updated formalisms. Methods:Whole-body PET/CT scans were acquired for 16 patients after 68Ga-DOTATATE administration. Contours were drawn on the CT images for
spleen, liver, kidneys, adrenal glands, brain, heart, lungs, thyroid gland,
salivary glands, testes, red marrow (L1–L5), muscle (right thigh), and
whole body. Dosimetric calculations were based on the CE phantomsand the more recent ICRP 110 reference-voxel phantoms. Tissue-
weighting factors from ICRP 60 and ICRP 103 were used in effective
dose calculations for the CE phantoms and ICRP 110 phantoms, re-
spectively. Results: The highest absorbed dose coefficients (absorbeddose per unit activity) were, in descending order, in the spleen, pituitary
gland, kidneys, adrenal glands, and liver. For ICRP 110 phantoms with
tissue-weighting factors from ICRP 103, the effective dose coefficientwas 0.023 ± 0.003 mSv/MBq, which was significantly lower than the
0.027 ± 0.005 mSv/MBq calculated for CE phantoms with tissue-
weighting factors from ICRP 60. One of the largest differences in esti-
mated absorbed dose coefficients was for the urinary bladder wall,at 0.040 ± 0.011 mGy/MBq for ICRP 110 phantoms compared with
0.090 ± 0.032 mGy/MBq for CE phantoms. Conclusion: This study
showed that the effective dose coefficient was slightly overestimated
for CE phantoms, compared with ICRP 110 phantoms using the latesttissue-weighting factors from ICRP 103. The more detailed handling of
electron transport in the latest phantom calculations gives significant
differences in estimates of the absorbed dose to stem cells in the
walled organs of the alimentary tract.
Key Words: 68Ga-DOTATATE; PET/CT imaging; normal tissue; dosi-
metry; effective dose
J Nucl Med 2018; 59:1281–1288DOI: 10.2967/jnumed.117.203893
Dosimetry for nuclear medicine imaging agents is performedto ensure that the long-term radiation risks of the imaging pro-
cedure are minimal compared with the benefits of obtaining a correct
image-based diagnosis. In the late 1960s and early 1970s, the MIRD
Committee of the Society of Nuclear Medicine and Molecular Imag-
ing published a formalism that standardized the process for comput-
ing tissue-absorbed doses through the introduction of 2 essential
terms, cumulated activity (~A) and radionuclide S value (S) (1). Cu-
mulated activity, currently known by the term time-integrated activity
(abbreviated TIA but still represented by ~A) (2), depends on the
pharmacokinetic properties of the diagnostic agent. These are typi-
cally characterized by longitudinal quantitative imaging in an appro-
priate patient population. S value is defined as the absorbed dose to a
target region per unit TIA in the source region, such that the product
of TIA and S value gives the absorbed dose contribution from a
source region to a target region. S values depend on the emission
characteristics of the radionuclide used in the diagnostic agent and on
the reference anatomic model used in the Monte Carlo radiation
transport simulations of the emitted radiation particles and photons.
The S values that have been used in effective dose calculations
over the past several decades have been derived primarily from the
stylized Cristy–Eckerman (CE) phantom series developed in 1987
(3) and used extensively by the International Commission on Radio-
logical Protection (ICRP). Reflecting the computational and imaging
capabilities of the time, the CE phantoms comprised stylized organs
composed of simple geometries defined by mathematic surface equa-
tions to describe the inner anatomy and outer body contour. In 2009,
the ICRP and the International Commission on Radiation Units and
Measurements released adult male and female CT-based voxelized
reference phantoms (ICRP publication 110) (4), with organ and tissue
masses matched to reference values (ICRP publication 89) (5). Spe-
cific absorbed fractions for the ICRP 110 voxelized reference phan-
toms have been published (ICRP publication 133) (6), as well as the
latest reference tissue–weighting factors (ICRP publication 103) (7).
Received Oct. 18, 2017; revision accepted Dec. 14, 2017.For correspondence or reprints contact: George Sgouros, Russell H.
Morgan Department of Radiology and Radiological Science, Johns HopkinsUniversity, School of Medicine, CRBII 4M.61, 1550 Orleans St., Baltimore,MD 21231.E-mail: [email protected] online Feb. 9, 2018.COPYRIGHT© 2018 by the Society of Nuclear Medicine and Molecular Imaging.
CRISTY–ECKERMAN VS. UPDATED ICRP PHANTOMS • Josefsson et al. 1281
by on March 23, 2020. For personal use only. jnm.snmjournals.org Downloaded from

In the present study, we used 68Ga-DOTATATE PET/CT scans tocompare dosimetry based on the most recent ICRP standards (ICRP110 phantoms and ICRP 103 tissue-weighting factors) with dosime-try based on the prior standards (CE phantoms and ICRP 60 tissue-weighting factors (8)) and with previously reported dosimetry basedon these prior standards (9,10). Such comparisons are important tounderstanding the impact of transitioning from the older phantomsand tissue-weighting factors to the most recently recommended ones.
MATERIALS AND METHODS
Patients68Ga-DOTATATE PET/CT scans from 16 Brazilian patients with
somatostatin-avid tumors were used in this study (11 female and 5 male;mean age, 53.8 6 13.0 y; range, 36–79 y) (Table 1). PETwas indicated
for staging, follow-up, or planning of peptide receptor radionuclide ther-apy. Five of the patients had gastroenteropancreatic neuroendocrine tu-
mors, 5 had medullary thyroid cancer with increasing calcitonin levels,3 had neuroectodermic tumors (malignant pheochromocytoma or para-
ganglioma), 2 had associated adrenal and thyroid tumors, and 1 hadectopic Cushing syndrome requiring tumor localization. The institutional
review board at S~ao Paulo University School of Medicine approved thisstudy, and all subjects signed an informed-consent form.
PET/CT Imaging
Two to four whole-body PET/CT scans were acquired at 2–240 min
after injection of 68Ga-DOTATATE (mean, 131.2 6 26.3 MBq) (Table 1).Imaging was performed in 3-dimensional time-of-flight mode on a Dis-
covery PET/CT 690 system (GE Healthcare) at 2 min per bed position.
The acquisition matrix was 192 · 192 pixels, the in-slice pixel size was3.27 mm, and the transaxial slice thickness was 3.27 mm. Ordered-subsets
expectation maximization was used for PET reconstruction, with CT-basedattenuation correction using automatic exposure control for dose reduction.
Normal-Tissue Dosimetry
Overview. Patient-tissue activity concentrations rather than organ-specific activities were taken from the patient data and transposed into
the 2 reference phantom models. Normal-tissue absorbed dose
coefficients (absorbed dose per unit activity) were calculated using
the MIRD S-value–based methodology (1,2). OLINDA/EXM soft-
ware, version 1 (11), was used for the CE phantom dosimetry calcu-
lations, and a Microsoft Excel spreadsheet with S values obtained
from the University of Florida was used for the ICRP 110 phantom
dosimetry calculations. TIA (i.e., total number of nuclear transforma-
tions between 2 time points) was calculated from time–activity data
within the source regions, defined by drawing organ contours on the
CT portion of the first PET/CT image for each patient. These contours
were transposed to later time points after deformable registration of
the scans had been performed using Velocity software (version 3.1;
Varian Medical Systems Inc.). Contours were drawn for the spleen,
liver, kidneys, adrenal glands, brain, heart, lungs, thyroid gland,
salivary glands, testes, red marrow (L1–L5), muscle (right thigh),
and whole body. Dosimetry was performed for each patient and
inserted into the respective phantom, after which the average for
all patients was calculated.
TIA Calculations. The average activity concentration is AðrS ;tÞVðrSÞ ,
where A is activity, V is volume, rS is source region, and t is time
after injection. Volume was derived from each patient’s PET/CT
images. The specific organ/tissue activity (Bq) for a phantom k was
calculated for each patient’s organ/tissue activity as follows:
AðrS; tÞk 5AðrS; tÞVðrSÞ �MðrSÞk
rðrSÞ ; Eq. 1
whereM is mass and r is tissue density. Mass was taken from OLINDA/EXM (11,12) for the CE phantom calculations and from ICRP 133 for
the ICRP 110 phantom calculations. Tissue density was according to
ICRP 110. Source region rS in Equation 1 is an index over all tissues and
the whole body for which TIA was assigned.
Excel was used to fit a monoexponential expression to eachpatient’s specific organ/tissue time–activity curve. The expressions
were analytically integrated from 0 to infinity, resulting in the TIA
corresponding to each phantom’s source region. Preserving activity
concentration rather than total activity can lead to a discrepancy in
the whole-body activity between the phantom and the patient at the time
of administration. The TIA coefficient (TIAC) is defined as the TIA
divided by the administered activity. In this scenario, the administered
activity is the total virtually administered activity to the phantom rather
than the administered activity to the patient. Scaling of each TIAC by
the phantom-to-patient whole-body mass ratio accounts for this differ-
ence. The TIAs (Bq�s) used for the calculations were as follows:
~AðrSÞk 5ðN
0
AðrS; tÞkdt: Eq. 2
The TIACs (s) where
~aðrSÞk 5MðwbÞpatientMðwbÞk
�~AðrSÞkA0
; Eq. 3
where ~a is TIAC, wb is whole body, and A0 is administered activity.
Remainder of Body. The remainder-of-body TIAC (s) was calculatedas the difference between the TIAC of the whole body, the TIAC of the
target region, and the TIAC of the source regions summed:
~aðrbÞk 5 ~aðwbÞk 2 ~aðrT Þk 2 +rS
~aðrSÞk; Eq. 4
where rb is rest of body, wb is whole body, and rT is target region. The
corresponding phantom masses (kg) were
TABLE 1Patient and Imaging Data
Patient
Age
(y)
Weight
(kg)
Height
(cm) Sex
Administered
activity
(MBq)
PET/CT
scans
(n)
1F 59 63 155 F 156.9 3
2F 67 75 145 F 107.3 3
3F 70 74 147 F 140.6 4
4F 53 66 165 F 126.2 2
5F 35 76 161 F 107.3 3
6F 38 62 167 F 125.8 2
7F 65 109 159 F 82.1 3
8M 36 83 178 M 149.1 2
9F 79 73 156 F 177.6 3
10M 59 68 157 M 169.5 3
11M 63 102 182 M 158.7 3
12M 39 85 181 M 91.0 3
13F 43 97 155 F 112.1 2
14M 44 94 176 M 137.3 2
15F 52 106 162 F 126.5 3
16F 58 84 157 F 131.7 3
1282 THE JOURNAL OF NUCLEAR MEDICINE • Vol. 59 • No. 8 • August 2018
by on March 23, 2020. For personal use only. jnm.snmjournals.org Downloaded from

MðrbÞk 5 MðwbÞk 2 MðrT Þk 2 +rS
MðrSÞk: Eq. 5
Source region rS in Equations 4 and 5 is an index over all source regions
for which a TIAC is assigned, except for the target region. The remain-
der-of-body mass excluded the contents of the walled organs.Urinary Bladder. The TIAC for urinary bladder contents was
calculated using the MIRD bladder-voiding model (13) as imple-
mented in OLINDA/EXM. A 2-h voiding interval was used, with
the whole-body biologic clearance half-life obtained from the PET/
CT images and a fraction of 1. This TIAC was used both for the CE
phantom calculations and for the ICRP 110 phantom calculations.
Pituitary Gland. To account for partial-volume effects arising fromthe small size of the pituitary gland, a hybrid dosimetric method
developed by Plyku et al. (14) for small tumors was used. Briefly, the
pituitary gland was modeled as a 0.6-g unit-density sphere. A 10%
threshold of the maximum PET value was used for contouring. The
volume of the pituitary gland contoured on the PET images was sys-
tematically larger than the ICRP volume and presumably larger than the
real volume because of activity spill-out. However, this volume contains
the activity in the pituitary gland plus some background activity (Bq) in
the PET volume outside the real volume, which needs to be subtracted:
AðpgÞ 5 AðVPETÞ 2 A
VðbkgÞ�ðVPET2VICRPÞ; Eq. 6
where pg is pituitary gland and bkg is background. The backgroundactivity concentration for the pituitary gland was determined by
drawing a contour in the brain. A monoexponential expression was
fitted to the time–activity data points and analytically integrated from
zero to infinity, and the TIAC was calculated according to Equations 2
and 3 for the respective phantom.
Absorbed Dose Calculations. The MIRD Committee–derived equa-
tion was used for all calculations of absorbed dose coefficients
(absorbed dose per unit activity (Gy/Bq)) (2):
dðrT Þ 5 +rS
~aðrSÞ � SðrT)rSÞ; Eq. 7
where d is absorbed dose coefficient. The TIACs for the CE phantoms
were used as input in OLINDA/EXM to obtain estimates of the CE
phantom–derived absorbed dose coefficient. Because the CE phan-
toms do not have S values for the pituitary gland, the self-dose
absorbed dose coefficient to the pituitary gland was calculated using
the unit-density sphere model provided by OLINDA/EXM. An
Excel spreadsheet was used for the ICRP dosimetric calculations.
Remainder-of-Body Contribution to Absorbed Dose. The CEphantom–based dosimetry specifies 25 target regions and 28 source
regions. In contrast, the ICRP 110 phantom dosimetry allows TIAC
apportionment in up to 76 source regions and provides the absorbed
dose coefficients to 41 target regions. More significantly, the CE phantom–
based formalism includes whole-body–to–individual-tissue S values,
whereas no such S values are tabulated for the ICRP 110 phantoms.
The remainder TIAC that has not been otherwise allocated is given
the term remainder of body in CE phantom calculations. Target
absorbed dose coefficients (Gy/Bq) for remainder of body are given
by (15)
dðrT ÞCE 5 ~aðrT ÞCE � SðrT)rT ÞCE1 ~aðrbÞCE � SðrT)rbÞCE1 +
rS
~aðrSÞCE � SðrT)rSÞCE; Eq. 8
with the remainder-of-body to target S value (Gy/Bq�s) given by
SðrT)rbÞCE 5 SðrT)wbÞCE �MðwbÞCEMðrbÞCE
2 +rS
SðrT)rSÞCE �MðrSÞCEMðrbÞCE
:
Eq. 9
Because almost all tissues in the body are accounted for by the ICRP
110 phantoms, whole-body–to–individual-tissue S values have notbeen calculated for the ICRP 110 phantoms. The contribution of the
absorbed dose coefficient from remainder of body to each targettissue is obtained by apportioning the remainder-of-body TIAC (s)
to each remaining source tissue not previously accounted for:
~aðrUÞICRP 5 ~aðrbÞICRP �MðrUÞICRPMðrbÞICRP
; Eq. 10
where rU is the index over source regions identified in the ICRP 110phantoms that have not been specifically assigned a TIAC.
The absorbed dose coefficient (Gy/Bq) to each target region of theICRP 110 phantoms is given by
dðrT ÞICRP 5 ~aðrT ÞICRP � SðrT)rT ÞICRP1 +rS
~aðrSÞICRP � SðrT)rSÞICRP1 +
rU
~aðrUÞICRP � SðrT)rUÞICRP:
Eq. 11
Effective Dose Calculations. The effective dose coefficient (effec-
tive dose per unit activity (Sv/Bq)) for CE phantom calculations in anindividual patient is given by
epatientCE 5 +
T
wT � hðrT ÞpatientCE ; Eq. 12
where e is effective dose coefficient, wT is ICRP 60 tissue-weightingfactor, and h is equivalent dose coefficient (Sv/Bq).
The radiation-weighting factor for all 68Ga radiation emissions isequal to 1. Accordingly,
hðrT Þak 5 dðrT Þak ; Eq. 13
where a denotes the sex of each patient.The effective dose coefficient per unit activity (Sv/Bq) is obtained
by averaging the male- and female-averaged patient-specific effectivedose coefficient:
eCE 5
+nM
eMCEnM
1+nF
eFCEnF
2
26664
37775; Eq. 14
where nM and nF are the number of males and females, respectively.The effective dose coefficient (Sv/Bq) for ICRP is
eICRP 5 +T
wT �+nM
hðrT ÞMICRPnM 1
+nF
hðrT ÞFICRPnF
2
26664
37775; Eq. 15
where the tissue-weighting factor is from ICRP 103.
The percentage differences between the CE phantom values and theICRP 110 phantom values were calculated as follows:
Difference 5ðvalueCE 2 valueICRPÞ
valueCE� 100% Eq. 16
CRISTY–ECKERMAN VS. UPDATED ICRP PHANTOMS • Josefsson et al. 1283
by on March 23, 2020. For personal use only. jnm.snmjournals.org Downloaded from

Statistical Analysis
Statistical analysis was performed usingPrism software (version 7.03; GraphPad Soft-
ware Inc.). All data are presented as the meanvalue 6 SD. Groups were compared using a
2-tailed Student t test, and differences be-tween groups were considered significant for
P values of less than 0.05.
RESULTS
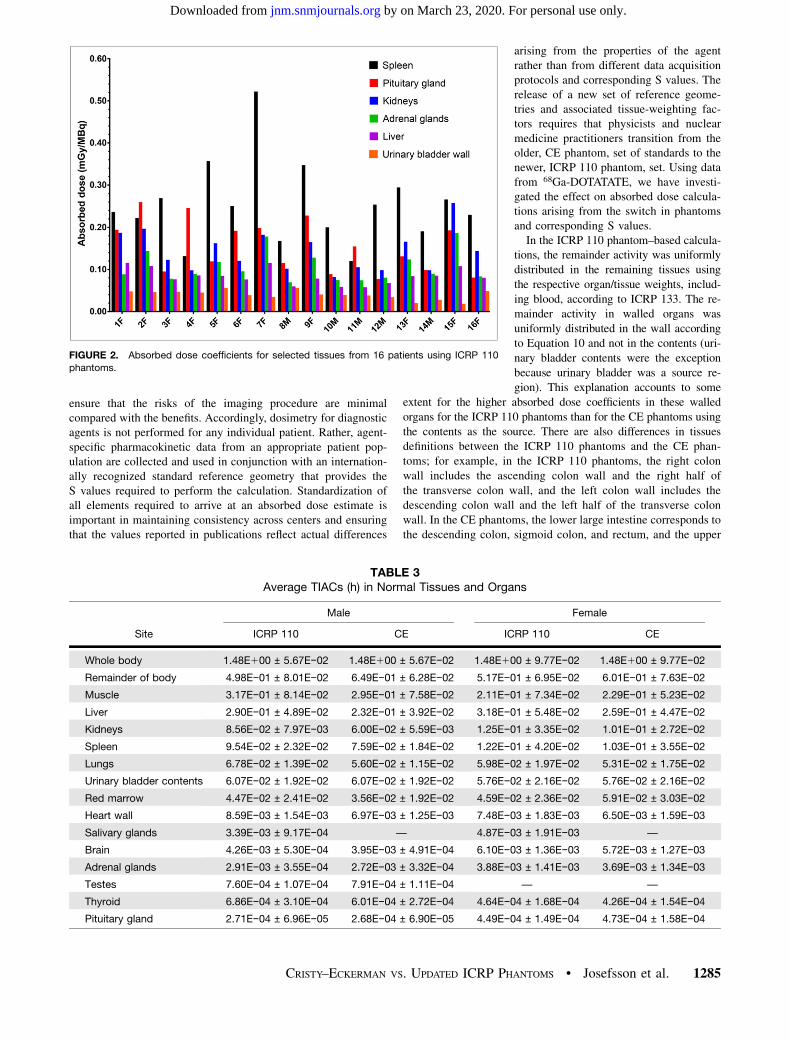
The absorbed dose coefficients calcu-lated for the ICRP 110 phantoms areshown in Figure 1. The tissues with thehighest 7 absorbed dose coefficients, aswell as the effective dose coefficient, arelisted and compared with previously pub-lished data (9,10) in Table 2. ICRP 110phantom–based calculations for the 16 pa-tients are shown in Figure 2. TIACs arelisted in Table 3. The absorbed dose coef-ficients obtained in this study are comparedwith those in the literature (9) in Figure 3.The ICRP 110 phantom–derived effectivedose coefficient (0.023 6 0.003 mSv/MBq) obtained using tissue-weighting fac-tors from ICRP 103 was significantly lower(P 5 0.0114) than that (0.027 6 0.005mSv/MBq) derived from the CE phantomsusing tissue-weighting factors from ICRP60. Significant differences in calculatedabsorbed dose coefficients between theCE phantoms and the ICRP 110 phantomswere found for gallbladder wall, breast,thymus, pancreas, small intestine wall,stomach wall, uterus, ovaries, skin, heartwall, urinary bladder wall (P , 0.0001),and pituitary gland (P 5 0.0252). The con-tributions from remainder of body, sourcetissues, and target tissue to the totalabsorbed dose coefficients for kidney andurinary bladder wall are shown in Figure 4.
DISCUSSION
The main objective of radiopharmaceu-tical dosimetry for diagnostic agents is to
TABLE 2Absorbed Dose Coefficients for 68Ga-DOTATATE (mGy/MBq) in Normal Tissues and Organs
Site ICRP 110 CE Sandstrom et al. (10) Walker et al. (9)
Spleen 0.25 ± 0.097 0.28 ± 0.11 0.11 ± 0.058 0.28 ± 0.12
Pituitary gland 0.15 ± 0.062 0.22 ± 0.092 — 0.042 ± 0.032
Kidneys 0.14 ± 0.048 0.15 ± 0.055 0.093 ± 0.016 0.092 ± 0.028
Adrenal glands 0.11 ± 0.037 0.11 ± 0.041 0.086 ± 0.052 0.015 ± 0.001
Liver 0.084 ± 0.019 0.088 ± 0.022 0.050 ± 0.015 0.045 ± 0.015
Gallbladder wall 0.043 ± 0.008 0.015 ± 0.002 0.016 ± 0.002 0.015 ± 0.001
Urinary bladder wall 0.040 ± 0.011 0.090 ± 0.033 0.098 ± 0.048 0.13 ± 0.062
Effective dose coefficient (mSv/MBq) 0.023 ± 0.003 0.027 ± 0.005 0.021 ± 0.003 0.026 ± 0.003
FIGURE 1. Mean absorbed dose coefficients for normal organs and tissues using ICRP 110
phantoms. Error bars 5 SD.
1284 THE JOURNAL OF NUCLEAR MEDICINE • Vol. 59 • No. 8 • August 2018
by on March 23, 2020. For personal use only. jnm.snmjournals.org Downloaded from
ensure that the risks of the imaging procedure are minimalcompared with the benefits. Accordingly, dosimetry for diagnosticagents is not performed for any individual patient. Rather, agent-specific pharmacokinetic data from an appropriate patient pop-ulation are collected and used in conjunction with an internation-ally recognized standard reference geometry that provides theS values required to perform the calculation. Standardization ofall elements required to arrive at an absorbed dose estimate isimportant in maintaining consistency across centers and ensuringthat the values reported in publications reflect actual differences
arising from the properties of the agentrather than from different data acquisitionprotocols and corresponding S values. Therelease of a new set of reference geome-tries and associated tissue-weighting fac-tors requires that physicists and nuclearmedicine practitioners transition from theolder, CE phantom, set of standards to thenewer, ICRP 110 phantom, set. Using datafrom 68Ga-DOTATATE, we have investi-gated the effect on absorbed dose calcula-tions arising from the switch in phantomsand corresponding S values.In the ICRP 110 phantom–based calcula-
tions, the remainder activity was uniformlydistributed in the remaining tissues using
the respective organ/tissue weights, includ-ing blood, according to ICRP 133. The re-mainder activity in walled organs wasuniformly distributed in the wall accordingto Equation 10 and not in the contents (uri-
nary bladder contents were the exceptionbecause urinary bladder was a source re-gion). This explanation accounts to some
extent for the higher absorbed dose coefficients in these walled
organs for the ICRP 110 phantoms than for the CE phantoms usingthe contents as the source. There are also differences in tissuesdefinitions between the ICRP 110 phantoms and the CE phan-toms; for example, in the ICRP 110 phantoms, the right colonwall includes the ascending colon wall and the right half of
the transverse colon wall, and the left colon wall includes thedescending colon wall and the left half of the transverse colonwall. In the CE phantoms, the lower large intestine corresponds tothe descending colon, sigmoid colon, and rectum, and the upper
TABLE 3Average TIACs (h) in Normal Tissues and Organs
Site
Male Female
ICRP 110 CE ICRP 110 CE
Whole body 1.48E100 ± 5.67E−02 1.48E100 ± 5.67E−02 1.48E100 ± 9.77E−02 1.48E100 ± 9.77E−02
Remainder of body 4.98E−01 ± 8.01E−02 6.49E−01 ± 6.28E−02 5.17E−01 ± 6.95E−02 6.01E−01 ± 7.63E−02
Muscle 3.17E−01 ± 8.14E−02 2.95E−01 ± 7.58E−02 2.11E−01 ± 7.34E−02 2.29E−01 ± 5.23E−02
Liver 2.90E−01 ± 4.89E−02 2.32E−01 ± 3.92E−02 3.18E−01 ± 5.48E−02 2.59E−01 ± 4.47E−02
Kidneys 8.56E−02 ± 7.97E−03 6.00E−02 ± 5.59E−03 1.25E−01 ± 3.35E−02 1.01E−01 ± 2.72E−02
Spleen 9.54E−02 ± 2.32E−02 7.59E−02 ± 1.84E−02 1.22E−01 ± 4.20E−02 1.03E−01 ± 3.55E−02
Lungs 6.78E−02 ± 1.39E−02 5.60E−02 ± 1.15E−02 5.98E−02 ± 1.97E−02 5.31E−02 ± 1.75E−02
Urinary bladder contents 6.07E−02 ± 1.92E−02 6.07E−02 ± 1.92E−02 5.76E−02 ± 2.16E−02 5.76E−02 ± 2.16E−02
Red marrow 4.47E−02 ± 2.41E−02 3.56E−02 ± 1.92E−02 4.59E−02 ± 2.36E−02 5.91E−02 ± 3.03E−02
Heart wall 8.59E−03 ± 1.54E−03 6.97E−03 ± 1.25E−03 7.48E−03 ± 1.83E−03 6.50E−03 ± 1.59E−03
Salivary glands 3.39E−03 ± 9.17E−04 — 4.87E−03 ± 1.91E−03 —
Brain 4.26E−03 ± 5.30E−04 3.95E−03 ± 4.91E−04 6.10E−03 ± 1.36E−03 5.72E−03 ± 1.27E−03
Adrenal glands 2.91E−03 ± 3.55E−04 2.72E−03 ± 3.32E−04 3.88E−03 ± 1.41E−03 3.69E−03 ± 1.34E−03
Testes 7.60E−04 ± 1.07E−04 7.91E−04 ± 1.11E−04 — —
Thyroid 6.86E−04 ± 3.10E−04 6.01E−04 ± 2.72E−04 4.64E−04 ± 1.68E−04 4.26E−04 ± 1.54E−04
Pituitary gland 2.71E−04 ± 6.96E−05 2.68E−04 ± 6.90E−05 4.49E−04 ± 1.49E−04 4.73E−04 ± 1.58E−04
FIGURE 2. Absorbed dose coefficients for selected tissues from 16 patients using ICRP 110
phantoms.
CRISTY–ECKERMAN VS. UPDATED ICRP PHANTOMS • Josefsson et al. 1285
by on March 23, 2020. For personal use only. jnm.snmjournals.org Downloaded from

large intestine corresponds to the ascending colon and transversecolon (16). In addition, the lungs are divided into 4 target regionsin the ICRP 110 phantoms, compared with 1 target region in theCE phantoms.When the calculated self-dose S values were compared between
the CE and ICRP 110 phantoms, the CE phantom values werehigher for both females (range, 27.7% to 165.3%) and males(range, 2961% to 159.6%), with the largest difference beingfor the urinary bladder contents to the urinary bladder wall(165.3% in females and 159.6% in males) and an outlier forthe self-dose breast S value (2961%) in males. The standard massfor the male breast was 351 g (11,12) and 26.2 g (6) for the CE andICRP 110 phantoms, respectively, and is probably the main expla-nation for the large difference observed in the respective S values.A comparison of the CE and the ICRP 110 phantoms using theaveraged male and female self-dose S values for all organs andtissues gave a difference of 126.3% and 127.1%, respectively,with a respective tissue mass difference of 22.2% and 26.7%.However, a comparison using the specific TIACs and organ/tissuemasses from the ICRP 110 method in the CE method and com-paring with the CE phantom results gave an averaged male andfemale absorbed dose difference of 2.1% for the urinary bladderwall and 1.8% for the kidneys; thus, the effect of mass differenceson the results is small because of the scaling of input activity to thephantom organ mass.In general, the results showed lower absorbed doses using ICRP
110 phantoms than using CE phantoms. This finding is likelyexplained by 2 fundamental differences between these phantoms.The first is a difference in organ topology, with the ICRP 110phantoms having less interorgan tissue space and a betteraccounting and placement of distributed tissue (e.g., marrow,adipose tissue, and muscle). The second difference is that S valuesderived from the ICRP 110 phantoms have a better handling of thefraction of electron energy absorbed. This characteristic explainsto some extent the larger differences seen in thin-walled organs(e.g., urinary bladder wall, which had a 125% higher absorbed dose
coefficient in the CE phantom calculationsthan in the ICRP 110 phantom calcula-tions). This advantage leads to a differentand better approach to handling TIACs notspecifically assigned to source organs. It isnow possible to deposit TIACs uniformlythroughout the remaining non-source tissueand then use specific source-to-target Svalues to account for the absorbed dose dueto a TIAC that is not specifically allocated.Other differences in the calculations (e.g.,updated radionuclide decay data (17) and tis-sue densities) had negligible effects on thedifferences, as previously shown by Hadidet al. (18).Dosimetric calculations for 68Ga-DOTA-
TATE have previously been published byWalker et al. (9) and Sandstrom et al. (10).The percentage difference between resultsobtained in this study using the CE phan-toms and those of Walker et al. rangedfrom2229% to 186.5% (brain and adrenalglands, respectively). The absorbed dose co-efficient to the adrenal glands reported bySandstrom et al. was 21% lower than that
obtained in this study. The large adrenal-gland difference for Walkeret al. could be explained by their not using the adrenal glands as asource organ (no contour was drawn), whereas our study and that ofSandstrom et al. did use drawn contours. In addition, the absorbeddose coefficient to the salivary glands calculated by Walker et al.(0.0126 0.008 mGy/MBq) was 52% lower than that obtained usingthe ICRP 110 phantom calculation (0.025 6 0.010 mGy/MBq).Similarly, the salivary glands were not included in the CE phantomsas a source or target region. In addition, Walker et al. used dataexclusively from male patients, whereas our study used the averagebetween male and female. For both the salivary and the pituitaryglands, there were significant differences (P , 0.035) between themale and female absorbed dose coefficients (Fig. 1). In addition,because the ICRP 110 phantoms use the salivary glands both as asource and as a target region, the absorbed dose considers not onlythe self-dose but also contributions from adjacent and surroundingtissues (unlike version 1 of the OLINDA/EXM sphere model, forexample). Furthermore, Walker et al. did not perform whole-bodyPET/CT and made estimates for the activity in the nonimaged ex-tremities to get the whole-body activity. Sandstrom et al. also didnot perform whole-body PET/CT but, rather, scanned from the baseof the skull to the proximal femur. Because we performed whole-body (head to toes) scans in this work, we were able to account forall the activity in the body.Figure 4 depicts the averaged male and female contribution
from different source tissues to the kidneys and urinary bladderwall. These 2 tissues were chosen to illustrate the differences inrelative contribution to the total absorbed dose between a solidorgan and a walled tissue, respectively. As expected, self-dose isthe dominant contributor to the total absorbed dose for the kid-neys. In contrast, urinary bladder contents provide a greater con-tribution to the bladder wall dose than does the wall itself, as canbe seen in the ICRP 110 bladder wall dose calculation. Urinarybladder wall self-dose S values are available for the ICRP 110phantom calculations but not for the CE phantom calculations.The absorbed dose coefficient for the kidneys was 5.9% higher
FIGURE 3. Comparison of absorbed dose coefficients for ICRP 110 phantoms, CE phantoms
(CEP), and previously published results by Walker et al. (9) using OLINDA/EXM, version 1. Error
bars 5 SD. *Anatomic definition differs between ICRP 110 and CE phantoms. 1ICRP 110 phan-
toms show alveolar–interstitial absorbed dose coefficient, compared with total lung for CE
phantoms.
1286 THE JOURNAL OF NUCLEAR MEDICINE • Vol. 59 • No. 8 • August 2018
by on March 23, 2020. For personal use only. jnm.snmjournals.org Downloaded from

for the CE phantoms than for the ICRP 110 phantoms, as can beexplained mainly by a 29.7% higher self-dose S value, a 30.7%lower average kidney TIAC, and the difference in contributionsfrom source tissues and remainder of body. For the urinary bladderwall, the absorbed dose coefficient was 125% higher for the CEphantoms than for the ICRP 110 phantoms, as can be explainedmainly by a 62.5% higher urinary bladder contents-to-wall Svalue, no difference in TIAC (the TIACs for urinary bladder con-tents were calculated using the MIRD bladder-voiding model asimplemented in OLINDA/EXM, version 1, and is not phantom-dependent), and the difference in contributions from source tissuesand remainder of body (including urinary bladder wall for theICRP 110 phantoms). This difference stems from a difference inmethods, with the CE phantoms using only contents as a sourcefor walled organs (e.g., stomach, gallbladder, intestine, and uri-nary bladder) but the ICRP 110 phantoms using organ wall as asource as well.As shown in Figures 2 and 3, the calculated absorbed dose
coefficients for the different organs/tissues varied widely amongpatients, with the differences being in many cases larger than thosebetween the ICRP 110 and CE phantom calculations. About halfthe compared organs/tissues (mainly those that are small orwalled) differed significantly between the ICRP 110 and CE phan-tom calculations. The calculated absorbed doses for larger solidorgans (e.g., liver) did not significantly differ between the ICRP
110 and CE phantoms. The significant differences in the smaller orwalled organs represent relatively low absorbed doses compared withlarger solid organs such as the spleen. Tissue-absorbed doses arealready low for diagnostic agents. The modest reduction in tissue-absorbed doses and in effective dose will have a minimal impact onroutine clinical practice. The main impact of these updated calcula-tions will be in the development of new imaging agents. In thiscontext, lower absorbed doses would allow slightly greater adminis-tered activities and therefore higher-quality images.Another area that would be impacted, although negatively so, is the
therapeutic use of radionuclides. Even though dosimetry for radio-pharmaceutical therapy should account for individual patient anatomyand the spatial distribution of activity within organs, standardphantom-based dosimetry methods are still used for initial assess-ments of likely toxicity and for reporting to regulatory authorities.The tissue-weighting factors used with the ICRP 110 phantoms
were from ICRP 103, whereas those used with the CE phantomswere from ICRP 60. The main change from the earlier tissue-weighting factors is a decrease for gonads, an increase for breast,the use of separate weighting factors for salivary glands and brain,and an increase for the remainder category, both in value and innumber of tissues included (7,8). The calculated effective dosecoefficient was significantly lower for the ICRP 110 phantomsthan for the CE phantoms. The recommended administered activ-ity of 68Ga-DOTATATE (range, 100–200 MBq) (19)—and the
FIGURE 4. Contribution from target region, source region, and remainder of body to total absorbed dose coefficient in target regions ICRP 110
kidney (A), CE kidney (B), ICRP 110 urinary bladder wall (with contribution from contents and wall) (C), and CE urinary bladder wall (with contribution
from contents) (D). CEP 5 CE phantoms.
CRISTY–ECKERMAN VS. UPDATED ICRP PHANTOMS • Josefsson et al. 1287
by on March 23, 2020. For personal use only. jnm.snmjournals.org Downloaded from

average administered in this study—was 131.2 MBq. According tothe ICRP 110 phantoms, this amount of activity results in aneffective dose of 3.0 mSv (2.3–4.6 mSv for the recommendedactivity range), which is lower than the 3.6 mSv calculated usingthe CE phantoms. Accordingly, effective doses have been over-estimated using the CE phantoms, as compared with the ICRP 110phantoms in combination with specific absorbed fractions fromICRP 133 and tissue-weighting factors from ICRP 103.
CONCLUSION
CE phantom–based dosimetry has been shown to overestimateeffective dose. The differences that were found between CE phan-tom–based dosimetry and ICRP 110–based dosimetry for 68Ga-DOTATATE may require a reevaluation of the dosimetry for otherdiagnostic agents as well. These new standards should be adoptedrapidly so as to minimize confusion in the dosimetry literature.
DISCLOSURE
This work was supported by FAPESP 13/03876-4 (‘‘Avaliacx~ao douso do 68Ga-peptıdeo analogo de somatostatina PET/CT como ferra-menta diagnostica em tumores neuroendocrinos e sua correlacx~ao commarcadores moleculares’’) and by NIH R01 CA116477. No otherpotential conflict of interest relevant to this article was reported.
ACKNOWLEDGMENTS
Drs. George Barberio Coura Filho and Ana Amelia Fialho deOliveira Hoff, from Instituto do Cancer do Estado de S~ao Paulo,are acknowledged for helping us acquire the PET/CT images. Wealso thank Dr. William Goodwin, from the Department of Bio-medical Engineering at the University of Florida, for valuableinformation and insight on the ICRP 110 voxelized phantoms.
REFERENCES
1. Loevinger R, Budinger T, Watson E. MIRD Primer for Absorbed Dose Calcu-
lations. Reston, VA: The Society of Nuclear Medicine and Molecular Imaging;
1991:1–128.
2. Bolch WE, Eckerman KF, Sgouros G, Thomas SR. MIRD pamphlet no. 21: a
generalized schema for radiopharmaceutical dosimetry–standardization of no-
menclature. J Nucl Med. 2009;50:477–484.
3. Cristy M, Eckerman KF. Specific Absorbed Fractions of Energy at Various Ages
from Internal Photon Sources. III. Five-Year-Old. Oak Ridge, TN: Oak Ridge
National Laboratory; 1987:1–42. ORNL/TM-8381/V3.
4. Menzel HG, Clement C, DeLuca P. ICRP publication 110: realistic reference
phantoms—an ICRP/ICRU joint effort. A report of adult reference computa-
tional phantoms. Ann ICRP. 2009;39:1–164.
5. Basic anatomical and physiological data for use in radiological protection: ref-
erence values—a report of age- and gender-related differences in the anatomical
and physiological characteristics of reference individuals. ICRP publication 89.
Ann ICRP. 2002;32:5–265.
6. Bolch WE, Jokisch D, Zankl M, et al. The ICRP computational framework for
internal dose assessment for reference adults: specific absorbed fractions—ICRP
publication 133. Ann ICRP. 2016;45:1–74.
7. The 2007 recommendations of the International Commission on Radiological
Protection: ICRP publication 103. Ann ICRP. 2007;37:1–332.
8. 1990 recommendations of the International Commission on Radiological Pro-
tection: ICRP publication 60. Ann ICRP. 1990;21:1–227.
9. Walker RC, Smith GT, Liu E, Moore B, Clanton J, Stabin M. Measured human
dosimetry of 68Ga-DOTATATE. J Nucl Med. 2013;54:855–860.
10. Sandstrom M, Velikyan I, Garske-Roman U, et al. Comparative biodistribution
and radiation dosimetry of 68Ga-DOTATOC and 68Ga-DOTATATE in patients
with neuroendocrine tumors. J Nucl Med. 2013;54:1755–1759.
11. Stabin MG, Sparks RB, Crowe E. OLINDA/EXM: the second-generation per-
sonal computer software for internal dose assessment in nuclear medicine. J Nucl
Med. 2005;46:1023–1027.
12. Stabin MG, Tagesson M, Thomas SR, Ljungberg M, Strand SE. Radiation do-
simetry in nuclear medicine. Appl Radiat Isot. 1999;50:73–87.
13. Thomas SR, Stabin MG, Chin-Tu C, Samaratunga RC. MIRD pamphlet no. 14
revised: a dynamic urinary bladder model for radiation dose calculations. J Nucl
Med. 1999;40(suppl):102S–123S.
14. Plyku D, Hobbs RF, Huang K, et al. Recombinant human thyroid-stimulating
hormone versus thyroid hormone withdrawal in 124I-PET/CT based dosimetry for131I therapy of metastatic differentiated thyroid cancer. J Nucl Med. 2017;58:
1146–1154.
15. Coffey JL, Watson EE. Calculating dose from remaining body activity: a com-
parison of two methods. Med Phys. 1979;6:307–308.
16. Snyder WS, Cook MJ, Nasset ES, Karhausen LR, Howells GP, Tipton IH. Report
of the Task Group on Reference Man: ICRP Publication 23. New York, NY:
Pergamon Press; 1975:1–480.
17. Eckerman K, Endo A. ICRP publication 107: nuclear decay data for dosimetric
calculations. Ann ICRP. 2008;38:1–96.
18. Hadid L, Gardumi A, Desbree A. Evaluation of absorbed and effective doses to
patients from radiopharmaceuticals using the ICRP 110 reference computational
phantoms and ICRP 103 formulation. Radiat Prot Dosimetry. 2013;156:141–159.
19. Virgolini I, Ambrosini V, Bomanji JB, et al. Procedure guidelines for PET/CT tumour
imaging with 68Ga-DOTA-conjugated peptides: 68Ga-DOTA-TOC, 68Ga-DOTA-NOC,68Ga-DOTA-TATE. Eur J Nucl Med Mol Imaging. 2010;37:2004–2010.
1288 THE JOURNAL OF NUCLEAR MEDICINE • Vol. 59 • No. 8 • August 2018
by on March 23, 2020. For personal use only. jnm.snmjournals.org Downloaded from

Doi: 10.2967/jnumed.117.203893Published online: February 9, 2018.
2018;59:1281-1288.J Nucl Med. de Carvalho, Carlos Alberto Buchpiguel, Marcelo Tatit Sapienza, Wesley E. Bolch and George SgourosAnders Josefsson, Robert F. Hobbs, Sagar Ranka, Bryan C. Schwarz, Donika Plyku, Jose Willegaignon de Amorim Phantoms, S Values, and Tissue-Weighting Factors
Ga-DOTATATE: Impact of Using Updated ICRP68Comparative Dosimetry for
http://jnm.snmjournals.org/content/59/8/1281This article and updated information are available at:
http://jnm.snmjournals.org/site/subscriptions/online.xhtml
Information about subscriptions to JNM can be found at:
http://jnm.snmjournals.org/site/misc/permission.xhtmlInformation about reproducing figures, tables, or other portions of this article can be found online at:
(Print ISSN: 0161-5505, Online ISSN: 2159-662X)1850 Samuel Morse Drive, Reston, VA 20190.SNMMI | Society of Nuclear Medicine and Molecular Imaging
is published monthly.The Journal of Nuclear Medicine
© Copyright 2018 SNMMI; all rights reserved.
by on March 23, 2020. For personal use only. jnm.snmjournals.org Downloaded from