comparative economic analysis of coal & gas in vietnam · china’s coal trading partners 11...
TRANSCRIPT


The Lantau Group
Agenda / Content
Coal Markets
- Domestic supply and demand – coal imports?
- Asian coal markets
- Indonesia – key regional supplier
- Coal and transport pricing
Natural Gas Markets
- Domestic supply and demand
- LNG regasification development
- Global LNG supply and demand
- LNG pricing – convergence of US and Asian markets?
- Domestic gas pricing – marginal cost versus rolled-in
Case study: Gas development in Vietnam
1

The Lantau Group
Agenda / Content
Coal Markets
- Domestic supply and demand – coal imports?
- Asian coal markets
- Indonesia – key regional supplier
- Coal and transport pricing
Natural Gas Markets
Case study: Gas development in Vietnam
2

The Lantau Group
Vietnam Coal Supply: coal mines and reserves
• Coal resource of Vietnam is concentrated in Quang Ninh coal basin and
Red River coal basin in North Vietnam.
• Though Vietnam is endowed with abundant and good quality coal
resources, the economically recoverable reserves of 2.80 billion tonnes
only represent 6% of total reserves, and it is scattered across the north of
the country making mining more costly.
• At current stage, exploration is not of high quality and mining conditions
are harsh.
• If future coal demand is to be met from domestic coal sources, significant
investment is required to increase reserves and develop coal mining.
• The Red River Delta coal seams are generally consider un-exploitable as
they are too near the surface of the rice basket of Vietnam and display
undulations making machine cutting difficult.
3
Mining District Capacity (Mtpa) Reserve (Mt)
Cam Pha 43 875
Hon Gai 13 400
Uong Bi 40 1,420
Interior 3 90
Red River Delta 14 600
Hanoi
Ho Chi Minh City
Cam Pha
Hon Gai
Uong Bi
Interior Area
Red River Delta Source: Coal Development Master Plan 2012, reserve and resource as of December 2011
Reserve and Resources Billion Tonnes
A+B 0.42
C1 2.39
Identified Resource 2.80
C2 2.65
P 43.3
Total Resource 48.7

Domestic coal supply and demand
0
10
20
30
40
50
60
70
20
10
20
12
20
14
20
16
20
18
20
20
20
22
20
24
20
26
20
28
20
30
mm
tpa
Exports Captive Power
Residential and Industrial Domestic Power
4
• Local coal supply is expected to level off within
the medium term. It is just a question of at what
level will it level off.
• The latest official coal development plan
indicates local production might top out at close
to 70 million tonnes a year.
• Private consultancies such as The Lantau
Group take a more conservative view and we
forecast domestic coal production reaching 65
million tonnes by 2030.
• Most recoverable coal reserves lend themselves
to open cast mining, with limited underground
mining. There comes a limit to the number of
opencast mines a certain land area can
accommodate.
• We expected exports to be slowly clawed back
as domestic demand grows.
• This raises upward pressure on domestic coal
prices which have historically been cross
subsidized by more expensive exports.
Source: TLG

The Lantau Group
In order to replicate the PDP results, we had to “force-build” units
• Overall demand reaches a very substantial 695 TWh in 2030 (versus 442TWh in our projection)
• Domestic coal levels out after 2020 (similar to TLG forecast).
• Renewables mainly wind make a growing presence rising to 5 percent of generation (similar to TLG forecast).
• Hydro rises to 10 percent of power produced (similar to TLG forecast)
• Gas fired generation gets squeezed out by other plants especially nuclear and coal
• LNG is forced in starting in 2018, a few years later than in the PDP as no construction work has started.
• Nuclear contributes 10 percent of generation by 2030 (versus zero in TLG projections)
• Imports of power direct from China grows in the PDP forecast (versus flat outlook in TLG forecast)
• Imported coal accounts for almost half of generation by 2030 (versus 25 percent in TLG forecast).
• Competition from other types of generation and assumed LNG use results in lower demand for domestic gas (relative to the TLG forecast).
5
0
100,000
200,000
300,000
400,000
500,000
600,000
700,000
800,000
2010 2012 2014 2016 2018 2020 2022 2024 2026 2028 2030
GW
h
Domestic Coal Renewables Hydro
Gas LNG Nuclear
Fuel_Oil Import Imported Coal
Source: TLG

The Lantau Group
Vietnam Coal Demand: an array of planned coal-fired power plant
6
Existing Capacity
Hanoi
Ho Chi Minh City
Mixture of
domestic
and
imported
coal
Mostly
domestic coal
until 2020
then imported
coal new build
as well
Coal-fired generation capacity: Existing and Planned
Source: PDP 7 revised and TLG
New build located in North Vietnam will be met by local supply until about 2020 when imports may be needed
New build in South Vietnam needs to use import coal due to lack of local coal supply and as it is uneconomic to
transport domestic coal from the north
Imported
coal only
0
10,000
20,000
30,000
40,000
50,000
60,000
70,000
80,000
2010 2012 2014 2016 2018 2020 2022 2024 2026 2028 2030
MW
Existing domestic coal Domestic coal new build
Imported coal new build

The Lantau Group
Agenda / Content
Coal Markets
- Domestic supply and demand – coal imports?
- Asian coal markets
- Indonesia – key regional supplier
- Coal and transport pricing
Natural Gas Markets
Case study: Gas development in Vietnam
7

The Lantau Group
Asia coal markets: Demand
China
• China is the world’s largest coal importer, both in terms of thermal and coking coal
• China’s power demand growth is expected to continue for the few decades to come
• Coal-fired generation will remain its dominant role in China’s generation fuel mix
• Domestic production characteristic of declining energy content and inland rail infrastructure bottlenecks are expected not to be able to meet growth in coastal power demand.
8
World’s top thermal coal import countries 2011 and 2012 (e)
137
120
98 97
27 39
218
132 123
94
40 36
0
50
100
150
200
250
China Japan India South Korea UK Germany
2011
2012 (e )
Source: IEA Coal Information 2013

The Lantau Group
Asia Coal Markets: Demand - Continued
Japan
• Japan is the world’s second largest thermal coal importer, surpassed by China in 2011
• Japan’s power demand is expected to be flat on the back of matured economy, declining population and energy demand management efforts.
• Fukushima disaster is expected to change the landscape of Japan’s energy supply from the June 2010 Revised Basic Energy Plan, which plans for nuclear to account for more than 50% of total power generation as both baseload and zero emission technology.
• New Basic Energy Plan is under drafting and its release is expected in Summer 2012, it is widely anticipated that nuclear will assume a much less important role due to safety considerations
• Renewables are anticipated to fill in the gap in the long run, whilst gas and coal will be utilized in the interim.
South Korea
• South Korea is the world’s fourth largest thermal coal importer, behind China, Japan and India
• S. Korea’s power demand growth and energy intensity are expected to fall as its economy matures and shifts towards lighter, high-tech manufacturing and service sectors
• Coal-fired power generation is expected to increase in the medium term through brownfield expansions in coal units according to the government’s 5th Basic Plan for Long Term Electricity Supply and Demand
• However in the long run, renewables and nuclear will assume a more important role in power generation whilst that of coal’s remains stable
9

The Lantau Group
China: the world’s leading steam coal producer and importer
10
Source: China Custom
China Steam Coal Export and Import Volume 2004-2013
• China’s the world’s largest thermal coal producer
• China flips to become a net coal importer in 2009, and supplanted Japan as the world’s largest coal importer in 2011
Source: IEA Coal Information 2013
2012 Steam coal production by country
3,039
782
504
440
258
201
200
108
58
68
0 1,000 2,000 3,000 4,000
PR China
United States
India
Indonesia
South Africa
Russian Federation
Australia
Kazakhstan
Colombia
Poland -69
-48
-25
-6 -8
70
120
166
227
109
-100
-50
0
50
100
150
200
250
300
2004 2005 2006 2007 2008 2009 2010 2011 2012 2013
Million Ton
Import Net Import Export

The Lantau Group
2013
CAGR %
2011-13
Others 6% 49%
US 3% 31%
South Africa 5% 17%
Russian Federation 10% 60%
North Korea 6% 22%
Mongolia 6% -7%
Vietnam 5% -23%
Australia 33% 65%
Indonesia 25% 3%
0
50
100
150
200
250
300
2011 2012 2013
Million Ton
182
234
267
China’s coal trading partners
11
• Indonesia, Australia and Vietnam are China’s main sources of coal supply
• Imports from Vietnam and Mongolia are falling, from Indonesia is levelling whilst that from RoW such as Australia,
South Africa, Russia and USA have increased markedly to fuel China’s growing energy demand and industrialization
China total coal import 2011-2013
(Including coking and steam coal)

The Lantau Group
Asia Coal Markets: Supply
Australia
• World’s largest coal exporter, second in thermal coal export
• Existing infrastructure is expected to experience significant improvement with the completion of multiple large-scale port and rail capacity expansion projects
• Supply is expected to grow strongly in the medium term (2014-2016) with an array of significant thermal coal projects coming online in less developed Surat and Galilee basins of Queensland
• Carbon tax burden: A$25.4/tonne carbon tax and Mineral Resources Rent Tax
Indonesia
• World’s largest thermal coal exporter, supplies a majority of coal production in the seaborne export market
• Lowest cost of production among major coal exporters but coal is lower quality medium-low rank coal
• However, future production faces challenges such as:
i) Declining energy content of export coal as higher rank coal becomes exploited; and
ii) Tightening government regulation to constrain coal export and set minimum price levels
iii) Increasing transport costs as railway links are required to develop inland coal resources
12

The Lantau Group
Australia: Supply to grow strongly with an array of mega projects coming online
in Surat and Galilee basins
13
List of Post-2015 Mega Thermal Coal Projects
Company Project Capacity (Mtpa)
Xstrata Wandoan 30
GVK Group; Hancock Alpha 27.6
China First Waratah Coal Inc 28
GVK Group Kevin's Corner 21.7
Meijin Energy China Stone ~30
Australia’s total coal production capacity expansion
However, the deliverability of expanded thermal coal production capacity depends on commensurate capacity
expansions in railway networks and port facilities
0
20
40
60
80
100
120
140
160
180
2011 2012 2013 2014 2015
Million Ton Expansion
New

The Lantau Group
Australia: Significant infrastructure debottlenecking with of multiple large-scale
port and rail capacity expansion projects
14 Hunter Valley Network on the east coast of Australia
RailConnectivity
Expected
Completion
GAP
Goonyella to Abbot Point Expansion
'Nothern Missing Link'
connects Bowen Basin to
expanding Port of Abbot Point
2011
Surat Basin Rail
Southern Missing Link'
connects Surat Basin to the
Port of Gladstone
2015
Hunter Valley Coal Chain (HVCC)
Connects coal mines in the
Ulan, Central Coast and
Gunnedah basin of NSW
HVCC 1 Narrrabri--Muswellbrook 2012 Q3 - 2016 Q1
HVCC 2 Muswellbrook-Ulan 2015 Q3-2017 Q1
HVCC 3 Muswellbrook--Hexham 2017
HVCC 4 GAP--Narrabri (RIC) 2017
Ports and Railway expansions to align capacity with that of projects
Source: Australian Rail Track Corporation (ARTC)
Source: Port Authorities and company reports
Port Region
Additional
Capacity (Mt)
Estimated
Completion
Abbot Point Coal Terminal Queensland 110 2016
Hay Point Coal Terminal Queensland 31 2014
Wiggins Island Coal Terminal Queensland 27 2015
Dudgeon Point Coal Terminal Queensland 150 2016
Fitzroy Terminal Queensland 22 2015
New Castle Coal Infrastructure Group New South Wales 36 2016
Port Waratah Coal Services New South Wales 120 2017

The Lantau Group
Agenda / Content
Coal Markets
- Domestic supply and demand – coal imports?
- Asian coal markets
- Indonesia – key regional supplier
- Coal and transport pricing
Natural Gas Markets
Case study: Gas development in Vietnam
15

The Lantau Group
Indonesia – Key global and regional supplier
16
World’s Top Thermal Coal Exporting Nations 2012(e)
Source: IEA Coal Information 2013
• Indonesia is the world’s largest thermal coal exporter, exporting around 380Mt in 2012
• Indonesia supplies the largest portion of seaborne thermal coal in Pacific basin, at around 55%
Thermal Export into Pacific Basin 2012
380
159
116
82
74
51
- 100 200 300 400
Indonesia
Australia
Russia
Colombia
South Africa
US
Million Tonne Canada
1% USA 2%
S Africa 8%
Colombia 1%
Russia 7%
Australia 26%
Indonesia 55%

The Lantau Group
Indonesia Coal Resource and Reserve
17
• The majority of indonesia’s coal resources is medium to low rank in calorific value
• This fits with the needs of coal-fired electricity generation facilities (5100-6100 kcal/kg ADB) to fuel
Indonesia’s growing energy demand
Grade: kcal.kg ADB
Source: Geology Agency – Ministry of Energy and Mineral Resources,
0
20
40
60
80
100
120
Resource Reserve
Low <5,100
Medium 5,100-6,100
High 6,100-7,100
Very High > 7,100
21
Million Tons
105
As of November 2011

The Lantau Group
Indonesia coal export by destination countries
18
Asian countries account for over 95% of Indonesia’s seaborne thermal coal export, and it is increasing
0
50,000
100,000
150,000
200,000
250,000
300,000
350,000
400,000
2005 2006 2007 2008 2009 2010 2011 2012
Million Tonne % Total 2005-12
CAGR
Others 4% -4%
Philippines 3% 12%
Hong Kong 3% 3%
Thailand 3% 11%
Malaysia 4% 6%
Taiwan 7% 5%
Japan 9% 8%
Korea, Republic 11% 18%
China 30% 75%
India 25% 35%

The Lantau Group
Indonesia Supply and Demand Balance 2000-2025
19
Source: BPS Statistics of India, Indonesia Coal Mining Association forecast • Indonesia exports a majority of its coal production
• The proportion of export supply is projected to fall due to increasing energy demand at home
Source: Ministry of Energy and Mineral Resources
11% 16% 16%
10% 18%
30%
14% 17%
4% 5%
31%
-3%
-6% -9%
-20%
0%
20%
40%
60%
80%
100%
-100
0
100
200
300
400
500
2000 2001 2002 2003 2004 2005 2006 2007 2008 2009 2010 2011 2015 2020 2025
Million Tonne
Net export Domestic Consumption Export % Change
Forecast

The Lantau Group
Indonesia Coal Mining Regulations
DMO Domestic Market Obligation
• In order to ensure sufficient coal supply for domestic coal consumption, Indonesia government
introduced in 2009 under the new mining law, the Domestic Market Obligation (“DMO”) requiring
mining companies to sell a proportion of their production to the local market
• DMO is determined on an annual basis and a list of DMO for each company is published by the
Ministry of Energy and Mineral Resources
• In 2014, DMO is set at 95.55Mt, estimated at around 25% of total production
Benchmark Price Regulation
• Under the Ministerial Regulation 17/2010, guidelines are provided to determine the minimum selling
price of coal into both domestic and export markets
• The minimum benchmark price is determined on a monthly basis using the average of a combination
of domestic and international price indexes, namely Argus Indonesia Coal Index (ICI), Platts,
Newcastle Export Index and Newcastle globalCOAL Index
• This works to align domestic coal prices to prevailing international price levels and boost government’s
royalty income as this forms the price basis at which royalties are collected
20

The Lantau Group
Agenda / Content
Natural Gas Markets
Coal Markets
- Domestic supply and demand – coal imports?
- Asian coal markets
- Indonesia – key regional supplier
- Coal and transport pricing
Case study: Gas development in Vietnam
21

The Lantau Group
Coal Contracting and Pricing: Summary
• In Pacific basin, the majority of seaborne trade is settled through term contracts with the
balance made up by spot market purchases
The annual Japan-Australia term contract negotiation in March-April sets the reference price for
utilities in Japan and other Asian countries to follow
Taiwan and South Korea typically procure a larger proportion of coal on the spot market
• The long term trend has been moving from long term contracts to the spot market
The increasingly competitive electricity supplier market, the volatility of major reference index and
the inflexibility of traditional procurement arrangements are drivers behind the trend of larger spot
market purchases
Three major spot market price references in Indo Pacific region are Australia Newcastle FOB,
Indonesia Kalimantan and South Africa Richards Bay
• Procurement Strategies
Strike balance between supply stability and economic purchasing
Diversification of sources in terms of supplier and country of origin
22

The Lantau Group
In Pacific basin, the price tone for the year is set by March/April Australian-
Japanese annual term contract settlement
The first contract price starting Japanese Financial Year (1st April) agreed between Xstrata(the world’s
largest thermal coal exporter) and JPU serves as price indicator across Pacific Basin
23
Historical Xstrata-JPU Annual Term Contract Reference Price
2004-2014 • Since 1998, Japanese Power Utilities
(“JPU”) have negotiated individually
based on reference prices instead of
benchmark prices, a system under
which coal prices were negotiated
between the elected JPU and
representative of Australian producers
• Australian-Japanese term contracts
are settled four times a year with the
largest volume settled in March/April,
accounting for 70% of the total annual
imports, followed by deliveries starting
in October accounting for about 20%,
and the rest is divided among July and
January negotiations and spot
purchases Source: Xstrata financial reports
45
53.75 52.5 55.65
125
70-72
97.75
129.85
115.25
95 87.4
0
20
40
60
80
100
120
140
2004 2005 2006 2007 2008 2009 2010 2011 2012 2013 2014
USD/mt

The Lantau Group
International coal price forecast
Coal prices are likely to see only a slow recovery from current lows in the short term as suppliers respond to low prices by delaying capacity expansions. In the medium term the coal price is expected to trend down before market adjusts back to balance post 2020-2025 period.
Demand side:
• Chinese demand for coal is likely to rise due to underlying economic expansion however the growth is likely to be subdued - China needs to invests in infrastructure that enables domestic coal transportation.
• The level of fuel switching away from gas to coal in power generation Europe witnessed in Spain and UK is unlikely to continue further due to environmental concerns
• India has strong demand for import thermal coal, however, price sensitivity will likely keep pressure on prices.
Supply side:
• There are plentiful supplies from Indonesia, Australia and US on the horizon.
• Major infrastructure debottlenecking projects and brownfield expansion projects in Australia are coming on line.
• US continues to switch to gas due to the attractive gas price relative to coal. The US exports excess coal abroad.
24
0.0
20.0
40.0
60.0
80.0
100.0
120.0
140.0
20
10
20
11
20
12
20
13
20
14
20
15
20
16
20
17
20
18
20
19
20
20
20
21
20
22
20
23
20
24
20
25
20
26
20
27
20
28
20
29
20
30
USD
to
nn
e (
real
20
14
)
Low case Base case High case Historic

The Lantau Group
Domestic coal price forecast
• We forecast that the domestic coal price will
gradually rise.
• Imports of coal are set to be reduced to meet
local demand in power.
• In order for Vincomin to remain viable the
artificially low domestic coal prices will have to
rise to compensate for a reduction in volumes
of higher priced exports.
25
0.0
10.0
20.0
30.0
40.0
50.0
60.0
20
10
20
11
20
12
20
13
20
14
20
15
20
16
20
17
20
18
20
19
20
20
20
21
20
22
20
23
20
24
20
25
20
26
20
27
20
28
20
29
20
30
USD
to
nn
e (
real
20
14
)
Coal Price USD tonne (real 2014)

The Lantau Group
In Pacific basin, the majority of seaborne trade is settled through term contracts
with the balance made up by spot market purchases
• Japan, South Korea and Taiwan import
100% of thermal coal requirement
• Procurement strategy gravitates towards
supply security and a diverse supply
portfolio is maintained
• JPUs are the most conservative and
procure almost 95% of its coal imports
from term contract.
• This is however a significant
improvement from the non-existence of
spot procurement before 1996, the
liberalization of Japan’s electricity market
• Power utilities in South Korea and
Taipower acquire larger portion of coal
imports on the seaborne spot market
26
0
20
40
60
80
100
120
Japan Korea Taiwan
Term
Spot
Million Metric Ton
95%
5%
79%
21%
77%
23%
101.2
87.5
36.3
Source: Company presentations, custom data, TLG Analysis
Major thermal coal importing nations 2011 import
split by term contract/spot purchases
Import dependent Japan, Korea and Taiwan acquire a majority of thermal coal requirements from term
contracts and maintain a diverse supply portfolio in terms of countries and supplier companies

The Lantau Group
The long term trend has been moving from long term contracts to the spot
market
Traditional take-or-pay contracts worked
well during times of stable coal prices but
not in current volatile markets
• Spot market prices are particularly
volatile around the time of annual
term contract negotiation, making the
process long and difficult
• For the past two years, spot market
prices have been consistently below
that of fixed contract price, making
prices uncompetitive for term contract
buyers
• Fixed-price coal deliveries are not
always secure. Regular delays are
experienced during times when spot
market prices rise above contract
prices
27
Source: Xstrata financial reports, World Bank Commodity Prices
Price comparison between annual term contract and
spot market 2004-2014
Therefore, short term contracts and spot market purchases are increasingly used to complement long-
term contracts for better procurement flexibility and cost competitiveness.
0
20
40
60
80
100
120
140
160
180
200USD/mt
Japan-Australia Annual Term Contract Newcastle FOB

The Lantau Group
Procurement strategies: the need to balance between stable supply and
economic purchasing
28
High costs
• Diversification of coal import sources
- Taipower applies supply limits of
i) Country 35% supplier 15% to term
contracts
ii) China: 30% for both term and spot
• Coordination among Gencos
- Korea power utilities cargo swaps
• Enhancing relationship with suppliers
• Investment in overseas coal mine
- Secure off-take contract
- Taipower holds 10% interest in Bengalla
coal mine in Australia
Stable Supply
High costs • Diversify pricing policy
- Development of index-linked, option
embedded pricing mechanism
• Competitive bidding
- Taipower’s coal tender
• Increase low rank coal blending
• Securing more dedicated vessels for
distant sourcing
- Shipment of Taipower-owned coal vessels
reaches 30%
Unified coal procurement and
negotiation
- In 2009, 5 Korea Gencos formed fuel
procurement union for 2.6Mt Chinese coal
Economic purchasing

The Lantau Group
Major Spot Market Reference Prices
• Spot market price indexes are
influential in their respective parts
of coal importing countries
• Newcastle FOB price is commonly
used as reference price for coal
imports in Japan and South Korea
• Richards Bay FOB is commonly
used as reference price coal
imports in India
• Indonesia Kalimantan coal prices
are commonly used as reference
price for coal imports in China and
Southeast Asian countries such as
Philippines
29
Source: McCloskey, Indonesian Government
0
20
40
60
80
100
120
140
160
180
200 USD/Tonne
Newcastle FOB
Richards Bay FOB
Indonesian Envirocoal

The Lantau Group
Indonesian coal is priced with reference to government’s monthly pricing guideline
• Indonesia government introduced
Indonesian Coal Price Reference
(HPB) for 8 brands of coal of varying
quality to align domestic coal prices to
international levels
• HPB is arrived at by adjusting differing
coal quality to a general price
reference (HBA). HBA is linked to both
domestic and global prices,
determined using a formula based on
Indonesia Coal Index (ICI), Platts-1,
Newcastle Export Index(NEX), and
globalCOAL Newcastle Coal Index
• HBA and HPB are published monthly
• Price for term contract is the average
HBA over the past three months and is
fixed over a 12-month period,
preventing Indonesian coal discount by
setting an effective floor price
30
Calorific Value
(kcal.kg GAR)
Moisture
(%, ar)
Sulphur
(%, ar)Ash (%, ar)
Gunung Bayan I 7,000 10 1 15
Prima Coal 6,700 12 0.6 5
Pinang 6150 6,200 14.5 0.6 5.5
Indominco IM_East 5,700 17.5 1.6 4.8
Melawan Coal 5,400 22.5 0.4 5
Envirocoal 5,000 26 0.1 1.2
Jorong J-1 4,400 32 0.3 4.2
Ecocoal 4,200 35 0.2 3.9
Typical Quality
Brand
Harga Patokan Batubara (HPB)
Harga Batubara Acuan (HBA) on the basis of 6,322kcal/kg,
TM of 8%, TS of 8%, 15% ash FOB vessel
HBA=25%ICI1+25%Platts59+25%NEX+25%globalC
OAL NEWC Index
Source: Directorate General of Mineral, Coal and Geothermal at
The Ministry of Energy and Mineral Resources

The Lantau Group
Ocean freight rates
Representative freight rates for major coal import routes
Ocean freight rates estimated between potential coal export and Vietnam
31
Source: Clarkson
Source: TLG Analysis
Freight rates will be the cheapest for Vietnam to import from Indonesia due to the geographical
proximity, followed by Russia and Australia
USD/Metric Ton 2011 2012 2013
Newcastle-> Japan
Panamax $17.13 $14.76 $15.09
Indonesia -> India
Panamax $10.20 $9.33 $9.91
Richards Bay ->Amsterdam-Rotterdam-Antwerp
(ARA) Capesize $10.78 $8.00 $9.12
Queensland -> Japan
Capesize $10.33 $8.82 $10.14
Panamax USD/Metric Ton
Indonesia -> Vietnam $4.89
Russia -> Vietnam $11.47
Queensland-Vietnam $13.48
Newcastle -> Vietnam $15.34

The Lantau Group
Dry bulk freight rates: historical trend and outlook
• In 2013, freight rates slowly
recovered from 2012 lows on the
back of steadily improving global
economy
• In the short term, freight rates will
continue to be weighted down by
oversupply caused by large amount
of new vessels on the order book
• Oversupply will moderate post 2015,
when increase in trade volumes and
old vessel scrapping drive market
back to balance
• Meaningful increases will be
registered when demand starts to
overtake the slowing vessel tonnage
growth, driven by growing coal
demand in China and India,
improving harvests in Latin America
and a recovery in minor bulk trade
32
Source: Baltic Exchange
0
2,000
4,000
6,000
8,000
10,000
12,000
14,000
Baltic Dry Index

The Lantau Group
Agenda / Content
Coal Markets
Natural Gas Markets
- Domestic supply and demand
- LNG regasification development
- Global LNG supply and demand
- LNG pricing – new dynamics led by disruptive influence of US LNG
- Impact of shale gas
- Domestic gas pricing – marginal cost versus rolled-in
Case study: Gas development in Vietnam
33

The Lantau Group
Vietnam natural gas supply: reserve and gas fields
34
Source: PVN, PVGAS
Note that in Vietnam as a whole PVN and PVGas
figures indicate 12.6 Tcf of proven reserves, and
24.4 Tcf of resources.
To upgrade resources to reserves requires
exploration and appraisal drilling.
Moreover it requires the expectation of receiving a
fair to generous return on risky expenditure – the
E&P companies of course may make uncommercial
discoveries or hit dry wells.
Tcf
Total proved reserves 12.6
Cuu Long Basin 3.5
Nam Con Son Basin 6.6
Malay-Tho Chu Basin 4.8
Song Hong Basin 9.6
Total potential resources 24.4
Total reserves and unrisked resources 37.0
Source: PVN, PVGAS

The Lantau Group
Official Vietnam natural gas southern supply and demand balance
35
Source: EVN, Vietnam PDP VII (2011)
• Through to 2025 this amounts to 6
Tcf of gas, but proven reserves,
which we expect will mostly be
located in the south, are already
double this figure.
• With some correct price signals
some of the 24.4 Tcf of resources
should be able with some
exploration and appraisal to be
firmed up to probable or possible
reserves.
• This gas could then close the
demand supply gap. -2,000
-1,500
-1,000
-500
0
500
1,000
1,500
2,000
2,500
mm
cfd
Cuu Long Nam Con Son Malay
"Unmet Demand" Demand

The Lantau Group
Southern Vietnam natural gas supply: pipelines
Vietnam has three gas pipelines connecting offshore fields in the south with power
plants and onshore gas distribution systems.
• The key pipeline is the 250-mile Nam Con Son pipeline, which accounts for a majority of Vietnam's
gas supply and has a capacity of 700 mmcfd.
• The Bach Ho pipeline, with a capacity of 200 mmcfd, transmits associated gas from fields in the
Cuu Long basin which are mostly associated gas.
• The third pipeline (200 mmcfd of capacity) runs from the PM3 Commercial Arrangement Area to the
Ca Mau combined-cycle power plant and fertiliser plant.
36
A second Nam Con Son
pipeline, with a capacity of 600
mmcfd is nearing development
and slated for completion by
2017. PV Gas is at the FEED
phase.
The Block B&52 to O Mon
Pipeline with 600 mmcfd
capacity is uncertain although
and EPC contract has been
inked. But it is intended to
connect offshore blocks in the
north Malay Basin (that
Chevron is exiting) to the
existing Ca Mau and the
planned O Mon power plants.
Existing
Planned

The Lantau Group
PDP generation
• Overall demand reaches a very substantial 695 TWh in 2030 (versus 442TWh in our projection).
• Domestic coal levels out after 2020 (similar to TLG forecast).
• Renewables mainly wind make a growing presence rising to 5 percent of generation (similar to TLG forecast).
• Hydro rises to 10 percent of power produced (similar to TLG forecast).
• Gas fired generation gets squeezed out by other plants especially nuclear and coal.
• LNG is forced in starting in 2018, a few years later than in the PDP as no construction work has started yet on terminals.
• Nuclear contributes 10 percent of generation by 2030 (versus zero in TLG projections).
• Imports of power direct from China grows in the PDP forecast (versus flat outlook in TLG forecast).
• Imported coal accounts for almost half of generation by 2030 (versus 25 percent in TLG forecast).
• Competition from other types of generation and assumed LNG use results in lower demand for domestic gas (relative to the TLG forecast).
37
0
100,000
200,000
300,000
400,000
500,000
600,000
700,000
800,000
2010 2012 2014 2016 2018 2020 2022 2024 2026 2028 2030
GW
h
Domestic Coal Renewables Hydro
Gas LNG Nuclear
Fuel_Oil Import Imported Coal

The Lantau Group
PDP gas demand forecast
• Demand for piped gas is hampered by
forcing in LNG from 2018 onwards.
• The rise in generation from imported coal
in particular hampers growth in domestic
gas into power.
• There is no need for any gas in the
central area from new offshore
discoveries as imported coal-fired
generation is less expensive.
• There is some demand for gas in the
north as we see some demand in the
industrial sector.
38
0
200
400
600
800
1,000
1,200
1,400
1,600
1,800
2010 2012 2014 2016 2018 2020 2022 2024 2026 2028 2030
bb
tud
CuuLong_Contracted NamConSon_Contracted
Southwest_Contracted CuuLong_Uncontracted
NamConSon_Uncontracted North_Uncontracted
LNG

The Lantau Group
We see three fundamental flaws in the PDP
39
• The load growth forecast is wildly optimistic
• Capacity expansion plan (at least implicitly) uses LNG to meet incremental load
growth – but LNG is not economic relative to alternative resources (and also
assumes nuclear development starting in 2020)
• Ability to pass on LNG costs to consumers appears dubious – and certainly does
not justify use of LNG for baseload power

The Lantau Group
Balancing supply and demand is a dark art
– forecasts often look a lot like wild guesses when viewed with hindsight
40
0
100
200
300
400
500
600
700
800
19641967
19701973
19761979
19821985
19881991
19941997
0
1
2
3
4
5
6
7
8
9
1975
1978
1981
1984
1987
1990
1993
1996
1999
2002
2005
2008
74 75 76
77 78
80 81 82 84
79
83
TH
OU
SA
ND
S O
F M
EG
AW
AT
TS
Source: Client Confidential
ACTUAL (64 - 74) = 7.2% p.a.
PROJECTED
Actual Annual
Growth rate (%)
PROJECTING 10 YEARS
1974 - 7.6%
1975 - 6.9%
1976 - 6.4%
1977 - 5.7%
1978 - 5.2%
1979 - 4.7%
1980 - 4.0%
1981 - 3.4%
1982 - 3.0%
1983 - 2.8%
1984 - 2.5%
85 86
87
88
89
91 92
93 95/96
97
90 94
Source: North American Electric Reliability Council, Electric Power
Supply & Demand 1984, p.5
Asian Country USA
ACTUAL (75 - 85) = 10.1% p.a.
Warren Buffet: “Forecasts tell you little about the future, but a lot about the forecaster”

The Lantau Group
Vietnam projects much higher load than Thailand, despite much lower GDP
41
0
1,000
2,000
3,000
4,000
5,000
6,000
2000 2004 2008 2012 2016 2020 2024 2028
GDP per capita(Constant USD 2000)
KWh per capita
Vietnam Thailand
0
1,000
2,000
3,000
4,000
5,000
6,000
2000 2004 2008 2012 2016 2020 2024 2028
GDP per capita(Constant USD 2000)
KWh per capita
PDP Low Forecast

The Lantau Group
Our TLG forecast reduces the load growth rate substantially
• The low PDP generation forecast
looks way over-ambitious compared
to economic growth
• We have assumed the same
underlying GDP growth rate (6.5%
average annual expansion the
economy to 2030) as assumed for
the low PDP forecast
• We have assumed an average
elasticity of power generation
growth to economic growth of 1.2
times through to 2030 (versus an
average of 1.6 times for the low
PDP forecast) – and we feel even
this assumption is aggressive.
42
0
1,000
2,000
3,000
4,000
5,000
6,000
2000 2004 2008 2012 2016 2020 2024 2028
GDP per capita(Constant USD 2000)
KWh per capita
PDP Low
Forecast
TLG
Forecast

The Lantau Group
Gas prices will be limited by the competition between coal and gas economics
• State-of-the-art technology and coal fired
plant
• Plant competing for base load with average
capacity factor of 85 percent
• Use the economics of the new build coal
plant to determine the competing price for
delivered gas
• This would be gas delivered to a new build
combined cycle gas turbine
• Should be willing to pay up to USD 8 per
mmbtu delivered for gas.
• This indicates a range of USD 6.25 to 6.50
per mmbtu upstream.
43
Plant Type Gas CCGT Coal Greenfield
State of Art
Plant Details and Capital Cost
Generic USD/kW 800 1,600
Economic Life (years) 25 30
Capacity Factor (%) 85 85
Fixed Cost
Capex (USD/MWh) 15 32.2
Fixed O&M per MWh 2 3.4
Fixed (USD/MWh) 17 36
Fuel Costs Gas Coal
Gross Fuel Cost (HHV) (USD/mmbtu) 8.00 3.65
Heat Rate (mmbtu/MWh) 6.7 9.0
Variable Costs
Variable O&M per MWh 2 4
Fuel per MWh 54 34
Variable (USD/MWh) 56 38
LRMC (USD/MWh) 73 73

The Lantau Group
TLG generation forecast
44
Generation by fuel • Domestic coal generation levels out after 2020 due to plateau in local supplies.
• Renewables mainly wind show steady growth but will need to sort out feed in tariffs.
• Hydro is an important source of generation but shortage of new sites hampers growth after 2020
• Generation from gas fired plants rises despite, in some cases, being slightly higher cost than power from imported coal, due to siting problems for coal fired plant. We imposed some constraints on new build imported coal to let in more gas.
• LNG arrives at the end of the horizon to supplement local gas.
• There is some fuel oil and diesel needed for peaking.
• Large rise in generation from imported coal starting in 2018 and rising to account for 25 percent of total by 2030 (versus 50 percent in PDP).
0
50,000
100,000
150,000
200,000
250,000
300,000
350,000
400,000
450,000
500,000
2010 2012 2014 2016 2018 2020 2022 2024 2026 2028 2030
GW
h
Domestic Coal Renewables Hydro
Gas LNG Fuel_Oil
Diesel Import Imported Coal

The Lantau Group
TLG gas balance
• Southwest contracted rises by 2018 reflecting the rise in supplies from block B&52, which although not contracted we view as committed.
• Cuu Long uncontracted is needed to back fill the existing pipeline by 2014 and later on gets access to market via a T-in to the Nam Con Son 2 pipeline.
• Nam Con Son uncontracted gas can only get into market once the Nam Con Son 2 pipeline is completed, we estimate commissioning in 2017.
• Southern yet to find gas is not needed until 2017 from associated and inexpensive gas in the Cuu Long basin and by 2021 from the more expensive generally non-associated gas in the Nam Con Son basin.
• We force in Central uncontracted gas by limited new build generic imported coal fired plant in that region due to siting problems.
• North uncontracted gas goes to industry not power due to the large amount of new build coal fired plant in that area.
45
0
500
1,000
1,500
2,000
2,500
2010 2012 2014 2016 2018 2020 2022 2024 2026 2028 2030
bb
tud
CuuLong_Contracted NamConSon_Contracted
Southwest_Contracted CuuLong_Uncontracted
NamConSon_Uncontracted Southwest_Uncontracted
Central_Uncontracted North_Uncontracted
CuuLong_YetToFind NamConSon_YetToFind
Southwest_YetToFind LNG

The Lantau Group
Agenda / Content
Coal Markets
Natural Gas Markets
- Domestic supply and demand
- LNG regasification development
- Global LNG supply and demand
- LNG pricing – new dynamics led by disruptive influence of US LNG
- Domestic gas pricing – marginal cost versus rolled-in
Case study: Gas development in Vietnam
46
The Lantau Group
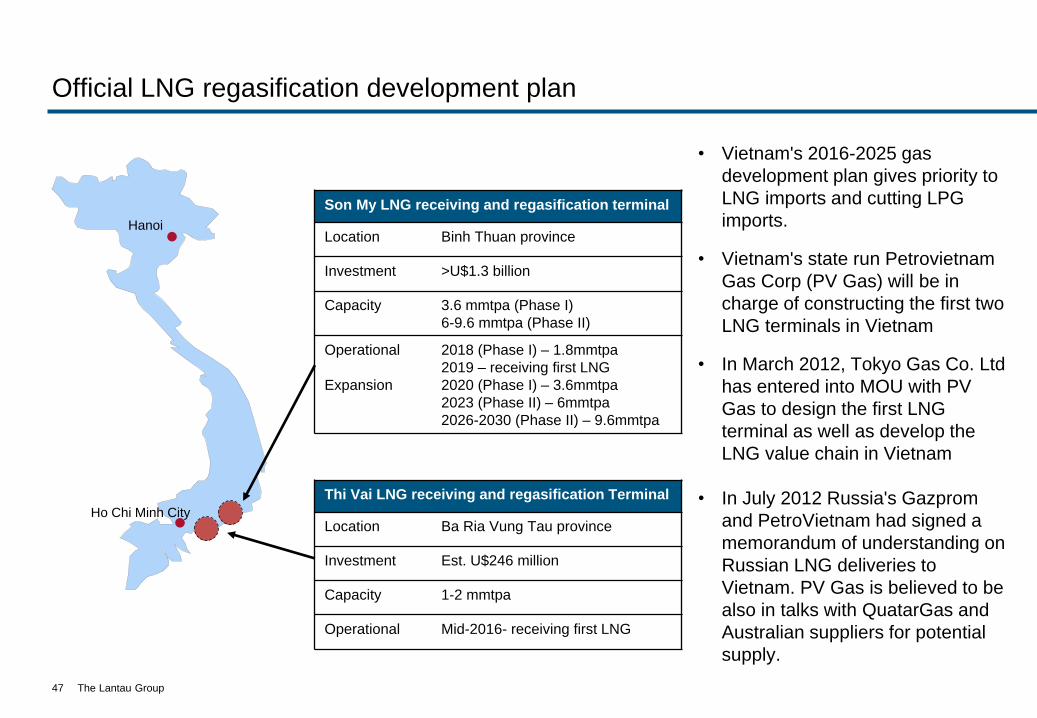
Official LNG regasification development plan
• Vietnam's 2016-2025 gas
development plan gives priority to
LNG imports and cutting LPG
imports.
• Vietnam's state run Petrovietnam
Gas Corp (PV Gas) will be in
charge of constructing the first two
LNG terminals in Vietnam
• In March 2012, Tokyo Gas Co. Ltd
has entered into MOU with PV
Gas to design the first LNG
terminal as well as develop the
LNG value chain in Vietnam
• In July 2012 Russia's Gazprom
and PetroVietnam had signed a
memorandum of understanding on
Russian LNG deliveries to
Vietnam. PV Gas is believed to be
also in talks with QuatarGas and
Australian suppliers for potential
supply.
47
Hanoi
Ho Chi Minh City
Son My LNG receiving and regasification terminal
Location Binh Thuan province
Investment >U$1.3 billion
Capacity 3.6 mmtpa (Phase I)
6-9.6 mmtpa (Phase II)
Operational
Expansion
2018 (Phase I) – 1.8mmtpa
2019 – receiving first LNG
2020 (Phase I) – 3.6mmtpa
2023 (Phase II) – 6mmtpa
2026-2030 (Phase II) – 9.6mmtpa
Thi Vai LNG receiving and regasification Terminal
Location Ba Ria Vung Tau province
Investment Est. U$246 million
Capacity 1-2 mmtpa
Operational Mid-2016- receiving first LNG

The Lantau Group
Comments on official LNG development plan
48
Raise domestic gas
prices first to get
more domestic
supply
• Subject to endless delays as the plan to import
of LNG has several serious short-comings
• The state power utility has trouble passing on
costs of its existing fuel costs, far less the jump
in costs that would come with large supplies of
LNG at a premium to domestic gas prices
• Ignores potential supply that could come from
offering a better price to domestic gas. But
breaking through into the high single digits far
less double digits per mmbtu has proved an
insurmountable mental hurdle, so far…...
• The global LNG suppliers will check to see if
the buyer of LNG under a long term contract
has the ability to pay for it. While PVN and PV
Gas are viable and bankable entities the same
is not so far true for the power company EVN.
This will make buying any LNG under long
term contract very difficult.
• So what to do?

The Lantau Group
Kinky gas price curves
• A kink arises at the point where there is
no more domestic gas available at the
acceptable domestic price.
Consequently, the country imports LNG to
fill the gap to meet demand. Without
access to the imported LNG price, gas
developers do not explore or develop
domestic resources to the extent that they
might otherwise. The result is foregone
value.
• Vietnam is one of the countries in Asia
with the most pronounced ‘kinky’ gas
price curve. The last non-associated gas
price contract signed was almost a
decade ago from block 11-2 for gas from
the Rong Doi field.
49
Imported LNG Price
Quantity of gas
US
D m
mbtu
Unseen
Domestic
Supply
Curve
Domestic
Gas
Price
Imported
LNG
Domestic
Gas
Foregone Value

The Lantau Group
Supply curve for domestic gas
• In this diagram we stack up uncontracted and estimates for yet to find gas by breakeven cost.
• Any gas above USD 8 mmbtu delivered, or in the range USD 6.25 to USD 6.5 mmbtu ex-platform would be displaced by less expensive generation from new build imported coal fired plants.
• There is a fairly large amount of gas that can compete with new imported coal fired plant. But also a substantial volumes of gas that would come in above the tipping delivered price of USD 8 mmbtu.
• In the PDP run none of that higher priced gas gets to market, but in the TLG run to recognize the siting constraints that some new imported coal fired plants might face, we allow in some of this higher cost gas.
50
0.0
2.0
4.0
6.0
8.0
10.0
0 500 1,000 1,500 2,000
US
D m
mb
tu
Cumulative Volume (bbtud)
Delivered gas at breakeven cost in 2020

The Lantau Group
Agenda / Content
Coal Markets
Natural Gas Markets
- Domestic supply and demand
- LNG regasification development
- Global LNG supply and demand
- LNG pricing – new dynamics led by disruptive influence of US LNG
- Domestic gas pricing – marginal cost versus rolled-in
Case study: Gas development in Vietnam
51

The Lantau Group
The gas decision in Asia is particularly complex
52
Seller’s market as Asia still
pays premium for LNG LNG supply glut with global
prices converging
Which world?
Why?
How to manage if
wrong?
Supply: US LNG export and
Australian projects are executed as
planned; shale gas production in US
continue to increase significantly
Demand: China develop their shale
gas resources and scale up
production and investment in the near
term, leading to less LNG demand
Prices: Both buyers and sellers
accept new pricing mechanism and
more LNG contracts are linked to HH,
with more contractual flexibility
Supply: US LNG export and
Australian projects are delayed
because of various challenges
Demand: Chinese LNG demand is
unexpectedly high as its domestic gas
resource (especially shale gas) are
developed very slowly; LNG demands
in new markets are unexpectedly high
Prices: Asian buyers have to pay
higher premium for LNG than other
regions
Either way, gas in Asia is likely to struggle to compete with coal in the near and medium term, without a
strong environmental agenda and robust government support

The Lantau Group
The USA, a previously anticipated major growth market for LNG imports, is
expected to become a net LNG exporter as early as 2016
53
Evolution of US Net LNG Imports Forecast by EIA
Source: US Energy Information Administration (EIA), AEO 2007-2013
2007 EIA Forecast
2008 EIA Forecast
2010 EIA Forecast
2009 EIA Forecast
2011 EIA Forecast
2013 EIA Forecast -40
-20
0
20
40
60
80
100
120 Million tons
2012 EIA Forecast

The Lantau Group
Out of the total of about 200 mmtpa of capacity applied to the DOE, 63 mmtpa
has been approved for export to non-FTA countries
54
DOE application FERC application Capacity, mmtpa Group Project Requested
volume, bcfd
FTA approved
Non-FTA application submitted
Non-FTA approved
/ DOE order
Pre-filling completed
Filing completed
Filing approved
Terminal total
Group total
Non-FTA approved Sabine Pass 1-4 2.2 18.0
62.8
Freeport 1-2 1.4 8.8
Lake Charles 2.0 15.0
Dominion Cove Point 1.0 4.6
Freeport 3 1.4 4.4
Cameron 1.7 12.0
Non-FTA pending, filed with FERC
Jordan Cove Point 1.2 1 6.0 37.9
Oregon LNG 1.3 2 9.6
Corpus Christi 2.1 3 13.5
Excelerate 1.4 4 8.8
Non-FTA pending, pre-filed with FERC
Southern 0.5 6 2.5 21.6
Gulf LNG 1.5 7 2.1
Sabine Pass 5-6 Total 0.3 12 2.0
Sabine Pass 5-6 Centrica 0.2 13 1.8
Sabine Pass 5-6 Uncommitted 0.9 pending 17 5.3
CE FLNG 1.1 8 8.0
Non-FTA pending, no FERC pre-filing
Gulf Coast 2.8 5 20.6 73.2
Golden Pass 2.6 9 15.6
Pangea 1.1 10 8.0
Main Pass 3.2 11 24.0
Venture 0.7 pending 14 5.0
Only applied for FTA license
Waller 0.2 1.3 6.8
Magnolia 0.5 4.0
Gasfin 0.2 1.5
202.3

The Lantau Group
US LNG – it’s not about the price as much as it is about the flexibility….
A NEW MODEL
US LNG buyers contract for liquefaction capacity. When they want LNG they buy it at Henry Hub
prices. Then they can take it anywhere they want – resell or for own use. Tap can be turned on
and off at will. The LNG price is not linked to oil.
55
NOT EASILY REPLICATED
This contrasts with the Western Canadian LNG projects which are more typical in that they specify
a source of gas, will build dedicated new long pipelines to get the gas to the coast, and develop
liquefaction plants and then sell the LNG. Projects have some buyer participation but at the
moment are led by traditional LNG majors and aspirants. Pricing might be oil linked or linked to
AECO (Canadian version of Henry Hub).
AROUND FOR THE LONG TERM
US domestic demand for natural gas is close to 24 Tcf/year and the nation has recoverable
resources of some 2,200 Tcf, according to EIA data. A rise in demand for gas from US transport
and petrochemicals could add some 6 Tcf to demand by the start of next decade. If all 200 mmtpa
of LNG export plants go ahead (which is unlikely) then this would require close to 10 Tcf of gas per
year. So even 40 Tcf per year of demand still gives the US some 55 years of gas in the ground.

The Lantau Group
Australia developing traditional LNG for Asia, with US LNG coming a few years
later
56
• Angola T1
• Skikda GL2K
• Arzew GL3Z
• PNG LNG
• Donngi-Senoro
• QC LNG T1
• Gorgon T1-3
• QC LNG T2
• AP LNG T1
• GLNG T1
• Petronas FLNG1
• Sengkang T1
• AP LNG T2
• GLNG T2
• Wheatstone T1-2
• MLNG T9 and Petronas FLNG2
• Sabin Pass T1-2
• Senkang T2
• Ichthys T1-2
• Prelude FLNG
• Sabine Pass T3-4
LNG liquefaction projects under construction/reached FID, 2013-2017
Source: TLG analysis
• The near term LNG
capacity will be mainly from
Atlantic basin, which used
to export LNG to Europe
and US. With the low
demand in Europe and no
demand in US, most of the
new Atlantic LNG is
expected to be directed to
Asia.
• Large amount of new
committed LNG volumes
from Australia will start to
enter the market from 2015
onwards.
• US LNG will start to export
to Asia from 2016
0
5
10
15
20
25
30
35
2013 2014 2015 2016 2017
mm
tpa
Others Australia Asia USA
The Lantau Group
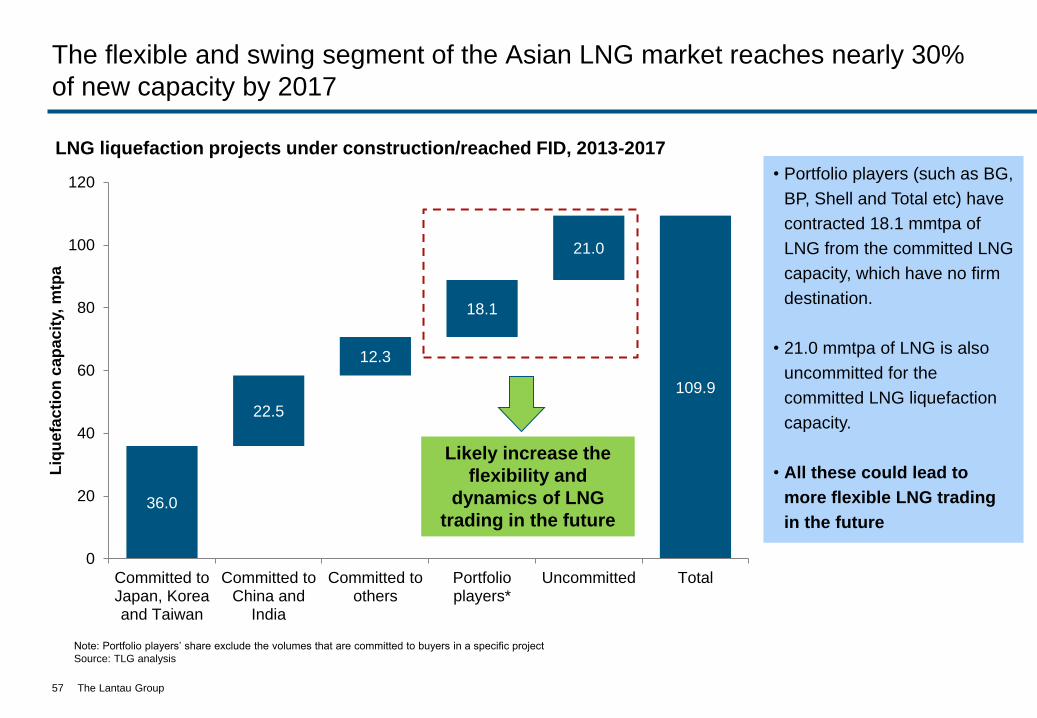
The flexible and swing segment of the Asian LNG market reaches nearly 30%
of new capacity by 2017
57
LNG liquefaction projects under construction/reached FID, 2013-2017
Note: Portfolio players’ share exclude the volumes that are committed to buyers in a specific project
Source: TLG analysis
• Portfolio players (such as BG,
BP, Shell and Total etc) have
contracted 18.1 mmtpa of
LNG from the committed LNG
capacity, which have no firm
destination.
• 21.0 mmtpa of LNG is also
uncommitted for the
committed LNG liquefaction
capacity.
• All these could lead to
more flexible LNG trading
in the future
Likely increase the
flexibility and
dynamics of LNG
trading in the future 36.0
109.9
22.5
12.3
18.1
21.0
0
20
40
60
80
100
120
Committed toJapan, Koreaand Taiwan
Committed toChina and
India
Committed toothers
Portfolioplayers*
Uncommitted Total
Liq
uefa
cti
on
cap
acit
y,
mtp
a

The Lantau Group
LNG Liquefaction Capacity, mmtpa
Under
Construction
or reach FID
(2013-2017)
Likely projects
(2018-2025)
Other
announced
projects
Australia 61.8 12 36.0
US 18 53.8 130.5
Canada 17 52.6
Africa 30 41.4
Others 14.5 15 75.5
Asia 15.7 5.8 5.5
Total 110.0 133.6 341.5
The North America LNG projects in 2018-2025 are poised to amplify the disruptive
influences of Japan (demand uncertainty) and Australia, East Africa (new supply)
58
• US LNG exports will be free on board and so be more
flexible on destination restrictions and allowing re-exports
and diversions. (Pertamina and Corpus Christi contract).
• Canadian LNG exports will be more like traditional LNG
projects with developers investing from upstream, pipelines
and liquefaction plant.
• Buyers have bought over 30% in the acreage
supporting the Mozambique LNG project, and
Pavilion Energy some of the acreage directed at
Tanzania LNG
The large volume of potential flexible Henry Hub-linked LNG from US and maybe Canada could have
disruptive force in long term LNG trading, new contract negotiation and re-negotiation of contracts.

The Lantau Group
High costs
• High labour cost with skills shortage
• Tight immigration
• Small population
• High construction materials’ costs
• Technically difficult upstream projects
• Remote locations with little existing infrastructures
Environmental
• Tight regulation (BTEX fracking chemicals banned and drilling buffers around towns)
• Strategic cropping land
• Water resource issues
Fiscal and Political
• Fiscal uncertainties
• Carbon tax
• Extended Petroleum Rent Tax
• Political uncertainties
• Domestic/Export
• JPDA – E. Timor
• Native title
While supply projects in other countries face some of these challenges, the combined impact in
Australia could delay or keep supply from coming online
But Australian projects have many challenges
59

The Lantau Group
And Australian projects are relatively expensive compared to North American
LNG export potential
60
Australian LNG projects are at the high end of the cost curve
0
2
4
6
8
10
12
14
16
US
D m
mb
tuu
Pluto Gorgon Ichthys Wheatstone GLNG QC LNG AP LNG Browse
• Browse onshore LNG plant cancelled and Woodside and Shell assessing FLNG option to bring down costs, or else just wait until new build costs fall in Australia

The Lantau Group
Japan - the more nuclear restarts, the less LNG imports require so flexibility on LNG is
key
• Half of Japan’s post Fukushima fuel response
has come from LNG and a quarter from fuel oil
and a quarter from crude oil
– Japan has turned LNG into a flexible fuel source
like oil
• For every ~10 GW of nuclear restarts LNG
import requirements fall by about 4 mmtpa
• But how much and when?
• Uncertainty requires flexibility!
61
Nuclear capacity and change in LNG
demand
-18
-16
-14
-12
-10
-8
-6
-4
-2
0
10 20 30 40
mm
tpa
GW

The Lantau Group
Japan’s renewables uptake is another story
• Avoiding higher oil and LNG import costs
makes renewables more attractive
• Japan has proceeded aggressively – having
attracted 3.5 GW of solar power to date
• There are various plans afoot to raise
renewables to close to 25 percent of
generation by 2030.
• While these have extra value due to
environmental and a fuel displacement
economics – they also require flexible system
support
• More uncertainty and more need for
flexibility!
62
Power generation by fuel type
0
200
400
600
800
1,000
1,200
2015 2020 2025 2030
TWh
Nuclear Coal Gas
Oil Biomass Wind
Geothermal Solar Hydro

The Lantau Group
With uncertainties in future fuel mix, regulation and domestic gas production, most
Asia countries are looking at LNG, but with more flexible terms
63
China and India:
• Domestic unconventional gas
production
• Scale of imports of piped gas
• Possible entry of new domestic
LNG buyers
• Rate of push for more gas in
power generation
JKT:
• Rate of nuclear restarts in
power generation
• Liberalization of gas
sectors which allow more
players to procure LNG
ASEAN:
• Need for LNG in power
generation
• Domestic gas production
could be incentivised
• Regional Hub LNG trading
There are many inherent uncertainties in the
buyers’ domestic gas sector, which could
incentive the buyers to negotiate for more
volume flexible and shorter term LNG
contracts
• LNG Demand uncertainties. In countries that
have significant domestic gas production such
as China and India, LNG demand in the long
term would depend on how successful their
unconventional gas production will be, and
also by piped gas imports.
• Liberalization of the gas sector in the
domestic buyers’ market. It is possible that
some buyers will have a more liberalized gas
and power sectors in the medium and long
term, which allow more domestic players to
procure LNG. Thus, the risks of over-
contracting could be high for the current
incumbent LNG buyers committed to a 20 or
25 years long term contract with little volume
flexibility.

The Lantau Group
Huge volume uncertainties for which emerging LNG supply infrastructure
capability is poised to assist
• Thailand could probably delay the steep rise
in LNG imports by offering a higher price for
domestic piped gas.
• Philippines might start importing limited
quantities by 2020 which would be affected by
seasonality and rate of coal build which would
require flexibility in supplies.
• Malaysia demand could be hampered by
delays in domestic gas pricing reform.
• New supplies of LNG to Singapore might
undercut the price of contracted supplies.
• All of which adds up to uncertainty which
will require flexibility.
64
0
10
20
30
40
50
60
702
01
5
202
0
202
5
203
0
mm
tpa
Thailand Indonesia Philippines
Malaysia Singapore Vietnam
LNG demand by country

The Lantau Group
New markets for LNG can even take higher LNG prices if necessary – the key
is flexibility and lower volumes
• Indonesia
– There is about 2,000 MW of effective diesel-
fired power plants outside the island of Java.
– These consumer the diesel equivalent of over
3 mmtpa of LNG
– If only the infrastructure could serve them, the
savings against diesel would likely pay for
smaller scale and break-bulking type operations
• Philippines
– The Philippines has 3,000 MW of on-grid diesel
and fuel oil power stations
– Furthermore, off-grid and micro-grid capacity
exists given the isolated nature of some regions
– These oil-fired plants consume the equivalent of
nearly 1 mmtpa of LNG.
65
M I N D A N A O
L U Z O N
V I S A Y A S
MINDANAO
LUZON

The Lantau Group
Global LNG demand supply balance
66
Global LNG demand Global LNG supply
0
50
100
150
200
250
300
350
400
450
500
2010 2012 2014 2016 2018 2020 2022 2024 2026 2028 2030
mm
tpa
Asia Europe Latin America Middle East
0
50
100
150
200
250
300
350
400
450
500
2010 2012 2014 2016 2018 2020 2022 2024 2026 2028 2030m
mtp
a
Pacific, Operational Middle East, Operational
West Africa, Operational Other, Operational
Pacific, Under-construction North America, Under-construction
North America, Probable Other, Probable
New Portfolio Global Demand

The Lantau Group
Asia LNG demand supply balance
67
Asia LNG demand Supply of LNG to Asia
0
50
100
150
200
250
300
350
2010 2012 2014 2016 2018 2020 2022 2024 2026 2028 2030
mm
tpa
Japan South Korea Taiwan China
India Thailand Indonesia Philippines
Malaysia Singapore Vietnam
0
50
100
150
200
250
300
350
2010 2012 2014 2016 2018 2020 2022 2024 2026 2028 2030m
mtp
a
Pacific, Operational Middle East, Operational
West Africa, Operational Other, Operational
Pacific, Under-construction North America, Under-construction
North America, Probable New Portfolio
Asia Demand
The Lantau Group
Agenda / Content
Coal Markets
Natural Gas Markets
- Domestic supply and demand
- LNG regasification development
- Global LNG supply and demand
- LNG pricing – new dynamics led by disruptive influence of US LNG
- Domestic gas pricing – marginal cost versus rolled-in
Case study: Gas development in Vietnam
68

The Lantau Group
The US shale gas revolution has “disrupted” pricing
69
Regional pricing gap has widened to
unprecedented wide level – more LNG is
likely to be diverted to higher pricing
region (i.e. Asia)
• Qatar’s original LNG export strategy:
1/3 for US, 1/3 for Europe and 1/3 for
Asia; But this strategy is unlikely to be
sustainable and Qatar is diverting
more LNG cargos to Asia and Europe
• Trinidad & Tobago used to have 86%
of its export to US, but it has to seek
new customers now, likely in Asia
• In 2005, HH price increased to ~$15/MMBtu because of strong demand
and supply disruption (Hurricanes Katrina). In response, many LNG
receiving terminals were planned and some quickly built in US
• Now, most are idle as the US has 134 mmtpa of LNG import capacity but
imported only ~3 Mt in 2012
• Many import terminals plan to convert into export terminals
HH and Asian LNG prices
0
5
10
15
20
USD/MMBtu
Asia LNG price
assuming 13.85
slope
Henry Hub

The Lantau Group
Delivered prices of US gulf coast LNG versus west coast Canada
70
0
2
4
6
8
10
12
14
USA Brownfield
USD
mm
btu
Onshore Transport Henry Hub Liquefaction Shipping
0
2
4
6
8
10
12
14
Canada Greenfield
USD
mm
btu
Onshore Transport AECO Liquefaction Shipping
US LNG Canadian LNG

The Lantau Group
US gulf coast and Canada west coast delivered to Asia
71
• The pricing gap: is not as large you might think once liquefaction and shipping are added on. Based
on Henry Hub at USD 5 mmbtu then the delivered price to Asia is shy of USD 12 mmbtu for US LNG
and USD13 mmbtu for Canadian LNG, assuming it is sold at breakeven.
• Pricing more than about cost: But if it is a seller’s market then higher pricing might be expected.
Unless the buyer has contracted for US LNG, which many have done. In addition, many Canadian
LNG projects are expected to favour a more traditional pricing mechanism linked to crude oil although
they maybe forced to accept a linkage to the Canadian version of Henry Hub, AECO (Alberta Energy
Company) spot price.
• US LNG and Canadian LNG: A major difference between the two sources needs re-emphasized.
Buyers of US LNG are not buying LNG but buying liquefaction capacity rights, they can use it or lose it.
Buyers of Canadian LNG are the end point on a build out of new liquefaction plant, new pipelines, and
exploration and development of dedicated supply reserves, usually shale.
• Buyers take a slice in liquefaction capacity : Major LNG buyers such as KOGAS, GAIL, Tokyo Gas,
Kansai Power, Osaka Gas, Chubu Power, have signed HH linked long term contracts with US LNG
plants. Many new LNG buyers are also interested to get HH linked contracts, although the quality of
some of the latest buyers of US liquefaction capacity has been declining.
The Lantau Group
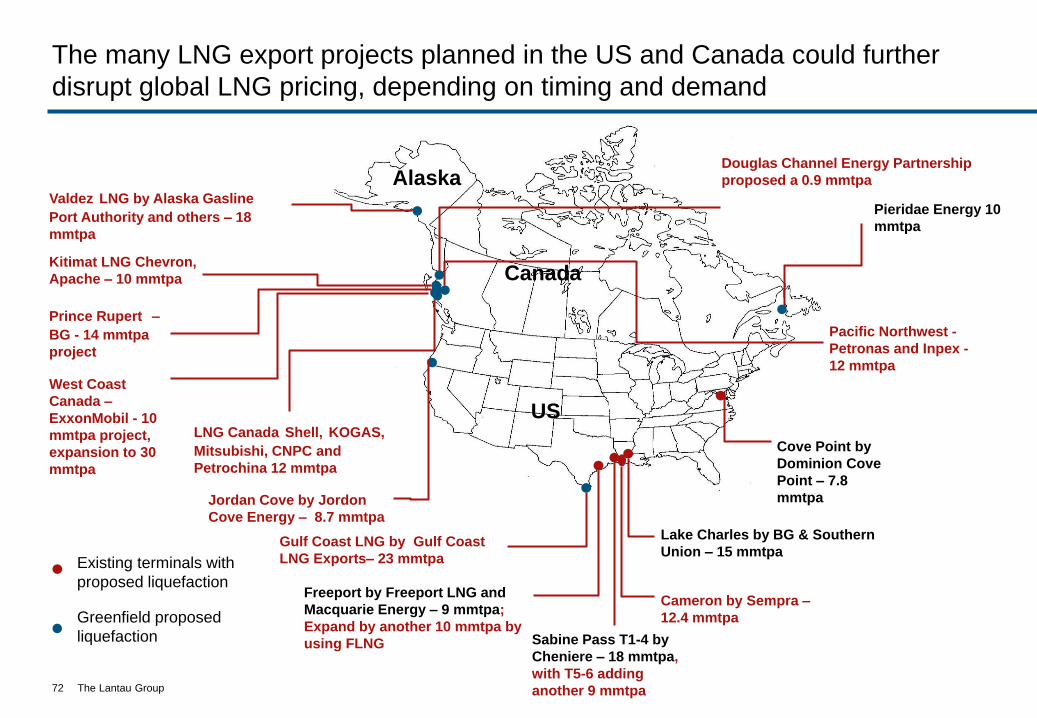
The many LNG export projects planned in the US and Canada could further
disrupt global LNG pricing, depending on timing and demand
US
Canada
Alaska
Cove Point by
Dominion Cove
Point – 7.8
mmtpa
Lake Charles by BG & Southern
Union – 15 mmtpa
Cameron by Sempra –
12.4 mmtpa
Sabine Pass T1-4 by
Cheniere – 18 mmtpa,
with T5-6 adding
another 9 mmtpa
Freeport by Freeport LNG and
Macquarie Energy – 9 mmtpa;
Expand by another 10 mmtpa by
using FLNG
Jordan Cove by Jordon
Cove Energy – 8.7 mmtpa
Gulf Coast LNG by Gulf Coast
LNG Exports– 23 mmtpa
Kitimat LNG Chevron,
Apache – 10 mmtpa
LNG Canada Shell, KOGAS,
Mitsubishi, CNPC and
Petrochina 12 mmtpa
Pacific Northwest -
Petronas and Inpex -
12 mmtpa
Douglas Channel Energy Partnership
proposed a 0.9 mmtpa
Valdez LNG by Alaska Gasline
Port Authority and others – 18
mmtpa
Existing terminals with
proposed liquefaction
Greenfield proposed
liquefaction
72
West Coast
Canada –
ExxonMobil - 10
mmtpa project,
expansion to 30
mmtpa
Prince Rupert –BG - 14 mmtpa
project
Pieridae Energy 10
mmtpa

The Lantau Group
US DOE will grant approval for exporting LNG to non-FTA countries based on “accumulative
effect” of LNG exports on US energy security
First mover advantage: many players have been quick to file
applications for LNG exports and push for approvals
Competition also exist between the exports from US and those from Canada
LNG exports: US vs British Columbia (BC) in Canada
Liquefaction
cost US Gulf Coast: CAPEX for converting regasification terminal US$500-600/tonne
Canada British Columbia: CAPEX for greenfield development is US$900-1,200/tonne
Shipping cost
US Gulf Coast: US$2.8/MMBtu to Asia, and maybe lower after the expansion of Panama
Canal in c.2014 – depends on the rent the canal extracts from the LNG carriers.
Canada British Columbia: Not cheaper than US Gulf despite shorter route to Asia as all
equipment is new build – LNG plant, pipelines, exploration and development of gas fields.
Other costs Canada British Columbia: BC government intends to levy LNG tax.
Competition between US and Canadian export projects has increased
73

The Lantau Group
Henry Hub: $4.00-
$6.50/mmBtu
Liquefaction costs: $2.00-$3.00/mmBtu
Fuel costs: $0.60-
$0.98/mmBtu
Shipping to Asia:
$2.80/mmBtu
Source: Cheniere Energy, Annual Report
Sabine Pass LNG DES Price to Asia: $8.8-11.3/MMBtu
0
5
10
15
20
25
$/barrel
~$15/MMBtu
Assume: slope of 13.85 for 50<JCC<110
US LNG export price 20-40% less than other Asian
LNG
But with new risks:
US LNG exports – cheaper with more flexibility, but not without risk
74
Approximate Cost of New Asian LNG Contracts
$/MMBtu
15
0
5
10
15
20
US LNG Export Asia LNG
$/MMBtu
11.3
8.8
I) Timing/ Regulatory Risk
II) Commercial Risk
• Prospects of LNG export
authorization delay or withdrawal by
DOE
• Will supply-side competition allow
LNG importers to capture the
savings?
• Henry Hub price volatility
• Shale industry dynamics

The Lantau Group
East Africa LNG – marketing indicates some linkage to Henry Hub
• Mozambique LNG led by Anadarko will
probably be first to market by 2020 with an
initial 10 mmtpa. With reserves (25 to 50 Tcf)
from Area 1 in the Rovuma basin to support a
rise to 50 mmtpa. Pricing has been offered
that is part linked to Henry Hub and part to
crude oil.
• Tanzania LNG we expect will come later
perhaps by 2022 due to a lack of regulatory
transparency, confusion over the role of the
mooted new National Oil Company and
existing de-facto upstream regulator Tanzania
Petroleum Development Corp, and
requirements for gas and infrastructure to
support domestic industry. BG Group, Ophir
and Statoil have together some 30 Tcf of
recoverable gas from their four blocks.
75
0
10
20
30
40
50
60
70
80
90
100
Mozambique Areas, 1,2,4,5 Tanzania Blocks 1,2,3,4
Tcf
(re
cove
rab
le)

The Lantau Group
LNG pricing round up
76
• US LNG: The gap is not as large you might think once liquefaction and shipping are added on. Based on Henry Hub at USD 5 mmbtu, then the delivered price to Asia is shy of USD 12 mmbtu, assuming it is sold at cost.
• Canada: Less expensive shipping than US LNG but a large build out of new infrastructure and field development adds to costs and complexity. They are like a traditional LNG projects with the need for new liquefaction plant, in most cases new pipelines and gathering pipelines, field exploration, appraisal and development. We believe these projects will favour a strong linkage to crude oil in pricing. This might partly explain why marketing efforts to date have been slow. So perhaps they have to accept some component of domestic gas spot pricing in the LNG contract?
• East Africa : Marketing of new LNG with a partial linkage to Henry Hub has been noted, but too early in the development phase to sign any firm sales agreements.
• Qatar: Up until recently it was the marginal LNG supplier and held fast on pricing, recently some compromise on pricing has been noticed, in response to greater competition.
• Australia: Mostly linked to crude oil but, CNOOC bought more shares in Queensland Curtis LNG and this we believe was accompanied by a LNG sales agreement that is partly linked to Henry Hub.
• More trading and arbitrage: A surplus in supply might be looming after 2020, this might lead to more spot trading and arbitrage.
– Will Singapore become an LNG trading hub as more LNG is diverted to Asia and more trading companies such as BP, Gazprom, Gunvor and Vitol set up their LNG trading teams in the island?

The Lantau Group
Commodity pricing outlook – whether the marginal price is set by Australia/Qatar, or
East Africa, or US LNG will depend to some extent on demand supply balance
77
Brent and Henry Hub LNG delivered price forecast
0.0
1.0
2.0
3.0
4.0
5.0
6.0
7.0
0.0
20.0
40.0
60.0
80.0
100.0
120.0
201
3
201
4
201
5
201
6
201
7
201
8
201
9
202
0
202
1
202
2
202
3
202
4
202
5
202
6
202
7
202
8
202
9
203
0
He
nry
Hu
b
Bre
nt
Brent USD barrel Henry Hub USD mmbtu
8
9
10
11
12
13
14
15
16
17
201
6
201
7
201
8
201
9
202
0
202
1
202
2
202
3
202
4
202
5
202
6
202
7
202
8
202
9
203
0
US
D m
mb
tu
Australia/Qatar East Africa US LNG
The Lantau Group
Agenda / Content
Coal Markets
Natural Gas Markets
- Domestic supply and demand
- LNG regasification development
- Global LNG supply and demand
- LNG pricing – convergence of US and Asian markets?
- Domestic gas pricing – marginal cost versus rolled-in
Case study: Gas development in Vietnam
78

The Lantau Group
Vietnam Natural Gas: the need for a generic pricing strategy
• PetroVietnam is the dominant player and is both industry regulator and project participant. It signs back-to-
back gas purchase and sales agreements and negotiates wellhead prices on a cost-plus basis. Transmission
and Distribution tariffs are approved by GoV at project stage. Gas sales prices are negotiated between
PetroVietnam and each end user.
• The absence of a gas pricing methodology handicaps gas development in Vietnam and it is also difficult to
guide economically efficient development for its critical energy resources
Upstream investors cannot confidently evaluate their probable returns from exploration and development
Government cannot assess and optimize its fiscal revenues from gas development
Consumers have no basis to estimate their costs for gas supplies
• Twin Objectives for the gas pricing methodology
At the supply side, it needs to provide the appropriate financial incentives to gas developers to invest in
exploration, development and production activities. This should lead to optimal investments in the upstream
sector and ensures only those gas fields should be developed which are economically competitive in
Vietnam’s main gas consuming sectors
At the demand side, it needs to provide the right signals to investors to choose gas as the economic, lower-
cost fuel when supply increments become available. This should lead to optimal investment in the consuming
sectors, i.e. gas should only be used in those gas-consuming projects in which is it competitive with its
alternative. For example, coal as an alternative fuel to gas in the power generation sector.
79

The Lantau Group
Natural Gas Pricing: Marginal Cost versus Rolled-in
Marginal Cost Rolled-In
• Marginal cost mechanism prices natural gas at
the cost of supplying one extra unit to meet
increase in demand
• The cost of incrementing gas production is
typically higher as gas resources become more
scarce and exploration and development
become more expensive
• The price incentivizes exploration and
development of new reserve
• However, charging all consumers at the
marginal cost let suppliers operate below
marginal cost reap all the economic rent, which
is considered inequitable
• Current cost-plus mechanism for Nam Con
Son and Bach Ho have led to lengthy
negotiations and long delays
• Another option is to allow wholesale prices to
include the markup for historical average costs
plus profit for the pipelines and historical
average field price for gas at the wellhead
• This “rolled-in” price at wholesale is thus
changed by an increased field price only to the
extent that the new price changes the historical
average of all field prices
• Rolled-in rate requires the costs of new gas
into the line are spread equitably amongst
existing shippers
• This prevents explorers shoulder the entire
cost of expansion
• Therefore, rolled-in pricing incentivizes the
opening of the entire basin for generations of
exploration and development
80

The Lantau Group
PVN’s plan is to create WACOG pools so as to direct subsides to specific users
81
Source: PetroVietnam Gas, Challenges for Balancing Gas Supply and Demand, 4 July 2012

The Lantau Group
Agenda / Content
Natural Gas Markets
Coal Markets
Case study: Gas development in Vietnam
82
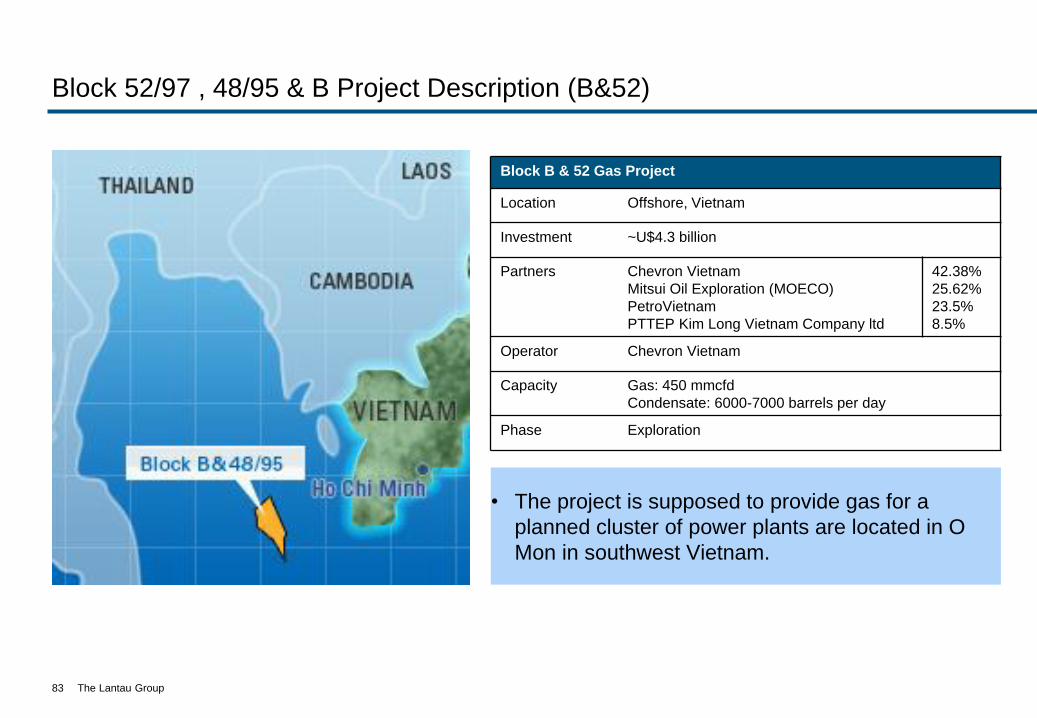
The Lantau Group
Block 52/97 , 48/95 & B Project Description (B&52)
• The project is supposed to provide gas for a
planned cluster of power plants are located in O
Mon in southwest Vietnam.
83
Block B & 52 Gas Project
Location Offshore, Vietnam
Investment ~U$4.3 billion
Partners Chevron Vietnam
Mitsui Oil Exploration (MOECO)
PetroVietnam
PTTEP Kim Long Vietnam Company ltd
42.38%
25.62%
23.5%
8.5%
Operator Chevron Vietnam
Capacity Gas: 450 mmcfd
Condensate: 6000-7000 barrels per day
Phase Exploration

The Lantau Group
Development of Gas Block B&52 Project
• In July 2009, Chevron and three partners signed a basic agreement for front end engineering
and design (FEED) with Vietnam Oil and Gas Group (PetroVietnam).
• The EPC for the pipeline from Block B, by subsidiaries of PVN and Vietsovpetro, to the shore
site at O Mon started in late November 2009 ahead of any gas sales agreement.
• Chevron has prepared a development plan to produce gas from the block but hasn't started
work over a dispute with Vietnam's national oil firm PetroVietnam about the price of gas.
• However, after many years of negotiations, the parties came close to agreeing on gas sale
price in mid 2012 but then stalled again.
• We believe Chevron wanted a gas price of between $8 to $10 per million British thermal units
while PVN and the government was unwilling to pay this amount.
• Chevron has indicated it will exit the project and has invited other partners to buy its stake.
Existing partners of the project have the first right to buy stakes from others in the project.
• This said it was reported that India’s ONGC Videsh Ltd (OVL) and Russia’s Gazprom
expressed an interest in buying a stake in B&52, but to date no details have been revealed by
the parties.
• To add to the competition the Vietnamese government recently gave PetroVietnam the go-
ahead to buy Chevron’s stake in the B&52 gas project.
84

The Lantau Group
Block B – O Mon Gas pipeline project description
• The Block B - O Mon gas pipeline system is currently under construction in order to transport gas
from Blocks B&52 to supply for consumers in Ca Mau and O Mon area.
• The cooperation for this project marked a milestone in Vietnam’s long-term partnership with
foreign counterparts in constructing gas pipelines.
85
Block B – O Man Gas Pipeline Project
Length 406km, including 246km offshore and 160km onshore
Investment ~U$1 billion
Operator PV Gas
Capacity 600 mmcfd
Status Construction started in November 2009
Expected to be completed by Q4 2014

The Lantau Group
Development of Gas pipeline project for Block B&52 to O Mon
• A FEED design contract was signed with Worley-Parsons and PetroVietnam in July 2009.
• An EPC contract has been signed; and the contractor venture (including Vietsovpetro,
PVC and PTSC) is preparing construction ground of GDC station in order to start
construction.
• Site clearance and compensation have been coordinated with local authorities. Entire area
for the construction-commencing celebration is handed over to the Venture.
• Petrovietnam Safety and Environment R&D Center is completing a final EIA report.
• Construction started in November 2009 but we believe that the lack of progress on a gas
sales agreement has caused work to slow down.
• March 2010, Petrovietnam Gas Corporation (PV Gas), Chevron Vietnam Ltd. (US), Mitsui
Oil Exploration Company Ltd. (MOECO) (Japan) and PTT Exploration and Production
Public Company Limited (PTTEP) (Thailand) signed a Business Cooperation Contract
(BCC) for the Block B Gas Pipeline Project. We understand that none of the upstream
partners were willing to invest in the pipeline without a gas sales agreement being in place
first.
86

The Lantau Group
87
Rigour
Value
Insight
Energy Power Utilities
For more information please contact us:
Tom Parkinson
Neil Semple
Recca Liem
+852 2521 5501 (office)
www.lantaugroup.com
The Lantau Group (HK) Limited
4602-4606 Tower 1, Metroplaza
223 Hing Fong Road
Kwai Fong, Hong Kong
Hong Kong
Tel: +852 2521 5501
www.lantaugroup.com