comparative evaluation of the effects of …repository.essex.ac.uk/17063/1/p. o. eburu phd...
TRANSCRIPT
i
COMPARATIVE EVALUATION OF THE EFFECTS
OF WHOLE ESSENTIAL OILS AND THEIR ACTIVE
CONSTITUENT COMPOUNDS ON THE BIOHYDROGENATION
OF POLYUNSATURATED FATTY ACIDS AND FERMENTATION
CHARACTERISTICS OF RUMEN MICROBES IN VITRO
By
EBURU PATRICK OKARA
A thesis submitted for the degree of Doctor of Philosophy (PhD) in Animal Science
Department of Animal Science
University of Essex
Supervisor:
Dr Sifelani Chikunya
February 2016
ii
ABSTRACT
Effects of whole essential oils (EOs) and their constituent compounds (EOCs) on the fermentation
activities of rumen microbes and the biohydrogenation (BH) of n-3 polyunsaturated fatty acids (PUFA)
were evaluated in four in vitro experiments and one feeding trial. In all the in vitro experiments, rumen
fluid was collected from Hartline Texel cross cull ewes. A basal feedstock comprising of 70:30 grass
hay and concentrate was formulated, milled (1 mm screen) and then supplemented with 32.5 g oil/kg
(40% oil from ground whole linseed and 60% from fish oil). In the first experiment using 15 EOCs,
anethole and 4-allyanisole which were the most effective EOCs reduced the BH of 18:3 n-3 by 22.2% and
26.4%, respectively. But, at 300 mg/L there was a concomitant substantial inhibition of total volatile fatty
acids (VFA). In the second experiment, out of 10 whole EOs, anise and cassia oils which were the most
effective EOs reduced the BH of 18:3 n-3 by 58.2% and 54.3%, respectively. However, protection was
accompanied with significant suppression of VFA at 300 mg/L. In the third experiment using varying
doses (0, 100, 200 and 300 mg/L) of 4-allylanisole, anethole, anise oil and cassia oil, it was observed that
at 200, 4-allylanisole, anethole and anise oil maintained best balance between satisfactory protection of n-
3 PUFA and minimal disruption to VFA concentration. In the fourth experiment, six Hartline Texel
cross lambs were used. Three of the lambs were randomly assigned to the untreated basal diet (BDG) and
the remaining three lambs were offered diet with anise oil (AOG). Rumen fluid collected from each of the
BDG and AOG was used in in vitro batch culture system. The AOG maintained higher concentrations of
PUFA and lower concentration of stearic acid. Results of these studies indicate that dietary addition of
selected EOs and EOCs represent a potential effective strategy to optimize the fatty acid composition of
ruminant food products (to be confirmed). However, whole EOs are more effective than EOCs.
iii
ACKNOWLEDGEMENTS
Special thanks to the Almighty God for providing the hub (grace, strength, knowledge and wisdom) for
the success of this work.
I would like to sincerely acknowledge the support of the following persons without which this piece of
work would not have been a reality:
My heartfelt thanks go to my dear supervisor (Dr Sifelani Chikunya) for the planning, guidance, co-
operation and continued support throughout the period of this work. Accept my unreserved thanks.
Thanks go to Mr Andrew Thompson for technical support and all the technicians at the Lordship Science
Laboratory at Writtle College, technicians at the University of Essex and those at the University of
Aberdeen for their co-operation and understanding during chemical analyses.
To all the postgraduate students, members of staff, librarians, members of the postgraduate research
council of the University of Essex and Writtle College, a huge thank you for your immeasurable support.
Thanks cannot be completed without gratefully acknowledging the financial support of the Cross River
State Government, The Leche Trust, Evamay Services LTD, Dr Peter Oti, Mr Timothy Jedy Agba and
Senator Victor Ndoma Egba.
Finally, unconditional thanks go to my family members, particularly, my lovely wife and dear son
(junior), to my friends (especially Dr A.Mufutau) and well-wishers, for their encouragement.
iv
Publications
Part of this thesis has appeared previously in:
Eburu, P. O. and Chikunya, S. (2014) Effects of Fifteen Compounds from Essential Oil Extracts on the
Metabolism of Polyunsaturated Fatty Acids by Rumen Microorganisms in vitro. Advances in Animal
Biosciences, 5 (1), 78.
Eburu, P. O. and Chikunya, S. (2015a) Effects of ten whole essential oils on rumen fermentation and
biohydrogenation of n-3 polyunsaturated fatty acids by rumen microorganisms in vitro. Advances in
Animal Biosciences, 6 (1), pp. 203.
Eburu, P. O. and Chikunya, S. (2015b) The effects of graded doses of 4-allylanisole, anethole, anise oil
and cassia oil on fermentation and biohydrogenation of n-3 polyunsaturated fatty acids by rumen
microorganisms in vitro. Advances in Animal Biosciences 6 (1), pp. 204.
Eburu, P. O. and Chikunya, S. (2016) Effects of microbial adaptation to anise oil on biohydrogenation of
n-3 polyunsaturated fatty acids. The European Federation of Animal Science (EAAP) Annual conference,
2016.
v
LIST OF ABBREVIATIONS
AACC: American Association of Cereal Chemists
ADF: acid detergent fiber
ALA: 4-allylanisole
ANE: anethole
ANO: anise oil
ANOVA: analysis of variance
AOAC: Association Official Analytical Chemist
AOG: anise oil group
BCVFA: branched chain volatile fatty acid
BDG: basal diet group
BEO: blend of essential oil
BH: biohydrogenation
BHT: butylated hydroxyl-toluene
BIS: bisabolol
BOR: borneole
CALA: conjugated linolenic acid
CAR: 3-carene
CHD: coronary heart disease
CIN: cinnamaldehyde
CIT: citronellol
CLA: conjugated linoleic acid
CLO: clove oil
CMO: cornmint oil
vi
CON: control
CPY: caryophyllene
CSO: cassia oil
CTO: citronella oil
CVD: cardiovascular disease
CYM: p-Cymene
DHA: docosahexaenoic acid
DM: dry matter
DPS: deproteinising solution
EAFUS: everything added to food in the US
EFA: essential fatty acids
EOCS: essential oil compounds
EOS: essential oils
EPA: eicosapentaenoic acid
ETO: eucalyptus oil
EUC: eucalyptol
FA: fatty acid
FAMES: fatty acid methyl esters
FAO: food and agricultural organization
FCC: food chemicals codex
FFA: free fatty acid
FFDCA: federal food drug and cosmetic act
FG: food grade
GC: gas chromatography
vii
GRAS: generally recognized as safe
HAP: hyper ammonia producing bacteria
HIV/AID: human immunodeficiency virus
IUPAC: international union of pure and applied chemistry
JPO: juniper berry oil
LA: linoleic acid
LDL: low-density lipoprotein
LIM: limonene
LNA: linolenic acid
LSD: least significant difference
LVO: lavender oil
MDO: mandarin oil
MEN: menthol
MIC: minimum inhibitory concentration
MUFA: monounsaturated fatty acid
MYT: myrtenol
NEFA: non-esterified fatty acids
NFD: neutral detergent fiber
P/S: PUFA/SFA ratio
PBC: plant bioactive compounds
PMF: proton motive force
PSM: plant secondary metabolites
PUFA: polyunsaturated fatty acid
RF: rumen fluid
viii
RFA: remaining fatty acid
RMO: rosemary
SA: stearic acid
SFA: saturated fatty acid
TFA: total fatty acid
THU: thujone
TVFA: total volatile fatty acid
USFA: unsaturated fatty acid
VA: vaccenic acid
VAN: vanillin
VFA: volatile fatty acid
WHO: world health organization
ix
TABLE OF CONTENT
Table of Contents
Introduction .............................................................................................................................................1
CHAPTER 1 ............................................................................................................................................3
1.0. LITERATURE REVIEW ..................................................................................................................3
1.1. Definition and classification of lipids .............................................................................................3
1.1.1. Functions of lipids in food ........................................................................................................5
1.2. Nomenclature of fatty acids ...........................................................................................................7
1.2.1. Fatty acids ................................................................................................................................ 10
1.2.2. Saturated fatty acids ............................................................................................................. 10
1.2.3. Monounsaturated fatty acids ................................................................................................ 11
1.2.4. Polyunsaturated fatty acids .................................................................................................. 12
1.2.5. Contribution of ruminant food products to global food security ............................................ 15
1.2.6. Nutritional importance of PUFA, CLA and MUFA in human diets ....................................... 16
1.3.0. Dietary sources of lipids for ruminants ...................................................................................... 20
1.3.1. Forage and grass lipids ............................................................................................................. 20
1.3.2. Oilseeds.................................................................................................................................... 23
1.3.3. Fish oil ..................................................................................................................................... 24
1.4.0. Fatty acid metabolism in animals .................................................................................................. 25
1.4.1. Metabolism of lipid in non-ruminants ....................................................................................... 25
1.4.2. Hydrolysis and biohydrogenation of PUFA in ruminants........................................................... 25
1.4.2.1. Ruminal Pathways of lipolysis and biohydrogenation ........................................................ 26
1.4.2.2. Biohydrogenation intermediates ........................................................................................ 31
1.4.2.3. Factors affecting biohydrogenation ................................................................................... 33
1.4.2.4. Microorganisms involved in lipolysis and biohydrogenation ............................................. 34
1.5.0. Methods for protecting lipids from biohydrogenation in the rumen ............................................... 37

x
1.5.1. Formaldehyde protein-lipid supplements .............................................................................. 37
1.5.2. Saponification (Calcium soaps) ............................................................................................ 41
1.5.3. Prilling (prilled fatty acids) .................................................................................................. 42
1.5.5. Oil seeds .............................................................................................................................. 43
1.6. Plant Bioactive Compounds and rumen Biohydrogenation ............................................................... 44
1.7.0. Essential oils (the proposed technique) ......................................................................................... 46
1.7.1. Definition of Essential oil ......................................................................................................... 46
1.7.2. Composition of EO ................................................................................................................... 47
1.7.3. Mechanism of actions of EOs ................................................................................................... 55
1.7.4. Antagonism and synergism between EOCs ............................................................................... 61
1.7.5. Effects of EOs on feed intake, diegestion and VFA production ................................................. 62
1.7.6. Effects of essential oil compounds on ammonia production ....................................................... 64
1.7.7. Effects of EOs and EOCs on rumen methanogenesis ................................................................. 67
1.7.8. Effects of EOs and EOCs on biohydrogenation of PUFA .......................................................... 70
1.7.9. Effects of essential oil compounds on rumen microbes .............................................................. 73
1.7.10. Microbial adaptation to EOs and compounds .......................................................................... 75
1.7.11. Legal and safety issues with the use of EOs and EOCs in food ................................................ 76
1.8. Justification and approach taken in this PhD research ...................................................................... 80
Chapter 2 ............................................................................................................................................... 84
2.0. General material and methods ......................................................................................................... 84
2.1. Animal management, feeding and collection of rumen fluid ......................................................... 84
2.2. Anaerobic buffer ......................................................................................................................... 85
2.3. The basal diet for in vitro incubation............................................................................................ 85
2.4. Incubation, sample collection and storage .................................................................................... 86
2.5. ROUTINE CHEMICAL ANALYSIS .......................................................................................... 89
xi
2.5.1. Dry matter ................................................................................................................................ 89
2.5.2. Ether Extract ............................................................................................................................ 89
2.5.3. Feed total Nitrogen analysis ...................................................................................................... 90
2.5.4. Ammonia analysis .................................................................................................................... 90
2.5.4.1. Reagents ........................................................................................................................... 90
2.5.4.2. Analytical procedure ......................................................................................................... 91
2.5.5. Neutral and acid detergent fiber (NDF and ADF) ...................................................................... 93
2.5.6. Volatile fatty acid analysis ........................................................................................................ 95
2.5.6.1. Reagents ........................................................................................................................... 95
2.5.6.2. Sample preparation and analysis ....................................................................................... 95
2.5.7. Fatty acid analysis .................................................................................................................... 96
2.5.7.1. Reagents ........................................................................................................................... 96
2.5.7.2. Extraction of fatty acid content of basal feedstock ............................................................. 97
2.5.7.3. Extraction of fatty acid content of in vitro fermentation residues (digesta) ......................... 97
2.5.7.5. Methylation of extracted fatty acids samples (feed and digesta) ......................................... 98
CHAPTER 3 ........................................................................................................................................ 101
Effects of Fifteen Compounds from Essential Oil Extracts on the Metabolism of Polyunsaturated Fatty
Acids by Rumen Microorganisms in vitro ............................................................................................ 101
3.1. Introduction ............................................................................................................................... 103
3.2. Materials and methods ............................................................................................................... 105
3.2.1. Animal management and collection of rumen fluid/sampling ..............................................105
3.2.2. Basal feedstock, treatments and in vitro incubation .............................................................105
3.2.3. Sample collection and preservation .....................................................................................108
3.2.4 Chemical analysis ................................................................................................................108
3.2.5. Experimental design and statistical analysis ........................................................................108
3.3. RESULTS ................................................................................................................................. 109
3.3.1. In vitro fermentation parameters .........................................................................................109
3.3.2. Effects of EOCs on fatty acid metabolism ...........................................................................113
3.5.0. Discussion .............................................................................................................................. 125
xii
3.5.1. In vitro fermentation parameters .........................................................................................125
3.5.2. Effect of EOC on fatty acid metabolism ..............................................................................128
3.6. Conclusion ................................................................................................................................ 134
Chapter 4 ............................................................................................................................................. 137
Effects of ten whole essential oils on rumen fermentation and biohydrogenation of n-3 polyunsaturated
fatty acids by rumen microorganisms in vitro ....................................................................................... 137
4.1. Introduction ............................................................................................................................... 139
4.2. Materials and methods ............................................................................................................... 140
4.2.1. Animal management and collection of rumen fluid .............................................................140
4.2.2. Basal feedstock, treatments and in vitro incubation .............................................................140
4.2.3. Sample collection and preservation .....................................................................................144
4.2.4. Chemical analysis ...............................................................................................................144
4.2.5. Experimental design and statistical analysis ........................................................................144
4.4.0. RESULTS .............................................................................................................................. 145
4.4.1. In vitro fermentation parameters .........................................................................................145
4.4.2. Effect of EOs on fatty acid metabolism ...............................................................................149
4.5. Discussion ................................................................................................................................. 160
4.5.1. Effects of EOs on in vitro fermentation parameters .............................................................160
4.5.2. Effect of EOs on fatty acid metabolism ...............................................................................164
4.6. Conclusion .................................................................................................................................... 169
Chapter 5 ............................................................................................................................................. 171
The effects of graded doses of 4-allylanisole, anethole, anise oil and cassia oil on fermentation and
biohydrogenation of n-3 polyunsaturated fatty acids by rumen microorganisms in vitro ........................ 171
5.1. Introduction ............................................................................................................................... 173
5.2.0. Materials and methods ............................................................................................................ 174
5.2.1. Animal management and collection of rumen fluid/sampling ..............................................174
5.2.2. Basal feedstock, treatments and in vitro incubation .............................................................174
5.2.3. Sample collection and preservation .....................................................................................174
xiii
5.2.4 Chemical analysis ................................................................................................................175
5.2.5. Experimental design and statistical analysis ........................................................................175
5.3.0. RESULTS .............................................................................................................................. 176
5.3.1 In vitro fermentation parameters ..........................................................................................176
5.3.2. Effect of EOC on fatty acid metabolism ..............................................................................181
5.4. Discussion ................................................................................................................................. 194
5.4.1. In vitro fermentation parameters .........................................................................................194
5.4.2. Effect of EOs/EOCs on fatty acid metabolism .....................................................................198
5.5. Conclusion ................................................................................................................................ 203
CHAPTER 6 ........................................................................................................................................ 205
Effects of four weeks of rumen adaptation to anise oil on biohydrogenation of n-3 polyunsaturated fatty
acids .................................................................................................................................................... 205
6.1. Introduction ............................................................................................................................... 207
6.2.0. Materials and methods ............................................................................................................ 208
6.2.1. Animal management and collection of rumen fluid/sampling ..............................................208
6.2.2. Basal feedstock, treatments and in vitro incubation .............................................................208
6.2.3. Sample collection and preservation .....................................................................................209
6.2.4 Chemical analysis ................................................................................................................209
6.2.5. Experimental design and statistical analysis ........................................................................209
6.3. Results ...................................................................................................................................... 210
6.3.1. Fermentation parameters .....................................................................................................210
6.3.2. Effect of EOC on fatty acid metabolism ..............................................................................214
6.4.0. Discussion .............................................................................................................................. 222
6.4.1. Fermentation parameters .....................................................................................................222
6.4.2. Effect of EOC on fatty acid metabolism ..............................................................................224
6.5. Conclusion .................................................................................................................................... 227
CHAPTER 7 ........................................................................................................................................ 230
7.1a. General discussion and recommendations for future research ................................................... 230
7.2. Brief summary........................................................................................................................... 235

xiv
References ........................................................................................................................................... 244
xv
TABLE OF TABLES
Table 1.1 Nomenclature of Some FA found in plant and animal tissues…………………………………..9
Table 1.2 Profile of fatty acids of common forages (g/100 g total fatty acids)…………………………...22
Table 1.3 Some types of monoterpenes and their examples ……………………………………………..51
Table 1.4 Some types of sesquiterpenes and their examples……………………………………………..52
Table 1.5 Some types of phenylpropanoids and their examples………………………………………….52
Table 1.6 EOs and their major components which exhibit antimicrobial activities (adopted from Burt,
2004)……………………………………………………………………………………………………... 53
Table 2.1 Anaerobic buffer used for in vitro incubation according to Theodorou et al. (1994)………….87
Table 2.2 The ingredients, chemical composition and fatty acid content of the basal feedstock used in
incubations………………………………………………………………………………………………...88
Table 2.3 Range of standard dilutions in 1 ml Eppendorf………………………………………………..92
Table 2.4 Sample of 96 well plates ……………………………………………………………………...92
Table 3.1 Selected essential oil compounds used in this study and examples of microbes or process
inhibited in previous studies……………………………………………………………………………..104
Table 3.2 Description of the essential oil compounds (EOCs) used in this experiment………………...106
Table 3.3 Typical parent whole oils from which the EOCs used in this study can be extracted
from………………………………………………………………………………………………………107
Table 3.4 Effects of EOCs on cumulative gas production (ml/g OM), pH and ammonia concentration
(mM) in cultures during 48 h incubation………………………………………………………………...111
Table 3.5 Effects of EOCs on concentration of total (mM) and molar proportions of individual volatile
fatty acids (mM/mol TVFA) in cultures during 48 h incubation………………………………………...112
Table 3.6 Effects of EOCs on selected C14 and C16 fatty acids concentration (g/100 g total fatty acids) in
cultures at 12, 24 and 48 h incubation…………………………………………………………………...119
xvi
Table 3.7 Effects of EOCs on selected C18 fatty acids composition (g/100 g total fatty acids) in cultures
at 12, 24 and 48 h incubation…………………………………………………………………………….120
Table 3.8 Effects of EOCs on selected long chain fatty acids composition (g/100 g total fatty acids) in
cultures at 12, 24 and 48 h incubation…………………………………………………………………...121
Table 3.9 Effects of EOCs on the concentration of sums of fatty acids (g/100 g TFA) and content of total
fatty acids (mg/g) in cultures at 12, 24 and 48 h incubation……………………………………………..122
Table 3.10 Effects of EOCs on fatty acid ratios in cultures at 12, 24 and 48 h incubation……………..123
Table 3.11 Effects of EOCs on the biohydrogenation (g/100 g) of PUFA in cultures at 12, 24 and 48 h
incubation………………………………………………………………………………………………124
Table 4.1 Description of the essential oils used in this experiment as purchased from Sigma-
Aldrich…………………………………………………………………………………………………...142
Table 4.2 Typical constituent component composition of the whole essential oils used in this
study……………………………………………………………………………………………………...143
Table 4.3 Effects of EOs on cumulative gas production (ml/g OM) and ammonia concentration (mM) in
cultures during 48 h incubation…………………………………………………………………………..147
Table 4.4 Effects of EOs on concentration of total (mM) and proportions of individual volatile fatty acids
(mM/mol TVFA) in cultures during 48 h incubation……………………………………………………148
Table 4.5 Effects of whole EOs on selected C14 and C16 fatty acids concentration (g/100 g total fatty
acids) in cultures at 12, 24 and 48 h incubation………………………………………………………….154
Table 4.6 Effects of whole EOs on selected C18 fatty acids composition (g/100 g total fatty acids) in
cultures at 12, 24 and 48 h incubation…………………………………………………………………...155
Table 4.7 Effects of whole EOs on selected long chain fatty acids composition (g/100 g total fatty acids)
in cultures at 12, 24 and 48 h incubation………………………………………………………………...156
xvii
Table 4.8 Effects of whole EOs on the concentration of sums of fatty acids (g/100 g TFA) and content of
total fatty acids (mg/g) in cultures at 12, 24 and 48 h incubation………………………………………..157
Table 4.9 Effects of whole EOs on fatty acid ratios in cultures at 12, 24 and 48 h incubation…………158
Table 4.10 The effects of EOs on the biohydrogenation (g/100 g) of PUFA in cultures at 12, 24 and 48 h
incubation………………………………………………………………………………………………159
Table 5.1a Effects of EOs and EOCs on gas production (ml/g OM) and ammonia (mM) during 24 h
incubation………………………………………………………………………………………………179
Table 5.1b Effects of EOs and EOCs on gas production (ml/g OM) and ammonia (mM) (Significance of
main effects and interactions)……………………………………………………………………………179
Table 5.2a Effects of EOs and EOCs on total (mM) and molar proportions of VFA (mM/mol TVFA) at
24 h incubation…………………………………………………………………………………………...180
Table 5.2b Effects of EOs and EOCs on total VFA (mM) and molar proportions of VFA (mM/mol
TVFA) (Significance of main effects and interactions)………………………………………………….180
Table 5.3a Effects of whole EOs and EOCs on the concentration of selected C14/C16 fatty acids (g/100 g
TFA) in cultures at 12 and 24 h incubation……………………………………………………………...187
Table 5.3b Effects of whole EOs and EOCs on concentration of selected C14/C16 fatty acids (g/100 g
TFA) in cultures at 12 and 24 h incubation (Significance of main effects and interactions)……………187
Table 5.4a Effects of whole EOs and EOCs on the concentration of selected C18 fatty acids (g/100 g
TFA) in cultures at 12 and 24 h incubation……………………………………………………………...188
Table 5.4b Effects of whole EOs and EOCs on concentration of selected C18 fatty acids (g/100 g TFA)
in cultures at 12 and 24 h incubation (Significance of main effects and interactions)…………………..189
Table 5.5a Effects of whole EOs and EOCs on concentration of selected long chain fatty acids (g/100 g
total fatty acids) in cultures at 12 and 24 h incubation…………………………………………………..190
Table 5.5b Effects of whole EOs and EOCs on concentration of selected long chain fatty acids (g/100 g
total fatty acids) in cultures at 12 and 24 h incubation (Significance of main effects and
interactions)………………………………………………………………………………………………190
xviii
Table 5.6a Effects of whole EOs and EOCs on the concentration of fatty acids (g/100 g TFA) and content
of total fatty acids (mg/g) at 12 and 24 h………………………………………………………………...191
Table 5.6b Effects of whole EOs and EOCs on the concentration of fatty acids (g/100 g TFA) and content
of total fatty acids (mg/g) at 12 and 24 h (Significance of main effects and interactions)………………192
Table 5.7a The effects of EOs on the biohydrogenation (g/100 g) of PUFA in cultures at 12 and 24
h…………………………………………………………………………………………………………..193
Table 5.7b The effects of EOs on the biohydrogenation (g/100 g) of PUFA in cultures at 12 and 24 h
(Significance of main effects and interactions)…………………………………………………………..193
Table 6.1 Effects of four weeks of rumen adaptation to anise oil on animal performance and
concentrations of total volatile fatty acids (mM), molar proportion of individual VFA (mM/mol TVFA)
and NH3-N (mM) in vivo………………………………………………………………………………...211
Table 6.2 Effects of four weeks of rumen adaptation to anise oil on total gas (ml/g OM), ammonia
concentration (mM), total VFA (mM) and molar proportion of individual VFA (mM/mol TVFA) in
cultures during 48 h in vitro incubation………………………………………………………………….212
Table 6.3 Effects of four weeks of rumen adaptation to anise oil on concentration of selected fatty acids
(g/100 g total fatty acids) in cultures during 48 h in vitro incubation…………………………………...218
Table 6.4 Effects of four weeks of rumen adaptation to anise oil on the concentration of sum of fatty
acids (g/100 g TFA) and content of total fatty acids (mg/g) in cultures during 48 h in vitro incubation..219
Table 6.5 Effects of four weeks of rumen adaptation to anise oil on biohydrogenation of PUFA (g/100 g
TFA) in cultures during 48 h in vitro incubation………………………………………………………...220
xix
TABLE OF FIGURES
Figure 1.1 Fatty acid carbon atoms (Adapted from Stryer, 1988)…………………………………………3
Figure1.2 Example of simple lipids (Adapted from Christie (2007))……………………………………4
Figure 1.3 Example of complex lipids (Adapted from Christie (2007))…………………………………5
Figure 1.4 Examples of the C18:3 PUFAs and the position of double bonds (Adapted from Christie,
2007)………………………………………………………………………………………………………..8
Figure 1.5 Example of geometric isomerism in PUFA……………………………………………………8
Figure 1.6 Elongation and desaturation pathways of the n-3 and n-6 fatty acids (Adapted from Barcelo-
Coblijn and Murphy, 2009)………………………………………………………………………………..14
Figure 1.7 Pathways of BH of linolenic and linoleic acid (Adapted from Harfoot and Hazlewood,
1997)………………………………………………………………………………………………………29
Figure 1.8 Biohydrogenation pathways of the main putative secondary and primary intermediates of LA
and LNA (Adapted from Chilliard et al., 2007). Thin arrows represent other possible secondary pathways
whereas thick arrows represent the primary pathways……………………………………………………30
Figure 1.9 Techniques for protecting dietary fat (Adapted from Scott and Ashes,
1993)………………………………………………………………………………………………………40
Figure 1.10 Chemical structures of different components of EOs (Adapted from Patra, 2102)………….54
Figure 1.11 Mechanisms and sites in the microbial cell considered to be the locations of actions for EOCs
(Adapated from Burt, 2004)……………………………………………………………………………….56
Figure 1.12 Four separate pathways for the production of methane (Adapted from Chesworth et al.,
1998)………………………………………………………………………………………………………68
1
Introduction
Within the last few decades, remarkable changes in consumption of diets (shifts from the consumption of
plant based products to mainly products of animal origin) took place in both the developed and the
developing countries (World Health Organization, WHO, 2003). Increased human population, per capita
income and urbanization are some of the driving factors of these changes (WHO, 2003). These changes
have great direct implications for human health and indirect economic impacts. The direct health impacts
result from the combined increase in consumption and the imbalance in the composition of ruminant
animal fats, which are traditionally high in saturated fatty acids (SFA) and low in polyunsaturated fatty
acids (PUFA) (Williams, 2000; Scollan et al., 2006). Increased occurrence of chronic diseases such as
diabetes, obesity, compromised immune system and cardiovascular diseases (CVD) are some of these
health challenges (Givens, 2005). These animal food products provide more than 30% of the total
consumed energy and fat contributes about 50% of this energy (Givens, 2005). In 2003, WHO
recommended less than 1% of trans FA, less than 10% of SFA and less than 15-30% of total fat to
constitute the total consumed energy in human diets, because SFA is a risk factor of CVD. Unlike SFA,
PUFA have among other positive health benefits, the potential to lower blood cholesterol. There is a
positive relationship between increased intake of n-3 PUFA and reduced risk of coronary heart disease
(CHD) (Abeywardena and Patten, 2011). These benefits, at least in part, explain why The Department of
Health (1994) recommended increased intake of dietary n-3 PUFA over SFA. The economic impacts of
these changes in consumption are due to the expensive nature (direct and indirect costs) of treating
chronic diseases. The cost of treating CVD is more (over $400 billion) than the combine cost of HIV
(about $29 billion) and cancers (about $200 billion) (Thom et al., 2006). In 1994, the Department of
Health reported that 27% of all deaths recorded in the UK were caused by CHD. In about a decade after,
WHO (2003) reported that approximately 60% of the total 56.5 million global deaths reported in 2001
were caused by chronic disease. The greater concern is the 75% of global deaths which is projected to
result from chronic diseases by 2020 (WHO/FAO, 2003). Similarly, intake of animal food products (milk
and meat) is projected to increase by 2030 (WHO, 2003). This situation is set to worsen the
aforementioned health and economic impacts of these changes.
2
High content of SFA in ruminant derived food products is caused by hydrolysis of dietary lipids and the
subsequent hydrogenation of the constituent PUFA by rumen microbes (Kim et al., 2009a). The process
of biohydrogenation (BH) of C18:2 n-6 and C18:3 n-3 produces various intermediates such as conjugated
linoleic acid (CLA) and Vaccenic acid (trans-11 18:1) (Harfoot and Hazlewood, 1997; Lee and Jenkins,
2011), which have been shown to have potential health benefits. The CLA (cis-9 trans-11 18:2 isomer)
and its precursor (18:1 trans-11) have attracted considerable research attention as anti-carcinogenic, anti-
inflammatory, anti-atherogenic and anti-diabetic agents (Kritchevsky, 2000, Kennedy et al., 2010).
Identification of additives to reduce biohydrogenation of PUFA would lessen both the health and
economic impacts of this seemingly inevitable change in consumption pattern.
A number of animal feeding strategies have been developed over the years to improve the PUFA content
of ruminant food products through modification of rumen biohydrogenation, but these have been
considerably inefficient (Fievez et al., 2007; Jenkins and Bridges, 2007). Formaldehyde treatment of free
oil and protein mixtures has been described as effective in increasing the flow of 18:3 n-3 to the
abomasum of goats (Scott et al., 1971), and in reducing the in vitro biohydrogenation of 18:2 n-6 (Gulati
et al., 1997). However, beside the fact that the use of formaldehyde would potentially be criticized by
regulatory authorities, the inconsistency of formaldehyde alone to reduce biohydrogenation of either 18:3
n-3 or 18:2 n-6 was reported by Sinclair et al. (2005). Recently, the potential of plant extracts such as
essential oils (EOs) or their constituent compounds (EOCs) as rumen modifiers is receiving significant
attention (Burt, 2004; Calsamiglia et al., 2007; Hart et al., 2008). Plants and their extracts are potential
alternative because they are natural components of animal feed (Cowan, 1999). The effects of EOs or
EOCs on methane production and ammonia nitrogen metabolism have been adequately investigated and
recently reviewed (Patra, 2011). However, there is a scarcity of information on the effects of EOs or
EOCs as modifiers of rumen biohydrogenation of PUFA. The aim of this PhD study was to compare the
potential of EOs and EOCs as feed additives to reduce the extent of rumen biohydrogenation of n-3
PUFA.
3
CHAPTER 1
1.0. LITERATURE REVIEW
1.1. Definition and classification of lipids
Generally, lipids can be defined as a group of naturally occurring organic compounds or chemically
heterogeneous substances, which are soluble in organic solvents such as benzene, hydrocarbons, ethers,
alcohols and chloroform, but insoluble in water (Fahy et al., 2009; Fahy et al., 2011). A wide range of
molecules, such as fatty acids, terpenes, phospholipids, sphingolipids, sterols, etc. possess these chemical
characteristics. In functional terms, ‘lipid’ refers to a diverse group of compounds possessing different
fundamental roles in the body such as storage of energy, metabolic fat and as structural components of
cell membranes (Fahy et al., 2011). The variation in the structure of lipid molecule accounts for their
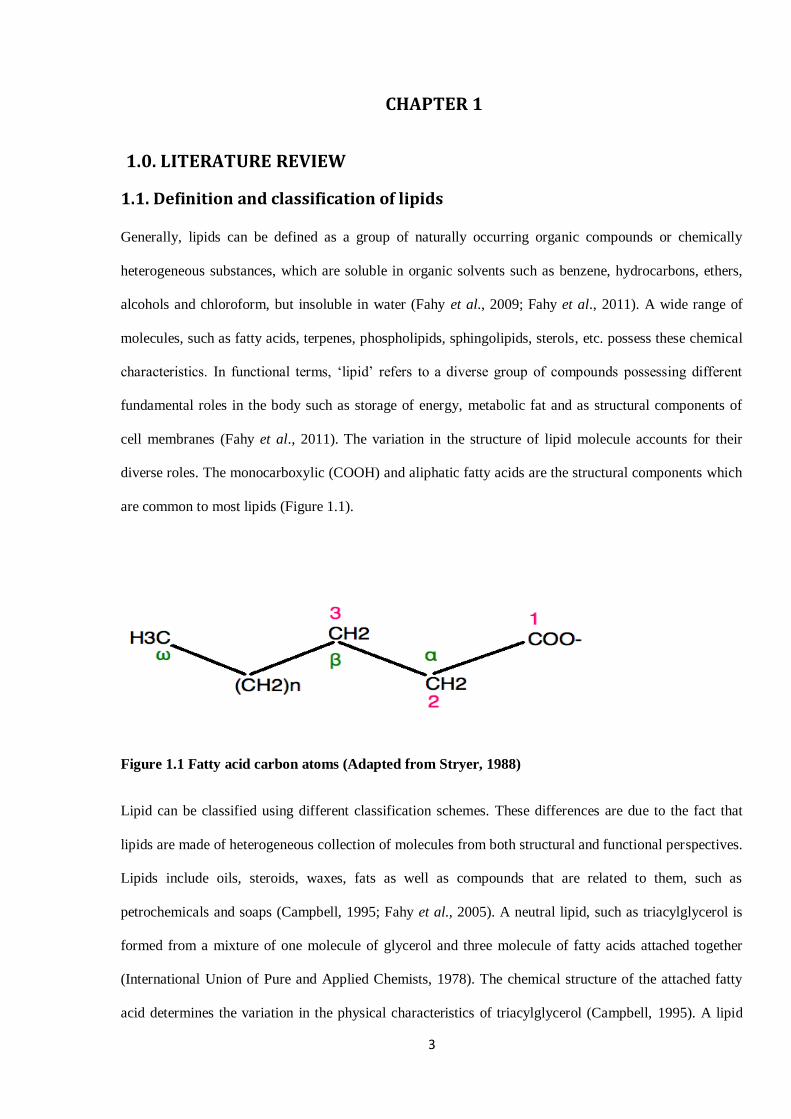
diverse roles. The monocarboxylic (COOH) and aliphatic fatty acids are the structural components which
are common to most lipids (Figure 1.1).
Figure 1.1 Fatty acid carbon atoms (Adapted from Stryer, 1988)
Lipid can be classified using different classification schemes. These differences are due to the fact that
lipids are made of heterogeneous collection of molecules from both structural and functional perspectives.
Lipids include oils, steroids, waxes, fats as well as compounds that are related to them, such as
petrochemicals and soaps (Campbell, 1995; Fahy et al., 2005). A neutral lipid, such as triacylglycerol is
formed from a mixture of one molecule of glycerol and three molecule of fatty acids attached together
(International Union of Pure and Applied Chemists, 1978). The chemical structure of the attached fatty
acid determines the variation in the physical characteristics of triacylglycerol (Campbell, 1995). A lipid
4
containing phosphoric acid as di-ester or mono-ester is known as a phospholipid (IUPAC, 1978), which is
the main building block of cell membranes (Webb and O’Neill, 2008). Lipids are further divided into
simple and complex classes for the convenience of chromatography analysis (Christie, 1983; Christie,
2007; Fahy et al., 2009). Detailed and more complex classification of lipids is beyond the scope of this
review, however, comprehensive update of lipid classification can be found in the review by Fahy et al.
(2009).
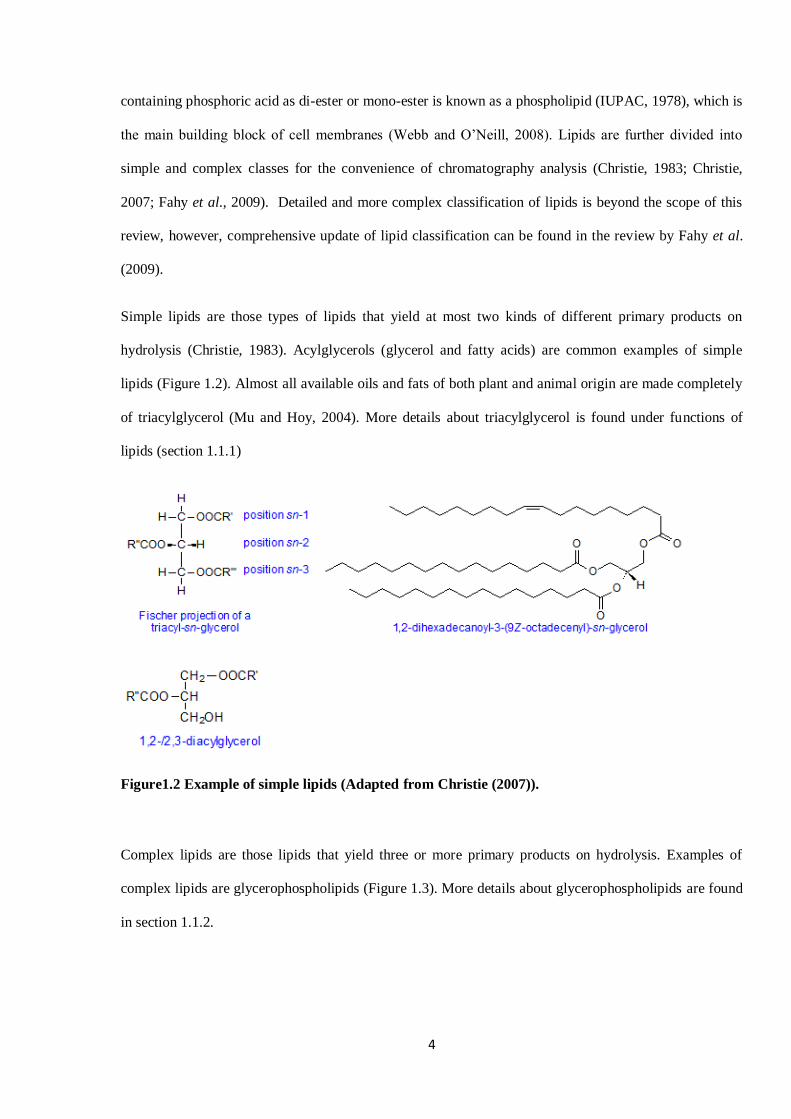
Simple lipids are those types of lipids that yield at most two kinds of different primary products on
hydrolysis (Christie, 1983). Acylglycerols (glycerol and fatty acids) are common examples of simple
lipids (Figure 1.2). Almost all available oils and fats of both plant and animal origin are made completely
of triacylglycerol (Mu and Hoy, 2004). More details about triacylglycerol is found under functions of
lipids (section 1.1.1)
Figure1.2 Example of simple lipids (Adapted from Christie (2007)).
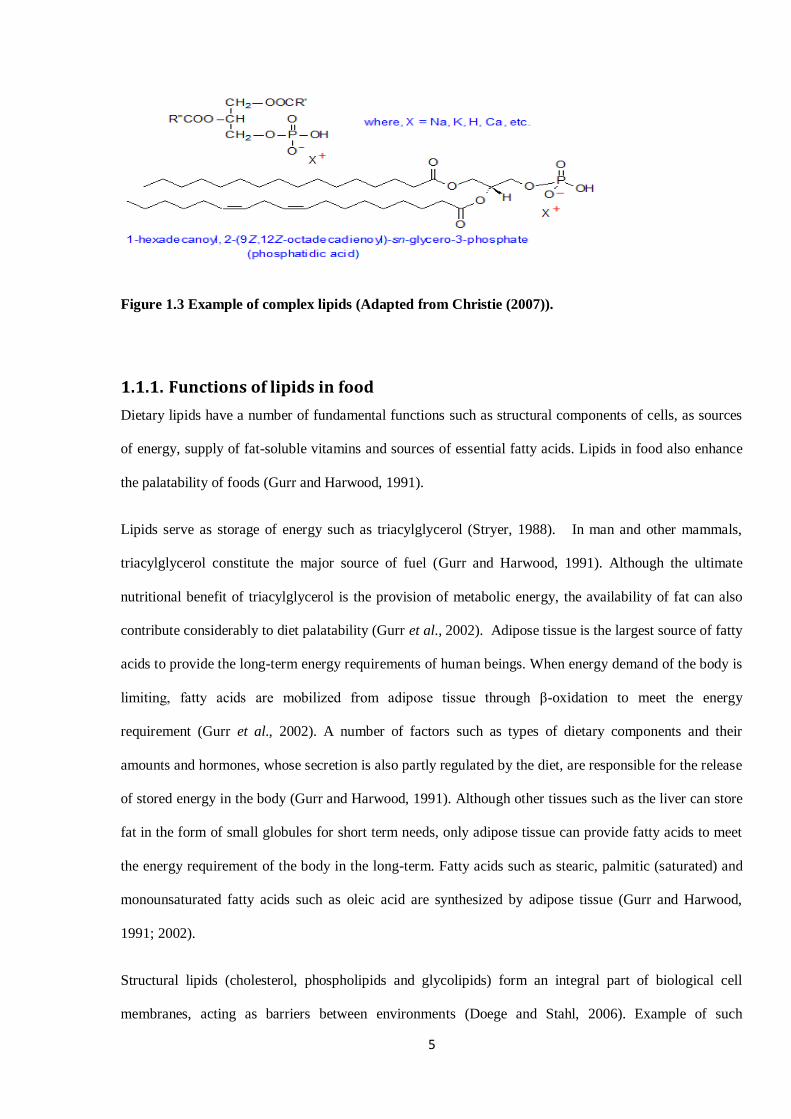
Complex lipids are those lipids that yield three or more primary products on hydrolysis. Examples of
complex lipids are glycerophospholipids (Figure 1.3). More details about glycerophospholipids are found
in section 1.1.2.
5
Figure 1.3 Example of complex lipids (Adapted from Christie (2007)).
1.1.1. Functions of lipids in food
Dietary lipids have a number of fundamental functions such as structural components of cells, as sources
of energy, supply of fat-soluble vitamins and sources of essential fatty acids. Lipids in food also enhance
the palatability of foods (Gurr and Harwood, 1991).
Lipids serve as storage of energy such as triacylglycerol (Stryer, 1988). In man and other mammals,
triacylglycerol constitute the major source of fuel (Gurr and Harwood, 1991). Although the ultimate
nutritional benefit of triacylglycerol is the provision of metabolic energy, the availability of fat can also
contribute considerably to diet palatability (Gurr et al., 2002). Adipose tissue is the largest source of fatty
acids to provide the long-term energy requirements of human beings. When energy demand of the body is
limiting, fatty acids are mobilized from adipose tissue through β-oxidation to meet the energy
requirement (Gurr et al., 2002). A number of factors such as types of dietary components and their
amounts and hormones, whose secretion is also partly regulated by the diet, are responsible for the release
of stored energy in the body (Gurr and Harwood, 1991). Although other tissues such as the liver can store
fat in the form of small globules for short term needs, only adipose tissue can provide fatty acids to meet
the energy requirement of the body in the long-term. Fatty acids such as stearic, palmitic (saturated) and
monounsaturated fatty acids such as oleic acid are synthesized by adipose tissue (Gurr and Harwood,
1991; 2002).
Structural lipids (cholesterol, phospholipids and glycolipids) form an integral part of biological cell
membranes, acting as barriers between environments (Doege and Stahl, 2006). Example of such

6
protection in the form of barrier is the skin, which is covered with a layer of protective lipids such as
mono-, di- and triglycerols, sterol and sterol esters, unsaturated fatty acids (USFA), hydrocarbons and
wax esters (Gurr and Harwood; 1992). The ability of fat to exclude water is partly one of the roles of fat
in biological barriers. The chemical feature of part of the fat molecule which is hydrophobic (water
hating) is the physical characteristic feature which accounts for their insolubility in water (Gurr and
Harwood, 1991). The physical properties of fat are mainly determined by the nature of the fatty acid
chain. Therefore, fat is softer when the melting point is low due to larger number of double bonds (degree
of unsaturation) in the fatty acid chain. Because fats provide the framework on which much of the
complex chemistry of the cell takes place, fats also occur within the cell (Stryer 1988; Gurr and Harwood,
1991). Phospholipids and glycolipids are also found in animal cell membranes. Some of the lipids
required for the growth and development of tissue can be synthesized by the cells. However, FAs such as
α-linolenic and linoleic acids (known as essential fatty acids) must be supplied in the diet as they cannot
be synthesized by the cells (Gurr et al., 2002). Once these essential fatty acids are incorporated into cells,
their elongation or desaturation can lead to the synthesis of long chain PUFA such as C20:5 n-3 and
C22:6 n-3.
Lipids such as eicosanoids, steroid hormones and prostaglandins participate in signalling pathways and
have recently been shown to have the potential for the exhibition of molecular roles such as regulation of
local hormones and intracellular cell signal transduction (Eyster, 2007). In the structural and storage
functions of lipids, their ability to associate and interact with each other, such as amphiphilic sheets in
membranes and as hydrophobic globules in stored fat is their characteristic feature (Gurr and Harwood,
1991). Stored fats must undergo biochemical transformation for them to become physiologically useful.
For instance, specific types of unsaturated FAs which are stored in membrane phospholipids can be
transformed to hormone-like substances (such as eicosanoids) and cholesterol is metabolized in the
adrenal gland to vitamin D in the skin, to a variety of steroid hormones and to bile acids in the liver (Gurr
and Harwood, 1991). Fat soluble vitamins which are involved in metabolic processes can also be called
metabolic lipids. Fat soluble vitamins which are present in fatty foods are vitamins A, D, E and K. It has
7
long been established that vitamins are key requirements in the diet to maintain health, and sustain normal
growth and reproductive efficiency of the body (Gurr et al., 2002).
1.2. Nomenclature of fatty acids
The nomenclature of FA falls into two principal classes: the common or trivial names and the systematic
names. The former uses abbreviations as the convenient way of defining fatty acids. According to the
International Union of Pure and Applied Chemistry (IUPAC, 1977), the nomenclature of n-9, n-6 and n-3
polyunsaturated fatty acids can be determined by the position of the first double bond on the carbon
chain. Example, α-linolenic acid (LNA; C18:3 n-3) is an essential fatty acid with n-3 and 18-carbon
atoms. The n-3 is the position where the first double bond is located on the carbon backbone from the
methyl end, 3 is the number of double bonds on the chain, and 18 refers to the number of carbon atoms
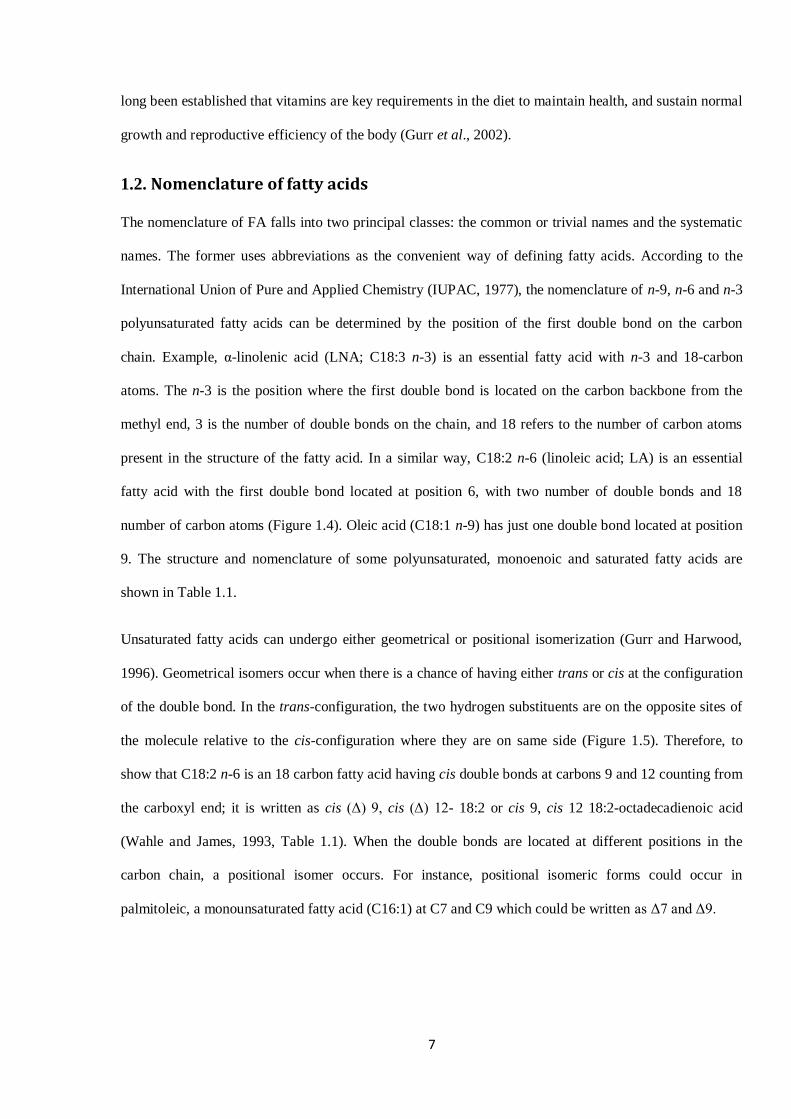
present in the structure of the fatty acid. In a similar way, C18:2 n-6 (linoleic acid; LA) is an essential
fatty acid with the first double bond located at position 6, with two number of double bonds and 18
number of carbon atoms (Figure 1.4). Oleic acid (C18:1 n-9) has just one double bond located at position
9. The structure and nomenclature of some polyunsaturated, monoenoic and saturated fatty acids are
shown in Table 1.1.
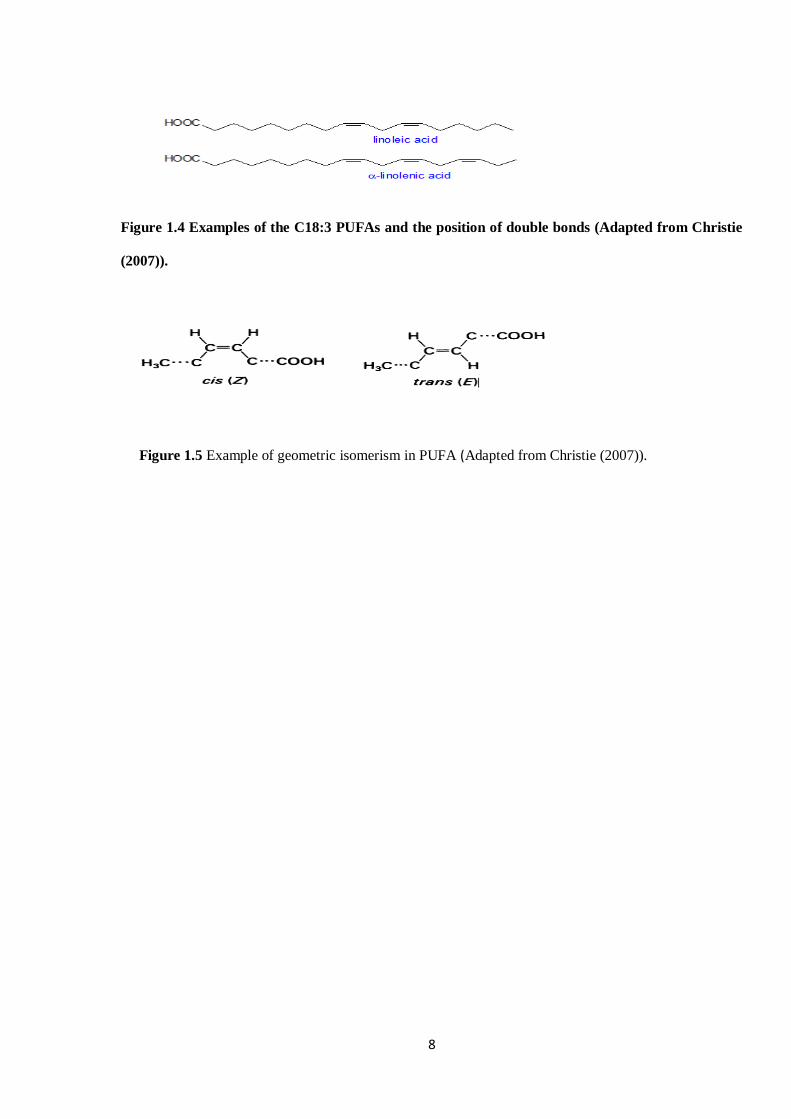
Unsaturated fatty acids can undergo either geometrical or positional isomerization (Gurr and Harwood,
1996). Geometrical isomers occur when there is a chance of having either trans or cis at the configuration
of the double bond. In the trans-configuration, the two hydrogen substituents are on the opposite sites of
the molecule relative to the cis-configuration where they are on same side (Figure 1.5). Therefore, to
show that C18:2 n-6 is an 18 carbon fatty acid having cis double bonds at carbons 9 and 12 counting from
the carboxyl end; it is written as cis (Δ) 9, cis (Δ) 12- 18:2 or cis 9, cis 12 18:2-octadecadienoic acid
(Wahle and James, 1993, Table 1.1). When the double bonds are located at different positions in the
carbon chain, a positional isomer occurs. For instance, positional isomeric forms could occur in
palmitoleic, a monounsaturated fatty acid (C16:1) at C7 and C9 which could be written as Δ7 and Δ9.
8
Figure 1.4 Examples of the C18:3 PUFAs and the position of double bonds (Adapted from Christie
(2007)).
Figure 1.5 Example of geometric isomerism in PUFA (Adapted from Christie (2007)).
9
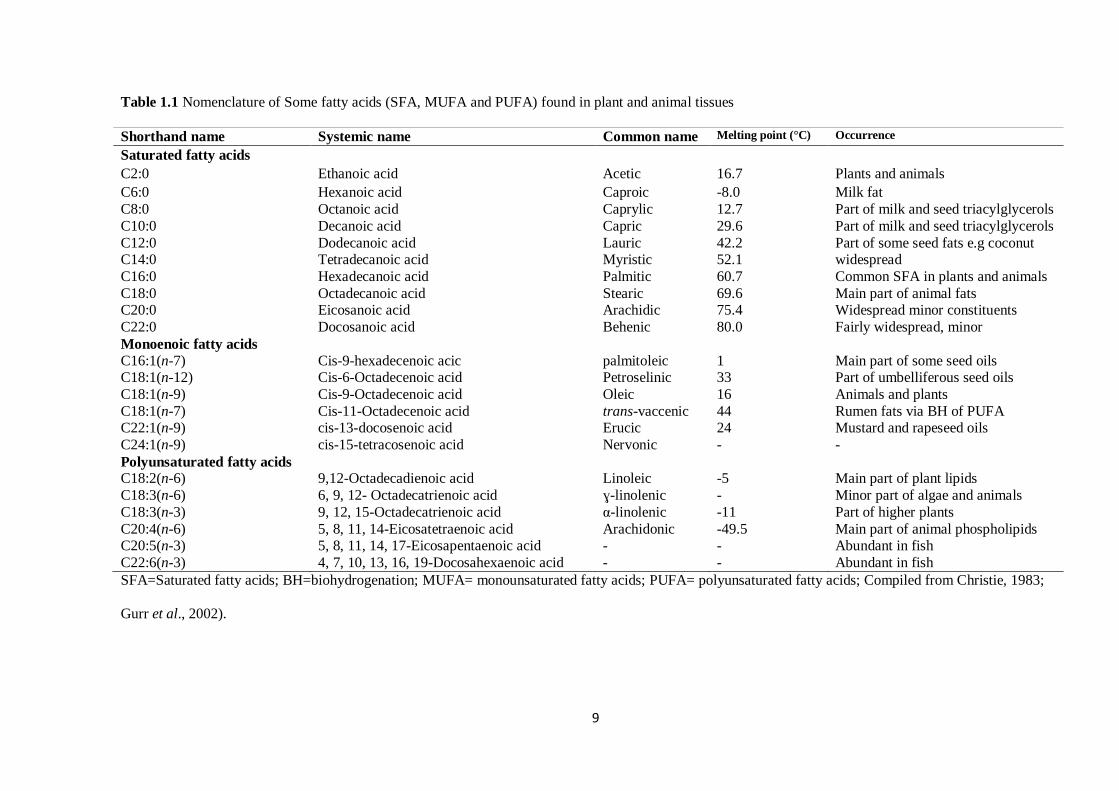
Table 1.1 Nomenclature of Some fatty acids (SFA, MUFA and PUFA) found in plant and animal tissues
Shorthand name Systemic name Common name Melting point (°C) Occurrence
Saturated fatty acids
C2:0 Ethanoic acid Acetic 16.7 Plants and animals
C6:0 Hexanoic acid Caproic -8.0 Milk fat
C8:0 Octanoic acid Caprylic 12.7 Part of milk and seed triacylglycerols
C10:0 Decanoic acid Capric 29.6 Part of milk and seed triacylglycerols
C12:0 Dodecanoic acid Lauric 42.2 Part of some seed fats e.g coconut C14:0 Tetradecanoic acid Myristic 52.1 widespread
C16:0 Hexadecanoic acid Palmitic 60.7 Common SFA in plants and animals
C18:0 Octadecanoic acid Stearic 69.6 Main part of animal fats C20:0 Eicosanoic acid Arachidic 75.4 Widespread minor constituents
C22:0 Docosanoic acid Behenic 80.0 Fairly widespread, minor
Monoenoic fatty acids
C16:1(n-7) Cis-9-hexadecenoic acic palmitoleic 1 Main part of some seed oils C18:1(n-12) Cis-6-Octadecenoic acid Petroselinic 33 Part of umbelliferous seed oils
C18:1(n-9) Cis-9-Octadecenoic acid Oleic 16 Animals and plants
C18:1(n-7) Cis-11-Octadecenoic acid trans-vaccenic 44 Rumen fats via BH of PUFA C22:1(n-9) cis-13-docosenoic acid Erucic 24 Mustard and rapeseed oils
C24:1(n-9) cis-15-tetracosenoic acid Nervonic - -
Polyunsaturated fatty acids C18:2(n-6) 9,12-Octadecadienoic acid Linoleic -5 Main part of plant lipids
C18:3(n-6) 6, 9, 12- Octadecatrienoic acid ɣ-linolenic - Minor part of algae and animals
C18:3(n-3) 9, 12, 15-Octadecatrienoic acid α-linolenic -11 Part of higher plants
C20:4(n-6) 5, 8, 11, 14-Eicosatetraenoic acid Arachidonic -49.5 Main part of animal phospholipids C20:5(n-3) 5, 8, 11, 14, 17-Eicosapentaenoic acid - - Abundant in fish
C22:6(n-3) 4, 7, 10, 13, 16, 19-Docosahexaenoic acid - - Abundant in fish
SFA=Saturated fatty acids; BH=biohydrogenation; MUFA= monounsaturated fatty acids; PUFA= polyunsaturated fatty acids; Compiled from Christie, 1983;
Gurr et al., 2002).
10
1.2.1. Fatty acids
Fatty acids, whether of animal or plant origin, consist of even number of carbons (from C4-C24),
hydrogen (H) and oxygen (O). These elements are arranged in straight chains with a terminal carboxyl
group. Fatty acid could be classified on the basis of two fundamental concepts: the degree of
saturation and the chain length. On the basis of the former, FA could be unsaturated or saturated
depending on the presence or absence of double bonds in the carbon chain. Unsaturated fatty acids
(UFA) have double bonds in their chain structure. The number of double bonds in the structure of
UFA also classifies fatty acids into monounsaturated and polyunsaturated FA. Based on the number of
double bonds present within the carbon chain, fatty acids in mammalian tissues are categorized as
polyunsaturated fatty acids (PUFA), monounsaturated fatty acids (MUFA) and saturated fatty acids
(SFA). On the basis of chain length, FA may have as many as thirty carbons.
1.2.2. Saturated fatty acids
A saturated fatty acid is a FA in which the carbon chain is completely hydrogenated (zero double
bonds). Majority of SFA have straight chain structures with an even number of carbon atoms (Table
1.1). Although shorter (from 4-14 carbon atoms) chains of SFA occur in milk, the most common fatty
acids in animal tissues are those containing between C12-C24 (Enser et al., 1984; Table1.1). Myristic
acid (C14:0) which is a major component of seed oil from myristicaceae family is a minor constituent
of the animal lipids (Christie, 1983). The commonest SFA in both plant and animal is C16:0 (palmitic
acid), whilst C18:0 (Stearic acid) is less common compared to C16:0, but may be more abundant than
palmitic in some cases (Christie, 1983). Although in fish and bacterial species, large amounts of
longer chain FAs may occur but are less frequent in animal tissues. SFA longer than 10 carbon atoms
are comparatively inert chemically and can be subjected to vigorous chemical conditions because of
the absent of functional groups except the carboxyl group (Christie, 1983; Enser et al., 1984).
Although SFA are generally considered to be risk factors of coronary heart disease and cancers, stearic
acid is a neutral fatty acid (Webb and O’Neill, 2008). It has been recommeneded that saturated fatty
acids should contribute about 10% of the total 30% of lipid energy intake that is considered as normal
for humans (World Health Organization; WHO, 2003). The ratio of polyunsaturated fatty acids to
11
saturated fatty acid (P:S) in human diets was recommemded to be above 0.4 (WHO, 2003), whilst the
recommended ratio of n-6/n-3 is a value less than 4 (Webb and O’Neill, 2008). Nowadays ruminant
meats have been considered to be causing the imbalance in the consumption of fatty acid as they have
a P:S ratio of about 0.1 (Enser et al., 1996). Both P:S and n-6:n-3 in ruminant meat can be potentially
improved through dietary manipulation (Wood et al., 2003).
1.2.3. Monounsaturated fatty acids
Unlike PUFA, MUFA are the group of FA with just one double bond in the carbon chain. The double
bond is usually present between carbon atoms 9 and 10 counting from the alpha carbon, but in some
cases, the double bonds could be between 7 and 8 carbon atoms. Unlike SFA, monoenoic fatty acids
are more susceptible to chemical attack by oxidising agents (Wahle and James, 1993).
Palmitoleic acid (C16:1) is a constituent of most animal fats and may be found in significant
concentrations in some seed oil and fish oils. The most abundant monoenoic acid is oleic acid
(C18:1n-9), and is present in almost all plant and animal lipids. Although trans vaccenic (C18:1 trans
11) acid is an intermediate product of rumen biohydrogenation of PUFA, it is found in low
concentrations in ruminant lipids (Enser et al., 1984). In a single natural lipid, many different
positional isomers of MUFA may be present. For example, in bovine milk triacylglycerides, eleven
different trans-octadecenoic acids and five different cis- octadecenoic acids have been reported
(Christie, 1983). Monoenoic acids of long chain fatty acids (C20 and C22) are present in large
amounts in fish oils and seed oils such as rapeseed oil. Shorter chain monoenoic acids are found in
milk but rarely present in appreciable concentrations in other tissues. In bacterial and fish oil lipids,
odd chain monoenoic acids are found in considerable concentrations but are minor constituents of
animal lipids (Enser et al., 1984; Table1.1).
12
1.2.4. Polyunsaturated fatty acids
Polyunsaturated fatty acids are a category of FA with more than one double bond, and could have up
to six (maximum) double bonds in their carbon chain structures. According to their biosynthetic
derivation, PUFA of plant and animal lipids can be sub-grouped as n-3, n-6, n-7 and n-9 (Brenner,
1989). Although the focus of review in this area is on the n-3 and n-6, brief information on n-7 and n-9
would be provided. The fatty acids in each sub-group have the same terminal structure (-COOH) and
the carbon chain structures contain two or more cis-double bonds, which are generally separated by a
single methylene group (-CH2). The higher the double bond in polyunsaturated fatty acids the more the
susceptibility to oxidative attack (Gurr and Harwood, 1991).
1.2.4.1. n-3 and n-6 PUFA
Alpha-linolenic acid (C18:3 n -3) or cis-9, cis-12, cis-15-Octadecatrienoic acid (Table 1.1), which is a
C-18 PUFA, is rarely found in large amounts in animal lipids but is a major component of plant lipids
(Christie, 1983). Linolenic acid is an essential fatty acid (EFA) and a precursor of the long chain n-3
fatty acids such as C20:5 n-3 or eicosapentaenoic acid (5, 8, 11, 14, 17-eicosapentaenoic, EPA) and
C22:6 n-3 or docosahexaenoic acid (4, 7, 10, 13, 16, 19-Docosahexaenoic acid) in animal lipids
(Enser, 1984; Barcelo-Coblijn and Murphy, 2009; Figure 1.6). The long chain n-3 PUFA are present
in significant concentrations in fish oils and are major components of phospholipids in many animal
tissues (Brenner, 1989).
Essential fatty acids perform vital functions in immune response and they are known carriers of the
fat soluble vitamins such as vitamins A, D, E and K (Webb and O’Neill, 2008). Linoleic acid (cis-9,
cis-12-octadecadienoic acid, LA) and LNA are the two EFA with 18-carbon atoms, whereas EPA and
arachidonic acid (C20:4 n-6) which are formed by the desaturation and elongation of linolenic and
linoleic acids respectively, are the two most important C20 EFA (Smith, 2007). The importance of
these FAs in humans was first demonstrated in the early 1980s (Holman et al., 1982). Since it is
established that some long chain n-3 fatty acids such as EPA and DHA are metabolically synthesized
from C18:3 n -3 (Figure 1.6), it has been considered as the important precursor of the group of fatty
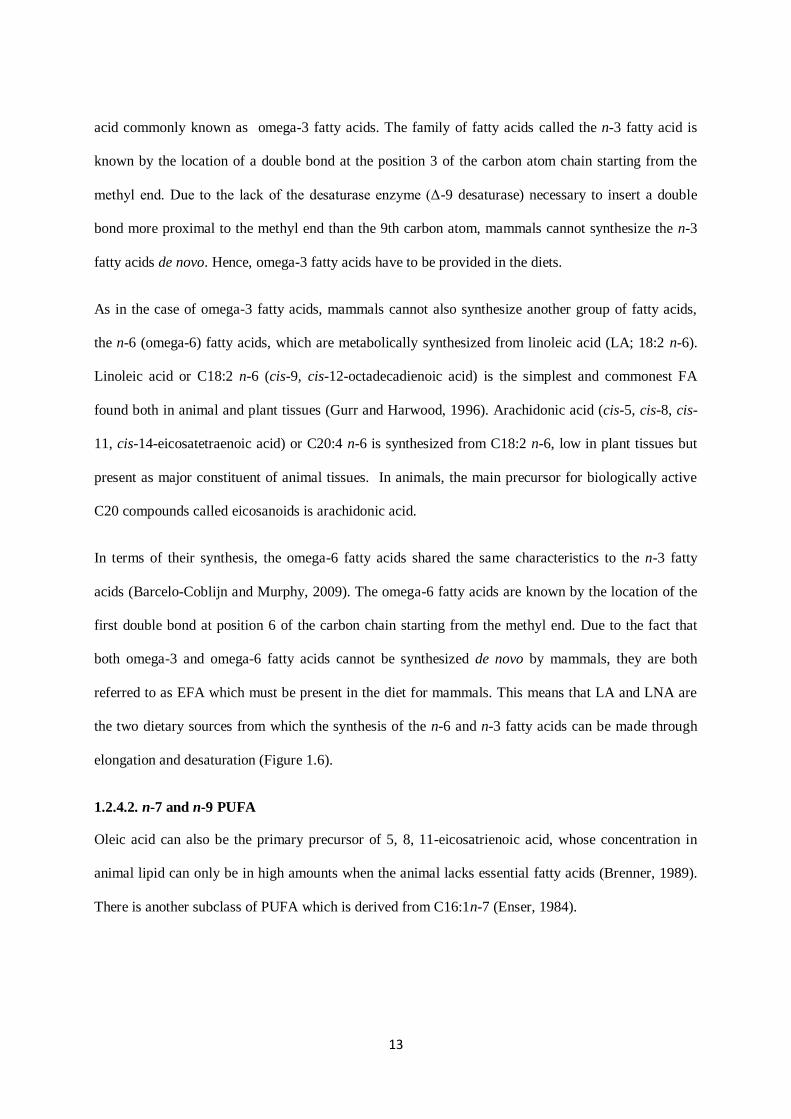
13
acid commonly known as omega-3 fatty acids. The family of fatty acids called the n-3 fatty acid is
known by the location of a double bond at the position 3 of the carbon atom chain starting from the
methyl end. Due to the lack of the desaturase enzyme (Δ-9 desaturase) necessary to insert a double
bond more proximal to the methyl end than the 9th carbon atom, mammals cannot synthesize the n-3
fatty acids de novo. Hence, omega-3 fatty acids have to be provided in the diets.
As in the case of omega-3 fatty acids, mammals cannot also synthesize another group of fatty acids,
the n-6 (omega-6) fatty acids, which are metabolically synthesized from linoleic acid (LA; 18:2 n-6).
Linoleic acid or C18:2 n-6 (cis-9, cis-12-octadecadienoic acid) is the simplest and commonest FA
found both in animal and plant tissues (Gurr and Harwood, 1996). Arachidonic acid (cis-5, cis-8, cis-
11, cis-14-eicosatetraenoic acid) or C20:4 n-6 is synthesized from C18:2 n-6, low in plant tissues but
present as major constituent of animal tissues. In animals, the main precursor for biologically active
C20 compounds called eicosanoids is arachidonic acid.
In terms of their synthesis, the omega-6 fatty acids shared the same characteristics to the n-3 fatty
acids (Barcelo-Coblijn and Murphy, 2009). The omega-6 fatty acids are known by the location of the
first double bond at position 6 of the carbon chain starting from the methyl end. Due to the fact that
both omega-3 and omega-6 fatty acids cannot be synthesized de novo by mammals, they are both
referred to as EFA which must be present in the diet for mammals. This means that LA and LNA are
the two dietary sources from which the synthesis of the n-6 and n-3 fatty acids can be made through
elongation and desaturation (Figure 1.6).
1.2.4.2. n-7 and n-9 PUFA
Oleic acid can also be the primary precursor of 5, 8, 11-eicosatrienoic acid, whose concentration in
animal lipid can only be in high amounts when the animal lacks essential fatty acids (Brenner, 1989).
There is another subclass of PUFA which is derived from C16:1n-7 (Enser, 1984).
14
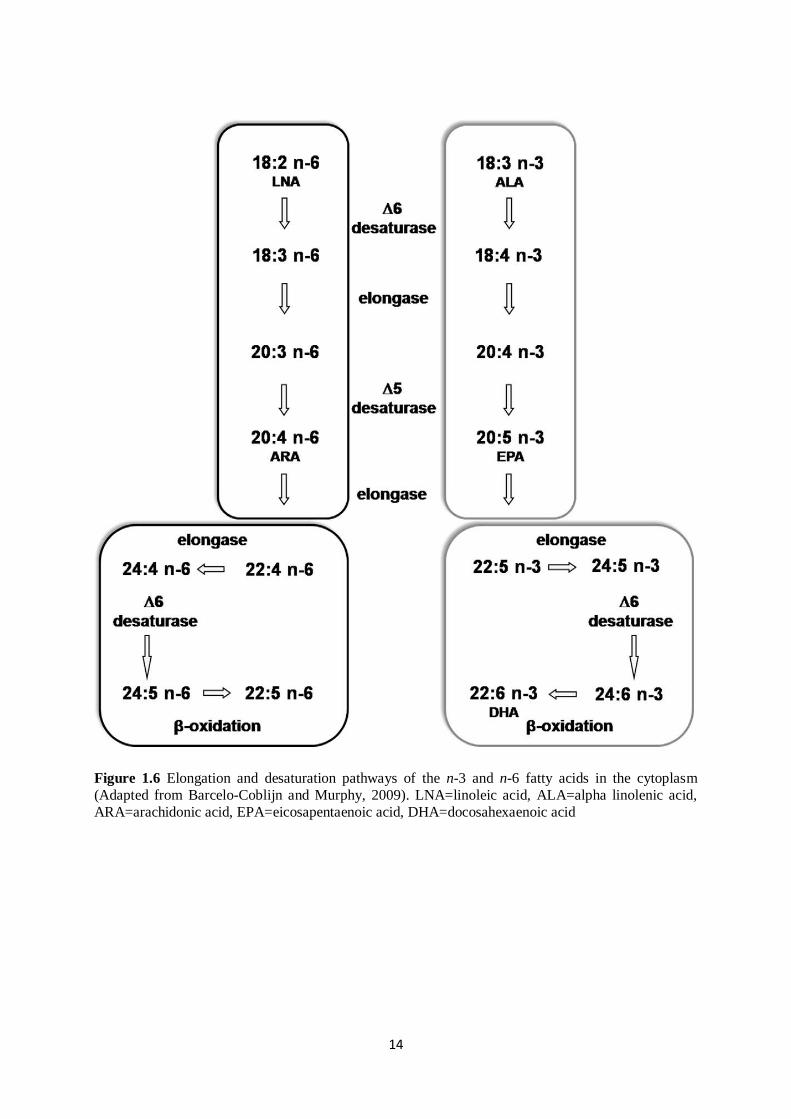
Figure 1.6 Elongation and desaturation pathways of the n-3 and n-6 fatty acids in the cytoplasm
(Adapted from Barcelo-Coblijn and Murphy, 2009). LNA=linoleic acid, ALA=alpha linolenic acid,
ARA=arachidonic acid, EPA=eicosapentaenoic acid, DHA=docosahexaenoic acid
15
1.2.5. Contribution of ruminant food products to global food security
The main source of milk for human consumption is from ruminant livestock. Milk is rich in energy,
protein, fat and minerals such as calcium and iron including essential vitamins (National Research
Council, 1998; Newman et al., 2003; Givens, 2005). Milk contains 3-5% fat, which is responsible for
many of the manufacturing, sensory and physical properties of dairy products (Kaylegian and Lindsay,
1995; Jensen, 2002). In the milk fat composition, the proportion of PUFA is insignificant (5%) relative
to the levels of SFA (70-75%) and 20-25% of MUFA (Lock and Shingfield, 2004). The fatty acid
composition of milk has both positive and negative implications for the health of consumers
(Williams, 2000). The high content of SFA which is directly related to the risk of cardiovascular
disease accounts for the negative implications of milk fat composition (WHO, 2003). In addition,
increased intakes of SFA may be associated with a higher fasting plasma glucose and insulin
concentrations and higher risk of impaired glucose tolerance (Parker et al., 1993; Feskens et al., 1995).
Similarly, beef is enriched with high quality protein, energy, a wide range of minerals such as Fe, Zn
and a number of essential vitamins including B12, B6, B2 and B1 (De Smet, 2012). In countries with
limited access to sea and where the consumption of sea food products is reduced, the intake of beef
can be a direct source of omega-3 PUFA such as 18:3 n-3, 20:5 n-3 and 22:6 n-3. These n-3 fatty acids
have a number of health benefits (see section 1.2.6). However, the concentrations of SFA (45-55% of
total FA) and trans-fatty acids (3-10%) in beef are higher than the levels of PUFA (Mapiye et al.,
2015). The consumption of high SFA has been associated with increased risk of several diseases such
as cardiovascular disease and cancer (Gurr and Harwood, 1991; Salter, 2013).
In both the developed and developing countries, the roles of milk and beef to the food and nutrition
security are distinct. In developed countries such as the UK and the US, there is an abundant supply of
milk and beef and, their accessibility and affordability is not a problem. However, there are concerns
about the health implications of these foods because they are relatively rich sources of SFA which are
known to increase the risk of the so called “diseases of affluence” such as cardiovascular diseases and
obesity (McNeill & Van Elswyk, 2012). By contrast, in the developing countries, the intake of beef
16
provides essential nutrients to complement the nutritionally poor plant food sources (based on one type
of cereal or root crop) (Mapiye et al., 2015). Therefore, in these countries, the consumption of beef is
seen as essential in terms of reducing the so called “diseases of poverty” (McNeill & Van Elswyk,
2012). These diseases of poverty which are responsible for impaired mental development, increased
exposure to infection and impairment of growth are the results of deficiencies in bioavailable
micronutrients such as Zn, Fe, B-vitamins, n-3 PUFA and protein (McNeill & Van Elswyk, 2012). In
the developing countries, urbanisation, increasing population growth and high purchasing power are
expected to strongly increase the demand for milk and beef in the coming decades (FAO, 2009).
The intake of ruminant food products makes a substantial contribution to meeting food and nutrition
security through the provision of the above mentioned nutrients. However, research to find dietary
strategies to increase the ratio of PUFA to SFA in beef and milk is necessary as a useful means of
reducing the risk of ‘diseases of affluence’ and “diseases of poverty” in the developed and the
developing countries, respectively.
1.2.6. Nutritional importance of PUFA, CLA and MUFA in human diets
Alpha linolenic acid, C20:5 n-3 and C22:6 n-3 are the most important n-3 fatty acids. As mentioned
previously, C18:3 n-3 is synthesized in plants whilst C20:5 n-3 and C22:6 n-3 are predominantly in
marine products. Interest in the potential benefits of C18:3 n-3 has been on the increase as it is the
metabolic precursor of EPA and DHA, which have a number of benefits in human health.
Physiologically, C18:3 n-3 is as important as its metabolites such as C20:5 n-3 and C22:6 n-3
(Barcelo-Coblijn and Murphy, 2009). Alpha linolenic acid is converted to C22:6 n-3 through a multi-
step process of desaturation and elongation (Figure 1.6). Through Δ-6 desaturase, C18:3 n-3 is
desaturated to C18:4 n-3 as the initial step, followed by a carbon chain elongation step i.e. C18:4 n-3
to C20: 4 n-3, and then Δ-5 desaturase converts C20: 4 n-3 to C20: 5 n-3 (Figure 1.6). The next step is
the elongation of EPA to form C22: 5 n-3 through elongase-2 (Wang et al., 2005). This is followed by
the formation of C24: 5 n-3 which is then desaturated by Δ-6 desaturase to produce C24: 6 n-3
17
(Sprecher, 2000). These reactions show that any of the omega-3 fatty acid synthesized in the
endoplasmic reticulum undergoes either elongation or desaturation to eventually produce C22: 6 n-3.
Few decades ago, medical specialists recommended that the intake of total fat should be reduced
(Webb and O’Neill, 2008). This recommendation was made in attempt to control the potential adverse
effects of fats on coronary heart disease, obesity as well as other health disorders associated with
excessive intake of fat. Presently, there is a significant shift from fat quantity to fat quality. For
instance, with regard to reducing the risk of cardiovascular disease (CVD) in middle-aged men, the
intake of n-3 PUFA and MUFA is more important as a regulator than the intake of total fat (Laaksonen
et al., 2005). This group of PUFA has potential to reduce the risk of cardiovascular disease by
regulating the concentrations of blood cytokine (Von Schacky et al., 1999; Von Schacky, 2007;
Laaksonen et al., 2005; Coates et al., 2009). In addition, the n-3 PUFA have been reported as
stimulators of endothelial relaxation which leads to anti-arrhythmic and cardioprotective effects on the
heart (Raheja et al., 1993).
The development of carcinogenesis has also been shown to be regulated by the consumption of PUFA.
The intake of long chain n-3 fatty acids has been shown to reduce the risk and inhibit the development
of cancer (Larsson et al., 2004; Palmquist, 2009), through the following processes: regulation of signal
transduction pathways, gene expression, transcription factor activity, membrane fluidity and insulin
sensitivity. In addition, PUFA also cause suppression of eicosanoid biosynthesis from arachidonic
acid, decreased or increased production of reactive oxygen species and free radicals and modification
of oestrogen metabolism (Palmquist, 2009). Following the review of available data on clinical results
of supplementing fish oil and cancer prevalence, Colomer et al. (2007) inferred that it is beneficial to
administer n-3 fatty acids particularly C20:5 n-3 and C20:6 n-3 at 1.5 g/d to patients with advanced
cancer. The benefits include improvement in quality-of-life and both clinical and biological
parameters.
In recent times, it is considered that the anti-atherosclerotic effect of n-3 PUFA through decreasing the
concentrations of tumour necrosis factor-α and proinflammatory cytokines (e.g. interleukins -6,
18
interleukins-Iβ), is attributed to their actions on growth and cytokines factors (Palmquist, 2009). The
n-3 fatty acids are also known to offer a protective effect on the risk of atherosclerosis by altering the
concentration of plasma lipids i.e. reducing the concentration of triacylglycerols (Harris, 1997; Sirtori
and Galli, 2002). EPA and DHA have been reported to possess high potential to lower serum
triglycerides (WHO, 2003), which suggests that they are capable of reducing coronary heart disease.
PUFA such as C18:2 n-6 (LA) is a useful structural component required for the synthesis of lipids in
the tissue and a component of cellular membranes (Simopoulos, 2000; Palmquist, 2009). The benefits
of n-3 fatty acids on increased glucose metabolism include the potential to reduce low density
lipoprotein cholesterolemia, positive effects on high density lipoprotein and decreased hyperglycaemia
(Raheja et al., 1993; Sirtori and Galli, 2002).
Several reports (Funahashi et al., 2006; Kim et al., 2009) have repeatedly indicated that n-3 fatty acids
may be responsible for inhibition of tumours growth rate by decreasing the number and size of
tumours, as well as delaying its appearance. Long chain n-3 PUFA have also been reported to regulate
chronic inflammatroy disorders through inhibition of the expression of adhesion molecules and
reduction of the production of cytokines, reactive oxygen species and inflammatory eicosanoids
(Calder, 2006).
EPA and DHA are required as key fatty acids in the development and growth of the central nervous
system in humans (Innis, 2003). The n-3 PUFA, especially C22:6 n-3 (DHA) play an important
function in the development of the liver and brain in infants (Martinez and Ballabriga, 1987), hence,
they are needed as basic requirement for normal development and growth of humans (Simopoulos et
al., 1991; Salem et al., 1996).
In addition to the above mentioned health benefits of long chain n-3 PUFA, they also have beneficial
effects such as antithrombotic and immuno-suppressive effects (Kremmer et al., 1995, Gonzalez,
1995; Narayan et al., 2006), management and prevention of hypertension (Morris et al., 1994), renal
disease (Donadio et al., 1994), type 2 diabetes (Connor et al., 1993), rheumatoid arthritis (Kremer,
1996), and chronic obstructive pulmonary disease (Shahar et al., 1994). Omega-3 PUFA are also
19
implicated in cyclic adenosine monophosphate signal transduction pathways where they function as
regulators of specific gene transcription, and are also involved as second messengers in gene
expression (Clark and Jump, 1994; Graber et al., 1994).
The main dietary source of conjugated linoleic acid (CLA) in the human diet is milk fat (Lawson et
al., 2001). CLA are known as the collective term for a mixture of geometric and positional isomers of
C18:2 n-6 having conjugated double bonds. Although there are many isomers of CLA, cis-9 trans- 11
is the major isomer (approximately 90%) in milk (Parodi, 1977). A range of health benefits such as
antimutagenic, antidiabetic, antiobesity, antiatherogenic, immunomodulation and modulation of bone
growth and anticarcinogenic effects have been attributed to cis-9 trans- 11 CLA in different biological
models (Banni et al., 2001; Corl et al., 2003). In a Swedish Mammography cohort where records of 60
000 women were analysed, the intake of CLA from dairy products was shown to be inversely related
to the risk of colorectal cancer (Larsson et al., 2005). For more information about CLA refer to section
1.7.3.
The main MUFA in milk fat are vaccenic acid (C18:1 trans 11) and oleic acid (C18:1 n-9). The former
is the major trans fatty acid in milk and has been linked with improvement in cholesterol levels, lower
rates of cancer and cardiovascular disease (Kris-Etherton et al., 1999; Banni et al., 2001). Based on
endogenous conversion of vaccenic acid to cis-9 trans-11 18:2 CLA through the delta 9 desaturase in
the mammary gland, C18:1 trans 11 has been reported to have anticarcinogenic properties (Banni et
al., 2001). The endogenous conversion of C18:1 trans 11 to cis-9 trans-11 18:2 CLA is as important
for prevention of cancer as the dietary supply of CLA (Corl et al., 2003).
Despite the above nutritional benefits of PUFA, their concentration in ruminant food products is low;
hence, there is a need to device a means of increasing the content of PUFA in ruminant food products.
This would lessen the negative effects of high SFA and improve the accessibility of other nutritional
benefits derivable from ruminant food products.
20
1.3.0. Dietary sources of lipids for ruminants
The main dietary sources of lipids for ruminants are forage, oilseeds and fish oils. The lipid content
and fatty acid composition are significantly different among the different sources of dietary lipids. In
this section these main dietary sources of lipid for ruminants would be discussed.
1.3.1. Forage and grass lipids
Generally, ruminants are provided with considerable amounts of lipids from the forage component of
their dietary daily allowance. These lipids which consist of high content of glycolipids and
phospholipids are mainly of leaf origin, comprising between 6-8% of the dry matter content of the leaf
(Harfoot, 1978). Glycolipids are the most abundant form of lipids, consisting between 70-80% of the
available lipid content, whilst phospholipids, cholesterol esters and triacylglycerides represent the less
(20-30%) abundant lipids (Christie, 1978).
Plant lipids are comprised of high levels of USFA, predominantly C18:2 n-6 (linoleic acid) and C18:3
n-3 (linolenic acid) and some smaller amounts of oleic acid (Palmquist and Jenkins, 1980). Majority of
these lipids, which account for about 22-25% of the lipid on dry matter basis, are found in the
chloroplast of leaf tissue (Harfoot, 1978). Of this lipid content, about 80% is
monogalactosyldiglycerides and digalactosyldiglycerides (Harfoot, 1978). The fatty acid composition
of monogalactosyldiglycerides from Lucerne (alfalfa) was reported to contain C18:3 n-3 (95%), C16:0
(2.7%) and C18:2 n-6 (1.7%) on a weight basis (O’Brien and Benson, 1964). The C18:3 n-3
concentrations in other legumes such as clover depend on both the species and the season of growth
(Collins et al., 2002; Loor et al., 2003; Table 1.2). Consequently, glycolipids and phospholipids are
the predominant lipids present in the forage consumed by ruminants.
Alpha linolenic acid, the precursor for the long chain n-3 PUFA, is high in fresh grass, consisting
between 0.50-0.75 g/g of the total fatty acids (Hawke, 1973). However, the concentration of C18:3 n-3
in fresh grass depends on grass species (Dewhurst and Scollan, 1997) and the stage of maturity
(Bauchart et al., 1984). Drying and storage of forages can result in significant losses in the content of

21
C18:3 n-3 and corresponding increases in the concentration of palmitic acid (Noble, 1981). Therefore,
it can be inferred that fresh grass or Lucerne would have higher content of C18:3 n-3 than grass hay.
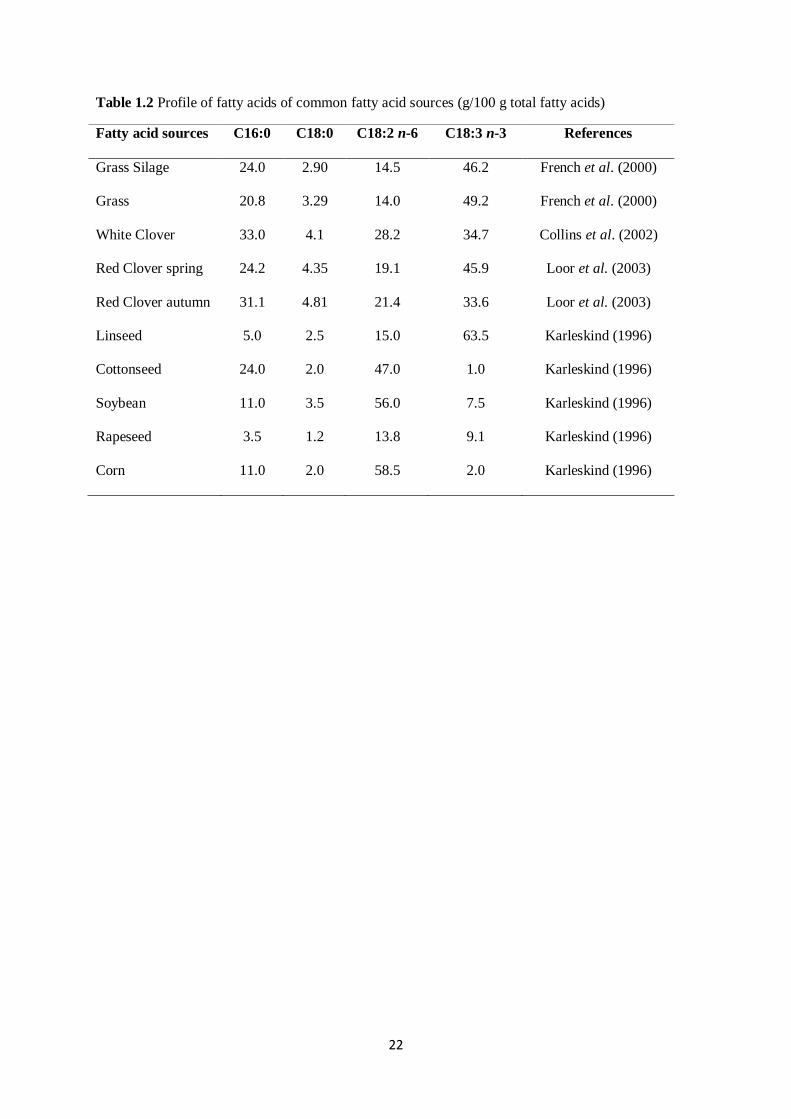
22
Table 1.2 Profile of fatty acids of common fatty acid sources (g/100 g total fatty acids)
Fatty acid sources C16:0 C18:0 C18:2 n-6 C18:3 n-3 References
Grass Silage 24.0 2.90 14.5 46.2 French et al. (2000)
Grass 20.8 3.29 14.0 49.2 French et al. (2000)
White Clover 33.0 4.1 28.2 34.7 Collins et al. (2002)
Red Clover spring 24.2 4.35 19.1 45.9 Loor et al. (2003)
Red Clover autumn 31.1 4.81 21.4 33.6 Loor et al. (2003)
Linseed 5.0 2.5 15.0 63.5 Karleskind (1996)
Cottonseed 24.0 2.0 47.0 1.0 Karleskind (1996)
Soybean 11.0 3.5 56.0 7.5 Karleskind (1996)
Rapeseed 3.5 1.2 13.8 9.1 Karleskind (1996)
Corn 11.0 2.0 58.5 2.0 Karleskind (1996)
23
1.3.2. Oilseeds
Concentrates, which are feedstuffs with high energy content, are conventionally added to ruminant diets
to improve the energy density of the diet, especially for lactating animals (Palmquist, 1984). These
concentrate feeds which are processed to prevent negative effect on digestion of fibre in the rumen,
contain large amounts of crushed cereal grains, crushed oil seeds or their extracts (Palmquist, 1988). The
addition of concentrate supplements to ruminant feed can also help to manipulate the digestion and
absorption of nutrients, in addition to increasing the energy value of the diet (Palmquist, 1984; Palmquist,
1988). Rumen acidosis or reduced milk fat content due to low fibre diet or high carbohydrate diets can be
limited by addition of fats to the diet (Palmquist, 1984). In addition, the fatty acid composition of
ruminant food products can be manipulated to increase their desirability by food industries and for human
consumption through addition of concentrates (Grummer, 1991).
Although grass and forages contain high concentration of C18:3 n-3 as a proportion of the total fatty
acids, the content of C18:2 n-6 is higher in most commonly used oil seeds (Christie, 1983; Enser, 1984;
Gurr and Harwood, 1996; Table 1.2). However, a significant concentration of C18:3 n-3 is found in a few
number of oil seeds such as linseed oil, where C18:3 n-3 accounts for more than 50% of the total fatty
acids (Sim, 1990; Table 1.2).
The long chain n-3 fatty acids such as C20:5 n-3 and C22:6 n-3 are completely absent in oils of higher
plants. However, there is some evidence that substantial concentration of C20:5 n-3 can be found in lower
land plants such as ferns and mosses (MAFF, 1997). Certain technologies such as the development of
transgenic plants which expresses the desaturase gene could be used to produce higher concentration of
C20:5 n-3 and C22:6 n-3 in higher plants (Kyle et al., 1990). Similar technology has been successfully
used with tobacco to cause accumulation of gamma-linolenic acid (Reddy and Thomas, 1996).
24
1.3.3. Fish oil
There is a marked difference between the fatty acid composition of higher plants and marine organisms,
with the latter containing significant concentrations of C20:5 n-3 and C22:6 n-3 (Nettleton, 1991).
Relative to land animals, the unsaturated fatty acid content of fish oil is higher because fish like
monogastric animals, absorb and deposit a wide range of available fatty acids from their diet (Sargent,
1997). The fatty acid composition of marine zooplanktons is substantially determined by the fatty acid
composition of the phytoplanktons which serve as their main source of food (Sargent, 1996).
Triacylglycerides or wax esters (fatty alcohols esterified to fatty acids) represent the oil reserves of
zooplanktons. Marine zooplanktons in the polar latitudes deposit wax esters as an adaptation to extreme
light regimes because the condition is characterized by limited supply and seasonal availability of
phytoplanktons (Sargent, 1997). Under such extreme weather conditions, more than 50% of the dry
weight of zooplanktons is oils, composed of wax esters, whereas zooplanktons in lower latitudes
accumulate much lower oils with high levels of phospholipids and insignificant concentration of wax
esters.
In the lower latitude where the zooplanktons contain negligible levels of waxes, fish such as sardines,
anchovy and pilchards, consuming the zooplanktons have higher proportion of n-3 PUFA and lower body
triacylglycerides than high altitude fish oils (Sargent, 1997). By contrast higher altitude fish such as
herring, sprats, capelin and mackerel consuming zooplanktons containing high levels of wax esters can
digest, absorb and transform the waxes to triacylglycerol. Thus, high altitude fish contains low levels of
n-3 PUFA and relatively high concentration of C20:1 n-9 and C22:1 n-11 (Sargent, 1997).
25
1.4.0. Fatty acid metabolism in animals
1.4.1. Metabolism of lipid in non-ruminants
The pattern of lipid digestion by the animal, whether ruminant or non-ruminant, substantially regulates
the transfer of fatty acids from the diet to the products derived from that animal. In non-ruminants, unlike
ruminant animals, the small intestine is the main site for the digestion of ingested dietary lipids. The
dietary lipids (triacylglycerols) are broken down by pancreatic lipase to mainly free fatty acids and 2-
monoacylglycerols with absorption aided by the formation of micelles (Woods and Fearon, 2009). Then,
lipoprotein lipase enzyme which is distributed widely around the body mediates the uptake of lipid in the
jejunum. In the non-ruminant animal, relative to the ruminant animal, lipids in the diet are absorbed
without transformation before their integration into the tissue lipids. Because dietary lipids are absorbed
unchanged in non-ruminant animal, sources of dietary lipids have a determining and predictable effect on
the fatty acid composition of human food products from poultry and pigs (Chesworth et al., 1998). The
supply of UFA to tissue in non-ruminants could therefore be increased by simply increasing their dietary
supply.
1.4.2. Hydrolysis and biohydrogenation of PUFA in ruminants
It is well established that lipolysis is a prerequisite for the occurrence of biohydrogenation of unsaturated
fatty acid in the rumen (Dawson et al., 1977). Lipolysis is the process which hydrolyses ester linkages of
esterified lipids to non-esterified fatty acids in the rumen and occurs rapidly after ingestion (Garton et al.,
1958; Dawson et al., 1977). Lipolysis precedes biohydrogenation because the availability of a free
carboxyl moiety is an important requirement for biohydrogenation to proceed (Harfoot and Hazlewood
1997; Jenkins and Bridges, 2007).
The non-esterified unsaturated fatty acids which are the products of lipolysis have a relatively short half-
life, hence, they are rapidly hydrogenated after being adsorbed unto bacterial surfaces in the rumen
(Keeney, 1970). The rational for the saturation of unsaturated fatty acid is still controversial. It has been
suggested that ruminal biohydrogenation of UFA would be predictably manipulated if the reason as to
why microbial population saturate unsaturated fatty acid is established (Jenkins et al., 2008). This implies
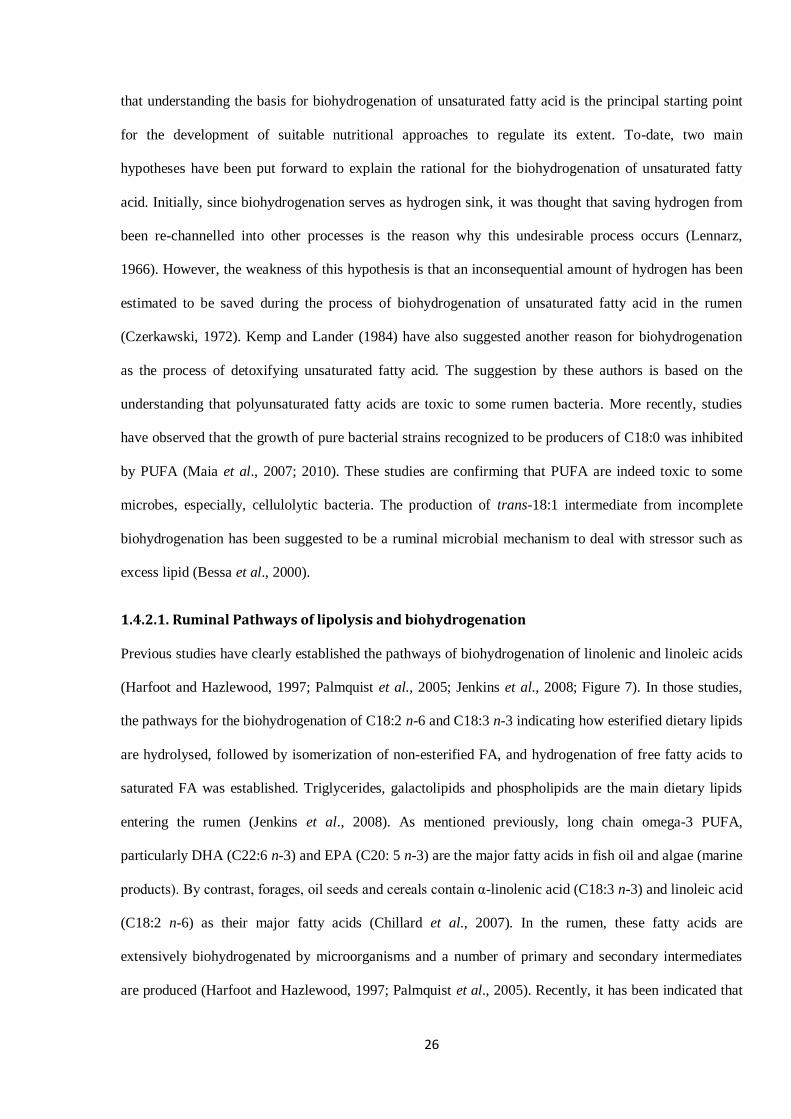
26
that understanding the basis for biohydrogenation of unsaturated fatty acid is the principal starting point
for the development of suitable nutritional approaches to regulate its extent. To-date, two main
hypotheses have been put forward to explain the rational for the biohydrogenation of unsaturated fatty
acid. Initially, since biohydrogenation serves as hydrogen sink, it was thought that saving hydrogen from
been re-channelled into other processes is the reason why this undesirable process occurs (Lennarz,
1966). However, the weakness of this hypothesis is that an inconsequential amount of hydrogen has been
estimated to be saved during the process of biohydrogenation of unsaturated fatty acid in the rumen
(Czerkawski, 1972). Kemp and Lander (1984) have also suggested another reason for biohydrogenation
as the process of detoxifying unsaturated fatty acid. The suggestion by these authors is based on the
understanding that polyunsaturated fatty acids are toxic to some rumen bacteria. More recently, studies
have observed that the growth of pure bacterial strains recognized to be producers of C18:0 was inhibited
by PUFA (Maia et al., 2007; 2010). These studies are confirming that PUFA are indeed toxic to some
microbes, especially, cellulolytic bacteria. The production of trans-18:1 intermediate from incomplete
biohydrogenation has been suggested to be a ruminal microbial mechanism to deal with stressor such as
excess lipid (Bessa et al., 2000).
1.4.2.1. Ruminal Pathways of lipolysis and biohydrogenation
Previous studies have clearly established the pathways of biohydrogenation of linolenic and linoleic acids
(Harfoot and Hazlewood, 1997; Palmquist et al., 2005; Jenkins et al., 2008; Figure 7). In those studies,
the pathways for the biohydrogenation of C18:2 n-6 and C18:3 n-3 indicating how esterified dietary lipids
are hydrolysed, followed by isomerization of non-esterified FA, and hydrogenation of free fatty acids to
saturated FA was established. Triglycerides, galactolipids and phospholipids are the main dietary lipids
entering the rumen (Jenkins et al., 2008). As mentioned previously, long chain omega-3 PUFA,
particularly DHA (C22:6 n-3) and EPA (C20: 5 n-3) are the major fatty acids in fish oil and algae (marine
products). By contrast, forages, oil seeds and cereals contain α-linolenic acid (C18:3 n-3) and linoleic acid
(C18:2 n-6) as their major fatty acids (Chillard et al., 2007). In the rumen, these fatty acids are
extensively biohydrogenated by microorganisms and a number of primary and secondary intermediates
are produced (Harfoot and Hazlewood, 1997; Palmquist et al., 2005). Recently, it has been indicated that
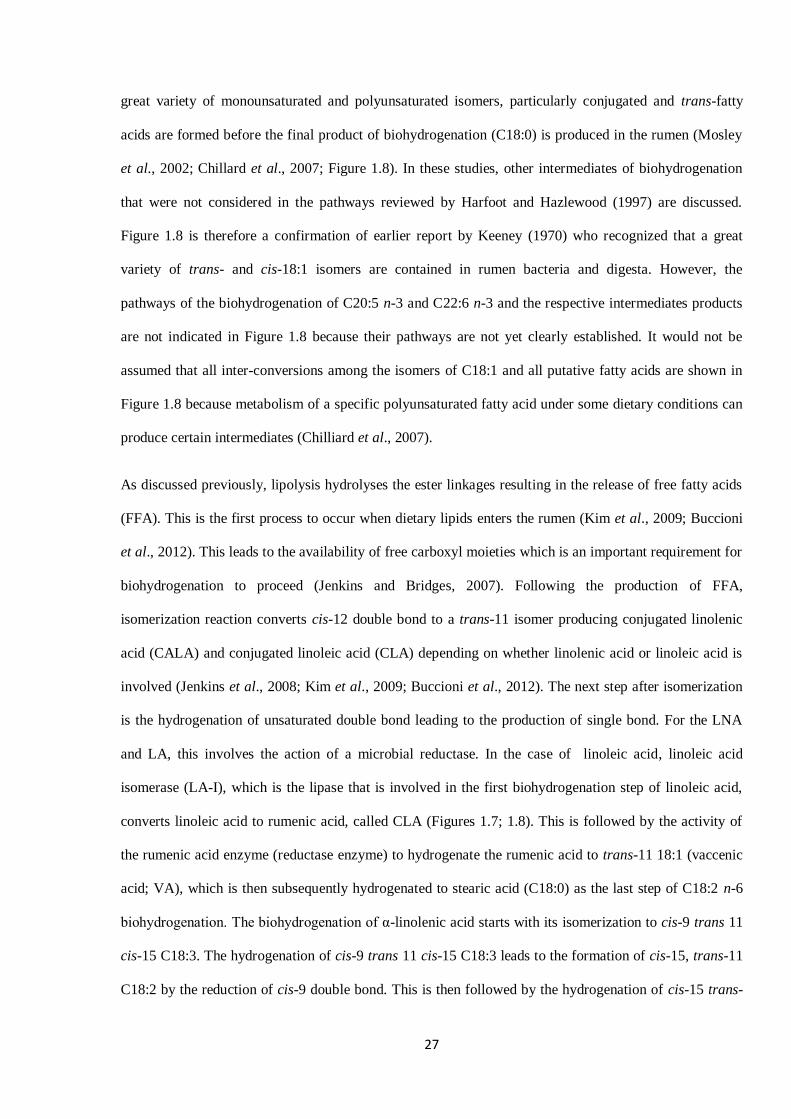
27
great variety of monounsaturated and polyunsaturated isomers, particularly conjugated and trans-fatty
acids are formed before the final product of biohydrogenation (C18:0) is produced in the rumen (Mosley
et al., 2002; Chillard et al., 2007; Figure 1.8). In these studies, other intermediates of biohydrogenation
that were not considered in the pathways reviewed by Harfoot and Hazlewood (1997) are discussed.
Figure 1.8 is therefore a confirmation of earlier report by Keeney (1970) who recognized that a great
variety of trans- and cis-18:1 isomers are contained in rumen bacteria and digesta. However, the
pathways of the biohydrogenation of C20:5 n-3 and C22:6 n-3 and the respective intermediates products
are not indicated in Figure 1.8 because their pathways are not yet clearly established. It would not be
assumed that all inter-conversions among the isomers of C18:1 and all putative fatty acids are shown in
Figure 1.8 because metabolism of a specific polyunsaturated fatty acid under some dietary conditions can
produce certain intermediates (Chilliard et al., 2007).
As discussed previously, lipolysis hydrolyses the ester linkages resulting in the release of free fatty acids
(FFA). This is the first process to occur when dietary lipids enters the rumen (Kim et al., 2009; Buccioni
et al., 2012). This leads to the availability of free carboxyl moieties which is an important requirement for
biohydrogenation to proceed (Jenkins and Bridges, 2007). Following the production of FFA,
isomerization reaction converts cis-12 double bond to a trans-11 isomer producing conjugated linolenic
acid (CALA) and conjugated linoleic acid (CLA) depending on whether linolenic acid or linoleic acid is
involved (Jenkins et al., 2008; Kim et al., 2009; Buccioni et al., 2012). The next step after isomerization
is the hydrogenation of unsaturated double bond leading to the production of single bond. For the LNA
and LA, this involves the action of a microbial reductase. In the case of linoleic acid, linoleic acid
isomerase (LA-I), which is the lipase that is involved in the first biohydrogenation step of linoleic acid,
converts linoleic acid to rumenic acid, called CLA (Figures 1.7; 1.8). This is followed by the activity of
the rumenic acid enzyme (reductase enzyme) to hydrogenate the rumenic acid to trans-11 18:1 (vaccenic
acid; VA), which is then subsequently hydrogenated to stearic acid (C18:0) as the last step of C18:2 n-6
biohydrogenation. The biohydrogenation of α-linolenic acid starts with its isomerization to cis-9 trans 11
cis-15 C18:3. The hydrogenation of cis-9 trans 11 cis-15 C18:3 leads to the formation of cis-15, trans-11
C18:2 by the reduction of cis-9 double bond. This is then followed by the hydrogenation of cis-15 trans-

28
11 18:2 to produce either cis-15 18:1 or trans-11 cis-13 18:2, or trans-11 18:1 (vaccenic acid). The
production of C18:0 results from further hydrogenation of trans-11 18:1, as the final step in the ruminal
biohydrogenation of C18:3 n-3.
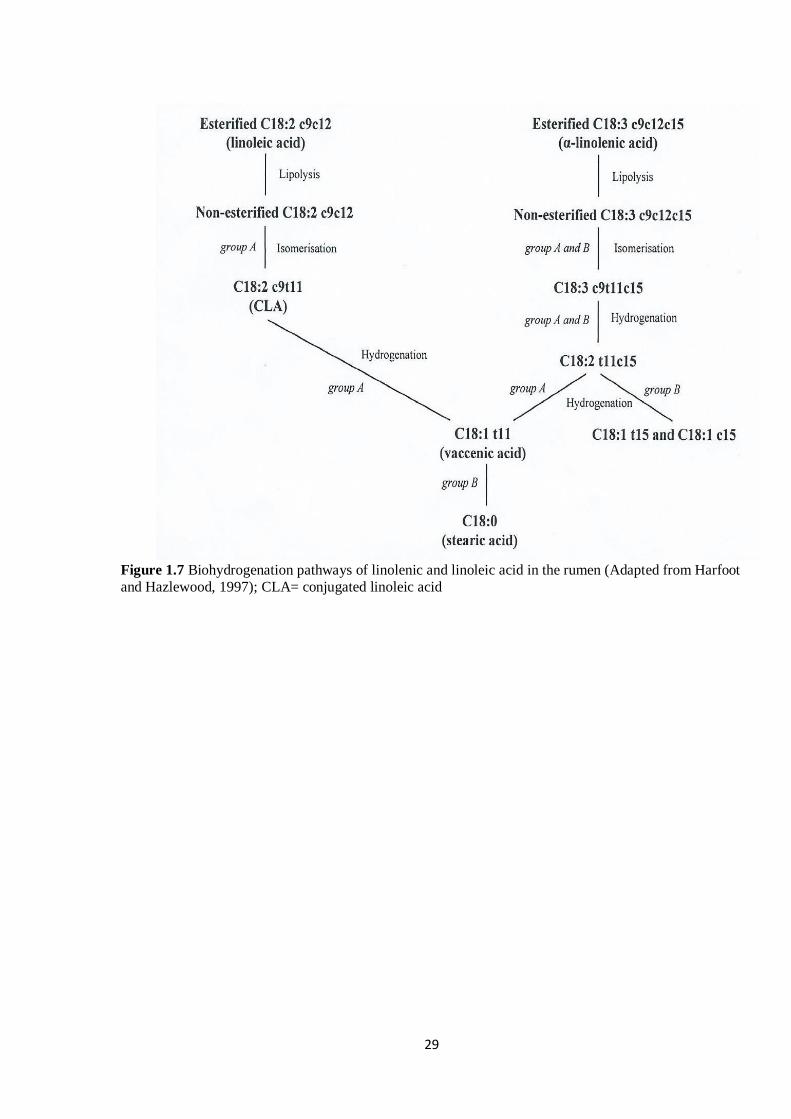
29
Figure 1.7 Biohydrogenation pathways of linolenic and linoleic acid in the rumen (Adapted from Harfoot
and Hazlewood, 1997); CLA= conjugated linoleic acid
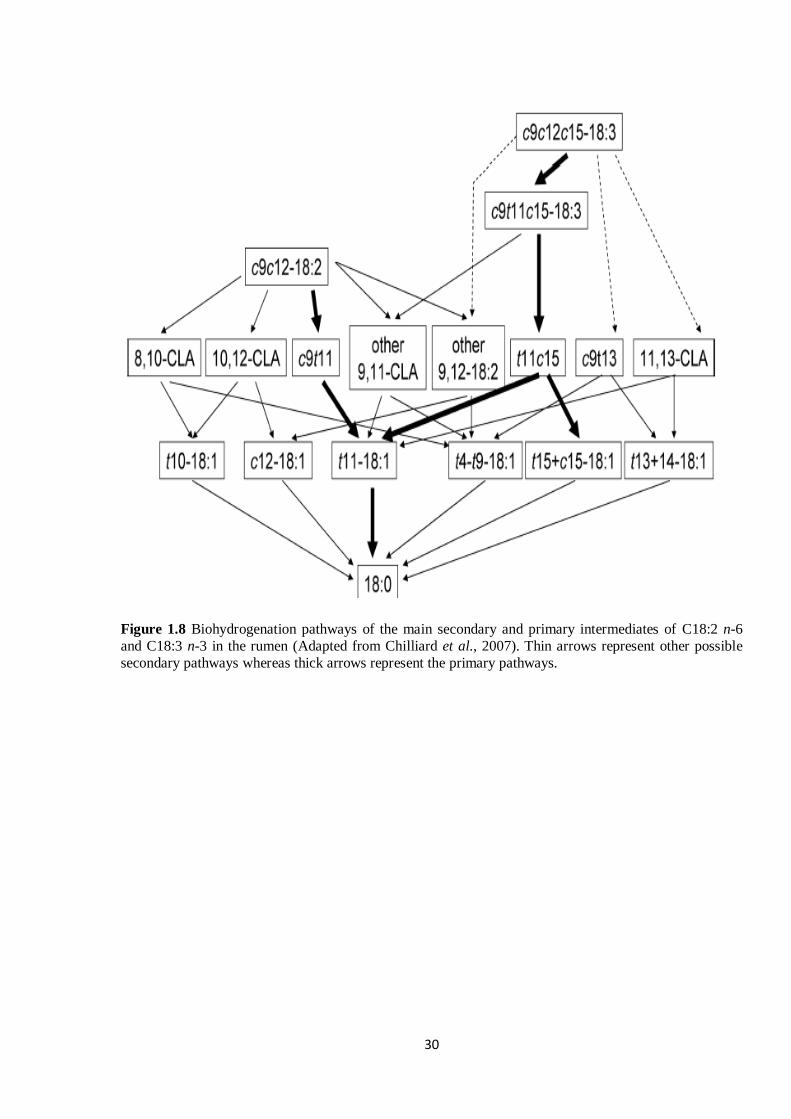
30
Figure 1.8 Biohydrogenation pathways of the main secondary and primary intermediates of C18:2 n-6
and C18:3 n-3 in the rumen (Adapted from Chilliard et al., 2007). Thin arrows represent other possible
secondary pathways whereas thick arrows represent the primary pathways.
31
1.4.2.2. Biohydrogenation intermediates
Although major intermediates of biohydrogenation have been discussed previously (section 1.4.2.1), it is
important to emphasis some of the key intermediates, particularly those with known human health
benefits. The process of biohydrogenation produces various intermediates; the most important of these
intermediates recognized in human health are conjugated linoleic acid (CLA) and its precursor, vaccenic
acid (VA, 18:1 trans-11). Cis-9 trans-11 CLA isomer is one of the most important transient intermediates
of RBH of UFA because of its anti-carcinogenic, anti-atherogenic, anti-diabetic and anti-inflammatory
effects (Kritchevsky, 2000, Jenkins et al., 2008; Kennedy et al., 2010; Crumb, 2011). However, a wide
range of other positional and geometrical fatty acid isomers including modified FA (keto and hydroxyl
derivatives) are produced during the biohydrogenation of C18:2 n-6 in the rumen (Jenkins et al., 2008;
Figure 1.8). Absorption and incorporation of these BH intermediates into milk fatty acid differs
depending on their concentrations. But, their production can be influenced under experimental conditions
using specific diets (Harvatine and Bauamn, 2006).
Conjugated linoleic acid is the collective name for a series of geometric and positional isomers of 18:2 n-
6 possessing conjugated double bonds. There has been a surge in interest in the study of cis-9 trans 11
CLA in the last decade. This increased interest is due to the health benefits of cis-9 trans 11 CLA as
discussed previously (Belury, 2002; section 1.2.6). Ruminant food products are the natural and richest
dietary sources of CLA available for human consumption. The isomer, cis-9, trans-11 CLA accounts for
more than 90% of the total CLA present in ruminant milk fatty acid composition (Piperova et al., 2002;
Kay et al., 2004; Savoini et al., 2010). The cis-9, trans-11 CLA in milk fatty acid can possibly result from
two sources: firstly, it is the product of ruminal incomplete biohydrogenation of 18:2 n-6 by
microorganisms. Secondly, cis-9, trans-11 CLA originates endogenously from the mammary gland by the
action of Δ-⁹ desaturase enzyme which converts vaccenic acid (VA, trans-11 18:1) to cis-9, trans-11
(Griinari et al., 2000). The latter represents more than 70% of the total CLA present in milk fat of
ruminant origin (Bauman et al., 2006; Santora et al., 2000; Piperova et al., 2002). This suggests that
major proportion of the total CLA content of milk results from desaturation of VA and means that
increasing the ruminal concentration of VA would have a proportional effect on the level of CLA.
32
Although CLA in the rumen is synthesized only during the ruminal biohydrogenation of linoleic acid,
biohydrogenation of both linolenic and linoleic acids generates VA (Bauman et al., 2003; Figure 1.7&
1.8).
It is a paradox that ruminant products which have long been blamed for their high contents of saturated
fatty acids, and as such, potential risk factors of chronic disease, are also rich sources of nutraceutical
component such as CLA. Nevertheless, as conjugated linoleic acid is a fatty acid, there is reduced
concentration of this fatty acid in foods due to the renewed interest in the production of reduced-fat or fat-
free ruminant products (Webb and O’Neill, 2008). The established importance of CLA and its reduced
concentration in ruminant products has necessitated exploration of dietary approaches to modify ruminal
biohydrogenation so as to enhance its amounts in ruminal products. Studies have indicated that the
concentration of CLA in ruminant derived products can be increased through dietary manipulation of
ruminant feeding (Lawson et al., 2001). See section 1.4.2.1 for other major intermediates of
biohydrogenation.
33
1.4.2.3. Factors affecting biohydrogenation
The major sources of lipids used by ruminant nutritionists in the formulation of diets are marine origin
(algae and fish oil) and plants (Kim et al., 2009). Lipolysis of unprotected oils has been suggested to be in
the range of 85-95% (Doreau and Ferlay, 1994; Dewhurst et al., 2006). By contrast, lower lipolysis has
been proposed for the structural plant lipids because of the requirement for the removal of the
surrounding matrices before the occurrence of lipolysis (Doreau and Ferlay, 1994; Dewhurst et al., 2006).
This indicates that lipids in oils are more degraded than forage lipids and suggest that a number of factors
regulate the extent of ruminal biohydrogenation of PUFA. Lipolysis is a rate limiting step for
biohydrogenation (Harfoot and Hazlewood, 1997). Forage maturity (Gerson et al., 1986), particle size
(Gerson et al., 1988) and diet composition (Gerson et al., 1983; Gerson et al., 1985) are among the
different factors responsible for altering in vitro rate of lipolysis.
Ruminal biohydrogenation of unprotected linoleic and linolenic acids across a range of different types of
diets is in the mean range of 85 and 93% respectively (Fievez et al., 2007; Jenkins et al., 2008). Glasser et
al. (2008) concluded from a meta-analysis of the ruminal metabolism of C18 fatty acids with database of
294 treatments in 77 experiments that a number of factors are responsible for the extent of
biohydrogenation in the rumen. These factors are the forage: concentrate ratio, fish oil supplementation,
ruminal pH and level of feed intake. When the forage content of the diet is higher than the proportion of
concentrate, higher extent of biohydrogenation is more likely because of the likelihood of cellulolytic
bacteria to dominate such diets. However, when concentrate is higher, other alternative pathways of
biohydrogenation occur, with the formation of some trans fatty acids (Chilliard et al., 2007). It was
observed that C18:3 n-3 and C18:2 n-6 were considerably protected at low ruminal pH than at high pH
(Glasser et al., 2008). Increased feed intake causes a corresponding increase on the extent of linoleic and
linolenic acid biohydrogenation, especially if the forage proportion of the diet is high.
The extent of biohydrogenation of PUFA in the rumen can also be determined by the amount and type of
fat added to the diet. For instance, the extent of biohydrogenation of constituent PUFA in diet
supplemented with marine oils which contain EPA and DHA as the main fatty acids would be lower than
the biohydrogenation of C18 PUFA found in oilseeds such as linseed, sunflower or soybean. This
34
inability of microbes to hydrogenate the fish oil fatty acids is not due to the difference in the lipase
activities but because microbes lack the enzymes necessary to hydrogenate the long chain n-3 PUFA
(Ashes et al., 1992). Advance maturity of forage and forage which has been thoroughly ground before
added to the diet can also influence the biohydrogenation of PUFA in the rumen (Buccioni et al., 2012).
In the latter, it can be speculated that grinding forage to produce fine particles would reduce the
adherence of bacteria to feed particle and increase the rate of passage of food material through the rumen.
Increased passage rate would consequently reduce the resident time and microbial activities, hence,
decreased biohydrogenation of PUFA. Biohydrogenation has also been shown to be influenced by plant
secondary metabolites such as tannins, protein bound phenols (PBP) and fatty acid oxidation (Cabiddu et
al., 2010).
1.4.2.4. Microorganisms involved in lipolysis and biohydrogenation
Lipases responsible for lipolysis are from both microbial and dietary origin. However, the actual
contribution of dietary and microbial lipases to these processes is not clear (Lourenco et al., 2010). About
74 strains of microbial lipases in the rumen have been reported, all with varied lipolytic activity (Fay et
al., 1990). The lipolytic activity of Butyrivibrio fibrisolvens and Anaerovibrio lipolytica has been
extensively studied and reported (Harfoot, 1978). Hespell and O’Bryan-Shah (1988) examined the
lipolytic activities of 30 strains of Butyrivibrio fibrisolvens and observed that there is wide variation
among strains of Butyrivibrio fibrisolvens. Anaerovibrio lipolytica hydrolysed triglycerides less rapidly
than diglycerides; however, they did not hydrolyse galactolipids and phospholipids (Henderson, 1971).
The production of saturated fatty acids require first, the hydrolysis of dietary esterified lipids by plant
(Lee et al., 2004) and microbial (Harfoot, 1978) lipases to release the constituent fatty acids. A well-
recognized ruminal lipolytic bacterium (Anaerovibrio lipolytica) (Hungate, 1966) produces an
extracellular lipase that has the potential for hydrolysing diglycerides more readily than triglycerides.
Galactolipids and phospholipids are not however, affected by these lipases (Kim et al., 2009). Latham et
al. (1972) identified bacteria with the same morphology like those of the genus Butyrivibrio having the
capacity to hydrolyse triglycerides. A Butyrivibrio strain known as LM8/1B and Butyrivibrio fibrisolvens
have also been observed to carry out phospholipase activity (Hazlewood and Dawson, 1975).
35
Hydrolysis of ingested esterified plant lipids has also been linked with the activity of ciliated rumen
protozoa. In the early 1960s and 1970s; the activity of protozoa in lipolysis was reported (Wright, 1961;
Latham et al., 1972). Wright (1961) suggested that protozoa, particularly, Epidinium spp. could contribute
about 40% of the total lipolysis occurring in the rumen. This observation emerged after it was observed
that ruminal lipolysis was reduced when cultures were treated with penicillin. Harfoot and Hazlewood
(1988) proposed that the engulfment of lipases in the chloroplasts by protozoa could be responsible for
the lipolytic activity in protozoa. The ruminal fungi have not been linked with the hydrolysis of esterified
lipids in the rumen; however, there is evidence that they are involved in biohydrogenation (Nam and
Garnsworthy, 2007).
Biohydrogenation of FFA has been exclusively attributed to rumen bacteria (Lourenco et al., 2010). The
main microbes which are responsible for biohydrogenating PUFA are the surface-associated bacteria
(Lough, 1970). This is because the released PUFA are absorbed to the surface of plant material by means
of hydrophobic interactions (Harfoot et al., 1973). Initially, the biohydrogenating bacteria were grouped
into group A and group B (Kemp and Lander, 1984). The group A bacteria are generally seen as bacteria
with the ability to reduce PUFA to form vaccenic acid, whilst, group B bacteria have the ability to
biohydrogenate UFA to stearic acid. The main group A bacteria have been recognized as Butyrivibrio
fibrisolvens, whereas Fusocillus spp has been known as the main group B bacteria (Kemp et al., 1975;
Harfoot and Hazlewood, 1997). More recent studies have shown that the C18:0 producers are clustered
together and strains are so similar to Clostridium proteoclasticum (van de Vossenberg and Joblin, 2003;
Wallace et al., 2006). These biohydrogenating bacteria are generally recognized as cellulolytic bacteria
(Kepler and Tove, 1967), particularly, the Butyrivibrio group which are the most active group (Durmic et
al., 2008). Although the bacterium that was called Clostridium proteoclasticum (Kemp et al., 1975; Maia
et al., 2007) which is now re-classified as Butyrivibrio proteoclasticus (Moon et al., 2008), is the only
bacteria capable of converting VA to C18:0, all bacteria in the Butyrivibrio group are capable of
producing CLA from linoleic acid. Hudson et al. (1998) observed that Streptococcus bovis has the ability
to cause hydration of linoleic acid to 13-hydroxy-9-octadecenoic acid, hence diverting it from the
biohydrogenation course. This early study provide evidence that other facultative ruminal bacteria
36
including Lactobacillus, Staphyloccous, Pediococcus and Enterococcus have the ability to hydrate
linoleic acid (Hudson et al., 2000). In addition, a concurrent increase in Megasphera elsdenii within the
rumen has been identified with increased concentrate feeding (Counotte et al., 1981). Biohydrogenation
of linoleic acid to the trans-10, cis-12 CLA has been linked to the activity of Megasphera elsdenii (Kim
et al., 2002). There is limited evidence whether there are many more bacteria involved in
biohydrogentaion due to the time-consuming nature and the high cost of isolating such bacteria (Huws et
al., 2006). Available evidence suggests that other bacteria such as ruminococcaceae, Anaerovoax,
Prevotella as well as other clostridiales that have not been identified could also play a role in
biohydrogenation pathways (Huws et al., 2006, Huws et al., 2011).
Although BH of PUFA has been exclusively attributed to bacteria, biohydrogenating activity has been
reported from both protozoal and bacterial fractions of rumen contents (Wright, 1959; 1960). This
suggests a potential role of protozoa in the saturation of PUFA. However, further study suggests that the
rumen protozoa act as hosts for bacteria in a commensal relationship (Dawson and Kemp, 1969).
Therefore, the role of protozoa in biohydrogenation was at this time questioned. An experiment
conducted at the Rowett Research Institute shows that the concentration of CLA in protozoa was higher
than in bacteria (Devillard et al., 2006). Protozoa were not shown to have delta-9 desaturase activity,
suggesting that they preferentially incorporate VA and CLA produced by bacteria. Or-Rashid et al.
(2007) also carried out an in vivo study and the data showed that the concentrations of PUFA and CLA in
protozoa were higher than their concentrations in bacteria. Nam and Garnsworthy (2007) reported that
fungi also have the potential to biohydrogenate PUFA, but at a rate lower than bacteria, even though there
are not known to be involved in lipolysis.
37
1.5.0. Methods for protecting lipids from biohydrogenation in the
rumen
Various technologies have been developed over the years to either protect ruminal fermentation against
the negative effects of dietary lipids or to protect the constituent PUFA against biohydrogenating
microorganisms in the rumen. These technologies include hydrogenation or saponification of fatty acids
and crystallization of fat (Jenkins and Palmquist, 1984), formaldehyde treatment of whole oilseeds and
encapsulation of lipids in a formaldehyde-treated protein sources (Scott et al., 1970). Natural protection
of dietary fat from ruminal biohydrogenation can also be achieved through inclusion of whole oilseeds
with intact seed coat in ruminant diets instead of oils (St John et al., 1978; Solomon et al., 1991; Ekeren
et al., 1992).
A biologically effective technology to protect lipid from biohydrogenation is expected to have some
essential features such as:
a. The technology should have minimal adverse effect on general fermentation
b. The protection mechanism should be inert in the rumen
c. The flow of unsaturated fatty acids to the duodenum should be predictable and consistent
d. There is sufficient release and absorption of unsaturated fatty acids in the duodenum by the
technology.
A number of methods are available to test the effectiveness of protected lipid mechanisms (Ashes et al.,
1979). For in vitro and in vivo testing mechanisms, a 60% and 70% protection respectively is considered
satisfactory (McDonald and Scott, 1977).
1.5.1. Formaldehyde protein-lipid supplements
These mechanisms which were first developed over four decades ago involved the emulsification of
polyunsaturated vegetable oils with plant proteins or casein at 70°C with pH 6.8 (Scott et al., 1970;
Figure 1.9a). After forming emulsion, formalin was introduced as a fine mist during the drying process of
the spray dried emulsion. The interaction of formaldehyde and amino groups resulted to inter and
38
intramolecular methylene linkages which reduced the susceptibility of the protein to ruminal degradation.
When the supplements were fed, the proteins were solubilized in the abomasum and pancreatic lipase
hydrolysed the lipids before absorption in the small intestines (Scott et al., 1970).
It was observed that high amount of dietary fats in the form of protected lipids did not have any
deleterious effects on rumen fermentation (Palmquist and Jenkins, 1980). This observation stimulated
extensive study into lipid utilization by ruminants (Palmquist and Jenkins, 1980). The proportion of
protected lipid supplement in vitro was observed to be closely related to the levels of formalin added
(Ashes et al., 1979). Similarly, the concentration of formalin in protected lipid supplement fed to goats
was also proportional to the milk fatty acid response in the animals (Ashes et al., 1979). A significant
correlation between resistance to ruminal hydrolysis and resistance to ruminal biohydrogenation was
reported (n=6, r2=0.96). The formaldehyde treatment of vegetable oils was modified by Scott and Cook
(1973) to enable the use of natural oilseeds as the source of both protein and oil. However, protein which
is required for efficient emulsification and subsequent protection of polyunsaturated oils was low in some
oilseeds such as sunflower. Therefore, the addition of small amounts of casein (5-10%) or the mixture of
soybean meal or seeds and sunflower (about 30 -70 parts, respectively) was used to overcome this
deficiency. Knight et al. (1978) reported that oilseeds treated directly with formalin only offered partial
protection from hydrolysis and biohydrogenation in the rumen. The physical breakdown of the product
during mastication and insufficient control of the manufacturing process was suggested as the cause of
this partial protection (Ashes et al., 1979). Notwithstanding the incomplete protection, the feeding of
steers with formaldehyde protected canola and cotton seeds increased unsaturation in the subcutaneous
adipose tissue (Scott and Ashes, 1993). In addition, the concentrations of C18:3 n-3, C18:2 n-6 and
C18:1n-9 in milk was significantly increased after feeding protected canola supplements to lactating dairy
cows (Ashes et al., 1992). The content of C18:2 n-6 in tissues of cattle (Garrett et al., 1976) and sheep
(Faichney et al., 1973; Hogan and Hogan, 1976) was increased between 18-25% and 50-60, respectively,
when lipids were treated with formaldehyde. To date, the only documented protection method with
increased proportion of the absorbed PUFA is the formaldehyde treatment. Other encapsulation methods
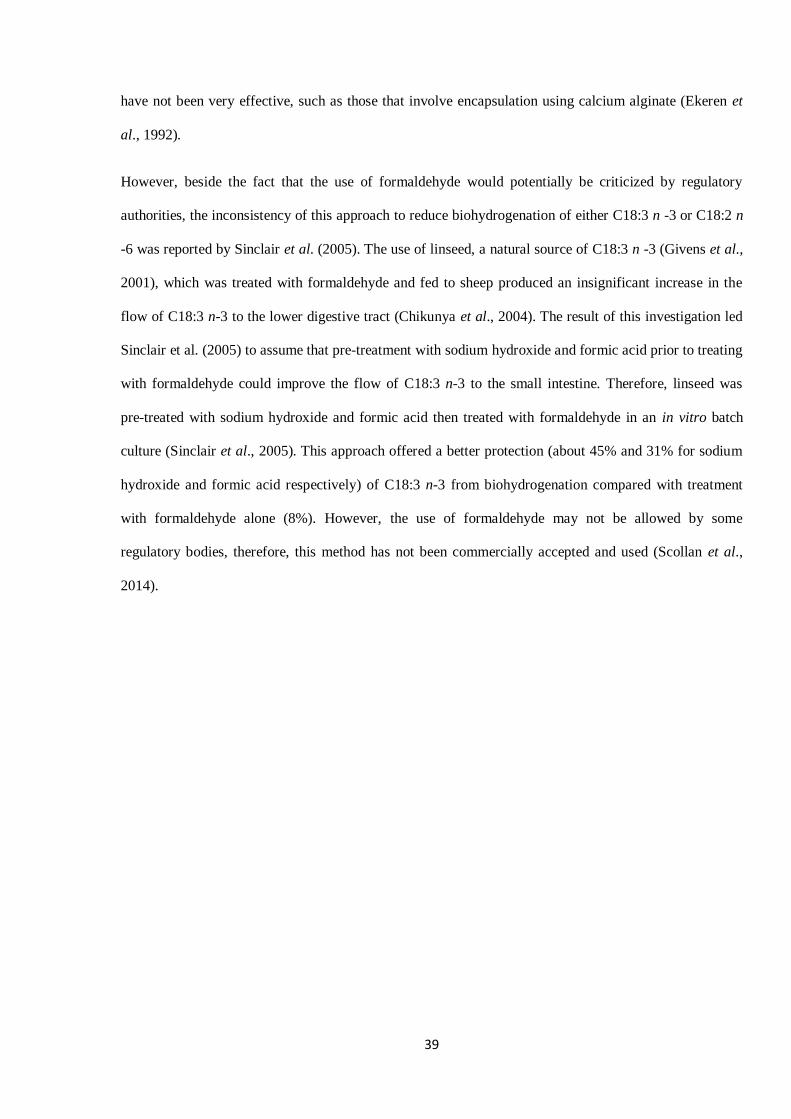
39
have not been very effective, such as those that involve encapsulation using calcium alginate (Ekeren et
al., 1992).
However, beside the fact that the use of formaldehyde would potentially be criticized by regulatory
authorities, the inconsistency of this approach to reduce biohydrogenation of either C18:3 n -3 or C18:2 n
-6 was reported by Sinclair et al. (2005). The use of linseed, a natural source of C18:3 n -3 (Givens et al.,
2001), which was treated with formaldehyde and fed to sheep produced an insignificant increase in the
flow of C18:3 n-3 to the lower digestive tract (Chikunya et al., 2004). The result of this investigation led
Sinclair et al. (2005) to assume that pre-treatment with sodium hydroxide and formic acid prior to treating
with formaldehyde could improve the flow of C18:3 n-3 to the small intestine. Therefore, linseed was
pre-treated with sodium hydroxide and formic acid then treated with formaldehyde in an in vitro batch
culture (Sinclair et al., 2005). This approach offered a better protection (about 45% and 31% for sodium
hydroxide and formic acid respectively) of C18:3 n-3 from biohydrogenation compared with treatment
with formaldehyde alone (8%). However, the use of formaldehyde may not be allowed by some
regulatory bodies, therefore, this method has not been commercially accepted and used (Scollan et al.,
2014).
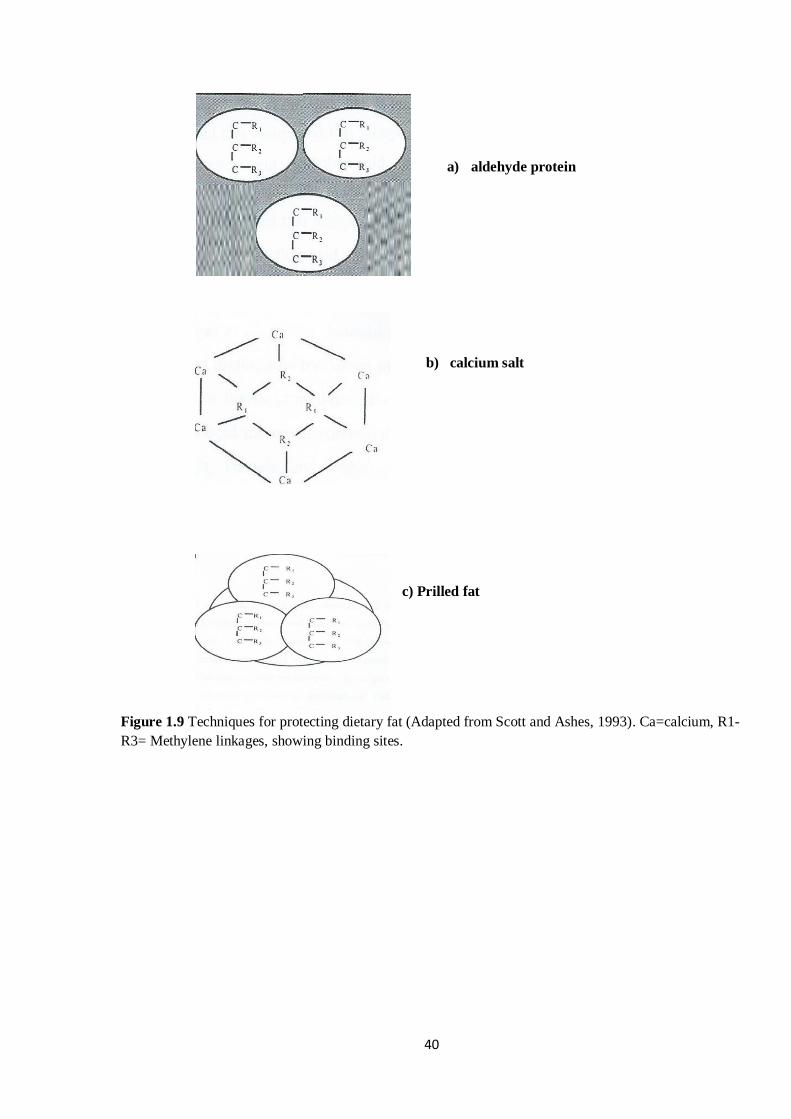
40
a) aldehyde protein
b) calcium salt
c) Prilled fat
Figure 1.9 Techniques for protecting dietary fat (Adapted from Scott and Ashes, 1993). Ca=calcium, R1-
R3= Methylene linkages, showing binding sites.
41
1.5.2. Saponification (Calcium soaps)
Saponification technique which involved the addition of calcium chloride to molten sodium salts of the
lipid was proposed by Jenkins and Palmquist (1984; Figure 1.9b). After adding the calcium chloride,
calcium salts precipitated and the soap was air dried before milling and added to diets. The authors
proposed this means of protecting PUFA from ruminal biohydrogenation because calcium soaps
dissociated in the acidic environment of the abomasun but were insoluble in the rumen.
Wu et al. (1991) reported 49% biohydrogenation (51% protection) by using calcium salt of palm oil to
reduce microbial degradation in the rumen compared with 80% biohydrogenation for the control diets.
Tallow calcium soaps allowed a normal fibre digestibility of 50%, whilst tallow fatty acids caused a
decrease in fibre digestibility from 51% (control cows) to 45% (Jenkins and Palmquist (1984). The
negative effects of calcium soaps based on palm oil were not observed by Elmeddah et al. (1991). This
was attributed to the low dissociation of calcium salts at a normal rumen pH of 6-7 (Sukhija and
Palmquist, 1991). However, subsequent studies reported extensive biohydrogenation of calcium salts,
especially those of USFA at pH less than 6.0 (Ferlay et al., 1993; Enjalbert et al., 1994). The rapid
decline in pH upon feeding the calcium soaps was suggested to be responsible for the extensive
biohydrogenation. Subsequent in vitro studies confirmed the effects of rumen pH on calcium soaps (Van
Nevel and Demeyer, 1996). The flow of unsaturated fatty acids to the duodenum was not affected when
calcium linoleate was fed to sheep (Fotouhi and Jenkins, 1998). Therefore, it was suggested that
protection of unsaturated fatty acids from ruminal microbial break-down is only possible if an insoluble
matrix of saturated calcium salts is used for the encapsulation. This suggests that protection is only likely
at low concentration of unsaturated fatty acid content, thereby limiting the extent to which alteration of
the unsaturated fatty acid composition of milk and meat can be achieved (Jenkins and Bridges, 2007). The
report by Enjalbert et al. (1997) supported this suggestion where the feeding of calcium salts of palm oil
fatty acids resulted in higher flow of linoleic acid to the duodenum than the feeding of calcium salts of
rapeseed fatty acid. When a commercial product based on calcium salts of soyabean oil was used to
replace soyabean oil (Oliveira et al., 2012), the concentration of 18:2 n-6 was observed to increase in the
42
muscle of beef cattle. However, experimental application of this process to linseed oil did not protect
PUFA from ruminal biohydrogenation (Oliveira et al., 2012).
1.5.3. Prilling (prilled fatty acids)
A dried prilled fatty acid supplement which is inert in the rumen environment is obtained by liquefying a
mixture of fatty acids containing high levels of saturated fatty acid and passing the fatty acid mixture
under pressure into a cooled atmosphere (Figure 1.9c). Prilling can therefore be defined as the process in
which fatty acids are crystallized together in a matrix through a rapid cooling process resulting in the
production of small spherical beads (Schauff and Clark, 1989; Figure 1.11). Because prilled fat
supplements are inert in the rumen, nutrient digestion is not affected when the supplement is added at
3.5% or less in the diet. Calcium salts of palm oil fatty acids and a relatively saturated fat source (C18:1,
12.8%; C18:0, 35.1% and C16:0, 48.6%) were compared by Grummer (1988). When the rumen pH is
maintained at above 6.0, hydrolysed saturated fatty acids react more readily with metal ions resulting in
the formation of salts that are insoluble in the rumen (Palmquist, 1984). In in vitro experiment to assess
the efficiency of fat supplements for ruminants, Gulati et al. (1997) observed that there was 90% and 65%
biohydrogenation for the control and prilled fat supplement respectively. However, the potential of
prilling to protect PUFA from biohydrogenation was not observed in other studies. For example,
Harvatine and Allen (2006) reported that prilling did not affect milk fat concentration and the fatty acid
profile of milk fat obtained from animals fed prilled fat supplement was similar to the control.
1.5.4. Fatty acyl amides
Fatty acyl amides which resist microbial breakdown in the rumen are formed by reacting fatty acids with
amines (Fotouhi and Jenkins, 1992a; Jenkins, 1995). The amide bond which results from the primary
amine group and the fatty acid carboxyl group is digestible in the small intestine, but undegradable in the
rumen (Langar et al., 1978). Biohydrogenation of linoleic acid by rumen microorganisms was observed to
be higher than that of linoleoyl methionine (Fotouhi and Jenkins, 1992b). The duodenal flow of linoleic
acid increased when small quantities of linoleoyl methionine were added directly to the rumen of sheep
compared with a free linoleic acid supplement (Fotouhi and Jenkins, 1992b; Jenkins, 1995). Addition of
soybean oil amide derivates to a diet for lactating cows increased the concentration of 18:2 n-6 in plasma
43
from 54.3% (control) to 59.0% (Jenkins et al., 1996). However, this protection technique is not
commercially available yet. In addition, Jenkins (1998) reported that addition of oleamide to the diet for
dairy cows negatively affected dry matter intake compared with the control.
1.5.5. Oil seeds
Polyunsaturated fatty acids in dietary fats can be naturally protected from ruminal biohydrogenation
through the supplementation of whole oilseeds with intact seed coat in ruminant diets instead of oils. This
has been observed to elevate the concentration of USFA in muscle tissue (St John et al., 1978; Solomon
et al., 1991; Ekeren et al., 1992). However, the efficiency of this technique can be reduced during
processing and mastication, which disrupts the intact seed coat. For efficient post-ruminal digestion, it has
been generally accepted that oilseeds or grains for ewes and cattle should be rolled or coarse ground
before feeding. This form of processing would disrupt the seed coat consequently exposing the lipids to
microbial transformation in the rumen. Orskov et al. (1974) suggested that there is no advantage in
processing oil seeds because sheep masticate their feed efficiently.
In summary, comparison of the ruminal fatty acid protection potential for some of the available protection
technologies was made by Lundy et al. (2003). In that study, the authors offered three equal amounts of
soybean fatty acids to cows as amides, unprotected and as calcium salts. The C18:2 ruminal
disappearance as a proportion of intake was 92.4%, 94.8 and 92.2 for the amides, the unprotected oil and
the calcium salts, respectively. This clearly demonstrates a non-substantial difference between the control
and the two protection technologies. In addition, de Veth et al. (2005) conducted a study to evaluate the
effect of formaldehyde and calcium salts protected forms of a trans-10, cis-12 CLA. It was observed that
the mean transfer of the CLA isomer to milk fat was 3.2 and 7.0 for the calcium salts and formaldehyde
treatments, respectively. This compared with approximately 20% transfer effectiveness for abomasal
infusion of the same CLA. This indicates less rumen protection efficiency by both calcium salts and
formaldehyde treatments. However, protection was better with formaldehyde treatment than calcium
salts.
44
As discussed above, inhibition of ruminal biohydrogenation is not consistent with any of the available
protection technology and none of these technologies meets all the essential features of any supplement to
protect ruminal biohydrogenation of PUFA. Therefore, in the recent times, considerable attention has
been given to evaluation of plant secondary metabolites and how they influence ruminal
biohydrogenation of PUFA. These compounds which possess antimicrobial activities are thought to
inhibit lipases involved in hydrolysis of fat.
1.6. Plant Bioactive Compounds and rumen Biohydrogenation
Plant secondary metabolites (PSM) refer to a wide range of chemical compounds which are produced by
plants but are not a requirement for the primary biochemical processes involved in growth, reproduction
and development of the plant (Calsamiglia et al., 2007; Patra, 2012). The primary functions of these PSM
in plants are that they act as protective agents against invasion from a wide range of foreign particles such
as pathogenic microorganisms (Calsamiglia et al., 2007).
The use of plant bioactive compounds (PBC) such as tannins, saponins and essential oils to modify
ruminal biohydrogenation is quite a recent development. Over many decades in the past, the main aim of
evaluating plants (trees, bushes or forages) which are high in secondary compounds was to ascertain their
suitability as feeds in livestock farming such as their effects on digestion of feeds, performance and
growth, reproduction and health of animals (Vasta and Bessa, 2012). But, the interest in evaluating the
influence of PBC on the fatty acid composition of meat was developed only in the last few years (Vasta et
al., 2013). In this review, only the effects of essential oils on rumen fermentation and biohydrogenation
would be considered. However, the effects of other PBC on rumen fermentation and biohydrogenation of
PUFA can be found in the recent review by Patra (2012). The effects of essential oils or their constituent
compounds on VFA and methane production and ammonia nitrogen metabolism have been adequately
investigated and recently reviewed (Patra, 2011; Vasta and Bessa, 2012). However, there is a scarcity of
information on the potential of EOs or EOCs as modifiers of rumen biohydrogenation of PUFA and
concentrations of BH intermediates such as CLA and VA. The aim of this PhD study was to compare the
potential of EOs and EOCs as feed additives to reduce the extent of rumen biohydrogenation of n-3

45
PUFA. This would potentially enable the optimization of the fatty acid composition of ruminant food
products with the use of either of these substances as feed additive.
46
1.7.0. Essential oils (the proposed technique)
1.7.1. Definition of Essential oil
Essential oils which are also known as volatile oils are aromatic (relating to the smell and taste) oily
liquids (Guenther, 1948; Burt, 2004). The presence of EOs in plants determines the unique smell of plants
due to the different smells and aroma produced by different EOs (Szumacher-Strabel and Cieslak, 2012).
These complex compounds are produced as secondary metabolites from aromatic plants, particularly,
spices and herbal plants (Bakkali et al., 2008; Patra, 2011). Contrary to what the name suggests, these oils
are not oils or lipids, but mainly volatile aromatic compounds extracted from different parts of a plant
such as the seeds, flowers, herbs, leaves, wood, bark, buds, roots and twigs (Burt, 2004; Hart et al., 2008).
Naturally, the existence of EOs in a plant may provide protection for the plant against external invasion
from organisms such as fungi, virus, bacteria and insects, as well as reducing the appetite of herbivores
for such plant (Greathead, 2003; Bakkali et al., 2008). The term ‘essential oil’ is derived from ‘Quinta
essentia’, a name which was first used by Paracelsus Von Hohenheim, a Swiss reformer of medicine, in
the 16th century (Guenther, 1948). This term ‘essential’ coins from essence, is meant to relate to the
property (smell or taste) of these materials in which the primary function is to provide specific odours or
flavours to the parent plant (Calsamiglia et al., 2007). Although there are several methods of obtaining
these oils from the plant, such as expression, extraction and fermentation, steam distillation is the most
widely used method for the commercial production of EO (Gershenzon and Croteau, 1991; Van de Braak
and Leijten, 1999). Steam distillation, which was initially developed and used in the Middle Ages by
Arabs, is popularly used to extract EOs to prevent compositional changes due to the volatile nature of
these oils (Simon, 1990; Greathead, 2003; Bakkali et al., 2008). Because of their volatile nature, EOs are
usually stored in airtight jars in dark areas to prevent compositional changes. The quantity and quality of
EOs may vary depending on the soil composition, climatic condition, vegetative stage, age and the plant
organ from which the oil is extracted (Masotti et al., 2003; Angioni et al., 2006).
Naturally, EOs have a range of properties such as antifungal, insecticidal and antibacterial, and they have
been used based on those properties (Thormar, 2011). Generally, about three thousand EOs are known,
47
but only around 300 have been commercially described by the fragrant and flavour companies (Van de
Braak and Leijten, 1999). The usefulness of the described (referring to the 300 above) EOs have been
shown in different industries like agriculture, sanitary, pharmaceutical, perfume, food, and cosmetic
(Calsamiglia et al., 2007; Bakkali et al., 2008). They are also used as mixtures of vegetal oil used for
massages, in aromatherapy and baths (Thormar, 2011). Some essential oils have been suggested to
possess potential for the cure and prevention of systemic malfunction and organ dysfunction due to
certain medicinal properties (Perry et al., 2003; Silva et al., 2003).
1.7.2. Composition of EO
EOs have a wide range of activities due to the diverse nature of their chemical composition.
Compositional analyses of EOs have indicated that essential oils are a mixture of about 20-100 individual
constituent compounds (EOCs) at different proportions (Senatore, 1996; Russo et al., 1998, Pengelly,
2004; Dung et al., 2008). The composition of the profile of EO can be determined either by gas
chromatography or mass spectrometry (Juliano et al., 2000; Delaquis et al., 2002). The estimated
proportion of the major components of EOs are around 20-85%, whilst trace amounts of other minor
components account for about 15% of the total (Senatore, 1996; Bauer et al., 2001). For instance, the
main components of Coriandrum sativum essential oil is linalool (68%); thymol (27%) and carvacrol
(30%) are the main components of Origanum compactum essential oil; menthone (19%) and menthol
(59%) are of Menthe piperita; and 1,8-cineole (50%) is the main component of the essential oil of
Cinnamomum camphora (Calsamiglia et al., 2007; Bakkali et al., 2008). The antimicrobial properties of
essential oils are predominantly determined by the major active compounds. However, other minor or
trace compounds can also contribute either synergistically or antagonistically to the activities of the main
components (Burt, 2004).
Structurally, EOs are complex mixtures of a diverse range of chemical compounds having terpenoids
(monoterpenoids and sesquiterpenoids) and phenylpropanoids as the most active forms (Calsamiglia et
al., 2007). A variety of low molecular weight aliphatic hydrocarbons, aldehydes, alcohols, lactones or
acyclic esters and acids may also exist (Dorman and Deans, 2000). These two most active compounds,
terpenoids and phenylpropanoids, are derived from different precursors of the primary metabolism, and
48
are synthesized from two separate pathways of metabolism (Gershenzon and Croteau, 1991; Calsamiglia
et al., 2007). Based on these classifications, terpenoids are the most important and more abundant (about
15,000 compounds have been described) compounds in herbs and spices compared to the
phenylpropanoids (Gershenzon and Croteau, 1991).
Terpenoids, which are synthesized from mevalonate metabolic pathways, are derived from a basic
structure of C-5 isoprene units, and the number of these units in its skeleton determines the classification
of terpenes (Calsamiglia et al., 2007). Predominantly, terpenes occur as monoterpenes (C₁₀) and
sesquiterpenes (C₁₅), but other categories such as diterpenes (C20), sesterterpenoids (C25), triterpenes
(C30) and tetraterpenes (C40) may also exist (Gershenzon and Croteau, 1991; Thormar, 2011; Patra,
2012). The monoterpenes, which are the most abundant form of terpenes, are made from the linkage of
two isoprene units; hence, they have 10 carbon atoms (Calsamiglia et al., 2007). As the most common
form of terpenes, monoterpenes have a diverse range of structural composition, and constitute about 90%
of EOs constituent compounds (Bodas et al., 2012). Types of monoterpenes (acyclic, bicyclic etc.) and
their examples are shown in Table 1.3.
Sesquiterpenes are formed from the combination of three isoprene units (C₁₅). Different structures of
sesquiterpenes are formed from the extension of the preceding chain, leading to increases in the number
of cyclization (Thormar, 2011). In terms of functions and structures, sesquiterpenes are similar to
monoterpenes (Bakkali et al., 2008; Thormar, 2011). Some types of sesquiterpenes and their examples are
shown in Table 1.4. A number of plants such as Juniper, caraway, citronella, angelica, mandarin, pine,
eucalyptus, lemon, thyme, bergamot, coriander, lemongrass, lavender, rosemary, mint, sage, peppermint,
lavandin, celery, orange and geranium, contain these compounds (Bakkali et al., 2008).
The second most abundant form of EOCs is the Phenylpropanoids. Relative to the terpenoids,
phenylpropanoids do not exist in high proportions in EOs, however, in some plants; their concentration
may be significant (Calsamiglia et al., 2007). Phenylpropanoids are derived from phenylalanine, and are
synthesized through the shikimate pathway, a process which is only functional in plants and
microorganisms (Sangwan et al., 2001). Phenylpropanoids are compounds with a side chain of C3 which
49
is bound to an aromatic ring of six carbons (C6) (Calsamiglia et al., 2007). Types of phenylpropanoids
and their examples are shown in Table 1.5. The main plant sources of this group of compounds are clove,
sassafras, fennel, cinnamon, tarragon, nutmeg, anise, and some of the botanical families from which these
plants belong are Rutaceae, Lamiaceae, Apiaceae and Myrtaceae (Thormar, 2011).
Some plants also contain sulphur and nitrogen containing compounds such as isothiocyanate or
glucosinolates derivatives (mustard and garlic oils) (Dorman and Deans, 2000).
In terms of antimicrobial potency, essential oil constituent compounds can be grouped into the following
in order of descending potential: phenols > cinnamic aldehyde > alcohols > aldehydes (ketones > ethers >
hydrocarbons) (Kalemba et al., 2012).
As mentioned previously, although steam distillation is widely used for commercial production of EOs,
obtaining these oils by means of liquid carbon dioxide under high pressure and low temperature is also
available (Moyler, 1998). However, this CO2 method is more expensive but produces oil with more
natural organoleptic composition relative to steam distilled oils (Moyler, 1998). These two methods of
extracting EOs are responsible for the difference in the composition of essential oil profile (Burt, 2004).
The difference in the antimicrobial properties of EOs and their compounds is also attributed to the method
used during extraction (Burt, 2004). This difference in antimicrobial properties have been shown where
the steam distilled EOs exhibit lower antimicrobial activity compared to the antimicrobial potential of
herb EOs extracted by hexane (Packiyasothy and Kyle, 2002).
The antimicrobial properties of EOs have been suggested to be influenced mainly by the phenolic
components (Cosentino et al., 1999). In such phenolic compounds, the hydroxyl group and the dislocated
electrons permeate the interaction with water through hydrogen bridges, enabling phenolic compounds to
be very active against wide range of microorganisms (Griffin et al., 1999; Davidson and Naidu, 2000;
Dorman and Deans, 2000; Cox et al., 2001). Table 1.6 shows the main components of a number of EOs
and their individual proportion. The structural formulas of different major chemical components of EOs
are presented in Figure 1.10. It has been indicated that minor components produce some synergistic
50
effect with other major components, suggesting their possible function in determining the antimicrobial
potential of EOs (Burt, 2004). This suggestion has been confirmed in several studies for some species of
Thymus (Lattaoui and Tantaoui-Elaraki, 1994; Marino et al., 1999), Oregano (Paster et al., 1995) and
sage (Marino et al., 2001).
In addition to the method of extracting EO as a factor responsible for the difference in composition and
antimicrobial potential, the profile of EOs can also be influenced by geographical/environmental location
and harvesting seasons of the parent plant (McGimpsey et al., 1994; Cosentino et al., 1999; Marino et al.,
1999; Juliano et al., 2000). This can partly be understood by the formation of some antibacterial
substances from their parent materials in a particular environment. As reported by many studies
(Cosentino et al., 1999; Jerkovic et al., 2001; Ultee et al., 2002), the precursors of thymol (5-methyl-2-(1-
methylethyl)phenol) and carvacrol (2-methyly-5-(1-methylethyl)-phenol) are γ-terpinene (1-methyl-4-(1-
methylethyl)-1,4-cyclohexadiene) and ρ-Cymene (1-methyl-4-(1-methyl)-benzene). The specimens
obtained from different environmental locations in Greece have been shown to contain the four
compounds in equal amounts to the proportion found in Greek oregano plants (Kokkini et al., 1997).
Similar report has been shown for Thymus vulgaris from Italy (Marino et al., 1999). This supports the
theory that the four compounds are functionally and biologically related (Kokkini et al., 1997). In general,
the strongest antimicrobial activity has been reported to be exhibited by EOs extracted from herbs which
are harvested immediately after flowering or during flowering (McGimpsey et al., 1994; Cosentino et al.,
1999; Marino et al., 1999). Different degree of antimicrobial potency has also been shown by different
enantiomers of EOCs (Lis-Balchin et al., 1999). The essential oil composition of cilantro, which is
obtained from the immature leaves of coriander (Coriandrum sativum), has been shown to have a
different profile from the EO obtained from the seeds of the same coriander (Delaquis et al., 2002). This
indicates that there can be wide variation between the compositions of EOs obtained from different parts
of the same plant.
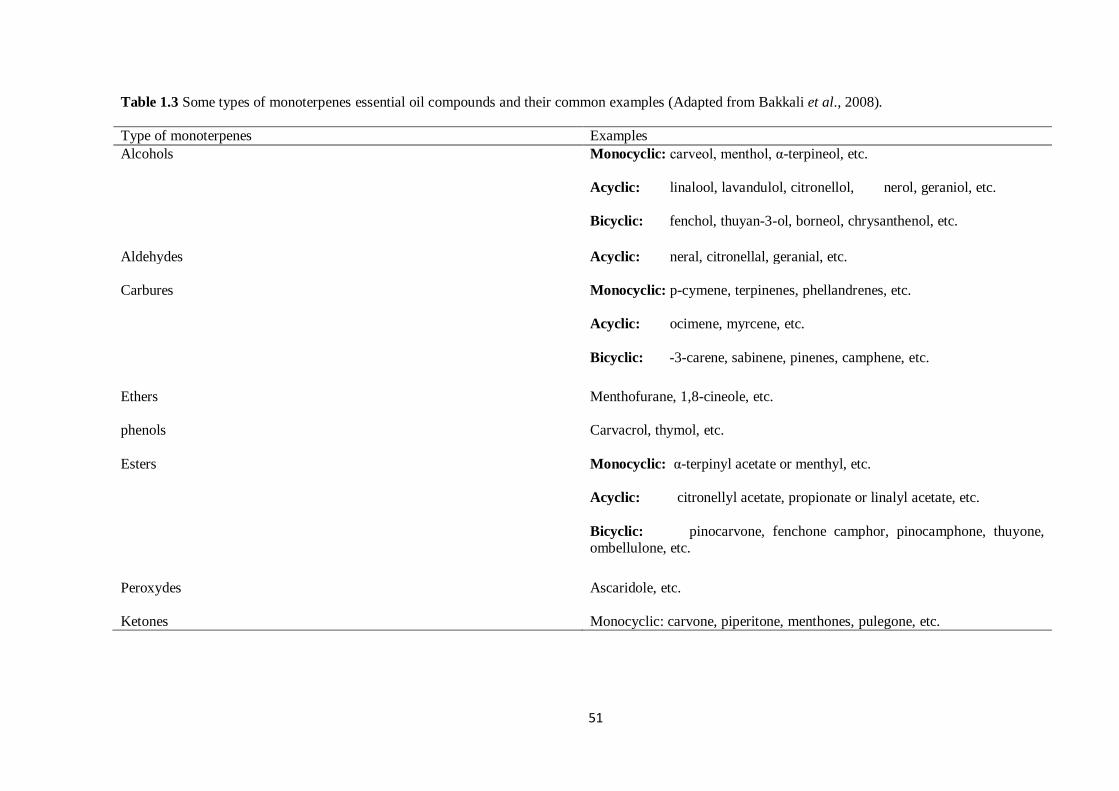
51
Table 1.3 Some types of monoterpenes essential oil compounds and their common examples (Adapted from Bakkali et al., 2008).
Type of monoterpenes Examples
Alcohols Monocyclic: carveol, menthol, α-terpineol, etc.
Acyclic: linalool, lavandulol, citronellol, nerol, geraniol, etc.
Bicyclic: fenchol, thuyan-3-ol, borneol, chrysanthenol, etc.
Aldehydes Acyclic: neral, citronellal, geranial, etc.
Carbures Monocyclic: p-cymene, terpinenes, phellandrenes, etc.
Acyclic: ocimene, myrcene, etc.
Bicyclic: -3-carene, sabinene, pinenes, camphene, etc.
Ethers Menthofurane, 1,8-cineole, etc.
phenols Carvacrol, thymol, etc.
Esters Monocyclic: α-terpinyl acetate or menthyl, etc.
Acyclic: citronellyl acetate, propionate or linalyl acetate, etc.
Bicyclic: pinocarvone, fenchone camphor, pinocamphone, thuyone, ombellulone, etc.
Peroxydes Ascaridole, etc.
Ketones Monocyclic: carvone, piperitone, menthones, pulegone, etc.
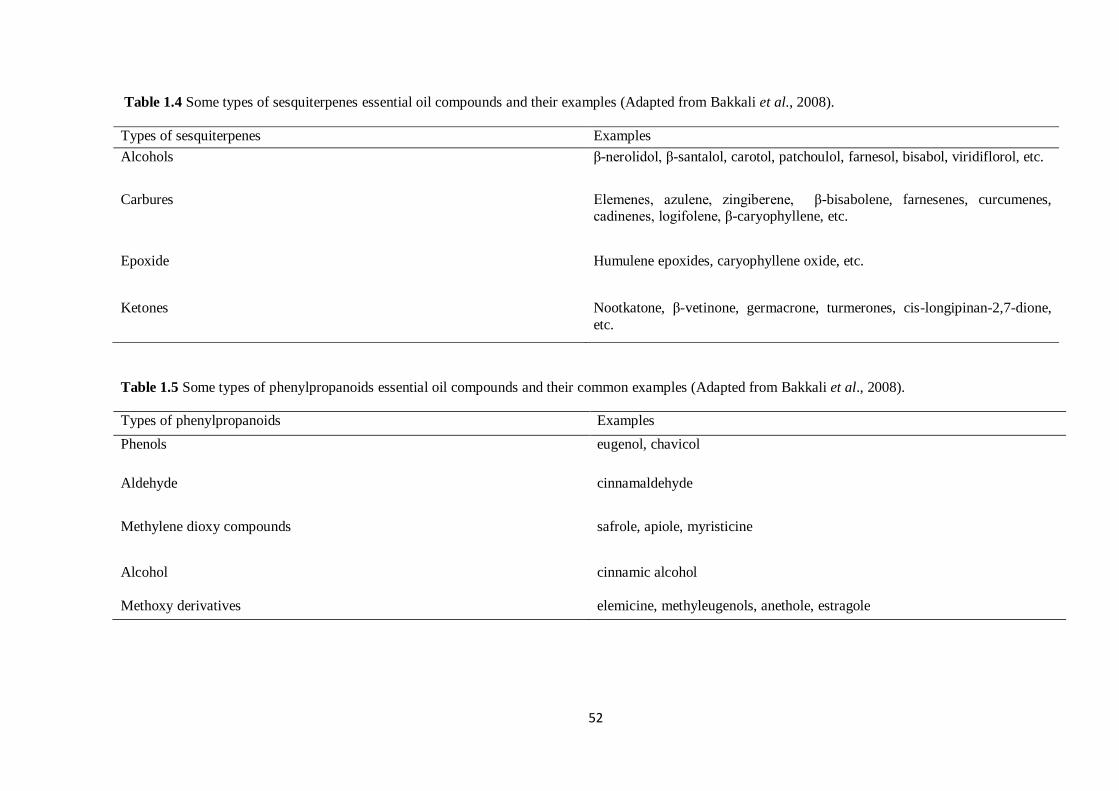
52
Table 1.4 Some types of sesquiterpenes essential oil compounds and their examples (Adapted from Bakkali et al., 2008).
Types of sesquiterpenes Examples
Alcohols β-nerolidol, β-santalol, carotol, patchoulol, farnesol, bisabol, viridiflorol, etc.
Carbures Elemenes, azulene, zingiberene, β-bisabolene, farnesenes, curcumenes, cadinenes, logifolene, β-caryophyllene, etc.
Epoxide Humulene epoxides, caryophyllene oxide, etc.
Ketones Nootkatone, β-vetinone, germacrone, turmerones, cis-longipinan-2,7-dione,
etc.
Table 1.5 Some types of phenylpropanoids essential oil compounds and their common examples (Adapted from Bakkali et al., 2008).
Types of phenylpropanoids Examples
Phenols eugenol, chavicol
Aldehyde cinnamaldehyde
Methylene dioxy compounds safrole, apiole, myristicine
Alcohol cinnamic alcohol
Methoxy derivatives elemicine, methyleugenols, anethole, estragole
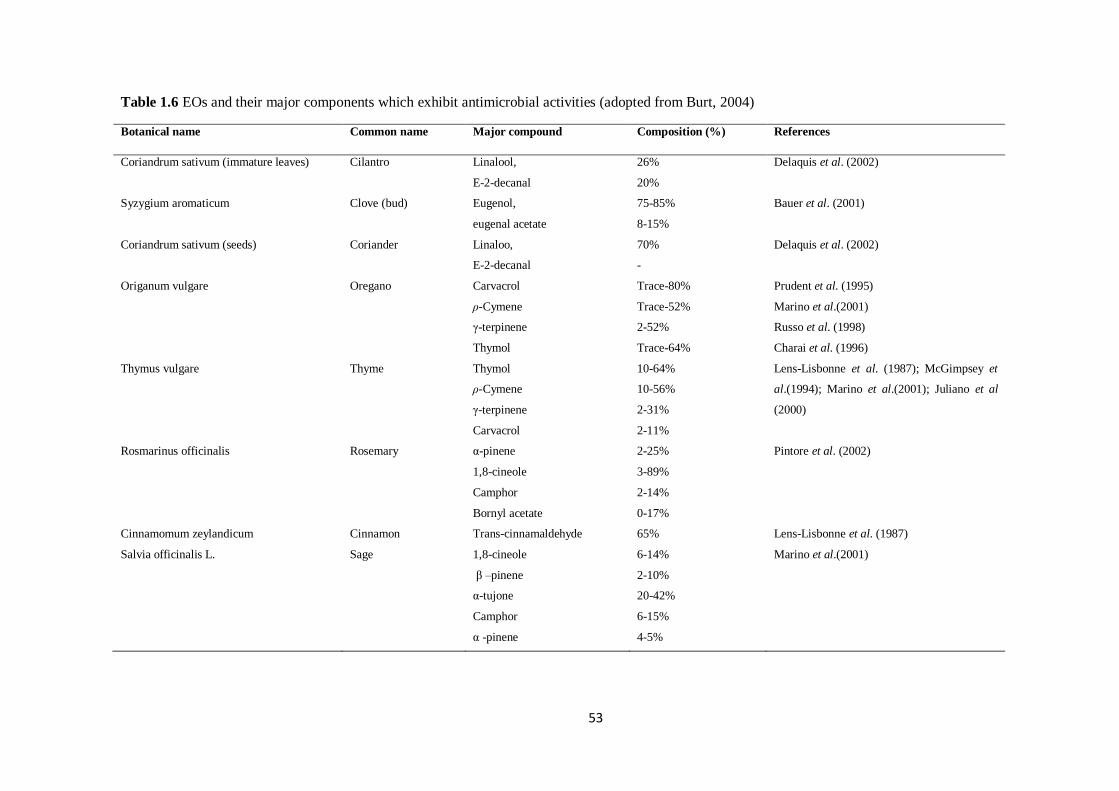
53
Table 1.6 EOs and their major components which exhibit antimicrobial activities (adopted from Burt, 2004)
Botanical name Common name Major compound Composition (%) References
Coriandrum sativum (immature leaves) Cilantro Linalool,
E-2-decanal
26%
20%
Delaquis et al. (2002)
Syzygium aromaticum Clove (bud) Eugenol,
eugenal acetate
75-85%
8-15%
Bauer et al. (2001)
Coriandrum sativum (seeds) Coriander Linaloo,
E-2-decanal
70%
-
Delaquis et al. (2002)
Origanum vulgare Oregano Carvacrol
ρ-Cymene
γ-terpinene
Thymol
Trace-80%
Trace-52%
2-52%
Trace-64%
Prudent et al. (1995)
Marino et al.(2001)
Russo et al. (1998)
Charai et al. (1996)
Thymus vulgare Thyme Thymol
ρ-Cymene
γ-terpinene
Carvacrol
10-64%
10-56%
2-31%
2-11%
Lens-Lisbonne et al. (1987); McGimpsey et
al.(1994); Marino et al.(2001); Juliano et al
(2000)
Rosmarinus officinalis Rosemary α-pinene
1,8-cineole
Camphor
Bornyl acetate
2-25%
3-89%
2-14%
0-17%
Pintore et al. (2002)
Cinnamomum zeylandicum Cinnamon Trans-cinnamaldehyde 65% Lens-Lisbonne et al. (1987)
Salvia officinalis L. Sage 1,8-cineole
β –pinene
α-tujone
Camphor
α -pinene
6-14%
2-10%
20-42%
6-15%
4-5%
Marino et al.(2001)

54
Figure 1.10 Chemical structures of different components of EOs (Adapted from Patra, 2102)
55
1.7.3. Mechanism of actions of EOs
Considering the large number of EOs and the diverse chemical compounds in them, it is unlikely that
there would be one specific mode of antimicrobial action or that there is one specific target site for their
actions (Skandamis et al., 2001; Carson et al., 2002). As indicated in Figure 1.11, a number of sites are
thought to be affected by the action of EOCs in different ways. However not all the sites are affected by
one action, some sites are affected as the consequence of the action of EOCs in another site (Burt, 2004).
In brief, EOCs alter microbial activities through a number of ways: degrading microbial cell wall
(Thoroski et al., 1989; Helander et al., 1998; Figure 1.11), damage to membrane proteins (Ultee et al.,
1999; Figure 1.11), depletion of the proton motive force (Ultee et al., 1999; Ultee and Smid, 2001) and by
damaging the cytoplasmic membrane (Ultee et al., 2002; Figure 1.11). They also achieve alteration of
microbial populations by causing leakage of the cell contents (Cox et al., 2000; Lambert et al., 2001) and
cytoplasmic coagulation (Gustafson et al., 1998).
Hydrophobicity of EOs and EOCs which enables them to partition in the phospholipid bilayer of
microbial mitochondria and cell membrane, causing damage to the structure and increasing the
permeability of the cell contents, is an important characteristic for the success of their mechanisms
(Sikkema et al., 1994). Because of the increased permeability of microbial cell, leakage of its contents
becomes possible (Helander et al., 1998; Skandamis et al., 2001; Ultee et al., 2002). Although death of
microbial cell can result from loss of critical cell contents (ions and molecules) or extended loss of
cellular materials, leakage of a certain amount of cellular contents may be tolerated with no adverse effect
on the viability of the cell (Denyer and Hugo, 1991). This tolerance could be achieved by diverting large
amounts of energy into ionic pumps to counterbalance the effect of the lost material, and this
consequently slows down bacterial growth (Ultee et al., 1999; Cox et al., 2001). These mechanisms of
actions are less effective against Gram-negative bacteria, where the cell membrane cannot interact
directly with the hydrophobic compounds in EOs. This is because the external cell wall around the Gram-
negative bacteria is hydrophilic, and therefore, not able to penetrate substances that are lipophilic in
nature (Calsamiglia et al., 2007). In contrast, because Gram-positive bacteria in which the cell membrane
can interact directly with the hydrophobic compounds of EOs, the described mechanism of action is more
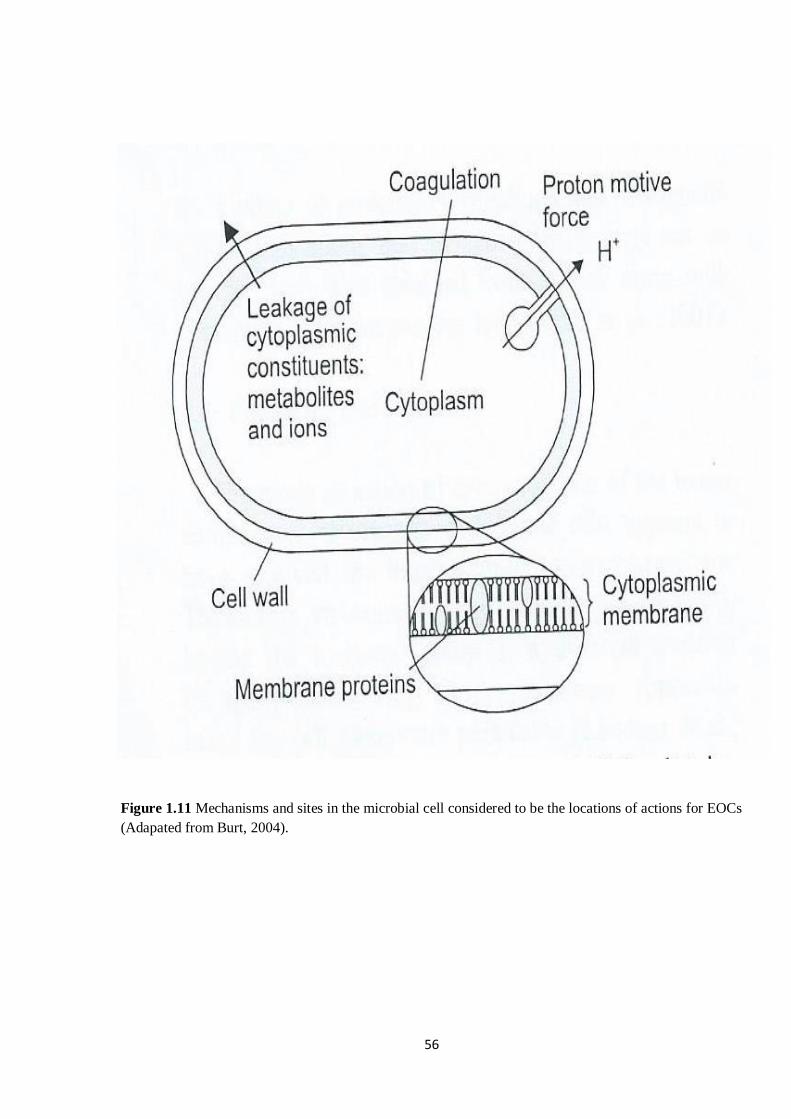
56
Figure 1.11 Mechanisms and sites in the microbial cell considered to be the locations of actions for EOCs
(Adapated from Burt, 2004).
57
effective against Gram-positive bacteria (Calsamiglia et al., 2007). Hence, Gram-positive bacteria are
more susceptible to the hydrophobicity of EOs and their compounds than Gram-negative bacteria which
have surface layer surrounding the membrane (Chao and Young, 2000; Cimanga et al., 2002; Bencharr
and Greathead, 2011). This difference is due to the variation in the microbial cell wall composition
between the two groups of bacteria. It is this susceptibility of Gram-positive bacteria to the antimicrobial
effects of essential oil compounds that makes them potential target. However, because the external
membrane of Gram-negative bacteria is not completely impermeable, it can be penetrated by some EOCs
that have low molecular weight such as thymol and carvacrol (Cox et al., 2001; Calsamiglia et al., 2007).
This means that the described mechanism of action does not apply to the low-molecular weight
molecules. These low-molecular weight compounds can penetrate the outer cell wall and interact with
membrane lipid of bacteria by reacting with H₂O through hydrogen bridges, and can diffuse slowly
through protein membrane or lipopolysaccharide layer (Griffin et al., 1999; Dorman and Deans, 2000;
Calsamiglia et al., 2007). In addition, destruction of the external cell wall of Gram-negative bacteria
leading to an increased penetration of the cytoplasmic membrane and the release of lipopolysaccharides
by the ability of some aromatic hydrocarbons found in essential oils have been reported (Helander et al.,
1998). It can be stated from the above mechanisms of EOCs with low-molecular weight that their
selection for use in practice (animal nutrition) is limited due to their practical effectiveness against both
the Gram-negative and Gram-positive bacteria. This non-selective effect of the low molecular weight
compounds does not have a beneficial implication in animal nutrition as the use of EOs or EOCs is to
cause selective inhibition of certain group of bacteria.
EOs containing high proportion of phenolic compounds such as thymol, carvacrol and eugenol (2-
methoxy-4-(2-propenyl)phenol as components of their chemical structure exhibit the strongest
antimicrobial properties against food borne pathogens (Cosentino et al., 1999; Juliano et al., 2000;
Lambert et al., 2001). It is considered that other phenolic compounds are likely to exhibit similar
antibacterial characteristics to the above. The mechanisms of action of phenolics are thought to generally
include disruption of proton motive force (PMF), coagulation of cell contents, disturbance of cytoplasmic
membrane and disrupting active transport and electron flow (Sikkema et al., 1995; Davidson, 1997).
58
The antibacterial activity and specific mode of action of an individual EO is influenced by the chemical
structure of EO components (Dormans and Deans, 2000). The presence of hydroxyl group in the chemical
structure of phenolics appears to be very vital for their high degree of antibacterial activities. The vital
role of the hydroxyl ring in the antimicrobial activity of phenolics was confirmed in previous studies
(Dormans and Deans, 2000; Ultee et al., 2002). However, the position of the -OH group on phenolic
compounds has not been reported to influence the antibacterial activity of EOC to any great extent. For
example, the action of carvacrol against Pseudomonas aeruginosa, Staphylococcus aureus and B. cereus
seems comparable to the mechanisms of thymol against the same set of organisms (Lambert et al., 2001;
Ultee et al., 2002). Nevertheless, Dorman and Deans (2000) reported that thymol and carvacrol behaved
differently in their action against Gram-negative and Gram-positive bacteria. The lack of activity of
menthol relative to carvacrol in the study by Ultee et al. (2002) appears to shed more light on the
importance of the phenolic ring itself (destabilized electrons) in determining the degree of antibacterial
activity. For the non-phenolic components of EOs, the antimicrobial strength has been associated with the
type of alkyl group, with alkenyls such as limonene, where the alkenyl substituents are incorporated into
non-phenolic ring, shown to express greater antimicrobial activity than alkyl group such as p-cymene
(Burt, 2004). This suggests that the stereochemistry and the structure of EOCs have great impact on the
antimicrobial characteristics of the compound or its parent oil. This has been confirmed in previous study
where limonene (1-methyl-4-(1-methylethenyl)-cyclohexene) was reported to exhibit greater antibacterial
potency than ρ-Cymene (Dorman and Deans, 2000). The stereochemistry of EOs had also shown that
trans-isomers are more active relative to cis-isomers; β-isomers like nerol and geraniol are more active
compared to α-isomers like α–pinene; the most active compounds are those with methyl-isopropyl
cyclohexane rings; and the antibacterial activity is highest in unsaturated cyclohexane such as
terpineolene, terpineol or terpinolene (Dorman and Deans, 2000).
The cell proteins found in the cytoplasm of bacterial cell membrane is another site thought to be affected
by the mechanisms of action of EOCs (Knobloch et al., 1989). Lipid molecules are known to have
boundaries with cytoplasmic membrane and the cell membrane is also known to contain enzymes such as
ATPases. Direct interaction of the lipophilic compounds with the hydrophobic components of protein and
59
accumulation of lipophilic hydrocarbons in the lipid bilayer leading to distortion of the lipid-protein
interaction have been suggested as two possible ways through which cyclic hydrocarbons could act on
this site (Juven et al., 1994; Sikkema et al., 1995). Components of EOs have also been suggested to
influence the synthesis of structural components involved in the enzymes responsible for energy
regulation (Conner and Beuchat, 1984). Inhibition of amino acid decarboxylases in Enterobacter
aerogenes was shown for cinnamon oil and the active components of the oil (Wendakoon and Sakaguchi,
1995).
Effect of EO on stimulation or inhibition of rumen microbes depends on the chemical composition of an
essential oil (Dorman and Deans, 2000), and the part of the plant species from which the compound is
extracted (Patra and Saxena, 2009). The inhibition of the growth of microbes by different EOCs is
mediated by different mode of action due to the variety of EOCs (Calsamiglia et al., 2007). As
cinnamaldehyde penetrate into the periplasm through porin proteins of the external membrane of
microbial cell by its carbonyl group (Nikaido, 1994; Helander et al., 1998), carvacrol exchanges its
hydroxyl proton with a cation like K+ by acting as a membrane carrier of monovalent cations (Bodas et
al., 2012). This mode of action by carvacrol eventually results in bacterial cell death due to the reduction
of ATP synthesis (Ultee et al., 2002; Busquet et al., 2006). The antimicrobial activity of anethol is due to
the ether group of the aromatic ring (Davidson and Naidu, 2000). Membrane-active biocide broad
spectrum activity is exhibited by some compounds in the tea tree oil (Davidson and Naidu, 2000).
The main effects and mode of action of essential oil compounds tend to be focused on their toxicity to cell
membranes (Calsamiglia et al., 2007) as described above. However, this is possibly not the only mode of
action exhibited by EOCs since other mechanisms have also been reported. Coagulation of certain
components of bacterial cell membrane through denaturation of protein is another possible way through
which the effect of EOCs can be exerted on microorganisms (Gustafson and Bowen, 1997). Components
of essential oil can cause damage to the proteins and lipids (Ultee et al., 2002; Burt, 2004) and can cause
coagulation of the cytoplasm (Gustafson et al., 1998). The leakage of macromolecules and lysis can
consequently result from bacterial membrane and cell wall damage (Juven et al., 1994; Cox et al., 2000;
Oussalah et al., 2006). These would result ultimately to inactivation of microbial enzymes (Benchaar et
60
al., 2008; Patra and Saxena, 2010). In addition, the potential of some non-phenolic and phenolic EOCs to
interact with bioactive molecules like enzymes and to interact with chemical groups of proteins have been
reported (Juven et al., 1994). Non-phenolic compounds have been suggested to interact with protein by a
mode of action such as interaction with the carbonyl group of cinnamaldehyde (Outtara et al., 1997). By
contrast, the reaction of phenolic compounds with protein is through hydrophobic interaction or reaction
with ion and hydrogen bridges (Outtara et al., 1997; Prescott et al., 2004; Calsamiglia et al. (2007).
Interaction with proteins and nucleic acids leading to their inactivation through alkylation or crossed
bridges could be the mode of actions by other aldehyde compounds (Prescott et al., 2004). For instance, it
was reported that the enzymatic activity of Enterobacter aerogenes could be inhibited through protein
binding by the constituents of clove and cinnamon essential oils (Wendakoon and Sakaguchi, 1995).
Compared with most other essential oil compounds, the essential oil of garlic is a special case as most
compounds of garlic oil are not found in the entire plant, but only made from thiosulfates when the plant
is treated with steam (Pentz and Siegers, 1996). Their activities against a large variety of both gram-
negative and gram-positive bacteria, viruses, fungi and parasites have been reported (Reuter et al., 1996).
Inhibiting the synthesis of proteins of the cell, DNA and RNA are the various modes of actions that have
been proposed to substantiate the anti-microbial activity of these compounds (Feldberg et al., 1988). The
ability to interact with the sulfhydryl groups (-SH) of other active compounds has been suggested as the
principal anti-microbial mechanism for the constituents of garlic oil (Reuter et al., 1996; O’Gara et al.,
2000). Several studies (Reuter et al., 1996; Ross et al., 2001; Busquet et al., 2005b) have reported that
each additional S atom increases the antimicrobial activity of allyl sulphur compounds of garlic oil. These
authors also reported that the antimicrobial action of individual main compounds of garlic oil is less
powerful than the activity of garlic oil, indicating that there is synergy among the different constituents of
the oil.
61
1.7.4. Antagonism and synergism between EOCs
The chemical configuration of EOCs, their interactions with one another and their individual proportions
are key factors that determine the inherent activity of essential oils (Dorman and Deans, 2000; Marino et
al., 2001; Delaquis et al., 2002). Constituents of EOs could interact in many ways such as synergism,
antagonism or additivity. Synergism between EOCs is observed when the effect of an individual
component is lesser than the combined effects of the substances (Davidson and Parish, 1989).
Antagonism as another form of interaction occurs when the effect of individual substances is greater than
the resultant effect of combining one or more compounds. An effect is observed to be additive when the
sum of the individual effect is not different from the combined effect of compounds (Burt, 2004). The
antibacterial potential of the whole EOs have been reported to be greater than the effects of mixing their
major active individual components (Gill et al., 2002; Mourey and Canillac, 2002). This suggests that the
minor components of the oil are equally involved in determining the antibacterial activity of the oil and
may have a synergistic effect with the major components (Burt, 2004).
An additive effect of thymol and carvacrol, the two structurally similar main compounds found in the EO
of oregano, was observed in a study with P. aeruginosa and Staphylococcus aureus (Lambert et al.,
2001).
Carvacrol and its precursor (ρ-Cymene) have been shown to exhibit synergistic effect when tested against
vegetative cells of B. cereus. It seems that carvacrol with a weak potential to swell bacterial cell
membranes, relies on ρ-Cymene with a weak antibacterial but greater potential to swell microbial cell
membranes (Burt, 2004). By this mode of action, the transport of carvacrol into the cell is probably
enabled by ρ-Cymene, so that when the two compounds are mixed together synergism is easily achieved
(Ultee et al., 2000).
A number of effects of interactions such as antagonism, synergism and additivity have been shown when
mixing various combinations of coriander, eucalyptus, cilantro and dill EOs, each containing different
chemical composition (Delaquis et al., 2002). The growth of some microbes such as Enterobacter sp.,
Micrococcus sp., Staphylococcus sp. and Bacillus sp. was inhibited when 250 ug /mL of cinnamaldehyde
62
and 500 ug/mL of eugenol were mixed together as opposed to individual application of these compounds
(Moleyar and Narasimham, 1992).
1.7.5. Effects of EOs on feed intake, digestion and VFA production
The use of EOs and their constituent components in ruminant nutrition impacts feed intake and digestion
in different ways, depending on the dose and type of EO or EOC. Feed intake was not affected by feeding
2 g of juniper berry EO, containing α –pinene (35%) to cows (Yang et al., 2007), a mixture of EO (2 g
or 0.75 g) to dairy cattle (Benchaar et al., 2007a) and 250 mg/day of oregano EO to sheep (Wang et al.,
2009a). But, feed intake was negatively affected by feeding 500 mg/day of cinnamaldehyde (Busquet et
al., 2003), and a mixture of eugenol (90 mg/day) plus 180 mg/day of cinnamaldehyde (Cardozo et al.,
2006). It is possible that problems of diet palatability was associated with the reduction of feed intake,
suggesting that encapsulation of these substances might improve feed intake (Calsamiglia et al., 2007).
By contrast, feed intake and fermentation were increased when 1 g/day of capsicum extract (containing
15% of capsaicin) was added to a concentrate based-diet for beef cattle (Cardozo et al., 2006). There was
increased (by 13%) ruminal digestibilities of dry matter (DM) when 2 g/cow/day of juniper berry
essential oil was added to forage (40%) and barley-based concentrate (60%) in Holstein cows (Yang et
al., 2007). The digestibilities of different nutrients in dairy goats were not affected by the inclusion of
monoterpene blend (0.43 g/kg diet) containing α-pinene (16.0%), β-pinene (2.2%), p-cymene (36.7%) and
linalool (45.2%) to the diet (Malecky et al., 2009). As opposed to reduced digestibility of diet reported
by Busquet et al. (2005) and Agarwal et al. (2009), other studies observed no effect on digestibility of
nutrients (Sallam et al., 2009; Wang et al., 2009a). The differences in the intake and digestibility of DM
due to the addition of EOs or EOCs could be attributed to different doses and types of compounds.
Volatile fatty acids such as acetic, butyrate and propionate are the fundamental sources of energy for
ruminants. The digestibility of the nutrients in a used feed is reflected by the concentration of these
volatile fatty acids in the rumen (Szumacher-Strabel and Cieslak, 2012). Acetic acid is required for the
synthesis of fatty acids, whereas other short-chain FA such as valeric, isovaleric and isobutyric acids are
necessary to initiate the synthesis of these fatty acids (Wu and Huber, 1994). As reported by several
studies, the effects of EOs and EOCs on total volatile fatty acids (TVFA) and molar proportion of acetic
63
to propionic ratio have mixed results (Busquet et al., 2005; Chaves et al., 2008; Kamel et al., 2008; Patra
et al., 2010). There was a slight increase in the concentration of total VFA in the rumen when 750 mg/day
of a mixture of EOs was added to alfalfa silage (Benchaar et al., 2007a). However, the concentration of
total VFA in the rumen was reduced when the same mixture and same dose of EOs was added to a feed
ration based on corn silage. This suggests that the effects of EOs or EOCs on VFA could depend on the
type of diet. The amount of EOs or EOCs has also been demonstrated to influence the concentrations of
total and molar proportions of individual volatile fatty acids in the rumen. The addition of increasing
doses (0, 3, 30, 300 and 3000 mg/L) of a wide range of EOs such as anise, tea tree and cade oils and
EOCs such as anethole, carvacrol and eugenol did not affect the concentrations of total and molar
proportions of individual VFA in rumen fluid (Busquet et al., 2006). In that study, only the addition of
3000 g/L (the highest dose) of the substances to rumen fluid reduced the concentration of total VFA in the
rumen. From the nutritional perspective, a reduction in ruminal concentration of VFA which is due to
decreased production of the same fatty acids is an undesirable results because it reflects reduced
utilization of dietary energy from structural carbohydrates (Szumacher-Strabel and Cieslak, 2012).
Addition of EOs or EOCs is expected to change the molar proportion of VFA towards increasing
propionic concentrations and reducing acetic acid without affecting the total VFA. The pattern of VFA
production was shifted towards increased proportion of butyrate and reduced concentration of propionate
in the rumen when phenolic compounds such as thymol, carvacrol and eugenol were used (Benchaar et
al., 2007b). Furthermore, Castillejos et al. (2006) reported reduced concentration of propionate without
affecting the total VFA when 500 mg/L of eugenol was used. In another in vitro experiment,
supplementation of two EOCs (anethole and p-cymene) and three EOs (juniper berry, cinnamon leaf and
garlic oils) did not affect the concentration of total VFA but the molar proportion of propionate was
reduced by garlic and cinnamon leaf oils (Chaves et al., 2008).
The pH of the rumen has also been suggested as another factor which regulates the effects of EOs and
EOCs. The pH of the rumen fluid was reported to influence the effects of EOs on the concentration of
VFA (Cardozo et al., 2005). In that study, cinnamon oil increased the ratio of acetate to propionate at pH
7.0 and decreased the same ratio when the pH was 5.5. In a similar study, Spanghero et al. (2008)
64
reported that at lower pH, a blend of EO changed the end-products of fermentation, particularly, reduced
molar proportions of acetate: propionate ratio and proportion of acetate.
In general, from the aforementioned paragraphs, it seems that supplementing diet with EOs and/or EOCs
may reduce feed nutrient digestion with concomitant suppression of VFA at high doses or no change at
low doses. The pH of the rumen is also a determinant of the effects of EOs or EOCs on VFA production.
It has been observed that, in some long-term in vitro culture experiments, benefits associated with
essential oils and their constituents compounds may decline over time due to possible adaptation of
individual microbial species to EOs or EOCs or shifts in microbial population (Benchaar et al., 2008;
Patra and Saxena, 2009a).
1.7.6. Effects of essential oil compounds on ammonia production
The symbiotic relationship between the ruminal microbial population and the ruminant animal enables
ruminants to synthesize biologically high quality protein from non-protein sources of nitrogen (Benchaar
et al., 2008). Ruminants are able to synthesize proteins for deposition in meat and milk from the
microbial protein containing good profile of amino acids (Benchaar et al., 2008). Nevertheless, this
symbiotic relationship does not provide sufficient microbial protein to synthesize amino acids required by
high producing ruminant animals (Benchaar et al., 2008; Szumacher-Strabel and Cieslak, 2012).
Therefore, extra supplementary protein sources are required to correct the deficits in amino acids
requirement. However, due to inefficient utilization of excess protein, ruminant excrete waste materials
which are rich in ammonia which causes environmental pollution (Benchaar et al., 2008; Szumacher-
Strabel and Cieslak, 2012). Therefore, modulation of rumen activities towards improved protein
utilization would benefit both the environment and enhance ruminant animal production.
Many in vitro studies have been conducted to evaluate the potential influence of essential oils and EOCs
to regulate protein utilization by ruminants. EOs and EOCs affect volatile fatty acid (VFA) and ammonia
production by altering the activity and population of rumen bacteria, fungi and protozoa (Bodas et al.,
2012). Therefore, using whole EOs and or their constituent compounds could decrease ruminal NH₃-N
production leading to improvement in the efficiency of protein absorption by ruminants (Wallace et al.,
65
2002; Spanghero et al., 2008). Reduced production of ammonia results from the decrease in the
degradation of feed proteins (Hervas et al., 2000; Alexander et al., 2008). Some studies suggest that the
effects of essential oil compounds on the ruminal production of ammonia are presumably the
consequences of a reduction in the population of protozoa (Newbold et al., 1997). This is due to the
understanding that protozoa are mainly responsible for the degradation of feed protein in the rumen
(Jouany, 1996). It has been suggested that added EOs or their individual active components inhibit the
break-down of protein to NH3-N through two mechanisms. These mechanisms are the direct inhibition of
hyper ammonia-producing bacteria (HAP) and their deaminase activities, and a reduction in the
degradation of protein to peptides (Mclntosh et al., 2003; Newbold et al., 2004). The reduced production
of peptides from the decreased protein degradation suggest reduced peptidolytic activity and explains why
some plant extracts like clove bud decrease the concentration of large peptides with no effect on ammonia
production (Busquet et al., 2005). The HAP bacteria consist only about 1% of the rumen however; they
have high potential for deamination (Wallace et al., 2004). This suggests that inhibition of the activity of
HAP bacteria would impair deamination. There was 9% reduction in the rate of amino acid deamination
when casein hydrolysate was incubated (in vitro 48 h) with rumen fluid from cows that were offered a
silage-based diet with 1 g/day of an added blend of commercial EOCs (Crina ruminants; Akzo Surface
Chemistry Ltd., Herfordshire, UK) (Mclntosh et al., 2003). The supplemented commercial mixture
contained 100-300 g/kg of phenolic compounds such as thymol, eugenol, resorcinol, guaiacol and cresol.
Decreased NH₃-N concentrations were reported by Cardozo et al. (2005) when oregano (30 and 300
mg/L) and cinnamon oil (0.3 to 300 mg/L) were used. Similarly, cinnamaldehyde (3000 mg/L) reduced
the concentration of NH₃-N in the rumen (Busquet et al., 2006). Bacterial deaminative activity was
reduced (25%) when casein hydrolysate and ruminal fluid from sheep offered diets supplemented with
110 mg of mixture of essential oil compounds were incubated together for 24 h in vitro (Newbold et al.,
2004). It was observed that there was 9% (Mclntosh et al., 2003) and 24% (Newbold et al., 2004)
reduction in deamination activities with no effects on the proteolytic and peptidolytic activities.
Despite the above reports on the potential of EOs and EOCs to cause reduction of ruminal ammonia
concentrations, several in vitro short term studies with different EOCs report no effect on the
66
concentrations of NH₃-N in culture (Castillejos et al., 2007; Spanghero et al., 2008). The use of carvone
and carvacrol (300 mg/L) and anethol (3000 mg/L) in in vitro studies had no effects on the concentrations
of NH₃-N (Busquet et al., 2006). Busquet et al. (2006) observed that biologically active components of
essential oils such as carvacrol, cinnamaldehyde, anethol, eugenol, benzyl salicylate and the whole
essential oil themselves (capsicum oil, bud oil, tea tree oil, ginger oil, anise oil, oregano oil) at 3 mg/l
showed lack of effect on the concentration of NH₃-N and considerable reduction in NH₃-N concentration
at 3000 mg/l. Generally, time, dose and the chemical structure of essential oil have been known as the
basic factors determining the effect of the supplemented compound on the concentration of NH₃-N.
Variable effects on the ruminal concentration of ammonia N have been observed due to variation in the
chemical configuration of essential oil active compound. The potential of the chemical structure of EOCs
as a contributing factor to determining their effect on ammonia production has been shown (Castillejos et
al., 2006; Benchaar et al., 2008). It was observed in those studies that limonene (500 mg), guaiacol (5, 50,
500, 5000 mg/L) and, another phenolic compound eugenol (5, 50 and 500 mg/L) substantially reduced the
concentration of NH₃-N in culture. However, the concentration of NH₃-N in culture was not affected by
inclusion of vanillic aldehyde (5, 50 and 500 mg/L).
A number of in vivo studies where the inclusion of EOs or EOCs did not affect the concentration of NH₃-
N have also been reported. Castillejos et al. (2005) reported that adding 1.5 mg/l of a mixture of essential
oil compounds for 8 days with the pH kept constant did not affect the concentration of NH₃-N. These
authors also reported that the degradation of crude protein, concentration of bacteria, dietary nitrogen
flow and synthesis of microbial protein were not affected. The lower concentration of the mixture of
EOCs (1.5 mg/l) used in that study was suggested as the reason for lack of effect on the metabolism of
nitrogen. Nevertheless, when the experiment was repeated for 9 days with the same blend of EOCs at
higher doses (5, 50, and 500 mg/l), the effect of the blended mixture of EOCs on nitrogen metabolism
(small peptides and amino acid, concentration of NH₃-N and large peptides) was still not observed
(Castillejos et al., 2007). Mclntosh et al. (2003) suggested that the above 35 mg/l is the required
concentration of mixture of EOCs in rumen fluid to enhance effective transformation of ruminal protein.
There was no change in nitrogen digestibility, retention and NH₃-N concentration when 2 g or 0.75 g of a
67
mixture of essential oil was supplemented per day in a diet for lactating dairy cows (Benchaar et al.,
2006b; 2007). This lack of effect on the concentration of NH₃-N in in vivo studies due to supplementation
of EOCs may suggest a number of possibilities: rapid ruminal metabolism of the active components of
essential oil to a less active form, microbial adaptation to EO or shift in the population of individual
microbial species (Patra, 2011). The benefits of using EOs or EOcs to modulate protein metabolism
include among others, selective inhibition of amino acid degradation due to a selective inhibition of hyper
ammonia producing bacteria (HAPB) (Hart et al., 2008; Patra and Saxena, 2009a).
1.7.7. Effects of EOs and EOCs on rumen methanogenesis
Methane is considered to be a potent greenhouse gas. Therefore reducing CH4 emissions from domestic
ruminants is receiving worldwide attention because its release into the atmosphere is directly linked with
ruminant production (Benchaar et al., 2008). Ruminants have the capability (abundant fibre degrading
microbes in the rumen, caecum and colon, which help in anaerobic oxidation of feed) to convert non-
utilizable feed sources such as lignocellulosic agro-industrial by-products to utilizable form (Kamra et al.,
2012). During the fermentation of ingested feed, a huge number of microbial populations such as
bacteria, protozoa and fungi are involved. These microorganisms act on the food in the rumen to produce
VFA, predominantly, acetate, propionate and butyrate, and a number of gases such as CO2 and H2 as the
end-products of their combined activities (Buddle et al., 2011). The VFAs which are absorbed across the
rumen wall are used by the animal as the primary source of energy (Kamra et al., 2012). Hydrogen (H2)
which results from the fermentation of the feed is used by methanogens as their important source of
energy to reduce CO2 to CH4 (Hungate, 1967), and may be used by biohydrogenating bacteria to
hydrogenate FAs (Chesworth et al., 1998). Although formate and methanol are also produced and used by
methane producing bacteria, they are not considered as the main sources of energy (Buddle et al., 2011).
Shown in Figure 1.12 are some of the major sources of methane (H2 and CO2, formate, methanol and
acetate) synthesis in the rumen. Of these, methane generation from acetate accounts for the highest
portion of gas production (Chesworth et al., 1998).
The basis for the formation of methane in the rumen is that accumulation of high concentration of H2
potentially reduces microbial activities and lowers the rate of fermentation, resulting in slow conversion of
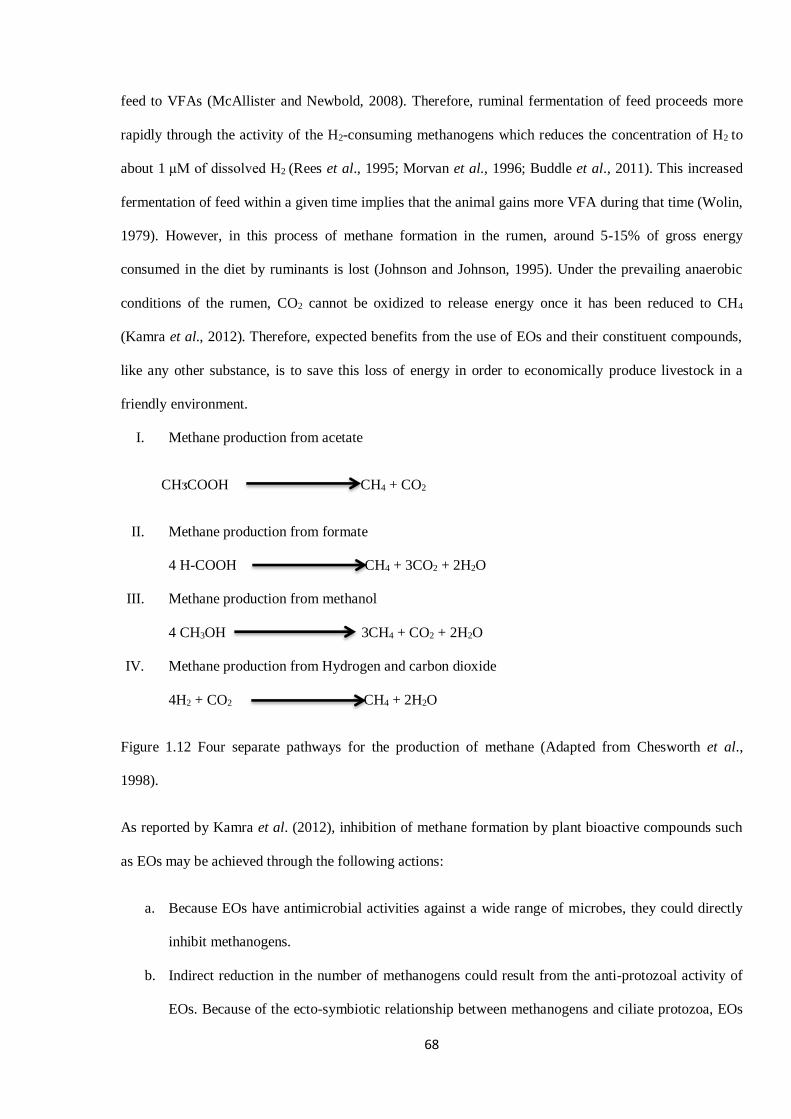
68
feed to VFAs (McAllister and Newbold, 2008). Therefore, ruminal fermentation of feed proceeds more
rapidly through the activity of the H2-consuming methanogens which reduces the concentration of H2 to
about 1 μM of dissolved H2 (Rees et al., 1995; Morvan et al., 1996; Buddle et al., 2011). This increased
fermentation of feed within a given time implies that the animal gains more VFA during that time (Wolin,
1979). However, in this process of methane formation in the rumen, around 5-15% of gross energy
consumed in the diet by ruminants is lost (Johnson and Johnson, 1995). Under the prevailing anaerobic
conditions of the rumen, CO2 cannot be oxidized to release energy once it has been reduced to CH4
(Kamra et al., 2012). Therefore, expected benefits from the use of EOs and their constituent compounds,
like any other substance, is to save this loss of energy in order to economically produce livestock in a
friendly environment.
I. Methane production from acetate
CHᴣCOOH CH4 + CO2
II. Methane production from formate
4 H-COOH CH4 + 3CO2 + 2H2O
III. Methane production from methanol
4 CH3OH 3CH4 + CO2 + 2H2O
IV. Methane production from Hydrogen and carbon dioxide
4H2 + CO2 CH4 + 2H2O
Figure 1.12 Four separate pathways for the production of methane (Adapted from Chesworth et al.,
1998).
As reported by Kamra et al. (2012), inhibition of methane formation by plant bioactive compounds such
as EOs may be achieved through the following actions:
a. Because EOs have antimicrobial activities against a wide range of microbes, they could directly
inhibit methanogens.
b. Indirect reduction in the number of methanogens could result from the anti-protozoal activity of
EOs. Because of the ecto-symbiotic relationship between methanogens and ciliate protozoa, EOs
69
might cause the death of ciliate protozoa causing the former to lose its symbiotic relationship and
hydrogen supply, leading to decreased production of methane.
c. Since EOs exhibit antimicrobial actions, this might decrease microbial numbers (bacteria and
fungi) which results in reduction in the digestibility of feed. Because methane production and
feed degradation are directly related to each other, the lower digestibility of feed would directly
reduce methanogenic activities.
It was first reported that EO may reduce methane production in rumen cultures when the effect of pinene
and limonene on methanogenesis was examined (Crane et al., 1957). In that study the inhibitory effect of
limonene on methane synthesis was more than that of pinene, suggesting that all terpenes do not have the
same toxic effect. After this report, it seems no other information was published on the effect of EO or its
compounds until the early 2000s.
The main active compound of Oreganium and Thymus plants, thymol at 0.4 g/L strongly inhibited in vitro
methane production (Evans and Martin, 2000). Similarly, 6 mM concentration of Thymus vulgare and its
principal compounds, thymol, had 99% reduction of methane (Macheboeuf et al., 2008). In another
report, Eugenol which possesses strong antibacterial effect against both Gram-positive and Gram-
negative bacteria was observed to have the potential of influencing rumen fermentation with beneficial
effects (Calsamiglia et al., 2007). Anethole (86-88%) has been reported as one of the main compounds in
mature fennel seeds (Telci et al., 2009). In an in vitro study, anethole (20 mg/L) reduced methane
production (Chaves et al., 2008). Although Wang et al. (2009) reported that methane production in sheep
was inhibited by inclusion of a mixture of EO (0.25 g/day) from oregano plants for 15 days; McGinn
(2006) observed no effect of adding 1 g/day of EO to beef cattle diet on methanogenesis when the
supplement was used for 21 days. This difference in effect could be due to different dose, time or duration
of experiment and type of EO or animal.
About 58% of methane inhibition was reported when eucalyptus oil was used at 1.66 ml/L (Kumar et al.,
2009), 90.3% at higher (2 ml/L) dose (Sallam et al., 2009) and at 0.33 g, α-cyclodextrin-eucalyptus oil
complex induced 70% inhibition of methane (Tatsuoka et al., 2008). P-Cymene, one of the components of
70
eucalyptus oil (Bhatti et al., 2007), at the concentration of 20 mg/L decreased methane synthesis by 29%
(Chaves et al., 2008). However, there was no effect of α-cyclodextrin cineole (up to 0.33 g/L) on
methanogensis (Tatsuoka et al., 2008). There was strong inhibition of methane synthesis when oil of
peppermint (Tatsuoka et al., 2008), and juniper berry and cinnamon oils (Chaves et al., 2008) were used.
Macheboeuf et al. (2008) reported 94% reduction of methanogenesis with 5 mM concentration of
cinnamaldehyde, the main component of cinnamon oil. In a batch culture study, Busquet et al. (2005)
observed 69 and 74% reduction in CH4 production when 300 mg/L each of diallyl disulphide and garlic
oil respectively, were used. It was suggested in that study that direct inhibition of rumen methanogenic
archaea was the mode of action through which the compounds reduced methane production. Furthermore,
other studies observed that there was 19% reduction in CH4 production in steers without effect on feed
digestibility or protozoal numbers with 20 g/kg DM intake of encapsulated horseradish oil (Mohammed et
al., 2004). In general, effects of essential oils and their constituent compounds on methanogenesis depend
on the dose and the type of substance, with the phenolic compounds or EOs containing them, showing
greater antimicrobial potential. In addition, it seems that there is a potential to select EO or EOC to
selectively inhibit CH4 production if the dose is optimized.
1.7.8. Effects of EOs and EOCs on biohydrogenation of PUFA
The n-3 PUFA such as EPA and DHA have been reported as important regulators of chronic diseases
such as coronary heart disease. As discussed previously, α- linolenic acid (LNA) and linoleic acid (LA),
the two metabolic precursors of the long chain n-3 fatty acids (20:5n-3 and 22:6n-3), are naturally, the
predominant fatty acids in ruminant feedstuff (Morrison, 1977). In the rumen, microbes convert these
UFA to different intermediates through the process known as biohydrogenation (BH). Therefore,
manipulation of biohydrogenation (BH) is receiving significant attention within the scientific community.
During BH, PUFA are converted to saturated fatty acid (SFA) through the following sequence of
reactions: hydrolysis, isomerization and reduction before hydrogenation of the free UFA to SFA.
Increasing the amounts of the n-3 in ruminant food products has been difficult due to the problem of
ruminal biohydrogenation of dietary PUFA. Biohydrogenation is carried out by a group of bacteria
recognized as cellulolytic bacteria (Kepler and Tove, 1967), particularly, the Butyrivibrio group which are
71
the most active group (Durmic et al., 2008). Although Clostridium proteoclasticum as it was formerly
called (Kemp et al., 1975; Maia et al., 2007), before it is re-classified as Butyrivibrio proteoclasticus
(Moon et al., 2008), is the only known bacteria capable of converting VA to 18:0, all bacteria in the
Butyrivibrio group are capable of producing CLA from linoleic acid. Identification of substances with
potential to selectively inhibit the activity of Butyrivibrio proteoclasticus, the undesirable
microorganisms, would increase both PUFA and BH intermediates (CLA and VA) in ruminant food
products (meat and milk).
As mentioned previously, essential oils and EOCs have a wide range of antimicrobial effects against both
Gram-positive and Gram-negative bacteria, and ruminal biohydrogenation involves several groups of
Gram-positive bacteria (Harfoot and Hazlewood, 1988). Therefore, EOs may potentially modify the
process of biohydrogenation through selective inhibition of biohydrogenating bacteria.
There is a scarcity of information on the effects of EOs and EOCs on ruminal biohydrogenation of
unsaturated fatty acids. Available data do not show clear effects of EOs and EOCs on biohydrogenation
due to the complex chemical composition of EOs. In addition, in vitro and in vivo data appear not to agree
in terms of effects on ruminal biohydrogenation of PUFA.
There was a substantial (58%) inhibition of ruminal biohydrogenation when cinnamaldehyde (500 mg/L)
was used in a dual-flow continuous culture fermenter system (Lourenco et al., 2008). However, there was
minor (6%) inhibition of biohydrogenation when 250 mg/L of eugenol was supplemented. In the same
study, the inclusion of 500 mg/L of cinnamaldehyde caused higher accumulation of biohydrogenation
intermediates such as trans-11, cis-15 C18:2 and trans-10 C18:1, trans-10, cis-12 C18:2 compared with
untreated cultures, suggesting that biohydrogenation of linolenic (C18:3) and linoleic (C18:2) acids was
affected. However, it is not clear whether the concentrations of the compounds (500 or 250 mg/L) or the
type of EOCs (eugenol or cinnamaldehyde) was responsible for this effect. The inclusion of citronella oil
(125, 250 and 500 mg/L), Siberian fir needle oil (500 mg/L), rosemary oil (250 and 500 mg/L) and sage
oil (500 mg/L) significantly reduced the concentration of stearic acid, the end product of
biohydrogenation of C18:2 n-6 and C18:3 n-3, in a batch culture in vitro study (Gunal et al., 2013). In
the same study, at the doses mentioned, the concentration of C18:2 n-6 was not affected suggesting that
72
accumulation of C18:0 could be due to inhibition of the last step of biohydrogenation (conversion of
C18:1 to C18:0) or that other biohydrogenation intermediates were produced in that study. In another
study (Durmic et al., 2008), the selective inhibitory potential of selected EO and plant extracts from
Australian plants was shown against Butyrivibrio fibrisolvens and Butyrivibrio Proteoclasticus, the two
most recognized groups of bacteria responsible for ruminal biohydrogenation of UFA.
However, the above dramatic inhibition of biohydrogenation reported by Lourenco et al. (2008) was not
confirmed in a number of in vivo studies. The fatty acid composition of milk was not affected by the
addition of a monoterpene blend (0.43 g/kg diet) containing α-pinene, β-pinene, p-cymene and linalool to
the diet (Malecky et al., 2009). Similarly, cinnamaldehyde (1 g/kg) added to the diet of dairy cattle also
did not affect the profile of milk fatty acids (Benchaar and Chouinard, 2009).
The fatty acid profile of milk obtained from dairy cows offered 0.75 g/cow/day of a mixture of essential
oils and compounds (Crina ruminants; CRINA S.A., Gland, Switzerland) was not affected (Benchaar et
al., 2007a). The Crina ruminants’ mixture contains eugenol, thymol, limonene, guaiacol and vanillin
(McIntosh et al., 2003; Castillejos et al., 2005). It is possible that there was microbial adaptation or shift
in microbial populations due to essential oil mixture as the animals were exposed to the experimental
treatment for a period of one month (28 days). Nevertheless, the concentration of CLA (cis-9, trans-11
18:2) in milk fatty acids was increased when the same mixture of essential oil compounds was added at
higher concentration (2 g/cow/day) (Benchaar et al., 2006a). Chaves et al. (2008) reported that
supplementing garlic, juniper berry and cinnamaldehyde at 200 mg/kg of dry matter to growing lambs did
not modify the fatty acid profile of back and liver fat. In a different study, monoterpenes blend consisting
of β-pinene, linalool, α-pinene, p-cymene offered at 0.43 g/kg of dry matter intake did not change the
fatty acid profile of milk (Malecky et al., 2009). Supplementing the diet of dairy cows with 1 g/day of
cinnalmaldehyde did not affect the fatty acid composition of milk (Benchaar et al., 2007b). Benchaar et
al. (2006; 2007) observed that supplementing the diet of dairy cows with EO did not alter the FA profile
of milk, but the extent of ruminal biohydrogenation was reduced and cis-9 trans-11 CLA concentration
was increased by EO rich in monoterpenes such as carvone and limonene (Lourenco et al., 2009). This
suggests that these compounds have some effects on biohydrogenating bacteria. This suggests that the
73
effect of EOCs and whole EOs on the modification of ruminal biohydrogenation of PUFA depends on the
type, time or duration of experiment and concentration of essential oil compounds.
As observed by Vasta and Bessa (2012), the lack of agreement between in vitro and in vivo results on the
profile of fatty acids suggests that it is discouraging to use these compounds to modulate ruminal
biohydrogenation. However, the great diversity in the composition of these compounds and the huge
number of commercially available EOs suggests that more results are required to reach conclusion and
conclusions should be drawn with caution.
In addition to altering the fatty acid composition of ruminant food products, there are other potential
nutritional and organoleptic benefits associated with using EOs in ruminant feeding. Supplementation of
ruminant diets with essential oil compounds could allow the compounds or their derived products to be
present in meat or milk. The presence of essential oil compounds or their metabolic products could
enhance the value of ruminant products by enriching them with nutritional and organoleptic properties
(Chion et al., 2010). Carvone and limonene (the main components of caraway essential oil) were
reported to be present in the milk when camomile and caraway seeds were fed to goats (Molnar et al.,
1997). Similarly, a number of reports have shown that different monoterpenes such as sabinene, 3-
carene, α-pinene, limonene, β-mircene, camphene and β-pinene were detected in the milk of cows grazing
pasture predominated by Alpine (Noni and Battelli, 2008; Chion et al., 2010).
1.7.9. Effects of essential oil compounds on rumen microbes
As mentioned earlier, essential oil compounds can cause inhibition of amino acid deamination by
inhibiting the growth of hyper ammonia-producing bacteria which are bacteria involved in the production
of NH₃-N (Mclntosh et al., 2003; Newbold et al., 2004; Wallace, 2004; Patra and Saxena, 2009).
Mclntosh et al. (2003) reported that while some hyper ammonia-producing bacteria such as Clostridium
aminophilus were less sensitive to the effect of EOCs, others, such as Peptostreptococcus anaerobius and
Clostridium sticklandii were highly sensitive. Although the population of HAP was not affected when
high protein diet was offered to sheep, about 77% of the number of hyper ammonia-producing bacteria
was decreased when sheep were offered a low protein diet supplemented with 100 mg/day of EOC

74
(Wallace, 2004). This could suggest that effect of essential oil compounds on HAP may also be diet
dependent. At 90 mg/L, the growth of Selenomonas ruminantium was selectively inhibited without
affecting the activity of Selenomonas bovis (Evans and Martin, 2000). However, including 400 mg/L
caused complete microbial inhibition. This suggests a selective inhibition of HAP bacteria by essential
oil compounds at low doses, and a complete microbial inhibition at higher doses. The peptidolytic activity
of ruminal bacteria can also be reduced by essential oil compounds (Busquet et al., 2005).
Antiprotozoal activity has also been exhibited by some essential oil compounds (Hristov et al., 2003). But
there are contrasting reports of these activities. Some studies have reported that essential oil compounds
have no effect on the population of protozoa (Mclntosh et al., 2003; Newbold et al., 2004; Benchaar et
al., 2007a; b). Ruminal protozoal numbers were not affected when a blend of essential oil compound 750
mg/day (Benchaar et al., 2007a) and 110 mg/day (Newbold et al., 2004) were fed to dairy cows and sheep
respectively. In another study, Patra et al. (2010) found lack of effect of fennel extract on the population
of protozoa. Similarly, Patra et al. (2010) observed that the concentrations of large entodiniomoph in the
presence of clove extract were not affected. By contrast, a stimulatory effect on the population of
protozoa was observed with EO (Patra and Saxena, 2009). The mode of action by which some studies
reported stimulatory effect of EOCs on rumen protozoa is not clear. Other studies (Ando et al., 2003;
Cardozo et al., 2006; Fandino et al., 2008) have observed reduction in the concentrations of holotrich,
entodiniomorph and total protozoa number due to the antiprotozoal effect of essential oil compounds.
Yang et al. (2010b) observed that feeding lower concentrations of cinnamaldehyde (0.4-1.6 g/day) has no
effect on protozoa, whereas, when 2 g/day of anise containing 100 g/kg of anethol was offered, the
numbers of entodiniomorph and holotrich reduced (Cardozo et al., 2006). The mechanism of action
through which the reported reduction of protozoal population is achieved may be due to the lipophilic
nature of EOCs enabling them to penetrate protozoal membrane; however, the actual means of inhibition
is not clearly known (Cardozo et al., 2006). Generally, there is no conspicuous effect of essential oil
compounds on protozoa. There is limited evidence on the effects of essential oil compounds on fungi
(Bodas et al., 2012). The general effect of EOCs on fungi has been suggested to be the inhibition of their
growth (Mclntosh et al., 2003).
75
1.7.10. Microbial adaptation to EOs and compounds
Several factors have been suggested to be responsible for the variation in bacteria’s sensitivity to the
effects of essential oil compounds, and by extension, the period of time during which the antimicrobial
property of EO can be exhibited. Gram-negative bacteria are less sensitive than Gram-positive bacteria
which have high susceptibility to the effect of EOCs (Cox et al., 2001). It has been indicated that
molecules such as phenolic compounds with hydroxyl and carbonyl groups on their structures are more
toxic to bacteria (Griffin et al., 1999), suggesting that the chemical composition of the essential oil
compound is another factor that determine the sensitivity of bacteria to them. In addition, as mentioned
previously, the concentration of the compound is also a determining factor of the influence of essential oil
and their compounds on bacteria. Broudiscou et al. (2007) reported that rumen microorganisms in goat
degraded β-ocimene, sabinene, α-copaene, α-pinene, myrcene. The same study reported that thymol and
camphene were not degraded by the same microbes. This suggests that ruminal microbes can degrade
some monoterpenes and some sesquiterpenes to their less active form. Ruminal microbes have the
potential to adapt to the effect of essential oil and their compounds over-time (Busquet et al., 2005),
suggesting that the actual effect of EOCs may not be shown on results obtained from short-term exposure
of ruminal microbial population to EO compounds. Chaves et al. (2008) reported that supplementing
garlic, juniper berry and cinnamaldehyde at 200 mg/kg of dry matter to growing lambs did not modify the
fatty acid profile of back and liver fat. Furthermore, monoterpenes blend consisting of β-pinene, linalool,
α-pinene, p-cymene at 0.43 g/kg of dry matter intake did not change the fatty acid profile of milk
(Malecky et al., 2009). In a separate study, supplementing the diet of dairy cows with 1 g/day of
cinnalmaldehyde did not affect the fatty acid composition of milk (Benchaar et al., 2007b). These results
are compelling evidence that more studies are require to ascertain the potential of EOs and EOCs as
potential feed additives in animal nutrition. The unchanged fatty acid profile of animal tissues following
the inclusion of essential oil compounds suggest that ruminal microbes can both alter the chemical
structure and adapt to some essential oil compounds (Malecky and Broudiscou, 2009).
Specific blend of EO containing limonene, guaiacol and thymol as major constituents was reported to
alter ruminal metabolism of nitrogen by inhibiting deamination (Mclntosh et al., 2003; Newbold et al.,
76
2004). Contradictory result was reported by Castillejos et al. (2005) where the addition of a blend of EO
to two different diets (high concentrate with high forage) for a period of eight days in a continuous culture
fermentation system did not modify the metabolism of nitrogen but increased the concentration of total
VFA. Few changes were made to this last experiment relative to the original study. The dose of the blend
of EOCs in the latter experiment was 5 times less and the adaptation time was equally 4 times less than
the time in the previous studies (Mclntosh et al., 2003; Newbold et al., 2004). About twenty eight days of
ruminal microbial adaptation was suggested by some of these studies as the minimum period of time
required to establish the actual effects of blend of EOs (Mclntosh et al., 2003; Newbold et al., 2004).
Therefore, it becomes clear that the short adaptation time (eight days) and the low dose (1.5 mg/l) in the
study by Castillejos et al. (2005) were the main factors why there was no change in ruminal nitrogen
metabolism. Castillejos et al. (2007) observed that addition of a blend of EO at 5 mg/l appears to be the
tolerant level for normal ruminal function. An adaptation time of more than 6 days was suggested as
minimum amount of time required for the blends of EOs to modify ruminal metabolism of nitrogen.
Addition of 400 mg/l of thymol by Evans and Martin (2000) decreased the total VFA, however, increased
the acetate to propionate ratio, and indicates that the dose was too toxic to ruminal microbes.
Different mechanisms through which bacteria become insensitive to the effect of supplemented essential
oil compounds have been suggested. Spanghero et al. (2008) suggested that shift in microbial population
is one of the actions that reduce the sensitivity of ruminal microbial population to essential oil compound.
The extent of this microbial shift depends on both the concentration and the period of exposure of these
compounds to ruminal microbes (Bodas et al., 2012). Chizzola et al. (2004) suggested that ruminal
microbes adapt to essential oil compounds through degrading the active components of these compounds
to their less active form. Other authors have proposed that evolution of mechanisms to tolerate the effect
of essential oil compounds by ruminal microbes is another mode of action for microbial adaptation to EO
(Jouany and Morgavi, 2007).
1.7.11. Legal and safety issues with the use of EOs and EOCs in food
The application of a number of EOs and EOCs as flavourings in foods has been approved and registered
by the European commission. The registered components are thought to present zero risk to human health
77
(Burt, 2004). Some of these flavourings are cinnamaldehyde, limonene, carvacrol, eugenol, menthol,
carvone, thymol, citral and ρ-Cymene. About 15 years ago, methyl eugenol and estragole were removed
from the list of flavourings approved by the European commission because they were reported to be
genotoxic (Commission Decision of 23 January, 2002). New components of EO can only be evaluated for
registration and inclusion into the list of flavouring agents after metabolic and toxicological studies have
been conducted (Commission Decision of 23 February, 1999; Commission Regulation (EC) No.
1565/2000; Commission Regulation (EC) No.622/2002; Regulation (EC) No.2232/96).
The flavouring agents in the list of European Commission is also part of the list of everything added to
Food in the US (EAFUS), which means, the Food and Drug Administration of the United States of
America has equally recognized those substances as generally recognized as safe (GRAS) food additives
in the US (Burt, 2004).
In other countries of the world, these substances may be recognized as new food additives if their
inclusion in food is for any purpose other than for the purpose of adding flavour to the food. As would be
expected in those countries, addition to the list of food additives would only be approved after several
expensive studies of their potential metabolic and safety issues, and may equally involve prohibitive cost.
For those countries, it would be better to consider the use of whole EO or herb or whole spice instead of
individual components for economic reasons (Smid and Gorris, 1999).
The Federal Food Drug and Cosmetic Act (FFDCA) recognizes that naturally occurring substances in
food should have a different and lower safety standard relative to other ingredients which are intentionally
added to food (Smith et al., 2005). According to the Act (21 CFR 172.30), the realistic standard for
naturally occurring substances is that the substances must ‘not ordinarily render the food injurious to
health’. However, for added substances, the Act applies a much higher standard which says ‘the food is
adulterated if the added substance may render the food injurious to health.
As EOs are considered neither a food nor a direct food additive, no current standard can be easily applied
to their safety evaluation (Smith et al., 2005). In the Act standards, EOs occupy an intermediate position
78
as they are comprised of naturally occurring substances which are intentionally added as individual
chemical substances to food (Smith et al., 2005).
Essential oils are considered to be safe based on the documented long history of their application in foods
and other wide range of human exposures with no known adverse effects (NAS, 1965; 1970; 1975; 1981;
1982; 1987; 21 CFR 172.510). Because of these documented safety history, one may presume with a high
degree of confidence that EOs derived from food are likely to be safe (Smith et al., 2005).
In terms of actual application in foods, different concentrations (from 0.05% to more than 1% v/w) of
whole EOs or their constituent compounds have been reported to present no issues for concern. For
instance, treating beef fillets with 0.8% v/w of oregano oil was found to improve the acceptability of the
flavour after storage (50C) and cooking (Tsigarida et al., 2000). Skandamis and Nychas (2001) reported
that treating minced beef with 1% v/w of oregano oil enhanced the odour, flavour and colour during
storage under modified atmosphere packing and vacuum (50C). These authors reported that oregano was
almost not detected after cooking. Oragno and thyme oils (0.05%, v/v) have been found to impart an
herbal odour when spread on Asian sea bass (Harpaz et al., 2003). There were no ill effects on either
appearance or flavour of cooked shrimps when thyme oil (0.9%, v/w) was added to a coating compared to
considerable reduction in the acceptability of the shrimps when the concentration was increased to 1.8%
in the coating (Ouattara et al., 2001). Carvacrol and cinnamic acid (1 mM) have been reported to delay
spoilage and also maintain the organleptic properties of honeydew melon and kiwifruit (Roller and
seedhar, 2002).
Although a great number of EOCs are considered as approved food flavourings in the EU and recognized
as GRAS in the US, toxicity and irritation have been reported in some studies (Burt, 2004). For example,
in root canal treatment, irritation of mouth tissues has been reported following application of thymol,
menthol and eugenol. Manabe et al. (1987) observed that the cytotoxicity results of these EOCs indicate
that lipid solubility and membrane affinity could be part of the tissue penetration and that irritation of the
gum may be caused by surface activity and membrane lysis. Although carvone, cinnamaldehyde and
carvacrol appear not to have significant effect in in vivo studies, results of in vitro studies suggest that at
the cellular levels, they exhibit mild to moderate toxicity. At the current level of use, gene-toxicity data
79
seem not to raise issues for concern (Stammati et al., 1999). For people who use EOs and EOCs
frequently, allergic contact dermatitis has been observed. However, if these substances are to be used at a
very large scale, preventive measures are necessary to ensure that the health condition of workers is not
compromised (Carson and Riley, 2001; Bleasel et al., 2002). At the above current low levels of intake as
flavouring substances, EOs or their compounds have no known or are not expected to pose any significant
risk to human health (Smith et al., 2005).
80
1.8. Justification and approach taken in this PhD research
Ruminant derived meat and milk, and their products which constitute a major part of human diets, are
characterized by low concentration of long chain n-3 PUFA such as C20:5 n-3 and C22:6 n-3 and high
content of SFA. The intakes of these long-chain PUFA are considered to be linked with reduced risk of
coronary heart diseases, whilst SFA have been associated with increased risk of cardiovascular diseases.
Ruminal biohydrogenation of dietary PUFA results in the production of SFA at the expense of CLA, VA
and PUFA. The key to improving the fatty acid profile of milk and meat is dietary manipulation of
ruminal biohydrogenation. In order to achieve this dietary modification and optimize the concentration of
PUFA in ruminant food products, ruminant nutritionists have been evaluating the suitability of various
possible strategies to manipulate the process of biohydrogenation. This manipulation, if it is successfully
achieved, would lead to the production of ruminant meats and milk with a high level PUFA, CLA and a
lower content of SFA which is of great value for consumer health. Increasing the concentrations in meat
or milk, of PUFA such as C20:5n-3 and C22:6n-3, which have proven human health benefits, would
represent an excellent means of increasing their intake by humans. In order to avoid the use of chemicals
such as formaldehyde to protect PUFA due to their potential implications for animal product quality and
consumer health, and to provide alternative to other protection techniques which are largely inefficient,
livestock nutritionists have been evaluating the suitability of plant bioactive compounds such as EOs as
modifiers of rumen biohydrogenation of PUFA. The majority of studies with EOs have been focused on
their effects on VFA concentration, methane and ammonia production, whilst little attention has been
given to their effects on biohydrogenation of PUFA. This modification is carried out by a direct or
indirect interaction of these compounds and ruminal microorganisms involved in rumen fermentation. In
this PhD study, the potential of EOs and their active compounds (EOCs) as feed additives to reduce the
extent of rumen biohydrogenation of n-3 PUFA is evaluated. To achieve this objective, a number of
experiments were conducted as follows:
Experiment 1
In this study, the effects of fifteen EOCs on the metabolism of n-3 PUFA by rumen microorganisms were
evaluated in vitro.
81
This study found that some EOCs such as anethole, menthol, 4-allylanisole and p-cymene have the
potential to reduce the extent of ruminal biohydrogenation of PUFA. However, they also equally caused
significant reduction of total VFA. The whole essential oils have a number of attractions compared with
the individual EOCs. The whole EOs have been used by man since antiquity in the area of aromatherapy
and food industries, hence, are likely to encounter less regulatory hassles compared to individual EOCs.
In addition, the synergistic effect between the minor and major components in the whole oils is expected
to improve the effectiveness of the whole oils against biohydrogenating bacteria over the individual
constituent compounds. These considerations led to the second experiment using the parent whole oils of
the ten most effective EOCs in experiment 1.
Experiment 2
In this experiment, the effects of ten whole essential oils on rumen fermentation and biohydrogenation of
n-3 polyunsaturated fatty acids by rumen microorganisms were examined in vitro. This study was
conducted to establish whether the parent oils in which some of the individual EOCs (in experiment 1)
showing potential are the predominant compounds, are equally as effective at inhibiting the
biohydrogenation of PUFA. This study found that some of the whole oils such as anise and cassia oils had
the highest potential to reduce the biohydrogenation of n-3 PUFA. But, they, like EOCs used in
experiment 1, equally caused significant reduction of total VFA in the rumen.
Because the concentration of volatile fatty acids in the rumen reflects the fermentation of nutrients in
feed, it was thought that the inclusion of either 300 mg/L of EOCs (experiment 1) or 300 mg/L of whole
EOs (experiment 2) reduced the digestibility of feed, hence, decreased ruminal concentration of total
VFA. Therefore, to achieve satisfactory inhibition of ruminal biohydrogenation of PUFA without
significant suppression of VFA, further in vitro study was conducted to establish optimal doses for the
two most effective EOCs (experiment 1) and EOs (experiment 2). This led to the next in vitro experiment,
the third experiment, which screened graded doses of both EOCs and whole EOs.
82
Experiment 3
This experiment examined the effects of graded doses (0, 100, 200 and 300 mg/L) of two EOCs (4-
allylanisole and anethole), and two whole EOs (anise oil and cassia oil) on the fermentation and
biohydrogenation of n-3 polyunsaturated fatty acids by rumen microorganisms in vitro. This study found
that at 200 mg/L or less, all substances except cassia oil did not reduce the concentration of total VFA
relative to the control treatment.
In the literature, there is disagreement between in vitro and in vivo effects of EOs or EOCs on metabolism
of n-3 PUFA. Continuous culture studies and long term in vivo studies suggest that the benefits associated
with the use of essential oil as feed additive may decline due to two possibilities: (1) adaptation of
individual microbial species to the use of EO or, (2) shifts in microbial species composition following
long-term use of essential oil (Gladine et al., 2007). Therefore, the last study (semi in vivo, experiment 4)
was conducted to examine the possibility of microbial adaptation time to anise oil, the most effective EO
at 200 mg/L.
Experiment 4
In this experiment, the potential of rumen microbes to adapt to anise oil over 4 weeks on rumen
fermentation and metabolism of n-3 PUFA was investigated. Six lambs were grouped into two and given
similar diet plus anise oil (100 mg/L equals 2.4 g/sheep/day) supplementation for one of the groups for a
period of one month. Then, the sheep were slaughtered and ruminal fluids from the two groups of sheep
were used in in vitro study. The study was a 2 2 factorial design experiment (details found in Chapter
6). The study observed that the PUFA content of feeds incubated in rumen fluid extracted from the group
of sheep fed anise oil was maintained at higher concentrations compared to the control sheep.

83
84
Chapter 2
2.0. General material and methods
In this chapter the general methods, materials and techniques which are similar in all the experiments are
discussed. Modifications of the procedures for specific experiments are discussed in the respective
chapters.
2.1. Animal management, feeding and collection of rumen fluid
In all the experiments similar breed of sheep (Hartline Texel cross) were used as rumen fluid donors.
The sheep were housed in groups of three or two per pen (depending on whether six or four sheep were
used) and straw bedding. Grass hay (Lolium perenne) supplied by Patterns Farm, Chelmsford, UK and
concentrate (Lamb finisher cubes) from W & H Marriage & Sons LTD, Chelmsford, Essex, were the
main feed ingredients. The rumen fluid donor sheep were offered water and hay ad libitum and
supplemented with additional 400 g/sheep/day of concentrate. The total amount (400 g) of lamb finisher
cubes offered per sheep/day was divided into two equal parts (200 g) and fed at 08.00 hours and 16.00
hours. The sheep were placed on the experimental feed for 14 days before slaughter.
Feed was withdrawn from the ewes at 18.00 hours on the eve of the day of slaughter. Sheep were taken to
the abattoir (Humphreys and Sons, Chelmsford-Essex) at 07.00 hours in the morning and were
slaughtered at 07.30 hours. Whole rumens were then collected and immediately sealed in tough plastic
bags to prevent oxygen entry and transported in insulated boxes to maintain rumen temperature to the
Lordship Science laboratory. The rumens were incised with a scalpel blade and rumen contents were
scooped and the liquor strained through 2 layers of cheesecloth. After straining, the remaining solids were
mixed with a volume of buffer (Table 2.1) equal to the rumen liquor removed, and homogenized using a
kitchen blender for about 45 seconds to detach rumen microbes attached to solids. The mixture was re-
strained with 2 layers of cheesecloth and the filtrate added to the rumen fluid to constitute the buffer
rumen fluid mixture as the final inoculum. The mixed fluid was held in a water bath maintained at 39⁰C
and was flushed with CO₂ to expel oxygen before being dispensed into the in vitro incubation flasks.
85
2.2. Anaerobic buffer
The anaerobic buffer used for all in vitro incubations was made by mixing five different solutions (Table
2.1) using the method described by Theodorou et al. (1994). The solutions that were mixed to obtain the
buffer are macro-mineral solution, buffer solution, micro-mineral solution, reducing solution and
anaerobic indicator (resazurin). The solutions were prepared separately then mixed together thoroughly in
a 50 litre capacity tank. In order to make a litre of buffer, the individual solutions were measured using a
measuring cylinder and mixed together in the proportions shown in Table 2.1. The buffer solution was
then sterilized using a Boxer autoclave (LAB3 Ltd, Northampton, UK). The autoclave was pre-set to
commence sterilization of buffer at 121⁰C for 80 minutes, and then cooled down to 80⁰C. The autoclaved
buffer was cooled under CO₂ in running cold water.
2.3. The basal diet for in vitro incubation
The basal feedstock used throughout the experiments was made from the mixture of a 70:30 rye- grass
(Lolium perenne, Patterns Farm, Chelmsford, UK) and lamb finisher concentrate (W & H Marriage &
Sons LTD, Chelmsford, Essex), respectively. The ingredients, chemical composition and fatty acid
content of the basal feedstock used in incubations are shown in Table 2.2. A 70: 30 mixture of the grass
hay and concentrate respectively was formulated and milled through 1 mm screen (Glen Creston Ltd,
Stammore, England). This diet was supplemented with 32.5 g oil/kg from a mixture on an oil basis, of
60% of fish oil (Sigma-Aldrich Co. Ltd., UK) and 40% of ground linseed (NBTY Europe LTD, Burton-
Upon-Trent), as extra sources of n-3 PUFA. Linseed was used as a major source of C18:3 n-3 and fish oil
was included as the main source of C20:5n -3 and C22:6n -3. In order to make 1 kg of the basal feedstock
used in incubations, 700 g of hay, 250 g of concentrate, 30 g of ground linseed and 20 g of fish oil were
mixed together as shown in Table 2.2. The composition of the concentrate used according to the supplier
(W & H Marriage & Sons LTD, Chelmsford, Essex) was a mixture of wheat (19.6%), wheatfeed (40.1%),
molasses (3%), palm kernel extract (12%), sunflower extract (5%), limestone flour (2%), salt (0.8%),
mixer oil (0.5%), millspec molasses (6%), spray oil (0.5%), ammonium chloride (0.3%) and malt nuts
(10%).
86
2.4. Incubation, sample collection and storage
Into 125 ml clear glass type 1 serum bottles (R & L Slaughter Ltd, Essex, UK), 1 g of feed substrate, 80
ml anaerobic buffer (Table 2.1), 20 ml inoculum and 300 or less mg/L of either EOs or EOCs (actual
amount depends on the objective of the experiment described in each chapter). The bottles were then
sealed with rubber cork and incubated at 39⁰C using Genlab incubator (Genlab Ltd, Cheshire, UK).
Gas pressure in the bottles during incubation was measured from all the replicates at various times (3, 6,
9, 12, 24, 36 and 48 h) using a pressure transducer (Bailey and Mackey Ltd., Birmingham, UK) which
was connected to a digital read-out voltmeter. The pressure was read on the transducer and then the gas
was released to return the head-space gas pressure to zero. The bottles were agitated by shaking before
returning to the incubator. Fermentation was stopped (at 12, 24 and 48 h) by freezing the contents of
incubation bottles at -20⁰C for 5 mins. After 5 mins serum bottles were brought to room temperature, then
3 replicates of each treatment were taken to determine ammonia (5 ml) and volatile fatty acids (VFA, 4
ml). The remaining fluid of these replicates was used for determining pH using a pH meter (Hanna
instrument Ltd., UK). The aliquots for ammonia were preserved by mixing 5 ml sample with 5 ml of 1M
HCL. Volatile fatty acid samples (4 ml) were mixed with 1 ml of a deproteinising solution (2.5.6) and
frozen (-20⁰C). The remaining 3 replicates of each treatment were mixed with 250 ul of BHT in ethanol
(2.5.7) then emptied into plastic tubs and frozen (-20⁰C) for subsequent fatty acid analysis.
The individual head-space pressure (psi) was converted to volume of gas (ml) using the following
equation:
V= [(4.899*p)-0.1817]
Where V is the volume of gas produced (ml) and p is the amount of head-space pressure (psi).
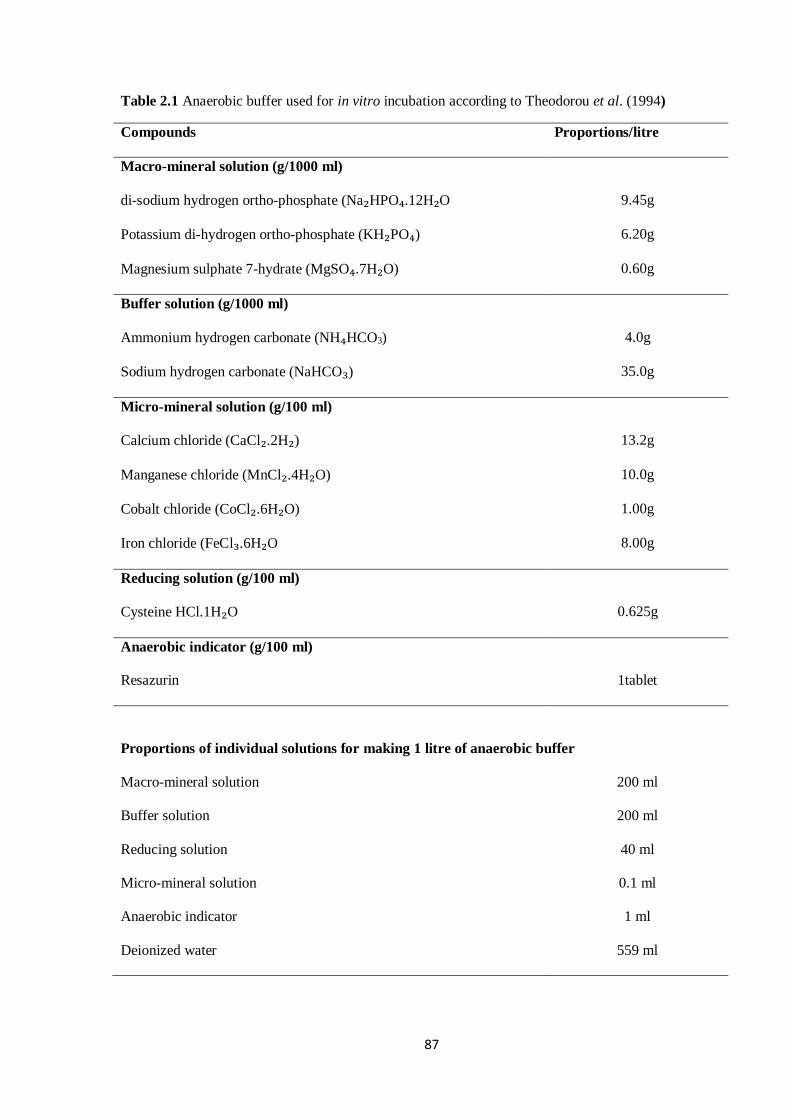
87
Table 2.1 Anaerobic buffer used for in vitro incubation according to Theodorou et al. (1994)
Compounds Proportions/litre
Macro-mineral solution (g/1000 ml)
di-sodium hydrogen ortho-phosphate (Na₂HPO₄.12H₂O 9.45g
Potassium di-hydrogen ortho-phosphate (KH₂PO₄) 6.20g
Magnesium sulphate 7-hydrate (MgSO₄.7H₂O) 0.60g
Buffer solution (g/1000 ml)
Ammonium hydrogen carbonate (NH₄HCO3) 4.0g
Sodium hydrogen carbonate (NaHCO₃) 35.0g
Micro-mineral solution (g/100 ml)
Calcium chloride (CaCl₂.2H₂) 13.2g
Manganese chloride (MnCl₂.4H₂O) 10.0g
Cobalt chloride (CoCl₂.6H₂O) 1.00g
Iron chloride (FeCl₃.6H₂O 8.00g
Reducing solution (g/100 ml)
Cysteine HCl.1H₂O 0.625g
Anaerobic indicator (g/100 ml)
Resazurin 1tablet
Proportions of individual solutions for making 1 litre of anaerobic buffer
Macro-mineral solution 200 ml
Buffer solution 200 ml
Reducing solution 40 ml
Micro-mineral solution 0.1 ml
Anaerobic indicator 1 ml
Deionized water 559 ml
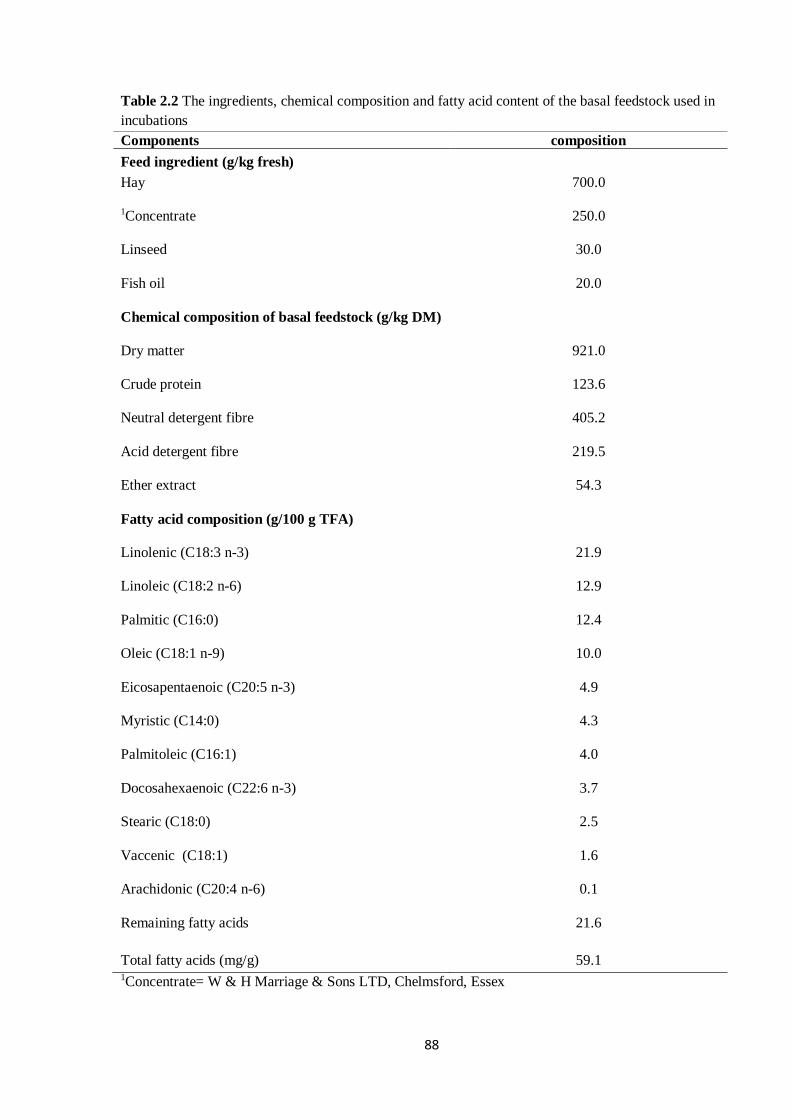
88
Table 2.2 The ingredients, chemical composition and fatty acid content of the basal feedstock used in
incubations
Components composition
Feed ingredient (g/kg fresh)
Hay 700.0
1Concentrate 250.0
Linseed 30.0
Fish oil 20.0
Chemical composition of basal feedstock (g/kg DM)
Dry matter 921.0
Crude protein 123.6
Neutral detergent fibre 405.2
Acid detergent fibre 219.5
Ether extract 54.3
Fatty acid composition (g/100 g TFA)
Linolenic (C18:3 n-3) 21.9
Linoleic (C18:2 n-6) 12.9
Palmitic (C16:0) 12.4
Oleic (C18:1 n-9) 10.0
Eicosapentaenoic (C20:5 n-3) 4.9
Myristic (C14:0) 4.3
Palmitoleic (C16:1) 4.0
Docosahexaenoic (C22:6 n-3) 3.7
Stearic (C18:0) 2.5
Vaccenic (C18:1) 1.6
Arachidonic (C20:4 n-6) 0.1
Remaining fatty acids 21.6
Total fatty acids (mg/g) 59.1 1Concentrate= W & H Marriage & Sons LTD, Chelmsford, Essex
89
2.5. ROUTINE CHEMICAL ANALYSIS
2.5.1. Dry matter
Sub-samples of ground (1 mm screen, Glen Creston Ltd, Stammore, England) mixed feed were weighed
into porcelain crucibles (Fisher Scientific, Leicestershire, UK) that were previously pre-heated in the oven
at 105°C and cooled. Samples were dried to a constant weight in the oven (105°C). After drying, samples
were taken out of the oven into a desiccator to avoid absorption of moisture and were allowed to cool
down. After cooling, the weight of the dried feed and the crucible was then taken together. The dry matter
content was determined as follows:
1
1000
(g)ght Wet wei
(g) Dry weight=>(g/kg)matter Dry
2.5.2. Ether Extract
The fat content of the feed was determined using the FOSS Soxtec Extraction system according to the
method described by AOAC 920.39 and AACC 30-25.
Approximately 2 g of the basal feedstock was weighed into the extraction thimble of known weight in
triplicate. A thin layer of fat-free cotton was placed on the top of the sample and the thimbles were
attached to the metal adapters before placing the thimbles and the adapter onto the thimble stand. A
previously cleaned and dried aluminium extraction cup was taken from the desiccator and weighed.
Using a measuring cylinder, exactly 45 ml of petroleum ether (40-600C, Sigma-Aldrich Co. Ltd., UK)
was added to the aluminium cup and the cup was placed in the cup holder. The thimbles were attached to
the magnetic holder in the Soxtec extractor and the extraction cups were inserted before running the
extraction programme. The control unit of the Soxtec extractor was preset as follows: boiling time (15
minutes), boiling temperature (900C), rinsing time (30 minutes) and 10 minutes for the recovery time. The
resulting fat residue was dried at 105°C to constant weight and the fat content was then determined
gravimetrically using the following formula:
90
1
1000
sample of weight
extract ofweight =>(g/kg)Fat
2.5.3. Feed total Nitrogen analysis
Total nitrogen of basal feedstock was determined using the Kjeldahl digestion procedure. Approximately
1 g of feed was weighed (in triplicate) into clean Kjeldahl tube (Fisher Scientific, Leicestershire, UK) and
digested at 400°C for 2 hours using 20 ml of concentrated H2SO4. After cooling to room temperature, the
residue was made alkaline through automatic addition of NaOH then the NH3-N was distilled into a
solution of boric acid (4%). This was then titrated with 0.1 M HCL. The sample weight and the volume of
hydrochloric acid required to neutralize the ammonia were then used to calculate the nitrogen content of
the feed as follows:
1 ml of 0.1 HCl = 0.0014 g of Nitrogen
1
1000
(g) weight sample
HCL of volume 0.0014=>(g/kg)Nitrogen
Crude protein was determined as follows: Nitrogen in feed × 6.25
2.5.4. Ammonia analysis
The concentration of NH3-N in digesta was determined using the method described by Weatherburn
(1967) adapted for use on the plate reader.
2.5.4.1. Reagents
A Standard solution (Ammonium chloride)
The standard solution was made by weighing 0.535 g of dried ammonium chloride and dissolving same in
100 ml distilled water to make 100 mM of ammonium chloride solution. From this solution (100 mM of
ammonium chloride), 10 ml was pipetted into a 1000 ml volumetric flask and made up to the mark with
distilled water. This solution was then stored in the fridge and used for making dilutions. Range of
standard dilutions in 1 ml eppendorf is shown in Table 2.3.
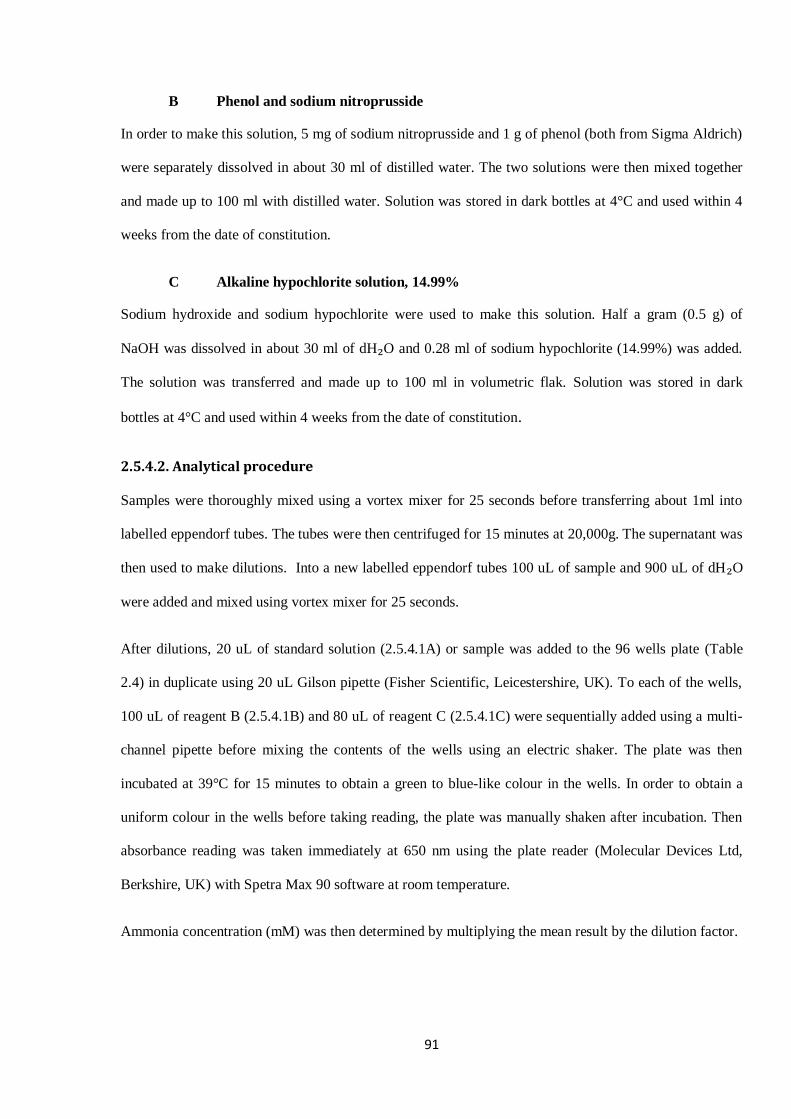
91
B Phenol and sodium nitroprusside
In order to make this solution, 5 mg of sodium nitroprusside and 1 g of phenol (both from Sigma Aldrich)
were separately dissolved in about 30 ml of distilled water. The two solutions were then mixed together
and made up to 100 ml with distilled water. Solution was stored in dark bottles at 4°C and used within 4
weeks from the date of constitution.
C Alkaline hypochlorite solution, 14.99%
Sodium hydroxide and sodium hypochlorite were used to make this solution. Half a gram (0.5 g) of
NaOH was dissolved in about 30 ml of dH₂O and 0.28 ml of sodium hypochlorite (14.99%) was added.
The solution was transferred and made up to 100 ml in volumetric flak. Solution was stored in dark
bottles at 4°C and used within 4 weeks from the date of constitution.
2.5.4.2. Analytical procedure
Samples were thoroughly mixed using a vortex mixer for 25 seconds before transferring about 1ml into
labelled eppendorf tubes. The tubes were then centrifuged for 15 minutes at 20,000g. The supernatant was
then used to make dilutions. Into a new labelled eppendorf tubes 100 uL of sample and 900 uL of dH₂O
were added and mixed using vortex mixer for 25 seconds.
After dilutions, 20 uL of standard solution (2.5.4.1A) or sample was added to the 96 wells plate (Table
2.4) in duplicate using 20 uL Gilson pipette (Fisher Scientific, Leicestershire, UK). To each of the wells,
100 uL of reagent B (2.5.4.1B) and 80 uL of reagent C (2.5.4.1C) were sequentially added using a multi-
channel pipette before mixing the contents of the wells using an electric shaker. The plate was then
incubated at 39°C for 15 minutes to obtain a green to blue-like colour in the wells. In order to obtain a
uniform colour in the wells before taking reading, the plate was manually shaken after incubation. Then
absorbance reading was taken immediately at 650 nm using the plate reader (Molecular Devices Ltd,
Berkshire, UK) with Spetra Max 90 software at room temperature.
Ammonia concentration (mM) was then determined by multiplying the mean result by the dilution factor.
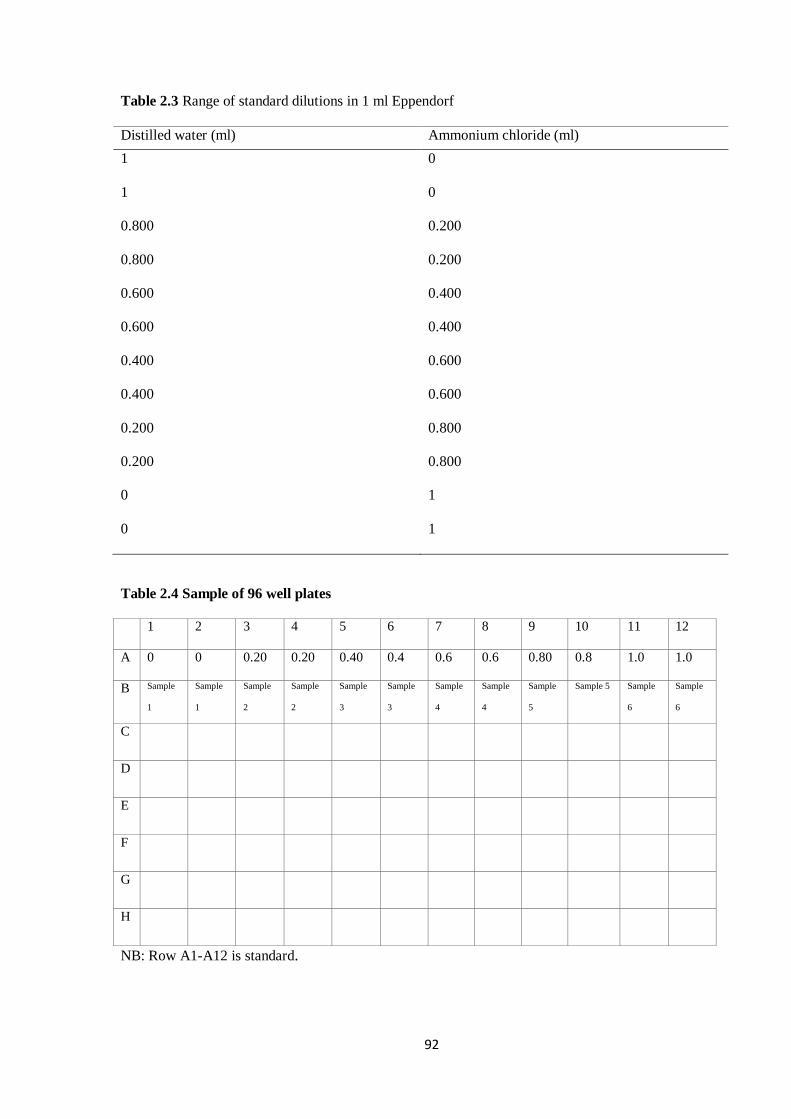
92
Table 2.3 Range of standard dilutions in 1 ml Eppendorf
Distilled water (ml) Ammonium chloride (ml)
1 0
1 0
0.800 0.200
0.800 0.200
0.600 0.400
0.600 0.400
0.400 0.600
0.400 0.600
0.200 0.800
0.200 0.800
0 1
0 1
Table 2.4 Sample of 96 well plates
1 2 3 4 5 6 7 8 9 10 11 12
A 0 0 0.20 0.20 0.40 0.4 0.6 0.6 0.80 0.8 1.0 1.0
B Sample
1
Sample
1
Sample
2
Sample
2
Sample
3
Sample
3
Sample
4
Sample
4
Sample
5
Sample 5 Sample
6
Sample
6
C
D
E
F
G
H
NB: Row A1-A12 is standard.
93
2.5.5. Neutral and acid detergent fiber (NDF and ADF)
The neutral detergent fiber (NDF) and acid detergent fiber (ADF) content of the basal feedstock were
determined using the methods of Goering and Van Soest (1970).
Reagents
NDF solution:
Into a 1 litre capacity beaker containing 500 ml of distilled water, 18.61 g of disodium ethylene tetra-
acetate dihydrate (EDTA), 6.81 g di-Sodium tetraborate, 30 g of 90% sodium lauryl sulphate and 10 ml
triethylene glycol mixed and 4.56 g disodium hydrogen orthophosphate were added. The mixture was
then mixed by stirring with a magnetic stirrer then made up to 1L and pH was adjusted to 7.
ADF solution:
Exactly 49.04 ml of 1N H2SO4 was added to 1000 ml volumetric flask containing 400 ml of distilled
water and this was made up to the mark with distilled water before adding 20 g of cetyl
trimethylammonium bromide, CTAB.
Procedure:
Approximately 1 g of dried feed was weighed into preweighed sintered crucibles (Fisher Scientific,
Leicestershire, UK) which were previously cleaned, dried (105°C) and cooled in a desiccator. Exactly 0.5
g of sodium sulphite was added to the crucibles containing the feed sample. The feed was then digested
for 60 minutes using the Fibertech apparatus (Fibertech 1020 System M-Tecator) with 100 ml of NDF
solution and 100 ml of ADF solution. Drops of octanol were added to each column before the heater and
the timer were turned on. At the end of 60 minutes, the digest was washed (three times) with about 50 ml
of hot water (100°C) and the column drained. Crucibles were then transferred to the cold extraction unit
using the clip carrier and were placed in the same manner as with the fibertec. Each crucible was then
rinsed with acetone (about 20 ml) and drained. The crucibles with the sample were then oven dried
(105°C) overnight and cooled in a desiccator. After cooling, sample and crucible was weighed before
ashing at 500°C for 5 hours using Carbolite AAF1100 furnace. The crucible and the ash were then
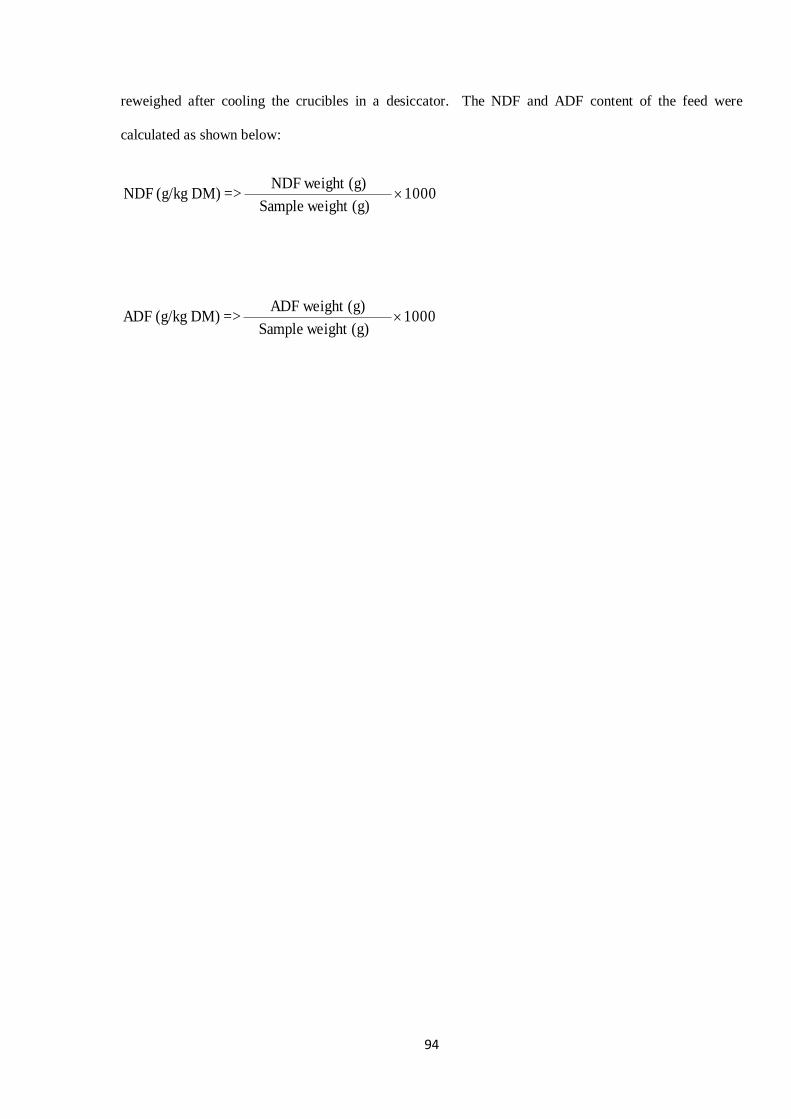
94
reweighed after cooling the crucibles in a desiccator. The NDF and ADF content of the feed were
calculated as shown below:
1000(g) weight Sample
(g) weight NDF =>DM) (g/kg NDF
1000(g) weight Sample
(g) weight ADF =>DM) (g/kg ADF
95
2.5.6. Volatile fatty acid analysis
The volatile fatty acids content of rumen fluid were determined using the method of Ottenstein and
Bartley (1971).
2.5.6.1. Reagents
A deproteinising solution (DPS) containing 2-ethylbutyric acid as an internal standard was prepared by
adding 581 mg of 2-ethylbutyric acid and 50 ml of ortho-phosphoric acid into 250 ml volumetric flask.
This solution was then made up to the mark with distilled water and stored at 4°C. In vitro fermentation
digests (4 ml) were mixed with 1 ml of the DPS and frozen (minus 180C) ready for subsequent fatty acid
analysis.
2.5.6.2. Sample preparation and analysis
The frozen samples were thawed at 40C and transferred to 30 ml Oak Ridge tube (Fisher Scientific,
Leicestershire, UK) and centrifuged at 20 000 g for 15 mins at 40C. Sub sample of 1.0 ml (the
supernatant) was then transferred to a labelled eppendorf tube and frozen at minus 180C ready for GC
analysis.
Volatile fatty acids sample was removed from the freezer, defrosted and 150 uL was transferred to GC
vial and analysed by GC. The operating conditions of the GC (Agilent 6890 with autosampler) were:
column (HP-FFAP 10M x 0.53 mm with 1 metre retention gap), injection liner (4mm straight liner with
phosphoric acid treated quartz fibre centre packing), carrier gas (Helium), head pressure 35kPa (5psi),
column flow (approx. 24 ml/min), temperature (70°C x 1 min. and 70°C x 4 min. for initial and final
respectively).
Determination of total fatty acids (mM) was done by simple addition of the individual volatile fatty acids
that were identified. Molar proportion of individual volatile fatty acids was calculated as a proportion
(mM/mol TVFA) of the total.
96
2.5.7. Fatty acid analysis
In order to protect fat from oxidation before and during analysis, butylated hydroxyl-toluone (BHT) was
added at 0.05% of fat by dissolving 100 mg of BHT in 1 litre of 100% ethanol. Immediately after
fermentation was stopped, 250 ul of BHT in ethanol was added to in vitro incubation digests before
samples were frozen (-20⁰C).
Direct saponification method (Enser et al., 1998) was used to extract fatty acids initially from both feed
samples and in vitro incubation residues. Then these non-esterified fatty acids (NEFA) were methylated
using 1% sulphuric acid in excess methanol (Christie, 2007) and the composition of methyl ester was
analysed by gas chromatographic analysis (Folch et al., 1957).
2.5.7.1. Reagents
A Butylated hydroxyl-toluone (BHT)
Into a 100 ml volumetric flask, exactly 1 g of BHT was weighed and made up to the mark with
chloroform.
B Internal standard (C₂₁)
Into a 10 ml volumetric flask approximately 150 mg of Heneicosanoic acid (C₂₁) was weighed and 50 μl
of BHT (2.5.7.2A) was added. The mixture was made up to the mark with chloroform. The solution was
then thoroughly mixed and stored in the freezer (-20⁰C).).
C Saponification mixture (5M potassium hydroxide-KOH)
Into a 500 ml measuring cylinder, 280.6 g of KOH was weighed and quickly dissolved in 400 ml of
distilled water before capping the cylinder and cooled to room temperature under running cold water. The
solution was made up to 500 ml with distilled water after cooling. Quinol (1 g) was weighed into a 200 ml
beaker and dissolved in about 50 ml of methanol and subsequently transferred to a 500 ml volumetric
flask. This was made up to the mark with methanol. The two solutions were then transferred into IL
volumetric flask and thoroughly mixed together to create the saponification mixture.
97
2.5.7.2. Extraction of fatty acid content of basal feedstock
The FA content of basal diet was extracted by weighing 0.4 g of dried ground samples in duplicate into
30 ml Pyrex tubes. This quantity (0.4 g) was estimated (Wachira et al., 2000) to give around 20-25 mg of
fat for an accurate peak in chromatographic analysis. To each sample in the tube was added 0.7 ml of
distilled water, 6 ml of 5M saponification mixture (2.5.7.1C), 100 μl of internal standard (2.5.7.1B) and
50 μl BHT (2.5.7.1A; as antioxidant). The tubes were incubated at 60⁰C in a water bath for 3 h with
shaking at 15 minutes intervals for about 30 seconds to completely hydrolyse and saponify the
triglycerides in the sample. After incubation, tubes were taken out of water bath and allowed to cool down
before adding 3 ml of 10N sulphuric acid then followed by further 1 h incubation to reform free fatty
acids.
After incubation 12 ml of distilled water and 5 ml of petroleum spirit (40-60⁰C) were added to the tube
and manually shaken vigorously before centrifuging at 1000 g (2300 rpm) for 2 minutes. Absolute
ethanol was added drop by drop to clear the gel and the top layer (supernatant) was transferred using a
Pasteur pipette into a new soveril tube. This procedure was repeated twice making 3 times. In order to
neutralize excess acid and to remove excess water from the fat sample, small amount of sodium hydrogen
carbonate was added using small spatula until fizzing subsided then followed by adding some amount of
anhydrous sodium sulphate until the power fell through. The tube was then centrifuged at 1000 g for 5
minutes before transferring the supernatant using Pasteur pipette to a clean new 10 ml quick fit tube and
stored under oxygen-free nitrogen in the freezer (minus 18⁰C) till the samples were methylated.
2.5.7.3. Extraction of fatty acid content of in vitro fermentation residues (digesta)
Into a 30 ml Pyrex tube, exactly 0.6 g of well mixed dried digesta was weighed followed by addition of
0.7 ml of distilled water, 6 ml of 5M saponification mixture (2.5.7.1C) and 100 μl of internal standard
(2.5.7.1B). The sample was then saponified at 60⁰C in a water bath for 2½ h with 15 minutes interval of
regular shaking for about 30 seconds to completely hydrolyse the sample. Into each tube was added 12 ml
of distilled water and 5 ml of petroleum spirit (40-60⁰C) then shaken vigorously before centrifuging for 3
minutes at 1000 g. Absolute ethanol was added in drops to clear the gel before discarding the top layer
and the procedure was repeated for 2 more times. Then 3 ml of 10N H₂SO₄ and 5 ml of petroleum spirit
98
were added followed by vigorous manual shaking of the tubes before centrifuging at 1000 g for 2
minutes. The top layer was transferred into another clean tubes using Pasteur pipette and this process was
repeated 2 more times, such that there were three top layers collected into a new tube. In order to
neutralize excess acid and to remove excess water from the fat sample, small amount of sodium hydrogen
carbonate was added using small spatula until fizzing subsided then followed by addition of some amount
of anhydrous sodium sulphate until the power fell through. The tube was then centrifuged at 1000 g for 5
minutes before transferring the supernatant using Pasteur pipette to a clean new quick fit tube and stored
under oxygen-free nitrogen in the freezer (minus 18⁰C) till the samples were methylated.
2.5.7.5. Methylation of extracted fatty acids samples (feed and digesta)
2.5.7.5.1. Reagents
Reagents used and their preparations for methylation are described below:
A 5% Sodium chloride
Into a 500 ml volumetric flask 25 g of sodium chloride was added and then made up to 500 ml using
distilled water to the mark.
B 1% Sulphuric acid/methanol mixtures
Exactly 1 ml of concentrated sulphuric acid was added to a 100 ml volumetric flask containing about 40
ml of methanol and thoroughly mixed. The solution was then made up to the mark using methanol. NB.
This mixture was made daily when required.
C 2% Potassium hydrogen carbonate
Into a 500 ml volumetric flask 10 g of potassium hydrogen carbonate was weighed and dissolved in
distilled water, then made up to the indicated mark using distilled water.
2.5.7.5.2. Methylation procedures
Frozen samples were taken out of the freezer to defrost in room temperature before drying under Oxygen-
free Nitrogen on hot plate maintained at 50⁰C. Then 1 ml of hexane was added to the tube to resuspend
99
the sample followed by brief vortexing. To the sample tube was added 1 ml of the 1% sulphuric
acid/methanol mixture (2.5.7.5.1B) before flushing the sample with nitrogen then glass stopper was
immediately attached. Tubes were incubated for 1 hour in a water bath maintained at 50⁰C. After
incubation 2.5 ml of the 5% sodium chloride (2.5.7.5.1A) was immediately added followed by brief
vortexing. Then 1 ml of hexane was added and vortexed briefly. Sample tube was allowed to settle in
order to form clear layers before transferring the upper section (hexane portion) with a Pasteur pipette to a
new clean 10 ml quick fit glass tube and repeating the procedure twice (i.e. addition of 1 ml of hexane
plus vortexing). To the tube containing the hexane fraction (supernatants) 1.5 ml of the prepared 2%
potassium hydrogen carbonate (2.5.7.5.1C) was added followed by brief vortexing. When two layers were
clearly formed, the top layer (hexane fraction) was transferred into clean quick fit tube then dried under
nitrogen with temperature maintained at 50⁰C. Fatty acid methyl Esters (FAMES) were at last re-
suspended by dissolving the dried samples in 500 uL of hexane plus brief vortexing. The re-suspended
FAMES was then transferred into vial with insert, capped and then stored at minus 18 till gas
chromatogram analysis (GCA).
The GC (HP 6890+, Agilent Technologies, UK Ltd) with a flame ionization detector and fitted with a 100
m fused silica capillary column (Varian CP-7489) of 0.2 µm film thickness and 250 µm diameter was
used. Approximately 1 uL of fatty acid samples in hexane were injected at 160⁰C (initial temperature of
the column) and held at that temperature for 15 minutes. Then the temperature increased at 1.5/minute to
240⁰C, and was held at that temperature until the run was completed (at 87 minutes, when the C22:6 n-3
was peaked). Helium at a flow rate of 1.2 ml/min was used as the carrier gas. The chromatograms were
recorded and processed by a computer installed with Productivity Chemstation Software connected to the
GC. Methyl heneicosanoic (C₂₁:₀, Sigma-Aldrich Co. Ltd., UK) which was added prior to saponification
was used as an internal standard. Fatty acid methyl ester standard mixture (Thames Restek UK) of
conjugated linoleic acid (CLA) was used as the standard for identification of peaks. The major peaks were
identified by comparing the retention times with the corresponding retention times of known standards.
The concentration of individual fatty acid in sample was determined as follows:
100
(g) weight sample
standard) of areastandard/ of(amount acidfatty of Area=>(mg) acidFatty
1
100
TFA
(mg/g) acidfatty =>TFA) g (g/100 acidFatty
Rumen biohydrogenation was calculated as the change in the proportion of individual FA such as 18:3 n-
3 and 18:3 n-2, in the feed relative to the amount left in incubation vessels at a given time as follows:
100added acidfatty dunsaturate ofamount Initial
incubationafter amount -FA dunsaturate ofamount Initialg) (g/100nation Biohydroge
Calculations of sum of fatty acids are shown as follows:
∑SFA = C14:0+C16:0+C18:0
∑SFA-C18 = C14:0+C16:0
∑MUFAs = C16:1+C18:1 n-9+18:1 trans 11
∑PUFAs = C18:2 n-6+18:2 cis-9 trans 11 CLA+C18:3 n-3+C20:4 n-6+C20:5 n-3 and C22:6 n-3
∑n-6/∑n-3
P/S = ∑PUFAs/∑SFAs
101
CHAPTER 3
Effects of Fifteen Compounds from Essential Oil Extracts on the Metabolism
of Polyunsaturated Fatty Acids by Rumen Microorganisms in vitro
102
ABSTRACT
The effects of fifteen EOCs on the fermentation activities of rumen microbes and the biohydrogenation
(BH) of PUFA were examined in vitro using a batch culture system. Rumen fluid was collected from Six
Hartline Texel cross cull ewes offered grass hay (Lolium perenne) ad libitum and supplemented with
additional 400 g/sheep/day of lamb finisher cubes. A basal feedstock comprising of 70:30 grass hay and
concentrate was formulated and milled (1 mm screen) then supplemented with 32.5 g oil/kg (40% from
ground whole linseed and 60% from fish oil). Serum bottles were incubated at 39⁰C; each bottle
contained 1 g of feed substrate, 80 ml buffer, 20 ml inoculum, then supplemented with 300 mg/l of EOCs
and repeated twice. There were 16 treatments with six replicates per treatment as follows: Control (CON),
3-carene (CAR), 4-Allylanisole (ALA), trans-anethole (ANE), (-)-α-bisabolol (BIS), (-)-borneole (BOR),
(-)-trans-caryophyllene (CPY), trans-cinnamaldehyde (CIN), (S)-(-)-β-citronellol (CIT), eucalyptol
(EUC), (R)-(+)-limonene (LIM), menthol (MEN), myrtenol (MYT), P-cymene (CYM), (-)-α-thujone
(THU) and vanillin (VAN). Gas measurement was taken at 3, 6, 9, 12, 24, 36 and 48 h and fermentation
was stopped at 12, 24 and 48 h. Samples were collected to analyse NH3-N, total volatile fatty acids (VFA)
and molar proportions of individual VFA; and concentration of individual PUFA including intermediates
of BH. Relative to the control, ANE and LIM reduced (P<0.001) ammonia concentration by a magnitude
of 27%, whilst the other EOCs maintained similar ammonia levels. With the exception of VAN, the
addition of all EOCs decreased (P<0.001) TVFA compared to the control, with MEN being the most
inhibitory compound, inducing an approximately 20% reduction. The concentrations of 18:3 n-3 or 18:2
n-6 increased significantly in response to EOCs in the sequence: ALA and ANE, MEN and CIT > 3-CAR
and BOR, CIN, LIM, MYT, CYM and THU > BIS and EUC > CPY and VAN. The addition of ALA
maintained highest the concentrations of C20:5 n-3 and C22: 6 n-3. These results showed that the
phenylpropanoid EOCs (ALA and ANE) and monoterpene alcohols (MEN) had the greatest potential to
reduce the disappearance of PUFA and suggest that their use could enhance the concentrations of n-3
PUFA in ruminant food products if these effects are confirmed in vivo. However, this needs to be
balanced against their effects on VFA.
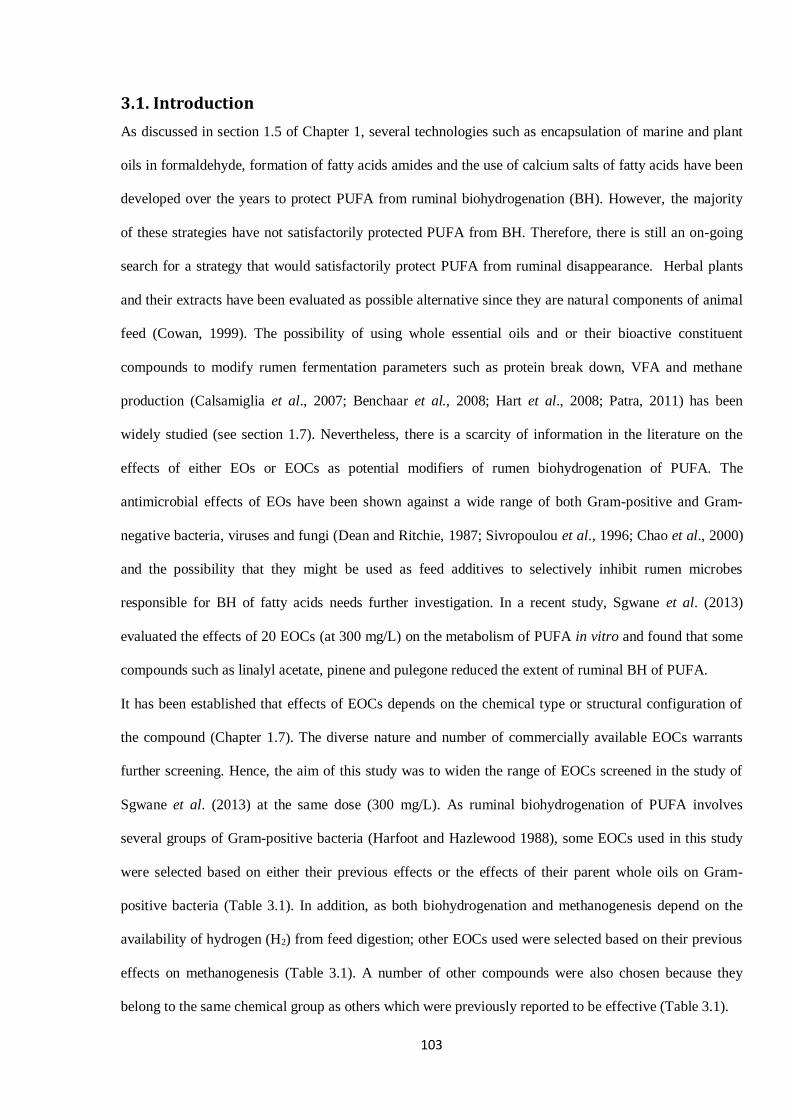
103
3.1. Introduction
As discussed in section 1.5 of Chapter 1, several technologies such as encapsulation of marine and plant
oils in formaldehyde, formation of fatty acids amides and the use of calcium salts of fatty acids have been
developed over the years to protect PUFA from ruminal biohydrogenation (BH). However, the majority
of these strategies have not satisfactorily protected PUFA from BH. Therefore, there is still an on-going
search for a strategy that would satisfactorily protect PUFA from ruminal disappearance. Herbal plants
and their extracts have been evaluated as possible alternative since they are natural components of animal
feed (Cowan, 1999). The possibility of using whole essential oils and or their bioactive constituent
compounds to modify rumen fermentation parameters such as protein break down, VFA and methane
production (Calsamiglia et al., 2007; Benchaar et al., 2008; Hart et al., 2008; Patra, 2011) has been
widely studied (see section 1.7). Nevertheless, there is a scarcity of information in the literature on the
effects of either EOs or EOCs as potential modifiers of rumen biohydrogenation of PUFA. The
antimicrobial effects of EOs have been shown against a wide range of both Gram-positive and Gram-
negative bacteria, viruses and fungi (Dean and Ritchie, 1987; Sivropoulou et al., 1996; Chao et al., 2000)
and the possibility that they might be used as feed additives to selectively inhibit rumen microbes
responsible for BH of fatty acids needs further investigation. In a recent study, Sgwane et al. (2013)
evaluated the effects of 20 EOCs (at 300 mg/L) on the metabolism of PUFA in vitro and found that some
compounds such as linalyl acetate, pinene and pulegone reduced the extent of ruminal BH of PUFA.
It has been established that effects of EOCs depends on the chemical type or structural configuration of
the compound (Chapter 1.7). The diverse nature and number of commercially available EOCs warrants
further screening. Hence, the aim of this study was to widen the range of EOCs screened in the study of
Sgwane et al. (2013) at the same dose (300 mg/L). As ruminal biohydrogenation of PUFA involves
several groups of Gram-positive bacteria (Harfoot and Hazlewood 1988), some EOCs used in this study
were selected based on either their previous effects or the effects of their parent whole oils on Gram-
positive bacteria (Table 3.1). In addition, as both biohydrogenation and methanogenesis depend on the
availability of hydrogen (H2) from feed digestion; other EOCs used were selected based on their previous
effects on methanogenesis (Table 3.1). A number of other compounds were also chosen because they
belong to the same chemical group as others which were previously reported to be effective (Table 3.1).
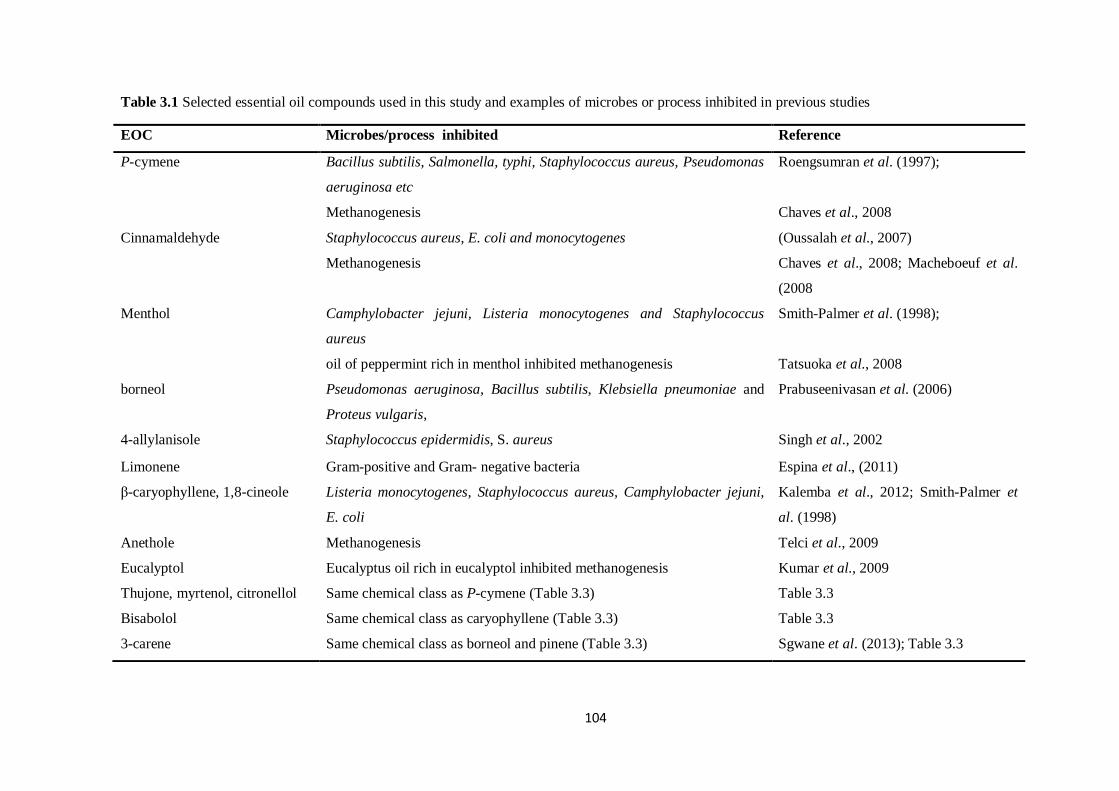
104
Table 3.1 Selected essential oil compounds used in this study and examples of microbes or process inhibited in previous studies
EOC Microbes/process inhibited Reference
P-cymene Bacillus subtilis, Salmonella, typhi, Staphylococcus aureus, Pseudomonas
aeruginosa etc
Methanogenesis
Roengsumran et al. (1997);
Chaves et al., 2008
Cinnamaldehyde Staphylococcus aureus, E. coli and monocytogenes
Methanogenesis
(Oussalah et al., 2007)
Chaves et al., 2008; Macheboeuf et al.
(2008
Menthol Camphylobacter jejuni, Listeria monocytogenes and Staphylococcus
aureus
oil of peppermint rich in menthol inhibited methanogenesis
Smith-Palmer et al. (1998);
Tatsuoka et al., 2008
borneol Pseudomonas aeruginosa, Bacillus subtilis, Klebsiella pneumoniae and
Proteus vulgaris,
Prabuseenivasan et al. (2006)
4-allylanisole Staphylococcus epidermidis, S. aureus Singh et al., 2002
Limonene Gram-positive and Gram- negative bacteria Espina et al., (2011)
β-caryophyllene, 1,8-cineole Listeria monocytogenes, Staphylococcus aureus, Camphylobacter jejuni,
E. coli
Kalemba et al., 2012; Smith-Palmer et
al. (1998)
Anethole Methanogenesis Telci et al., 2009
Eucalyptol Eucalyptus oil rich in eucalyptol inhibited methanogenesis Kumar et al., 2009
Thujone, myrtenol, citronellol Same chemical class as P-cymene (Table 3.3) Table 3.3
Bisabolol Same chemical class as caryophyllene (Table 3.3) Table 3.3
3-carene Same chemical class as borneol and pinene (Table 3.3) Sgwane et al. (2013); Table 3.3
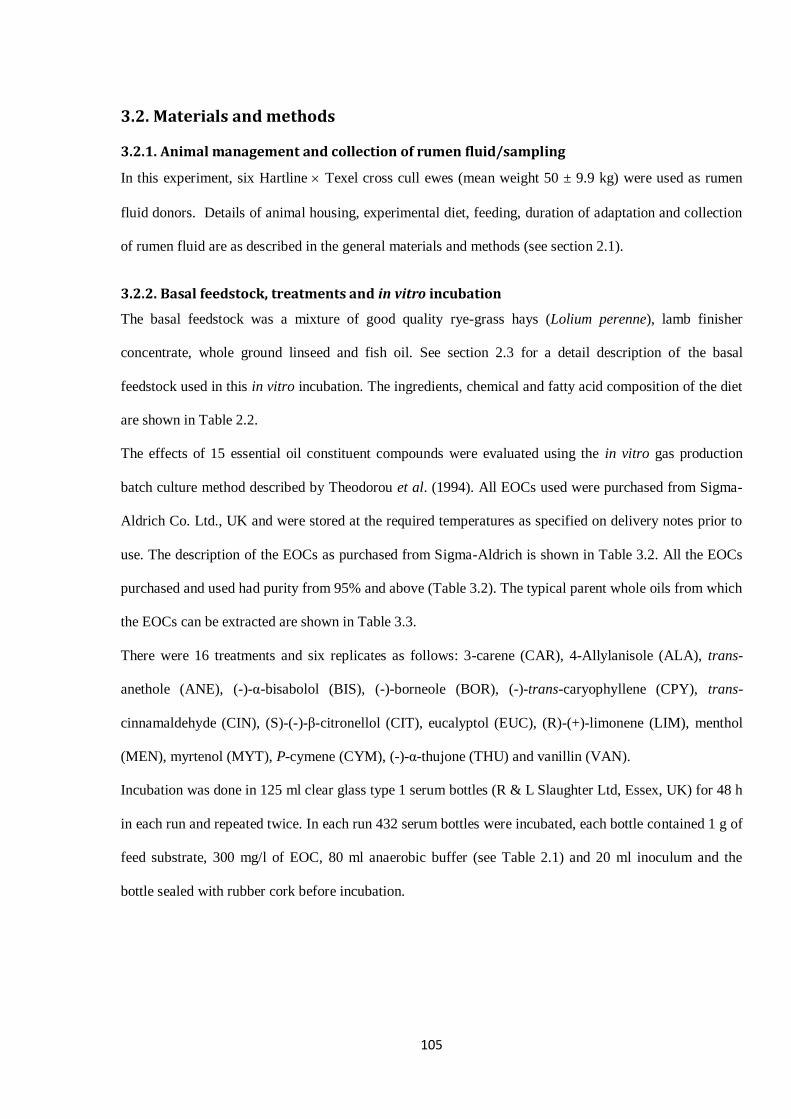
105
3.2. Materials and methods
3.2.1. Animal management and collection of rumen fluid/sampling
In this experiment, six Hartline Texel cross cull ewes (mean weight 50 ± 9.9 kg) were used as rumen
fluid donors. Details of animal housing, experimental diet, feeding, duration of adaptation and collection
of rumen fluid are as described in the general materials and methods (see section 2.1).
3.2.2. Basal feedstock, treatments and in vitro incubation
The basal feedstock was a mixture of good quality rye-grass hays (Lolium perenne), lamb finisher
concentrate, whole ground linseed and fish oil. See section 2.3 for a detail description of the basal
feedstock used in this in vitro incubation. The ingredients, chemical and fatty acid composition of the diet
are shown in Table 2.2.
The effects of 15 essential oil constituent compounds were evaluated using the in vitro gas production
batch culture method described by Theodorou et al. (1994). All EOCs used were purchased from Sigma-
Aldrich Co. Ltd., UK and were stored at the required temperatures as specified on delivery notes prior to
use. The description of the EOCs as purchased from Sigma-Aldrich is shown in Table 3.2. All the EOCs
purchased and used had purity from 95% and above (Table 3.2). The typical parent whole oils from which
the EOCs can be extracted are shown in Table 3.3.
There were 16 treatments and six replicates as follows: 3-carene (CAR), 4-Allylanisole (ALA), trans-
anethole (ANE), (-)-α-bisabolol (BIS), (-)-borneole (BOR), (-)-trans-caryophyllene (CPY), trans-
cinnamaldehyde (CIN), (S)-(-)-β-citronellol (CIT), eucalyptol (EUC), (R)-(+)-limonene (LIM), menthol
(MEN), myrtenol (MYT), P-cymene (CYM), (-)-α-thujone (THU) and vanillin (VAN).
Incubation was done in 125 ml clear glass type 1 serum bottles (R & L Slaughter Ltd, Essex, UK) for 48 h
in each run and repeated twice. In each run 432 serum bottles were incubated, each bottle contained 1 g of
feed substrate, 300 mg/l of EOC, 80 ml anaerobic buffer (see Table 2.1) and 20 ml inoculum and the
bottle sealed with rubber cork before incubation.
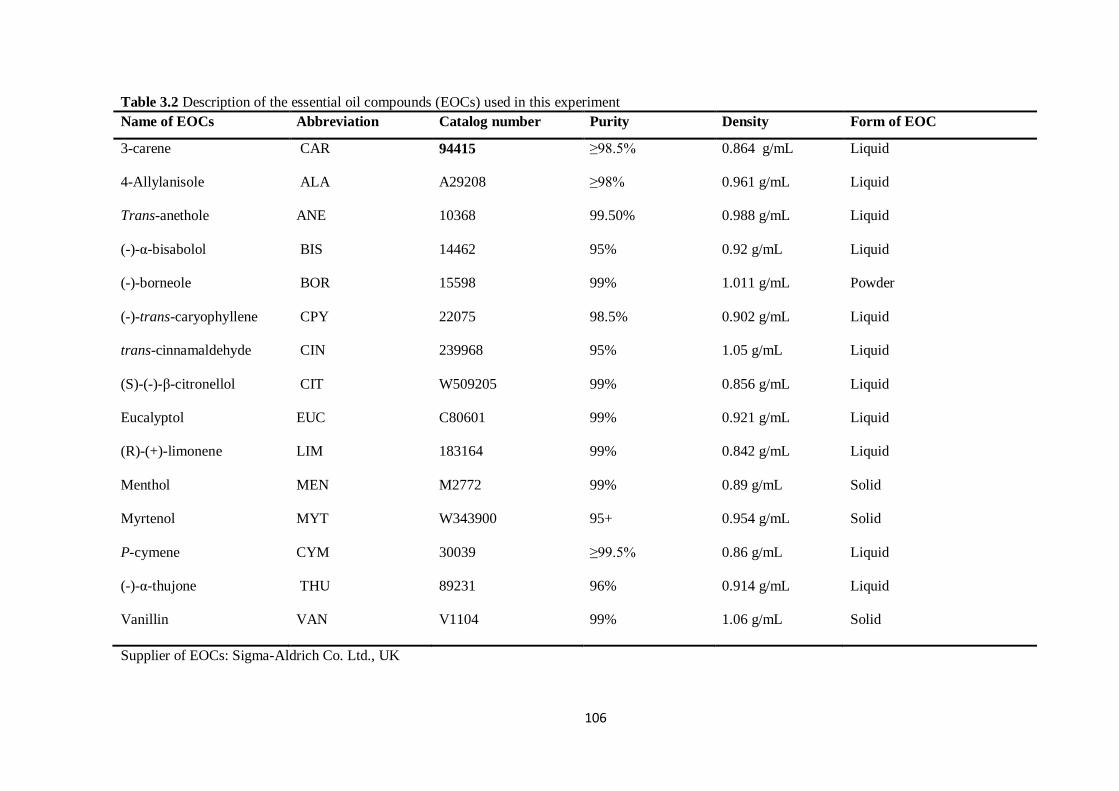
106
Table 3.2 Description of the essential oil compounds (EOCs) used in this experiment
Name of EOCs Abbreviation Catalog number Purity Density Form of EOC
3-carene CAR 94415 ≥98.5% 0.864 g/mL Liquid
4-Allylanisole ALA A29208 ≥98% 0.961 g/mL Liquid
Trans-anethole ANE 10368 99.50% 0.988 g/mL Liquid
(-)-α-bisabolol BIS 14462 95% 0.92 g/mL Liquid
(-)-borneole BOR 15598 99% 1.011 g/mL Powder
(-)-trans-caryophyllene CPY 22075 98.5% 0.902 g/mL Liquid
trans-cinnamaldehyde CIN 239968 95% 1.05 g/mL Liquid
(S)-(-)-β-citronellol CIT W509205 99% 0.856 g/mL Liquid
Eucalyptol EUC C80601 99% 0.921 g/mL Liquid
(R)-(+)-limonene LIM 183164 99% 0.842 g/mL Liquid
Menthol MEN M2772 99% 0.89 g/mL Solid
Myrtenol MYT W343900 95+ 0.954 g/mL Solid
P-cymene CYM 30039 ≥99.5% 0.86 g/mL Liquid
(-)-α-thujone THU 89231 96% 0.914 g/mL Liquid
Vanillin VAN V1104 99% 1.06 g/mL Solid
Supplier of EOCs: Sigma-Aldrich Co. Ltd., UK
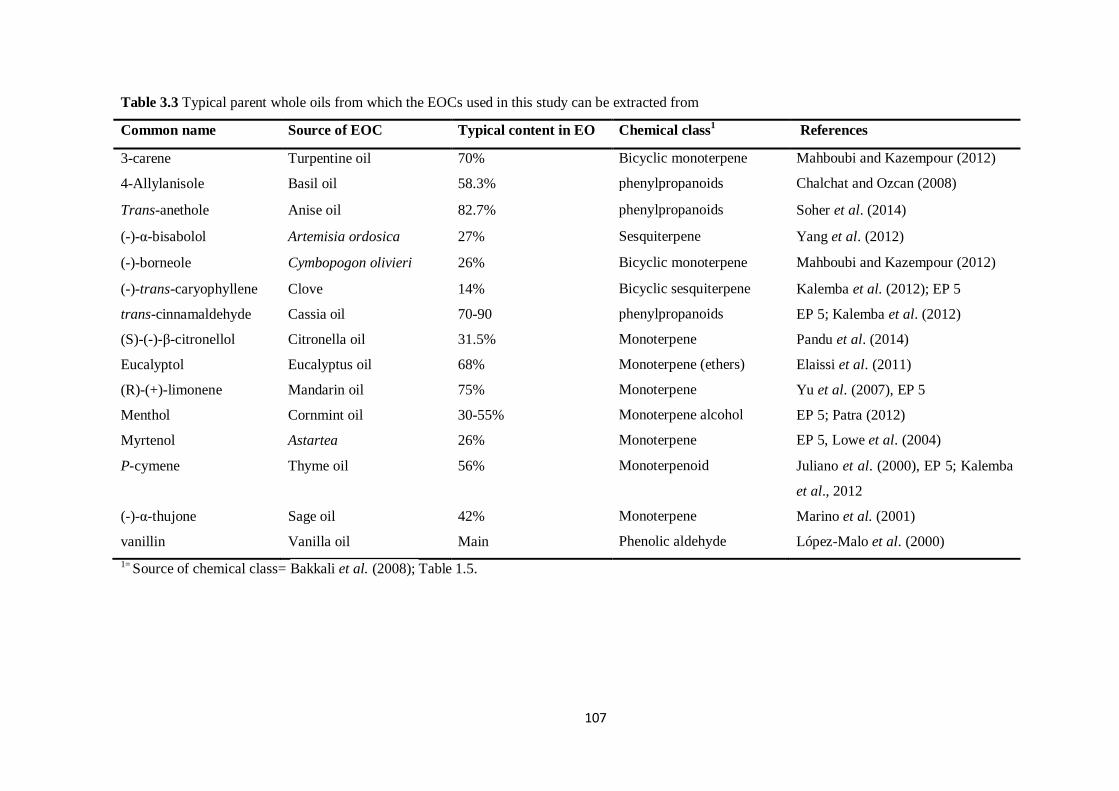
107
Table 3.3 Typical parent whole oils from which the EOCs used in this study can be extracted from
Common name Source of EOC Typical content in EO Chemical class1 References
3-carene Turpentine oil 70% Bicyclic monoterpene Mahboubi and Kazempour (2012)
4-Allylanisole Basil oil 58.3% phenylpropanoids Chalchat and Ozcan (2008)
Trans-anethole Anise oil 82.7% phenylpropanoids Soher et al. (2014)
(-)-α-bisabolol Artemisia ordosica 27% Sesquiterpene Yang et al. (2012)
(-)-borneole Cymbopogon olivieri 26% Bicyclic monoterpene Mahboubi and Kazempour (2012)
(-)-trans-caryophyllene Clove 14% Bicyclic sesquiterpene Kalemba et al. (2012); EP 5
trans-cinnamaldehyde Cassia oil 70-90 phenylpropanoids EP 5; Kalemba et al. (2012)
(S)-(-)-β-citronellol Citronella oil 31.5% Monoterpene Pandu et al. (2014)
Eucalyptol Eucalyptus oil 68% Monoterpene (ethers) Elaissi et al. (2011)
(R)-(+)-limonene Mandarin oil 75% Monoterpene Yu et al. (2007), EP 5
Menthol Cornmint oil 30-55% Monoterpene alcohol EP 5; Patra (2012)
Myrtenol Astartea 26% Monoterpene EP 5, Lowe et al. (2004)
P-cymene Thyme oil 56% Monoterpenoid Juliano et al. (2000), EP 5; Kalemba
et al., 2012
(-)-α-thujone Sage oil 42% Monoterpene Marino et al. (2001)
vanillin Vanilla oil Main Phenolic aldehyde López-Malo et al. (2000)
1= Source of chemical class= Bakkali et al. (2008); Table 1.5.
108
3.2.3. Sample collection and preservation
The procedures for gas pressure measurement, fermentation stopping times, collection and storage of
samples are described in the general material and methods (see section 2.4).
3.2.4 Chemical analysis
The concentration of NH3-N in digesta was analysed using the phenol-hypochlorite method
(Weatherburn, 1967; Broderick and Kang, 1980) adapted for use on the plate reader as described in
general materials and methods (see section 2.5.4).
The concentration of volatile fatty acid (VFA) was determined by gas chromatography (GC) as described
by Ottenstein and Bartley (1971). Details of this method are found in the general materials and methods
(see section 2.5.6).
The concentrations of fatty acids in feed and in freeze dried samples of effluent of in vitro digests were
extracted by direct saponification method described by Enser et al. (1998). Details of this method are
outlined in the general materials and methods (see section 2.5.6).
3.2.5. Experimental design and statistical analysis
The objective was to examine the effects of fifteen EOCs on the extent of rumen biohydrogenation of n-3
PUFA in vitro, including their effects on fermentation parameters (gas production, NH3-N concentration
and on concentrations of TVFA and molar proportions of individual VFA. The null hypothesis was that
inclusion of 300 mg/L of EOCs would have no effect on fermentation and biohydrogenation data. The
alternative hypothesis was that the EOCs would affect (decrease or increase) fermentation activities.
This study was a completely randomized design (CRD) experiment with 16 treatments randomly
allocated to fermentation flask as outlined in section 3.2.2. Data were analysed by analysis of variance
(ANOVA) using GenStat 15th edition (VSN international Ltd, Registered to: Writtle College) with
experimental runs as a blocking factor. Differences between treatments were declared by least
109
significance difference (LSD) and significance was declared at P< 0.05. Data were analysed separately
for each time point (12, 24 and 48 h).
3.3. RESULTS
3.3.1. In vitro fermentation parameters
The effects of EOCs on cumulative gas production (ml/g OM), NH₃-N concentration and pH of
fermentation vessels are shown in Table 3.4.
Except for VAN and LIM which maintained total gas production levels similar to the control (118.6 ml/g
OM), the addition of most EOCs significantly (P<0.001) reduced total gas production at 12 h, with CIN
(65.5 ml/g OM) being the most inhibitory EOC, inducing approximately 45% reduction of total gas. At 24
and 48 h, VAN had similar effects to the control (175.1 and 220 ml/g OM for 24 and 48 h respectively),
whilst the rest of the treatments reduced gas production relative to the control, with the lowest reductions
in gas production found in vessels with MEN and MYT (means 120.4 and 146.8 for 24 and 48 h,
respectively).
The concentration of NH₃-N in cultures increased as the time of incubation progressed (lowest at 12 and
highest at 48 h). There were no effects of treatments on the concentration of ammonia N in cultures at 12
h. After 24 h ANE and LIM caused a 27% mean reduction of NH₃-N concentration relative to the control.
At 48 h, only ANE and CIN significantly decreased (P<0.001) NH₃-N concentration (mean decrease 5.5
mM) compared with the control, other treatments maintained NH₃-N levels similar to the control (6.9
mM).
The pH of cultures at 12 h was not affected by the addition of all EOCs except in cultures with added
BOR which increased it (7.0) relative to the control (6.7). Relative to the control, the pH of cultures was
significantly (P<0.001) increased with the addition of all EOCs at both 24 and 48 h (average 6.8 for both
24 and 48) except VAN (both 24 and 48) and CPY (24 h only) which had similar pH to the control (6.7
for both 24 and 48 h).
The concentration of total TVFA (mM) and molar proportions of individual VFA (mM/mol TVFA) are
presented in Table 3.5. The average concentration of TVFA was highest in the control and VAN (63.8
110
and 71.0 mM for 24 and 48 h, respectively) and low (P<0.001) in the remaining treatments, with the
lowest level observed in MEN (53.7 and 54.1 mM for 24 and 48 h, respectively). At 24 h the average
molar proportion of acetate was lowest in vessels supplemented with MEN (67.2 mM/mol TVFA) and
was highest in cultures with CIT (71.4 mM/mol TVFA), relative to the control (68.1 mM/mol TVFA).
After 48 h the cultures with the lowest molar proportion of acetate was CIN (63.9 mM/mol TVFA), an
approximately 2% reduction in acetate compared to the control, whilst CIT (69.0) had the highest molar
proportion of acetate. Propionate was not affected by VAN (24 h), but was increased by EUC and VAN at
48 h (average increase of 10%), and was reduced by other compounds with CIT inducing the greatest
reduction (20 % and 21 % for 24 and 48 h, respectively). Whilst VAN, EUC, CAR, CPY and BIS (48 h)
had no effect on the proportion of butyrate, other compounds reduced the proportion of butyrate with
MEN expressing the greatest reduction (21 and 34 % reduction at 24 and 48 h respectively). Although
CIN, EUC and VAN had no effect on the acetate: propionate ratio, other EOCs increased (P<0.001) it
with the highest increase recorded in vessels with CIT (about 35 % average increase at 24 and 48 h).
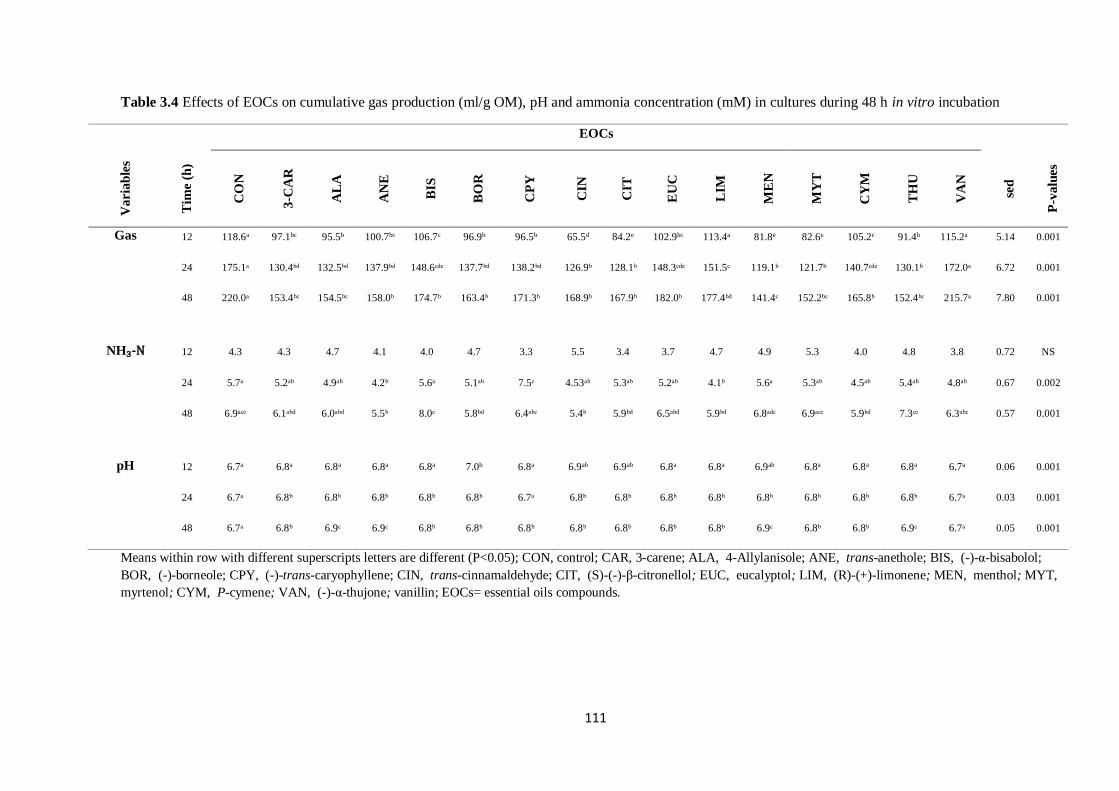
111
Table 3.4 Effects of EOCs on cumulative gas production (ml/g OM), pH and ammonia concentration (mM) in cultures during 48 h in vitro incubation
EOCs V
aria
ble
s
Tim
e (h
)
CO
N
3-C
AR
AL
A
AN
E
BIS
BO
R
CP
Y
CIN
CIT
EU
C
LIM
ME
N
MY
T
CY
M
TH
U
VA
N
sed
P-v
alu
es
Gas 12 118.6a 97.1bc 95.5b 100.7bc 106.7c 96.9b 96.5b 65.5d 84.2e 102.9bc 113.4a 81.8e 82.6e 105.2c 91.4b 115.2a 5.14 0.001
24 175.1ᵃ 130.4ᵇᵈ 132.5ᵇᵈ 137.9ᵇᵈ 148.6ᶜᵈᵉ 137.7ᵇᵈ 138.2ᵇᵈ 126.9ᵇ 128.1ᵇ 148.3ᶜᵈᵉ 151.5ᶜ 119.1ᵇ 121.7ᵇ 140.7ᶜᵈᵉ 130.1ᵇ 172.0ᵃ 6.72 0.001
48 220.0ᵃ 153.4ᵇᶜ 154.5ᵇᶜ 158.0ᵇ 174.7ᵇ 163.4ᵇ 171.3ᵇ 168.9ᵇ 167.9ᵇ 182.0ᵇ 177.4ᵇᵈ 141.4ᶜ 152.2ᵇᶜ 165.8ᵇ 152.4ᵇᶜ 215.7ᵃ 7.80 0.001
NH₃-N 12 4.3 4.3 4.7 4.1 4.0 4.7 3.3 5.5 3.4 3.7 4.7 4.9 5.3 4.0 4.8 3.8 0.72 NS
24 5.7ᵃ 5.2ᵃᵇ 4.9ᵃᵇ 4.2ᵇ 5.6ᵃ 5.1ᵃᵇ 7.5ᶜ 4.53ᵃᵇ 5.3ᵃᵇ 5.2ᵃᵇ 4.1ᵇ 5.6ᵃ 5.3ᵃᵇ 4.5ᵃᵇ 5.4ᵃᵇ 4.8ᵃᵇ 0.67 0.002
48 6.9ᵃᶜᵉ 6.1ᵃᵇᵈ 6.0ᵃᵇᵈ 5.5ᵇ 8.0ᵉ 5.8ᵇᵈ 6.4ᵃᵇᶜ 5.4ᵇ 5.9ᵇᵈ 6.5ᵃᵇᵈ 5.9ᵇᵈ 6.8ᵃᵈᶜ 6.9ᵃᶜᵉ 5.9ᵇᵈ 7.3ᶜᵉ 6.3ᵃᵇᶜ 0.57 0.001
pH 12 6.7a 6.8a 6.8a 6.8a 6.8a 7.0b 6.8a 6.9ab 6.9ab 6.8a 6.8a 6.9ab 6.8a 6.8a 6.8a 6.7a 0.06 0.001
24 6.7ᵃ 6.8ᵇ 6.8ᵇ 6.8ᵇ 6.8ᵇ 6.8ᵇ 6.7ᵃ 6.8ᵇ 6.8ᵇ 6.8ᵇ 6.8ᵇ 6.8ᵇ 6.8ᵇ 6.8ᵇ 6.8ᵇ 6.7ᵃ 0.03 0.001
48 6.7ᵃ 6.8ᵇ 6.9ᶜ 6.9ᶜ 6.8ᵇ 6.8ᵇ 6.8ᵇ 6.8ᵇ 6.8ᵇ 6.8ᵇ 6.8ᵇ 6.9ᶜ 6.8ᵇ 6.8ᵇ 6.9ᶜ 6.7ᵃ 0.05 0.001
Means within row with different superscripts letters are different (P<0.05); CON, control; CAR, 3-carene; ALA, 4-Allylanisole; ANE, trans-anethole; BIS, (-)-α-bisabolol;
BOR, (-)-borneole; CPY, (-)-trans-caryophyllene; CIN, trans-cinnamaldehyde; CIT, (S)-(-)-β-citronellol; EUC, eucalyptol; LIM, (R)-(+)-limonene; MEN, menthol; MYT,
myrtenol; CYM, P-cymene; VAN, (-)-α-thujone; vanillin; EOCs= essential oils compounds.
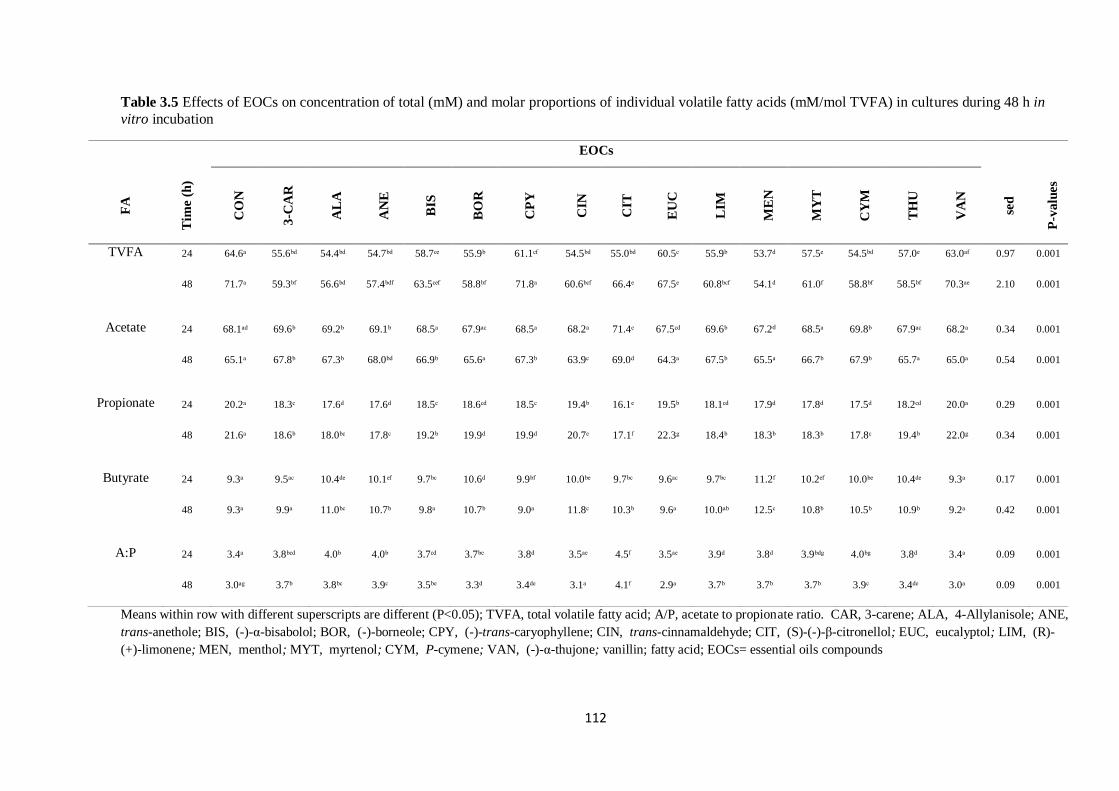
112
Table 3.5 Effects of EOCs on concentration of total (mM) and molar proportions of individual volatile fatty acids (mM/mol TVFA) in cultures during 48 h in
vitro incubation
EOCs
FA
Tim
e (h
)
CO
N
3-C
AR
AL
A
AN
E
BIS
BO
R
CP
Y
CIN
CIT
EU
C
LIM
ME
N
MY
T
CY
M
TH
U
VA
N
sed
P-v
alu
es
TVFA 24 64.6ᵃ 55.6ᵇᵈ 54.4ᵇᵈ 54.7ᵇᵈ 58.7ᶜᵉ 55.9ᵇ 61.1ᶜᶠ 54.5ᵇᵈ 55.0ᵇᵈ 60.5ᶜ 55.9ᵇ 53.7ᵈ 57.5ᵉ 54.5ᵇᵈ 57.0ᵉ 63.0ᵃᶠ 0.97 0.001
48 71.7ᵃ 59.3ᵇᶠ 56.6ᵇᵈ 57.4ᵇᵈᶠ 63.5ᶜᵉᶠ 58.8ᵇᶠ 71.8ᵃ 60.6ᵇᶜᶠ 66.4ᵉ 67.5ᵉ 60.8ᵇᶜᶠ 54.1ᵈ 61.0ᶠ 58.8ᵇᶠ 58.5ᵇᶠ 70.3ᵃᵉ 2.10 0.001
Acetate 24 68.1ᵃᵈ 69.6ᵇ 69.2ᵇ 69.1ᵇ 68.5ᵃ 67.9ᵃᶜ 68.5ᵃ 68.2ᵃ 71.4ᵉ 67.5ᶜᵈ 69.6ᵇ 67.2d 68.5ᵃ 69.8ᵇ 67.9ᵃᶜ 68.2ᵃ 0.34 0.001
48 65.1ᵃ 67.8ᵇ 67.3ᵇ 68.0ᵇᵈ 66.9ᵇ 65.6ᵃ 67.3ᵇ 63.9ᶜ 69.0ᵈ 64.3ᵃ 67.5ᵇ 65.5ᵃ 66.7ᵇ 67.9ᵇ 65.7ᵃ 65.0ᵃ 0.54 0.001
Propionate 24 20.2ᵃ 18.3ᶜ 17.6ᵈ 17.6ᵈ 18.5ᶜ 18.6ᶜᵈ 18.5ᶜ 19.4ᵇ 16.1ᵉ 19.5ᵇ 18.1ᶜᵈ 17.9ᵈ 17.8ᵈ 17.5ᵈ 18.2ᶜᵈ 20.0ᵃ 0.29 0.001
48 21.6ᵃ 18.6ᵇ 18.0ᵇᶜ 17.8ᶜ 19.2ᵇ 19.9ᵈ 19.9ᵈ 20.7ᵉ 17.1ᶠ 22.3ᵍ 18.4ᵇ 18.3ᵇ 18.3ᵇ 17.8ᶜ 19.4ᵇ 22.0ᵍ 0.34 0.001
Butyrate 24 9.3ᵃ 9.5ᵃᶜ 10.4ᵈᵉ 10.1ᵉᶠ 9.7ᵇᶜ 10.6ᵈ 9.9ᵇᶠ 10.0ᵇᵉ 9.7ᵇᶜ 9.6ᵃᶜ 9.7ᵇᶜ 11.2ᶠ 10.2ᵉᶠ 10.0ᵇᵉ 10.4ᵈᵉ 9.3ᵃ 0.17 0.001
48 9.3ᵃ 9.9ᵃ 11.0ᵇᶜ 10.7ᵇ 9.8ᵃ 10.7ᵇ 9.0ᵃ 11.8ᶜ 10.3ᵇ 9.6ᵃ 10.0ᵃᵇ 12.5ᶜ 10.8ᵇ 10.5ᵇ 10.9ᵇ 9.2ᵃ 0.42 0.001
A:P 24 3.4ᵃ 3.8ᵇᶜᵈ 4.0ᵇ 4.0ᵇ 3.7ᶜᵈ 3.7ᵇᵉ 3.8ᵈ 3.5ᵃᵉ 4.5ᶠ 3.5ᵃᵉ 3.9ᵈ 3.8ᵈ 3.9ᵇᵈᵍ 4.0ᵇᵍ 3.8ᵈ 3.4ᵃ 0.09 0.001
48 3.0ᵃᵍ 3.7ᵇ 3.8ᵇᶜ 3.9ᶜ 3.5ᵇᵉ 3.3ᵈ 3.4ᵈᵉ 3.1ᵃ 4.1ᶠ 2.9ᵃ 3.7ᵇ 3.7ᵇ 3.7ᵇ 3.9ᶜ 3.4ᵈᵉ 3.0ᵃ 0.09 0.001
Means within row with different superscripts are different (P<0.05); TVFA, total volatile fatty acid; A/P, acetate to propionate ratio. CAR, 3-carene; ALA, 4-Allylanisole; ANE,
trans-anethole; BIS, (-)-α-bisabolol; BOR, (-)-borneole; CPY, (-)-trans-caryophyllene; CIN, trans-cinnamaldehyde; CIT, (S)-(-)-β-citronellol; EUC, eucalyptol; LIM, (R)-
(+)-limonene; MEN, menthol; MYT, myrtenol; CYM, P-cymene; VAN, (-)-α-thujone; vanillin; fatty acid; EOCs= essential oils compounds
113
3.3.2. Effects of EOCs on fatty acid metabolism
The effects of EOC treatments on concentrations of selected C14 and C16 fatty acids are presented in
Table 3.6. The mean concentrations of C14:0 at 12 h was 5.0 g/100 g TFA and was similar for all EOCs
except BIS and CYM which decreased the level (P<0.001; average 4.0 g/100 g TFA). Relative to the
control, the fermentation vessel concentrations of C14:0 were not affected by the addition of 3-CAR, BIS,
CPY, CIN, LIM and VAN at 24 h, but it was significantly higher (P<0.001) in cultures in which the rest
of the treatments were added (mean values 5.0 g/100 g TFA). After 48 h the addition of all EOCs did not
change the levels of C14:0 in the cultures except with ALA, CPY, EUC, MEN, THU and VAN which
increased it (average 5.0 g/100 g TFA) relative to the control (4.0 g/100 g TFA).
After 12 h, the concentration of C16:0 was lowest (P<0.001) in vessels supplemented with BIS and CIT
(mean values 14.0 g/100 g TFA) and highest in cultures in which the control, VAN, CPY and LIM were
added (mean values 16.0 g/100 g TFA). Although the levels of C16:0 were not affected by treatments at
24 h, after 48 h it was lowest (P<0.001) in the cultures where BIS and MEN were added (mean values
14.1 g/100 g TFA). This level was approximately 12% and 7% lower than the concentrations found in the
control (16.0 g/100 g TFA), and in ALA and ANE (mean values 15.2), respectively.
At 12 h the levels of C16:1 were highest (P<0.001) in cultures supplemented with BOR, CIT and MYT
(average 2.7 g/100 g TFA), this was followed by ALA and THU (mean values 2.5 g/100 g TFA), and
lowest in vessels with the control, BIS and VAN (average 2.1 g/100 g TFA). However, after 24 h, CPY
had the lowest concentration of C16:1 (1.7 g/100 g TFA), followed by the control, 3-CAR, ANE, CIN,
LIM, CYM and VAN (mean values 1.9 g/100 g TFA), whilst the highest levels of C16:1 was observed in
vessels with added BOR and MYT (average 2.6 g/100 g TFA). At 48 h, BOR and MYT maintained the
highest levels of C16:1 (means 2.7 g/100 g TFA) relative to the control (1.7 g/100 g TFA), which had
similar concentration of C16:1 to 3-CAR, LIM, CYM and VAN.
The concentrations of selected C18 fatty acids in response to supplementation with EOCs are shown in
Table 3.7. Relative to the control, CIT elicited an approximately 14% reduction in the concentration of
C18:0 at 12 h, whilst the remaining EOCs maintained C18:0 at level similar to the control (14.0 g/100 g
114
TFA). The mean concentration of 18:0 was increased (P<0.001) by the addition of CYM, LIM and CIT to
fermentation cultures at 24 h (average 14.6 g/100 g TFA), after 48 h, C18:0 was reduced (P<0.001) in the
vessels where BOR, BIS, CIT, EUC, MEN, MYT and THU were added (11.4 g/100 g TFA) compared to
the control (12.9 and 13.6 g/100 g TFA for 24 and 48 h respectively). The remaining treatments
maintained similar levels of 18:0 to the control at both 24 and 48 h.
At 12 h, the average concentrations of C18:1 n-9 in cultures with added CIN, LIM, CPY and MEN was
7.0 g/100 g TFA, which exceeded (P=0.015) the mean values recorded in vessels with the control, BIS,
BOR, CIT, EUC and VAN (6.3 g/100 g TFA). After 24 h, CIT caused about a twofold increase in the
concentration of C18:1 n-9 relative to the control (P=0.015), whilst the levels were intermediate in the
rest of the other EOCs. Supplementation with ALA, BIS, CIT, MEN and THU doubled the vessel content
of C18:1 n-9 (mean values 5.3 g/100 TFA) relative to either the control or VAN (average 2.7 g/100 TFA)
after 48 h.
No dietary treatment effect on the vessel content of C18:1 trans 11 was observed after 12 h. However,
C18:1 trans 11 was increased by the addition of all EOCs at both 24 and 48 h with the exception of VAN.
The greatest increases were found in cultures with MEN and BOR (mean values 1.2 and 1.3 g/100 g TFA
for 24 and 48 h, respectively) compared to the control (average 1.0 for both 24 and 48 h).
The use of all EOCs did not affect the levels of 18:2 cis-9 trans-11 CLA at all incubation time points
except for 48 h. After 48 h MEN, BOR and BIS caused marginal but significant (P=0.002) increases on
the level of CLA (mean values 0.14, 0.11, 0.11 and 0.08 g/100 g TFA for MEN, BOR, BIS and control
respectively).
The content of 18:2 n-6 decreased with time, being highest at 12 h and lowest at 48 h, in both the control
and across all cultures supplemented with EOCs. At 12 h the vessel content of 18:2 n-6 increased
significantly in response to EOCs in the sequence: CIT (4.7 g/100 g TFA) > ALA, ANE, CIN, MEN,
MYT (average 4.2 g/100 g TFA) > 3-CAR, BOR, CPY, LIM, CYM and THU (mean values 3.4 g/100 g
TFA) > VAN and the control (means 2.5 g/100 g TFA). The concentration of 18:2 n-6 at 24 h decreased
significantly in response to EOCs in the order: control, CPY and VAN (1.4 g/100 g TFA) < BIS and EUC
115
(1.7 g/100 g TFA) < 3-CAR, BOR, CIN, LIM, MYT, CYM and THU (2.2 g/100 g TFA) < ALA, ANE,
CIT and MEN (2.7 g/100 g TFA). After 48 h, the average level of 18:2 n-6 in cultures with the most
effective EOCs (ANE and ALA) was more than doubled relative to the control, whilst the concentration
was intermediate with the addition of the rest of the treatments.
The pattern of effects of treatments on the vessel content of 18:3 n-3 at all incubation times (12, 24 and 48
h) were similar to the reported effects of treatments on the levels of 18:2 n-6 above. After 12 h the vessel
content of 18:3 n-3 increased significantly in response to EOCs in the sequence: CIT (7.0 g/100 g TFA)
> ALA, ANE, CIN, MEN, MYT (average 6.2 g/100 g TFA) and lowest in cultures supplemented with
VAN and the control (means 3.1g/100 g TFA). The values of 18:3 n-3 at 24 h decreased significantly in
response to EOCs in the order: control and VAN (1.7 g/100 g TFA) < BIS and EUC (2.2 g/100 g TFA) <
3-CAR, BOR, CIN, LIM, MYT, CYM and THU (3.0 g/100 g TFA) < ALA, ANE and MEN (3.9 g/100 g
TFA). After 48 h, the average level of 18:3 n-3 in cultures with the most effective EOCs (ANE and ALA)
tripled the concentration observed in the control, whilst the concentration was intermediate with the
addition of the rest of the treatments.
The effects of treatments on the concentration of selected C20 fatty acids are presented in Table 3.8. No
effect of treatment was found on the concentration of C20:4 n-6 in cultures at all times of incubation.
The levels of C20:5 n-3 decreased with time, being highest at 12 h and lowest at 48 h, in both the control
and in cultures with added EOCs. The effect of EOCs on the concentration of C20:5 n-3 at 12 h can be
ranked in ascending order as follows: control and VAN (2.1) < 3-CAR, BIS, CPY, LIM and CYM (2.3
g/100 g TFA) < ALA, ANE, CIN and EUC (2.6 g/100 g TFA) < BOR, CIT, MEN, MYT and THU (2.7
g/100 g TFA). After 24 h, the effects of EOCs on the concentration of C20:5 n-3 in a descending order
can be ranked as follows: ALA, ANE, BOR, EUC, MEN, MYT and THU (2.3 g/100 g TFA) > 3-CAR,
BIS, CPY, CIN, CIT, LIM and CYM (1.8 g/100 g TFA) > the control and VAN (1.7 g/100 g TFA).
Nevertheless, at 48 h period, the content of C20:5 n-3 in cultures with BOR (2.3 g/100 g TFA), followed
by ALA, ANE, EUC, MEN, MYT and THU (average 2.0 g/100 g TFA) were more than doubled and
doubled, respectively, relative to the control (1.0 g/100 g TFA).
116
The pattern of effects of treatments on the levels of C22:6 n-3 in vessels at all incubation times (12, 24
and 48 h) were similar to the reported effects of treatments on the levels of C20:5 n-3 above, with ALA,
ANE and BOR among the most effective compounds to maintain the highest levels of C22:6 n-3.
The concentrations of the sums of fatty acids (g/100 g TFA) and content of total fatty acid (mg/g) are
presented in Table 3.9. No effect of treatments was observed on the concentrations of remaining fatty
acids after 12 h except in cultures with added BIS and EUC, which increased it relative to the control. At
24 and 48 however, ALA, ANE, CIT, LIM, MEN and THU reduced the levels of RFA in cultures
compared to the control.
At 12 h the ∑SFA was significantly reduced by supplementation with CIT, BIS, BOR, CIN EUC, MEN,
MYT and THU (average 32.4 g/100 g TFA) relative to the control (35.0 g/100 g TFA). No effect of
treatment on ∑SFA was observed after 24 h. However, there was about 11% reduction of ∑SFA in
cultures with added BOR, CIT, MEN, MYT and THU compared to the control after 48 h. The effects of
EOCs on ∑SFA-18:0 was similar to the reported effects on ∑SFA; however, CYM which did not affect
∑SFA at 48 h caused 5% reduction in the content of ∑SFA-18:0 after 48 h relative to the control.
The content of ∑MUFA in cultures was reduced (P<0.001) with the addition of all EOCs at 12 except in
cultures with CPY and VAN, being lowest in cultures supplemented with CIT (10.7 g/100 g TFA)
relative to the control vessels (13.5). At 24 h, ∑MUFA concentration was highest in cultures with added
CIT (10.8 g/100 g TFA) compared to the control (6.6 g/100 g TFA), which was not different from VAN.
Except in vessels supplemented with CIN and VAN which had levels of ∑MUFA similar to the control,
the rest of the treatments increased ∑MUFA after 48 h.
The content of ∑PUFA decreased as incubation time increased (i.e. highest at 12 h and lowest at 48 h). At
24 h, the content of ∑PUFA in cultures were in the following decreasing order of significant magnitude:
ALA, ANE, CIT and MEN (average 10.9 g/100 g TFA) > 3-CAR, LIM, MYT, CYM and THU (9.5 g/100
g TFA) > BOR, BIS, CPY and EUC (8.0 g/100 g TFA) > VAN and the control (6.7 g/100 g TFA). After
48 h, the levels of ∑PUFA observed in cultures with ALA, ANE and MEN (9.1 g/100 g TFA), which
117
were the most effective EOCs, was more than double the concentration found in cultures with the control
(4.5 g/100 g TFA).
No effect of inclusion of VAN and CIN was found on TFA at 12, 24 and 48 h. However, all other EOCs
reduced (P<0.001) TFA relative to the control, with CPY, MEN and CYM (12 h), CIT, EUC and MYT
(24 h), and ALA and ANE (48 h), being the EOCs that elicited the greatest reduction of TFA compared to
the control (Table 3.9).
As indicated in Table 3.10, although no effect of treatments on ∑n-6/∑n-3 was observed at 12 h, it was
consistently reduced (P<0.001) in cultures with BIS, BOR, EUC, MYT, THU and VAN (mean values
0.3) at both 24 and 48 h relative to the control (average 0.4).
The ratio of PUFA to SFA (P: S) in cultures decreased with time of incubation. At both 12 and 24 h, the
P/S was increased (P<0.001) by all EOCs except EUC and VAN relative to the control (Table 3.10). At
48 h of incubation, the ratio of P/S in cultures with ALA, ANE, BOR, MEN, MYT and THU (EOCs with
the highest levels of P/S) tripled (0.3) the content of P/S in the control (0.1).
The biohydrogenation (g/100 g) of 18:2 n-6 and n-3 PUFA are presented in Table 3.11. The extent of
biohydrogenation of linoleic acid in the fermentation vessels increased as the time of incubation
progressed; being lowest at 12 h and highest at 48 h. At 12 h the disappearance of 18:2 n-6 from vessels
supplemented with EOCs can be ranked in the following increasing order: ALA, CIN, MYT and CIT
(52.1 g/100 g) > ANE, BOR, MEN, CYM and THU (61.3%) > LIM, EUC, CPY, BIS, 3-CAR, VAN and
the control (70.4). At 24 h, the biohydrogenation of 18:2 n-6 increased significantly in response to EOCs
(P<0.001) in the sequence: ALA (70.2 g/100 g) >ANE and CYM (73.1 g/100 g) > THU, MYT, MEN
(75.8 g/100 g) > 3-CAR, BOR, CIN and LIM (78.1 g/100 g) > CPY, EUC, VAN and the control (84.7
g/100 g). At 48 h, the protection of 18:2 n-6 from ruminal disappearance was least in the control, VAN
and CPY (average 89.3 g/100 g), highest in cultures with ALA (74.4 g/100 g) followed by ANE and
CYM (78.6), whilst rates were intermediate in the remaining EOCs.
The pattern of effects of EOCs on biohydrogenation of 18:3 n-3 was similar to their reported effects on
the disappearance of vessel content of 18:2 n-6 at all incubation times. After 12 h the biohydrogenation of
118
18:3 n-3 from vessels supplemented with EOCs can be ranked in the following increasing order: ALA,
CIN, and CIT (57.3 g/100 g) > ANE, BOR, MEN, CYM, MYT and THU (67.0%) and highest in the rest
of the treatments such as LIM, EUC, CPY, BIS, 3-CAR, VAN and the control (70.4). The
biohydrogenation values for 24 h in increasing response were: ALA (73.6 g/100 g) >ANE and CYM
(77.1 g/100 g) > THU, MYT, MEN (80.1 g/100 g) and levels were intermediate in the rest of the other
EOCs but highest in CPY, EUC, VAN and the control (84.7 g/100 g). At 48 h, the protection of 18:3 n-3
from ruminal disappearance was least in the control, VAN and CPY (average 94.3 g/100 g), highest in
cultures supplemented with ALA (79.0 g/100 g) followed by ANE and CYM (82.2 g/100 g), whilst it was
intermediate in the remaining EOCs.
The extent of disappearance of 20:5 n-3 in vessels increased as the time of incubation advanced, being
lowest at 12 h and highest at 48 h (Table 3.11). Biohydrogenation of C20:5 n-3 at 12 h of incubation in
increasing magnitude was as follows: ALA, MYT, CIT, CIN, BOR and THU (27.5 g/100 g) < ANE, BIS,
MEN and CYM (37.2 g/100 g) < 3-CAR, CPY, LIM, VAN and the control (46.5 g/100 g). After 24 h,
biohydrogenation increased significantly in response to EOCs (P<0.001) in the progression: control, 3-
CAR, CPY, CIN, LIM and VAN (46 g/100 g) and was highest in ALA, BOR, MYT and THU (62.9 g/100
g), with potential being intermediate in the other EOCs. After 48 h, biohydrogenation of C20:5 n-3 was
lowest in vessels with added ALA and THU (42 g/100 g) relative to the control (71.4 g/100 g).
The trend of biohydrogenation in the vessel content of C22:6 n-3 was similar to the reported trend in the
biohydrogenation of C20:5 n-3, with ALA, BOR and THU showing the highest (P<0.001) potential to
reduce the disappearance of C22:6 n-3 after 24 and 48 h, whilst 3-CAR, CPY and LIM, had the lowest
degree of protection of C22:6 n-3 from biohydrogenation relative to the control.
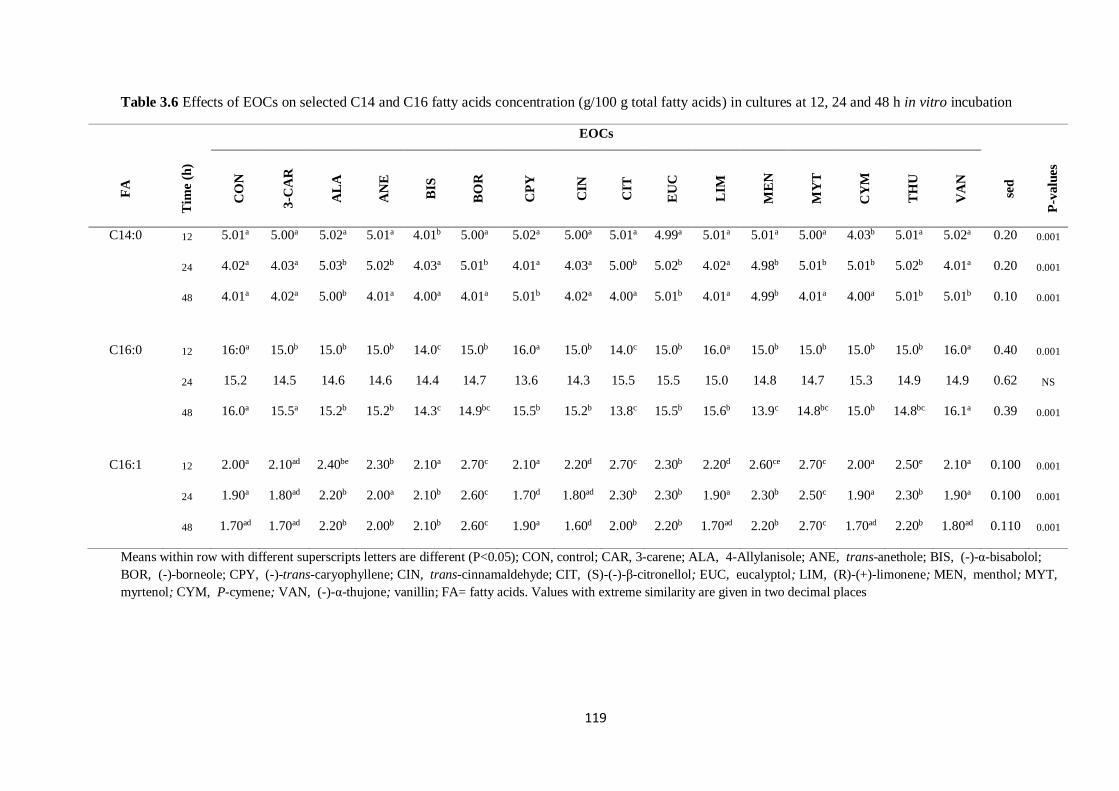
119
Table 3.6 Effects of EOCs on selected C14 and C16 fatty acids concentration (g/100 g total fatty acids) in cultures at 12, 24 and 48 h in vitro incubation
EOCs F
A
Tim
e (h
)
CO
N
3-C
AR
AL
A
AN
E
BIS
BO
R
CP
Y
CIN
CIT
EU
C
LIM
ME
N
MY
T
CY
M
TH
U
VA
N
sed
P-v
alu
es
C14:0 12 5.01a 5.00a
5.02a 5.01a
4.01b 5.00a
5.02a 5.00a
5.01a 4.99a
5.01a 5.01a
5.00a 4.03b
5.01a 5.02a
0.20 0.001
24 4.02a 4.03a
5.03b 5.02b
4.03a 5.01b
4.01a 4.03a
5.00b 5.02b
4.02a 4.98b
5.01b 5.01b
5.02b 4.01a
0.20 0.001
48 4.01a 4.02a
5.00b 4.01a
4.00a 4.01a
5.01b 4.02a
4.00a 5.01b
4.01a 4.99b
4.01a 4.00a
5.01b 5.01b
0.10 0.001
C16:0 12 16:0a 15.0b
15.0b 15.0b
14.0c 15.0b
16.0a 15.0b
14.0c 15.0b
16.0a 15.0b
15.0b 15.0b
15.0b 16.0a
0.40 0.001
24 15.2 14.5 14.6 14.6 14.4 14.7 13.6 14.3 15.5 15.5 15.0 14.8 14.7 15.3 14.9 14.9 0.62 NS
48 16.0a 15.5a 15.2b
15.2b 14.3c
14.9bc 15.5b
15.2b 13.8c
15.5b 15.6b
13.9c 14.8bc
15.0b 14.8bc
16.1a 0.39 0.001
C16:1 12 2.00a 2.10ad
2.40be 2.30b
2.10a 2.70c
2.10a 2.20d
2.70c 2.30b
2.20d 2.60ce
2.70c 2.00a
2.50e 2.10a
0.100 0.001
24 1.90a 1.80ad
2.20b 2.00a
2.10b 2.60c
1.70d 1.80ad
2.30b 2.30b
1.90a 2.30b
2.50c 1.90a
2.30b 1.90a
0.100 0.001
48 1.70ad 1.70ad
2.20b 2.00b
2.10b 2.60c
1.90a 1.60d
2.00b 2.20b
1.70ad 2.20b
2.70c 1.70ad
2.20b 1.80ad
0.110 0.001
Means within row with different superscripts letters are different (P<0.05); CON, control; CAR, 3-carene; ALA, 4-Allylanisole; ANE, trans-anethole; BIS, (-)-α-bisabolol;
BOR, (-)-borneole; CPY, (-)-trans-caryophyllene; CIN, trans-cinnamaldehyde; CIT, (S)-(-)-β-citronellol; EUC, eucalyptol; LIM, (R)-(+)-limonene; MEN, menthol; MYT,
myrtenol; CYM, P-cymene; VAN, (-)-α-thujone; vanillin; FA= fatty acids. Values with extreme similarity are given in two decimal places
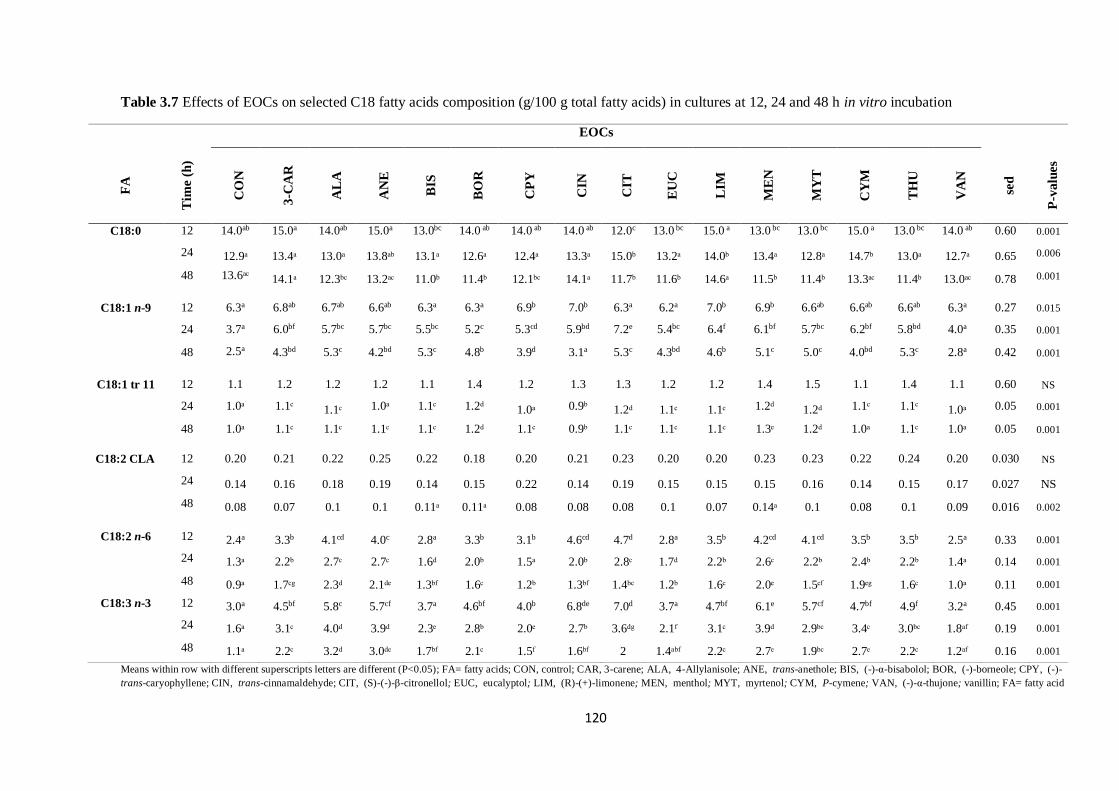
120
Table 3.7 Effects of EOCs on selected C18 fatty acids composition (g/100 g total fatty acids) in cultures at 12, 24 and 48 h in vitro incubation
EOCs F
A
Tim
e (h
)
CO
N
3-C
AR
AL
A
AN
E
BIS
BO
R
CP
Y
CIN
CIT
EU
C
LIM
ME
N
MY
T
CY
M
TH
U
VA
N
sed
P-v
alu
es
C18:0 12 14.0ab 15.0a 14.0ab 15.0a 13.0bc 14.0 ab 14.0 ab 14.0 ab 12.0c 13.0 bc 15.0 a 13.0 bc 13.0 bc 15.0 a 13.0 bc 14.0 ab 0.60 0.001
24 12.9ᵃ 13.4ᵃ 13.0ᵃ 13.8ᵃᵇ 13.1ᵃ 12.6ᵃ 12.4ᵃ 13.3ᵃ 15.0ᵇ 13.2ᵃ 14.0ᵇ 13.4ᵃ 12.8ᵃ 14.7ᵇ 13.0ᵃ 12.7ᵃ 0.65 0.006
48 13.6ᵃᶜ 14.1ᵃ 12.3ᵇᶜ 13.2ᵃᶜ 11.0ᵇ 11.4ᵇ 12.1ᵇᶜ 14.1ᵃ 11.7ᵇ 11.6ᵇ 14.6ᵃ 11.5ᵇ 11.4ᵇ 13.3ᵃᶜ 11.4ᵇ 13.0ᵃᶜ 0.78 0.001
C18:1 n-9 12 6.3a 6.8ab 6.7ab 6.6ab 6.3a 6.3a 6.9b 7.0b 6.3a 6.2a 7.0b 6.9b 6.6ab 6.6ab 6.6ab 6.3a 0.27 0.015
24 3.7a 6.0bf 5.7bc 5.7bc 5.5bc 5.2c 5.3cd 5.9bd 7.2e 5.4bc 6.4f 6.1bf 5.7bc 6.2bf 5.8bd 4.0a 0.35 0.001
48 2.5a 4.3bd 5.3c 4.2bd 5.3c 4.8b 3.9d 3.1a 5.3c 4.3bd 4.6b 5.1c 5.0c 4.0bd 5.3c 2.8a 0.42 0.001
C18:1 tr 11 12 1.1 1.2 1.2 1.2 1.1 1.4 1.2 1.3 1.3 1.2 1.2 1.4 1.5 1.1 1.4 1.1 0.60 NS
24 1.0ᵃ 1.1ᶜ 1.1ᶜ 1.0ᵃ 1.1ᶜ 1.2ᵈ 1.0ᵃ 0.9ᵇ 1.2ᵈ 1.1ᶜ 1.1ᶜ 1.2ᵈ 1.2ᵈ 1.1ᶜ 1.1ᶜ 1.0ᵃ 0.05 0.001
48 1.0ᵃ 1.1ᶜ 1.1ᶜ 1.1ᶜ 1.1ᶜ 1.2ᵈ 1.1ᶜ 0.9ᵇ 1.1ᶜ 1.1ᶜ 1.1ᶜ 1.3ᵉ 1.2ᵈ 1.0ᵃ 1.1ᶜ 1.0ᵃ 0.05 0.001
C18:2 CLA 12 0.20 0.21 0.22 0.25 0.22 0.18 0.20 0.21 0.23 0.20 0.20 0.23 0.23 0.22 0.24 0.20 0.030 NS
24 0.14 0.16 0.18 0.19 0.14 0.15 0.22 0.14 0.19 0.15 0.15 0.15 0.16 0.14 0.15 0.17 0.027 NS
48 0.08 0.07 0.1 0.1 0.11ᵃ 0.11ᵃ 0.08 0.08 0.08 0.1 0.07 0.14ᵃ 0.1 0.08 0.1 0.09 0.016 0.002
C18:2 n-6 12 2.4a 3.3b 4.1cd 4.0c 2.8a 3.3b 3.1b 4.6cd 4.7d 2.8a 3.5b 4.2cd 4.1cd 3.5b 3.5b 2.5a 0.33 0.001
24 1.3ᵃ 2.2ᵇ 2.7ᶜ 2.7ᶜ 1.6ᵈ 2.0ᵇ 1.5ᵃ 2.0ᵇ 2.8ᶜ 1.7ᵈ 2.2ᵇ 2.6ᶜ 2.2ᵇ 2.4ᵇ 2.2ᵇ 1.4ᵃ 0.14 0.001
48 0.9ᵃ 1.7ᶜᵍ 2.3ᵈ 2.1ᵈᵉ 1.3ᵇᶠ 1.6ᶜ 1.2ᵇ 1.3ᵇᶠ 1.4ᵇᶜ 1.2ᵇ 1.6ᶜ 2.0ᵉ 1.5ᶜᶠ 1.9ᵉᵍ 1.6ᶜ 1.0ᵃ 0.11 0.001
C18:3 n-3 12 3.0a 4.5bf 5.8c 5.7cf 3.7a 4.6bf 4.0b 6.8de 7.0d 3.7a 4.7bf 6.1e 5.7cf 4.7bf 4.9f 3.2a 0.45 0.001
24 1.6ᵃ 3.1ᶜ 4.0ᵈ 3.9ᵈ 2.3ᵉ 2.8ᵇ 2.0ᵉ 2.7ᵇ 3.6ᵈ g 2.1ᶠ 3.1ᶜ 3.9ᵈ 2.9ᵇᶜ 3.4ᶜ 3.0ᵇᶜ 1.8ᵃᶠ 0.19 0.001
48 1.1ᵃ 2.2ᶜ 3.2ᵈ 3.0ᵈᵉ 1.7ᵇᶠ 2.1ᶜ 1.5ᶠ 1.6ᵇᶠ 2 1.4ᵃᵇᶠ 2.2ᶜ 2.7ᵉ 1.9ᵇᶜ 2.7ᵉ 2.2ᶜ 1.2ᵃᶠ 0.16 0.001
Means within row with different superscripts letters are different (P<0.05); FA= fatty acids; CON, control; CAR, 3-carene; ALA, 4-Allylanisole; ANE, trans-anethole; BIS, (-)-α-bisabolol; BOR, (-)-borneole; CPY, (-)-
trans-caryophyllene; CIN, trans-cinnamaldehyde; CIT, (S)-(-)-β-citronellol; EUC, eucalyptol; LIM, (R)-(+)-limonene; MEN, menthol; MYT, myrtenol; CYM, P-cymene; VAN, (-)-α-thujone; vanillin; FA= fatty acid
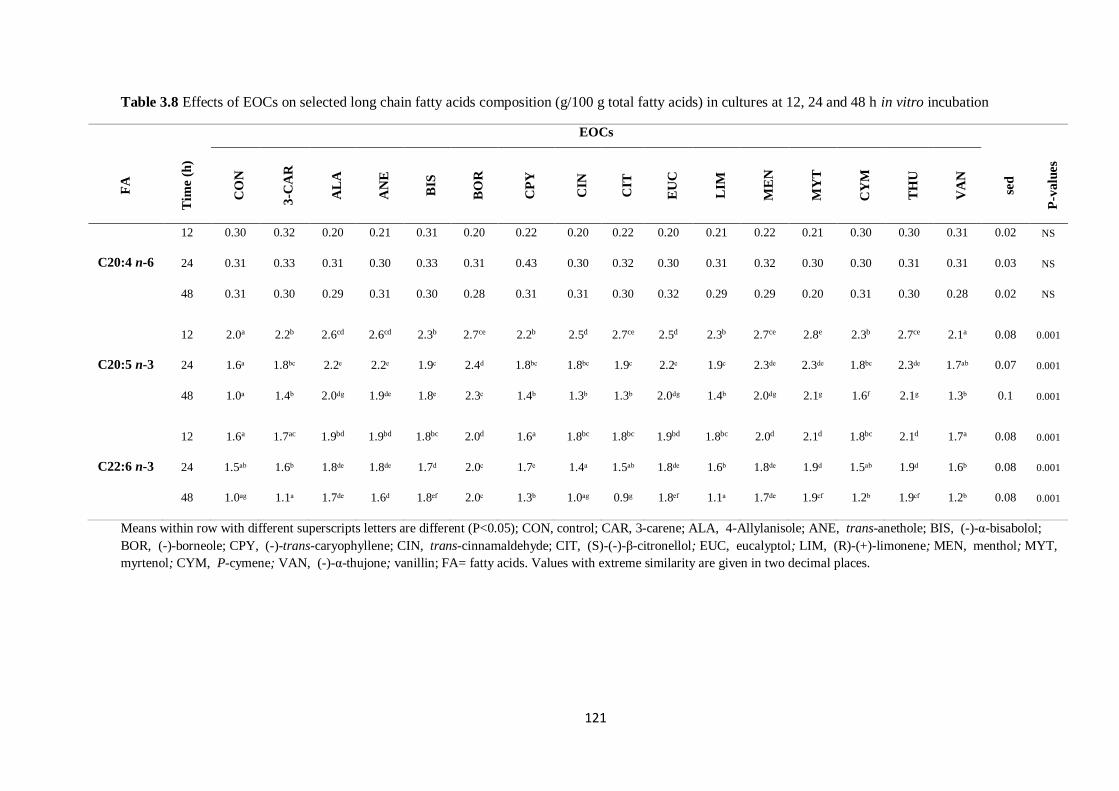
121
Table 3.8 Effects of EOCs on selected long chain fatty acids composition (g/100 g total fatty acids) in cultures at 12, 24 and 48 h in vitro incubation
EOCs F
A
Tim
e (h
)
CO
N
3-C
AR
AL
A
AN
E
BIS
BO
R
CP
Y
CIN
CIT
EU
C
LIM
ME
N
MY
T
CY
M
TH
U
VA
N
sed
P-v
alu
es
12 0.30 0.32 0.20 0.21 0.31 0.20 0.22 0.20 0.22 0.20 0.21 0.22 0.21 0.30 0.30 0.31 0.02 NS
C20:4 n-6 24 0.31 0.33 0.31 0.30 0.33 0.31 0.43 0.30 0.32 0.30 0.31 0.32 0.30 0.30 0.31 0.31 0.03 NS
48 0.31 0.30 0.29 0.31 0.30 0.28 0.31 0.31 0.30 0.32 0.29 0.29 0.20 0.31 0.30 0.28 0.02 NS
12 2.0a 2.2b 2.6cd 2.6cd 2.3b 2.7ce 2.2b 2.5d 2.7ce 2.5d 2.3b 2.7ce 2.8e 2.3b 2.7ce 2.1a 0.08 0.001
C20:5 n-3 24 1.6ᵃ 1.8ᵇᶜ 2.2ᵉ 2.2ᵉ 1.9ᶜ 2.4ᵈ 1.8ᵇᶜ 1.8ᵇᶜ 1.9ᶜ 2.2ᵉ 1.9ᶜ 2.3ᵈᵉ 2.3ᵈᵉ 1.8ᵇᶜ 2.3ᵈᵉ 1.7ᵃᵇ 0.07 0.001
48 1.0ᵃ 1.4ᵇ 2.0ᵈ g 1.9ᵈᵉ 1.8ᵉ 2.3ᶜ 1.4ᵇ 1.3ᵇ 1.3ᵇ 2.0ᵈ g 1.4ᵇ 2.0ᵈ g 2.1 g 1.6ᶠ 2.1 g 1.3ᵇ 0.1 0.001
12 1.6a 1.7ac 1.9bd 1.9bd 1.8bc 2.0d 1.6a 1.8bc 1.8bc 1.9bd 1.8bc 2.0d 2.1d 1.8bc 2.1d 1.7a 0.08 0.001
C22:6 n-3 24 1.5ᵃᵇ 1.6ᵇ 1.8ᵈᵉ 1.8ᵈᵉ 1.7ᵈ 2.0ᶜ 1.7ᵉ 1.4ᵃ 1.5ᵃᵇ 1.8ᵈᵉ 1.6ᵇ 1.8ᵈᵉ 1.9ᵈ 1.5ᵃᵇ 1.9ᵈ 1.6ᵇ 0.08 0.001
48 1.0ᵃ g 1.1ᵃ 1.7ᵈᵉ 1.6ᵈ 1.8ᵉᶠ 2.0ᶜ 1.3ᵇ 1.0ᵃ g 0.9 g 1.8ᵉᶠ 1.1ᵃ 1.7ᵈᵉ 1.9ᶜᶠ 1.2ᵇ 1.9ᶜᶠ 1.2ᵇ 0.08 0.001
Means within row with different superscripts letters are different (P<0.05); CON, control; CAR, 3-carene; ALA, 4-Allylanisole; ANE, trans-anethole; BIS, (-)-α-bisabolol;
BOR, (-)-borneole; CPY, (-)-trans-caryophyllene; CIN, trans-cinnamaldehyde; CIT, (S)-(-)-β-citronellol; EUC, eucalyptol; LIM, (R)-(+)-limonene; MEN, menthol; MYT,
myrtenol; CYM, P-cymene; VAN, (-)-α-thujone; vanillin; FA= fatty acids. Values with extreme similarity are given in two decimal places.
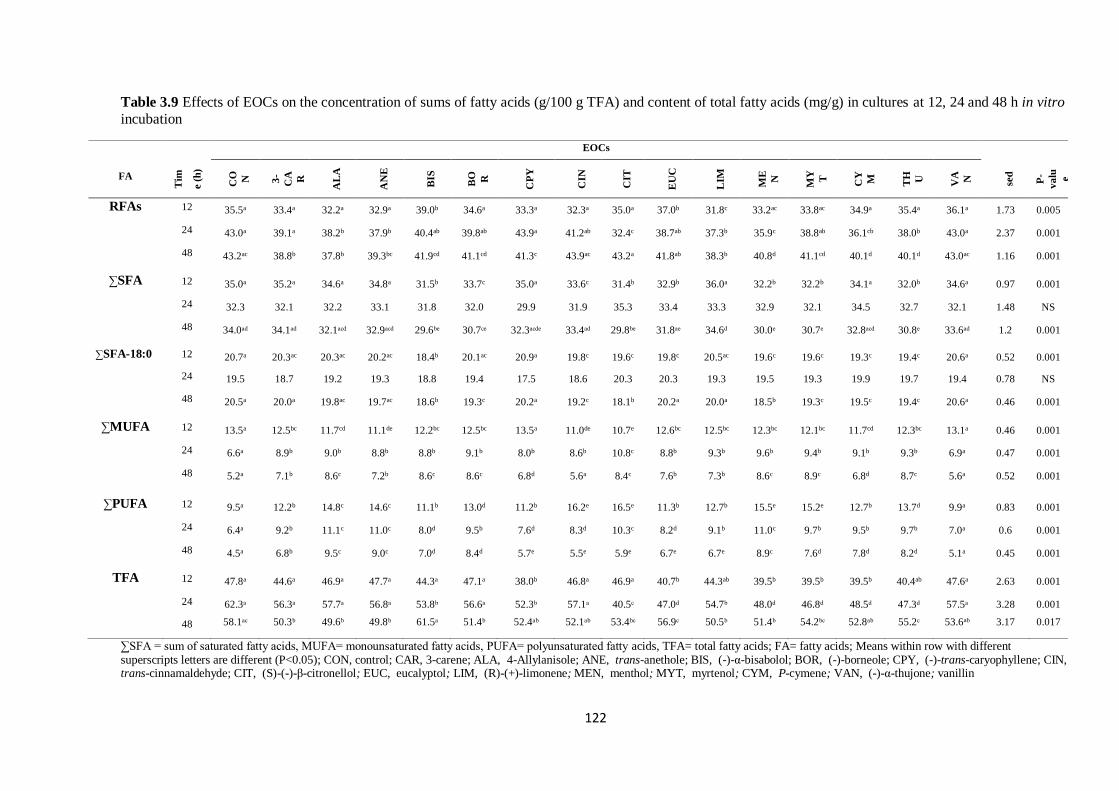
122
Table 3.9 Effects of EOCs on the concentration of sums of fatty acids (g/100 g TFA) and content of total fatty acids (mg/g) in cultures at 12, 24 and 48 h in vitro
incubation
EOCs
FA T
im
e (
h)
CO N
3-
CA R
AL
A
AN
E
BIS
BO R
CP
Y
CIN
CIT
EU
C
LIM
ME
N
MY T
CY
M
TH U
VA N
sed
P-
va
lu e
RFAs 12 35.5a 33.4a 32.2a 32.9a 39.0b 34.6a 33.3a 32.3a 35.0a 37.0b 31.8c 33.2ac 33.8ac 34.9a 35.4a 36.1a 1.73 0.005
24 43.0a 39.1a 38.2b 37.9b 40.4ab 39.8ab 43.9a 41.2ab 32.4c 38.7ab 37.3b 35.9c 38.8ab 36.1cb 38.0b 43.0a 2.37 0.001
48 43.2ac 38.8b 37.8b 39.3bc 41.9cd 41.1cd 41.3c 43.9ac 43.2a 41.8ab 38.3b 40.8d 41.1cd 40.1d 40.1d 43.0ac 1.16 0.001
∑SFA 12 35.0a 35.2a 34.6a 34.8a 31.5b 33.7c 35.0a 33.6c 31.4b 32.9b 36.0a 32.2b 32.2b 34.1a 32.0b 34.6a 0.97 0.001
24 32.3 32.1 32.2 33.1 31.8 32.0 29.9 31.9 35.3 33.4 33.3 32.9 32.1 34.5 32.7 32.1 1.48 NS
48 34.0ᵃᵈ 34.1ᵃᵈ 32.1ᵃᶜᵈ 32.9ᵃᶜᵈ 29.6ᵇᵉ 30.7ᶜᵉ 32.3ᵃᶜᵈᵉ 33.4ᵃᵈ 29.8ᵇᵉ 31.8ᵃᵉ 34.6ᵈ 30.0ᵉ 30.7ᵉ 32.8ᵃᶜᵈ 30.8ᵉ 33.6ᵃᵈ 1.2 0.001
∑SFA-18:0 12 20.7a 20.3ac 20.3ac 20.2ac 18.4b 20.1ac 20.9a 19.8c 19.6c 19.8c 20.5ac 19.6c 19.6c 19.3c 19.4c 20.6a 0.52 0.001
24 19.5 18.7 19.2 19.3 18.8 19.4 17.5 18.6 20.3 20.3 19.3 19.5 19.3 19.9 19.7 19.4 0.78 NS
48 20.5a 20.0a 19.8ac 19.7ac 18.6b 19.3c 20.2a 19.2c 18.1b 20.2a 20.0a 18.5b 19.3c 19.5c 19.4c 20.6a 0.46 0.001
∑MUFA 12 13.5a 12.5bc 11.7cd 11.1de 12.2bc 12.5bc 13.5a 11.0de 10.7e 12.6bc 12.5bc 12.3bc 12.1bc 11.7cd 12.3bc 13.1a 0.46 0.001
24 6.6a 8.9b 9.0b 8.8b 8.8b 9.1b 8.0b 8.6b 10.8c 8.8b 9.3b 9.6b 9.4b 9.1b 9.3b 6.9a 0.47 0.001
48 5.2a 7.1b 8.6c 7.2b 8.6c 8.6c 6.8d 5.6a 8.4c 7.6b 7.3b 8.6c 8.9c 6.8d 8.7c 5.6a 0.52 0.001
∑PUFA 12 9.5a 12.2b 14.8c 14.6c 11.1b 13.0d 11.2b 16.2e 16.5e 11.3b 12.7b 15.5e 15.2e 12.7b 13.7d 9.9a 0.83 0.001
24 6.4a 9.2b 11.1c 11.0c 8.0d 9.5b 7.6d 8.3d 10.3c 8.2d 9.1b 11.0c 9.7b 9.5b 9.7b 7.0a 0.6 0.001
48 4.5a 6.8b 9.5c 9.0c 7.0d 8.4d 5.7e 5.5e 5.9e 6.7e 6.7e 8.9c 7.6d 7.8d 8.2d 5.1a 0.45 0.001
TFA 12 47.8a 44.6a 46.9a 47.7a 44.3a 47.1a 38.0b 46.8a 46.9a 40.7b 44.3ab 39.5b 39.5b 39.5b 40.4ab 47.6a 2.63 0.001
24 62.3ᵃ 56.3ᵃ 57.7ᵃ 56.8ᵃ 53.8ᵇ 56.6ᵃ 52.3ᵇ 57.1ᵃ 40.5ᶜ 47.0ᵈ 54.7ᵇ 48.0ᵈ 46.8ᵈ 48.5ᵈ 47.3ᵈ 57.5ᵃ 3.28 0.001
48 58.1ᵃᶜ 50.3ᵇ 49.6ᵇ 49.8ᵇ 61.5ᵃ 51.4ᵇ 52.4ᵃᵇ 52.1ᵃᵇ 53.4ᵇᶜ 56.9ᶜ 50.5ᵇ 51.4ᵇ 54.2ᵇᶜ 52.8ᵃᵇ 55.2ᶜ 53.6aᵇ 3.17 0.017
∑SFA = sum of saturated fatty acids, MUFA= monounsaturated fatty acids, PUFA= polyunsaturated fatty acids, TFA= total fatty acids; FA= fatty acids; Means within row with different superscripts letters are different (P<0.05); CON, control; CAR, 3-carene; ALA, 4-Allylanisole; ANE, trans-anethole; BIS, (-)-α-bisabolol; BOR, (-)-borneole; CPY, (-)-trans-caryophyllene; CIN, trans-cinnamaldehyde; CIT, (S)-(-)-β-citronellol; EUC, eucalyptol; LIM, (R)-(+)-limonene; MEN, menthol; MYT, myrtenol; CYM, P-cymene; VAN, (-)-α-thujone; vanillin
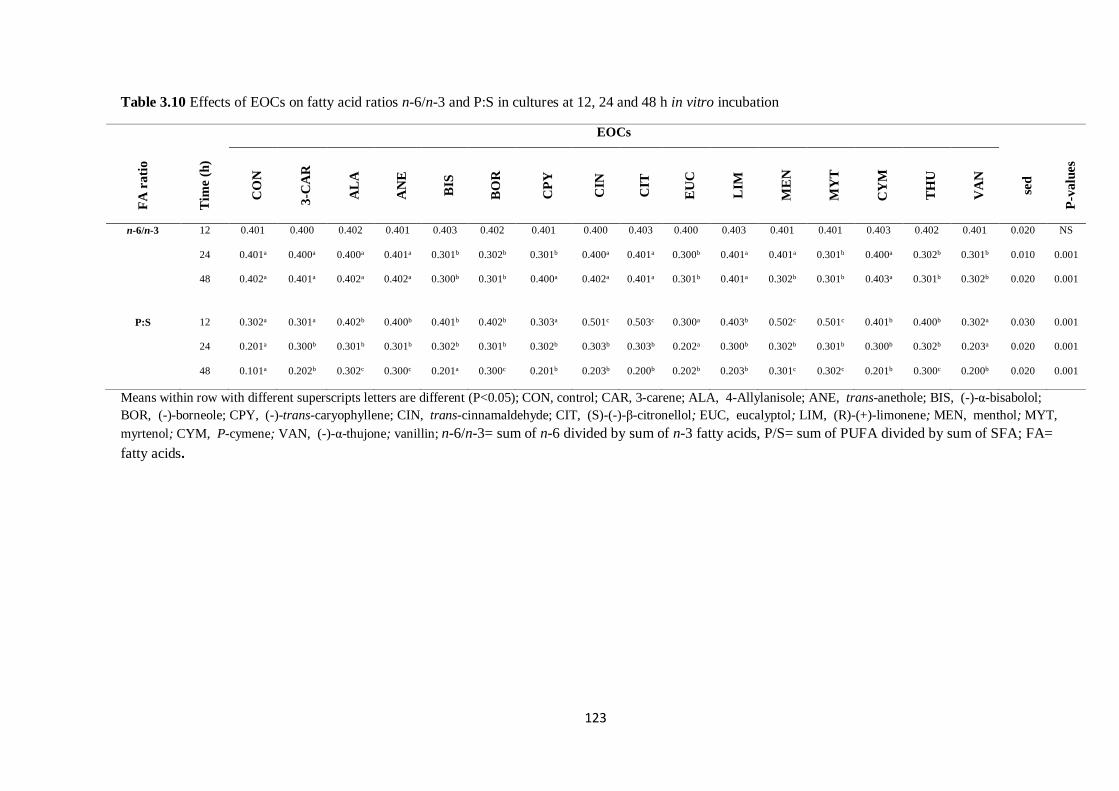
123
Table 3.10 Effects of EOCs on fatty acid ratios n-6/n-3 and P:S in cultures at 12, 24 and 48 h in vitro incubation
EOCs F
A r
ati
o
Tim
e (h
)
CO
N
3-C
AR
AL
A
AN
E
BIS
BO
R
CP
Y
CIN
CIT
EU
C
LIM
ME
N
MY
T
CY
M
TH
U
VA
N
sed
P-v
alu
es
n-6/n-3 12 0.401 0.400 0.402 0.401 0.403 0.402 0.401 0.400 0.403 0.400 0.403 0.401 0.401 0.403 0.402 0.401 0.020 NS
24 0.401a 0.400a 0.400a 0.401a 0.301b 0.302b 0.301b 0.400a 0.401a 0.300b 0.401a 0.401a 0.301b 0.400a 0.302b 0.301b 0.010 0.001
48 0.402a 0.401a 0.402a 0.402a 0.300b 0.301b 0.400a 0.402a 0.401a 0.301b 0.401a 0.302b 0.301b 0.403a 0.301b 0.302b 0.020 0.001
P:S 12 0.302a 0.301a 0.402b 0.400b 0.401b 0.402b 0.303a 0.501c 0.503c 0.300a 0.403b 0.502c 0.501c 0.401b 0.400b 0.302a 0.030 0.001
24 0.201a 0.300b 0.301b 0.301b 0.302b 0.301b 0.302b 0.303b 0.303b 0.202a 0.300b 0.302b 0.301b 0.300b 0.302b 0.203a 0.020 0.001
48 0.101a 0.202b 0.302c 0.300c 0.201a 0.300c 0.201b 0.203b 0.200b 0.202b 0.203b 0.301c 0.302c 0.201b 0.300c 0.200b 0.020 0.001
Means within row with different superscripts letters are different (P<0.05); CON, control; CAR, 3-carene; ALA, 4-Allylanisole; ANE, trans-anethole; BIS, (-)-α-bisabolol;
BOR, (-)-borneole; CPY, (-)-trans-caryophyllene; CIN, trans-cinnamaldehyde; CIT, (S)-(-)-β-citronellol; EUC, eucalyptol; LIM, (R)-(+)-limonene; MEN, menthol; MYT,
myrtenol; CYM, P-cymene; VAN, (-)-α-thujone; vanillin; n-6/n-3= sum of n-6 divided by sum of n-3 fatty acids, P/S= sum of PUFA divided by sum of SFA; FA=
fatty acids.
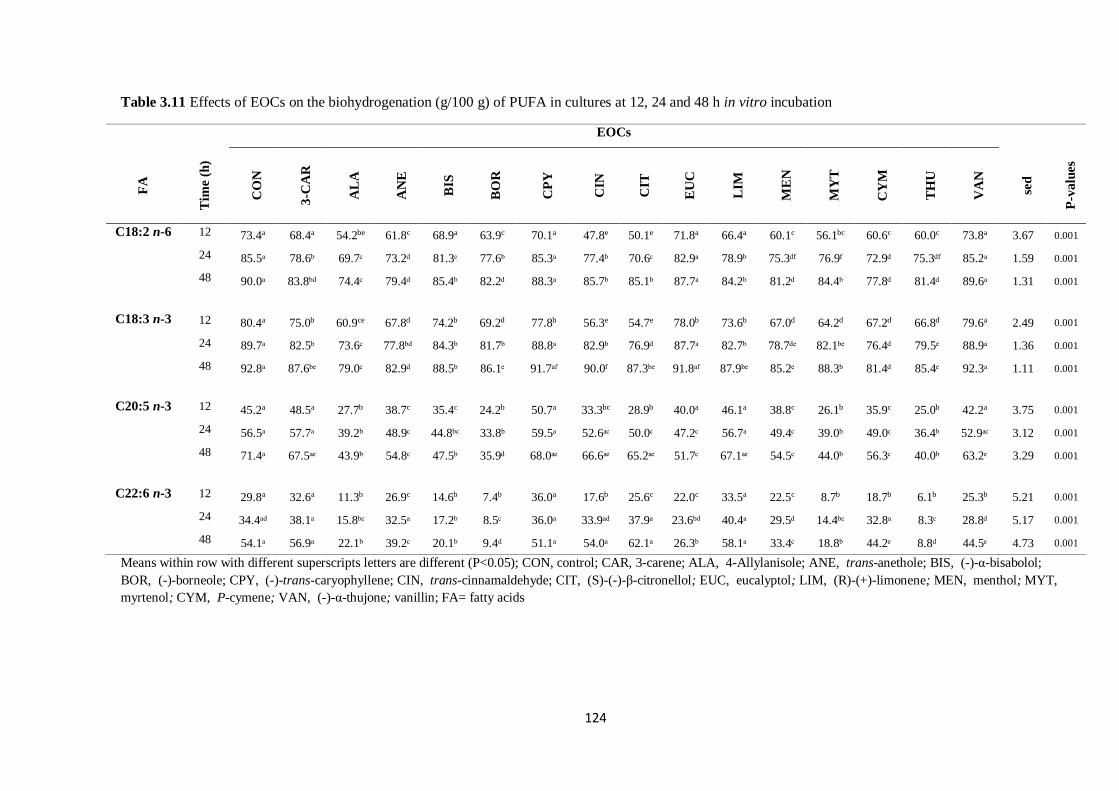
124
Table 3.11 Effects of EOCs on the biohydrogenation (g/100 g) of PUFA in cultures at 12, 24 and 48 h in vitro incubation
EOCs F
A
Tim
e (h
)
CO
N
3-C
AR
AL
A
AN
E
BIS
BO
R
CP
Y
CIN
CIT
EU
C
LIM
ME
N
MY
T
CY
M
TH
U
VA
N
sed
P-v
alu
es
C18:2 n-6 12 73.4a 68.4a 54.2be 61.8c 68.9a 63.9c 70.1a 47.8e 50.1e 71.8a 66.4a 60.1c 56.1bc 60.6c 60.0c 73.8a 3.67 0.001
24 85.5ᵃ 78.6ᵇ 69.7ᶜ 73.2ᵈ 81.3ᵉ 77.6ᵇ 85.3ᵃ 77.4ᵇ 70.6ᶜ 82.9ᵃ 78.9ᵇ 75.3ᵈᶠ 76.9ᶠ 72.9ᵈ 75.3ᵈᶠ 85.2ᵃ 1.59 0.001
48 90.0ᵃ 83.8ᵇᵈ 74.4ᶜ 79.4ᵈ 85.4ᵇ 82.2ᵈ 88.3ᵃ 85.7ᵇ 85.1ᵇ 87.7ᵃ 84.2ᵇ 81.2ᵈ 84.4ᵇ 77.8ᵈ 81.4ᵈ 89.6ᵃ 1.31 0.001
C18:3 n-3 12 80.4a 75.0b 60.9ce 67.8d 74.2b 69.2d 77.8b 56.3e 54.7e 78.0b 73.6b 67.0d 64.2d 67.2d 66.8d 79.6a 2.49 0.001
24 89.7ᵃ 82.5ᵇ 73.6ᶜ 77.8ᵇᵈ 84.3ᵇ 81.7ᵇ 88.8ᵃ 82.9ᵇ 76.9ᵈ 87.7ᵃ 82.7ᵇ 78.7ᵈᵉ 82.1ᵇᵉ 76.4ᵈ 79.5ᵉ 88.9ᵃ 1.36 0.001
48 92.8ᵃ 87.6ᵇᵉ 79.0ᶜ 82.9ᵈ 88.5ᵇ 86.1ᵉ 91.7ᵃᶠ 90.0ᶠ 87.3ᵇᵉ 91.8ᵃᶠ 87.9ᵇᵉ 85.2ᵉ 88.3ᵇ 81.4ᵈ 85.4ᵉ 92.3ᵃ 1.11 0.001
C20:5 n-3 12 45.2a 48.5a 27.7b 38.7c 35.4c 24.2b 50.7a 33.3bc 28.9b 40.0a 46.1a 38.8c 26.1b 35.9c 25.0b 42.2a 3.75 0.001
24 56.5ᵃ 57.7ᵃ 39.2ᵇ 48.9ᶜ 44.8ᵇᶜ 33.8ᵇ 59.5ᵃ 52.6ᵃᶜ 50.0ᶜ 47.2ᶜ 56.7ᵃ 49.4ᶜ 39.0ᵇ 49.0ᶜ 36.4ᵇ 52.9ᵃᶜ 3.12 0.001
48 71.4ᵃ 67.5ᵃᵉ 43.9ᵇ 54.8ᶜ 47.5ᵇ 35.9ᵈ 68.0ᵃᵉ 66.6ᵃᵉ 65.2ᵃᵉ 51.7ᶜ 67.1ᵃᵉ 54.5ᶜ 44.0ᵇ 56.3ᶜ 40.0ᵇ 63.2ᵉ 3.29 0.001
C22:6 n-3 12 29.8a 32.6a 11.3b 26.9c 14.6b 7.4b 36.0a 17.6b 25.6c 22.0c 33.5a 22.5c 8.7b 18.7b 6.1b 25.3b 5.21 0.001
24 34.4ᵃᵈ 38.1ᵃ 15.8ᵇᶜ 32.5ᵃ 17.2ᵇ 8.5ᶜ 36.0ᵃ 33.9ᵃᵈ 37.9ᵃ 23.6ᵇᵈ 40.4ᵃ 29.5ᵈ 14.4ᵇᶜ 32.8ᵃ 8.3ᶜ 28.8ᵈ 5.17 0.001
48 54.1ᵃ 56.9ᵃ 22.1ᵇ 39.2ᶜ 20.1ᵇ 9.4ᵈ 51.1ᵃ 54.0ᵃ 62.1ᵃ 26.3ᵇ 58.1ᵃ 33.4ᶜ 18.8ᵇ 44.2ᵉ 8.8ᵈ 44.5ᵉ 4.73 0.001
Means within row with different superscripts letters are different (P<0.05); CON, control; CAR, 3-carene; ALA, 4-Allylanisole; ANE, trans-anethole; BIS, (-)-α-bisabolol;
BOR, (-)-borneole; CPY, (-)-trans-caryophyllene; CIN, trans-cinnamaldehyde; CIT, (S)-(-)-β-citronellol; EUC, eucalyptol; LIM, (R)-(+)-limonene; MEN, menthol; MYT,
myrtenol; CYM, P-cymene; VAN, (-)-α-thujone; vanillin; FA= fatty acids
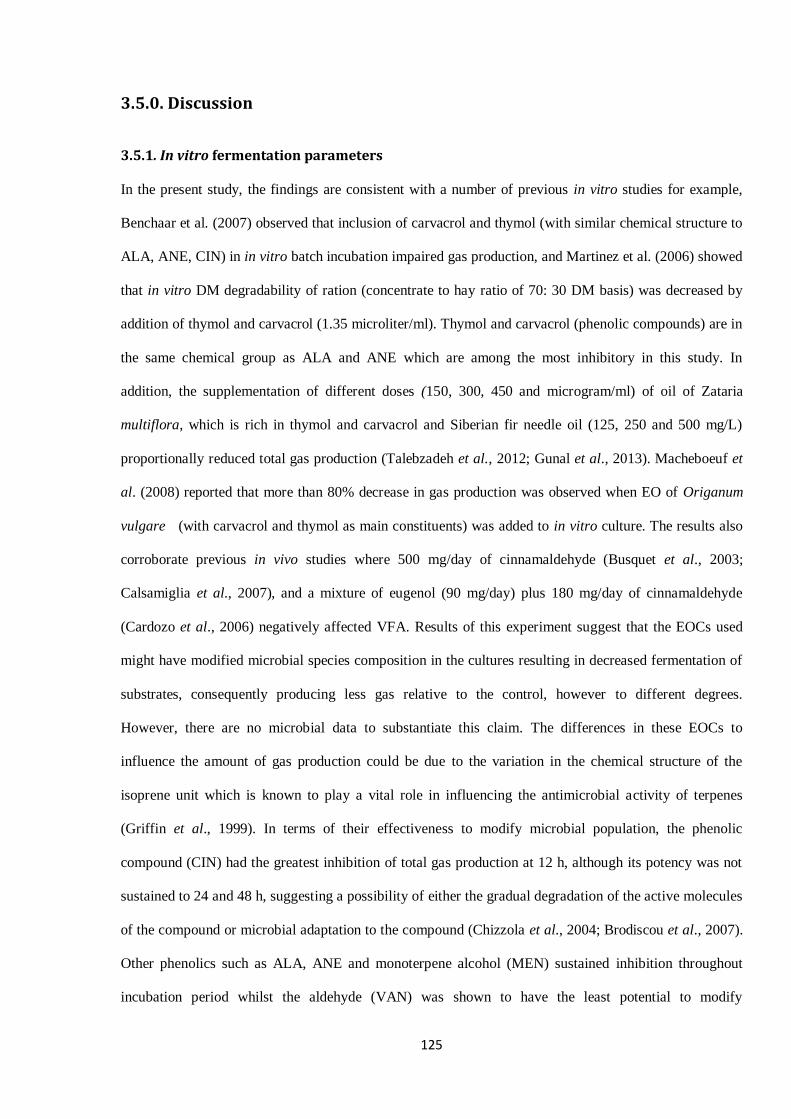
125
3.5.0. Discussion
3.5.1. In vitro fermentation parameters
In the present study, the findings are consistent with a number of previous in vitro studies for example,
Benchaar et al. (2007) observed that inclusion of carvacrol and thymol (with similar chemical structure to
ALA, ANE, CIN) in in vitro batch incubation impaired gas production, and Martinez et al. (2006) showed
that in vitro DM degradability of ration (concentrate to hay ratio of 70: 30 DM basis) was decreased by
addition of thymol and carvacrol (1.35 microliter/ml). Thymol and carvacrol (phenolic compounds) are in
the same chemical group as ALA and ANE which are among the most inhibitory in this study. In
addition, the supplementation of different doses (150, 300, 450 and microgram/ml) of oil of Zataria
multiflora, which is rich in thymol and carvacrol and Siberian fir needle oil (125, 250 and 500 mg/L)
proportionally reduced total gas production (Talebzadeh et al., 2012; Gunal et al., 2013). Macheboeuf et
al. (2008) reported that more than 80% decrease in gas production was observed when EO of Origanum
vulgare (with carvacrol and thymol as main constituents) was added to in vitro culture. The results also
corroborate previous in vivo studies where 500 mg/day of cinnamaldehyde (Busquet et al., 2003;
Calsamiglia et al., 2007), and a mixture of eugenol (90 mg/day) plus 180 mg/day of cinnamaldehyde
(Cardozo et al., 2006) negatively affected VFA. Results of this experiment suggest that the EOCs used
might have modified microbial species composition in the cultures resulting in decreased fermentation of
substrates, consequently producing less gas relative to the control, however to different degrees.
However, there are no microbial data to substantiate this claim. The differences in these EOCs to
influence the amount of gas production could be due to the variation in the chemical structure of the
isoprene unit which is known to play a vital role in influencing the antimicrobial activity of terpenes
(Griffin et al., 1999). In terms of their effectiveness to modify microbial population, the phenolic
compound (CIN) had the greatest inhibition of total gas production at 12 h, although its potency was not
sustained to 24 and 48 h, suggesting a possibility of either the gradual degradation of the active molecules
of the compound or microbial adaptation to the compound (Chizzola et al., 2004; Brodiscou et al., 2007).
Other phenolics such as ALA, ANE and monoterpene alcohol (MEN) sustained inhibition throughout
incubation period whilst the aldehyde (VAN) was shown to have the least potential to modify
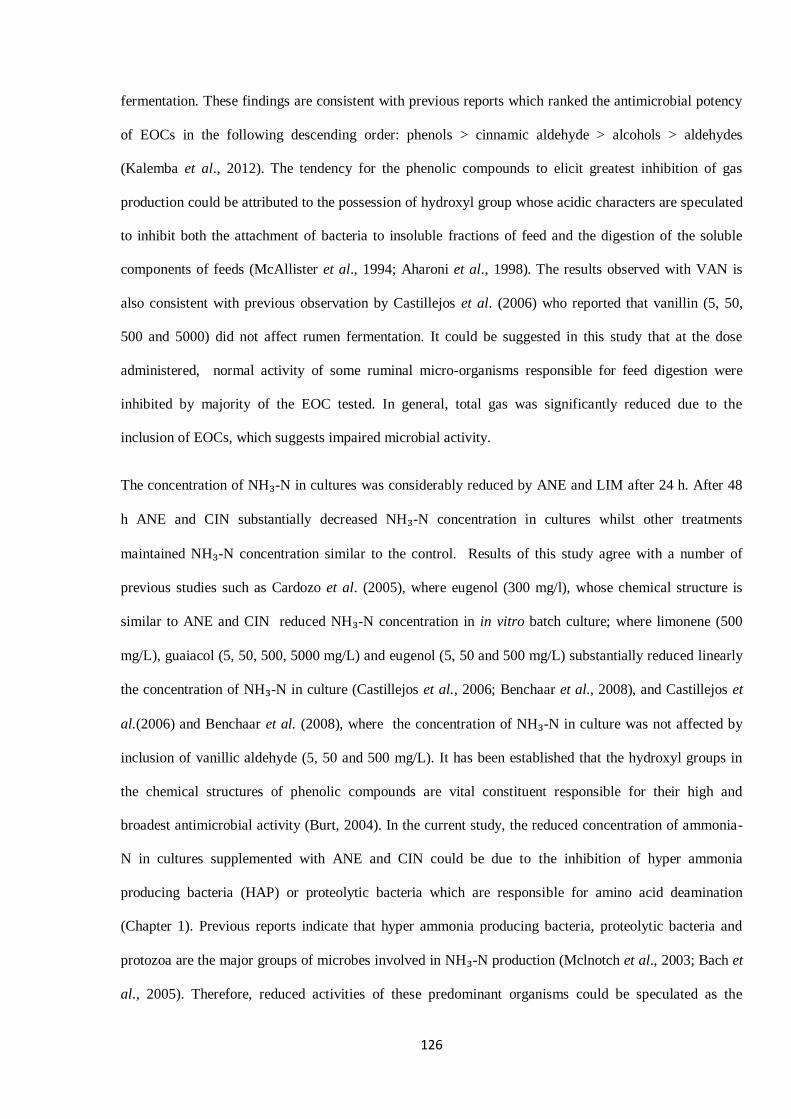
126
fermentation. These findings are consistent with previous reports which ranked the antimicrobial potency
of EOCs in the following descending order: phenols > cinnamic aldehyde > alcohols > aldehydes
(Kalemba et al., 2012). The tendency for the phenolic compounds to elicit greatest inhibition of gas
production could be attributed to the possession of hydroxyl group whose acidic characters are speculated
to inhibit both the attachment of bacteria to insoluble fractions of feed and the digestion of the soluble
components of feeds (McAllister et al., 1994; Aharoni et al., 1998). The results observed with VAN is
also consistent with previous observation by Castillejos et al. (2006) who reported that vanillin (5, 50,
500 and 5000) did not affect rumen fermentation. It could be suggested in this study that at the dose
administered, normal activity of some ruminal micro-organisms responsible for feed digestion were
inhibited by majority of the EOC tested. In general, total gas was significantly reduced due to the
inclusion of EOCs, which suggests impaired microbial activity.
The concentration of NH₃-N in cultures was considerably reduced by ANE and LIM after 24 h. After 48
h ANE and CIN substantially decreased NH₃-N concentration in cultures whilst other treatments
maintained NH₃-N concentration similar to the control. Results of this study agree with a number of
previous studies such as Cardozo et al. (2005), where eugenol (300 mg/l), whose chemical structure is
similar to ANE and CIN reduced NH₃-N concentration in in vitro batch culture; where limonene (500
mg/L), guaiacol (5, 50, 500, 5000 mg/L) and eugenol (5, 50 and 500 mg/L) substantially reduced linearly
the concentration of NH₃-N in culture (Castillejos et al., 2006; Benchaar et al., 2008), and Castillejos et
al.(2006) and Benchaar et al. (2008), where the concentration of NH₃-N in culture was not affected by
inclusion of vanillic aldehyde (5, 50 and 500 mg/L). It has been established that the hydroxyl groups in
the chemical structures of phenolic compounds are vital constituent responsible for their high and
broadest antimicrobial activity (Burt, 2004). In the current study, the reduced concentration of ammonia-
N in cultures supplemented with ANE and CIN could be due to the inhibition of hyper ammonia
producing bacteria (HAP) or proteolytic bacteria which are responsible for amino acid deamination
(Chapter 1). Previous reports indicate that hyper ammonia producing bacteria, proteolytic bacteria and
protozoa are the major groups of microbes involved in NH₃-N production (Mclnotch et al., 2003; Bach et
al., 2005). Therefore, reduced activities of these predominant organisms could be speculated as the
127
consequence of the lower concentration of ammonia N in some cultures. Indeed, some EOCs have been
reported to reduce the activities of HAP (Mclnotch et al., 2003).
The pH of ruminal cultures was increased by all EOCs at 24 and 48 h except VAN. Similar result was
obtained by Chaves et al. (2008) who reported higher ruminal pH following inclusion of anethole, juniper
berry, garlic, and cinnamon oils in culture.
The average concentration of TVFA was highest in the control and VAN, and significantly low in the
remaining treatments, with the lowest concentration of TVFA observed in cultures receiving MEN, ALA,
ANE and 3-CAR. These results are consistent with earlier studies where the addition of thyme oil (125,
250 and 500 mg/l) and citronella oil (125, 250 and 500 mg/l) rich in citronella, citronellol and limonene
decreased TVFA (Gunal et al., 2013; Pandu et al., 2014). In the current study, VAN and CPY did not
alter TVFA and did not change the pH of the fluid, hence, it could be suggested that the high TVFA
concentration in cultures supplemented with VAN reduced the pH of rumen fluid. However, it can be
speculated that the activities of cellulolytic bacteria may have been impaired by EOCs not pH given that
ruminal pH was not reduced since cellulolytic bacteria are sensitive to low (< 6.0) rumen pH (Weimer,
1993). Therefore, reductions in TVFA could be attributed to decreased digestibility of feed which is
influenced by the chemical configuration of the EOCs used. In the current study, the same set of EOCs
such as ALA and ANE (phenolics) and monoterpene alcohol (MEN) were observed to cause the highest
reductions of both the concentrations of TVFA and cumulative gas production. Reduced digestion of feed
which is reflected by decreased production of gas can be accompanied by less production of hydrogen,
CH4 and volatile fatty acids plus a lower A/P ratio (Boggs et al., 1987). The significant decrease in TVFA
due to supplementation of EOCs in cultures shows that at the dose used in this experiment, EOC had non-
selective and general antimicrobial activity against a broad spectrum of rumen micro-organisms. As
ruminants derive over 70% of their required energy from VFA (Bergman, 1990), a reduction of VFA of
the magnitude observed (over 10% average reduction) with all EOCs except CPY and VAN, would
suggest a significant reduction of rumen fermentation. A reduction in VFA would suggest that if similar
effect is exerted in vivo, growth of animal would also be affected since VFA are the major sources of
energy. Addition of EOC may decrease (at high doses) or have no effect (at low doses) on VFA
128
production (Patra and Saxena, 2010). Effects of EOC on VFA are determined by the dose, type of EO
used (Bustquet et al., 2006), and the pH of the rumen (Cardozo et al., 2005).
In this study the concentration of acetate was generally increased and the levels of propionate were
concomitantly reduced plus high A/P ratios with all EOCs relative to the control except CIN and MEN
(which reduced acetate at 24 h), and VAN and CPY (no effect). This suggests that the inclusion of CIN
and MEN in cultures could potentially modify rumen fermentation towards decreased methanogenesis
(Demeyer and Van Nevel, 1995). In the rumen, anaerobic fermentation of proteins and soluble
carbohydrates tends to shift fermentation towards higher propionate production and results in reduced
acetate and methanogenesis (Demeyer and Van Nevel, 1995), since the predominant producers of acetate
and methane are cellulolytic microbes. In agreement with the current study, Spanghero et al. (2008)
observed that a blend of EO shifted the end products of fermentation toward a reduction in the A/P ratio
and acetate proportion only at lower pH.
The results of the current study on rumen fermentation profiles showed that EOCs could be selected to
manipulate rumen fermentation if the dose is optimized. In general, the degree of using EOCs to
manipulate rumen fermentation activities (such as ammonia, VFA and gas production) seems to be in the
following decreasing sequence: phenolic compounds such as ALA, ANE, and CIN > the monoterpene
alcohols example, MEN > aldehydes such as VAN, had the least potential.
3.5.2. Effect of EOC on fatty acid metabolism
The concentrations of C14:0 were reduced in cultures where BIS and CYM were added. The EOCs ALA,
ANE, BIS and MEN reduced the levels of C16:0 in cultures relative to the control. A reduction in the
content of these saturated fatty acids (C14:0 and C16:0) is beneficial as they are known to have the
capacity of raising plasma cholesterol through suppression and saturation of low-density lipoprotein
(LDL) receptors in the blood (Keys et al., 1995). This suggests that a reduction in the concentration of
C14:0 and C16:0 in the current study with the inclusion of those EOCs could possibly decrease the
plasma levels of low-density lipoprotein (LDL) if this observation is also repeated in vivo.
129
Stearic acid (the end-product of the biohydrogenation of C18:1 n-9, C18:3 n-3 and C18:2 n-6) was
reduced in cultures receiving CIT at 12 h whilst the remaining EOCs maintained C18:0 at levels similar to
the control. The mean concentration of C18:0 tended to be increased with the addition of CYM, LIM and
CIT to cultures at 24 h, and reduced in the cultures with added BOR, BIS, CIT, EUC, MEN, MYT and
THU after 48 h compared to the control. The remaining treatments maintained similar levels of C18:0 to
the control at both 24 and 48 h. The reduced concentration of C18:0 in cultures receiving CIT, BOR, BIS,
EUC, MEN, MYT and THU is not consistent with the observed high accumulation of VA in this study.
This observation suggests that these EOCs could have impaired the activity of Clostridium
proteoclasticum (Kemp et al., 1975; Maia et al., 2007), renamed (Moon et al., 2008) as Butyrivibrio
proteoclasticus, the bacteria responsible for converting VA to C18:0. It is uncertain why the high
accumulation of C18:3 n-3 and C18:2 n-6 in vessels receiving ALA, ANE, CIN, LIM and CYM in this
study was not accompanied with a reduction of C18:0, since C18:0 is the end product of
biohydrogenation. However, the high levels of C18:0 in cultures with those EOCs despite high content of
PUFA in their vessels are in agreement with previous studies with EOs (Vasta et al., 2013). The
accumulation of PUFA (C18:3 n-3 and C18:2 n-6) without major effects on the final end product of
biohydrogenation could suggest three possibilities: firstly, that other unidentified biohydrogenation
intermediates were produced in these cultures (Gunal et al., 2013); secondly, that the observed
accumulation of PUFA could be due to reduced lipolytic activities. Buccioni et al. (2012) suggested that
if small amounts of PUFA in the diet reach the duodenum, it might be arising from a reduction in
lipolysis. This suggests that these EOCs might inhibit the activities of Butyrivibrio fibisolvens and
Anaerovibrio lipolytica or their lipases, which are responsible for hydrolysing the ester bonds of dietary
glycolipids and triglycerides (Buccioni et al. 2012), potentially reducing lipolysis and isomerization of
fatty acids. Thirdly, the accumulation of C18:0 in the current study despite maintenance of high levels of
PUFA could be due to the concomitant higher concentrations of C18:1 n-9 in cultures with added ALA,
ANE, CIN, LIM and CYM, as C18:0 may also result from C18:1 n-9. Jenkins et al. (2006) reported that
about 70% of C18:1 n-9 in rumen culture was converted to C18:0 and only 30% was transformed to
ketostearic acid and hydroxystearic acid. Stearic acid (C18:0) is a saturated fatty acid but without any
harmful effects on human health (Grundy, 1994; Pariza, 2004; Webb and O’Neill, 2008), therefore,
130
stearic acid should not be included with other saturated fatty acids such as C14:0 and C16:0, in attempt to
control the levels of plasma cholesterol through dietary manipulations (Cobb, 1992).
The formation of C18:1 trans-11 (vaccenic acid; VA) from the rumenic acid (cis-9 trans 11 CLA) is
aided by the activity of the rumenic acid enzyme, the reductase enzyme (Jenkins et al., 2008; Kim et al.,
2009; Buccioni et al., 2012). In this study, the concentration of C18:1 trans 11 was increased with the
addition of all EOCs at 24 and 48 except for VAN, with the greatest increase recorded in cultures with
MEN and BOR compared to the control. Increased concentration of C18:1 trans 11 in this study is in
agreement with previous reports where EOCs were observed to maintain high levels of C18:1 trans 11
(Lourenco et al., 2009). In this study, EOCs such as MEN and BOR were among the additive type with
the lowest concentration of C18:0, implying that the concomitant high concentrations of C18:1 trans 11
could have resulted from reduced conversion of C18:1 trans 11 to C18:0. This might indicate that these
EOCs potentially have the capacity to cause decrease activity of Clostridium proteoclasticum (Kemp et
al., 1975; Maia et al., 2007), renamed (Moon et al., 2008) as Butyrivibrio proteoclasticus, the bacteria
that is responsible for converting VA to C18:0. It could also mean that inclusion of these EOCs might
have stimulated the activity of the reductase enzyme which facilitates the production of trans-11 18:1
(vaccenic acid; VA) from cis-9 trans 11 18:2 CLA. These results imply that the inclusion of these EOCs
could also potentially increase the concentration of cis-9 trans 11 18:2 CLA since vaccenic acid is the key
substrate for endogenous synthesis of CLA in animal tissues (Griinari et al., 2000). It is established that
about 90% of cis-9 trans-11 CLA in cow’s milk and tissues resulted from the desaturation of trans-11
18:1 through the Δ-9 desaturase enzyme (Piperova et al., 2002; Kay et al., 2004).
In the present study, no effect of supplementing EOCs was observed on the levels of cis-9 trans 11 18:2
CLA at all times of incubation except for 48 h where MEN, BOR and BIS significantly increased cis-9
trans 11 18:2 CLA. The increased effects of MEN, BOR and BIS on the levels of cis-9 trans 11 18:2
CLA, relative to the control, is consistent with previous studies (Whitney et al., 2011). As mentioned
previously, cis-9 trans 11 18:2 CLA is formed in the first step during the transformation of cis-9, cis-12
18:2 by the linoleic acid isomerase (LA-I) (Jenkins et al., 2008; Kim et al., 2009; Buccioni et al., 2012).
Results of the current study suggest that all but MEN, BOR and BIS at 48 h could have impaired the
131
activities of the linoleic acid isomerase which facilitates the formation of cis-9 trans 11 18:2 CLA from
cis-9, cis-12 18:2.
The content of C18:2 n-6 rapidly decreased with time, being highest at 12 h and lowest at 48 h, in both
the CON and in the presence of all EOCs. The biohydrogenation of C18:2 n-6 was comparable to, but
slightly lower than that of C18:3 n-3, and in line with results of previous in vitro (Beam et al., 2000) and
in vivo (Wachira et al., 2000) studies. The effects of the added EOCs on the biohydrogenation of C18:2 n-
6 was similar to their effects on the biohydrogenation of C18:3 n-3 (discussed later), with ALA, ANE,
CIT and MEN being the most effective EOCs to reduce the extent of biohydrogenation of C18:2 n-6.
In the current study, the content of C18:3 n-3 rapidly decreased with time, being highest at 12 h and
lowest at 48 h, in both the CON and in all EOCs, evidently reflecting the biohydrogenation of C18:3 n-3
in cultures over time. This rapid biohydrogenation of C18:3 n-3 from ground linseed which exceeded 80
g/100 g at 24 h agrees with previous in vivo studies (Wachira et al., 2000; Scollan et al., 2001, Wang et
al., 2002; Chikunya et al., 2004) and in vitro studies (Sinclair et al., 2005). Relative to the control, within
the EOCs, the concentration of C18:3 n-3 was highest in ALA, ANE, MEN and CIT and consistently
lowest in VAN and CPY during the first 24 h. At 48 h, the highest levels of C18:3 n-3 were still found in
cultures with ALA and ANE. In this experiment, the EOCs which possess phenolic moieties in their
chemical structures such as ALA and ANE known to express the broadest antimicrobial effects, caused
high accumulation of C18:2 n-6 and C18:3 n-3. This is consistent with previous report by Vasta et al.
(2013) who added Artemisia EO (containing phenolic compounds such as thymol and carvacrol), and
Lourenco et al. (2008) who used cinnamaldehyde (500 mg/L). The antibacterial activity and specific
mode of action of an individual EOC is influenced by the chemical structure of the compound (Dormans
and Deans, 2000). Although, CIN (another phenolic compound) had the highest content of C18:3 n-3 and
C18:2 n-6 at 12 h, its potency was not sustained to 24 and 48 h, suggesting the possibility of gradual
degradation of the active molecules of the compound or microbial adaptation to the compound (Chizzola
et al., 2004; Brodiscou et al., 2007). The possibility of ALA and ANE to exert the greatest antimicrobial
characteristic by maintaining higher levels of C18:3 n-3 than other EOCs could be due to the possession
of hydroxyl group whose acidic characters are speculated to have broad inhibition of microbial activities.

132
This could suggest that ALA and ANE probably had higher capacity to reduce the biohydrogenation of
C18:3 n-3 and C18:2 n-6 compared to the rest of the treatments leading to high accumulation of PUFA in
their cultures. EOs containing high proportion of phenolic compounds such as thymol, carvacrol and
eugenol (2-methoxy-4-(2-propenyl)phenol as components of their chemical structure exhibit the strongest
antimicrobial properties against food borne pathogens (Cosentino et al., 1999; Juliano et al., 2000;
Lambert et al., 2001). The mechanisms of action of phenolic compounds are thought to generally include
disruption of proton motive force (PMF), coagulation of cell contents, disturbance of cytoplasmic
membrane and disruption of active transport and electron flow (Sikkema et al., 1995; Davidson, 1997).
In the literature, formaldehyde treatment of fat sources has been described as effective in increasing the
flow of C18:3 n-3 to the abomasum of goats (Scott et al., 1971), and in reducing the in vitro
biohydrogenation of C18:2 n-6 (Gulati et al., 1997). However, beside the fact that the use of
formaldehyde would potentially be criticized by regulatory authorities, the inconsistency of using it to
reduce the biohydrogenation of either C18:3 n-3 or C18:2 n-6 was reported by Sinclair et al. (2005).
These authors reported that formaldehyde treatment of whole linseed alone slightly reduced the
biohydrogenation of either C18:3 n-3 or C18:2 n-6. Hence, they proposed that pre-treatment of whole
linseed with NaOH and formic acid could be more effective because about 443 and 307 g/kg of C18:3n -
3 were protected from biohydrogenation when whole linseed was pre-treated with NaOH and formic acid
respectively, prior to treatment with formaldehyde. In the current study the content of C18:3 n-3 or C18:2
n-6 at 24 h decreased significantly in response to EOCs in the progression: ALA and ANE
(phenylpropanoids), MEN (monoterpene alcohol) and CIT (monoterpene) > 3-CAR and BOR (bicyclic
monoterpenes), CIN (phenylpropanoid), LIM, MYT, CYM and THU (monoterpenes) > BIS
(sesquiterpene) and EUC (monoterpene ethers) > CPY (bicyclic sesquiterpene) and VAN (aldehydes).
These findings are consistent with previous reports ranking the antimicrobial potency of EOCs in the
following descending order: phenols > cinnamic aldehyde > alcohols > aldehydes (Kalemba et al., 2012).
The extent of disappearance of C20:5 n-3 and C22:6 n-3 in vessels increased as the time of incubation
progressed, being lowest at 12 h and highest at 48 h. After 48 h, the quantity of the content of C20:5 n-3
and C22:6 n-3 in vessel which disappeared was highest in the control, with only 28.6 g/100 g and 45.9
133
g/100 g of C20:5n -3 and C22:6n -3 respectively, remaining in vessels. These findings support previous
reports from in vivo studies where the biohydrogenation of C20:5 n-3 and C22:6 n-3 in fish oil range
from 72 to 93 g/100 g TFA (Wachira et al., 2000; Scollan et al., 2001; Chikunya et al., 2004), and
contrast in vitro reports where the biohydrogenation of C20:5 n-3 and C22:6 n-3 was less than 50 g/100 g
(Ashes et al., 1992; Sinclair et al., 2005). Within the EOCs, the extent of inhibition of the
biohydrogenation of C20:5 n-3 and C22:6 n-3 differs and can be ranked in the following decreasing
order: ALA, MYT, CIT, CIN, BOR and THU > ANE, BIS, MEN and CYM > 3-CAR, CPY, LIM, VAN.
In general, the biohydrogenation of the fish oil fatty acids (C20:5 n-3 and C22:6 n-3) was less compared
to the ruminal disappearance of C18 fatty acids (C18:3 n-3 and C18:2 n-6). This inability of microbes to
hydrogenate the fish oil fatty acids is not due to the difference in the lipase activities but because
microbes lack the enzymes necessary to hydrogenate the long chain n-3 PUFA (Ashes et al., 1992). It
should be remembered that the biohydrogenation pathways of C20:5 n-3 and C22:6 n-3 are not yet fully
established (section 1.7.8).
No effect of treatment on ∑SFA was found after 24 h. Therefore a further calculations of ∑SFA without
18:0 (i.e. ∑SFA-18:0) was made but results were similar to the reported effects on ∑SFA. The lack of
difference on the content of ∑SFA and (∑SFA-C18:0) could be due to the reported high levels of C18:0
which possibly results from the metabolism of oleic acid. However, there was reduction on the ∑SFA in
cultures with added BOR, CIT, MEN, MYT and THU compared to the control after 48 h. These
reductions in the content of ∑SFA in these EOCs coincided with the high levels of trans-11 18:1 and
decreased concentration of 18:0 and oleic acid in those cultures.
The content of ∑PUFA decreased with increase in the time of incubation (i.e. highest at 12 h and lowest
at 48 h). After 48 h, the levels of ∑PUFA observed in cultures with ALA, ANE and MEN, which were
the most effective EOCs, was more than doubled the concentration observed in cultures with the control.
The decrease in the levels of ∑PUFA with time is understood from the fact that the concentration of
individual PUFA also decreased with time. The highest content of ∑PUFA in cultures treated with ALA,
ANE and MEN is also expected as the highest levels of individual PUFA were also observed in those
134
EOCs. The aim of increasing the content of ∑PUFA in diet is to reduce the risks of coronary heart
diseases in humans (as described in Chapter 1).
In the report presented here no effect of inclusion of VAN and CIN was recorded on TFA at 12, 24 and
48 h. However, all other EOCs reduced TFA relative to the control. Reduction of TFA could suggest that
the reported decrease in TVFA and ammonia concentration had reduced the microbial de novo fatty acids
synthesis (Sauvant and Bas, 2001), leading to reductions in the levels of TFA. The strength of this
conclusion lies in the fact that VAN which did not affect the TFA concentration also did not change the
TVFA and ammonia concentrations in cultures in this study.
The content of ∑n-6/∑n-3 was consistently reduced in cultures with BIS, BOR, EUC, MYT, THU and
VAN at both 24 and 48 h relative to the control. In this study, the major thrombotic fatty acid (C20:4 n-6;
Kinsella et al., 1990) was not affected by treatments.
The ratio of PUFA to SFA (P: S) in cultures decreased with time of incubation, and it was increased with
the addition of all EOCs except EUC and VAN relative to the control at 12 and 24 h. At 48 h of
incubation, the ratio of P/S in cultures with ALA, ANE, BOR, MEN, MYT and THU (EOCs with the
highest levels of P/S) tripled the content of P/S in the control. In this study, only the inclusion of ALA,
ANE, BOR, MEN, MYT and THU in cultures at 12 h had P/S of 0.40 which is close to the value of 0.45
recommended in the guidelines of the Department of Health (1994).
3.6. Conclusion
In the current study, the content of C18:3 n-3 or C18:2 n-6 at 24 h increased significantly in the
progression: ALA and ANE (phenylpropanoids), MEN (monoterpene alcohol) and CIT (monoterpene) >
3-CAR and BOR (bicyclic monoterpenes), CIN (phenylpropanoid), LIM, MYT, CYM and THU
(monoterpenes) > BIS (sesquiterpene) and EUC (monoterpene ethers) > CPY (bicyclic sesquiterpene) and
VAN (aldehydes). These results showed that the phenylpropanoids (ALA and ANE) and monoterpene
alcohols (MEN) had the greatest potential compared to the rest of the EOCs to reduce the disappearance
135
of n-3 PUFA and suggest that their use could enhance the concentrations of n-3 PUFA in ruminant food
products if this is confirmed in vivo. However, this needs to be balanced against their effects on VFA. It is
also worthwhile to investigate the mechanism of action and the stability of these EOCs in the rumen.
In the event of introducing these substances to the public or to livestock industries, the whole essential
oils might stand a better chance of acceptance compared with the individual EOCs. The whole EOs have
been used by man since antiquity in the area of aromatherapy and food industries, hence, are likely to
encounter less regulatory hassles compared to individual EOCs. In addition, the synergistic effect
between the minor and major components in the whole oils is expected to improve the effectiveness of the
whole oils against biohydrogenating bacteria over the individual constituent compounds. These
considerations would lead us to the second experiment using the parent whole oils of the ten most
effective EOCs. Therefore, the next experiment (discussed in Chapter 4) is to evaluate the potential of the
whole oils on rumen fermentation and biohydrogenation of PUFA.

136
137
Chapter 4
Effects of ten whole essential oils on rumen fermentation and
biohydrogenation of n-3 polyunsaturated fatty acids by rumen
microorganisms in vitro
138
Abstract
The effects of ten whole essential oils (EO) on the fermentation activities of rumen microbes and the
biohydrogenation (BH) of n-3 polyunsaturated fatty acids (PUFA) were evaluated in vitro using batch
culture system. Rumen fluid was collected from four Hartline Texel cross cull ewes offered grass hay
(Lolium perenne) and water ad libitum and supplemented with additional 400 g/sheep/day of lamb
finisher cubes. A basal feedstock comprising of 70:30 grass hay and concentrate was formulated. Serum
bottles were incubated at 39⁰C; each bottle contained 1 g of feed substrate, 80 ml buffer, 20 ml inoculum,
then supplemented with 300 mg/l of EOCs and repeated twice. There were 11 treatments, with six
replicates per treatment as follows: control (CON), whole oils of anise (ANO), cassia (CSO), citronella
(CTO), clove (CLO), cornmint (CMO), eucalyptus (ETO), juniper berry (JPO), lavender (LVO),
mandarin (MDO) and rosemary (RMO). Fermentation was stopped at 12, 24 and 48 h, and samples were
collected to analyse ammonia N, total VFA and molar proportions of individual VFA; and concentration
of PUFA including intermediates of BH. Relative to the control, CSO was the only EO that reduced
(P<0.001) ammonia concentration in culture by a magnitude of 33%, whilst others maintained similar
ammonia levels. With the exception of ETO and LVO, the addition of all EO decreased (P<0.001) total
VFA compared to the control, with CSO being the most inhibitory, inducing a 27% reduction. The
concentrations of C18:2 n-6 and n-3 PUFA (C18:3 n-3, C20: 5n-3 and C22: 6n-3) were maintained at
higher levels (P<0.001) with addition of all EO, and were highest (P<0.001) in cultures where ANO and
CSO were added. Except for CTO and CLO, the inclusion of EO did not affect the concentration of 18:2
cis-9 trans 11. The levels of C18:1 trans 11 were significantly increased (P<0.001) by supplementing
with either CSO, CTO, CMO or RMO. There was no effect of EOs inclusion on C18:0 except for CSO
(12 h) and RMO (24 h) which reduced (P<0.001) the level of C18:0. The potential of whole EOs used in
this study to inhibit BH at 24 h can be ranked as follows: ANO and CSO > MDO and CMO > CTO and
RMO > JPO, LVO, CLVO and ETO. These results suggest that the use of CSO and ANO have the
greatest potential to enhance the concentrations of n-3 PUFA in ruminant food products if this is also
confirmed in vivo. However, optimum doses are needed to balance their effects on VFA.
139
4.1. Introduction
The health benefits of n-3 PUFA such as C18:3 n-3, 20:5 n-3 and 22:6 n-3 have been described (see
section 1.2.2). Briefly, this category of fatty acids has been reported to have positive effects such as
reducing the risk of coronary heart disease in humans (Department of Health, 1994; de Lorgeril et al.,
1999). These health benefits of n-3 PUFA have raised the need to increase the levels of these fatty acids
in ruminant food products such as meat and milk. Because the fatty acid composition of ruminant food
products depends on the metabolism of dietary lipids in the rumen (Kim et al., 2009); the manipulation of
rumen biohydrogenation of PUFA has received significant attention within the scientific community
(Scollan et al., 2001, Wachira et al., 2000; Wang et al., 2002; Chikunya et al., 2004; Scollan et al., 2006;
Shingfield and Griinari, 2007; Gunal et al., 2013).
The possibility of using whole EOs and their constituent compounds (EOCs) in ruminant fermentation
have also been examined previously (Calsamiglia et al., 2007; Benchaar et al., 2008; Hart et al., 2008;
Chapter 1). The huge number (3000) of commercially available EOs makes it practically impossible to
evaluate the effects of EOs all by in vivo trials. Therefore, the use of in vitro experimental models to
investigate effects of EOs and consequently predict their in vivo effects has become a common
phenomenon for researchers. In our previous in vitro study (Chapter 3; Eburu and Chikunya, 2014), the
effects of 15 EOCs on the metabolism of PUFA was evaluated. The study found that some individual
EOCs such as anethole, menthol, 4-allylanisole and p-cymene have the potential to reduce the extent of
ruminal biohydrogenation of PUFA. In another in vitro study, Sgwane et al. (2013) reported that the
EOCs pinene, linalyl acetate, L-menthone and pulegone reduced the extent of ruminal biohydrogenation
of PUFA. However, the use of whole essential oils as opposed to individual EOCs has a number of
attractions. They have been used by man since antiquity in the area of aromatherapy and food industries,
hence, are likely to encounter less regulatory hassles compared to the EOCs. In addition, the potential
synergistic action between the minor and major constituents in the whole oils might improve the
effectiveness of the whole oils against biohydrogenating bacteria over the individual constituent
compounds. The aim of this study was therefore to establish whether the parent oils from which some of
the individual EOCs showing potential are the predominant compounds, are equally as effective at
140
inhibiting the biohydrogenation of PUFA and increasing the accumulation of biohydrogenation
intermediates.
4.2. Materials and methods
4.2.1. Animal management and collection of rumen fluid
In this experiment, four cull-ewes (Hartline Texel cross, mean weight 41.5 ±1.7kg) were used as rumen
fluid donors. Details of animal housing, experimental diets, feeding regime, duration of adaptation and
collection of rumen fluid are as described in section 2.1.
4.2.2. Basal feedstock, treatments and in vitro incubation
The basal feedstock was mixtures of good quality rye-grass hay (Lolium perenne), lamb finisher
concentrate, whole ground linseed and fish oil. Details of the basal feedstock used in this in vitro
incubation are as described in the general material and methods (see section 2.3). The ingredients,
chemical and fatty acid composition of the diet are shown in Table 2.2.
The effects of 10 whole essential oils were evaluated using the in vitro gas production batch culture
method described by Theodorou et al. (1994), which is outlined in section 2.4 of the general materials and
methods.
All EOs used were purchased from Sigma-Aldrich Co. Ltd., UK and were stored at the required
temperatures as specified on delivery notes prior to use. The description of the EOs as purchased from
Sigma-Aldrich is shown in Table 4.1. The typical constituent component composition of the whole
essential oils used in this study is shown in Table 4.2.
There were 11 treatments and six replicates as follows: Control (CON), anise oil (ANO), cassia oil
(CSO), citronella oil (CTO), clove oil (CLO), cornmint oil (CMO), eucalyptus oil (ETO), juniper berry
oil (JPO), lavender oil (LVO), mandarin oil (MDO) and rosemary oil (RMO).
Incubation was done in 125 ml clear glass type 1 serum bottles (R & L Slaughter Ltd, Essex, UK) for 48 h
in each run and repeated twice. In each run 268 (11 x 6 +4) serum bottles were incubated, each bottle

141
contained 1 g of feed substrate, 300 mg/l of EO, 80 ml anaerobic buffer (see Table 2.1) and 20 ml
inoculum and the bottle sealed with rubber cork before incubation.
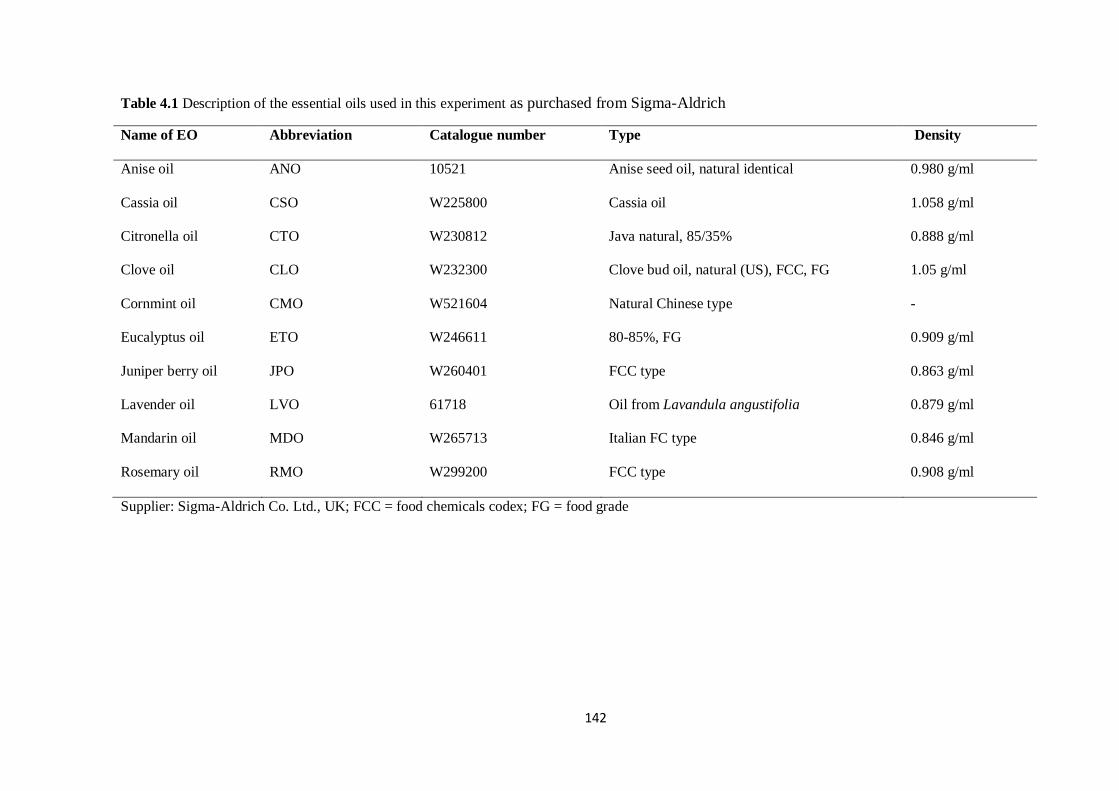
142
Table 4.1 Description of the essential oils used in this experiment as purchased from Sigma-Aldrich
Name of EO Abbreviation Catalogue number Type Density
Anise oil ANO 10521 Anise seed oil, natural identical 0.980 g/ml
Cassia oil CSO W225800 Cassia oil 1.058 g/ml
Citronella oil CTO W230812 Java natural, 85/35% 0.888 g/ml
Clove oil CLO W232300 Clove bud oil, natural (US), FCC, FG 1.05 g/ml
Cornmint oil CMO W521604 Natural Chinese type -
Eucalyptus oil ETO W246611 80-85%, FG 0.909 g/ml
Juniper berry oil JPO W260401 FCC type 0.863 g/ml
Lavender oil LVO 61718 Oil from Lavandula angustifolia 0.879 g/ml
Mandarin oil MDO W265713 Italian FC type 0.846 g/ml
Rosemary oil RMO W299200 FCC type 0.908 g/ml
Supplier: Sigma-Aldrich Co. Ltd., UK; FCC = food chemicals codex; FG = food grade
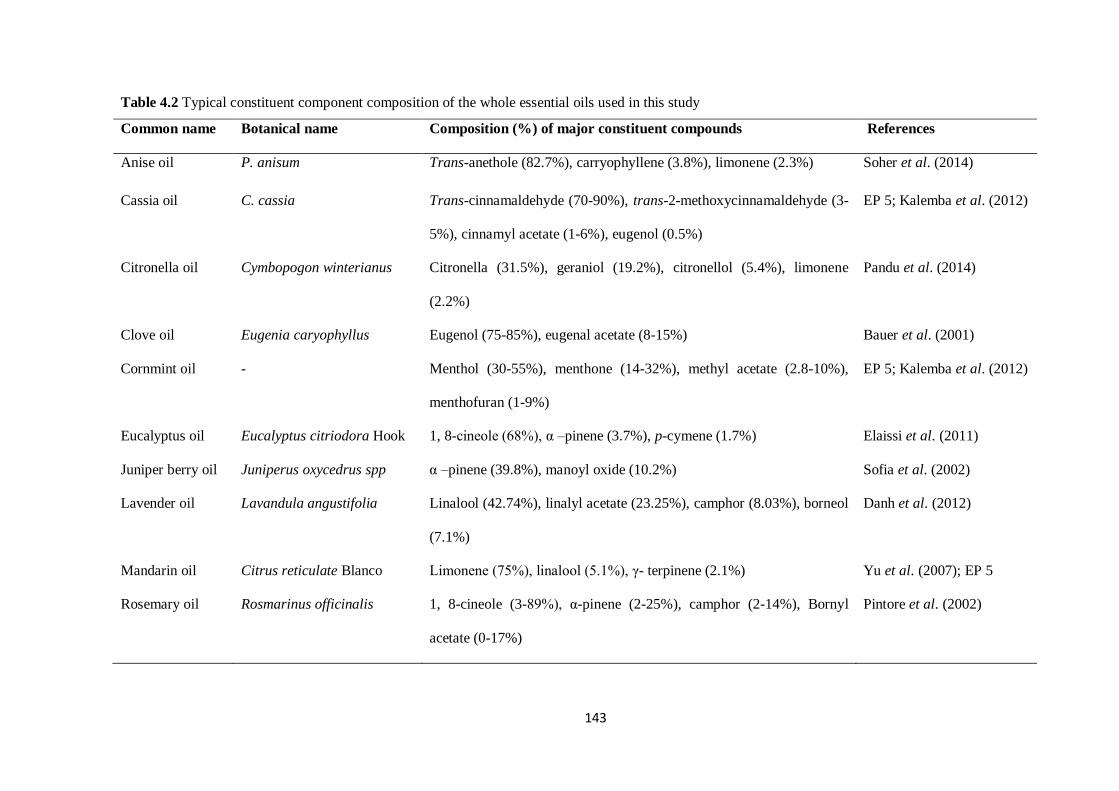
143
Table 4.2 Typical constituent component composition of the whole essential oils used in this study
Common name Botanical name Composition (%) of major constituent compounds References
Anise oil P. anisum Trans-anethole (82.7%), carryophyllene (3.8%), limonene (2.3%) Soher et al. (2014)
Cassia oil C. cassia Trans-cinnamaldehyde (70-90%), trans-2-methoxycinnamaldehyde (3-
5%), cinnamyl acetate (1-6%), eugenol (0.5%)
EP 5; Kalemba et al. (2012)
Citronella oil Cymbopogon winterianus Citronella (31.5%), geraniol (19.2%), citronellol (5.4%), limonene
(2.2%)
Pandu et al. (2014)
Clove oil Eugenia caryophyllus Eugenol (75-85%), eugenal acetate (8-15%) Bauer et al. (2001)
Cornmint oil - Menthol (30-55%), menthone (14-32%), methyl acetate (2.8-10%),
menthofuran (1-9%)
EP 5; Kalemba et al. (2012)
Eucalyptus oil Eucalyptus citriodora Hook 1, 8-cineole (68%), α –pinene (3.7%), p-cymene (1.7%) Elaissi et al. (2011)
Juniper berry oil Juniperus oxycedrus spp α –pinene (39.8%), manoyl oxide (10.2%) Sofia et al. (2002)
Lavender oil Lavandula angustifolia Linalool (42.74%), linalyl acetate (23.25%), camphor (8.03%), borneol
(7.1%)
Danh et al. (2012)
Mandarin oil Citrus reticulate Blanco Limonene (75%), linalool (5.1%), γ- terpinene (2.1%) Yu et al. (2007); EP 5
Rosemary oil Rosmarinus officinalis 1, 8-cineole (3-89%), α-pinene (2-25%), camphor (2-14%), Bornyl
acetate (0-17%)
Pintore et al. (2002)
144
4.2.3. Sample collection and preservation
Experimental details relating to gas pressure measurement, stopping times, collection and storage of
samples are as described in the general material and methods (see section 2.4).
4.2.4. Chemical analysis
The concentration of NH3-N in digesta was analysed using the phenol-hypochlorite method
(Weatherburn, 1967; Broderick and Kang, 1980) adapted for use on the plate reader as described in
general materials and methods (see section 2.5.4).
The concentration of volatile fatty acid (VFA) was determined by Gas chromatography (GC) as described
by Ottenstein and Bartley (1971). Details of this method are outlined in the general materials and methods
(see section 2.5.6).
The concentration of fatty acids in feed and freeze dried samples were extracted by direct saponification
method described by Enser et al. (1998). See section 2.5.7 of the general materials and methods for
detailed description of the techniques.
4.2.5. Experimental design and statistical analysis
This study was a completely randomized design (CRD) experiment. The objective was to examine the
effects of ten EOs on the extent of rumen biohydrogenation of n-3 PUFA in vitro, including their effects
on fermentation parameters (gas production, NH3-N concentration and on concentrations of TVFA and
molar proportions of individual VFA. The null hypothesis was that inclusion of 300 mg/L of EOs would
have no effect on fermentation and biohydrogenation data. The alternative hypothesis was that the EOs
would affect (decrease or increase) fermentation activities. Data were analysed (separately for each time
point) by one-way analysis of variance (ANOVA) using GenStat 16th edition (VSN international Ltd,
Registered to: Writtle College) with experimental runs as a blocking factor. Differences between
treatments were declared by least significance difference (LSD) and significance was declared at P< 0.05.
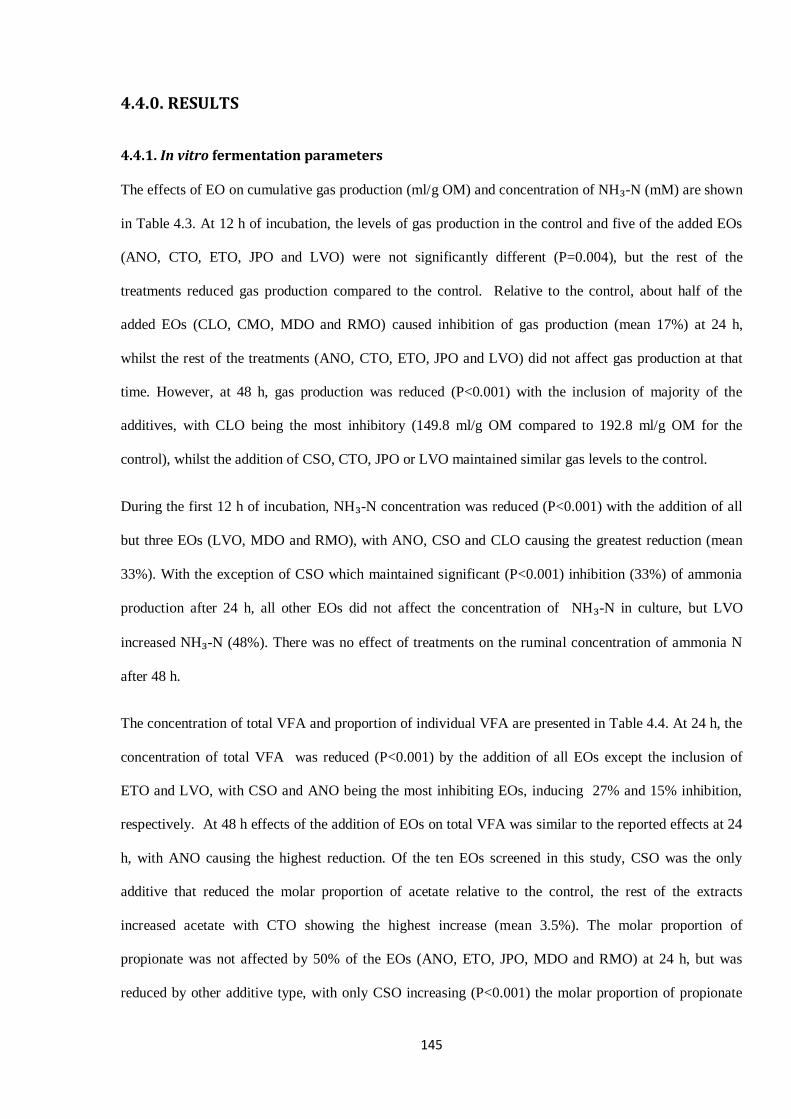
145
4.4.0. RESULTS
4.4.1. In vitro fermentation parameters
The effects of EO on cumulative gas production (ml/g OM) and concentration of NH₃-N (mM) are shown
in Table 4.3. At 12 h of incubation, the levels of gas production in the control and five of the added EOs
(ANO, CTO, ETO, JPO and LVO) were not significantly different (P=0.004), but the rest of the
treatments reduced gas production compared to the control. Relative to the control, about half of the
added EOs (CLO, CMO, MDO and RMO) caused inhibition of gas production (mean 17%) at 24 h,
whilst the rest of the treatments (ANO, CTO, ETO, JPO and LVO) did not affect gas production at that
time. However, at 48 h, gas production was reduced (P<0.001) with the inclusion of majority of the
additives, with CLO being the most inhibitory (149.8 ml/g OM compared to 192.8 ml/g OM for the
control), whilst the addition of CSO, CTO, JPO or LVO maintained similar gas levels to the control.
During the first 12 h of incubation, NH₃-N concentration was reduced (P<0.001) with the addition of all
but three EOs (LVO, MDO and RMO), with ANO, CSO and CLO causing the greatest reduction (mean
33%). With the exception of CSO which maintained significant (P<0.001) inhibition (33%) of ammonia
production after 24 h, all other EOs did not affect the concentration of NH₃-N in culture, but LVO
increased NH₃-N (48%). There was no effect of treatments on the ruminal concentration of ammonia N
after 48 h.
The concentration of total VFA and proportion of individual VFA are presented in Table 4.4. At 24 h, the
concentration of total VFA was reduced (P<0.001) by the addition of all EOs except the inclusion of
ETO and LVO, with CSO and ANO being the most inhibiting EOs, inducing 27% and 15% inhibition,
respectively. At 48 h effects of the addition of EOs on total VFA was similar to the reported effects at 24
h, with ANO causing the highest reduction. Of the ten EOs screened in this study, CSO was the only
additive that reduced the molar proportion of acetate relative to the control, the rest of the extracts
increased acetate with CTO showing the highest increase (mean 3.5%). The molar proportion of
propionate was not affected by 50% of the EOs (ANO, ETO, JPO, MDO and RMO) at 24 h, but was
reduced by other additive type, with only CSO increasing (P<0.001) the molar proportion of propionate
146
(mean increase 2.5%). The proportion of butyrate was reduced in cultures supplemented with JPO and
RMO (mean 8%) and increased with the addition of CSO and CMO (mean 21%), but other EOs did not
affect the molar proportion of butyric acid in cultures at all times of incubation. The ratio of acetate to
propionate (A: P) was not affected by JPO and RMO at 24 h but it was reduced by CSO, with the
remaining EOs increasing A: P, with LVO causing the highest (mean 11%) increase. At 48 h period of
incubation, the A/P ratio was highest in cultures with MDO and ANO (means 2.9) and lowest in CSO
(2.6).
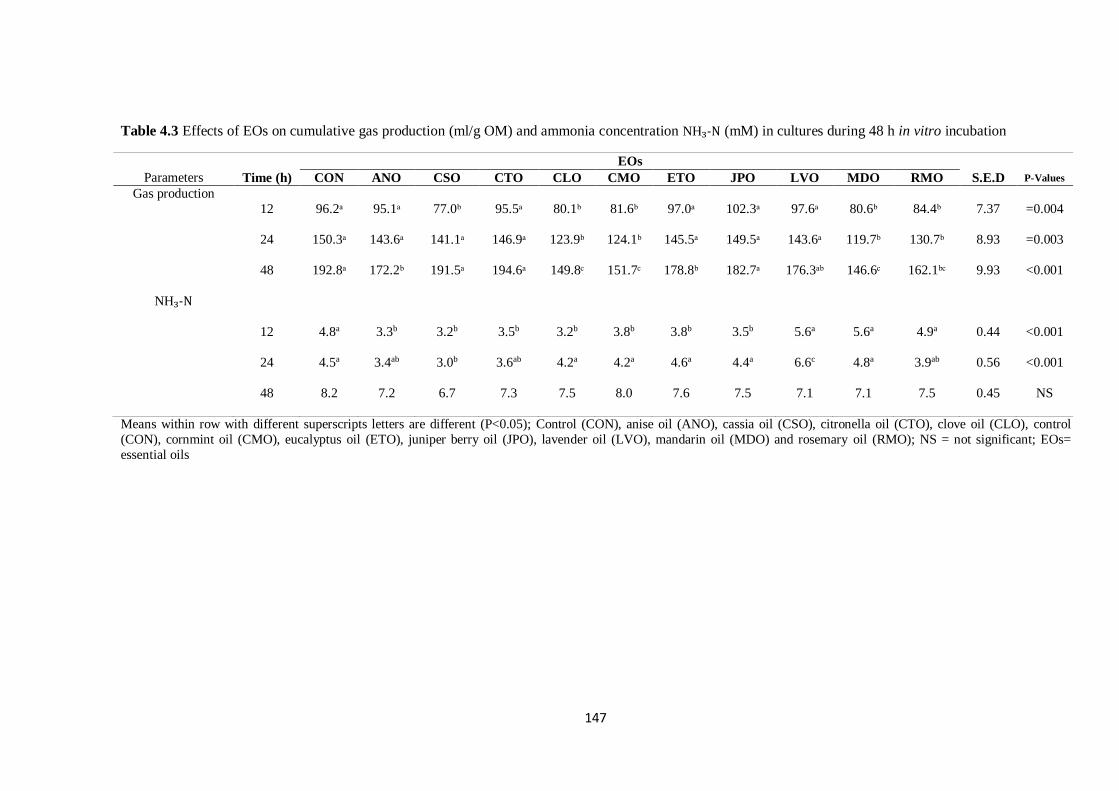
147
Table 4.3 Effects of EOs on cumulative gas production (ml/g OM) and ammonia concentration NH₃-N (mM) in cultures during 48 h in vitro incubation
EOs
Parameters Time (h) CON ANO CSO CTO CLO CMO ETO JPO LVO MDO RMO S.E.D P-Values
Gas production
12 96.2ᵃ 95.1ᵃ 77.0ᵇ 95.5ᵃ 80.1ᵇ 81.6ᵇ 97.0ᵃ 102.3ᵃ 97.6ᵃ 80.6ᵇ 84.4ᵇ 7.37 =0.004
24 150.3ᵃ 143.6ᵃ 141.1ᵃ 146.9ᵃ 123.9ᵇ 124.1ᵇ 145.5ᵃ 149.5ᵃ 143.6ᵃ 119.7ᵇ 130.7ᵇ 8.93 =0.003
48 192.8ᵃ 172.2ᵇ 191.5ᵃ 194.6ᵃ 149.8ᶜ 151.7ᶜ 178.8ᵇ 182.7ᵃ 176.3ᵃᵇ 146.6ᶜ 162.1ᵇᶜ 9.93 <0.001
NH₃-N
12 4.8a 3.3b 3.2b 3.5b 3.2b 3.8b 3.8b 3.5b 5.6a 5.6a 4.9a 0.44 <0.001
24 4.5a 3.4ab 3.0b 3.6ab 4.2a 4.2a 4.6a 4.4a 6.6c 4.8a 3.9ab 0.56 <0.001
48 8.2 7.2 6.7 7.3 7.5 8.0 7.6 7.5 7.1 7.1 7.5 0.45 NS
Means within row with different superscripts letters are different (P<0.05); Control (CON), anise oil (ANO), cassia oil (CSO), citronella oil (CTO), clove oil (CLO), control
(CON), cornmint oil (CMO), eucalyptus oil (ETO), juniper berry oil (JPO), lavender oil (LVO), mandarin oil (MDO) and rosemary oil (RMO); NS = not significant; EOs=
essential oils
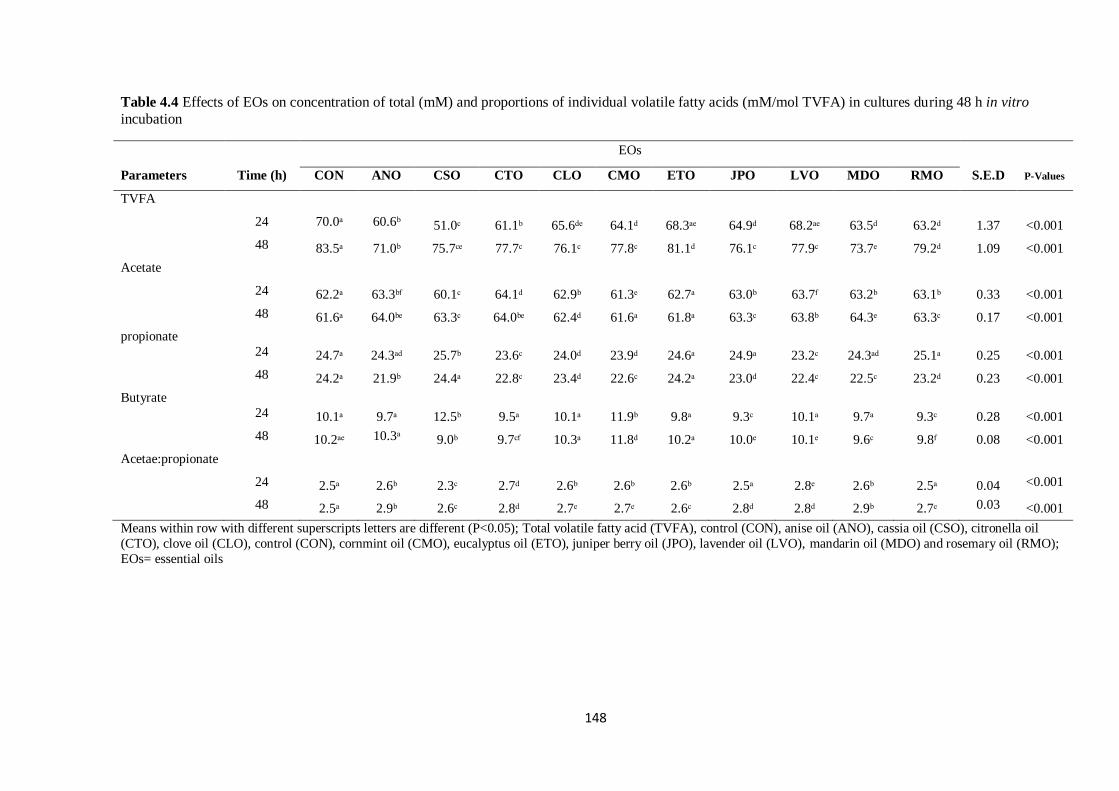
148
Table 4.4 Effects of EOs on concentration of total (mM) and proportions of individual volatile fatty acids (mM/mol TVFA) in cultures during 48 h in vitro
incubation
EOs
Parameters Time (h) CON ANO CSO CTO CLO CMO ETO JPO LVO MDO RMO S.E.D P-Values
TVFA
24 70.0ᵃ 60.6ᵇ 51.0ᶜ 61.1ᵇ 65.6ᵈᵉ 64.1ᵈ 68.3ᵃᵉ 64.9ᵈ 68.2ᵃᵉ 63.5ᵈ 63.2ᵈ 1.37 <0.001
48 83.5ᵃ 71.0ᵇ 75.7ᶜᵉ 77.7ᶜ 76.1ᶜ 77.8ᶜ 81.1ᵈ 76.1ᶜ 77.9ᶜ 73.7ᵉ 79.2ᵈ 1.09 <0.001
Acetate
24 62.2ᵃ 63.3ᵇᶠ 60.1ᶜ 64.1ᵈ 62.9ᵇ 61.3ᵉ 62.7ᵃ 63.0ᵇ 63.7ᶠ 63.2ᵇ 63.1ᵇ 0.33 <0.001
48 61.6ᵃ 64.0ᵇᵉ 63.3ᶜ 64.0ᵇᵉ 62.4ᵈ 61.6ᵃ 61.8ᵃ 63.3ᶜ 63.8ᵇ 64.3ᵉ 63.3ᶜ 0.17 <0.001
propionate
24 24.7ᵃ 24.3ᵃᵈ 25.7ᵇ 23.6ᶜ 24.0ᵈ 23.9ᵈ 24.6ᵃ 24.9ᵃ 23.2ᶜ 24.3ᵃᵈ 25.1ᵃ 0.25 <0.001
48 24.2ᵃ 21.9ᵇ 24.4ᵃ 22.8ᶜ 23.4ᵈ 22.6ᶜ 24.2ᵃ 23.0ᵈ 22.4ᶜ 22.5ᶜ 23.2ᵈ 0.23 <0.001
Butyrate
24 10.1ᵃ 9.7ᵃ 12.5ᵇ 9.5ᵃ 10.1ᵃ 11.9ᵇ 9.8ᵃ 9.3ᶜ 10.1ᵃ 9.7ᵃ 9.3ᶜ 0.28 <0.001
48 10.2ᵃᵉ 10.3ᵃ 9.0ᵇ 9.7ᶜᶠ 10.3ᵃ 11.8ᵈ 10.2ᵃ 10.0ᵉ 10.1ᵉ 9.6ᶜ 9.8ᶠ 0.08 <0.001
Acetae:propionate
24 2.5ᵃ 2.6ᵇ 2.3ᶜ 2.7ᵈ 2.6ᵇ 2.6ᵇ 2.6ᵇ 2.5ᵃ 2.8ᵉ 2.6ᵇ 2.5ᵃ 0.04 <0.001
48 2.5ᵃ 2.9ᵇ 2.6ᶜ 2.8ᵈ 2.7ᵉ 2.7ᵉ 2.6ᶜ 2.8ᵈ 2.8ᵈ 2.9ᵇ 2.7ᵉ 0.03 <0.001
Means within row with different superscripts letters are different (P<0.05); Total volatile fatty acid (TVFA), control (CON), anise oil (ANO), cassia oil (CSO), citronella oil
(CTO), clove oil (CLO), control (CON), cornmint oil (CMO), eucalyptus oil (ETO), juniper berry oil (JPO), lavender oil (LVO), mandarin oil (MDO) and rosemary oil (RMO);
EOs= essential oils
149
4.4.2. Effect of EOs on fatty acid metabolism
The effects of EOs on concentration of selected C14 and C16 fatty acids in cultures are summarized in
Table 4.5. There was no effect of treatments on the concentration of C14 at 12 and 24 h period of
incubation. However, half of the added EOs (ANO, CSO, CLO, JPO and MDO) reduced (P<0.001) the
concentration of C14 after 48 h.
Although the levels of C16:0 were not significantly different between the control and the added oils at 12
h period, it was reduced (P<0.001) with the addition of CSO, CMO, ETO and RMO (mean 14.0 g/100 g
TFA) compared to the control (15.0 g/100 g TFA) at 24 h. However, at 48 h, the content of C16:0 was
decreased with the inclusion of all EOs in cultures (mean 6.0 g/100 TFA) except the cultures
supplemented with CSO which did not affect the levels of C16:0 relative to the control (7.0 g/100 g
TFA).
Relative to the control (2.7 g/100 TFA), the concentration of C16:1 at 12 h was increased by all
treatments except CLO, JPO and MDO, with CSO showing the highest increase (3.3 g/100 TFA). At 24 h
the content of C16:1 in cultures was increased with the inclusion of all EOs except ANO, JPO and LVO
which maintained the levels of C16:1 similar to the control. Except the addition of CLO, CTO and JPO
which did not affect the concentration of C16:1 compared to the control (2.7 g/100 g TFA), the levels of
C16:1were increased with all additives, with ANO the highest (3.0 g/100 TFA).
Indicated in Table 4.6 are concentrations of selected C18 fatty acids in cultures during incubation. Except
for CSO (12 h) and RMO (24 h) which reduced (P<0.001) the content of 18:0 compared to the control,
there was no effect of EOs inclusion on the production of stearic acid. At 48 h, the vessels with added
MDO and CTO had the highest content of C18:0 (Mean values 12.6 g/100 g TFA) compared to the
control (6.9 g/100 g TFA).
The concentration of C18:1 n-9 at 12 h was significantly highest in CSO (8.4 g/100 g TFA) followed by
ANO and CTO (means 7.9 g/100 g TFA) compared to the control (7.4 g/100 g TFA). At 24 h period of
incubation, the fermentation vessel content of C18:1 n-9 was highest (P<0.001) in ANO, CSO, CTO and
MDO (means 8.4 g/100 g TFA) and lowest (P<0.001) in RMO, ETO and CLO (means 7.3 g/100 g TFA)
150
relative to the control (6.0 g/100 g TFA). After 48 h, the level of C18:1 n-9 in cultures was not affected
with the inclusion of five of the extracts (CSO, CLO, ETO, JPO and LVO) but it was significantly
increased with the rest of the treatments.
The levels of C18:1 trans 11 were increased (P<0.001) with all EOs at 12 h relative to the control (1.1
g/100 g TFA), with the highest content found in cultures supplemented with CSO (1.6 g/100 g TFA). At
24 h period of incubation, the content of C18:1 trans 11 was highest in CSO relative to the control.
Majority of the added EOs increased (P<0.001) the concentration of C18:1 trans 11 in cultures after 48 h,
with JPO, CTO and LVO being the most effective EOs (means 3.1 g/100 g TFA), compared to the control
(1.96 g/100 g).
Except for CSO, CTO and ANO at 12, 24 h and 48 h respectively, which increased (P<0.001) the content
of cis-9 trans 11 CLA, there was no effect of treatment on the content of cis-9 trans-11 18:2 CLA during
incubation.
The content of C18:2 n-6 decreased with time, being highest at 12 h and lowest at 48 h, in both the
control and the EOs cultures. At 24 h, relative to the control, the inclusion of all EOs maintained higher
(P<0.001) the content of C18:2 n-6 in cultures though at varying levels, being highest in CSO (6.0 g/100
g TFA) and ANO (5.4 g/100 g TFA), and lowest in CLO, ETO and LVO (means 3.3 g/100 g TFA),
compared to the control (2.2 g/100 TFA). At 48 h, ANO had the highest (P<0.001) concentration of
C18:2 n-6 (2.8 g/100 g TFA) and the lowest levels were observed in CSO, CTO and ETO (means 1.5
g/100 g TFA). The level of C18:2 n-6 in cultures with other additives was intermediate between the
highest and the lowest treatments.
The vessel content of C18:3 n-3 also decreased with time, being highest at 12 h and lowest at 48 h, in
both the CON and in all EOs cultures. Relative to the control, within the EOs, the concentration of C18:3
n-3 was consistently highest (P<0.001) in ANO and CSO (mean values were more than 2-fold), and
consistently lowest (P<0.001) in ETO and JPO at 12 and 24 h. At 48 h, the content of C18:3 n-3 was
maintained at the highest levels (P<0.001) with the addition of ANO (4.2 g/100 g TFA), a level which is
151
more than twice compared to the least effective EO (CSO; 1.8 g/100 g TFA), and the CON (1.6 g/100 g
TFA).
The concentrations of selected C20 fatty acids are presented in Table 4.7. At 12 and 24 h, the level of
C20:4 n-6 was decreased with the addition of all EOs except CLO, ETO, JPO and LVO (12 h) and CLO,
ETO and JPO (24 h), relative to the control. At 48 h, it was observed that ANO and MDO had the lowest
concentration of C20:4 n-6 (means 0.4 g/100 g TFA) compared to the control (0.7 g/100 g TFA).
In both the control and EOs, the concentration of C20:5 n-3 decreased with increase in the time of
incubation, being highest at 12 h (means 3.6 g/100 g TFA) and lowest at 48 h (means 1.0 g/100 g TFA).
The concentrations of C20:5 n-3 at 12 and 24 h of incubation were highest in cultures supplemented with
ANO, CSO and CMO (means 3.1 and 2.5 g/100 g TFA for 12 and 24 h respectively) and lowest in ETO
and JPO (means 2.2 and 2.0 g/100 g TFA for 12 and 24 h respectively) compared to the CON (1.7 and 1.4
g/100 g TFA for 12 and 24 h respectively). At 48 h, the most effective EO was ANO, which had about a
four-fold increase (1.9 g/100 g TFA) in the content of C20:5 n-3 compared to the control (0.5 g/100 g
TFA), whilst the vessel effluent content of C20:5 n-3 in the least effective extract (CSO) was 0.6 g/100 g
TFA. Increasing the time of incubation also decreased the content of C22:6 n-3 in cultures, being highest
in ANO and CMO (means 1.7 g/100 g TFA) and lowest in CSO (0.8 g/100 g TFA) after 48 h, relative to
the control (0.9 g/100 g TFA). Other added extracts maintained intermediate effect between ANO and
CSO on the concentration of C22:6 n-3 in cultures.
The concentrations of sums of fatty acids (g/100 g TFA) and content of total fatty acid (mg/g) are
presented in Table 4.8. The levels of remaining fatty acids (RFA) were significantly reduced in cultures
with added EOs at all times of incubation except ETO and RMO (24 h), and CSO, CLO and ETO (48 h).
The levels of ∑SFA in cultures at 12 h were increased by all EOs except CSO which reduced (P<0.001),
and RMO, which had a similar level of ∑SFA to the control. At 24 h the content of ∑SFA was highest in
cultures with CTO, MDO and LVO, but ∑SFA was not different between the control and majority of the
extracts after 48 h period of incubation. However, the levels of SFA at 48 h were significantly reduced
(P<0.001) with the addition of all EOs when SFA was calculated without C18:0 (i.e. ∑SFA-C18:0).
152
At both 12 and 24 h, the content of ∑MUFA in cultures with CLO and LVO was similar to the control
(18.6 and 21.8 g/100 g TFA), but reduced with the addition of other EOs, being lowest in ANO (16.8 and
18.8 g/100 TFA, for 12 and 24 h respectively). At the last hour of incubation (48 h), majority of the
treatments (CTO, CLO, CMO, ETO, LVO and RMO) did not affect the levels of ∑MUFA in cultures but
it was reduced by the rest of the added EOs.
The content of ∑PUFA) decreased with increase in the time of incubation (i.e. highest at 12 h and lowest
at 48 h), and was highest (P<0.001) in ANO (11.1 g/100 g TFA) and lowest in CSO and CTO (mean
values 5.4 g/100 g TFA) at 48 h, relative to the control (4.8 g/100 TFA).
At 24 h, the amount of TFA (mg/g) was significantly reduced (P<0.001) by majority of the EOs relative
to the control, except ANO and RMO which did not affect this concentration (Table 4.8). However, at 48
h, the inclusion of ANO, LVO and MDO (means 38.1 mg/g) reduced (P<0.001) the content of TFA
compared to the control (43.5 mg/g), with other treatments showing no effect.
The ∑n-6/∑n-3 was lowest in cultures with ANO (24 and 48 h), CSO, CTO, CMO, ETO, MDO and
RMO (24), and consistently highest in the control at all times of incubation (Table 4.9).
The ratio of PUFA to SFA ratio (P: S) in cultures decreased with time, and was consistently highest in
vessels with ANO and CSO at both 12 and 24 h (means 0.7 and 0.75, for 12 and 24 h, respectively)
relative to the control (0.5 and 0.3 for 12 h and 24 h respectively, Table 4.9). At 48 h of incubation, the
ratio of P/S in cultures with ANO was double (0.4) the content of P/S in the control (0.2).
Table 4.10 shows the biohydrogenation (g/100 g) of C18:2 n-6 and n-3 PUFA. The extent of
biohydrogenation of linoleic acid in the fermentation vessels increased as the time of incubation
progressed, being lowest at 12 h and highest at 48 h. At 24 h, the biohydrogenation of C18:2 n -6 was
lowest (P<0.001) in ANO and CSO (mean values 40.8 g/100 g), and highest in ETO (69.4 g/100 g),
relative to the control (76.1 g/100 g), with the rest of the treatments showing effects which are
intermediate between the control and the most effective treatments (ANO and CSO). At 48 h of
incubation, the biohydrogenation of C18:2 n-6 was highest in the control, CSO and ETO (means 86.7
153
g/100 g), followed by CTO, CMO, JPO and RMO (means 79.8 g/100 g), and lowest in ANO (68.6 g/100
g).
The pattern of effects of EOs on biohydrogenation of C18:3 n-3 was similar to their reported effects on
the disappearance of vessel content of C18:2 n-6, being lowest in ANO (69.5 g/100 g), followed by CLO
and MDO (means 78.0 g/100 g), and highest in the control, CSO and ETO (means values 89.3 g/100 g) at
48 h time of incubation.
The extent of disappearance of C20:5 n-3 in vessels increased as the time of incubation advanced, being
lowest at 12 h and highest at 48 h. After 48 h, the quantity of the content of C20:5 n-3 in vessel which
disappeared was highest in the control and CSO (means 85.2 g/100 g), and lowest in ANO (42.0 g/100 g),
with the remaining treatments having intermediate values. The trend of biohydrogenation in the vessel
content of C22:6 n-3 was similar to the reported trend in the biohydrogenation of C20:5 n-3, with ANO
showing the highest (P<0.001) potential to reduce the disappearance of C22:6 n-3 after 24 and 48 h,
whilst control and CSO, had the lowest potential at 48 h.
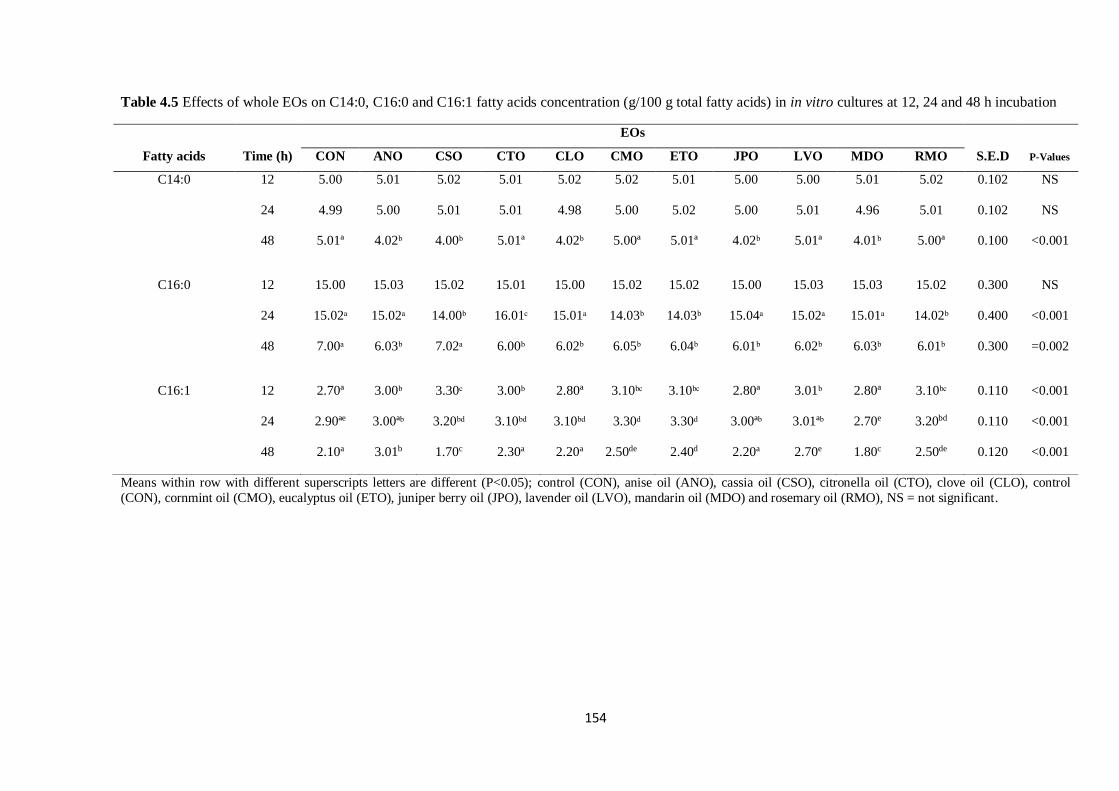
154
Table 4.5 Effects of whole EOs on C14:0, C16:0 and C16:1 fatty acids concentration (g/100 g total fatty acids) in in vitro cultures at 12, 24 and 48 h incubation
EOs
Fatty acids Time (h) CON ANO CSO CTO CLO CMO ETO JPO LVO MDO RMO S.E.D P-Values
C14:0 12 5.00 5.01 5.02 5.01 5.02 5.02 5.01 5.00 5.00 5.01 5.02 0.102 NS
24 4.99 5.00 5.01 5.01 4.98 5.00 5.02 5.00 5.01 4.96 5.01 0.102 NS
48 5.01ª 4.02ᵇ 4.00ᵇ 5.01ª 4.02ᵇ 5.00ª 5.01ª 4.02ᵇ 5.01ª 4.01ᵇ 5.00ª 0.100 <0.001
C16:0 12 15.00 15.03 15.02 15.01 15.00 15.02 15.02 15.00 15.03 15.03 15.02 0.300 NS
24 15.02ᵃ 15.02ᵃ 14.00ᵇ 16.01ᶜ 15.01ᵃ 14.03ᵇ 14.03ᵇ 15.04ᵃ 15.02ᵃ 15.01ᵃ 14.02ᵇ 0.400 <0.001
48 7.00ᵃ 6.03ᵇ 7.02ᵃ 6.00ᵇ 6.02ᵇ 6.05ᵇ 6.04ᵇ 6.01ᵇ 6.02ᵇ 6.03ᵇ 6.01ᵇ 0.300 =0.002
C16:1 12 2.70ª 3.00ᵇ 3.30ᶜ 3.00ᵇ 2.80ª 3.10ᵇᶜ 3.10ᵇᶜ 2.80ª 3.01ᵇ 2.80ª 3.10ᵇᶜ 0.110 <0.001
24 2.90ªe 3.00ªᵇ 3.20ᵇᵈ 3.10ᵇᵈ 3.10ᵇᵈ 3.30ᵈ 3.30ᵈ 3.00ªᵇ 3.01ªᵇ 2.70e 3.20bd 0.110 <0.001
48 2.10a 3.01b 1.70c 2.30a 2.20a 2.50de 2.40d 2.20a 2.70e 1.80c 2.50de 0.120 <0.001
Means within row with different superscripts letters are different (P<0.05); control (CON), anise oil (ANO), cassia oil (CSO), citronella oil (CTO), clove oil (CLO), control
(CON), cornmint oil (CMO), eucalyptus oil (ETO), juniper berry oil (JPO), lavender oil (LVO), mandarin oil (MDO) and rosemary oil (RMO), NS = not significant.
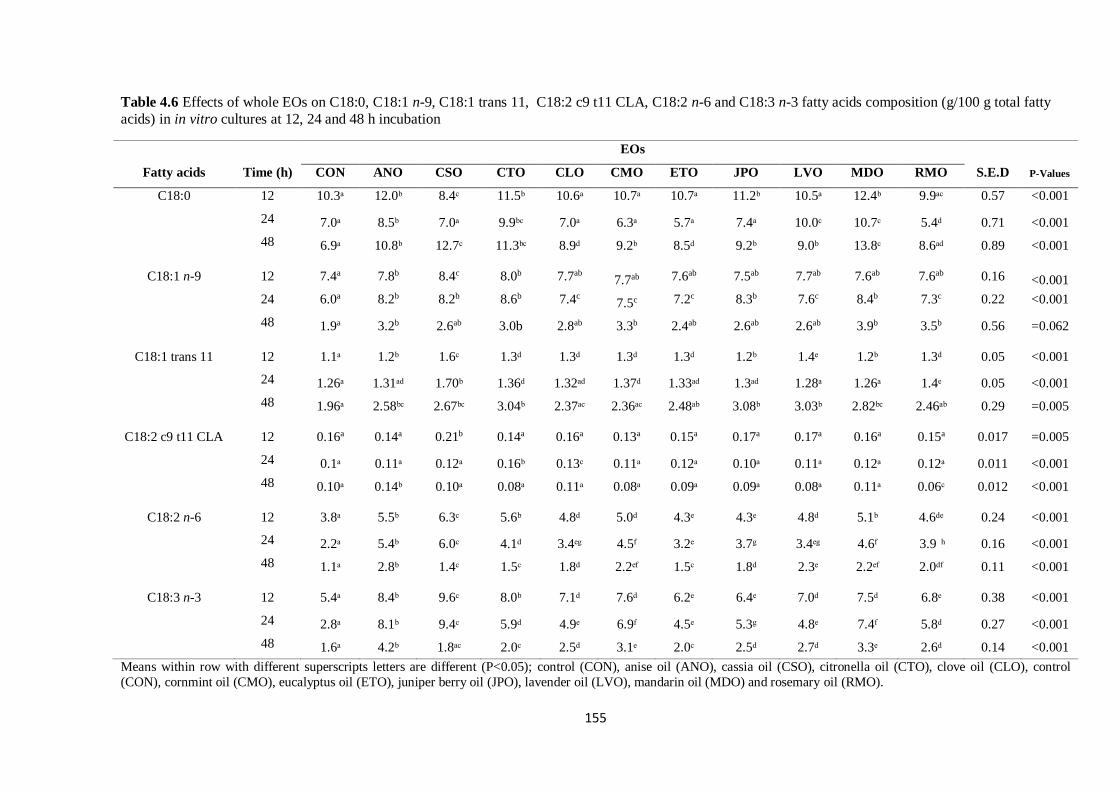
155
Table 4.6 Effects of whole EOs on C18:0, C18:1 n-9, C18:1 trans 11, C18:2 c9 t11 CLA, C18:2 n-6 and C18:3 n-3 fatty acids composition (g/100 g total fatty
acids) in in vitro cultures at 12, 24 and 48 h incubation
EOs
Fatty acids Time (h) CON ANO CSO CTO CLO CMO ETO JPO LVO MDO RMO S.E.D P-Values
C18:0 12 10.3ᵃ 12.0ᵇ 8.4ᶜ 11.5ᵇ 10.6ᵃ 10.7ᵃ 10.7ᵃ 11.2ᵇ 10.5ᵃ 12.4ᵇ 9.9ᵃᶜ 0.57 <0.001
24 7.0ᵃ 8.5ᵇ 7.0ᵃ 9.9ᵇᶜ 7.0ᵃ 6.3ᵃ 5.7ᵃ 7.4ᵃ 10.0ᶜ 10.7ᶜ 5.4ᵈ 0.71 <0.001
48 6.9ᵃ 10.8ᵇ 12.7ᶜ 11.3ᵇᶜ 8.9ᵈ 9.2ᵇ 8.5ᵈ 9.2ᵇ 9.0ᵇ 13.8ᶜ 8.6ᵃᵈ 0.89 <0.001
C18:1 n-9 12 7.4a 7.8b 8.4c 8.0b 7.7ab 7.7ab 7.6ab 7.5ab 7.7ab 7.6ab 7.6ab 0.16 <0.001
24 6.0a 8.2b 8.2b 8.6b 7.4c 7.5c 7.2c 8.3b 7.6c 8.4b 7.3c 0.22 <0.001
48 1.9a 3.2b 2.6ab 3.0b 2.8ab 3.3b 2.4ab 2.6ab 2.6ab 3.9b 3.5b 0.56 =0.062
C18:1 trans 11 12 1.1ᵃ 1.2ᵇ 1.6ᶜ 1.3ᵈ 1.3ᵈ 1.3ᵈ 1.3ᵈ 1.2ᵇ 1.4ᵉ 1.2ᵇ 1.3ᵈ 0.05 <0.001
24 1.26ᵃ 1.31ᵃᵈ 1.70ᵇ 1.36ᵈ 1.32ᵃᵈ 1.37ᵈ 1.33ᵃᵈ 1.3ᵃᵈ 1.28ᵃ 1.26ᵃ 1.4ᵉ 0.05 <0.001
48 1.96ᵃ 2.58ᵇᶜ 2.67ᵇᶜ 3.04ᵇ 2.37ᵃᶜ 2.36ᵃᶜ 2.48ᵃᵇ 3.08ᵇ 3.03ᵇ 2.82ᵇᶜ 2.46ᵃᵇ 0.29 =0.005
C18:2 c9 t11 CLA 12 0.16a 0.14a 0.21b 0.14a 0.16a 0.13a 0.15a 0.17a 0.17a 0.16a 0.15a 0.017 =0.005
24 0.1ᵃ 0.11ᵃ 0.12ᵃ 0.16ᵇ 0.13ᶜ 0.11ᵃ 0.12ᵃ 0.10ᵃ 0.11ᵃ 0.12ᵃ 0.12ᵃ 0.011 <0.001
48 0.10ᵃ 0.14ᵇ 0.10ᵃ 0.08ᵃ 0.11ᵃ 0.08ᵃ 0.09ᵃ 0.09ᵃ 0.08ᵃ 0.11ᵃ 0.06ᶜ 0.012 <0.001
C18:2 n-6 12 3.8ᵃ 5.5ᵇ 6.3ᶜ 5.6ᵇ 4.8ᵈ 5.0ᵈ 4.3ᵉ 4.3ᵉ 4.8ᵈ 5.1ᵇ 4.6ᵈᵉ 0.24 <0.001
24 2.2ᵃ 5.4ᵇ 6.0ᶜ 4.1ᵈ 3.4ᵉᵍ 4.5ᶠ 3.2ᵉ 3.7ᵍ 3.4ᵉᵍ 4.6ᶠ 3.9 ͪ 0.16 <0.001
48 1.1ᵃ 2.8ᵇ 1.4ᶜ 1.5ᶜ 1.8ᵈ 2.2ᵉᶠ 1.5ᶜ 1.8ᵈ 2.3ᵉ 2.2ᵉᶠ 2.0ᵈᶠ 0.11 <0.001
C18:3 n-3 12 5.4ᵃ 8.4ᵇ 9.6ᶜ 8.0ᵇ 7.1ᵈ 7.6ᵈ 6.2ᵉ 6.4ᵉ 7.0ᵈ 7.5ᵈ 6.8ᵉ 0.38 <0.001
24 2.8ᵃ 8.1ᵇ 9.4ᶜ 5.9ᵈ 4.9ᵉ 6.9ᶠ 4.5ᵉ 5.3ᵍ 4.8ᵉ 7.4ᶠ 5.8ᵈ 0.27 <0.001
48 1.6ᵃ 4.2ᵇ 1.8ᵃᶜ 2.0ᶜ 2.5ᵈ 3.1ᵉ 2.0ᶜ 2.5ᵈ 2.7ᵈ 3.3ᵉ 2.6ᵈ 0.14 <0.001
Means within row with different superscripts letters are different (P<0.05); control (CON), anise oil (ANO), cassia oil (CSO), citronella oil (CTO), clove oil (CLO), control
(CON), cornmint oil (CMO), eucalyptus oil (ETO), juniper berry oil (JPO), lavender oil (LVO), mandarin oil (MDO) and rosemary oil (RMO).
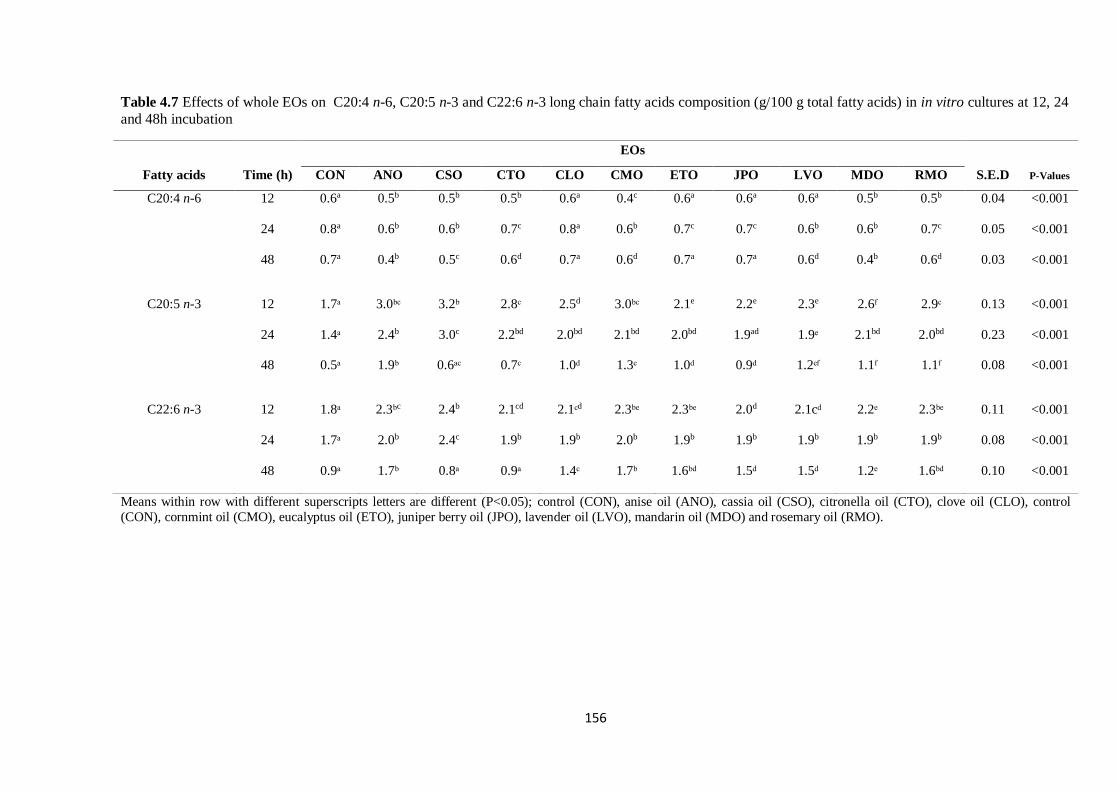
156
Table 4.7 Effects of whole EOs on C20:4 n-6, C20:5 n-3 and C22:6 n-3 long chain fatty acids composition (g/100 g total fatty acids) in in vitro cultures at 12, 24
and 48h incubation
EOs
Fatty acids Time (h) CON ANO CSO CTO CLO CMO ETO JPO LVO MDO RMO S.E.D P-Values
C20:4 n-6 12 0.6a 0.5b 0.5b 0.5b 0.6a 0.4c 0.6a 0.6a 0.6a 0.5b 0.5b 0.04 <0.001
24 0.8a 0.6b 0.6b 0.7c 0.8a 0.6b 0.7c 0.7c 0.6b 0.6b 0.7c 0.05 <0.001
48 0.7a 0.4b 0.5c 0.6d 0.7a 0.6d 0.7a 0.7a 0.6d 0.4b 0.6d 0.03 <0.001
C20:5 n-3 12 1.7ᵃ 3.0ᵇᶜ 3.2ᵇ 2.8ᶜ 2.5d 3.0ᵇᶜ 2.1e 2.2e 2.3e 2.6ᶠ 2.9ᶜ 0.13 <0.001
24 1.4ᵃ 2.4b 3.0c 2.2bd 2.0bd 2.1bd 2.0bd 1.9ad 1.9ᵉ 2.1bd 2.0bd 0.23 <0.001
48 0.5ᵃ 1.9ᵇ 0.6ᵃᶜ 0.7ᶜ 1.0ᵈ 1.3ᵉ 1.0ᵈ 0.9ᵈ 1.2ᵉᶠ 1.1ᶠ 1.1ᶠ 0.08 <0.001
C22:6 n-3 12 1.8ᵃ 2.3ᵇc 2.4b 2.1cd 2.1ᶜd 2.3ᵇᵉ 2.3ᵇᵉ 2.0d 2.1cᵈ 2.2ᵉ 2.3ᵇᵉ 0.11 <0.001
24 1.7ᵃ 2.0b 2.4c 1.9b 1.9b 2.0b 1.9b 1.9b 1.9b 1.9b 1.9b 0.08 <0.001
48 0.9ᵃ 1.7ᵇ 0.8ᵃ 0.9ᵃ 1.4ᶜ 1.7ᵇ 1.6ᵇᵈ 1.5ᵈ 1.5ᵈ 1.2ᵉ 1.6ᵇᵈ 0.10 <0.001
Means within row with different superscripts letters are different (P<0.05); control (CON), anise oil (ANO), cassia oil (CSO), citronella oil (CTO), clove oil (CLO), control
(CON), cornmint oil (CMO), eucalyptus oil (ETO), juniper berry oil (JPO), lavender oil (LVO), mandarin oil (MDO) and rosemary oil (RMO).
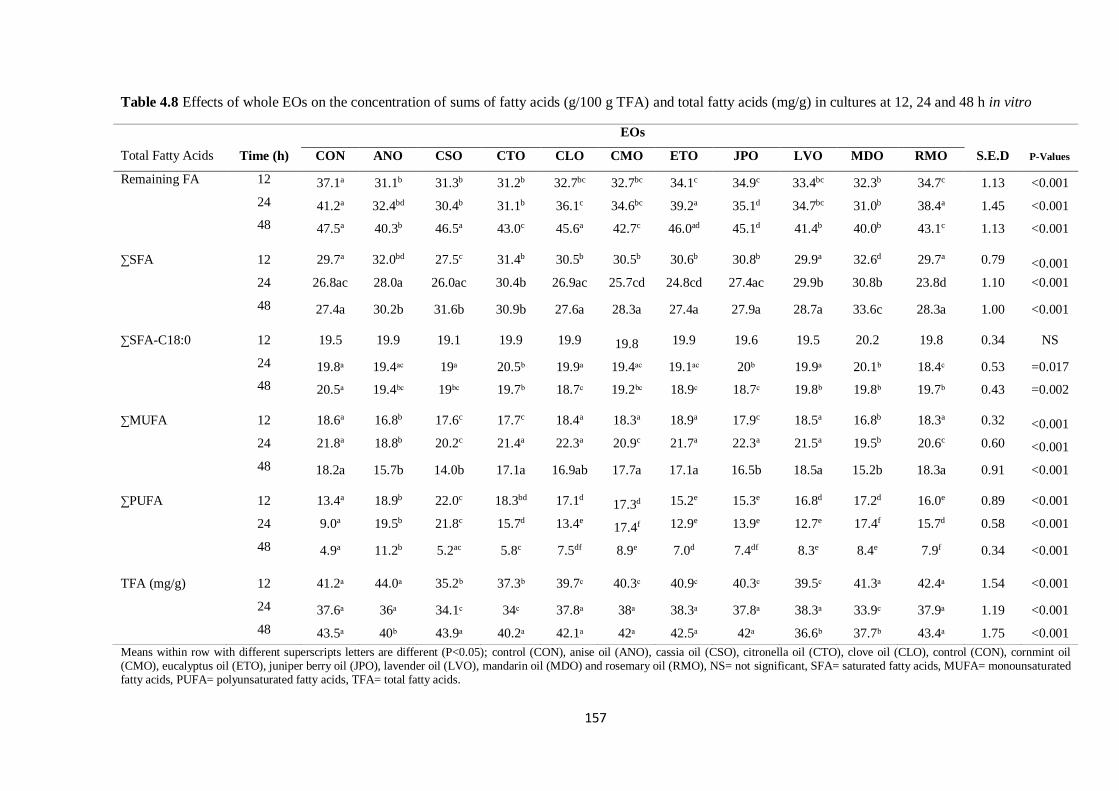
157
Table 4.8 Effects of whole EOs on the concentration of sums of fatty acids (g/100 g TFA) and total fatty acids (mg/g) in cultures at 12, 24 and 48 h in vitro
EOs
Total Fatty Acids Time (h) CON ANO CSO CTO CLO CMO ETO JPO LVO MDO RMO S.E.D P-Values
Remaining FA 12 37.1a 31.1b 31.3b 31.2b 32.7bc 32.7bc 34.1c 34.9c 33.4bc 32.3b 34.7c 1.13 <0.001
24 41.2a 32.4bd 30.4b 31.1b 36.1c 34.6bc 39.2a 35.1d 34.7bc 31.0b 38.4a 1.45 <0.001
48 47.5a 40.3b 46.5a 43.0c 45.6a 42.7c 46.0ad 45.1d 41.4b 40.0b 43.1c 1.13 <0.001
∑SFA 12 29.7a 32.0bd 27.5c 31.4b 30.5b 30.5b 30.6b 30.8b 29.9a 32.6d 29.7a 0.79 <0.001
24 26.8ac 28.0a 26.0ac 30.4b 26.9ac 25.7cd 24.8cd 27.4ac 29.9b 30.8b 23.8d 1.10 <0.001
48 27.4a 30.2b 31.6b 30.9b 27.6a 28.3a 27.4a 27.9a 28.7a 33.6c 28.3a 1.00 <0.001
∑SFA-C18:0 12 19.5 19.9 19.1 19.9 19.9 19.8 19.9 19.6 19.5 20.2 19.8 0.34 NS
24 19.8ᵃ 19.4ᵃᶜ 19ᵃ 20.5ᵇ 19.9ᵃ 19.4ᵃᶜ 19.1ᵃᶜ 20ᵇ 19.9ᵃ 20.1ᵇ 18.4ᶜ 0.53 =0.017
48 20.5ᵃ 19.4ᵇᶜ 19ᵇᶜ 19.7ᵇ 18.7ᶜ 19.2ᵇᶜ 18.9ᶜ 18.7ᶜ 19.8ᵇ 19.8ᵇ 19.7ᵇ 0.43 =0.002
∑MUFA 12 18.6a 16.8b 17.6c 17.7c 18.4a 18.3a 18.9a 17.9c 18.5a 16.8b 18.3a 0.32 <0.001
24 21.8a 18.8b 20.2c 21.4a 22.3a 20.9c 21.7a 22.3a 21.5a 19.5b 20.6c 0.60 <0.001
48 18.2a 15.7b 14.0b 17.1a 16.9ab 17.7a 17.1a 16.5b 18.5a 15.2b 18.3a 0.91 <0.001
∑PUFA 12 13.4a 18.9b 22.0c 18.3bd 17.1d 17.3d 15.2e 15.3e 16.8d 17.2d 16.0e 0.89 <0.001
24 9.0a 19.5b 21.8c 15.7d 13.4e 17.4f 12.9e 13.9e 12.7e 17.4f 15.7d 0.58 <0.001
48 4.9a 11.2b 5.2ac 5.8c 7.5df 8.9e 7.0d 7.4df 8.3e 8.4e 7.9f 0.34 <0.001
TFA (mg/g) 12 41.2ᵃ 44.0ᵃ 35.2ᵇ 37.3ᵇ 39.7ᶜ 40.3ᶜ 40.9ᶜ 40.3ᶜ 39.5ᶜ 41.3ᵃ 42.4ᵃ 1.54 <0.001
24 37.6ᵃ 36ᵃ 34.1ᶜ 34ᶜ 37.8ᵃ 38ᵃ 38.3ᵃ 37.8ᵃ 38.3ᵃ 33.9ᶜ 37.9ᵃ 1.19 <0.001
48 43.5ᵃ 40ᵇ 43.9ᵃ 40.2ᵃ 42.1ᵃ 42ᵃ 42.5ᵃ 42ᵃ 36.6ᵇ 37.7ᵇ 43.4ᵃ 1.75 <0.001
Means within row with different superscripts letters are different (P<0.05); control (CON), anise oil (ANO), cassia oil (CSO), citronella oil (CTO), clove oil (CLO), control (CON), cornmint oil (CMO), eucalyptus oil (ETO), juniper berry oil (JPO), lavender oil (LVO), mandarin oil (MDO) and rosemary oil (RMO), NS= not significant, SFA= saturated fatty acids, MUFA= monounsaturated fatty acids, PUFA= polyunsaturated fatty acids, TFA= total fatty acids.
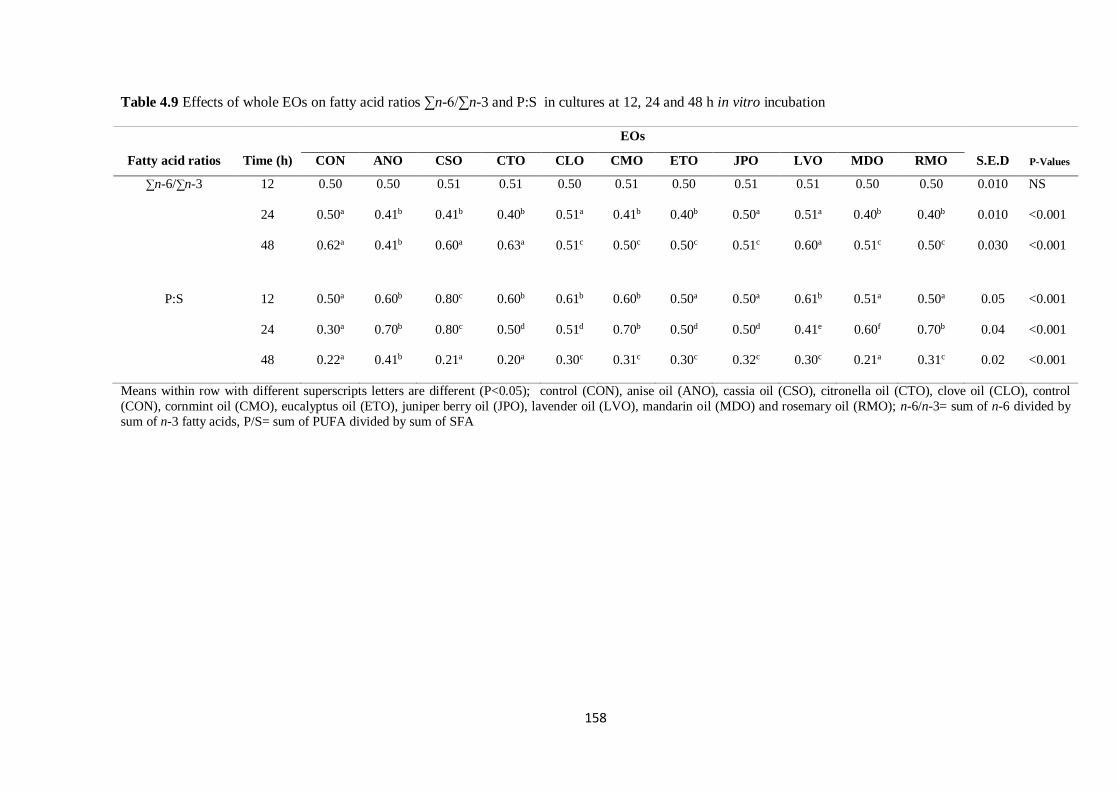
158
Table 4.9 Effects of whole EOs on fatty acid ratios ∑n-6/∑n-3 and P:S in cultures at 12, 24 and 48 h in vitro incubation
EOs
Fatty acid ratios Time (h) CON ANO CSO CTO CLO CMO ETO JPO LVO MDO RMO S.E.D P-Values
∑n-6/∑n-3 12 0.50 0.50 0.51 0.51 0.50 0.51 0.50 0.51 0.51 0.50 0.50 0.010 NS
24 0.50a 0.41b 0.41b 0.40b 0.51a 0.41b 0.40b 0.50a 0.51a 0.40b 0.40b 0.010 <0.001
48 0.62a 0.41b 0.60a 0.63a 0.51c 0.50c 0.50c 0.51c 0.60a 0.51c 0.50c 0.030 <0.001
P:S 12 0.50a 0.60b 0.80c 0.60b 0.61b 0.60b 0.50a 0.50a 0.61b 0.51a 0.50a 0.05 <0.001
24 0.30a 0.70b 0.80c 0.50d 0.51d 0.70b 0.50d 0.50d 0.41e 0.60f 0.70b 0.04 <0.001
48 0.22a 0.41b 0.21a 0.20a 0.30c 0.31c 0.30c 0.32c 0.30c 0.21a 0.31c 0.02 <0.001
Means within row with different superscripts letters are different (P<0.05); control (CON), anise oil (ANO), cassia oil (CSO), citronella oil (CTO), clove oil (CLO), control
(CON), cornmint oil (CMO), eucalyptus oil (ETO), juniper berry oil (JPO), lavender oil (LVO), mandarin oil (MDO) and rosemary oil (RMO); n-6/n-3= sum of n-6 divided by
sum of n-3 fatty acids, P/S= sum of PUFA divided by sum of SFA
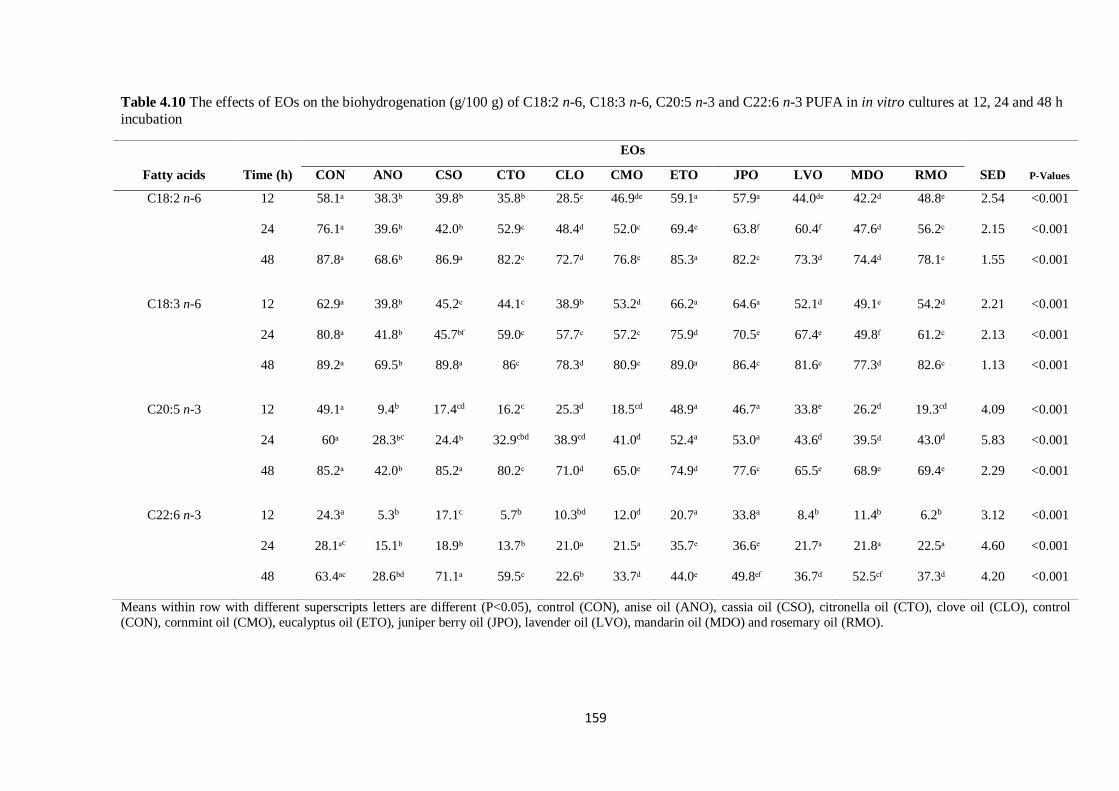
159
Table 4.10 The effects of EOs on the biohydrogenation (g/100 g) of C18:2 n-6, C18:3 n-6, C20:5 n-3 and C22:6 n-3 PUFA in in vitro cultures at 12, 24 and 48 h
incubation
EOs
Fatty acids Time (h) CON ANO CSO CTO CLO CMO ETO JPO LVO MDO RMO SED P-Values
C18:2 n-6 12 58.1ᵃ 38.3ᵇ 39.8ᵇ 35.8ᵇ 28.5ᶜ 46.9ᵈᵉ 59.1ᵃ 57.9ᵃ 44.0ᵈᵉ 42.2ᵈ 48.8ᵉ 2.54 <0.001
24 76.1ᵃ 39.6ᵇ 42.0ᵇ 52.9ᶜ 48.4ᵈ 52.0ᶜ 69.4ᵉ 63.8ᶠ 60.4ᶠ 47.6ᵈ 56.2ᶜ 2.15 <0.001
48 87.8ᵃ 68.6ᵇ 86.9ᵃ 82.2ᶜ 72.7ᵈ 76.8ᵉ 85.3ᵃ 82.2ᶜ 73.3ᵈ 74.4ᵈ 78.1ᵉ 1.55 <0.001
C18:3 n-6 12 62.9ᵃ 39.8ᵇ 45.2ᶜ 44.1ᶜ 38.9ᵇ 53.2ᵈ 66.2ᵃ 64.6ᵃ 52.1ᵈ 49.1ᵉ 54.2ᵈ 2.21 <0.001
24 80.8ᵃ 41.8ᵇ 45.7ᵇᶠ 59.0ᶜ 57.7ᶜ 57.2ᶜ 75.9ᵈ 70.5ᵉ 67.4ᵉ 49.8ᶠ 61.2ᶜ 2.13 <0.001
48 89.2ᵃ 69.5ᵇ 89.8ᵃ 86ᶜ 78.3ᵈ 80.9ᵉ 89.0ᵃ 86.4ᶜ 81.6ᵉ 77.3ᵈ 82.6ᵉ 1.13 <0.001
C20:5 n-3 12 49.1ᵃ 9.4b 17.4cd 16.2c 25.3d 18.5cd 48.9a 46.7a 33.8e 26.2d 19.3cd 4.09 <0.001
24 60ᵃ 28.3ᵇc 24.4ᵇ 32.9cbd 38.9cd 41.0d 52.4a 53.0a 43.6d 39.5ᵈ 43.0d 5.83 <0.001
48 85.2ᵃ 42.0ᵇ 85.2ᵃ 80.2ᶜ 71.0ᵈ 65.0ᵉ 74.9ᵈ 77.6ᶜ 65.5ᵉ 68.9ᵉ 69.4ᵉ 2.29 <0.001
C22:6 n-3 12 24.3a 5.3b 17.1c 5.7b 10.3bd 12.0d 20.7a 33.8a 8.4b 11.4b 6.2b 3.12 <0.001
24 28.1ᵃc 15.1ᵇ 18.9ᵇ 13.7ᵇ 21.0ᵃ 21.5ᵃ 35.7ᵉ 36.6ᵉ 21.7ᵃ 21.8ᵃ 22.5ᵃ 4.60 <0.001
48 63.4ᵃᶜ 28.6ᵇᵈ 71.1ᵃ 59.5ᶜ 22.6ᵇ 33.7ᵈ 44.0ᵉ 49.8ᵉᶠ 36.7ᵈ 52.5ᶜᶠ 37.3ᵈ 4.20 <0.001
Means within row with different superscripts letters are different (P<0.05), control (CON), anise oil (ANO), cassia oil (CSO), citronella oil (CTO), clove oil (CLO), control
(CON), cornmint oil (CMO), eucalyptus oil (ETO), juniper berry oil (JPO), lavender oil (LVO), mandarin oil (MDO) and rosemary oil (RMO).
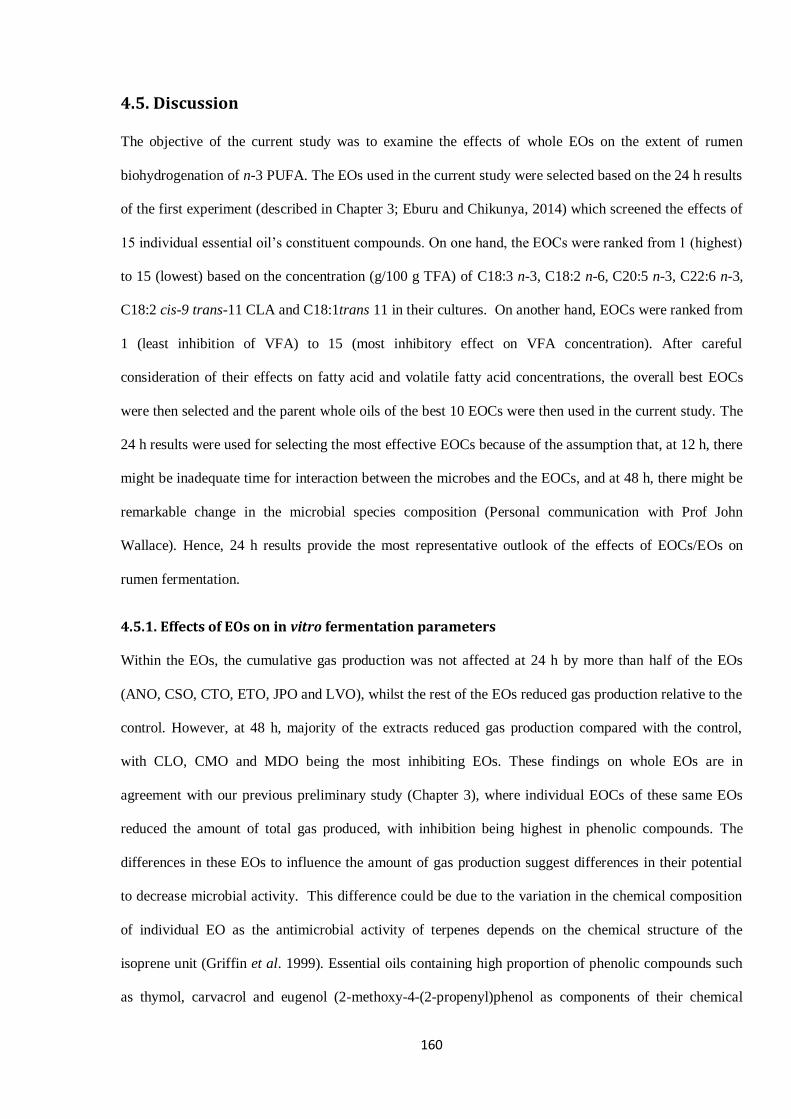
160
4.5. Discussion
The objective of the current study was to examine the effects of whole EOs on the extent of rumen
biohydrogenation of n-3 PUFA. The EOs used in the current study were selected based on the 24 h results
of the first experiment (described in Chapter 3; Eburu and Chikunya, 2014) which screened the effects of
15 individual essential oil’s constituent compounds. On one hand, the EOCs were ranked from 1 (highest)
to 15 (lowest) based on the concentration (g/100 g TFA) of C18:3 n-3, C18:2 n-6, C20:5 n-3, C22:6 n-3,
C18:2 cis-9 trans-11 CLA and C18:1trans 11 in their cultures. On another hand, EOCs were ranked from
1 (least inhibition of VFA) to 15 (most inhibitory effect on VFA concentration). After careful
consideration of their effects on fatty acid and volatile fatty acid concentrations, the overall best EOCs
were then selected and the parent whole oils of the best 10 EOCs were then used in the current study. The
24 h results were used for selecting the most effective EOCs because of the assumption that, at 12 h, there
might be inadequate time for interaction between the microbes and the EOCs, and at 48 h, there might be
remarkable change in the microbial species composition (Personal communication with Prof John
Wallace). Hence, 24 h results provide the most representative outlook of the effects of EOCs/EOs on
rumen fermentation.
4.5.1. Effects of EOs on in vitro fermentation parameters
Within the EOs, the cumulative gas production was not affected at 24 h by more than half of the EOs
(ANO, CSO, CTO, ETO, JPO and LVO), whilst the rest of the EOs reduced gas production relative to the
control. However, at 48 h, majority of the extracts reduced gas production compared with the control,
with CLO, CMO and MDO being the most inhibiting EOs. These findings on whole EOs are in
agreement with our previous preliminary study (Chapter 3), where individual EOCs of these same EOs
reduced the amount of total gas produced, with inhibition being highest in phenolic compounds. The
differences in these EOs to influence the amount of gas production suggest differences in their potential
to decrease microbial activity. This difference could be due to the variation in the chemical composition
of individual EO as the antimicrobial activity of terpenes depends on the chemical structure of the
isoprene unit (Griffin et al. 1999). Essential oils containing high proportion of phenolic compounds such
as thymol, carvacrol and eugenol (2-methoxy-4-(2-propenyl)phenol as components of their chemical
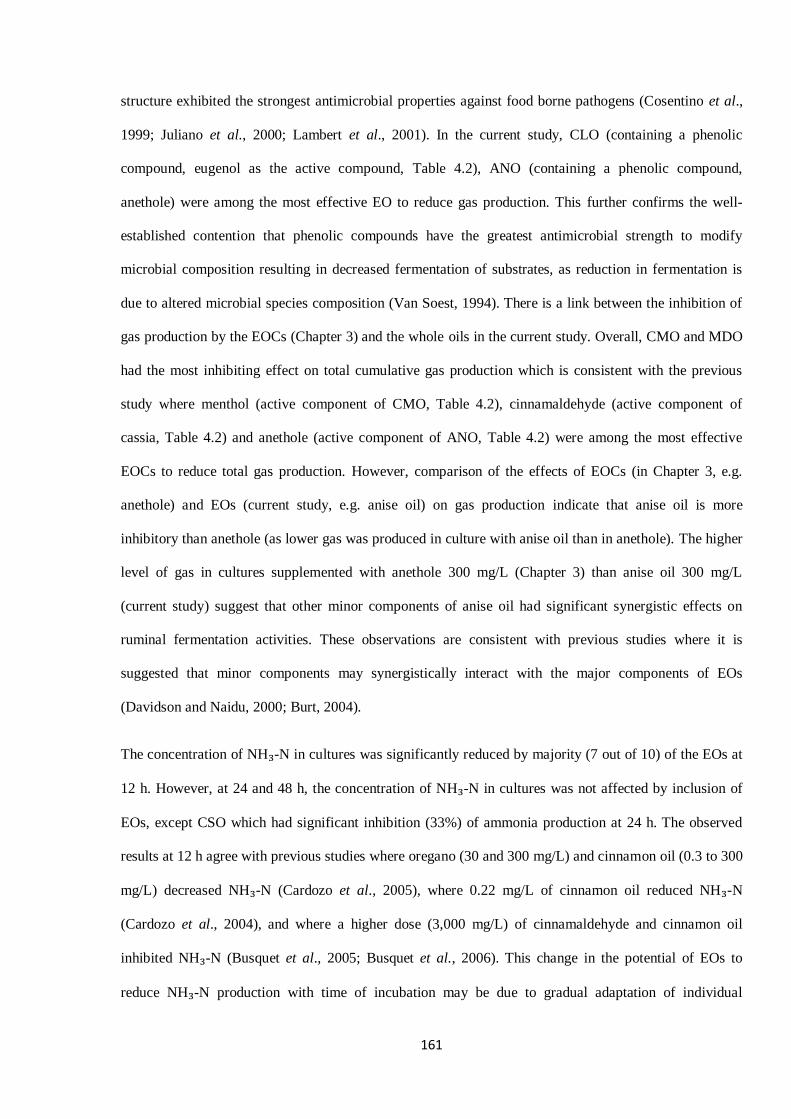
161
structure exhibited the strongest antimicrobial properties against food borne pathogens (Cosentino et al.,
1999; Juliano et al., 2000; Lambert et al., 2001). In the current study, CLO (containing a phenolic
compound, eugenol as the active compound, Table 4.2), ANO (containing a phenolic compound,
anethole) were among the most effective EO to reduce gas production. This further confirms the well-
established contention that phenolic compounds have the greatest antimicrobial strength to modify
microbial composition resulting in decreased fermentation of substrates, as reduction in fermentation is
due to altered microbial species composition (Van Soest, 1994). There is a link between the inhibition of
gas production by the EOCs (Chapter 3) and the whole oils in the current study. Overall, CMO and MDO
had the most inhibiting effect on total cumulative gas production which is consistent with the previous
study where menthol (active component of CMO, Table 4.2), cinnamaldehyde (active component of
cassia, Table 4.2) and anethole (active component of ANO, Table 4.2) were among the most effective
EOCs to reduce total gas production. However, comparison of the effects of EOCs (in Chapter 3, e.g.
anethole) and EOs (current study, e.g. anise oil) on gas production indicate that anise oil is more
inhibitory than anethole (as lower gas was produced in culture with anise oil than in anethole). The higher
level of gas in cultures supplemented with anethole 300 mg/L (Chapter 3) than anise oil 300 mg/L
(current study) suggest that other minor components of anise oil had significant synergistic effects on
ruminal fermentation activities. These observations are consistent with previous studies where it is
suggested that minor components may synergistically interact with the major components of EOs
(Davidson and Naidu, 2000; Burt, 2004).
The concentration of NH₃-N in cultures was significantly reduced by majority (7 out of 10) of the EOs at
12 h. However, at 24 and 48 h, the concentration of NH₃-N in cultures was not affected by inclusion of
EOs, except CSO which had significant inhibition (33%) of ammonia production at 24 h. The observed
results at 12 h agree with previous studies where oregano (30 and 300 mg/L) and cinnamon oil (0.3 to 300
mg/L) decreased NH₃-N (Cardozo et al., 2005), where 0.22 mg/L of cinnamon oil reduced NH₃-N
(Cardozo et al., 2004), and where a higher dose (3,000 mg/L) of cinnamaldehyde and cinnamon oil
inhibited NH₃-N (Busquet et al., 2005; Busquet et al., 2006). This change in the potential of EOs to
reduce NH₃-N production with time of incubation may be due to gradual adaptation of individual

162
microbial species to EO or shifts in microbial populations (Gladine et al., 2007). The gradual decrease in
the potency of EOs to inhibit ammonia N concentration with increase in time of incubation suggest that
the benefits associated with the use of essential oil as feed additive may decline over time. Reduced
concentration of NH₃-N (at 12 h) with the inclusion of EOs could be due to inhibition of microbial
enzymes responsible for amino acid deamination. As suggested in previous studies, inhibition of amino
acid deamination is the consequence of reduced proteolytic activity of the rumen (Mclnotch et al., 2003).
Bach et al. (2005) reported that different groups of microbes: HAP (with lower abundance but use amino
acids as energy source), proteolytic bacteria (with higher abundance and lower rate of NH₃-N producing
potential), and protozoa, are the major groups of microorganisms involved in NH₃-N production.
Therefore, the lower concentration of ammonia in some cultures could be due to inhibition of activities of
these predominant microorganisms by the addition of EOs (Mclnotch et al., 2003). Cassia oil containing
the phenolic compound, cinnamaldehyde (Table 4.2) had the highest inhibition of NH₃-N concentration
in cultures, further suggesting that phenolic compounds have the greatest and broadest antimicrobial
characteristics.
The inclusion of all EOs, except ETO and LVO at 24 h, significantly reduced TVFA at all times of
incubation compared to the control. As ruminants derive the majority of their energy from VFA
(Bergman, 1990), a reduction in VFA of the magnitude observed (over 10% average reduction) with all
EOs except ETO and LVO would suggest a gross inhibition of rumen function. Inhibition of TVFA in the
current study agrees with a number of previous studies such as Eburu and Chikunya (2014), where
inclusion of 300 mg/L of EOCs reduced TVFA; Gunal et al. (2013), where different doses of citronella
oil (125, 250 and 500 mg/L) reduced TVFA; and Agarwal et al. (2009), where 1.0 and 2.0 ml/L of
peppermint oil depressed feed digestibility and TVFA production, and, Busquet et al. (2005), where
inclusion of higher dose (3000 mg/L) of whole EO and individual components such as cinnamon oil and
cinnamaldehyde (3000 mg/L) reduced TVFA. By contrast, the use of anise at 0.22 mg/L in continuous
culture experiment did not change the profile of TVFA (Cardozo et al. (2004), and lavender oil (5, 50 and
500 mg/L) did not modify rumen fermentation parameters after 24 h (Castillejos et al., 2008). The
difference in the production of TVFA between the current study and the study of Cardozo et al. (2004)
163
could be understood from the point of view of the difference in the dose of EOs. Addition of EO to
cultures may decrease (at high doses) or have no effect (at low doses) on TVFA concentration, depending
on the concentration of the EOs to alter feed nutrient digestibility (Patra and Saxena, 2010). In addition,
previous studies suggested that effects of EO on VFA are not always consistent, but determined by the
dose and type of EO (Bustquet et al., 2006), and the pH of the rumen (Cardozo et al., 2005). In the
current study, the reduction on the concentration of TVFA was consistent with the reported reduction on
cumulative gas production after 48 h period of incubation. Reduced digestion in feed which is reflected
on decreased production of gas can be accompanied by less production of hydrogen, CH4 and volatile
fatty acids plus a lower A/P ratio (Boggs et al., 1987).
In the current study, CSO (with cinnamaldehyde as active component, Table 4.2) was the only additive
that reduced the molar proportion of acetate relative to the control, the rest of the extracts increased
acetate. This supports the finding in the first experiment (Chapter 3) where cinnamaldehyde decreased the
molar proportion of acetate. In addition; the result is consistent with previous studies (Busquet et al.,
2005; Gunal et al., 2013) where the use of either individual EOCs or whole EOs increased the molar
proportion of acetate in cultures. However, using rumen fluid from beef cattle fed 10% concentrate and
90% forage in in vitro fermentation experiment with pH 5.5, Cardozo et al. (2005) reported that anise oil
reduced acetate proportion. The difference in the composition of the basal diets fed to the donor animals
between the current study and the study by Cardozo et al. (2005) could be responsible for the observed
differences in the molar proportion of acetate. The proportion of propionate was not affected by 50% of
the EOs (ANO, ETO, JPO, MDO and RMO) at 24 h, but reduced by the rest of the additives used, with
the exception of CSO increased this molar proportion. This increase in the molar proportion of propionate
with the inclusion of CSO is consistent with the findings from previous studies (Busquet et al., 2005;
Castillejos et al., 2008). This suggests that the inclusion of CSO in cultures modified microbial
population towards decreased methanogenesis (Demeyer and Van Nevel, 1995). In the rumen, anaerobic
fermentation of proteins and soluble carbohydrates (sugars and starch) with higher propionate production
results in reduced acetate and methanogenesis (Demeyer and Van Nevel, 1995), since the predominant
producers of acetate and methane are cellulolytic bacteria. The reduced proportion of propionate in the
164
current study with the inclusion of the rest of the EOs also supports the results in Chapter 3, where EOCs
reduced the molar proportion of propionate, and also consistent with earlier studies (Castillejos et al.,
2006). The ratio of acetate to propionate (A: P) was not affected by JPO and RMO at 24 h but reduced by
CSO, with the remaining EOs increasing A/P. The increased ratio of A/P with the inclusion of most of the
EOs could be due to the higher molar proportion of acetate observed in those cultures, and the decrease in
A/P in cultures supplemented with CSO is also due to the increased proportion of propionate in those
vessels.
4.5.2. Effect of EOs on fatty acid metabolism
In the current study, the addition of ANO, CSO, CLO, JPO and MDO (at 48 h) and the inclusion of all
EOs except CSO (at 48 h) reduced the concentrations of C14:0 and C16:0 respectively. Available reports
suggest that these fatty acids (palmitic and myristic acids) are capable of raising plasma cholesterol
through suppression and saturation of low-density lipoprotein (LDL) receptors (Keys et al., 1995). This
suggests that a reduction in the concentration of C14:0 and C16:0 in the current study with the inclusion
of all EOs except CSO could possibly decrease the plasma levels of low-density lipoprotein (LDL) if this
is repeated in vivo.
The concentration of the last product of the biohydrogenation of C18:3 n-3, C18:2 n-6 and C18:1 n-9
(C18:0) was not affected by the addition of EOs to cultures. The exception to this was the reduced levels
of C18:0 in CSO (12 h) and RMO (24 h). It is uncertain why the high accumulation of C18:3 n-3 and
C18:2 n-6 in this study did not translate to a reduction in C18:0, since C18:0 is the end product of their
biohydrogenation. However, the accumulation of C18:0 in the current study despite high levels of PUFA
is in agreement with previous studies with EOs (Vasta et al., 2013). Also, in our previous studies with
individual EOCs, the production of C18:0 was not affected by majority of the EOCs at 24 h despite higher
levels of C18:3 n-3 and C18:2 n-6 (Chapter 3; Eburu and Chikunya, 2014). As suggested in Chapter 3,
three possibilities were discussed as potential reasons for the high accumulation of PUFA without major
effects on the end product of biohydrogenation: firstly, the high concentration of C18:0 in the current
study despite high levels of PUFA could be emanating from the high concentration of C18:1 n-9 in
cultures with added EOs. Jenkins et al. (2006) reported that about 70% of C18:1 n-9 in rumen culture was
165
converted to C18:0, and only 30% was transformed to ketostearic acid and hydroxystearic acid; the next
possibility is that other unidentified biohydrogenation intermediates could have been produced in these
cultures (Gunal et al., 2013); and finally, accumulation of PUFA could be due to reduced lipolytic
activities. Buccioni et al. (2012) suggested that if small amounts of PUFA in the diet reach the duodenum,
it might be arising from a reduction in lipolysis. This suggests that these EOs inhibit the activity of
Butyrivibrio fibisolvens and Anaerovibrio lipolytica, which are responsible for hydrolysing the ester bond
in fatty acids (Buccioni et al., 2012), potentially reducing lipolysis and isomerization of oil. As suggested
by previous studies (Cobb 1992; Grundy, 1994; Pariza, 2004), unlike C14:0 and C16:0 fatty acids,
discussion on the control of cholesterol through dietary manipulations should not be focused on stearic
acid as it is a saturated fatty acid but without any harmful effects on human health.
The activity of the rumenic acid enzyme, the reductase enzyme, aids the formation of trans-11 18:1
(vaccenic acid; VA) from cis-9 trans 11 18:2 CLA (Jenkins et al., 2008; Kim et al., 2009; Buccioni et al.,
2012). In the current study, majority of the added EOs increased the concentration of C18:1 trans 11 in
cultures after 48 h, JPO, CTO and LVO being the most effective EOs, in agreement with Lourenco et al.
(2009). This suggests that inclusion of EOs stimulates the activity of the reductase enzyme, and also
indicate that inclusion of these EOs could increase the concentration of cis-9 trans 11 18:2 CLA.
Vaccenic acid represents a substrate for endogenous synthesis of CLA in animal tissues through the Δ-9
desaturase enzyme (Griinari et al., 2000); hence, increasing the level of VA would potentially have a
linear effect on the amount of cis-9 trans 11 18:2 CLA in animal tissues (Griinari et al., 2000). Previous
studies (Piperova et al., 2002; Kay et al., 2004) reported that about 90% of cis-9 trans-11 CLA in cow’s
milk resulted from the desaturation of VA. In addition, high accumulation of C18:1 trans 11 in the current
study suggests that the addition of EOs could likely impair the activity of Clostridium proteoclasticum
(Kemp et al., 1975; Maia et al., 2007), renamed as Butyrivibrio proteoclasticus (Moon et al., 2008), the
bacteria responsible for converting VA to C18:0.
The current study observed that only the inclusion of CTO (24 h) and ANO (48 h) significantly increased
the content of cis-9 trans 11 18:2 CLA, relative to the control, which is consistent with previous studies
(Whitney et al., 2011); the rest of the treatments did not affect this intermediate of biohydrogenation. As
166
mentioned previously, cis-9 trans 1118:2 CLA is formed in the first step during the transformation of cis-
9, cis-12 18:2 by the linoleic acid isomerase (LA-I) (Jenkins et al., 2008; Kim et al., 2009; Buccioni et
al., 2012). It can be suggested from the results of the current study that the activities of the lipase (LA-I)
which facilitate the formation of cis-9 trans 11 CLA from cis-9, cis-12 18:2 were impaired by all but
CTO and ANO at the times indicated.
The content of C18:2 n-6 in both the CON and in all EOs rapidly decreased with time, being lowest at 48
h and highest at 12 h. Although the biohydrogenations of C18:2 n-6 and C18:3 n-3 were similar, that of
C18:2 n-6 was slightly lower than that of C18:3 n-3. These biohydrogenation values conform to results of
previous in vitro (Beam et al., 2000) and in vivo (Wachira et al., 2000) studies. The effects of the added
EOs on the biohydrogenation of C18:2 n-6 and C18:3 n-3 (discuss later) were similar, with ANO and
CSO being the most effective EOs to reduce the extent of biohydrigenation of C18:2 n-6.
As a direct reflection of the biohydrogenation of C18:3 n-3 in cultures, the content of C18:3 n-3 rapidly
decreased with time, being highest at 12 h and lowest at the end of incubation (48 h). This rapid
biohydrogenation of C18:3 n-3 from whole ground linseed which was more than 80 g/100 g at 24 h
agrees with the results obtained with the EOCs in Chapter 3. This biohydrogenation values are also in
support of other results of previous in vivo studies (Wachira et al., 2000; Scollan et al., 2001, Wang et al.,
2002) and in vitro studies (Sinclair et al., 2005). In the first 24 h, the concentration of C18:3 n-3 was
significantly highest in ANO and CSO and consistently lowest in ETO and JPO, relative to the control. At
48 h, the highest levels of C18:3 n-3 were still observed in cultures with ANO. These findings are in
agreement with our previous study where anethole and cinnamaldehyde, the active components of anise
and cassia EOs respectively, were among the most effective compounds to maintain the highest
concentrations of C18:3n -3 and C18:2 n-6 (Chapter 3, Eburu and Chikunya, 2014). The most active
component of ANO (anethole) and CSO (cinnamaldehyde) possess phenolic moieties in their chemical
structures (Calsamiglia et al., 2007; Bakkali et al., 2008). As mentioned previously, the antibacterial
activity and specific mode of action of an individual EO is influenced by the chemical structure of EO
components (Dormans and Deans, 2000). The possibility of ANO and CSO to exert the greatest
antimicrobial characteristic by maintaining higher levels of C18:3 n-3 than other EOs could be due to
167
their phenolic properties. This could suggest that ANO and CSO probably reduced isomerization of C18:3
n-3 compared to the rest of the treatments. EOs containing high proportion of phenolic compounds such
as thymol, carvacrol and eugenol (2-methoxy-4-(2-propenyl)phenol as components of their chemical
structure exhibit the strongest antimicrobial properties against food borne pathogens (Cosentino et al.,
1999; Juliano et al., 2000; Lambert et al., 2001). The mechanisms of action of phenolics are thought to
generally include disruption of proton motive force (PMF), coagulation of cell contents, disturbance of
cytoplasmic membrane and disruption of active transport and electron flow (Sikkema et al., 1995;
Davidson, 1997). By contrast, the use of six different essential oils (citronella, rosemary, sage, Siberian fir
needle oil, clove and white thyme) at 125, 250 and 500 mg/L did not affect the biohydrogenation of
C18:3n -3 (Gunal et al., 2013). The possible explanation to the difference in results obtained between the
study of Gunal et al. (2013) and the current study could be the difference in the maturity stage of the
parent plant at which the oil was obtained before use, and the part of the plant from which the oils were
extracted. This is because maturity stage and the part of the plant from where oil is extracted have been
reported to influence the antimicrobial potency of oils (McGimpsey et al., 1994; Cosentino et al., 1999;
Lis-Balchin et al., 1999; Marino et al., 1999; Delaquis et al., 2002). This indicates wide variation between
the compositions of EOs obtained from different parts of the same plant, which could translate to their
different antimicrobial characteristics. Comparison between the effects of EOCs (in Chapter 3, e.g.
anethole) and EOs (the current study, e.g. anise oil) on concentrations and biohydrogenation of C18:3 n -3
and C18:2 n-6 suggest that anise oil and its predominant active compound (anethole) had similar effects
on rumen concentration of C18:3 n-3. This observation is consistent with previous studies where it is
established that anethole is the main compound in anise oil (Davidson and Naidu, 2000). However, the
higher concentrations of C18:3 n-3 and C18:2 n-6 in cultures supplemented with anise oil 300 mg/L
(current study) than anethole 300 mg/L (Chapter 3) suggest that other minor components of anise oil had
significant synergistic effects on ruminal fermentation activities.
In our previous study (Chapter 3; Eburu and Chikunya, 2014), the use of anethole and 4-allylanisole, the
two most effective EOCs, protected 22.2 and 26.4 g/100 g of C18:3 n-3 from biohydrogenation. In the
current study however, the use of ANO and CSO, the two most effective EOs, protected 58.2 and 54.3
168
g/100 g respectively, from biohydrogenation at 24 h. As mentioned previously, the possible reason why
the use of the whole EOs in the current study had higher potential to protect C18:3 n -3 or C18:2 n -6
from biohydrogenation could be that there is some form of synergism between the minor and major
compounds in the whole EOs (Davidson and Parish, 1989; Burt, 2004).
The extent of disappearance of C20:5 n-3 and C22:6 n-3 in vessels increased as the time of incubation
progressed, being highest at 48 h and lowest at 12 h. The quantity of the content of C20:5 n-3 and C22:6
n-3 in vessel which disappeared after 48 h was highest in the control. These results support previous
reports from in vivo studies where the biohydrogenation of C20:5 n-3 and C22:6 n-3 in fish oil range
from 72 to 93 g/100 g TFA (Wachira et al., 2000; Scollan et al., 2001; Chikunya et al., 2004). However,
these findings contrast in vitro reports where the biohydrogenation of C20:5 n-3 and C22:6 n-3 was less
than 50 g/100 g (Ashes et al., 1992; Sinclair et al., 2005). Similar to the results obtained in Chapter 3, the
potential inhibition of the biohydrogenation of C20:5 n-3 and C22:6 n-3 differs within the EO group; with
biohydrogenation being lowest in ANO whose most active compound (anethole) possesses phenolic
moieties. As discussed in Chapter 3, the biohydrogenation of the fish oil fatty acids (C20:5 n-3 and C22:6
n-3) was less compared to the ruminal disappearance of C18 fatty acids (C18:3 n-3 and C18:2 n-6). This
inability of microbes to hydrogenate the fish oil fatty acids is not due to the difference in the lipase
activities but because microbes lack the enzymes necessary to hydrogenate the long chain n-3 PUFA
(Ashes et al., 1992).
There were no clear effects of treatments on the content of ∑SFA after 48 h; therefore, ∑SFA was
calculated without C18:0 (I.e. ∑SFA-C18:0) since C18:0 does not have any harmful effects in human
health (discussed previously). After 48 h the inclusion of all EOs in cultures reduced the content of
∑SFA-C18:0 compared with the control at 48 h, which is consistent with the higher accumulation of
∑PUFA in cultures with added EOs.
The content of ∑PUFA declined with increase in the time of incubation, and was highest in ANO at 48 h,
relative to the control. The decrease in the levels of ∑PUFA with time agrees with the corresponding
169
decrease in the concentration of individual PUFA. The highest content of the ∑PUFA in vessels treated
with ANO also conformed to the highest levels of individual PUFA.
In the report presented here, the content of TFA was significantly reduced by majority of the EOs relative
to the control, except ANO and RMO (both at 24 h) which did not affect the concentration of TFA.
Reduction of TFA could suggest that the reported decrease in TVFA and ammonia concentration (mostly
at 12 h) had reduced the microbial de novo fatty acids synthesis (Sauvant and Bas, 2001), leading to
reductions in the levels of TFA.
In this study, the major thrombotic fatty acid (C20:4 n-6; Kinsella et al., 1990), was beneficially reduced
by most of the added EOs and was lowest in ANO and MDO after 48 h. If ∑n-6/∑n-3 is an indicator of
the antithrombotic effect, then cultures with ANO would have the highest antithrombotic strength.
The ratio of PUFA to SFA (P: S) in cultures decreased with time, and was consistently highest in vessels
with ANO and CSO. After 48 h of incubation, only cultures with ANO had P/S close to the value of 0.45
recommended in the guidelines of the Department of Health (1994).
4.6. Conclusion
In the current study, the potential of whole EOs used in this study to inhibit BH of n-3 PUFA at 24 h can
be ranked as follows: ANO and CSO > MDO and CMO > CTO and RMO > JPO, LVO, CLVO and ETO.
These results showed that ANO and CSO (rich in phenolic compounds) have the greatest potential to
modulate the biohydrogenation of n-3 PUFA in the rumen. However, it is uncertain whether these
changes are replicated in in vivo experiment. If this is confirmed, then the levels of PUFA in ruminant
food products (meat and milk) could be enhanced by supplementing ruminant diet with cassia and anise
oils. However, lower doses should be tested to establish optimum levels of inclusion at which feed
degradability and VFA production would not be impaired. It is also worthwhile to investigate the
mechanism of action and the stability of these oils in the rumen. Therefore, the next study (discussed in
Chapter 5) would investigate effects of varying doses (0, 100, 200 and 300 mg/L) of the two most
effective oils (anise and cassia) and the two most effective EOCs (anethole and 4-allylanisole).

170
171
Chapter 5
The effects of graded doses of 4-allylanisole, anethole, anise oil and
cassia oil on fermentation and biohydrogenation of n-3 polyunsaturated
fatty acids by rumen microorganisms in vitro
172
Abstract
Effects of varying levels of inclusion of 4-Allyanisole (ALA), anethole (ANE), anise oil (ANO) and
cassia oil (CSO) on the fermentation activities of rumen microbes and the biohydrogenation (BH) of n-3
PUFA were evaluated in vitro using batch culture system. Rumen fluid was collected from six Hartline
Texel cross cull ewes. A basal feedstock comprising of 70:30 grass hay (Lolium perenne) and concentrate
(lamb finisher cubes) was used. Serum bottles were incubated at 39⁰C; each bottle contained 1 g of feed
substrate, 80 ml buffer, 20 ml inoculum, then supplemented with increasing concentrations (0, 100, 200
and 300 mg/l) of each EOs/EOCs. There were 16 treatments (with 6 replicates per treatment) as follows:
ALA, ANE, ANO and CSO. Fermentation was stopped after 12 and 24 h, and samples were collected to
analyse NH3-N, total and molar proportions of individual VFA; and concentration of PUFA including
intermediates of BH. Relative to the control, CSO (all doses), ANE (at 100), and ALA at 300 reduced
NH3-N levels relative to the control, whilst concentration was similar in all doses of ANO. Irrespective of
oil, the highest dose (300 mg/L) of all substances with the exception of ANE induced the most inhibition
(average 12%) on TVFA. At 200 mg/L, ANE, ALA and ANO only slightly (by about 2%) reduced
TVFA relative to the control, but CSO reduced TVFA by 10%. The level of C18:0 was reduced by ANO
(at 100 mg/L), ALA (at 300 mg/L) and CSO (at 200 mg/L). All doses of all substances maintained higher
(P<0.001) the concentrations of 18:2 cis-9 trans 11 CLA and all PUFA in a dose-dependent manner,
suggesting that higher doses afforded better protection. At 200 and 300 mg/L all substances substantially
maintained higher concentration of PUFA relative to the control. Therefore, considering the effects of the
tested EOs and EOCs and at different doses in this study, it appears that the administration of ALA, ANE
and ANO at 200 mg/L seems to give best balance between PUFA protection and minimal disturbance to
VFA concentration. However, CSO requires a dose more than 100 mg/L but less than 200 mg/L to attain
the same level of protection and minimising disruption of fermentation. It is worthwhile to investigate
whether these effects are sustained in vivo including testing the possibility of microbial adaptation to
these substances at these doses.
173
5.1. Introduction
In two separate preliminary investigations, it was established that including both individual essential oil
compounds (EOCs) particularly 4-allylanisole and anethole (Chapter 3; Eburu and Chikunya, 2014) and
whole essential (EOs) such as oils of anise and cassia (Chapter 4; Eburu and Chikunya, 2015a) at 300
mg/L significantly inhibits the disappearance of C18:2 n-6 and n-3 polyunsaturated fatty acids (PUFA;
C18:3 n-3, C20:5 n-3 and C22:6 n-3) from rumen contents. However, at this level of inclusion (300
mg/L) there was a concomitant significant suppression of VFA levels (over 10% average reductions with
the addition of both EOs and EOCs). Volatile fatty acids are the fundamental sources of energy for
ruminants and their ruminal concentrations reflect the extent of degradation of nutrients in the used feed
(Bergman, 1990; Szumacher-Strabel and Cieslak, 2012). The reduced concentrations of VFA in our
previous studies (Chapters 3; 4) would suggest that if similar effect is exerted in vivo, animal performance
would be significantly negatively affected. Previous studies suggested that the benefits of using EOs and
EOCs to decrease ruminal NH3-N production can be counterbalanced by a reduction in feed digestibility
and decreased concentration of VFA if their inclusion levels are not optimized (Busquet et al., 2006;
Martinez et al., 2006). Therefore, using these additives at optimum dosages could reduce the negative
effects on VFA concentration. Because the aim of using EOs and EOCs as feed additive is to improve the
efficiency of rumen fermentation processes and not inhibition, information on their optimum doses is vital
to maximize ruminant performance. McIntosh et al. (2003) observed that EOs affect microbial population
in a dose-dependent manner. The aim of the current study was to establish the optimal doses of the four
substances (4-allyanisole, anethole, anise and cassia) which were identified in our preliminary studies
(Chapters 3; 4) to be most effective at inhibiting PUFA disappearance. This would enable the
achievement of satisfactory inhibition of PUFA biohydrogenation but without significant reductions in
VFA concentration. In the current study, these additives were evaluated at graded levels of inclusion.
174
5.2.0. Materials and methods
5.2.1. Animal management and collection of rumen fluid/sampling
In this experiment, six Hartline Texel cross cull ewes (mean weight 70.2 ±7.5kg) were used as rumen
fluid donors. Experimental details relating to housing, experimental diet, feeding, duration of adaptation
and collection of rumen fluid are described in section 2.1.
5.2.2. Basal feedstock, treatments and in vitro incubation
The basal feedstock was mixtures of good quality rye-grass hay (Lolium perenne), lamb finisher
concentrate, whole ground linseed and fish oil. The supplier details and components of the basal
feedstock used in this in vitro incubation are as described in the general material and methods (see section
2.3). The ingredient content, chemical and fatty acid composition of the basal feedstock are shown in
Table 2.2.
The effects of the 2 EOCs and 2 whole essential oils were evaluated using the in vitro gas production
batch culture method described by Theodorou et al. (1994). All EOCs and EOs used were purchased from
Sigma-Aldrich Co. Ltd., UK and were stored at the required temperatures specified on delivery notes
prior to use. See Tables 3.2 and 3.3 for a description of the EOCs and Tables 4.1 and 4.2 for a description
of the EOs used in this study. There were 16 treatments and 6 replicates per treatment as follows: 4-
Allyanisole (ALA: 0, 100, 200 and 300 mg/L), anethole (ANE: 0, 100, 200 and 300 mg/L), anise oil
(ANO: 0, 100, 200 and 300 mg/L) and cassia oil (CSO: 0, 100, 200 and 300 mg/L). In total 292 serum
bottles were incubated, each bottle contained 1 g of feed substrate, 300 mg/l of EOC, 80 ml anaerobic
buffer (see Table 2.1) and 20 ml inoculum and the bottle sealed with rubber cork before incubation.
5.2.3. Sample collection and preservation
Experimental procedures relating to cumulative gas pressure measurements, incubation stopping times,
collection and storage of samples in this study were as described in the general material and methods (see
section 2.4).
175
5.2.4 Chemical analysis
The concentration of NH3-N in digesta was analysed using the phenol-hypochlorite method
(Weatherburn, 1967; Broderick and Kang, 1980) adopted for use on the plate reader as described in
general materials and methods (see section 2.5.4).
The concentrations of total volatile fatty acid (VFA) and molar proportion of VFA was determined by gas
chromatography (GC) as described by Ottenstein and Bartley (1971). Details of this method are outlined
in the general materials and methods (see section 2.5.6).
The concentration of fatty acids in feed and freeze dried samples were extracted using the direct
saponification method described by Enser et al. (1998). See section 2.5.7 of the general materials and
methods for detailed description of the techniques.
5.2.5. Experimental design and statistical analysis
This study was a randomized complete block design (RCBD) experiment. The objective was to examine
the effects of increasing doses of EOCs/EOs on the extent of rumen biohydrogenation of n-3 PUFA in
vitro. The null hypothesis was that inclusion of varying doses of EOs/EOCs would have no effect on
fermentation and biohydrogenation data. The alternative hypothesis was that the different doses of
EOCs/EOs would affect (decrease or increase) fermentation activities.
The study was a 4 (EOs/EOCs: ALA, ANE, ANO and CSO) 4 (dose: 0, 100, 200 and 300 mg/L)
factorial design experiment. Therefore data were analysed by TWO-WAY analysis of variance (ANOVA)
using GenStat 16th edition (VSN international Ltd, Registered to: Writtle College). The main effects were
EOs/EOCs, dose and oil dose interaction. Differences between treatments were declared by least
significance difference (LSD) and significance was declared at P< 0.05. Data were analysed separately
for each time point (12 and 24 h).
176
5.3.0. RESULTS
5.3.1 In vitro fermentation parameters
Effects of treatments on cumulative gas production (ml/g OM) and NH3-N (mM) are presented in Table
5.1a, whilst the significance of the main effects and interactions are shown in Table 5.1b.
At 12 h, the levels of total gas was decreased (P<0.001) with the supplementation of all doses (100, 200
and 300 mg/L) of all EOCs/EOs in a dose response manner, relative to the control. Regardless of oil, the
300 mg/L (highest dose) of all substances caused the most reduction (average 22%) on total gas. At 200
mg/L, all treatments caused marginal inhibition of total gas (average 6%), except for CSO which inhibited
by 15%. There was a significant interaction between dose levels and EOs/EOCs (P<0.001). It was
observed that supplementing CSO 300 mg/L induced the highest inhibition of total gas relative to the 300
mg/L of the rest of the treatments (ALA, ANE and ANO). Mean values were 103.5 (average across all
controls), 84.1, 82.5, 94.3 and 62.9 ml/g OM (sed= 4.02, P<0.001, Table 5.1a), for ALA 300, ANE 300,
ANO 300 and CSO 300, respectively. At 24 h, irrespective of oil, increasing the dose of all substances
progressively reduced the amount of total gas observed in fermentation vessels. The lowest dose (100
mg/L) of all substances elicited the least reduction (average 4%) on total gas, but no interaction was
observed at this point.
At 12 h, the addition of ANE (at 100 and 200 mg/L) and ANO (at 300 mg/L) reduced (P<0.001) NH3-N
concentration relative to the control. In contrast, the supplementation of cultures with ALA (at 100, 200
and 300 mg/L) and CSO (at 200 and 300 mg/L) increased (P<0.001) the mean concentration of NH3-N.
There was a significant interaction between the oils and the dose such that ANE 200 mg/L decreased
NH3-N concentration compared to the 200 mg/L of the rest of the treatments (ALA, ANO and CSO).
Mean values were 3.6 (mean across all controls), 3.8, 3.1, 3.8 and 3.7 mM (sed= 0.22, P<0.001, Table
5.1a). After 24 h, the concentration of NH3-N in fermentation vessels was reduced (P<0.001) with the
supplementation of ALA (at 300 mg/L) and CSO (at 100, 200 and 300 mg/L) but increased in vessels
where ANE (100 mg/L) and ANO (at 200 mg/L) were added. The addition of CSO at 100 had the lowest
level of ammonia compared with ALA 100, ANE 100 and ANO 100, relative to the control. Average
values were 4.8, 4.4, 5.6, 4.6 and 3.4 mM (sed= 0.44, P<0.018, Table 5.1a), for the control, ALA 100,
177
ANE 100, ANS 100 and CAS 100, respectively. Similar effect was true for ALA 200, ANE 200, ANO
200 and CSO 200. However, ALA 300 and CSO 300 caused 25% average NH3-N reduction relative to the
control, whilst ANE 300 and ANO 300 maintained the concentration of NH3-N at similar levels to the
control. Mean values were 4.8, 3.4, 4.8 and 3.8 mM (sed= 0.44, P<0.018, Table 5.1a), for the control,
ALA 300, ANE 300, ANO 300 and CSO 300, respectively.
Effects of treatments on the concentration of TVFA (mM) and the molar proportions of individual VFA
(mM/mol TVFA) are presented in Table 5.2a and the significance of the main effects and interactions are
in Table 5.2b. In this study, both EOCs and EOs used all reduced the mean (mean across all doses)
concentration of TVFA, with the overall highest reductions observed in vessels with CSO (14%) and
ALA (11%). All doses of all EOs and EOCs maintained a dose dependent response effect on TVFA with
the exception of ANE, such that vessels that received the highest dose (300 mg/L) irrespective of additive
type, induced the highest inhibition (average 12%) on TVFA (Table 5.2a). Relative to the control,
supplementing ALA 300 caused the highest decrease on TVFA compared to 300 of ANE, ANO and COS
(Table 5.1a). Average inhibitions were 18%, 2%, 10.7% and 15.1% for ALA 300, ANE 300, ANO 300
and CSO 300, respectively. At 200 mg/L, ANE, ALA and ANO only marginally reduced TVFA (by
about 2%) relative to the control, but CSO reduced TVFA by 10%. Mean values were 92.5 (mean of all
controls), 87.3, 103.5, 91.8 and 82.9 mM (sed= 2.62, P<0.001, Table 5.2a), for the control, ALA, ANE,
ANO and CSO, respectively. Compared to the control, the 100 mg/L of ANO and ANE caused
approximately 7% and 12% increases in TVFA, respectively (Table 5.2a).
The proportion of acetate was reduced (P<0.001) in CSO (at 100, 200 and 300 mg/L); ALA and ANO (at
300 mg/L); and in ANE (100 mg/L). By contrast, ANE (200 and 300 mg/L) and ANO (at 100 and 200)
increased the proportion of acetate, relative to the control. All doses (at 100, 200 and 300 mg/L) of CSO
recorded the lowest molar proportion of acetate relative to the corresponding doses of other substances
(Table 5.2a, b). Overall mean across all doses showed that the proportion of propionate was increased
(17%) in vessels where CSO was added and reduced (12%) where ANE was added, but ALA and ANO
maintained the concentration of propionate similar to the control. At 100 mg/L, the proportion of
propionate was increased with the addition of CSO compared to the 100 mg/L of the remaining
178
treatments. At 200 mg/L, CSO and ALA increased the concentration of propionate but ANO and ANE
reduced it. Supplementing 300 mg/L of CSO increased the concentration of propionate relative to 300
mg/L of other treatments (ANO, ANE and ALA). Average values were 17.2 (mean across all controls),
17.8, 17.4, 16.4 and 20.5 (100 mg/L); 16.8, 14.2, 16.1 and 20.3 (200 mg/L); and 300 mg/L were 17.2,
17.6, 14.6, 16.4 and 19.5 mM/mol TVFA (sed= 0.54, P<0.001, Table 5.2a and b), for the control, ALA,
ANE, ANO and CSO, respectively. Although the proportion of butyrate was not affected with higher
doses (200 and 300 mg/L) of CSO and lower doses of ALA (100 and 200 mg/L), it was reduced
(P<0.001) where higher doses of ANE (200 and 300 mg/L) and lower doses of ANO (100 and 200 mg/L)
were added. The acetate to propionate ratio (A: P) was reduced with all doses of CSO (reduction being
highest in the lower doses, average 21%) and the lowest dose (100 mg/L) of ALA (5%) and ANE (3%).
However, all doses of ANO (100, 200 and 300 mg/L) and higher doses of ANE (200 and 300 mg/L)
increased A: P (Tables 5.2a; b). Supplementation of EOCs/EOs elicited minor increases and decreases on
the molar proportions of the branched-chain VFA (BCVFA) such as iso-valeric, iso-butyric, valeric and
caproic acids (Tables 5.2a and b). Generally, the lowest proportions of iso-valeric, iso-butyric and caproic
acids were observed in CSO (200 and 300 mg/L), relative to the control.
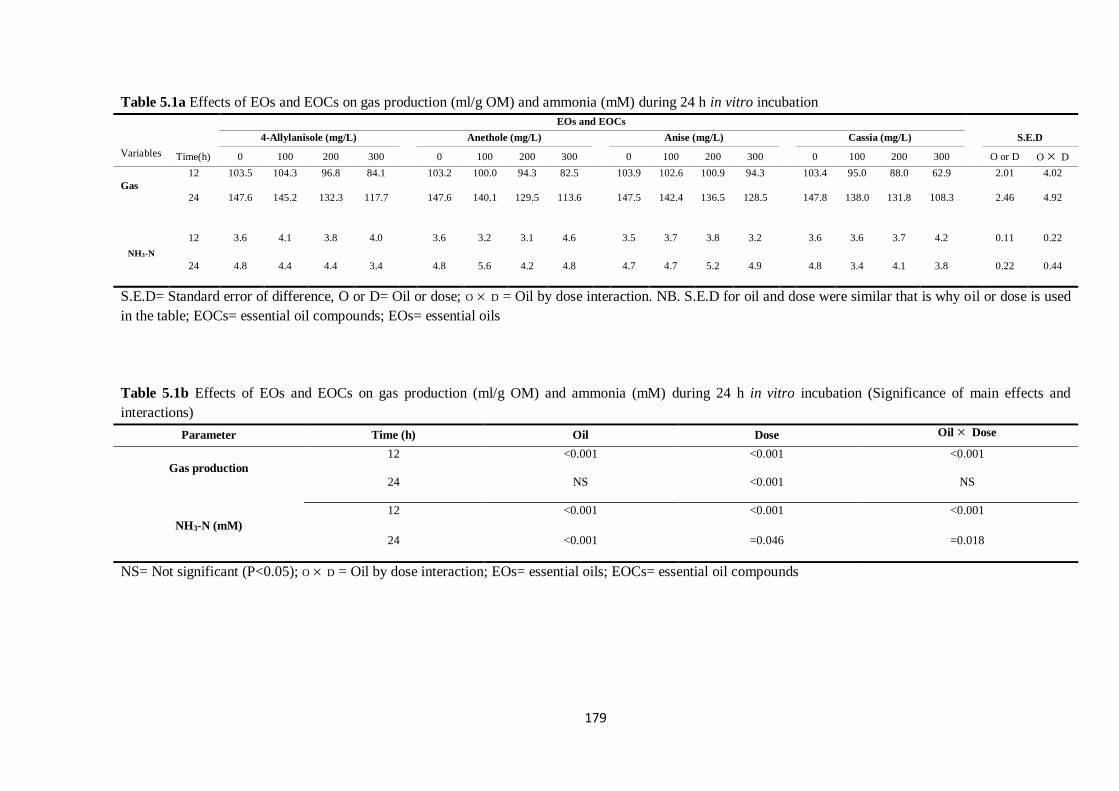
179
Table 5.1a Effects of EOs and EOCs on gas production (ml/g OM) and ammonia (mM) during 24 h in vitro incubation
EOs and EOCs
4-Allylanisole (mg/L) Anethole (mg/L) Anise (mg/L) Cassia (mg/L) S.E.D
Variables Time(h) 0 100 200 300 0 100 200 300 0 100 200 300 0 100 200 300 O or D O D
Gas
12 103.5 104.3 96.8 84.1 103.2 100.0 94.3 82.5 103.9 102.6 100.9 94.3 103.4 95.0 88.0 62.9 2.01 4.02
24 147.6 145.2 132.3 117.7 147.6 140.1 129.5 113.6 147.5 142.4 136.5 128.5 147.8 138.0 131.8 108.3 2.46 4.92
NH3-N
12 3.6 4.1 3.8 4.0 3.6 3.2 3.1 4.6 3.5 3.7 3.8 3.2 3.6 3.6 3.7 4.2 0.11 0.22
24 4.8 4.4 4.4 3.4 4.8 5.6 4.2 4.8 4.7 4.7 5.2 4.9 4.8 3.4 4.1 3.8 0.22 0.44
S.E.D= Standard error of difference, O or D= Oil or dose; O D = Oil by dose interaction. NB. S.E.D for oil and dose were similar that is why oil or dose is used
in the table; EOCs= essential oil compounds; EOs= essential oils
Table 5.1b Effects of EOs and EOCs on gas production (ml/g OM) and ammonia (mM) during 24 h in vitro incubation (Significance of main effects and
interactions)
Parameter Time (h) Oil Dose Oil Dose
Gas production
12 <0.001 <0.001 <0.001
24 NS <0.001 NS
NH3-N (mM)
12 <0.001 <0.001 <0.001
24 <0.001 =0.046 =0.018
NS= Not significant (P<0.05); O D = Oil by dose interaction; EOs= essential oils; EOCs= essential oil compounds
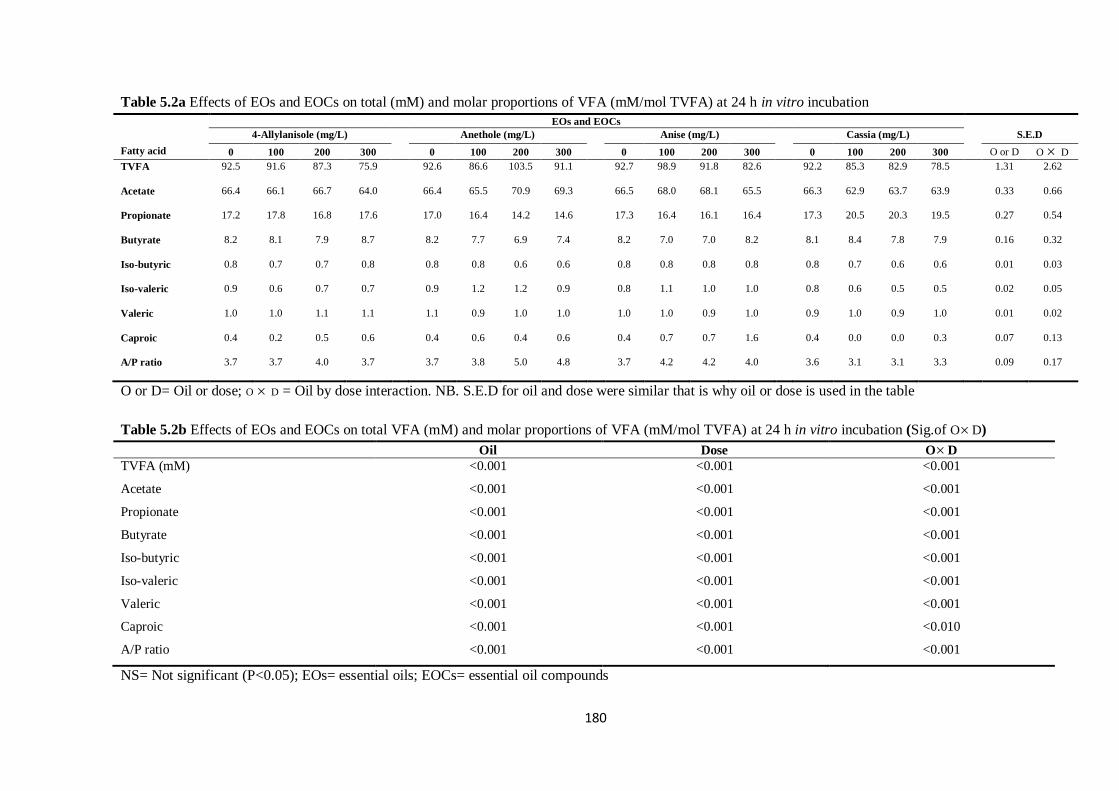
180
Table 5.2a Effects of EOs and EOCs on total (mM) and molar proportions of VFA (mM/mol TVFA) at 24 h in vitro incubation
EOs and EOCs
4-Allylanisole (mg/L) Anethole (mg/L) Anise (mg/L) Cassia (mg/L) S.E.D
Fatty acid 0 100 200 300 0 100 200 300 0 100 200 300 0 100 200 300 O or D O D
TVFA 92.5 91.6 87.3 75.9 92.6 86.6 103.5 91.1 92.7 98.9 91.8 82.6 92.2 85.3 82.9 78.5 1.31 2.62
Acetate 66.4 66.1 66.7 64.0 66.4 65.5 70.9 69.3 66.5 68.0 68.1 65.5 66.3 62.9 63.7 63.9 0.33 0.66
Propionate 17.2 17.8 16.8 17.6 17.0 16.4 14.2 14.6 17.3 16.4 16.1 16.4 17.3 20.5 20.3 19.5 0.27 0.54
Butyrate 8.2 8.1 7.9 8.7 8.2 7.7 6.9 7.4 8.2 7.0 7.0 8.2 8.1 8.4 7.8 7.9 0.16 0.32
Iso-butyric 0.8 0.7 0.7 0.8 0.8 0.8 0.6 0.6 0.8 0.8 0.8 0.8 0.8 0.7 0.6 0.6 0.01 0.03
Iso-valeric 0.9 0.6 0.7 0.7 0.9 1.2 1.2 0.9 0.8 1.1 1.0 1.0 0.8 0.6 0.5 0.5 0.02 0.05
Valeric 1.0 1.0 1.1 1.1 1.1 0.9 1.0 1.0 1.0 1.0 0.9 1.0 0.9 1.0 0.9 1.0 0.01 0.02
Caproic 0.4 0.2 0.5 0.6 0.4 0.6 0.4 0.6 0.4 0.7 0.7 1.6 0.4 0.0 0.0 0.3 0.07 0.13
A/P ratio 3.7 3.7 4.0 3.7 3.7 3.8 5.0 4.8 3.7 4.2 4.2 4.0 3.6 3.1 3.1 3.3 0.09 0.17
O or D= Oil or dose; O D = Oil by dose interaction. NB. S.E.D for oil and dose were similar that is why oil or dose is used in the table
Table 5.2b Effects of EOs and EOCs on total VFA (mM) and molar proportions of VFA (mM/mol TVFA) at 24 h in vitro incubation (Sig.of OD)
Oil Dose OD
TVFA (mM) <0.001 <0.001 <0.001
Acetate <0.001 <0.001 <0.001
Propionate <0.001 <0.001 <0.001
Butyrate <0.001 <0.001 <0.001
Iso-butyric <0.001 <0.001 <0.001
Iso-valeric <0.001 <0.001 <0.001
Valeric <0.001 <0.001 <0.001
Caproic <0.001 <0.001 <0.010
A/P ratio <0.001 <0.001 <0.001
NS= Not significant (P<0.05); EOs= essential oils; EOCs= essential oil compounds
181
5.3.2. Effect of EOC on fatty acid metabolism
Effects of treatments on the concentrations of selected C14 and C16 are presented in Table 5.3a and the
significance of the main effects and interactions are shown in Table 5.3b.
At 12 h, the concentration of C14:0 decreased in ALA (at 200 mg/L) and in CSO (at 100, 200 and 300
mg/L). However, mean levels of C14:0 was not affected with the supplementation of ALA (100 and 300
mg/L) and ANE and ANO (at 100, 200 and 300 mg/L) (Table 5.3a, b). There was a significant interaction
between oils and dose levels. Relative to the control, all doses (100, 200 and 300 mg/L) of CSO and ALA
200 reduced the levels of C14:0 compared to the respective doses of other treatments (Table 5.3a; b).
After 24 h, the addition of EOCs/EOs did not change the concentration of C14:0 in the vessels.
The concentration of C16:0 at both 12 and 24 h decreased (P<0.001) as the dose of all substances (ALA,
ANE, ANO and CSO) increased. Regardless of the substance, the lowest levels of C16:0 were observed
in vessels in which the 300 mg/L of both EOCs and EOs were added. Although the interaction between
oil and dose was not significant at 12 h, rates were different after 24 h. After 24 h, the addition of ANE
100 increased the concentration of C16:0 compared with the supplementation of 100 mg/L of other
treatments (ALA, ANO and CSO), relative to the control. Average values for 100 mg/L were 15.8 (mean
of all controls), 15.6, 17.7, 15.5 and 15.9 g/100 g TFA (sed= 0.51, P<0.001, Table 5.3a), for the control,
ALA, ANE, ANO and CSO, respectively.
The addition of all doses of all substances increased (P<0.001) the concentration of C16:1, with increases
being proportional to the dose of oils (Table 5.3a; b). After 24 h, CSO 300 mg/L reduced (by about 4%)
the concentration of C16:1 relative to the 300 mg/L of the rest of the treatment which increased it
(average 13%), compared with the control.
Effects of EOCs and EOs on concentrations of selected C18 fatty acids are presented in Table 5.4a and
significance of the main effects and interactions are shown in Table 5.4b.
At 12 h, the fermentation vessel concentrations of C18:0 were decreased in ANO (at 100 mg/L, by 6%);
increased in ALA and ANE (at 100, 200 and 300 mg/L), ANO (at 300 mg/L) and CSO (at 200 and 300
mg/L); whilst CSO (at 100 mg/L) maintained similar to the control. Fermentation vessels that received
182
ANO 100 mg/L reduced the content of C18:0 compared with the 100 mg/L of the rest of the treatments
(ALA, ANE and CSO), whilst vessels with added ANE 100 had the highest concentration of C18:0,
relative to the control. Mean values for 100 mg/L were 12.1 (average of controls), 12.6, 13.1, 11.4 and
12.3 g/100 g TFA (sed= 0.27, P<0.001, Table 5.4a, b), for the control, ALA 100, ANE 100, ANO 100 and
CSO 100 mg/L, respectively. After 24 h, the concentration of C18:0 was reduced (P<0.001) in vessels
that were supplemented with ALA (at 300 mg/L) and CSO (at 200 mg/L). In contrast, the level of C18:0
was increased in cultures where ANE (300 mg/L) and ANO (at 200 and 300 mg/L) were added, but
concentration was not affected in vessels that received ALA (200 and 300 mg/L), ANE (100 and 300
mg/L), ANO (at 100 mg/L) and CSO (at 100, 200 and 300 mg/L).
Anise oil had the overall lowest mean of C18:1 n-9 relative to the control after 12 h. Average values were
7.9 (mean across all controls), 7.8, 7.7, 7.4 and 7.9 g/100 g TFA (sed= 0.06, P<0.001, Table 5.4a, b), for
the control, ALA, ANE, ANO and CSO, respectively. After 24 h, irrespective of oil, the highest dose
(300 mg/L) of all substances with the exception of ANO had the highest levels of C18:1 n-9. The addition
of ANO 300 had the lowest content of C18:1 n-9 compared with 300 mg/L of ALA, ANE and CSO,
relative to the control. Mean values expressed as % increase to the control (5.3) were 35.8%, 30.2%,
15.1% and 41.5% (Table 5.4a), for ALA, ANE, ANO and CSO, respectively.
At 12 h, the mean (across all doses) concentration of C18:1 trans 11 was highest in vessels supplemented
with CSO, lowest in fermentation vessels with ALA and ANO, whilst ANE maintained it similar to the
control. Mean values across all doses were 1.8, 1.7, 1.8, 1.7 and 2.0 g/100 g TFA (sed= 0.02, P<0.001,
Table 5.4a, b), for the control, ALA, ANE, ANS and CAS, respectively. The observed concentration of
C18:1 trans 11 at 12 h was proportional to the dose level of all additive type, such that the 300 mg/L (the
highest dose) of all substances recorded the highest (P<0.001) level of C18:1 trans 11 (Table 5.4a).
Supplementation of CSO 300 mg/L caused 17% increase on 18:1 trans 11 compared to 300 mg/L of the
rest of the treatments (ALA, ANE and ANO). Mean values for 300 mg/L were 1.8 (mean of all controls),
1.8, 1.8, 1.8 and 2.1 g/100 g TFA (sed= 0.04, P<0.001, Table 5.4a, b), for the control, ALA, ANE, ANO
and CSO, respectively. However, after 24 h, effects of dose, oil and interactions were not significant.
183
At 12 h, effects of EOCs/EOs, dose and the interactions between oils and dose levels on the concentration
of C18:2 cis-9 trans 11 CLA were not significant (Table 5.4a, b). However, after 24 h, the overall
concentration of C18:2 cis-9 trans 11 CLA was maintained at higher levels (P<0.001) with the
supplementation of all substances. The level of C18:2 cis-9 trans 11 CLA increased as the dose of oil
progressed, such that the highest dose (300 mg/L) of all substances irrespective of oil, recorded the
highest level of C18:2 cis-9 trans 11 CLA, relative to the control. The minimum doses of all substances
needed to maintain higher concentration of C18:2 cis-9 trans 11 CLA relative to the control were ANO
(at 100, 200 and 300 mg/L), ALA (at 200 mg/L), ANE and CSO (at 300 mg/L). Fermentation vessels
which received all the doses of ANO (100, 200 and 300 mg/L) contained the highest levels of C18:2 cis-9
trans 11 CLA compared to the respective doses of other treatments, relative to the control. Mean values
were 0.15 (average of controls); 0.15, 0.14, 0.16 and 0.14 (100 mg/L); 0.16, 0.15, 0.18 and 0.15 (200
mg/L) and 300 mg/L were 0.18, 0.16, 0.19 and 0.18 g TFA (sed= 0.010, P<0.001, Table 5.4a, b), for the
control, ALA, ANE, ANO and CSO, respectively.
All doses (of both EOCs and EOs) maintained the concentrations of C18:2 n-6 and C18:3 n-3 in a dose
related response. Irrespective of additive type, the highest concentrations of C18:2 n-6 and C18:3 n-3
were observed in vessels supplemented with the highest dose (300 mg/L) of all the substances. At 100
mg/L, there was a significant (P<0.001) but marginal increases on the concentrations of both C18:2 n-6
and C18:3 n-3, relative to the control. The minimum dose of all the oils required to maintain a substantial
concentrations of both C18:2 n-6 and C18:3 n-3 relative to the control was 200 mg/L. The average (12
and 24 h) effects of treatments indicated that the mean concentrations of C18:2 n-6 and 18:3 n-3 were
highest in vessels supplemented with ANO 200 relative to the 200 mg/L of other substances and the
control. Mean values (12 and 24 h) for 200 mg/L were 3. 0 (average of controls), 3.8, 3.7, 3.9 and 3.7
(C18:2 n-6) and for C18:3 n-3 were 3.7 (mean of controls), 5.0, 5.0, 5.3 and 4.8 g/100 g TFA (Table 5.4a,
b), for the control, ALA, ANE, ANO and CSO, respectively. The corresponding % increases relative to
the control were 26.7%, 23.3%, 30% and 23.3% (18:2 n-6) and for C18:3 n-3 were 35.1%, 35.1%, 43.2%
and 29.7%, for ALA, ANE, ANO and CSO, respectively.
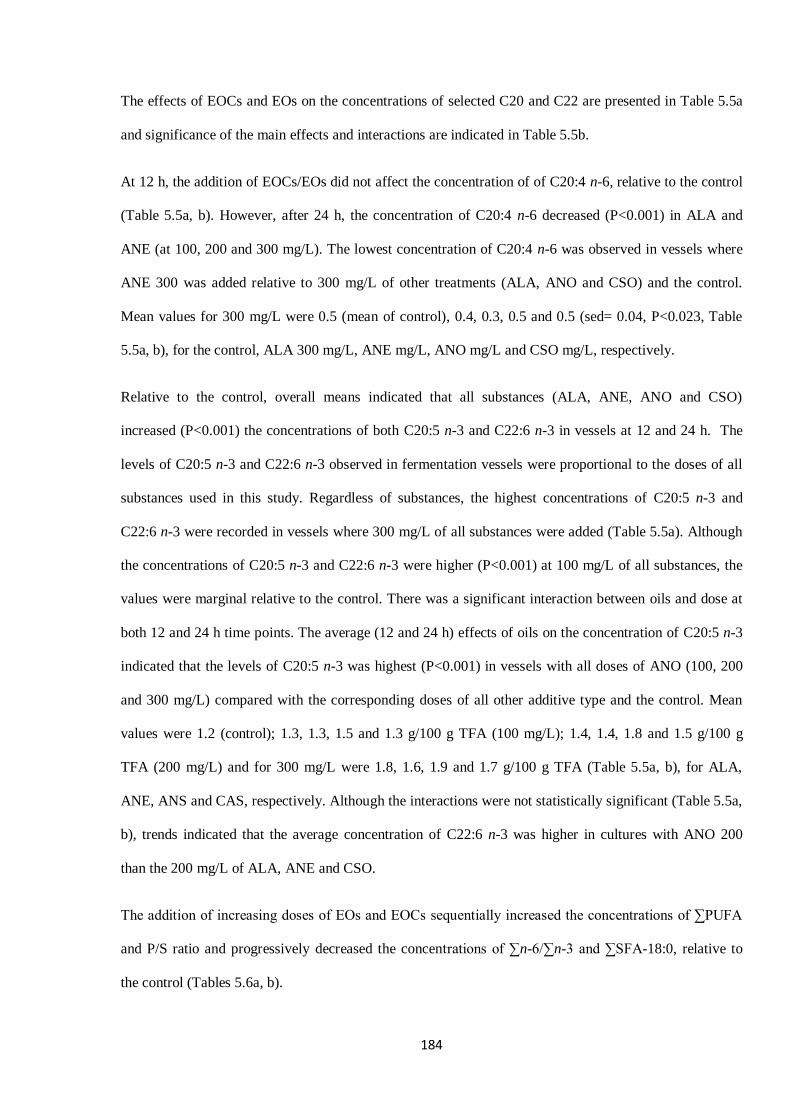
184
The effects of EOCs and EOs on the concentrations of selected C20 and C22 are presented in Table 5.5a
and significance of the main effects and interactions are indicated in Table 5.5b.
At 12 h, the addition of EOCs/EOs did not affect the concentration of of C20:4 n-6, relative to the control
(Table 5.5a, b). However, after 24 h, the concentration of C20:4 n-6 decreased (P<0.001) in ALA and
ANE (at 100, 200 and 300 mg/L). The lowest concentration of C20:4 n-6 was observed in vessels where
ANE 300 was added relative to 300 mg/L of other treatments (ALA, ANO and CSO) and the control.
Mean values for 300 mg/L were 0.5 (mean of control), 0.4, 0.3, 0.5 and 0.5 (sed= 0.04, P<0.023, Table
5.5a, b), for the control, ALA 300 mg/L, ANE mg/L, ANO mg/L and CSO mg/L, respectively.
Relative to the control, overall means indicated that all substances (ALA, ANE, ANO and CSO)
increased (P<0.001) the concentrations of both C20:5 n-3 and C22:6 n-3 in vessels at 12 and 24 h. The
levels of C20:5 n-3 and C22:6 n-3 observed in fermentation vessels were proportional to the doses of all
substances used in this study. Regardless of substances, the highest concentrations of C20:5 n-3 and
C22:6 n-3 were recorded in vessels where 300 mg/L of all substances were added (Table 5.5a). Although
the concentrations of C20:5 n-3 and C22:6 n-3 were higher (P<0.001) at 100 mg/L of all substances, the
values were marginal relative to the control. There was a significant interaction between oils and dose at
both 12 and 24 h time points. The average (12 and 24 h) effects of oils on the concentration of C20:5 n-3
indicated that the levels of C20:5 n-3 was highest (P<0.001) in vessels with all doses of ANO (100, 200
and 300 mg/L) compared with the corresponding doses of all other additive type and the control. Mean
values were 1.2 (control); 1.3, 1.3, 1.5 and 1.3 g/100 g TFA (100 mg/L); 1.4, 1.4, 1.8 and 1.5 g/100 g
TFA (200 mg/L) and for 300 mg/L were 1.8, 1.6, 1.9 and 1.7 g/100 g TFA (Table 5.5a, b), for ALA,
ANE, ANS and CAS, respectively. Although the interactions were not statistically significant (Table 5.5a,
b), trends indicated that the average concentration of C22:6 n-3 was higher in cultures with ANO 200
than the 200 mg/L of ALA, ANE and CSO.
The addition of increasing doses of EOs and EOCs sequentially increased the concentrations of ∑PUFA
and P/S ratio and progressively decreased the concentrations of ∑n-6/∑n-3 and ∑SFA-18:0, relative to
the control (Tables 5.6a, b).
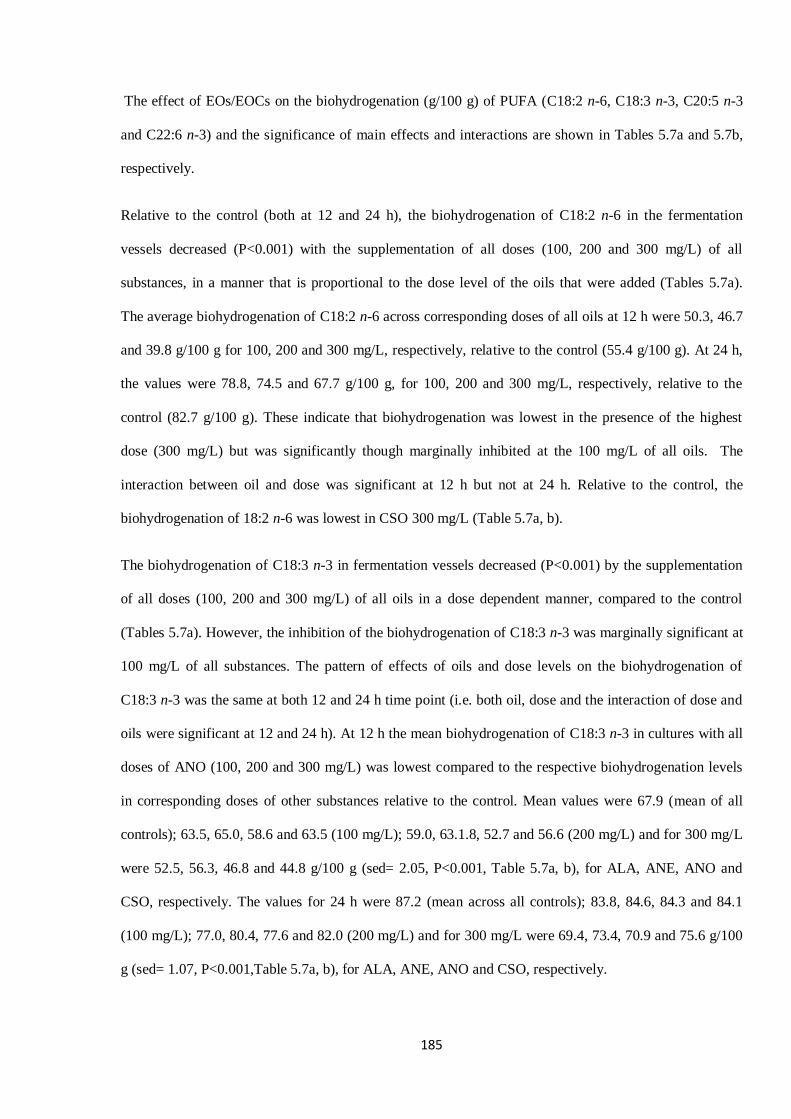
185
The effect of EOs/EOCs on the biohydrogenation (g/100 g) of PUFA (C18:2 n-6, C18:3 n-3, C20:5 n-3
and C22:6 n-3) and the significance of main effects and interactions are shown in Tables 5.7a and 5.7b,
respectively.
Relative to the control (both at 12 and 24 h), the biohydrogenation of C18:2 n-6 in the fermentation
vessels decreased (P<0.001) with the supplementation of all doses (100, 200 and 300 mg/L) of all
substances, in a manner that is proportional to the dose level of the oils that were added (Tables 5.7a).
The average biohydrogenation of C18:2 n-6 across corresponding doses of all oils at 12 h were 50.3, 46.7
and 39.8 g/100 g for 100, 200 and 300 mg/L, respectively, relative to the control (55.4 g/100 g). At 24 h,
the values were 78.8, 74.5 and 67.7 g/100 g, for 100, 200 and 300 mg/L, respectively, relative to the
control (82.7 g/100 g). These indicate that biohydrogenation was lowest in the presence of the highest
dose (300 mg/L) but was significantly though marginally inhibited at the 100 mg/L of all oils. The
interaction between oil and dose was significant at 12 h but not at 24 h. Relative to the control, the
biohydrogenation of 18:2 n-6 was lowest in CSO 300 mg/L (Table 5.7a, b).
The biohydrogenation of C18:3 n-3 in fermentation vessels decreased (P<0.001) by the supplementation
of all doses (100, 200 and 300 mg/L) of all oils in a dose dependent manner, compared to the control
(Tables 5.7a). However, the inhibition of the biohydrogenation of C18:3 n-3 was marginally significant at
100 mg/L of all substances. The pattern of effects of oils and dose levels on the biohydrogenation of
C18:3 n-3 was the same at both 12 and 24 h time point (i.e. both oil, dose and the interaction of dose and
oils were significant at 12 and 24 h). At 12 h the mean biohydrogenation of C18:3 n-3 in cultures with all
doses of ANO (100, 200 and 300 mg/L) was lowest compared to the respective biohydrogenation levels
in corresponding doses of other substances relative to the control. Mean values were 67.9 (mean of all
controls); 63.5, 65.0, 58.6 and 63.5 (100 mg/L); 59.0, 63.1.8, 52.7 and 56.6 (200 mg/L) and for 300 mg/L
were 52.5, 56.3, 46.8 and 44.8 g/100 g (sed= 2.05, P<0.001, Table 5.7a, b), for ALA, ANE, ANO and
CSO, respectively. The values for 24 h were 87.2 (mean across all controls); 83.8, 84.6, 84.3 and 84.1
(100 mg/L); 77.0, 80.4, 77.6 and 82.0 (200 mg/L) and for 300 mg/L were 69.4, 73.4, 70.9 and 75.6 g/100
g (sed= 1.07, P<0.001,Table 5.7a, b), for ALA, ANE, ANO and CSO, respectively.

186
At both 12 and 24 h, the biohydrogenation of C20:5 n-3 and C22:6 n-3 in fermentation vessels decreased
(P<0.001) as the level (100, 200 and 300 mg/L) of all substances increased (Tables 5.7a). However, on
the average, the minimum level of all substances necessary to cause substantial inhibition of the
biohydrogenation of both C20:5 n-3 and C22:6 n-3 was 200 mg/L. The rate of biohydrogenation of C20:5
n-3 and C22:6 n-3 was not different between the corresponding levels of all substances (i.e. no significant
interaction between oils and dose, Table 5.7b).
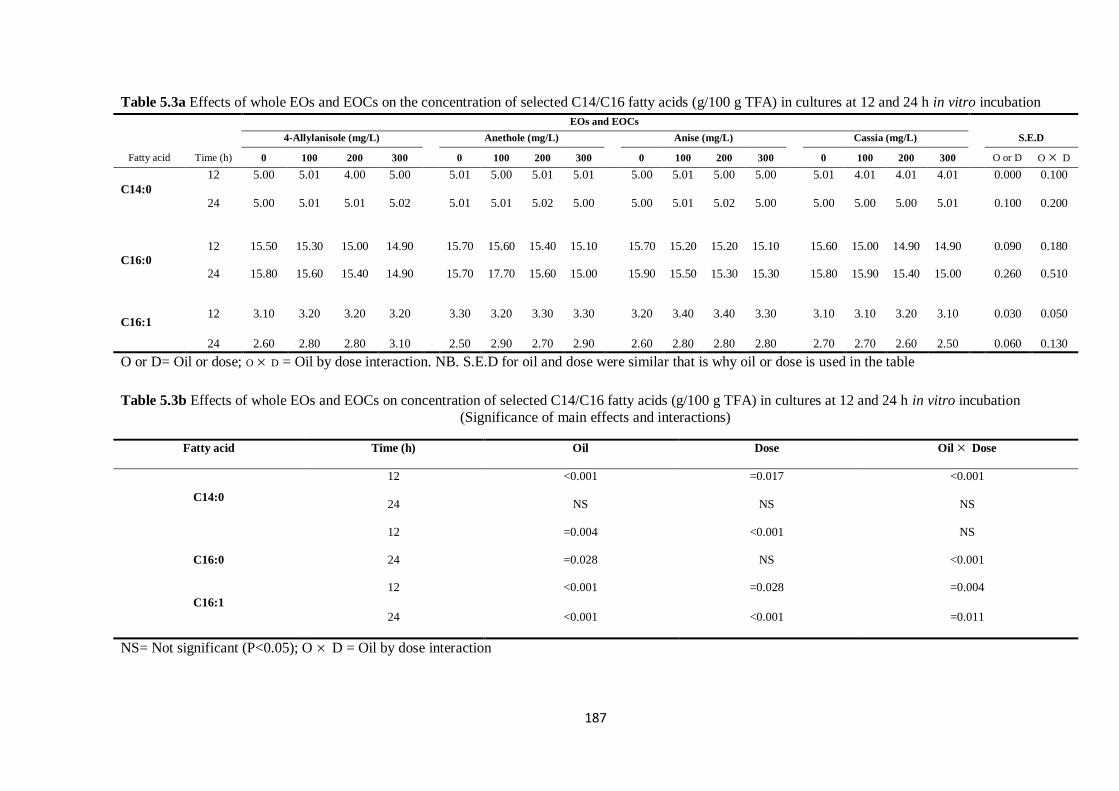
187
Table 5.3a Effects of whole EOs and EOCs on the concentration of selected C14/C16 fatty acids (g/100 g TFA) in cultures at 12 and 24 h in vitro incubation
EOs and EOCs
4-Allylanisole (mg/L) Anethole (mg/L) Anise (mg/L) Cassia (mg/L) S.E.D
Fatty acid Time (h) 0 100 200 300 0 100 200 300 0 100 200 300 0 100 200 300 O or D O D
C14:0
12 5.00 5.01 4.00 5.00 5.01 5.00 5.01 5.01 5.00 5.01 5.00 5.00 5.01 4.01 4.01 4.01 0.000 0.100
24 5.00 5.01 5.01 5.02 5.01 5.01 5.02 5.00 5.00 5.01 5.02 5.00 5.00 5.00 5.00 5.01 0.100 0.200
C16:0
12 15.50 15.30 15.00 14.90 15.70 15.60 15.40 15.10 15.70 15.20 15.20 15.10 15.60 15.00 14.90 14.90 0.090 0.180
24 15.80 15.60 15.40 14.90 15.70 17.70 15.60 15.00 15.90 15.50 15.30 15.30 15.80 15.90 15.40 15.00 0.260 0.510
C16:1 12 3.10 3.20 3.20 3.20 3.30 3.20 3.30 3.30 3.20 3.40 3.40 3.30 3.10 3.10 3.20 3.10 0.030 0.050
24 2.60 2.80 2.80 3.10 2.50 2.90 2.70 2.90 2.60 2.80 2.80 2.80 2.70 2.70 2.60 2.50 0.060 0.130
O or D= Oil or dose; O D = Oil by dose interaction. NB. S.E.D for oil and dose were similar that is why oil or dose is used in the table
Table 5.3b Effects of whole EOs and EOCs on concentration of selected C14/C16 fatty acids (g/100 g TFA) in cultures at 12 and 24 h in vitro incubation
(Significance of main effects and interactions)
Fatty acid Time (h) Oil Dose Oil Dose
C14:0
12 <0.001 =0.017 <0.001
24 NS NS NS
C16:0
12 =0.004 <0.001 NS
24 =0.028 NS <0.001
C16:1
12 <0.001 =0.028 =0.004
24 <0.001 <0.001 =0.011
NS= Not significant (P<0.05); O D = Oil by dose interaction
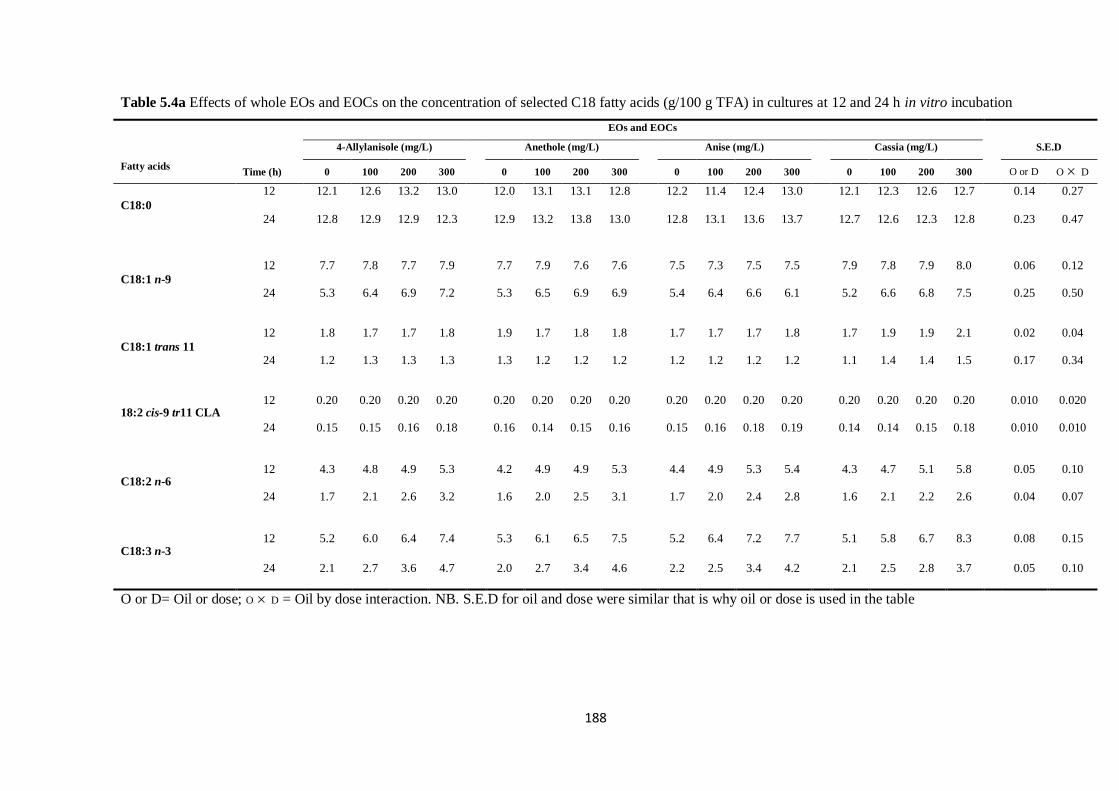
188
Table 5.4a Effects of whole EOs and EOCs on the concentration of selected C18 fatty acids (g/100 g TFA) in cultures at 12 and 24 h in vitro incubation
EOs and EOCs
4-Allylanisole (mg/L) Anethole (mg/L) Anise (mg/L) Cassia (mg/L) S.E.D
Fatty acids Time (h) 0 100 200 300 0 100 200 300 0 100 200 300 0 100 200 300 O or D O D
C18:0
12 12.1 12.6 13.2 13.0 12.0 13.1 13.1 12.8 12.2 11.4 12.4 13.0 12.1 12.3 12.6 12.7 0.14 0.27
24 12.8 12.9 12.9 12.3 12.9 13.2 13.8 13.0 12.8 13.1 13.6 13.7 12.7 12.6 12.3 12.8 0.23 0.47
C18:1 n-9
12 7.7 7.8 7.7 7.9 7.7 7.9 7.6 7.6 7.5 7.3 7.5 7.5 7.9 7.8 7.9 8.0 0.06 0.12
24 5.3 6.4 6.9 7.2 5.3 6.5 6.9 6.9 5.4 6.4 6.6 6.1 5.2 6.6 6.8 7.5 0.25 0.50
C18:1 trans 11
12 1.8 1.7 1.7 1.8 1.9 1.7 1.8 1.8 1.7 1.7 1.7 1.8 1.7 1.9 1.9 2.1 0.02 0.04
24 1.2 1.3 1.3 1.3 1.3 1.2 1.2 1.2 1.2 1.2 1.2 1.2 1.1 1.4 1.4 1.5 0.17 0.34
18:2 cis-9 tr11 CLA
12 0.20 0.20 0.20 0.20 0.20 0.20 0.20 0.20 0.20 0.20 0.20 0.20 0.20 0.20 0.20 0.20 0.010 0.020
24 0.15 0.15 0.16 0.18 0.16 0.14 0.15 0.16 0.15 0.16 0.18 0.19 0.14 0.14 0.15 0.18 0.010 0.010
C18:2 n-6
12 4.3 4.8 4.9 5.3 4.2 4.9 4.9 5.3 4.4 4.9 5.3 5.4 4.3 4.7 5.1 5.8 0.05 0.10
24 1.7 2.1 2.6 3.2 1.6 2.0 2.5 3.1 1.7 2.0 2.4 2.8 1.6 2.1 2.2 2.6 0.04 0.07
C18:3 n-3
12 5.2 6.0 6.4 7.4 5.3 6.1 6.5 7.5 5.2 6.4 7.2 7.7 5.1 5.8 6.7 8.3 0.08 0.15
24 2.1 2.7 3.6 4.7 2.0 2.7 3.4 4.6 2.2 2.5 3.4 4.2 2.1 2.5 2.8 3.7 0.05 0.10
O or D= Oil or dose; O D = Oil by dose interaction. NB. S.E.D for oil and dose were similar that is why oil or dose is used in the table
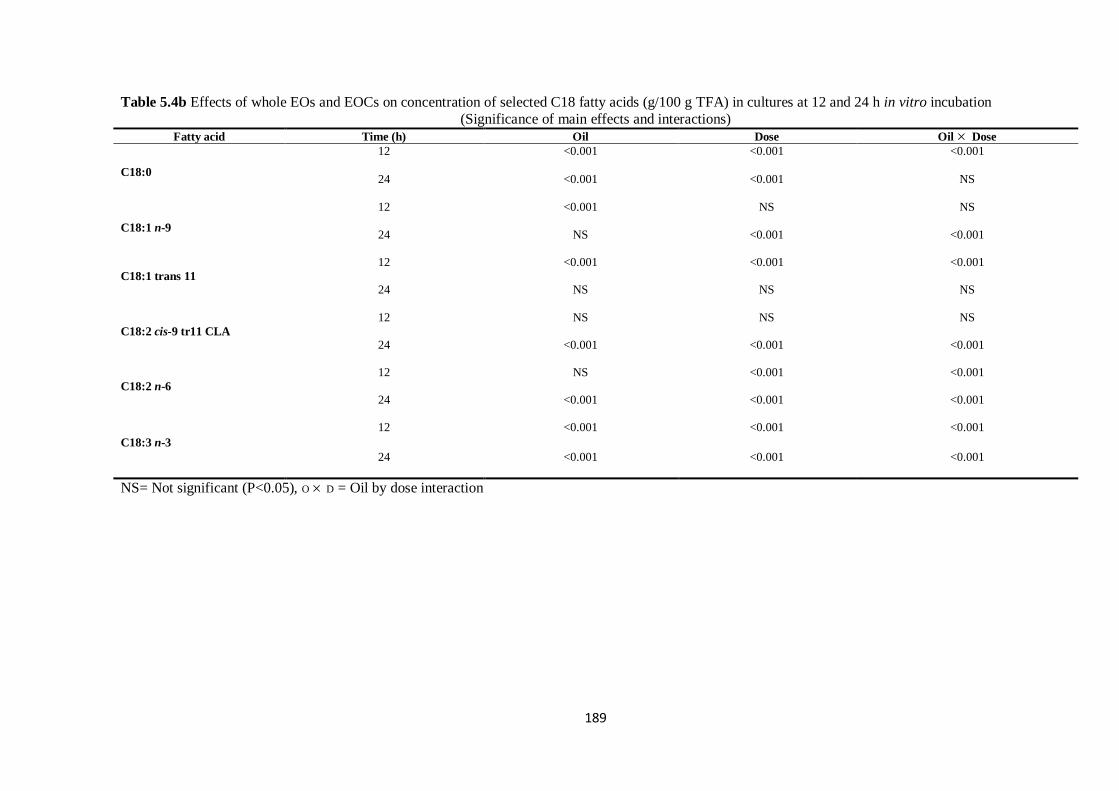
189
Table 5.4b Effects of whole EOs and EOCs on concentration of selected C18 fatty acids (g/100 g TFA) in cultures at 12 and 24 h in vitro incubation
(Significance of main effects and interactions)
Fatty acid Time (h) Oil Dose Oil Dose
C18:0
12 <0.001 <0.001 <0.001
24 <0.001 <0.001 NS
C18:1 n-9
12 <0.001 NS NS
24 NS <0.001 <0.001
C18:1 trans 11
12 <0.001 <0.001 <0.001
24 NS NS NS
C18:2 cis-9 tr11 CLA
12 NS NS NS
24 <0.001 <0.001 <0.001
C18:2 n-6
12 NS <0.001 <0.001
24 <0.001 <0.001 <0.001
C18:3 n-3
12 <0.001 <0.001 <0.001
24 <0.001 <0.001 <0.001
NS= Not significant (P<0.05), O D = Oil by dose interaction
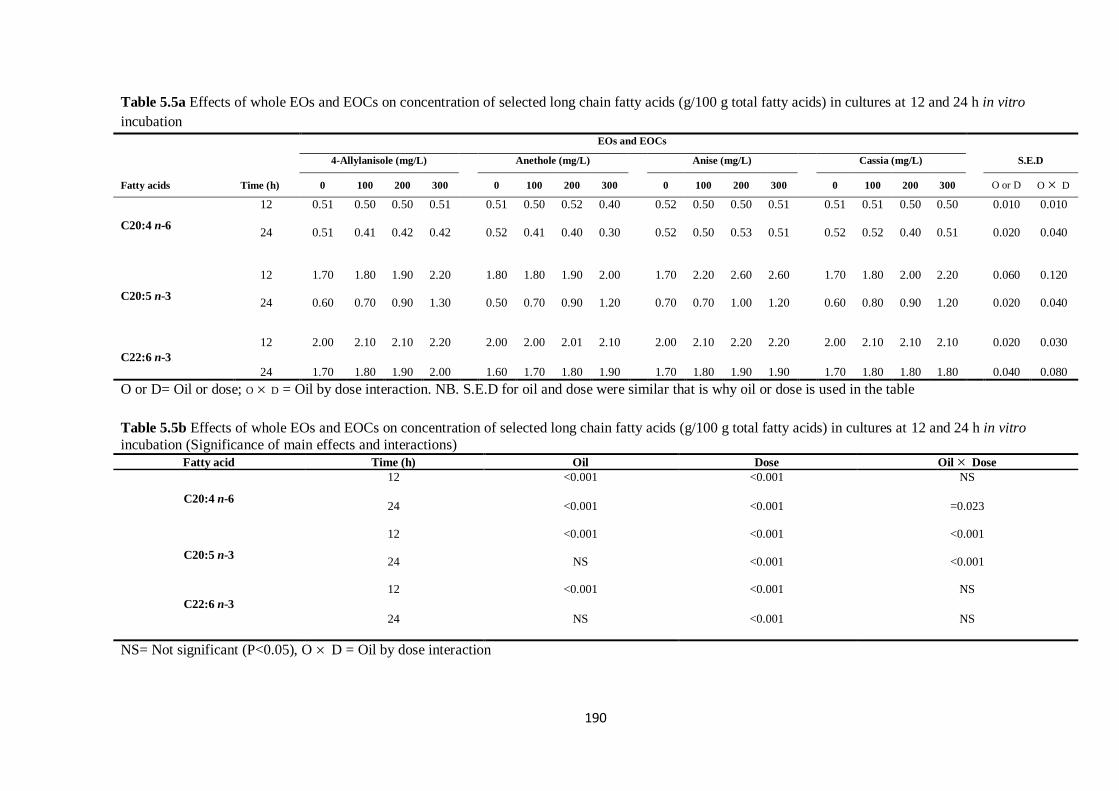
190
Table 5.5a Effects of whole EOs and EOCs on concentration of selected long chain fatty acids (g/100 g total fatty acids) in cultures at 12 and 24 h in vitro
incubation
EOs and EOCs
4-Allylanisole (mg/L) Anethole (mg/L) Anise (mg/L) Cassia (mg/L) S.E.D
Fatty acids Time (h) 0 100 200 300 0 100 200 300 0 100 200 300 0 100 200 300 O or D O D
C20:4 n-6
12 0.51 0.50 0.50 0.51 0.51 0.50 0.52 0.40 0.52 0.50 0.50 0.51 0.51 0.51 0.50 0.50 0.010 0.010
24 0.51 0.41 0.42 0.42 0.52 0.41 0.40 0.30 0.52 0.50 0.53 0.51 0.52 0.52 0.40 0.51 0.020 0.040
C20:5 n-3
12 1.70 1.80 1.90 2.20 1.80 1.80 1.90 2.00 1.70 2.20 2.60 2.60 1.70 1.80 2.00 2.20 0.060 0.120
24 0.60 0.70 0.90 1.30 0.50 0.70 0.90 1.20 0.70 0.70 1.00 1.20 0.60 0.80 0.90 1.20 0.020 0.040
C22:6 n-3
12 2.00 2.10 2.10 2.20 2.00 2.00 2.01 2.10 2.00 2.10 2.20 2.20 2.00 2.10 2.10 2.10 0.020 0.030
24 1.70 1.80 1.90 2.00 1.60 1.70 1.80 1.90 1.70 1.80 1.90 1.90 1.70 1.80 1.80 1.80 0.040 0.080
O or D= Oil or dose; O D = Oil by dose interaction. NB. S.E.D for oil and dose were similar that is why oil or dose is used in the table
Table 5.5b Effects of whole EOs and EOCs on concentration of selected long chain fatty acids (g/100 g total fatty acids) in cultures at 12 and 24 h in vitro
incubation (Significance of main effects and interactions)
Fatty acid Time (h) Oil Dose Oil Dose
C20:4 n-6
12 <0.001 <0.001 NS
24 <0.001 <0.001 =0.023
C20:5 n-3
12 <0.001 <0.001 <0.001
24 NS <0.001 <0.001
C22:6 n-3
12 <0.001 <0.001 NS
24 NS <0.001 NS
NS= Not significant (P<0.05), O D = Oil by dose interaction

191
Table 5.6a Effects of whole EOs and EOCs on the concentration of fatty acids (g/100 g TFA) and content of total fatty acids (mg/g) at 12 and 24 h in vitro
incubation
EOs and EOCs
4-Allylanisole Anethole Anise Cassia S.E.D
Fatty Acid Time (h) 0 100 200 300 0 100 200 300 0 100 200 300 0 100 200 300 O or D O D
RFA
12 32.0 30.9 31.3 29.5 31.6 30.3 30.7 30.0 32.1 31.8 29.9 29.4 31.1 31.9 30.5 28.7 0.34 0.68
24 40.7 36.8 35.3 34.4 40.8 36.3 35.0 35.3 40.7 37.3 36.1 34.2 40.6 36.0 36.8 35.7 0.87 1.73
∑SFA
12 32.3 32.4 32.6 32.5 32.4 33.3 33.2 32.6 32.6 31.8 32.5 33.0 32.4 31.6 32.0 32.0 0.20 0.40
24 33.3 33.1 33.0 32.0 33.2 33.6 34.1 32.8 33.5 33.3 33.6 33.7 33.2 33.0 32.2 32.4 0.54 1.07
∑SFA-18:0
12 20.3 19.8 19.4 19.5 20.2 20.2 20.0 19.8 20.3 20.3 20.2 20.0 20.4 19.3 19.4 19.3 0.09 0.17
24 20.5 20.3 20.1 19.7 20.4 20.3 20.2 19.8 20.6 20.2 20.0 19.9 20.5 20.4 19.9 19.5 0.32 0.65
∑MUFA
12 12.7 12.8 12.5 12.7 12.7 12.8 12.6 12.6 12.8 12.5 12.6 12.4 12.6 12.8 13.0 13.2 0.08 0.16
24 9.1 10.5 11.1 11.6 9.3 10.6 10.8 11.0 9.1 10.4 10.7 11.0 9.2 10.7 10.9 11.5 0.25 0.49
∑PUFA
12 13.9 15.6 15.9 17.8 13.8 15.5 16.0 17.7 13.9 16.3 18.1 18.6 14.0 15.0 16.7 19.0 0.32 0.64
24 6.7 7.8 9.5 11.7 6.7 7.6 9.1 11.3 6.7 7.6 9.4 11.0 6.7 7.7 8.3 9.9 0.09 0.19
TFA (mg/g)
12 41.3 39.0 37.6 36.2 41.2 36.1 39.1 38.3 41.3 42.0 41.3 39.4 41.4 38.5 37.7 36.7 0.83 1.66
24 39.7 39.1 37.8 37.9 39.7 40.1 38.2 38.7 39.8 40.9 41.8 39.8 39.6 41.6 40.3 40.6 1.23 2.46
n-6/n-3 12 0.55 0.54 0.51 0.49 0.56 0.54 0.52 0.49 0.55 0.50 0.48 0.47 0.54 0.53 0.52 0.50 0.004 0.008
24 0.50 0.49 0.47 0.45 0.50 0.49 0.47 0.45 0.51 0.51 0.48 0.45 0.50 0.50 0.49 0.47 0.007 0.014
P/S
12 0.43 0.48 0.49 0.55 0.43 0.47 0.48 0.54 0.44 0.52 0.56 0.56 0.42 0.47 0.52 0.59 0.006 0.013
24 0.35 0.39 0.47 0.59 0.34 0.37 0.45 0.57 0.36 0.38 0.47 0.55 0.35 0.38 0.41 0.51 0.01 0.02
O or D= Oil or dose; O D = Oil by dose interaction. NB. S.E.D for oil and dose were similar that is why oil or dose is used in the table. RFA= remaining fatty
acids, SFA= saturated fatty acids, MUFA= monounsaturated fatty acids, PUFA= polyunsaturated fatty acids, TFA= total fatty acids, n-6/n-3= sum of n-6 divided
by sum of n-3 fatty acids, P/S= sum of PUFA divided by sum of SFA.
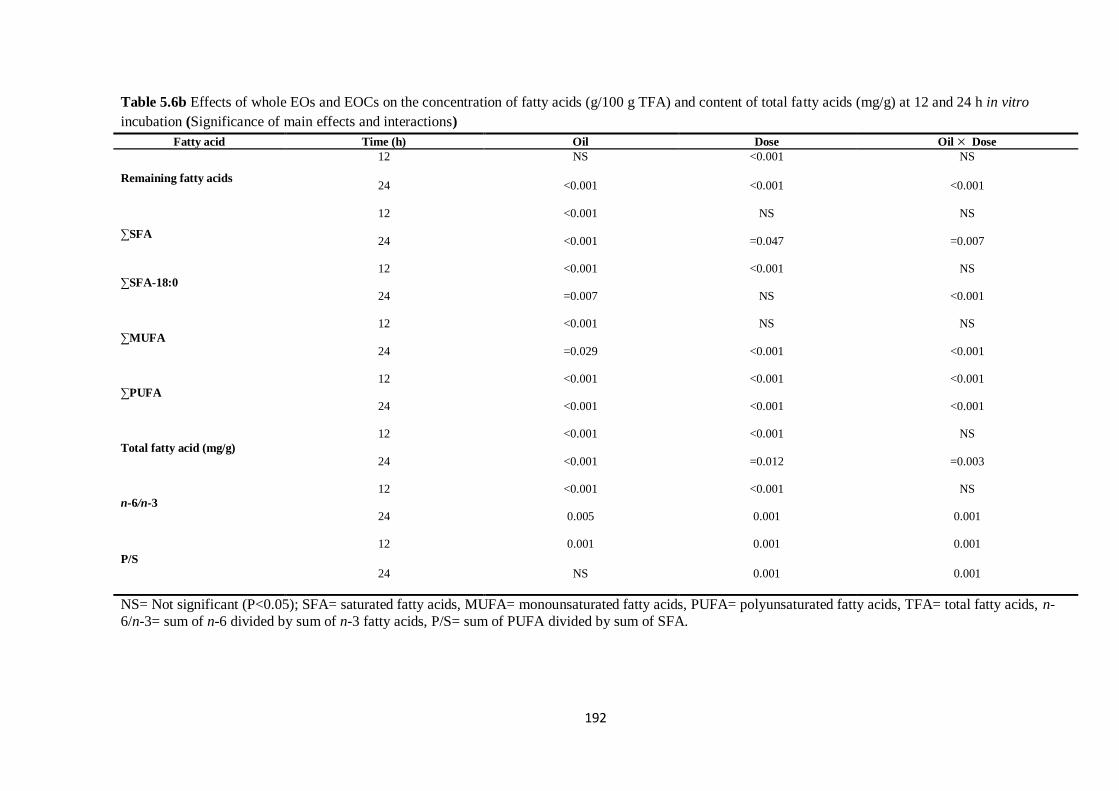
192
Table 5.6b Effects of whole EOs and EOCs on the concentration of fatty acids (g/100 g TFA) and content of total fatty acids (mg/g) at 12 and 24 h in vitro
incubation (Significance of main effects and interactions)
Fatty acid Time (h) Oil Dose Oil Dose
Remaining fatty acids
12 NS <0.001 NS
24 <0.001 <0.001 <0.001
∑SFA
12 <0.001 NS NS
24 <0.001 =0.047 =0.007
∑SFA-18:0
12 <0.001 <0.001 NS
24 =0.007 NS <0.001
∑MUFA
12 <0.001 NS NS
24 =0.029 <0.001 <0.001
∑PUFA
12 <0.001 <0.001 <0.001
24 <0.001 <0.001 <0.001
Total fatty acid (mg/g)
12 <0.001 <0.001 NS
24 <0.001 =0.012 =0.003
n-6/n-3
12 <0.001 <0.001 NS
24 0.005 0.001 0.001
P/S
12 0.001 0.001 0.001
24 NS 0.001 0.001
NS= Not significant (P<0.05); SFA= saturated fatty acids, MUFA= monounsaturated fatty acids, PUFA= polyunsaturated fatty acids, TFA= total fatty acids, n-
6/n-3= sum of n-6 divided by sum of n-3 fatty acids, P/S= sum of PUFA divided by sum of SFA.
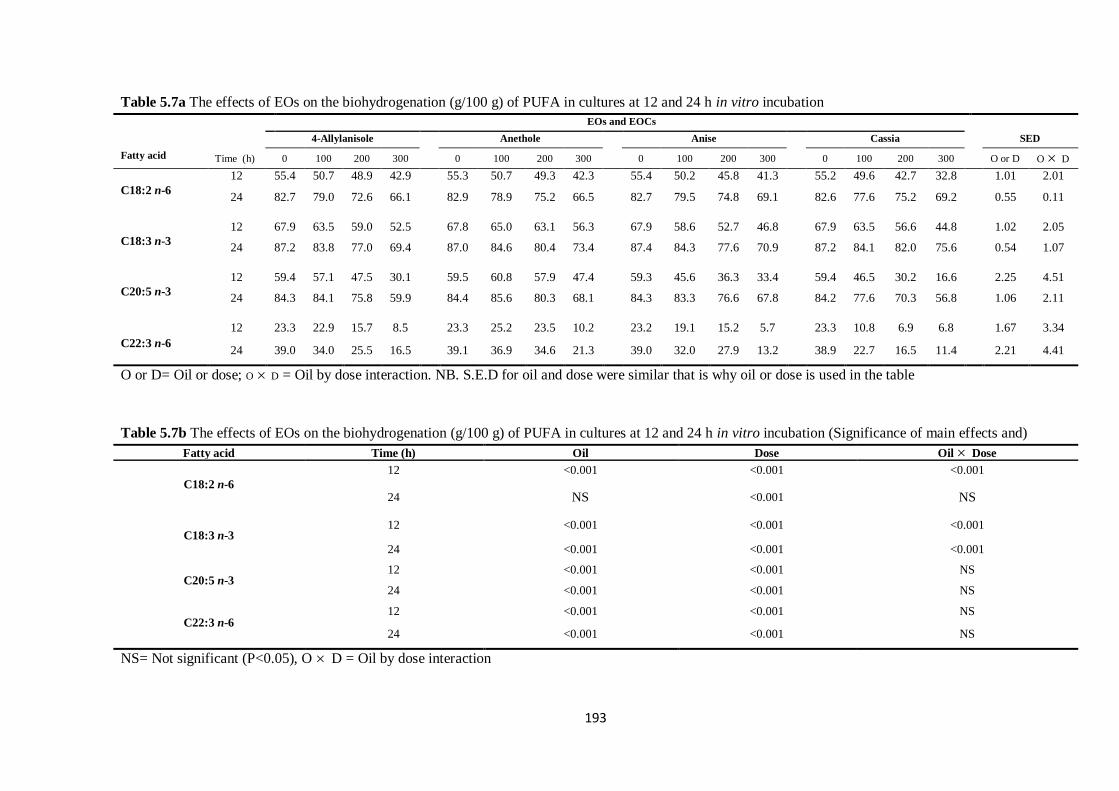
193
Table 5.7a The effects of EOs on the biohydrogenation (g/100 g) of PUFA in cultures at 12 and 24 h in vitro incubation
EOs and EOCs
4-Allylanisole Anethole Anise Cassia SED
Fatty acid Time (h) 0 100 200 300 0 100 200 300 0 100 200 300 0 100 200 300 O or D O D
C18:2 n-6
12 55.4 50.7 48.9 42.9 55.3 50.7 49.3 42.3 55.4 50.2 45.8 41.3 55.2 49.6 42.7 32.8 1.01 2.01
24 82.7 79.0 72.6 66.1 82.9 78.9 75.2 66.5 82.7 79.5 74.8 69.1 82.6 77.6 75.2 69.2 0.55 0.11
C18:3 n-3
12 67.9 63.5 59.0 52.5 67.8 65.0 63.1 56.3 67.9 58.6 52.7 46.8 67.9 63.5 56.6 44.8 1.02 2.05
24 87.2 83.8 77.0 69.4 87.0 84.6 80.4 73.4 87.4 84.3 77.6 70.9 87.2 84.1 82.0 75.6 0.54 1.07
C20:5 n-3
12 59.4 57.1 47.5 30.1 59.5 60.8 57.9 47.4 59.3 45.6 36.3 33.4 59.4 46.5 30.2 16.6 2.25 4.51
24 84.3 84.1 75.8 59.9 84.4 85.6 80.3 68.1 84.3 83.3 76.6 67.8 84.2 77.6 70.3 56.8 1.06 2.11
C22:3 n-6
12 23.3 22.9 15.7 8.5 23.3 25.2 23.5 10.2 23.2 19.1 15.2 5.7 23.3 10.8 6.9 6.8 1.67 3.34
24 39.0 34.0 25.5 16.5 39.1 36.9 34.6 21.3 39.0 32.0 27.9 13.2 38.9 22.7 16.5 11.4 2.21 4.41
O or D= Oil or dose; O D = Oil by dose interaction. NB. S.E.D for oil and dose were similar that is why oil or dose is used in the table
Table 5.7b The effects of EOs on the biohydrogenation (g/100 g) of PUFA in cultures at 12 and 24 h in vitro incubation (Significance of main effects and)
Fatty acid Time (h) Oil Dose Oil Dose
C18:2 n-6
12 <0.001 <0.001 <0.001
24 NS <0.001 NS
C18:3 n-3 12 <0.001 <0.001 <0.001
24 <0.001 <0.001 <0.001
C20:5 n-3 12 <0.001 <0.001 NS
24 <0.001 <0.001 NS
C22:3 n-6 12 <0.001 <0.001 NS
24 <0.001 <0.001 NS
NS= Not significant (P<0.05), O D = Oil by dose interaction
194
5.4. Discussion
The aim of the present study was to examine the effects of graded doses of 4-Allylanisole, anethole, anise
oil and cassia oil on the extent of rumen biohydrogenation of n-3 PUFA. The EOCs used in the current
study were selected based on the 24 h batch culture results of the first experiment described in Chapter 3
which screened the effects of 15 individual essential oil’s constituent compounds on the extent of rumen
biohydrogenation of n-3 PUFA (Eburu and Chikunya, 2014). Similarly, the EOs used in the current study
were selected based on the 24 h batch culture results of the second experiment described in Chapter 4
which screened the effects of 10 whole essential oils on the extent of rumen biohydrogenation of n-3
PUFA (Eburu and Chikunya, 2015a). In each of those experiments, selection of both EOCs and EOs was
based on two ways: on one hand, the EOCs/EOs were ranked from 1 (highest) to 15 (lowest) based on the
concentration (g/100 g TFA) of C18:3 n-3, C18:2 n-6, C20:5 n-3, C22:6 n-3, C18:2 cis-9 trans-11 CLA
and C18:1trans 11 in their cultures, on another hand, EOCs/EOs were ranked from 1 (least inhibitory) to
15 (most inhibitory) on VFA concentration. After considering their effects on fatty acid and volatile fatty
acid concentrations, the two overall best EOCs and two best EOs were selected and investigated in the
current study to establish optimum doses for them.
5.4.1. In vitro fermentation parameters
In this study, it was generally observed that the supplementation of all doses of EOCs/EOs progressively
reduced substantially the amount of total gas. Regardless of oil, the 300 mg/L (highest dose) of all
substances induced the most reduction (average 22%) on total gas. At 200 mg/L, all treatments caused
marginal inhibition of total gas (average 6%), except for CSO which inhibited by 15% at this level of
inclusion. There was a significant interaction between dose levels and EOs/EOCs but only at the highest
level (300 mg/L) at 12 h. This interaction showed that the supplementation of CSO 300 mg/L induced the
highest inhibition of total gas relative to the 300 mg/L of the rest of the treatments (ALA, ANE and
ANO). However, after 24 h the interaction between dose levels and EOs/EOCs was not significant. The
dose dependent effects of the substances on gas production are consistent with previous studies such as
those of Talebzadeh et al. (2012), where the supplementation of different doses (150, 300, 450 and
microgram/ml) of oil of Zataria multiflora, which is rich in thymol and carvacrol (phenolic compounds)

195
and those of Gunal et al., (2013), where Siberian fir needle oil (125, 250 and 500 mg/L) reduced total gas
production according to concentration of EOs.
Overall, under our experimental conditions, the minimum concentration of EOCs/EOs that caused
inhibition of rumen fermentation activities (gas production, concentrations of NH3-N, VFA and PUFA)
ranged from 100 mg/L to 300 mg/L for all the substances used (ALA, ANE, ANO and CSO). It is useful
to point out that the uniqueness of substances in this study is that all the whole oils (anise and cassia)
contained phenolic compounds as the most active components and all the essential oil compounds (4-
allyanisole and anethole) are also phenolic compounds (Table 3.3; 4.2). Anethole is the main active
compound in anise oil (P. anisum) (Soher et al., 2014; Davidson and Naidu, 2000, Table 4.2);
cinnamaldehyde is the predominant constituent of cassia oil (EP 5; Kalemba et al., 2012; Table 4.2) and
4-allylanisole is the most active component of basil oil (Naidu 2000; Holley et al., 2005). Anethole,
cinnamaldehyde and 4-allylanisole are phenylpropanoids (see Table 3.3). Hence, all the substances
contained phenolic moieties in their chemical structures. The antimicrobial effects and mechanism of
action of EO is determined by the chemical structure of its constituent compounds (Dorman and Deans,
2000). Hence, these phenolic compounds (in the current study) generally require about the same
concentration to elicit a response. This characteristic (phenolic chemical structure) which is common to
all the substances in the current study could be speculated as the reason for the lack of marked difference
among them in terms of their effect on gas production after 24 h. The range of minimum concentrations
of EOCs/EOs in this study (100-300 mg/L) is within the established minimum inhibitory concentration
(MIC) necessary to cause inhibition of both mixtures of microorganisms and single bacterial species by
other phenolic compounds or essential oils rich in phenolic compounds of this type. The MIC of carvacrol
was 22.5-500 mg/L against Escherichia coli (Cosentino et al., 1999); 17.5-45 mg/L against
Staphylococcus aureus (Lambert et al., 2001) and 37.5-500 mg/L against Listeria monocytogenes
(Cosentino et al., 1999; Pol and Smid, 1999). The MIC for thymol was 22.5-45 mg/L against E.coli
(Cosentino et al., 1999), 45.0 mg/L against L. monocytogenes (although these are not rumen bacteria)
(Cosentino et al., 1999) and 14.0-22.5 mg/L against Staph. aureus (Cosentino et al., 1999; Lambert et al.,
2001). The MIC for clove oil (whose main active compound is eugenol, a phenolic compound) against
196
E.coli ranges from 40-250 mg/L (Smith-Palmer et al., 1998) and against L.monocytogenes was 20 mg/L
(Smith-Palmer et al., 1998). The MIC for thyme oil (rich in thymol and carvacrol) against
L.monocytogenes was 30 mg/L (Smith-Palmer et al., 1998; Burt 2004) and against E.coli ranges from 45-
125 mg/L (Smith-Palmer et al., 1998; Burt 2004). The broadest antimicrobial activities of the phenolic
compounds is linked with the possession of hydroxyl group, whose acidic characters are speculated to
inhibit both the attachment of bacteria to insoluble fractions of feed and the digestion of the soluble
components of feeds (McAllister et al., 1994; Aharoni et al., 1998).
The concentration of NH3-N in fermentation vessels was reduced in CSO (at 100, 200 and 300), ANE (at
100 and 200 mg/L) and ALA and ANO (300 mg/L). These results are consistent with the observations of
Busquet et al. (2006) who reported that cassia/cinnamon oil and its main constituent compound
(cinnamaldehyde) reduced ammonia concentration. However, Busquet et al. (2006) did not observe
reduction in NH3-N with the supplementation of ANE and ANO (at 30 or 300 mg/L). The difference in
the observation between our results and those of Busquet et al. (2006) could be due to the variations in
the environmental conditions, plant chemotype or in the preparation of the anise oil. The results when 300
mg/L of all substances was administered are also in agreement with the reports in Chapter 3 (where the
levels of NH3-N in vessels were significantly decreased with the addition of ALA and ANE), and in
Chapter 4 (where the addition of CSO reduced the content of NH3-N). These findings suggest that the
inclusion of ALA and ANO (300 mg/L); ANE (at 100 and 200 mg/L) and CSO (at 100, 200 and 300)
could potentially inhibit the activities of hyper ammonia producing bacteria or proteolytic bacteria (which
are responsible for extensive deamination of amino acid, Mclnotch et al., 2003; Bach et al., 2005; section
1.7.6). It has been observed that about 75-85% of dietary N consumed by dairy cows is excreted in faeces
and urine as waste (Tamminga, 1992). Therefore, in terms of practical implications of the results of the
current study, it can be conceived that supplementing the diet of dairy cows with CSO (either at 100, 200
or 300 mg/L), ANE (at 100 mg/L) and ALA and ANO (at 300 mg/L) could possibly reduce the
production of NH3-N and increase ruminal escape of dietary protein, consequently improving the
efficiency of protein use in the rumen (Van Nevel and Demeyer, 1988). There was a significant
interaction between dose levels and EOs/EOCs, which suggest that the use of CSO 100 mg/L would
197
reduce more amount of ammonia than the supplementation of ANE 100 mg/L. Reduction of NH3-N with
the supplementation of ANE (at 100 mg/L) has practical benefits as its use would potentially improve the
efficiency of protein in the rumen without adversely affecting VFA concentration (see VFA concentration
at 100 mg/L).
Total VFA was decreased with the inclusion of all the EOCs and EOs used in this experiment, with the
highest reductions being observed in vessels with CSO and ALA. All doses of all EOs and EOCs
maintained a dose related response effects on TVFA with the exception of ANE, with cultures receiving
the highest dose (300 mg/L) of all substances irrespective of oil inducing the highest inhibition (average
12%) on TVFA. The rate of VFA inhibition which clearly depends on doses of EOs is consistent with the
reports of other studies who investigated dose related (0, 3, 30, 300 and 3000 mg/L) effects of cassia oil,
anethole and anise oil on VFA concentration (Bustquet et al., 2006; Macheboeuf et al., 2008; Gunal et al.,
2013). Furthermore, these results are in agreement with those of Gunal et al. (2013), where different
doses of citronella oil (125, 250 and 500 mg/L) reduced TVFA; Pandu et al. (2014), where the addition of
thyme oil (125, 250 and 500 mg/l); and Agarwal et al. (2009), where 1.0 and 2.0 ml/L of peppermint oil
caused a dose related depression of feed digestibility and TVFA concentration. The average inhibition of
TVFA with the inclusion of 300 mg/L of all substances in the current study also agree with our previous
reports where the addition of 300 mg/L of EOCs (Chapter 3) and EOs (Chapter 4) caused over 10%
reduction of TVFA. There was a significant interaction at 200 mg/L, which indicated that ANE, ALA
and ANO only marginally reduced TVFA (by about 2%) relative to the control, but CSO reduced TVFA
by 10%. Therefore, it could be suggested in this study that whilst the optimum dose for ALA, ANE and
ANO could be 200 mg/L (because at this dose no substantial reduction on TVFA was observed), CSO
requires less than 200 mg/L to maintain similar effect on concentration of TVFA. However, if the diets of
ruminant must be supplemented with CSO 200 mg/L (due to other benefits associated with this dose),
equivalent of 4.8 g/day/sheep, then ways of preventing reduction in feed intake, such as encapsulation
must be developed. This findings support earlier observation that addition of EOCs/EOs may decrease (at
high doses) or have no effect (at low doses) on VFA concentration (Patra and Saxena, 2010). In the
current study, the effects of EOs/EOCs on the concentration of TVFA at different doses were consistent
198
with the reported effects on cumulative gas production. This suggests that the way a substance affects the
digestion of feed (decrease/increase) directly impacts on the concentration of TVFA. Reduced digestion
in feed which is reflected on decreased production of gas can be accompanied by less production of
hydrogen, CH4 and volatile fatty acids plus a lower A/P ratio (Boggs et al., 1987).
The molar proportion of acetate was reduced in CSO (at 100, 200 and 300 mg/L); ALA and ANO (at 300
mg/L); and in ANE (100 mg/L), and the reduction in cultures with CSO progressed as the dose of CSO
decreased. There was a significant interaction at all doses which suggest that the supplementation of CSO
(at 100, 200 and 300 mg/L) would possibly increase the molar proportion of propionate more than the
addition of the remaining treatments. Consistent with the reduction on the molar concentration of acetate
in cultures with CSO (at all doses), the A/P ratio was significantly reduced in vessels where all doses of
CSO were added. As anaerobic fermentation of proteins and carbohydrates with higher propionate levels
results in reduced acetate and methanogenesis (Demeyer and Van Nevel, 1995), results of this study
suggest that the inclusion of CSO (100, 200 and 300 mg/L) would modify microbial population towards
decreased methanogenesis. These observations are in support of previous reports with ALA and ANE
(Chapter 3) and ANO and CSO (Chapter 4). The fact that ANE (at 100 mg/L) reduced the molar
proportions of acetate and propionate casts doubt on its practical application as feed additive in dairy
farming. Reduction in propionate and acetate, which are the main precursors in ruminant for glucose and
fat synthesis, respectively, is detrimental. In terms of practical application, it implies that anethole may
not be nutritionally beneficial to dairy cattle, except if it is used in conjunction with another compound.
This observation with ANE is consistent with the results of Bustquet et al. (2006) who reported that
anethole decreased both acetate and propionate. The BCVFA are derived from the ruminal catabolism of
amino acid (Mackie and White, 1990). The reduced concentrations of BCVFA in vessels with all doses of
CSO coincide with the decrease in NH3-N concentration in this study.
5.4.2. Effect of EOs/EOCs on fatty acid metabolism
In this study, as evidence of biohydrogenation of PUFA in the rumen, the profiles of fatty acids of
incubated diet were considerably different from those observed in the digesta. The levels of C14 were not
affected by the addition of substances except ALA (at 200 mg/L) and CSO (at 100, 200 and 300 mg/L)

199
which reduced it at 12 h. Regardless of the substance, the lowest levels of C16:0 was observed in vessels
that received the 300 mg/L of both EOCs and EOs at 12 h. Myristic (C14:0) and palmitic (C16:0) acids
are saturated fatty acids having the capacity to increase the plasma cholesterol levels by suppressing and
saturating low-density lipoprotein (LDL) receptors (Keys et al., 1995). This implies that reduced
concentration of these fatty acids with the inclusion of ALA (at 200 mg/L) and CSO (at 100, 200 and 300
mg/L) would be beneficial in terms of the possibility of reducing the level of plasma cholesterol levels.
The levels of C18:0 (the end-product of the biohydrogenation of C18:1 n-9, C18:3 n-3 and C18:2 n-6)
were reduced in ANO (at 100 mg/L), ALA (at 300 mg/L) and CSO (at 200 mg/L) but not in the
corresponding doses of the other treatments. The significant interaction at 100 mg/L suggests that the low
levels of C18:0 in ANO 100 mg/L could probably be emanating from reduce conversion of C18:1 n-9.
This speculation is due to the corresponding low concentration of C18:1 n-9 in ANO 100 mg/L and the
absent of reduction of C18:0 in the higher levels of ANO (200 and 300 mg/L). Overall, the addition of
ANO reduced the level of C18:1 n-9 relative to the control. The concentration of C18:1 trans 11 at 12 h
was increased with the addition of CSO 300 mg/L and maintained in vessels where 300 mg/L of the rest
of the treatments were added. There seems to be a link in relation to the levels of C18:0, C18:1 n-9 and
C18:1 trans 11 in vessels. There appears to be tendency that the higher the levels of C18:0 the lower
would be the concentration of C18:1 n-9, and low content of C18:0 tended to be accompanied by high
concentrations of C18:1 trans 11. The higher levels of C18:0 and the associated lower concentrations of
C18:1 n-9 would suggest that the high stearic acid might be emanating from the conversion of the oleic
acid during ruminal transformation of fatty acids. It has been observed that about 70% of C18:1 n-9 in
rumen culture was converted to C18:0, and only 30% was transformed to ketostearic acid and
hydroxystearic acid (Jenkins et al., 2006). The lower concentration of C18:0 which corresponds to high
content of C18:1 trans 11 probably implies that the activity of Clostridium proteoclasticum (Kemp et al.,
1975; Maia et al., 2007), renamed (Moon et al., 2008) as Butyrivibrio proteoclasticus, the bacteria which
converts VA to C18:0, was inhibited in those cultures, hence the observed increased levels of C18:1 trans
11. It is important to mention here that evaluation of microbial species composition, which this study
unfortunately did not perform, would have been able to conclusively establish whether there is a
200
relationship between the inhibition of these key biohydrogenation bacteria and the concentration of these
intermediates. These findings are in agreement with results from our preliminary studies (Chapters 3 and
4). As C18:0 is a saturated fatty acid but without any harmful effects on human health (Grundy, 1994;
Pariza, 2004), its high accumulation would not suggest any negative effects provided the levels of PUFA
in the corresponding vessels are higher.
The concentration of C18:2 cis-9 trans 11 CLA was maintained at higher levels with the inclusion of all
substances at all doses. The highest dose (300 mg/L) of all substances recorded the highest level of C18:2
cis-9 trans 11 CLA, relative to the control. The higher levels of C18:2 cis-9 trans 11 CLA were
associated with lower content of C18:1 trans 11. This relationship between C18:2 cis-9 trans 11 CLA and
C18:1 trans 11 is consistent with our previous results (described in Chapters 3 and 4). Results of this
study suggest that inclusion of ALA (at 200 mg/L), ANE and CSO (at 300 mg/L) and ANO (at 100, 200
and 300 mg/L) would increase the level of C18:2 trans 11 CLA and potentially increase its health benefits
(Banni et al., 2001; Corl et al., 2003). Although both ALA 200 mg/L and ANO 200 mg/L increased the
concentration of C18:2 cis-9 trans 11 CLA, the significant interaction indicated that supplementation of
ANO 200 mg/L would result in higher levels of C18:2 cis-9 trans 11 CLA than ALA 200 mg/L.
Similarly, the concentration of C18:2 cis-9 trans 11 CLA in ANO 300 mg/L would potentially be higher
than the levels in ANE and CSO 300 mg/L.
It was observed in this study that increasing the doses of both EOCs and EOs resulted to a proportional
increase in the concentrations of C18:2 n-6 and C18:3 n-3, relative to the control. The highest
concentrations of C18:2 n-6 and C18:3 n-3 which were observed in vessels with the highest dose (300
mg/L) of all substances were in the same range as the observed effects of these substances in our previous
experiments (Chapter 3; Chapter 4). The minimum dose of all the oils required to maintain a higher
concentrations of C18:3 n-3 relative to the control was 200 mg/L .The concentration of C18:3 n-3 at 200
mg/L increased in response to treatments relative to the control in the sequence: 43.2% (ANO 200 mg/L)
> 35.1% (ANE 200 mg/L), 35.1% (ALA 200 mg/L) > 29.7% (CSO 200 mg/L). This significant
interaction indicates that supplementation of ANO 200 mg/L would potentially cause higher
concentration of C18:3 n-3 than the addition of either ALA or ANE 200 mg/L. Comparison between the
201
anethole and anise oil suggest that anise oil and its predominant active compound (anethole) had similar
effects on rumen concentration of C18:3 n-3. This observation is consistent with previous studies where it
is established that anethole is the main compound in anise oil (Davidson and Naidu, 2000). However, the
slightly higher concentration of C18:3 n-3 in ANO 200 mg/L than ANE 200 mg/L suggests that other
minor components of anise oil had insignificant but synergistic effects on ruminal fermentation activities.
The biohydrogenation of C18:3 n-3 which approached 90 g/100 g (87.2 g/100 g) at 24 h was comparable
to the biohydrogenation of C18:3 n-3 in other studies where different protection methods were used such
as in vitro (Beam et al., 2000; Sinclair et al., 2005) and in vivo (Wachira et al., 2000; Scollan et al., 2001,
Wang et al., 2002) studies. The content of C18:2 n-6 and C18:3 n-3 rapidly decreased with time, being
highest at 12 h and lowest at 24 h, in the control, EOCs and EOs. Relative to the control, the average
concentration of C18:2 n-6 and C18:3 n-3 in cultures with the inclusion of 100 mg/L of all substances
were significant but negligible. However, the average effects of treatments at 12 and 24 h indicated that
the biohydrogenation of C18:2 n-6 and C18:3 n-3 were lowest in vessels with ANO 200 followed by
ALA 200 than 200 mg/L of other substances relative to the control. At 24 h, biohydrogenation data
indicated that the disappearance of C18:3 n-3 from ruminal content was reduced as follows: 23.0%,
19.6%, 25.2% and 18.0% for ALA, ANE, ANO and CSO, respectively. At 300 mg/L, the average
protection was approximately 10% higher than that of 200 mg/L. These values are comparable to other
protection techniques described in Chapter 2 such as where about 44.3 g/100 g and 30. 7 g/100 g of C18:3
n -3 were protected from biohydrogenation when whole linseed was pre-treated with NaOH and formic
acid respectively, prior to treatment with formaldehyde. The fact that EOs and EOCs are extracts of plants
which are part of animal diets and their consideration as generally recognized as safe (GRAS) food
additives, offers the use of EOs to reduce ruminal PUFA disappearance advantage over other methods
that use chemicals. However, data from this study disagree with the results from the study of Gunal et al.
(2013) who reported that different doses (125, 250 and 500 mg/L) of six essential oils (citronella,
rosemary, clove, white thyme, sage and Siberian fir needle oils) did not affect the concentration of C18:3
n-3 or C18:2 n-6 in batch culture study. It has been established that the antimicrobial effects and
mechanism of action of EO is determined by the chemical structure of its constituent compounds
202
(Dorman and Deans, 2000), and could be responsible for the observed difference between our results and
those of Gunal et al. (2013).
The extent of disappearance of C20:5 n-3 and C22:6 n-3 in vessels increased as the time of incubation
advanced. After 24 h, the quantity of the content of C20:5 n-3 in vessel which disappeared was highest in
the control (84.3%) and supports previous reports from in vivo studies where the biohydrogenation of
C20:5 n-3 and C22:6 n-3 from fish oil range from 72 to 93 g/100 g TFA (Wachira et al., 2000; Scollan et
al., 2001; Chikunya et al., 2004), and contrast in vitro reports where the biohydrogenation of C20:5 n-3
and C22:6 n-3 was less than 50 g/100 g (Ashes et al., 1992; Sinclair et al., 2005). The concentrations of
C20:5 n-3 and C22:6 n-3 responded proportionally to the dose of both EOs and EOCs, with the highest
levels of C20:5 n-3 and C22:6 n-3 observed in vessels where 300 mg/L of substances were added.
However, at 100 mg/L, the levels of C20:5 n-3 and C22:6 n-3 were insignificant, relative to the control.
The average (12 and 24 h) effects of substances on the concentration of C20:5 n-3 indicated that it was
highest in vessels with all doses of ANO compared with the corresponding doses of all other additive type
and the control. These significant interactions were consistent with the biohydrogenation data and suggest
that supplementation of ANO (at 100, 200 and 300 mg/L) slightly had a higher potency to reduce the
biohydrogenation of C20:5 n-3 and C22:6 n-3 irrespective of dose, than other substances. As mentioned
previously (see section 1.7.8), it is worthy to mention that the biohydrogenation pathways of C20:5 n-3
and C22:6 n-3 are not yet fully established like that of C18:2 n-6 and C18:3 n-3.
The addition of graded doses of EOs and EOCs sequentially increased the concentrations of ∑PUFA and
P/S ratio and progressively decreased the concentrations of ∑n-6/∑n-3 and ∑SFA-C18:0, relative to the
control. At 200 mg/L all doses of all substances had the P/S ratio above the 0.45 recommended in the
guidelines of the Department of Health (1994) except CSO which had 0.41.
It is important to emphasise that the possible reason why the effect of substances used in this study on
fermentation parameters and PUFA concentration or biohydrogenation are not too distinct compared to
the results of the first (Chapter 3) and second (Chapter 4) experiment is that all EOCs and EOs in the
current study are rich in phenolic compounds. This group of compounds have been observed to elicit the
203
highest and the broadest antimicrobial potency. However, the interactions as discussed above suggest that
at a particular dose, different phenolic compounds may elicit a slightly different response. If 200 mg/L is
considered the optimum dose for majority of the substances in this study, it means about 4.8 g/sheep/day
of the substances are required to feed a sheep producing an average of 24 litres of rumen fluid per day.
5.5. Conclusion
Although at 100 mg/L all substances did not affect the concentration of TVFA, effect on gas production,
concentration and biohydrogenation of PUFA was significant but marginal, relative to the control. At 200
mg/L all substances substantially maintained higher concentrations of PUFA, CLA; and ANE, ALA and
ANO only marginally reduced TVFA (by about 2%) relative to the control, but CSO reduced TVFA by
10%. At 300 mg/L the addition of all substances almost tripled the concentration of residual PUFA
observed in cultures but this was accompanied by over 12% inhibition of the concentration of TVFA.
Therefore, considering the effects of the tested EOs and EOCs and at different doses in this study, it
appears that whilst administration of ALA, ANE and ANO at 200 mg/L seems to maintain higher PUFA
levels and minimal disruption to VFA concentration in vitro, CSO requires a dose less than 200 mg/L to
attain the same balance. However, the significant interactions at 200 mg/L with respect to CLA and
PUFA concentration and biohydrogenation suggests that supplementing ANO (at 200 mg/L) is potentially
more effective than the other three in both preventing PUFA disappearance and maintenance of optimal
VFA concentration. It is worthwhile to investigate whether these effects also occur in vivo including
testing the possibility of microbial adaptation to these substances. Therefore, the next study (Chapter 6)
investigates the possibility of rumen adaptation to 100 mg/L of ANO for four weeks.

204
205
CHAPTER 6
Effects of four weeks of rumen adaptation to anise oil on
biohydrogenation of n-3 polyunsaturated fatty acids
206
Abstract
This study evaluates effect of four weeks of microbial adaptation to anise oil (ANO) on the fermentation
activities of ruminal micro-organisms and the biohydrogenation of n-3 polyunsaturated fatty acids
(PUFA). In this experiment, six Hartline Texel cross lambs were used. Three of the lambs were
randomly assigned to the basal diet (basal diet group, BDG) and the remaining three lambs were offered
basal diet with ANO (anise oil group, AOG) for four weeks. The rumen fluid donor sheep were offered
water and hay ad libitum and supplemented with additional 400 g/sheep/day of concentrate plus 2.4
g/sheep/day of ANO (for the AOG). The ANO was thoroughly mixed with the concentrate prior to
feeding. The total amount (400 g) of lamb finisher cubes offered per sheep/day was divided into two
equal parts (200 g) and fed at 08.00 hours and 16.00 hours. After the four weeks adaptation period, lambs
were slaughtered and ruminal fluid was collected from each of the lambs on BDG and on AOG and used
in a 48 h in vitro batch culture system to study the fermentation of a 70: 30 grass hay (Lolium perenne)
and concentrate (lamb finisher) diet . The study was a 2 (batches of rumen fluid: BDG and AOG) 2
(doses of ANO: 0 and 200 mg/L) factorial design experiment. Total volatile fatty acid (TVFA) in RF
extracted from lambs on the BDG (242.0 mM) was similar to that in the AOG (242.2 mM).
Concentrations of TVFA in in vitro digests were similar between groups on the BDG (68.6 mM) and on
the AOG (66.4 mM), but differed between levels of anise oil (0 versus 200 mg/L). The levels of NH3-N
were not different (P<0.05) between the RF collected from AOG and BDG. However, in vitro results
showed that AOG 200 mg/L induced a 20% decrease on the concentration of NH3-N in fermentation
vessels, relative to BDG 0 mg/L. The in vitro digesta incubated in RF from the AOG (i.e. AOG 200
mg/L) maintained higher concentrations of PUFA (C18:2 n-6 and n-3 PUFA), trans vaccenic acid and
lower concentration of stearic acid.This suggest that there was no rumen adaptation within the period of
trial. These results indicate that anise oil is potentially a useful feed additive to optimise the fatty acid
composition of ruminant food products, if these effects are repeated in meat and milk.
207
6.1. Introduction
In the preceding experiments (Chapters 3, 4 and 5), it has been established that certain EOCs (e.g.
anethole and 4-allylanisole) and whole EOs (e.g. anise oil) when added at 200 mg/L can significantly
suppress biohydrogenation of PUFA without detrimental effects to fermentation and VFA concentrations.
However, it is not clear whether these effects are sustained in the medium and long term. Available
evidence from continuous culture studies and long term in vivo trials suggest that the benefits associated
with the use of essential oil as feed additives may decline due to two possibilities: (1) adaptation of
individual microbial species to the use of EOs or, (2) shifts in microbial populations following long-term
use of essential oil (Gladine et al., 2007). In addition, only few studies have been conducted in vivo to
investigate the possibility of microbial adaptation to essential oils in the rumen as a measure of their
potential effectiveness as feed additives. Previous studies with the use of specific blend of essential oil
(BEO) compounds consisting mainly of limonene, guaiacol and thymol observed that ruminal N
metabolism was modified by supplementing with BEO (Mclntosh et al., 2003; Molero et al., 2004;
Newbold et al., 2004). About four weeks period of microbial adaptation was suggested as the minimum
time required to modify N metabolism in the rumen by some of these studies (Wallace et al., 2003;
Molero et al., 2004; Castillejos et al., 2007). However, to date, there is no similar report about the
adaptation period of microbes to EOs and their corresponding effects on fatty acid metabolism in the
rumen. The aim of the present study was to examine effects of four weeks period of microbial adaptation
to anise oil on metabolism of PUFA and biohydrogenation end-product. Anise oil (200 mg/L) was
identified as the most effective substance to both prevent PUFA disappearance and maintain optimal VFA
concentration in the preceding Chapter (Chapter 5; Eburu and Chikunya (2015b)).
208
6.2.0. Materials and methods
6.2.1. Animal management and collection of rumen fluid/sampling
In this experiment, six Hartline Texel cross lambs (mean weight 42.0 ±2.5kg) were used as rumen fluid
donors. Details of animal housing, experimental diets and feeding are as described in section 2.1 of
general material and methods. Briefly, the rumen fluid donor lambs were offered water and hay ad
libitum and supplemented with additional 400 g/sheep/day of concentrate. The total amount (400 g) of
lamb finisher cubes offered per sheep/day was divided into two equal parts (200 g) and fed at 08.00 hours
and 16.00 hours. Three lambs were randomly assigned to the basal diet (basal diet group, BDG) and the
remaining three lambs were fed basal diet with ANO (2.4 g/sheep/day ANO, AOG) for four weeks. The
2.4 g/day/sheep of anise oil was thoroughly mixed with the lamb finisher cubes prior to feeding. The dose
(2.4 g/sheep/day) was estimated based on an estimated rumen volume of about 10 litres (as rumen volume
equals body weight, Owens and Goetsch, 1988) and a dilution rate of about 100 mg/h. The total amount
of fluid estimated to flow through the rumen per 24 h/day was 24 litres which equals about 100 mg/L (a
dose which was observed to maintain the level of TVFA similar to the control in the previous experiment)
(Chapter 5; Eburu and Chikunya, 2015b). See section 2.1 of the general materials and methods for the
collection of rumen fluid and preparation for in vitro incubation.
6.2.2. Basal feedstock, treatments and in vitro incubation
The basal feedstock for in vitro incubation was mixtures of good quality rye-grass hay (Lolium perenne),
lamb finisher concentrate, whole ground linseed and fish oil. Details of the basal feedstock used in this in
vitro incubation are as described in the general material and methods (see section 2.3). The ingredients,
chemical and fatty acid composition of the diet are shown in Table 2.2.
The effect of anise oil was evaluated using the in vitro gas production batch culture method described by
Theodorou et al. (1994). Anise oil was purchased from Sigma-Aldrich Co. Ltd., UK and was stored at the
required temperatures specified on delivery notes prior to use. See Tables 4.1 and 4.2 for a description of
the ANO used in this study.
The effect of four weeks adaptation of rumen microbes to ANO was examined in vitro, using rumen fluid
extracted from both basal diet group (BDG) and anise oil group (AOG) in a 2 (batches of rumen fluid:
209
BDG and AOG) 2 (doses of ANO: 0 and 200 mg/L) factorial design experiment with six replicates as
follows: (1) fluid from BDG plus 0 mg/l of anise (BDG 0 mg/l); (2) fluid from BDG plus a single dose of
200 mg/l of anise oil (BDG 200 mg/l); (3) fluid from AOG plus 0 mg/l of anise oil (AOG 0 mg/l); and (4)
fluid from AOG plus a single dose of 200 mg/l of anise (AOG 200 mg/l).
In total 100 serum bottles were incubated, each bottle contained 1 g of feed substrate, 200 or 0 mg/l of
anise oil, 80 ml anaerobic buffer (see Table 2.1) and 20 ml inoculum and the bottle sealed with rubber
cork before incubation.
6.2.3. Sample collection and preservation
Cumulative gas pressure measurements, incubation stopping times, collection and storage of samples in
this study were as described in the general material and methods (see section 2.4).
6.2.4 Chemical analysis
The concentration of NH3-N in digesta was analysed using the phenol-hypochlorite method
(Weatherburn, 1967; Broderick and Kang, 1980) adopted for use on the plate reader as described in
general materials and methods (see section 2.5.4).
The concentration of volatile fatty acid (VFA) was determined by Gas chromatography (GC) as described
by Ottenstein and Bartley (1971). Detail of this method in general materials and methods (see section
2.5.6).
The concentration of fatty acids in feed and freeze dried samples were extracted by direct saponification
method described by Enser et al. (1998). See section 2.5.7 of the general materials and methods for detail.
6.2.5. Experimental design and statistical analysis
The study (RCBD) was a 2 (batches of rumen fluid: BDG and AOG) 2 (doses of ANO: 0 and 200
mg/L) factorial design experiment. Therefore data were analysed by TWO-WAY analysis of variance
(ANOVA) with batches of rumen fluid and dose of anise as the main effects using GenStat 16th edition.
Differences between treatments were declared by least significance difference (LSD) and significance
was declared at P< 0.05. Data were analysed separately for each time point (12, 24 and 48 h).
210
6.3. Results
6.3.1. Fermentation parameters
The effects of four weeks of microbial adaptation to anise oil on animal performance and concentrations
of total volatile fatty acids (TVFA, mM), molar proportion of individual VFA (mM/mol TVFA) and NH3-
N (mM) in vivo are shown in Table 6.1. The dry matter intake was significantly higher in sheep that
received anise oil compared to the control. Mean values were 18.5 and 18.9 kg/week (SEM= 0.05,
P<0.05, Table 6.1), for the control and the anise oil group of sheep, respectively. The initial and final
body weight gain were not different (P=0.05) between the two groups of lambs (Table 6.1).
The concentrations of NH3-N, TVFA and molar proportions of individual VFA were not affected by
treatments. However, the acetate to propionate ratio was lower in the AOG than the BDG. Mean values
were 3.4 and 3.1 (SEM= 0.008, P=0.05, Table 6.1), for the BDG and the AOG, respectively.
The effects of treatments on cumulative gas production (ml/g OM), NH3-N (mM), TVFA (mM) and
molar proportion of individual VFA (mM/mol TVFA) in vitro are presented in Table 6.2.
In this experiment the fluid adapted with anise oil (AOG) and the unadapted fluid (BDG) maintained
similar levels of total gas production. The total amounts of gas in vessels were maintained in a dose-
response pattern, such that the higher dose of anise oil (200 mg/L), irrespective of source of innoculum,
produced lower total gas relative to the control (BDG 0). Mean values were 96.2, 87.2, 96.0 and 90.4 ml/g
OM (12 h, sed=, 3.08, P<0.028); 133.2, 121.6, 131.5 and 123.7 ml/g OM (24 h, sed= 2.93, P<0.004); and
for 48 h were 164.8, 144.3, 159.4 and 145.4 ml/g OM (sed= 2.88, P<0.001, Table 6.2), for BDG 0, BDG
200, AOG 0 and AOG 200, respectively.
The concentration of NH3-N in the fermentation vessels at all time points was not significantly different
between the BDG and AOG. At 12 and 48 h, the vessel concentration of NH3-N was not affected by dose
of anise. However, at 24 h, the concentration of NH3-N in vessels was maintained in a dose-response
pattern, with the higher dose of anise oil (200 mg/L), regardless of fluid, containing lower ammonia
relative to BDG 0 (Table 6.2). Mean values were 5.0, 4.7, 5.3 and 4.0 mM (sed= 0.29, P<0.017), for BDG
0, BDG 200, AOG 0 and AOG 200, respectively. This indicates that AOG 200 mg/L caused a 20%
reduction on the ruminal concentration of ammonia.
211
At 24 and 48 h, the fermentation vessel concentration of TVFA was similar between BDG and AOG
(Table 6.2). There was a dose dependent response effect on the levels of TVFA at 48 h but not at 24 h. At
48 h, irrespective of fluid type, the higher dose of anise (200 mg/L) reduced (P<0.001) the concentration
of TVFA relative to the control (mean inhibition 8%). Mean values were 24 h (48 h in brackets) 70.2
(81.5), 67.0 (74.6), 67.3 (80.0) and 65.5 (75.0) mM for BDG 0, BDG 200, AOG 0 and AOG 200,
respectively.
The molar proportion of acetate was significantly higher (P<0.001) in cultures with the AOG than the
BDG. Mean values (average of doses within a fluid type) were 24 h (48 h in brackets) 61.3 (61.1) and
63.2 (62.6) mM/mol TVFA for the BDG and AOG, respectively. Although there was no observed
difference between doses of anise on the proportion of acetate at 24 h, levels were different at 48 h, such
that the 200 mg/L of both BDG and AOG maintained higher levels of acetate than the 0 mg/L.
The proportion of propionate was significantly lower (P<0.001) in cultures with the AOG compared to
the BDG. Mean values (mean of doses within a fluid type) for 24 h were 20.0 and 18.1 and for 48 h were
20.2 and 18.7 mM/mol TVFA (Table 6.2), for the BDG and AOG, respectively. The proportion of
propionate was not affected by the dose of anise (irrespective of fluid type) at 24 h, but levels were
different at 48 h, with the 200 mg/L causing the higher reduction in propionate compared to the lower
dose (0 mg/L).
The molar proportion of butyrate was not affected by treatment except at 24 h where the AOG reduced
(P<0.001) it compared to the BDG (mean values 8.5 and 8.0 mM/mol TVFA for the BDG and AOG,
respectively). The acetate to propionate ratios were maintained at higher levels in the AOG relative to the
BDG at both 24 and 48 h.
Treatment effects caused minor changes to the concentrations of branched chain volatile fatty acids
(BCVFA) such as isovaleric, valeric and isobutyric acids (Table 6.2).
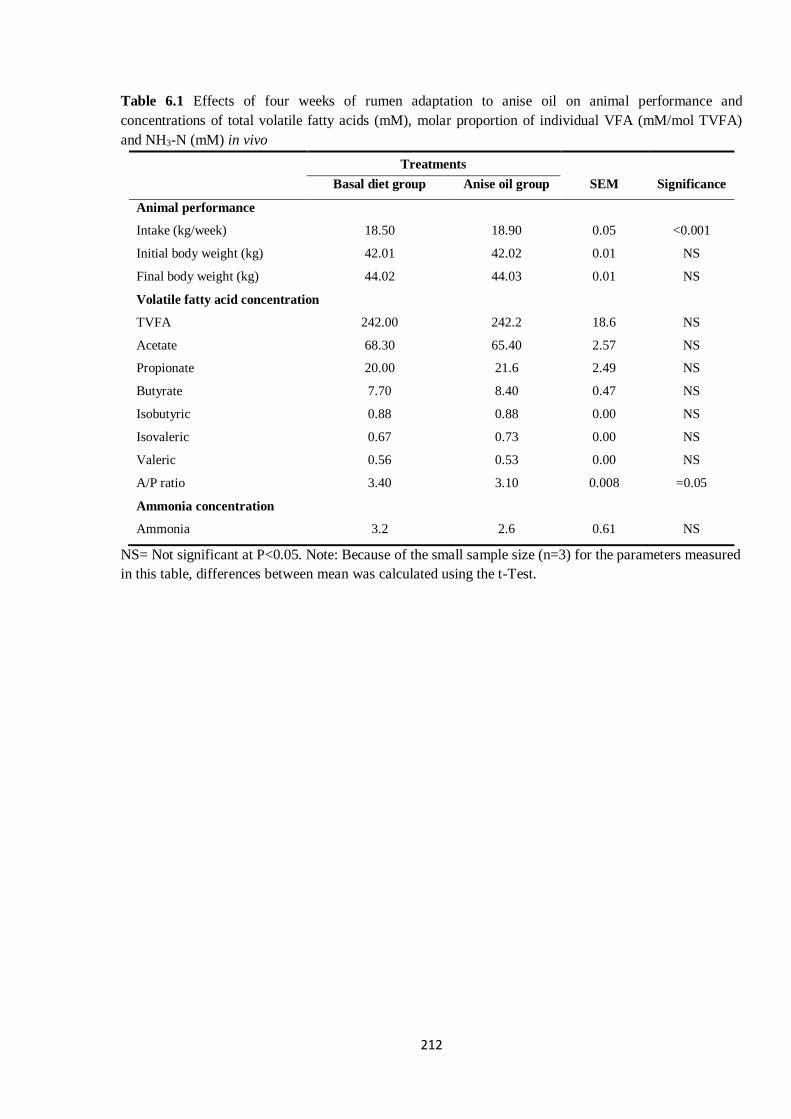
212
Table 6.1 Effects of four weeks of rumen adaptation to anise oil on animal performance and
concentrations of total volatile fatty acids (mM), molar proportion of individual VFA (mM/mol TVFA)
and NH3-N (mM) in vivo
Treatments
Basal diet group Anise oil group SEM Significance
Animal performance
Intake (kg/week) 18.50 18.90 0.05 <0.001
Initial body weight (kg) 42.01 42.02 0.01 NS
Final body weight (kg) 44.02 44.03 0.01 NS
Volatile fatty acid concentration
TVFA 242.00 242.2 18.6 NS
Acetate 68.30 65.40 2.57 NS
Propionate 20.00 21.6 2.49 NS
Butyrate 7.70 8.40 0.47 NS
Isobutyric 0.88 0.88 0.00 NS
Isovaleric 0.67 0.73 0.00 NS
Valeric 0.56 0.53 0.00 NS
A/P ratio 3.40 3.10 0.008 =0.05
Ammonia concentration
Ammonia 3.2 2.6 0.61 NS
NS= Not significant at P<0.05. Note: Because of the small sample size (n=3) for the parameters measured
in this table, differences between mean was calculated using the t-Test.
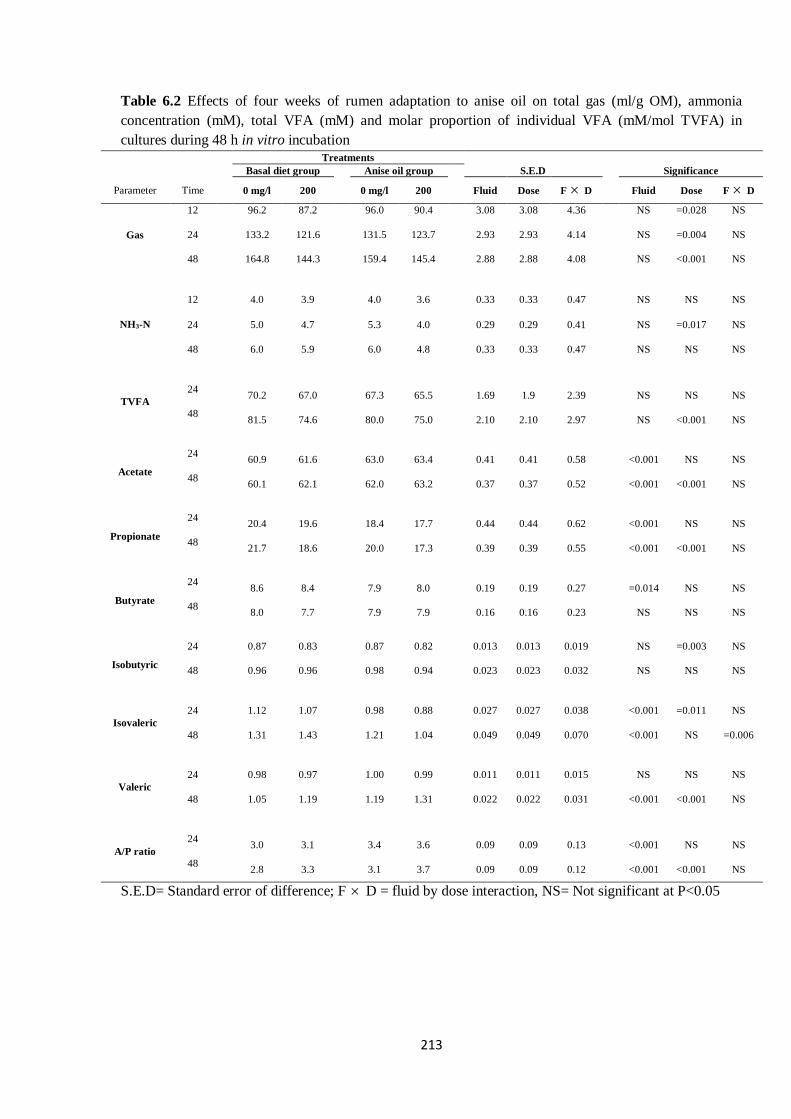
213
Table 6.2 Effects of four weeks of rumen adaptation to anise oil on total gas (ml/g OM), ammonia
concentration (mM), total VFA (mM) and molar proportion of individual VFA (mM/mol TVFA) in
cultures during 48 h in vitro incubation Treatments
Basal diet group
Anise oil group
S.E.D
Significance
Parameter Time 0 mg/l 200 0 mg/l 200 Fluid Dose F D Fluid Dose F D
Gas
12 96.2 87.2 96.0 90.4 3.08 3.08 4.36 NS =0.028 NS
24 133.2 121.6 131.5 123.7 2.93 2.93 4.14 NS =0.004 NS
48 164.8 144.3 159.4 145.4 2.88 2.88 4.08 NS <0.001 NS
NH3-N
12 4.0 3.9 4.0 3.6 0.33 0.33 0.47 NS NS NS
24 5.0 4.7 5.3 4.0 0.29 0.29 0.41 NS =0.017 NS
48 6.0 5.9 6.0 4.8 0.33 0.33 0.47 NS NS NS
TVFA
24 70.2 67.0
67.3 65.5
1.69 1.9 2.39
NS NS NS
48 81.5 74.6
80.0 75.0
2.10 2.10 2.97
NS <0.001 NS
Acetate
24 60.9 61.6
63.0 63.4
0.41 0.41 0.58
<0.001 NS NS
48 60.1 62.1
62.0 63.2
0.37 0.37 0.52
<0.001 <0.001 NS
Propionate
24 20.4 19.6
18.4 17.7
0.44 0.44 0.62
<0.001 NS NS
48 21.7 18.6
20.0 17.3
0.39 0.39 0.55
<0.001 <0.001 NS
Butyrate
24 8.6 8.4
7.9 8.0
0.19 0.19 0.27
=0.014 NS NS
48 8.0 7.7
7.9 7.9
0.16 0.16 0.23
NS NS NS
Isobutyric
24 0.87 0.83 0.87 0.82 0.013 0.013 0.019 NS =0.003 NS
48 0.96 0.96 0.98 0.94 0.023 0.023 0.032 NS NS NS
Isovaleric
24 1.12 1.07 0.98 0.88 0.027 0.027 0.038 <0.001 =0.011 NS
48 1.31 1.43 1.21 1.04 0.049 0.049 0.070 <0.001 NS =0.006
Valeric
24 0.98 0.97 1.00 0.99 0.011 0.011 0.015 NS NS NS
48 1.05 1.19 1.19 1.31 0.022 0.022 0.031 <0.001 <0.001 NS
A/P ratio
24 3.0 3.1
3.4 3.6
0.09 0.09 0.13
<0.001 NS NS
48 2.8 3.3
3.1 3.7
0.09 0.09 0.12
<0.001 <0.001 NS
S.E.D= Standard error of difference; F D = fluid by dose interaction, NS= Not significant at P<0.05
214
6.3.2. Effect of EOC on fatty acid metabolism
The effects of treatments on the concentration of selected fatty acids (g/100 g TFA) are presented in Table
6.3.
The levels of C14:0 were not affected by treatments (Table 6.3). The g/100 g concentration of C16:0 was
not different between the BDG and AOG, but the 200 mg/L of anise (regardless of fluid) reduced the
levels of C16:0 relative to the control at both 12 and 48 h time points. Mean values were 12 h (48 h in
brackets) 15.0 (17.0), 14.0 (15.0), 15.0 (16.0) and 14.0 (15.0) g/100 g TFA for BDG 0, BDG 200, AOG 0
and AOG 200, respectively.
The level of C16:1 in the AOG at 12 h was higher (P<0.001) than the BDG. Mean values were 7.1 and
7.6 g/100 g TFA (sed= 0.02, P<0.001, Table 6.3), for the BDG and AOG, respectively. At the dose level,
there was no difference (P<0.05), irrespective of fluid, between the levels of anise added. There was a
significant interaction which indicates that addition of 0 and 200 mg/L of anise to the fluid adapted with
anise oil (i.e. AOG 0 mg/L and AOG 200 mg/L) significantly increased the concentration of C16:1
compared with the respective 0 and 200 mg/L of the unadapted fluid (BDG) at 12 h. Mean values were
3.5, 3.6, 3.8 and 3.8 g/100 g TFA (sed= 0.03, P<0.016, Table 6.3), for BDG 0, BDG 200, AOG 0 and
AOG 200, respectively.
The concentrations of C18:0 were reduced (P<0.001) in cultures with the AOG relative to the BDG
(Table 6.3). Mean values were 14.2 and 11.2 g/100 g TFA (12 h, sed= 0.15, P<0.001), 15.5 and 11.9
g/100 g TFA (24 h, sed= 0.21, P<0.001) and for 48 h were 16.8 and 12.9 g/100 g TFA (sed= 0.45,
P<0.001), for BDG and AOG, respectively. The 200 mg/L regardless of the type of fluid (BDG or AOG)
maintained higher levels of C18:0 than the 0 mg/L of all fluids.
The concentrations of C18:1 n-9 in cultures were not different (P<0.05) between the BDG and AOG
(Table 6.3). At the dose level, the 200 mg/L of all fluid type maintained higher levels of C18:1 n-9 than
the 0 mg/L. Mean values were 7.9, 8.0, 7.7 and 8.2 (12 h); 6.3, 7.3, 6.1 and 7.8 (24 h) and for 48 h were
4.5, 5.6, 3.1 and 5.4 g/100 g TFA for BDG 0, BDG 200, AOG 0 and AOG 200, respectively.
215
The concentrations of C18:1 trans 11 at 12 and 24 h were significantly higher in cultures with the AOG
than the BDG. Mean values were 3.6 and 3.8 (12 h, sed= 0.02, P<0.001, Table 6.3) and 24 h were 2.9 and
3.4 g/100 g TFA (sed=0.05, P<0.001, Table 6.3), for the BDG and AOG, respectively. There was no
difference in the dose of anise oil at all time points except at 48 h where the AOG 200 mg/L had higher
level of 18:1 trans 11 than the rest of the treatments. Average values were 1.4, 1.4, 1.4 and 1.6 g/100 g
TFA BDG 0, BDG 200, AOG 0 and AOG 200, respectively.
The concentrations of C18:2 cis-9 trans 11CLA in cultures with BDG and AOG were similar (Table 6.3).
The addition of different doses of anise oil (0 and 200 mg/L) had no effect on the levels of C18:2 trans
11CLA at all time of incubation except at 12 h, where the levels of C18:2 trans 11CLA in cultures were
maintained in a linear pattern (dose-response). Mean values were 0.25, 0.26, 0.27 and 0.28 g/100 g TFA
BDG 0, BDG 200, AOG 0 and AOG 200, respectively.
At both 12 and 24 h period, the unadapted fluid (BDG) and adapted fluid (AOG) maintained a similar
level of C18:2 n-6 and C18:3 n-3 (Table 6.3). In contrast, the concentrations of C18:2 n-6 and C18:3 n-3
at 48 h were higher in vessels with AOG relative to BDG. Mean values were 5.1 and 6.8 (C18:2 n-6,
sed=0.44, P<0.049) and for C18:3 n-3 were 5.7 and 7.5 g/100 g TFA (sed=0.36, P<0.022), for BDG and
AOG, respectively. The 200 mg/L of all fluids maintained higher levels of C18:2 n-6 and C18:3 n-3
compared to the control. There was a significant interaction at 24 h time point, which showed that the
concentrations of C18:2 n-6 and C18:3 n-3 in vessels where AOG 200 were added were higher than their
corresponding values in BDG 200 (Table 6.3). Mean values were 2.7, 4.1, 2.6 and 4.9 g/100 g TFA (18:2
n-6, sed= 0.29, P<0.035) and for C18:3 n-3 were 3.4, 5.7, 3.3 and 7.0 g/100 g TFA (sed= 0.45, P<0.031),
for BDG 0, BDG 200, AOG 0 and AOG 200, respectively.
At 12 h the concentration of C20:4 n-6 was higher (P<0.025) in cultures with the AOG compared to the
BDG (Table 6.3). By contrast, the levels of C20:4 n-6 at 24 and 48 h were lower in vessels with AOG
than BDG. Mean values were 1.0 and 1.1 (12 h), 1.2 and 1.0 (24 h) and 48 h were 1.2 (1.0) g/100 g TFA
for BDG 0, BDG 200, AOG 0 and AOG 200 mg/L, respectively.
216
At 12 and 24 h time points, fluid from sheep adapted with anise oil maintained higher levels of C20:5 n-3
and C22:6 n-3 than the unadapted fluid (Table 6.3). Mean values were 12 h (24 h in brackets) 6.6 (4.0)
and 7.0 (5.4) for C20:5 n-3 and for C22:6 n-3 were 5.0 (4.0) and 5.3 (4.6) g/100 g TFA for BDG and
AOG, respectively. All treatments maintained a dose related effect on the levels of C20:5 n-3 and C22:6
n-3, such that the 200 mg/L of anise (the higher dose) contained higher amounts of these fatty acids
compared to the control. Except at 48 h, there were no significant interactions between fluid and dose of
anise. The concentration of C22:6 n-6 at 48 h was maintained higher (P<0.049) in cultures where AOG
200 mg/L was added than other treatments. Mean values were 1.9, 1.7, 1.8 and 2.1 g/100 g TFA
(sed=0.18, P<0.049, Table 6.3), for BDG 0, BDG 200, AOG 0 and AOG 200 mg/L, respectively.
The content of ∑SFA was consistently lower in AOG compared to BDG at all time points (12, 24 and 48
h). Mean values were 52.9 and 50.8 (12 h), 56.8 and 52.8 (24 h) and for 48 h were 59.0 and 54.9 g/100 g
TFA (Table 6.4), for BDG and AOG, respectively. Effects of treatments on levels of total SFA was not
dependent on the dose of anise but levels are generally lower in the adapted fuid.
At 12 h, the fermentation vessel concentration of ∑MUFA was higher in the AOG than in vessels with
BDG (Table 6.4). Mean values were 26.6 and 27.3 g/100 g TFA (sed= 0.06, P<0.001, Table 6.4), for
BDG and AOG, respectively. There was significant interaction at 12 h period of incubation, which
showed that supplementing cultures with AOG 200 mg/L contained higher concentration of ∑MUFA
compared to the addition of BDG 200 mg/L. Mean values were 13.3, 13.3, 13.4 and 13.9 g/100 g TFA
(sed= 0.08, P<0.006, Table 6.4), for BDG 0, BDG 200, AOG 0 and AOG 200 mg/L, respectively.
However, at 24 and 48 h, the concentration of ∑MUFA in vessels was similar in the two fluids. The
levels of ∑MUFA in cultures were maintained in a dose response pattern, with the higher dose of anise oil
(200 mg/L) containing higher ∑MUFA than 0 mg/L.
The vessel contents of ∑PUFA were higher in the AOG than the BDG at 12 h. Mean values were 41.3
and 42.5 g/100 g TFA (sed= 0.17, P<0.002, Table 6.4), for BDG and AOG, respectively. However, at 24
and 48 h, the concentrations of ∑PUFA in vessels were similar between the two fluids. The levels of
∑PUFA in cultures increased as the dose of anise increased. Except at 24 h, there were no significant
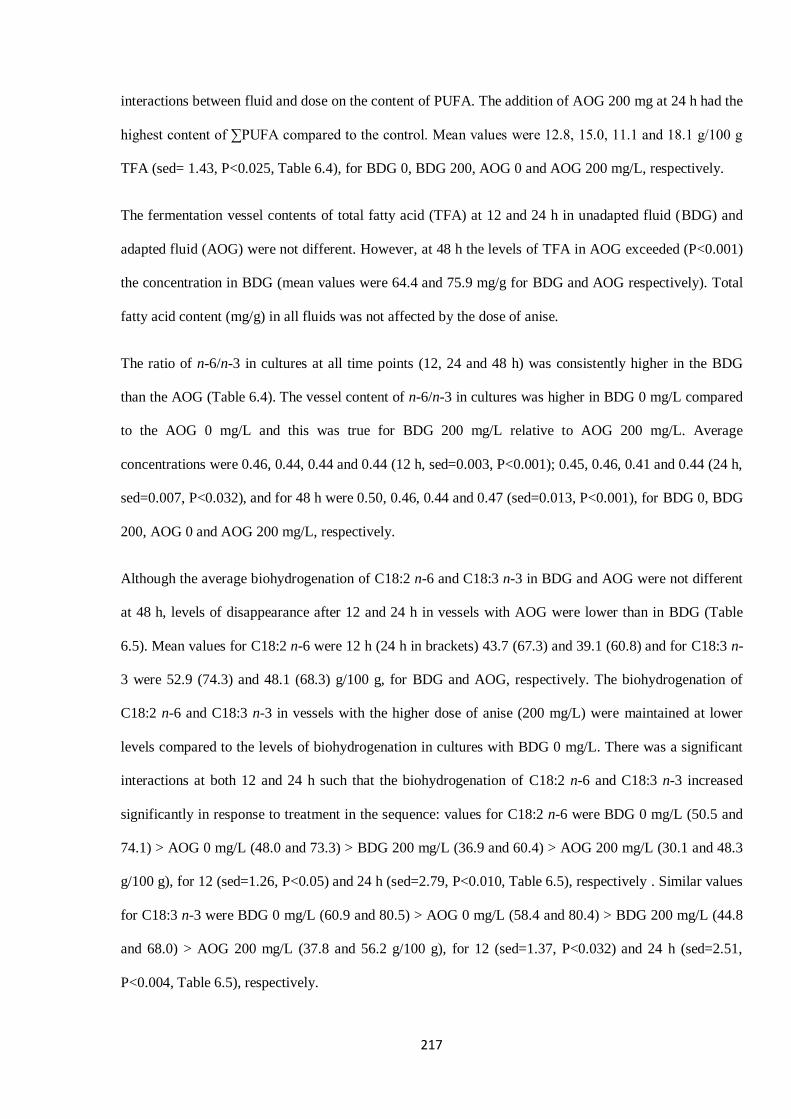
217
interactions between fluid and dose on the content of PUFA. The addition of AOG 200 mg at 24 h had the
highest content of ∑PUFA compared to the control. Mean values were 12.8, 15.0, 11.1 and 18.1 g/100 g
TFA (sed= 1.43, P<0.025, Table 6.4), for BDG 0, BDG 200, AOG 0 and AOG 200 mg/L, respectively.
The fermentation vessel contents of total fatty acid (TFA) at 12 and 24 h in unadapted fluid (BDG) and
adapted fluid (AOG) were not different. However, at 48 h the levels of TFA in AOG exceeded (P<0.001)
the concentration in BDG (mean values were 64.4 and 75.9 mg/g for BDG and AOG respectively). Total
fatty acid content (mg/g) in all fluids was not affected by the dose of anise.
The ratio of n-6/n-3 in cultures at all time points (12, 24 and 48 h) was consistently higher in the BDG
than the AOG (Table 6.4). The vessel content of n-6/n-3 in cultures was higher in BDG 0 mg/L compared
to the AOG 0 mg/L and this was true for BDG 200 mg/L relative to AOG 200 mg/L. Average
concentrations were 0.46, 0.44, 0.44 and 0.44 (12 h, sed=0.003, P<0.001); 0.45, 0.46, 0.41 and 0.44 (24 h,
sed=0.007, P<0.032), and for 48 h were 0.50, 0.46, 0.44 and 0.47 (sed=0.013, P<0.001), for BDG 0, BDG
200, AOG 0 and AOG 200 mg/L, respectively.
Although the average biohydrogenation of C18:2 n-6 and C18:3 n-3 in BDG and AOG were not different
at 48 h, levels of disappearance after 12 and 24 h in vessels with AOG were lower than in BDG (Table
6.5). Mean values for C18:2 n-6 were 12 h (24 h in brackets) 43.7 (67.3) and 39.1 (60.8) and for C18:3 n-
3 were 52.9 (74.3) and 48.1 (68.3) g/100 g, for BDG and AOG, respectively. The biohydrogenation of
C18:2 n-6 and C18:3 n-3 in vessels with the higher dose of anise (200 mg/L) were maintained at lower
levels compared to the levels of biohydrogenation in cultures with BDG 0 mg/L. There was a significant
interactions at both 12 and 24 h such that the biohydrogenation of C18:2 n-6 and C18:3 n-3 increased
significantly in response to treatment in the sequence: values for C18:2 n-6 were BDG 0 mg/L (50.5 and
74.1) > AOG 0 mg/L (48.0 and 73.3) > BDG 200 mg/L (36.9 and 60.4) > AOG 200 mg/L (30.1 and 48.3
g/100 g), for 12 (sed=1.26, P<0.05) and 24 h (sed=2.79, P<0.010, Table 6.5), respectively . Similar values
for C18:3 n-3 were BDG 0 mg/L (60.9 and 80.5) > AOG 0 mg/L (58.4 and 80.4) > BDG 200 mg/L (44.8
and 68.0) > AOG 200 mg/L (37.8 and 56.2 g/100 g), for 12 (sed=1.37, P<0.032) and 24 h (sed=2.51,
P<0.004, Table 6.5), respectively.
218
At 12 and 24 h, the mean biohydrogenation (mean across all doses within a fluid type) of 20:5 n-3 and
22:6 n-3 were lower in AOG relative to levels in BDG (Table 6.5). Mean values for 20:5 n-3 were 12 h
(24 h in brackets) 27.4 (57.1) and 18.1 (37.2) and for 22:6 n-3 were 16.5 (34.4) and 5.9 (17.1) g/100 g for
BDG and AOG, respectively. The biohydrogenation of 20:5 n-3 and 22:6 n-3 decreased as the dose of
anise oil increased in fermentation vessels, such that the highest dose (200 mg/L) of all fluids maintained
lower levels of disappearance compared to the control. Mean values for 20:5 n-3 were 31.8, 23.0, 24.7
and 11.5 g/100 g (12 h, sed=0.90, P<0.001); and 65.8, 48.4, 48.7, 25.7 g/100 g (24 h, sed= 3.22, P<0.001,
Table 6.5), for BDG 0, BDG 200, AOG 0 and AOG 200 mg/L, respectively. The corresponding means for
22:6 n-3 were 19.7, 13.2, 7.9 and 3.9 g/100 g (12 h, sed= 1.46, P<0.002); and 41.2, 27.6, 22.8 and 11.4
g/100 g (24 h, sed= 2.68, P<0.001, Table 6.5), for BDG 0, BDG 200, AOG 0 and AOG 200 mg/L,
respectively.
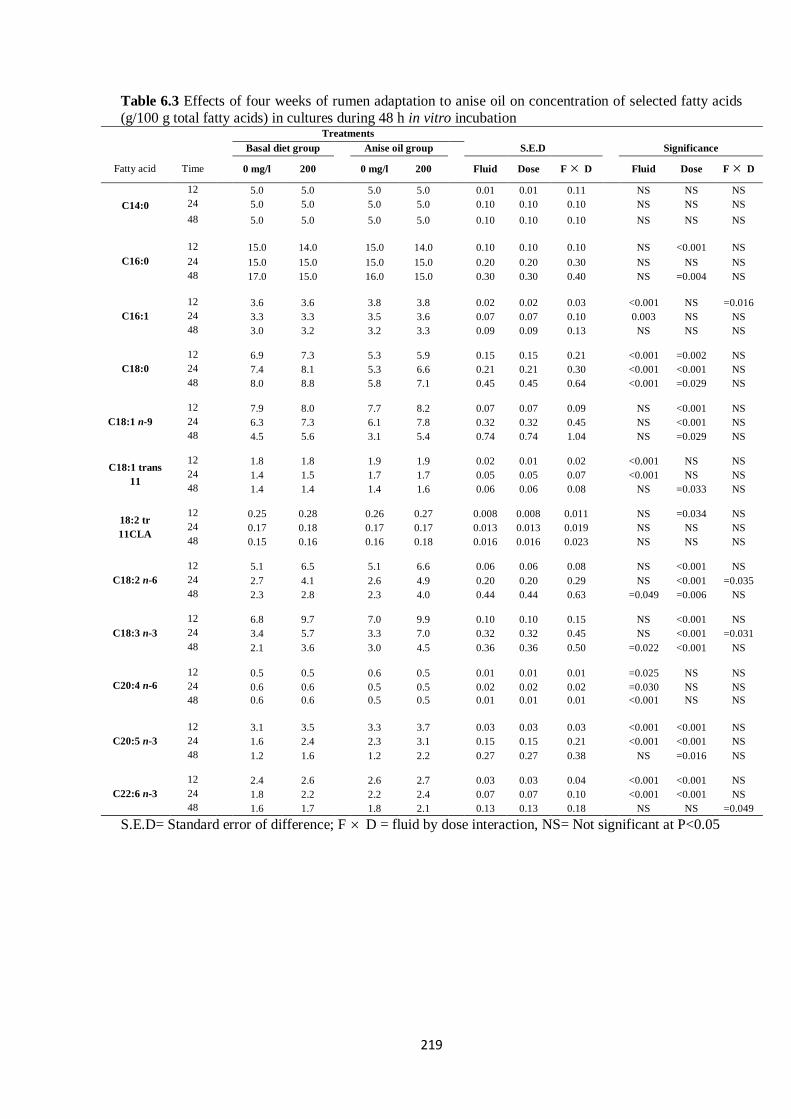
219
Table 6.3 Effects of four weeks of rumen adaptation to anise oil on concentration of selected fatty acids
(g/100 g total fatty acids) in cultures during 48 h in vitro incubation Treatments
Basal diet group
Anise oil group
S.E.D
Significance
Fatty acid Time 0 mg/l 200 0 mg/l 200 Fluid Dose F D Fluid Dose F D
C14:0
12 5.0 5.0 5.0 5.0 0.01 0.01 0.11 NS NS NS
24 5.0 5.0 5.0 5.0 0.10 0.10 0.10 NS NS NS
48 5.0 5.0 5.0 5.0 0.10 0.10 0.10 NS NS NS
C16:0
12 15.0 14.0 15.0 14.0 0.10 0.10 0.10 NS <0.001 NS
24 15.0 15.0 15.0 15.0 0.20 0.20 0.30 NS NS NS
48 17.0 15.0 16.0 15.0 0.30 0.30 0.40 NS =0.004 NS
C16:1
12 3.6 3.6 3.8 3.8 0.02 0.02 0.03 <0.001 NS =0.016
24 3.3 3.3 3.5 3.6 0.07 0.07 0.10 0.003 NS NS
48 3.0 3.2 3.2 3.3 0.09 0.09 0.13 NS NS NS
C18:0
12 6.9 7.3 5.3 5.9 0.15 0.15 0.21 <0.001 =0.002 NS
24 7.4 8.1 5.3 6.6 0.21 0.21 0.30 <0.001 <0.001 NS
48 8.0 8.8 5.8 7.1 0.45 0.45 0.64 <0.001 =0.029 NS
C18:1 n-9
12 7.9 8.0 7.7 8.2 0.07 0.07 0.09 NS <0.001 NS
24 6.3 7.3 6.1 7.8 0.32 0.32 0.45 NS <0.001 NS
48 4.5 5.6 3.1 5.4 0.74 0.74 1.04 NS =0.029 NS
C18:1 trans
11
12 1.8 1.8 1.9 1.9 0.02 0.01 0.02 <0.001 NS NS
24 1.4 1.5 1.7 1.7 0.05 0.05 0.07 <0.001 NS NS
48 1.4 1.4 1.4 1.6 0.06 0.06 0.08 NS =0.033 NS
18:2 tr
11CLA
12 0.25 0.28 0.26 0.27 0.008 0.008 0.011 NS =0.034 NS
24 0.17 0.18 0.17 0.17 0.013 0.013 0.019 NS NS NS
48 0.15 0.16 0.16 0.18 0.016 0.016 0.023 NS NS NS
C18:2 n-6
12 5.1 6.5 5.1 6.6 0.06 0.06 0.08 NS <0.001 NS
24 2.7 4.1 2.6 4.9 0.20 0.20 0.29 NS <0.001 =0.035
48 2.3 2.8 2.3 4.0 0.44 0.44 0.63 =0.049 =0.006 NS
C18:3 n-3
12 6.8 9.7 7.0 9.9 0.10 0.10 0.15 NS <0.001 NS
24 3.4 5.7 3.3 7.0 0.32 0.32 0.45 NS <0.001 =0.031
48 2.1 3.6 3.0 4.5 0.36 0.36 0.50 =0.022 <0.001 NS
C20:4 n-6
12 0.5 0.5 0.6 0.5 0.01 0.01 0.01 =0.025 NS NS
24 0.6 0.6 0.5 0.5 0.02 0.02 0.02 =0.030 NS NS
48 0.6 0.6 0.5 0.5 0.01 0.01 0.01 <0.001 NS NS
C20:5 n-3
12 3.1 3.5 3.3 3.7 0.03 0.03 0.03 <0.001 <0.001 NS
24 1.6 2.4 2.3 3.1 0.15 0.15 0.21 <0.001 <0.001 NS
48 1.2 1.6 1.2 2.2 0.27 0.27 0.38 NS =0.016 NS
C22:6 n-3
12 2.4 2.6 2.6 2.7 0.03 0.03 0.04 <0.001 <0.001 NS
24 1.8 2.2 2.2 2.4 0.07 0.07 0.10 <0.001 <0.001 NS
48 1.6 1.7 1.8 2.1 0.13 0.13 0.18 NS NS =0.049
S.E.D= Standard error of difference; F D = fluid by dose interaction, NS= Not significant at P<0.05
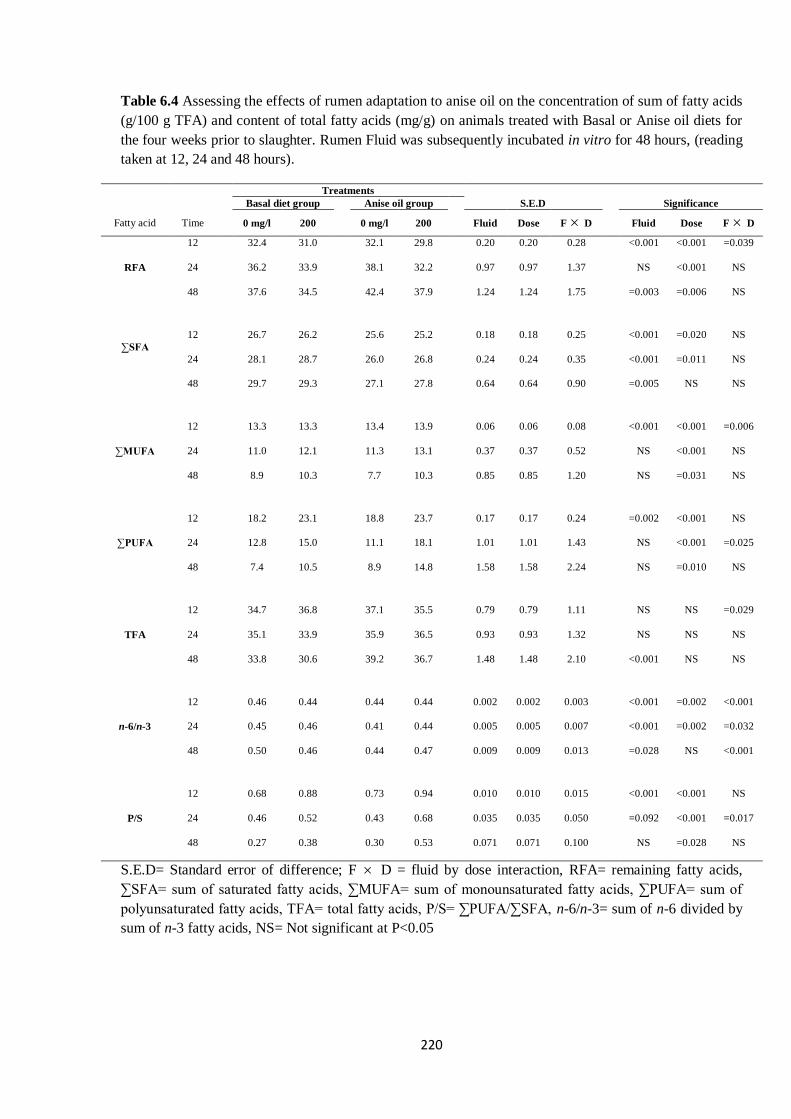
220
Table 6.4 Assessing the effects of rumen adaptation to anise oil on the concentration of sum of fatty acids
(g/100 g TFA) and content of total fatty acids (mg/g) on animals treated with Basal or Anise oil diets for
the four weeks prior to slaughter. Rumen Fluid was subsequently incubated in vitro for 48 hours, (reading
taken at 12, 24 and 48 hours).
Treatments
Basal diet group
Anise oil group
S.E.D
Significance
Fatty acid Time 0 mg/l 200 0 mg/l 200 Fluid Dose F D Fluid Dose F D
RFA
12 32.4 31.0 32.1 29.8 0.20 0.20 0.28 <0.001 <0.001 =0.039
24 36.2 33.9 38.1 32.2 0.97 0.97 1.37 NS <0.001 NS
48 37.6 34.5 42.4 37.9 1.24 1.24 1.75 =0.003 =0.006 NS
∑SFA
12 26.7 26.2 25.6 25.2 0.18 0.18 0.25 <0.001 =0.020 NS
24 28.1 28.7 26.0 26.8 0.24 0.24 0.35 <0.001 =0.011 NS
48 29.7 29.3 27.1 27.8 0.64 0.64 0.90 =0.005 NS NS
∑MUFA
12 13.3 13.3 13.4 13.9 0.06 0.06 0.08 <0.001 <0.001 =0.006
24 11.0 12.1 11.3 13.1 0.37 0.37 0.52 NS <0.001 NS
48 8.9 10.3 7.7 10.3 0.85 0.85 1.20 NS =0.031 NS
∑PUFA
12 18.2 23.1 18.8 23.7 0.17 0.17 0.24 =0.002 <0.001 NS
24 12.8 15.0 11.1 18.1 1.01 1.01 1.43 NS <0.001 =0.025
48 7.4 10.5 8.9 14.8 1.58 1.58 2.24 NS =0.010 NS
TFA
12 34.7 36.8 37.1 35.5 0.79 0.79 1.11 NS NS =0.029
24 35.1 33.9 35.9 36.5 0.93 0.93 1.32 NS NS NS
48 33.8 30.6 39.2 36.7 1.48 1.48 2.10 <0.001 NS NS
n-6/n-3
12 0.46 0.44 0.44 0.44 0.002 0.002 0.003 <0.001 =0.002 <0.001
24 0.45 0.46 0.41 0.44 0.005 0.005 0.007 <0.001 =0.002 =0.032
48 0.50 0.46 0.44 0.47 0.009 0.009 0.013 =0.028 NS <0.001
P/S
12 0.68 0.88 0.73 0.94 0.010 0.010 0.015 <0.001 <0.001 NS
24 0.46 0.52 0.43 0.68 0.035 0.035 0.050 =0.092 <0.001 =0.017
48 0.27 0.38 0.30 0.53 0.071 0.071 0.100 NS =0.028 NS
S.E.D= Standard error of difference; F D = fluid by dose interaction, RFA= remaining fatty acids,
∑SFA= sum of saturated fatty acids, ∑MUFA= sum of monounsaturated fatty acids, ∑PUFA= sum of
polyunsaturated fatty acids, TFA= total fatty acids, P/S= ∑PUFA/∑SFA, n-6/n-3= sum of n-6 divided by
sum of n-3 fatty acids, NS= Not significant at P<0.05
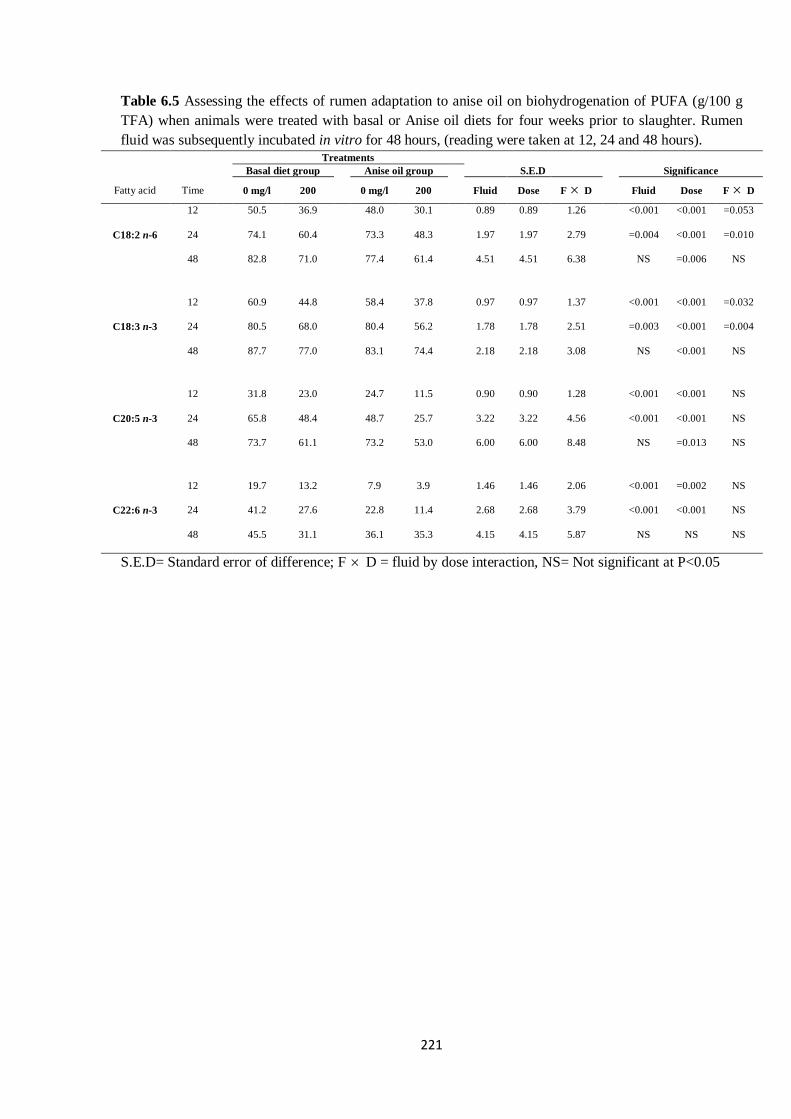
221
Table 6.5 Assessing the effects of rumen adaptation to anise oil on biohydrogenation of PUFA (g/100 g
TFA) when animals were treated with basal or Anise oil diets for four weeks prior to slaughter. Rumen
fluid was subsequently incubated in vitro for 48 hours, (reading were taken at 12, 24 and 48 hours). Treatments
Basal diet group
Anise oil group
S.E.D
Significance
Fatty acid Time 0 mg/l 200 0 mg/l 200 Fluid Dose F D Fluid Dose F D
C18:2 n-6
12 50.5 36.9 48.0 30.1 0.89 0.89 1.26 <0.001 <0.001 =0.053
24 74.1 60.4 73.3 48.3 1.97 1.97 2.79 =0.004 <0.001 =0.010
48 82.8 71.0 77.4 61.4 4.51 4.51 6.38 NS =0.006 NS
C18:3 n-3
12 60.9 44.8 58.4 37.8 0.97 0.97 1.37 <0.001 <0.001 =0.032
24 80.5 68.0 80.4 56.2 1.78 1.78 2.51 =0.003 <0.001 =0.004
48 87.7 77.0 83.1 74.4 2.18 2.18 3.08 NS <0.001 NS
C20:5 n-3
12 31.8 23.0 24.7 11.5 0.90 0.90 1.28 <0.001 <0.001 NS
24 65.8 48.4 48.7 25.7 3.22 3.22 4.56 <0.001 <0.001 NS
48 73.7 61.1 73.2 53.0 6.00 6.00 8.48 NS =0.013 NS
C22:6 n-3
12 19.7 13.2 7.9 3.9 1.46 1.46 2.06 <0.001 =0.002 NS
24 41.2 27.6 22.8 11.4 2.68 2.68 3.79 <0.001 <0.001 NS
48 45.5 31.1 36.1 35.3 4.15 4.15 5.87 NS NS NS
S.E.D= Standard error of difference; F D = fluid by dose interaction, NS= Not significant at P<0.05
222
6.4.0. Discussion
The aim of the current study was to examine the possibility of rumen adaptation to anise oil within a
feeding period of four weeks. Anise oil (200 mg/L) was identified in the previous study (Chapter 5) as the
most effective essential oil in terms of both preventing PUFA disappearance and maintenance of optimal
VFA production. In this study, six Hartline Texel cross lambs were used. Three of the lambs were
randomly assigned to the control treatment (without anise oil, BDG) and the remaining three lambs were
offered feed pre-treated with ANO (2.4 g/sheep/day anise oil, AOG) for four weeks. All the six lambs
used in this study were in good health condition throughout the period of the trial. Dry matter intake was
marginally higher (by 2%) in sheep that received anise oil (AOG) compared to the control (BDG).
However, final body weight gains were not affected by treatments (BDG and AOG). Nevertheless, it
could be speculated that the AOG that had higher feed intake but without higher weight gain may have
excreted more nutrients than the BDG. By contrast, previous in vivo studies where higher doses: 500
mg/day of cinnamaldehyde (Busquet et al., 2003; Calsamiglia et al., 2007), and a mixture of eugenol (90
mg/day) plus 180 mg/day of cinnamaldehyde (Cardozo et al., 2006) were used observed negative effect
on feed intake. The observed difference in feed intake between the present study and some previous
studies (Busquet et al., 2003; Cardozo et al., 2006; Calsamiglia et al., 2007) could be due to the different
doses or type of EOs/EOCs or the diet used.
6.4.1. Fermentation parameters
The current study observed that although the BDG and AOG maintained similar levels of total gas
production, BDG 200 and AOG 200 caused 7.9% (average) inhibition of total gas relative to the control.
This level of reduction of total gas in cultures supplemented with 200 mg/L from both sources of rumen
fluid (AOG and BDG) in the current study is similar and consistent with the level of inhibition of gas
production when 200 mg/L of anise oil was used in the previous study (see Chapter 5).
A number of studies have indicated that different blend of essential oil decreased proteolysis and amino
acid deamination (McIntosh et al., 2003; Molero et al., 2004; Newbold et al., 2004; Castillejos et al.,
2007). Majority of these studies proposed that about four weeks period of microbial adaptation to blend of
essential oil was the minimum period of time necessary to observe the effects of mixtures of essential oil
223
on protein metabolism in the rumen (Wallace et al., 2003; Molero et al., 2004; Castillejos et al., 2007 ).
In the current in vivo study, the concentrations of NH3-N from the two fluids (BDG and AOG) were not
affected by treatments. This observation is in agreement with Newbold et al. (2004) who reported that
110 mg/d of blend of EO (Crina® ruminants; Akzo Surface Chemistry Ltd., Herfordshire, UK) did not
affect the concentration of NH3-N measured in vitro. Furthermore, Castillejos et al. (2007) observed that
the concentration of NH3-N was not affected by supplementing 110 mg/L of a blend of essential oil
(Crina® Ruminant; AKZO NOBEL/CRINA S.A., Gland, Switzerland). The constituents of the Crina®
Ruminant were guaiacol, thymol and limonene. However, both studies (Newbold et al., 2004; Castillejos
et al., 2007) reported that 24% and 14% respectively, of ammonia N was decreased when measured in
vitro from rumen fluid collected from sheep adapted with blend of essential oil for four weeks. In the
current in vitro study, we observed that the addition of AOG 200 mg/L but not of BDG 200 mg/L induced
a 16% reduction on NH3-N concentration after 24 h. This observation suggests reduced deamination or
decreased concentration of HAP (although not tested). Some studies have demonstrated that some (HAP)
such as Peptostreptococcus anaerobius and Clostridium sticklandii were more sensitive than others such
as Clostridium aminophilum to the Crina blend of essential oil (McIntosh et al., 2003). Contrary to the
results obtained in the current study, previous results (described in Chapters 4 and 5) indicate that anise
oil (300 and 200 mg/L) did not change the levels of NH3-N in rumen contents. These results indicate the
possibility that the accumulated residual effects of feeding anise oil to lambs (for four weeks) resulted to
the decreased concentration of ammonia, suggesting that ruminal microbes need adaptation time of about
four weeks in order to change the levels of NH3-N in the rumen.
After four weeks period of microbial adaptation to anise oil, TVFA concentrations in the rumen (in vivo)
and in vitro were not different between the BDG and AOG, which implies that anise oil, at the dose tested
in this study, neither affect feed intake nor alter the utilization of energy. These results are consistent with
results of other previous studies (Wallace et al., 2002; Newbold et al., 2004). In addition, Castillejos et al.
(2007) observed in a dual flow continuous culture studies that supplementing 650 mg/day of a blend of
essential oil (Crina® Ruminant; AKZO NOBEL/CRINA S.A., Gland, Switzerland) did not alter the
concentration of VFA (in vitro and in vivo). Since the absorption of VFA in the rumen is proportional to
224
its ruminal concentration (Lopez et al., 2003), this study suggests that absorption of VFA would also not
be affected with the inclusion of 2.4 g/sheep/day of anise oil. Although the molar proportions of
individual VFA were not affected by treatment in vivo, results were different in vitro. The unadapted fluid
plus 200 mg/L of anise oil (BDG 200 mg/L) did not affect the molar proportions of acetate, propionate
and the acetate to propionate ratio at 24 h which is consistent with previous reports described in Chapter 5
(where 200 mg/L of anise oil did not change the molar proportions of VFA). In contrast, AOG 200 mg/L
increased acetate and reduced propionate. These results between in vitro and in vivo studies are in
agreement with the observation of Castillejos et al. (2007) who reported that although blend of essential
oil did not affect the concentrations of total and individual VFA in vivo, levels were affected when rumen
fluid collected from sheep adapted to blend of essential oil was used in in vitro trial. The concentrations
of branched-chain volatile fatty acids (BCVFA) such as isobutyric and isovaleric in AOG 200 mg/L were
reduced which agreed with the reduced concentration of NH3-N in those cultures. These results are
consistent with decreased deamination process (Allison et al., 1962).
6.4.2. Effect of EOC on fatty acid metabolism
Saturated fatty acids such as C14:0 and C16:0 have the capacity to increase the plasma cholesterol levels
by suppressing and saturating low-density lipoprotein (LDL) receptors (Keys et al., 1995). In the current
study, the levels of C14:0 were not affected by treatments, but the g/100 g concentration of C16:0 was
considerably reduced with the addition of 200 mg/L of anise oil (irrespective of fluid) relative to the
control. This agrees with the previous reports described in Chapter 5 and suggests that anise oil could
potentially reduce the levels of plasma cholesterol through decreasing the concentration of palmitic
(C16:0) acids.
The average concentration of C18:0 was reduced in cultures supplemented with AOG relative to the
BDG. The 200 mg/L regardless of the type of fluid (AOG or BDG) maintained higher levels of C18:0
than the 0 mg/L. At 12 and 24 h, the concentration of C18:1 trans 11 (vaccenic acid) was significantly
higher in cultures with the AOG relative to the BDG. These results suggest that anise oil modified the
biohydrogenation of fatty acids by reducing the production of stearic acid (the end-product of
biohydrogenation) and maintained higher levels of C18:1 trans 11 than the control cultures. Reduction in
225
the content of C18:0 and higher levels of C18:1 trans 11 suggests that supplementing anise oil might
reduce the activity of Butyrivibrio proteoclasticus, the ruminal microorganism responsible for converting
C18:1 trans 11 to stearic acid during the reductase-step of biohydrogenation (Moon et al., 2008). These
results agree with the reports from our preliminary in vitro studies (Eburu and Chikunya, 2014; 2015a; b).
In those studies, both anise oil and its main active constituent compound (anethole) maintained high
concentration of PUFA in cultures as a consequence of decreased biohydrogenation.
The concentrations of C18:2 cis-9 trans 11CLA in cultures at 12 h were maintained in a linear dose-
response pattern. This is consistent with reports from our previous study where anise oil maintained
higher levels of C18:2 trans 11CLA (Chapter 5; Eburu and Chikunya 2015a, b). This intermediate of
biohydrogenation (C18:2 cis-9 trans 11 CLA) is formed in the first step during the transformation of cis-
9, cis-12 18:2 by the linoleic acid isomerase (LA-I) (Jenkins et al., 2008; Kim et al., 2009; Buccioni et
al., 2012). Results of the current study suggest that anise oil at the level tested facilitated the activities of
the linoleic acid isomerase which regulates the formation of cis-9 trans 11 CLA from cis-9, cis-12 18:2.
The content of C18:2 n-6 and C18:3 n-3 rapidly decreased with time and the biohydrogenation of C18:2
n-6 and C18:3 n-3 was similar to previous in vitro (Beam et al., 2000; Sinclair et al., 2005) and in vivo
(Wachira et al., 2000; Scollan et al., 2001, Wang et al., 2002) studies. After 48 h time point, the
concentrations of C18:2 n-6 and C18:3 n-3 were higher in vessels with AOG than in BDG, and the 200
mg/L of all fluids maintained higher levels of C18:2 n-6 and C18:3 n-3 compared to the control. At 24 h
time point, the concentrations of C18:2 n-6 and C18:3 n-3 in vessels with added AOG 200 mg/L were
higher than their corresponding values in BDG 200 mg/L. This significant interaction proposes the
possibility of the residual effects of feeding anise oil to lambs (for four weeks) on the maintenance of the
concentration of PUFA by decreasing biohydrogenation. The biohydrogenation of these C-18 PUFAs was
similar to their concentrations with AOG 200 mg/L indicating the highest potency to decrease the
disappearance of PUFA. These results are consistent with those of Vasta et al. (2013) who observed that
after 3 months of supplementing the diet of Barbarine lambs with 400 ppm of Artemisia essential oil, the
concentrations of C18:1 trans 11, C18:2 cis-9 trans 11, C18:2 n-6, C18:3 n-3 and MUFA in the muscle
were increased compared to the control. Futhermore, other studies reported that the fat content of milk
226
from dairy cows was increased by feeding 5 g/day/cow and 2/day/cow of alium and juniper essential oils,
respectively (Yang et al., 2007). By contrast, Chaves et al. (2008) reported that supplementing garlic,
juniper berry and cinnamaldehyde at 200 mg/kg of dry matter to growing lambs did not modify the fatty
acid profile of back and liver fat. Other studies observed that monoterpenes blend consisting of β-pinene,
linalool, α-pinene, p-cymene at 0.43 g/kg of dry matter intake did not change the fatty acid profile of milk
(Malecky et al., 2009). In another study, supplementing the diet of dairy cows with 1 g/day of
cinnalmaldehyde did not affect the fatty acid composition of milk (Benchaar et al., 2007b). The
difference between the present study and previous studies (Chaves et al., 2008; Malecky et al., 2009) for
composition of fatty acid could be due to the difference in the chemical structure of essential oils and the
duration of exposure. These factors (the chemical structure of essential oils and the duration of exposure)
could affect the applicability of in vitro results and the actual response from animal performance in vivo
due to possible microbial adaptation. This is why other researchers suggested that sufficient time should
be provided in vitro in order to study the possibility of such adaptations (Calsamiglia et al., 2007).
The extent of disappearance of C20:5 n-3 and C22:6 n-3 in vessels increased as the time of incubation
progressed. After 24 h, the quantity of the content of 20:5 n-3 in vessel which disappeared was highest in
the control (73.7%) and supports previous reports from in vivo studies where the biohydrogenation of
C20:5 n-3 and C22:6 n-3 from fish oil range from 72 to 93 g/100 g TFA (Wachira et al., 2000; Scollan et
al., 2001; Chikunya et al., 2004). The disappearance of C22:6 n-3 which was less than the
biohydrogenation of C20:5 n-3 was also consistent with other previous in vitro reports where the
biohydrogenation of C22:6 n-3 was less than 50 g/100 g (Ashes et al., 1992; Sinclair et al., 2005). Rumen
fluid from sheep adapted with anise oil (AOG) maintained higher levels of C20:5 n-3 and C22:6 n-3 and
reduced their biohydrogenation than BDG, and all treatments maintained a dose-related response effect
on the levels of C20:5 n-3 and C22:6 n-3. As the concentrations of these fatty acids reflect the
biohydrogenation data, it indicates that disappearance of these PUFA was substantially reduced in the
AOG. However, there was no significant interaction between fluid and dose of anise on the concentration
and biohydrogenation of these long chain PUFAs.
227
The addition of graded doses of anise (0 and 200 mg/L) sequentially increased the concentrations of
∑PUFA and P/S ratio and progressively decreased the concentrations of ∑n-6/∑n-3 and ∑SFA, relative to
the control. These increased concentrations of ∑PUFA, P/S ratio and progressive decrease on the
concentrations of ∑n-6/∑n-3 and ∑SFA with 200 mg/L of anise oil were higher in vessels with the AOG
200 mg/L relative to the BDG 200 mg/L. This interaction implies that feeding 2.4 g/day/sheep of anise oil
for 4 weeks improved the concentrations of ∑PUFA, P/S ratio, ∑n-6/∑n-3 and ∑SFA than just the
supplementation of cultures with 200 mg/L of anise oil.
This microbial adaptation study did not measure the stability of anise oil (the used essential oil) in the
rumen. However, this assessment would have been achieved by measuring the amount of the oil in the
diet and examination of the feaces for the same purpose. There is increasing evidence that essential oils
and their constituent compounds are anaerobically biodegraded to a number of other compounds. This
suggests that adaptation may result from the biotransformation of the active form of a compound to a less
active form. In anaerobic environment, facultative bacteria such as Alcaligenes defragrans degrade
monoterpenes such as limonene into 2-carene or α-terpinene depending on the absence or availability of
nitrate, respectively (Heyen and Harder, 1998). Other microbes such as E.coli produce carveol, perillyl
alcohol, perillic acid and carvone from the biotransformation of monoterpenes such as limonene (Cheong
and Oriel, 2000; Mars et al., 2001).
In summary, as an indication of modified fatty acid profile in the present study, the fluid from lambs
adapted with 2.4 g/sheep/day for four weeks contained higher levels of individual and total PUFA and
reduced concentration of C18:0 and ∑SFA than the unadapted fluid. This study indicates that there was
no microbial adaptation to anise oil (2.4 g/sheep/day) during this experimental period (four weeks), and
suggests that at the dose tested, anise oil sustain microbial inhibition and prevented any form of microbial
adaptation process.
6.5. Conclusion
In this four weeks adaptation study, fluid from sheep adapted with anise oil maintained higher
concentrations of total and individual PUFA, trans vaccenic acid and lower concentration of stearic acid.

228
These results indicate that there was no microbial adaptation to anise oil in the rumen during the four
weeks period of study. These results suggest that anise oil is potentially a useful feed additive to optimise
the fatty acid composition of ruminant food products, if these effects are observed in meat and milk.

229
230
CHAPTER 7
7.1a. General discussion and recommendations for future research
The effects of essential oils and their constituent compounds on in vitro biohydrogenation of PUFA in the
rumen were examined during the course of this PhD research. The major objective was to use EOs/EOCs
to modify microbial metabolism of PUFA in order to optimize the fatty acid composition of ruminant
meat and milk. The need for optimization of the fatty acid composition of ruminant food products is due
to the well-known human health implications of consuming high SFA and low PUFA, which is common
in ruminant food products. One of the weaknesses of EOCs or EOs in the rumen is their lack of selectivity
in terms of microbial species affected; hence, dose optimization of EOCs/EOs was performed to obtain
satisfactory protection of PUFA from ruminal biohydrogenation but without disrupting VFA
concentration. In addition, microorganisms have the tendency to adapt to EOCs/EOs over time; therefore,
the possibility of microbial adaptation to anise oil (the most effective oil identified during the in vitro
studies) was investigated. During this PhD research, the main aims and the principal accomplishments
and findings are outlined as follows:
1. Phenolic compounds from essential oils were more effective at reducing biohydrogenation of
PUFA in the rumen than other classes of EOCs (Chapter 3).
2. Anethole and 4-allyanisole (at 300 mg/L) were the most effective EOCs to reduce the extent of in
vitro rumen biohydrogenation of C18:3 n-3 (average values were 22.2% and 26.4%, for anethole
and 4-allyanisole, respectively). However, at 300 mg/L, anethole and 4-allyanisole concomitantly
induced substantial decrease (over 10% reductions) on the ruminal concentration of total VFA
(Chapter 3).
3. Essential oils that are rich in phenolic compounds were more effective at reducing
biohydrogenation of PUFA in the rumen than other essential oils whose active compounds are not
predominantly phenolic compounds (Chapter 4).
4. Anise and cassia oils (at 300 mg/L) were the most effective whole EOs to reduce the extent of in
vitro rumen biohydrogenation of C18:3 n-3 (mean values were 58.2% and 54.3% for anise and
231
cassia oils, respectively). However, protection of PUFA from biohydrogenation was accompanied
by significant (over 10% reductions) suppression of VFA concentration in the ruminal contents.
5. Essential oils have slightly more potential to inhibit the biohydrogenation of PUFA in the rumen
than their main active constituent components (Chapter 4 and Chapter 5).
6. At 200 mg/L, 4-allylanisole, anethole and anise oil seems to give best balance between PUFA
protection and minimal disruption to VFA concentration in vitro, but cassia oil requires a dose
more than 100 mg/L but less than 200 mg/L to attain the same balance (Chapter 5).
7. At 200 mg/L, anise oil was more effective than the rest of the other substances (-allylanisole,
anethole and cassia oil) in both preventing PUFA disappearance and maintenance of optimal
VFA production (Chapter 5).
8. In vitro digests from rumen fluid fed anise oil (2.4 g/sheep/day) contained higher concentrations
of PUFA and biohydrogenation intermediate (C18:1 trans 11) with substantial reduction of C18:0
concentration (Chapter 6).
9. Microbial adaptation to anise oil did not occur within four weeks period used in adaptation study,
as evidenced by high accumulation of PUFA and C18:1 trans 11 with substantial reduction of
C18:0 concentration (Chapter 6).
10. There is a possibility to select essential oils and their main constituent compounds to reduce the
biohydrogenation of PUFA and to potentially use them to optimize the fatty acid composition of
ruminant food products (Chapters 3; 4; 5; 6).
Results of this PhD thesis suggest that, generally, dietary addition of essential oils and their constituent
compounds represent a potential effective technique to optimize the fatty acid composition of ruminant
food products by reducing the extent of rumen biohydrogenation of PUFA. Whole essential oils that are
rich in phenolic compounds are more effective than the individual constituent compounds. However,
certain questions remain unanswered which need to be addressed in future study. Therefore, the following
areas of further study are suggested.
232
7.1b MECHANISM OF ACTION OF EOS/EOCS
Despite the considerable increase on the concentration and the dramatic reduction in the biohydrogenation
of PUFA due to the supplementation of EOs/EOCs, there were no corresponding data on their effects on
specific biohydrogenating bacteria. It was not a deliberate decision not to evaluate effects of EOs/EOCs
on microbial species composition, but priority in the design of the PhD work was given to comparative
evaluation of effects of whole essential oils and their individual EOCs; establishment of optimum doses
for both EOCs/EOs; and the possibility of rumen adaptation. Furthermore, the time consuming nature of
microbial analyses and the expensive nature of microbial characterization studies were other factors that
worked against microbial species composition analysis in this study.
Clostridium proteoclasticum (Kemp et al., 1975; Maia et al., 2007) which was re-classified as
Butyrivibrio proteoclasticus (Moon et al., 2008), is well known as the only bacteria capable of converting
C18:1 trans 11 to C18:0, and all bacteria in the Butyrivibrio group are known to have the capacity to
convert linoleic acid to C18:2 cis-9 trans-11 CLA. However, because bacteria need to be growing or
active in order to cause biohydrogenation, other authors have argued that as PUFA are capable of
inhibiting this growth, it is likely that other bacteria which are potential producers of C18:0 might have
been inhibited (Wallace et al., 2006). Hudson et al. (1998) observed that Streptococcus bovis has the
ability to cause hydration of linoleic acid to 13-hydroxy-9-octadecenoic acid. The study of Hudson et al.
(1998) provide evidence to suggest that other facultative ruminal bacteria including Lactobacillus,
Staphyloccous, pediococcus and Enterococcus have the ability to hydrate linoleic acid (Hudson et al.,
2000). There is limited evidence whether there are many more bacteria involved in biohydrogentaion due
to the time-consuming nature and the high cost of isolating such bacteria (Huws et al., 2006). Available
evidence suggests that other bacteria such as Ruminococcaceae, Anaerovoax, Prevotella as well as other
clostridiales which have not been identified could also play a role in biohydrogenation pathways (Huws et
al., 2006, Huws et al., 2011). Future study with EOs/EOCs must consider examination of effects on
microbial species composition, providing evidence on the abundance of key biohydrogenating bacteria in
order to conclusively state the mechanism of actions of essential oils against individual microbial species.
233
7.1c IN VIVO STUDIES
Only short term in vitro studies up to 48 h and four weeks period of microbial adaptation effects were
evaluated in this PhD. Several studies have reported wide discrepancies between in vitro and in vivo
results. Malecky et al. (2009) observed that the fatty acid composition of milk was not affected by adding
a monoterpene blend (0.43 g/kg diet) containing α-pinene, β-pinene, p-cymene and linalool to the diet. In
another study, cinnamaldehyde (1 g/kg) added to the diet of dairy cattle also did not affect the profile of
milk fatty acids (Benchaar and Chouinard, 2009). Others observed that the fatty acid profile of milk
obtained from dairy cows offered 0.75 g/cow/day of a mixture of essential oils and compounds (Crina
ruminants; CRINA S.A., Gland, Switzerland) was not affected (Benchaar et al., 2007a). Furthermore,
Chaves et al. (2008) reported that supplementing garlic, juniper berry and cinnamaldehyde at 200 mg/kg
of dry matter to growing lambs did not modify the fatty acid profile of back and liver fat. However, other
studies observed that after 3 months of supplementing the diet of Barbarine lambs with 400 ppm of
Artemisia essential oil, the concentrations of C18:1 trans 11, C18:2 cis-9 trans 11, C18:2 n-6, C18:3 n-3
and total MUFA in the muscle were increased compared to the control( Vasta et al., 2013). In our in vitro
and adaptation studies, we observed dramatic changes in PUFA metabolism, resulting in higher
concentration and reduced biohydrogenation of PUFA due to the supplementation of EOs/EOCs. A
number of factors such as the environmental condition of the growing plant (soil temperature,
composition and moisture), stage of plant growth, the species of the plant, the part of the plant from
where the essential oil is extracted, and the particular method used for the extraction of oil, are all known
to be responsible for variation in the composition of essential oil and by extension, their antimicrobial
effects. In most cases, producers of the majority of the available commercial essential oils do not provide
sufficient details about these factors; hence, the differences observed in results cannot be categorically
attributed to any known factor. Therefore, in order to standardize the dose and type of essential oil in
relation to a particular effect in the rumen, future research must provide details of the growing conditions
of a plant, the species, the part of the plant from which oil was extracted, the method of extraction used,
the purity and chemical composition of the oil and the concentration which produced a particular effect in
the rumen. These data would reduce the discrepancies observed in results.

234
In a situation where the above factors are considered and a difference is still observed, this might be
attributed to microbial adaptation to essential oil or shift in microbial species composition. In the present
study, we established that there was no microbial adaptation after four weeks of feeding anise (at 2.4
g/sheep/day). We are proposing that there would be close relationship between in vivo and in vitro results
if in vivo studies (evaluation of effects on meat and milk fatty acid composition) succeed microbial
adaptation studies. In this way the minimum period of time which was established from an adaptation
study could be applied in the in vivo study. We had established that there was no microbial adaptation to
anise oil after four weeks period of feeding anise oil to lambs, further in vivo studies are necessary to
examine the potential transfer of these fatty acid changes to meat or milk by using anise oil at the dose
tested here and at the last four weeks to market weight (slaughter of the animal).
7.1d STABILITY OF ESSENTIAL OIL IN THE RUMEN
The microbial adaptation study did not measure the stability of anise oil (the used essential oil) in the
rumen. But there is increasing evidence that essential oils and their constituent compounds are
anaerobically biodegraded to a number of other compounds. This suggests that adaptation may result
from the biotransformation of the active form of a compound to a less active form. In anaerobic
environment, facultative bacteria such as Alcaligenes defragrans degrade monoterpenes such as limonene
into 2-carene or α-terpinene depending on the absence or availability of nitrate, respectively (Heyen and
Harder, 1998). Other microbes such as E.coli produce carveol, perillyl alcohol, perillic acid and carvone
from the biotransformation of monoterpenes such as limonene (Cheong and Oriel, 2000; Mars et al.,
2001). Facultative bacteria produce isoterpinolene from the biodegradation of isolimonene (Chang et al.,
1995; Heyen and Harder, 1998). The biodegradation of EOs or their compounds is achieved through the
re-arrangement of unsaturated monoterpenes by bacterial enzymes (Heyen and Harder, 1998). These
same authors reported that products of EO/EOC biodegradation might be in the form of ionic compounds.
This suggests that products of EO/EOCs biotransformation might just remain as intracellular substrate,
hence, the inhibitory effect of the products might be lost. Heylemon and Harder (1999) reported that C-1
sp2 hybridization of menthadienes can be used to determine the metabolism or transformation of
monoterpenes. Further study must use this method to elucidate the exact biodegradation pathways of EOs
235
and their compounds. Badee et al. (2011) suggested that the biodegradation of monoterpenes can be
inhibited either by the substrate or the end product of bioconversion. Establishment of these pathways
would help to suggest ways of inhibiting the activities of the biotransformation bacteria and ensure the
stability and antimicrobial activity of EOs and their constituent compounds in the rumen.
7.1e OTHER AREAS OF FURTHER RESEARCH
It is a known fact that farmers would not adopt a new nutritional strategy except the cost-benefit analysis
and the economic benefits for animal production are established. It is worth mentioning that because
most commercial essential oils, particularly their active compounds, are very expensive (Sigma Aldrich);
their effects on the welfare and productivity of animal should be established prior to their use in the farm.
Therefore, the cost-benefits ratio which would take into account the cost of an essential oil, the
concentration used and farm profitability (Calsamiglia et al., 2007), should be established in future study.
7.2. Brief summary
Optimising the fatty acid composition of ruminant derived food products for human health by altering the
processes of lipolysis and subsequent biohydrogenation of free fatty acids was the principal aim of this
study. Increased intakes of saturated fatty acids have been consistently associated with increased
occurrence of chronic diseases such as diabetes, obesity, compromised immune system and
cardiovascular diseases (Givens, 2005). In contrast, there is a positive relationship with increased intake
of n-3 PUFA and reduced risk of coronary heart disease (CHD). This relationship between CHD and the
intake of n-3 PUFA has led nutritional recommendation authorities to place emphasis on increasing the
intakes of dietary n-3 PUFA and reducing the consumption of SFA (Department of Health, 1994; WHO,
2003). Indeed, ruminant derived food products are paradoxical. On one hand, they have often been
blamed for containing low level of omega-3 fatty acids (about 2 g in every 100 g) and high content of
SFA (about 65 g in every 100 g) resulting from extensive biohydrogenation of dietary PUFA and the de
novo fatty acid synthesis (Gurr and Harwood, 1991). On the other hand, incomplete biohydrogenation of
dietary PUFA produces a number of intermediate fatty acids such as cis-9 trans 11 18:2 CLA and its
precursor, C18:1 trans 11. These fatty acids have been reported to possess a number of human health
236
benefits such as anti-carcinogenic, anti-inflammatory, anti-atherogenic and anti-diabetic effects (Banni et
al., 2001; Corl et al., 2003). Therefore, research to manipulate rumen metabolism of fatty acid is
necessary to optimize the fatty acid profile of ruminant food products and to improve human consumption
of n-3 PUFA and cis-9 trans 11 18:2 CLA from ruminant food products.
One of the ways of optimising the fatty acid composition of ruminant food products is through animal
dietary manipulation. A number of technologies have been developed over the years but they have been
largely ineffective or not cost effective. These factors have hindered the commercialization of many
technologies with the aim of optimizing the fatty acid composition of ruminant derived food products. A
few in vitro studies have shown the potential of essential oils to alter fatty acid metabolism and cause
accumulation of biohydrogenation intermediates. The effectiveness of essential oil to achieve this
depends on the ability of its active compounds to penetrate microbial cell wall, damage membrane
proteins, deplete the proton motive force, damage the cytoplasmic membrane, cause leakage of the cell
contents and coagulate the cytoplasm (see Chapter 1.7.3). These mechanisms of actions are capable of
enabling EOCs/EOs to reduce the activities of key biohydrogenating bacteria such as Butyrivibrio
proteoclasticus. The fact that these substances are constituent of plants which are dietary components for
herbivorous animals (Cowan, 1999), and also because a number of EOs/EOCs have been proposed as safe
alternative to antibiotics and their addition to food are generally considered as safe (Calsamiglia et al.,
2007), EOs/EOCs represent a potential dietary additive to achieve the right optimization of the fatty acid
composition of ruminant food products.
The principal objectives of this PhD study were 1) to examine the in vitro effects of essential oils
constituent compounds on the metabolism of n-3 PUFA by rumen microorganisms, 2) to further validate
the in vitro effects of whole essential oils on rumen fermentation and biohydrogenation of n-3
polyunsaturated fatty acids by rumen microorganisms, 3) to establish optimum doses of supplementing
essential oils and their compounds in ruminant diet and 4) to establish the potential adaptation time of the
most effective essential oil on rumen fermentation and metabolism of n-3 PUFA.
237
In order to achieve these objectives three preliminary in vitro studies followed by feeding trial and then
another in vitro study were conducted.
In all the in vitro trials in this research, the basal feedstock (a 70: 30 mixture of grass hay and concentrate,
respectively) was similar and was formulated once. Details of the experimental diet and supplier of the
ingredients are as described in section 2.3 (see general material and methods). The nutrient content and
the fatty acid composition of the basal feedstock are shown in Table 2.2 (general materials and methods).
Lipid sources in the basal feedstock were linseed (C18:3 n-3), grass hay (C18:3 n-3 and C18:2 n-6) and
fish oil (C20:5 n -3 and C22:6 n -3). The predominant C-18 fatty acids in the basal feedstock were C18:3
n-3 (21.93 g/100 g TFA) and C18:2 n-6 (12.90 g/100 g TFA). These principal C-18 FAs account for more
than 50% (59%) of the TFA in the diet. Similarly, C20:5 n -3 and C22:6 n -3 were the most abundant long
chain n-3 PUFA, contributing 8.3% and 6.2%, respectively to the TFA composition of the diet. Hence,
the fatty acid composition of the diet is a direct reflection of the sources of fatty acids in the diets (i.e.
C18:3 n-3 and C18:2 n-6 from linseed and grass hay, respectively and C20:5n -3 and C22:6n -3 from fish
oil). The basal feedstock was formulated by using feedstuff that are rich in C18:2 n-6, C18:3 n-3, C20:5
n -3 and C22:6 n -3 because the main aim of the study was to examine the biohydrogenation of those fatty
acids over time.
The effects of fifteen essential oil constituent compounds (at 300 mg/L) on the ruminal biohydrogenation
of C18:2 n-6 and n-3 PUFA was examined by means of 48 h in vitro batch culture system. A 70: 30
mixture of grass hay and concentrate respectively was formulated and then supplemented with additional
fat from the mixture of 60% of fish oil and 40% of ground linseed. The experiment was repeated twice
and the results presented were the means of two experiments. Treatments were control (no essential oil),
4-allylanisole, anethole and cinnamaldehyde (phenylpropanoids), menthol (monoterpene alcohol), 3-
carene and borneol (bicyclic monoterpenes), citronellol, limonene, myrtenol, p-cymene and thujone
(monoterpenes), bisabolol (sesquiterpene), eucalyptol (monoterpene ethers), caryophyllene (bicyclic
sesquiterpene) and vanillin (aldehydes). There was rapid biohydrogenation of C18:3 n-3 from ground
linseed which exceeded 80 g/100 g at 24 h. This observation agrees with previous studies where the
biohydrogenation of C18:3 n-3 range from 72-95% (Wachira et al., 2000; Scollan et al., 2001). However,
238
supplementing cultures with EOCs considerably reduced biohydrogenation and maintained higher the
concentrations of C18:2 n-6 and n-3 PUFA (Chapter 3). The content of C18:3 n-3 or C18:2 n-6 at 24 h
increased significantly in the progression: ALA and ANE (phenylpropanoids), MEN (monoterpene
alcohol) and CIT (monoterpene) > 3-CAR and BOR (bicyclic monoterpenes), CIN (phenylpropanoid),
LIM, MYT, CYM and THU (monoterpenes) > BIS (sesquiterpene) and EUC (monoterpene ethers) >
CPY (bicyclic sesquiterpene) and VAN (aldehydes). The results which indicated that phenolic
compounds were the most potent compounds and that aldehydes were the least effective compounds was
consistent with the findings of Kalemba et al. (2012) who ranked the antimicrobial potency of EOCs in
the following descending order: phenols > cinnamic aldehyde > alcohols > aldehydes. Anethole and 4-
allylanisole (phenolic compounds) were the most effective EOCs after 24 h. As a consequence of
including anethole and 4-allylanisole in cultures, the concentrations of C18:2 n-6 and C18:3 n-3 (g/100 g
TFA) were more than double the corresponding values in the control. Mean values were 2.7, 2.7 and 1.3
(C18:2 n-6) and for C18:3 n-3 were 4.0, 3.9 and 1.6 g/100 g TFA for 4-allylanisole, anethole and the
control, respectively. The values for other EOCs were intermediate between the control and the most
effective EOCs (anethole and 4-allylanisole). The biohydrogenation results showed that about 22.2% and
26.4% of alpha linolenic acid (C18:3 n-3) were protected from ruminal biohydrogenation in cultures
supplemented with anethole and 4-allylanisole, respectively. The possibility of anethole and 4-allylanisole
to exert the greatest antimicrobial characteristic by maintaining higher levels of C18:3 n-3 than other
EOCs could be due to the possession of hydroxyl group whose acidic characters are speculated to have
broad inhibition of microbial activities (Cosentino et al., 1999; Juliano et al., 2000; Lambert et al., 2001).
This could suggest that anethole and 4-allylanisole probably had higher capacity to reduce isomerization
of C18:3 n-3 and C18:2 n-6 compared to the rest of the treatments or that they were more active against
Clostridium proteoclasticum (Kemp et al., 1975; Maia et al., 2007), renamed (Moon et al., 2008) as
Butyrivibrio proteoclasticus, the bacteria which converts C18:1 trans 11 to C18:0. The latter reason
probably could be the option as further evaluation of the concentrations of C18:1 trans 11 revealed that
levels were higher in fermentation vessels supplemented with anethole and 4-allylanisole. However, due
to the high concentration of oleic acid (C18:1 n-9) which was probably converted to C18:0,
corresponding reduction in C18:0 as an evidence of reduced biohydrogenation of C18:3 n-3 and C18:2 n-
239
6 was not observed in anethole and 4-allylanisole. Jenkins et al. (2006) observed that about 70% of C18:1
n-9 in rumen culture was converted to C18:0 and only 30% was transformed to ketostearic acid and
hydroxystearic acid. Evaluation of microbial species composition, which this study unfortunately did not
perform, would have been able to conclusively establish whether the increased concentration of PUFA
and biohydrogenation intermediates such as C18:1 trans 11 concomitantly reduce the activity of
Butyrivibrio proteoclasticus (the key biohydrogenator) or any other closely associated bacteria capable of
causing biohydrogenation. However, substantial suppression of VFA was concomitantly associated with
the increased concentration of PUFA. The fact that EOCs are extracts of plants which are part of animal
diets (Cowan, 1999), and their consideration as generally recognized as safe food additives (GRAS,
Calsamiglia et al., 2007), offers the use of EOCs to reduce ruminal PUFA disappearance advantage over
other non-commercialized method of protecting PUFA from biohydrogenation such as the formaldehyde
method, if their use is balanced against inhibition of VFA.
The potential of ten whole essential oils (at 300 mg/L) on the biohydrogenation of C18:2 n-6 and n-3
PUFA was further evaluated through in vitro batch culture system. The aim was to establish whether the
whole essential oils from where some of the major compounds showing potential to reduce the
biohydrogenation of PUFA in Chapter 3 are equally effective. The ten whole oils (anise, cassia,
citronella, clove, cornmint, eucalyptus, juniper berry, lavender , mandarin and rosemary) used in this
study were the parent oils whose main compounds were the best ten in Chapter 3. There was rapid
biohydrogenation of C18:3 n-3 from ground linseed which exceeded 80 g/100 g at 24 h. This observation
agrees with previous studies where the biohydrogenation of C18:3 n-3 range from 72-95% (Wachira et
al., 2000; Scollan et al., 2001; Wang et al., 2002; Sinclair et al., 2005). Similarly, the biohydrogenation of
C20:5 n-3 which exceeded 80 g/100 g was in agreement with previous reports from in vivo studies where
the biohydrogenation of C20:5 n-3 and C22:6 n-3 in fish oil range from 72 to 93 g/100 g TFA (Wachira
et al., 2000; Scollan et al., 2001; Chikunya et al., 2004), and contrast in vitro reports where the
biohydrogenation of C20:5 n-3 and C22:6 n-3 was less than 50 g/100 g (Ashes et al., 1992; Sinclair et al.,
2005). However, supplementing cultures with EOs substantially reduced biohydrogenation and
maintained higher the concentration of C18:2 n-6 and n-3 PUFA, but with corresponding significant (over
240
10% average) suppression of VFA concentration (Chapter 4). The potential of whole EOs used in this
study to reduce the biohydrogenation of n-3 PUFA at 24 h was as follows: ANO and CSO > MDO and
CMO > CTO and RMO > JPO, LVO, CLVO and ETO. Similar to the results observed with the EOCs
(Chapter 3), the whole essential oils whose main components possess phenolic moieties in their chemical
structures were the most effective oils in this study. The fermentation vessels supplemented with anise
(high in anethole) and cassia (high in cinnamaldehyde) oils elicited the most effective protection of C18:2
n-6 and n-3 PUFA from biohydrogenation. Supplementation of anise and cassia oils tripled the
concentration of C18:2 n-6 and C18:3 n-3 relative to the control. The concentration values at 24 h were
5.4, 6.0 and 2.2 (C18:2 n-6) and for C18:3 n-3 were 8.1, 9.4 and 2.8 g/100 g TFA for anise oil, cassia oil
and the control, respectively. The biohydrogenation data indicated that about 58.2% and 54.3% protection
of alpha linolenic acid (C18:3 n-3) from ruminal biohydrogenation was obtained with the addition of
anise oil and cassia oil, respectively. This probably implies that anise and cassia oils had higher capacity
to either reduce isomerization of C18:3 n-3 and C18:2 n-6 compared to the rest of the treatments or that
they were more active against Clostridium proteoclasticum (Kemp et al., 1975; Maia et al., 2007),
renamed (Moon et al., 2008) as Butyrivibrio proteoclasticus, the bacteria which converts C18:1 trans 11
to C18:0. The concentration of C18:0 (the end-product of the biohydrogenation of C18:1 n-9, C18:3 n-3
and C18:2 n-6) was considerably decreased in cultures supplemented with cassia oil. This observation
learns support to the possibility of these phenolic rich EO to reduce the activity of Butyrivibrio
proteoclasticus, the key bacteria which converts C18:1 trans 11 to C18:0. Comparison of the effects of
EOCs (Chapter 3) and whole essential oils (Chapter 4) indicates that the whole essential oils are more
effective than the main active compounds in terms of inhibiting the biohydrogenation of PUFA. This
suggests that although the major constituent components of EOs reflect the biological properties of the
whole oils, minor components can contribute in modulating their activities such as hydrophobicity, cell
penetration and fixation on cell membranes (Bakkali et al., 2008). This leads to the suggestion that the
minor components of essential oils could be critical to the antimicrobial activity of the oil by working
synergistically with the major components (Burt, 2004). Although substantial suppression of VFA was
concomitantly associated with the increased concentration of PUFA, whole EOs are probably more
effective than the individual EOCs, if their dose is optimized. These results show that EOs have higher
241
potential to reduce PUFA biohydrogenation than other PUFA protection technologies such as the
formaldehyde method described in the reports of Sinclair et al. (2005), where pre-treatment of whole
linseed with NaOH and formic acid prior to treatment with formaldehyde obtained 44.3% and 30.7%
protection for C18:3 n-3, respectively. As shown above, the average use of whole anise and cassia oils
are 32.0% and 18.8% better than the use of EOCs (Chapter 3) and the method of Sinclair et al. (2005),
respectively. This is not weighting the economic and potential health benefits of the whole oils relative to
the formaldehyde method of Sinclair et al. (2005).
Based on the substantial inhibition of total VFA results from using 300 mg/L of EOCs (first experiment,
chapter 3) and of the whole oils (second experiment, chapter 4), a third in vitro study was conducted in
which graded doses (0, 100, 200 and 300 mg/L) of two most effective EOCs and 2 most effective whole
essential oils were evaluated. The aim was to establish a dose at which satisfactory inhibition of ruminal
PUFA biohydrogenation can be obtained but without significant reduction of VFA concentration.
Treatments were 4-Allyanisole (ALA 0, 100, 200 and 300 mg/L), anethole (ANE 0, 100, 200 and 300
mg/L), anise oil (ANO 0, 100, 200 and 300 mg/L) and cassia oil (CSO 0, 100, 200 and 300 mg/L).
Increasing the dose of both EOs/EOCs substantially increased proportionally the concentration of PUFA
(C18:3 n-3, C18:2 n-6, C20:5 n-3 and C22:6 n-3) and concomitant accumulation of biohydrogenation
intermediates such as C18:1 trans 11 and 18:2 cis-9 trans 11 CLA (Chapter 5). The substances also had a
dose related response on the concentration of total VFA. The concentrations of PUFA in all substances
were significant but marginal at 100 mg/L; doubled at 200 mg/L and; levels were tripled at 300 mg/L. As
all the essential oils and the EOCs used in this study had similar chemical structure (i.e. rich in phenolic
moieties), general results did not observe any marked difference in response among them. However, there
was a significant interaction at each level of supplementation with anise oil indicating higher potential
than other three substances to protect PUFA from biohydrogenation. Except in anise oil (at 100 mg/L), 4-
allylanisole (at 300 mg/L) and cassia oil (at 200 mg/L), the high accumulation of C18:1 trans 11 and
C18:2 cis-9 trans 11 CLA was not associated with reduced concentration of C18:0, suggesting that the
emergence of C18:0 may not be emanating from the biohydrogenation of C18:3 n-3 and C18:2 n-6 alone
but from oleic acid (C18:1 n-9) as discussed previously . At 200 mg/L, administration of 4-allylanisole,
242
anethole and anise oil seems to give best balance between PUFA protection and minimal disruption to
VFA concentration in vitro, but cassia requires a dose more than 100 mg/L but less than 200 mg/L to
attain the same balance. At this dose (200 mg/L), the corresponding concentration of total VFA was
unaffected in all substances except in cassia which caused 10% suppression of VFA level. However,
cassia (at 200 mg/L) reduced NH3-N concentration and the molar proportion of acetate and increased the
proportion of propionate. The significant interaction on both PUFA and total VFA concentrations suggest
that supplementation of anise oil had higher potential than other substances to protect PUFA from
biohydrogenation and to maintain VFA concentration at optimum level.
There is evidence from results of continuous culture studies and long term in vivo studies that the benefits
associated with the use of essential oil as feed additive may decline due to either microbial adaption to
EOs or shifts in microbial populations (Gladine et al., 2007). Therefore, a four weeks in vivo feeding trial
was conducted to test the possibility of microbial adaptation to the use of anise oil. Anise oil was
identified as the most effective from in vitro trials in terms of PUFA protection and maintenance of
ruminal VFA concentration (Chapter 5). In this experiment, six Hartline Texel cross lambs (mean
weight 44.0 ±2.5kg) were used as rumen fluid donors. The rumen fluid donor lambs were offered water
and hay ad libitum and supplemented with additional 400 g/sheep/day of concentrate plus 2.4 g/sheep/day
of ANO (for the anise oil group). After four weeks of adaptation, lambs were slaughtered and ruminal
fluid collected from each of the unadapted lambs (BDG) and adapted lambs (AOG) was used in vitro. The
study was a 2 (batches of rumen fluid: BDG and AOG) 2 (doses of ANO: 0 and 200 mg/L) factorial
design experiment. In this adaptation study, results indicated that rumen fluid from sheep adapted with
anise oil for four weeks maintained higher concentrations of PUFA, trans vaccenic acid and lower
concentration of stearic acid. These results are similar to the work reported in (Benchaar et al., 2006a).
These authors observed that biohydrogenation was altered and the concentration of cis-9, trans-11 18:2
CLA in milk fatty acids was increased when a mixture of essential oil compounds (Crina ruminants’ at 2
g/cow/day) was fed to dairy cow (Benchaar et al., 2006a). The Crina ruminants’ mixture contains
eugenol, thymol, limonene, guaiacol and vanillin (McIntosh et al., 2003; Castillejos et al., 2005).
Furthermore, other studies observed that after 3 months of supplementing the diet of Barbarine lambs
243
with 400 ppm of Artemisia essential oil, the concentrations of C18:1 trans 11, C18:2 cis-9 trans 11,
C18:2 n-6, C18:3 n-3 and total MUFA in the muscle were increased compared to the control( Vasta et al.,
2013). Although the fatty acid composition of the sheep meat was not examined in the present study to
confirm the transfer of this changes (increased PUFA and reduced C18:0) to meat, results of four weeks
adaptation study imply that anise oil is a potential feed additive to reduce the biohydrogenation of PUFA
and potentially optimize the fatty acid composition of ruminant food products. This suggest that if anise
oil (at 2.4 g/sheep/day, the tested dose) is fed to sheep at least one month before market weight, there is a
potential to alter the biohydrogenation of PUFA by increasing the concentration of PUFA and trans
vaccenic acid with concomitant reduction in the concentration of stearic acid without affecting dry matter
intake. There is also an indication that about 16% reduction in NH3-N excretion would be achieved along
with the benefits derivable from optimized fatty acid composition. The main effect of CRINA products
had also established a minimum of four weeks adaptation period to reduce ammonia excretion (McIntosh
et al., 2003; Molero et al., 2004; Newbold et al., 2004; Castillejos et al., 2007).
In conclusion, results of this PhD thesis suggest that, generally, dietary addition of essential oils and their
compounds represent a potential effective technique to optimize the fatty acid composition of ruminant
food products by reducing the extent of rumen biohydrogenation of PUFA. Whole essential oils are more
effective than the individual constituent compounds. More precisely, whole essential oils that are rich in
phenolic compounds were the most effective.
244
References
Abel-caines, S. F., Grant, R. J., Klopfenstein, T. J., Winowiski, T. and Barney, N. (1998) Influence of
non-enzymatically browned soybeans on ruminal fermentation and lactational performance of dairy cows.
Journal of Dairy Science 81: 1036-1045.
Abeywardena, M.Y. and Patten, G.S. (2011) Endocrine, Metabolic and Immune disorders. Drug Targets
3:232-246.
Adam, K., Sivropoulou, A., Kokkini, S., Lanaras, T. and Arsenakis, M. (1998) Antifungal activities of
Origanum vulgaris subsp. hirtum, Mentha spicata, Lavandula angustifolia, and salvia fructicosa essential
oils against human pathogenic fungi. Journal of Agricultural and Food Chemistry 46: 1739-1745.
Agarwal, N., Shekhar, C., Kumar, R., Chaudhary, L.C. and Kamra, D.N. (2009) Effect of peppermint
(Mentha piperita) oil on in vitro methanogenesis and fermentation of feed with buffalo rumen liquor.
Animal Feed Science and Technology 148: 321–327.
Aharoni, Y., Gilboa, N. and Silanikove, N. (1998) Models of suppressive effect of tannins. Analysis of
the suppressive effect of tannins on ruminal degradation by compartmental models. Animal Feed Science
and Technology 71: 251-267.
Akraim, F., Nicot, M. C., Weill, P. and Enjalbert, F. (2006) Effects of preconditioning and extrusion of
linseed on the ruminal biohydrogenation of fatty acids In vivo studies. Animal Research 55: 83-91.
Alexander, G., Singh, B., Sahoo, A. and Bhat, T. (2008) In vitro screening of plant extracts to enhance
the efficiency of utilization of energy and protein in ruminant diets. Animal feed Science and Technology
145: 229-244.
Allison, M.J., Bryant, M.P. and Doestch, R.N. (1962) Studies on the metabolic function of branched-
chain volatile fatty acids, growth factors for ruminococci I. incorporation of isovalerate into leucine.
Journal of Bacteriology 83: 523-532.
245
American Association of Cereal Chemists (AACC) International approved methods 30-25: Crude fat in
Wheat, Corn, Soy Flour, Feeds and Mixed feeds.
Anderson, T. J., Uehata, A., Gerhard, M. D., Meredith, I. T., Knab, S. and Delagrange (1995) Close
relation of endothelial function in the human coronary and peripheral circulations. Journal of the
American College of Cardiology 5: 1235.
Ando, S., Nishida, T., Ishida, M., Hosoda, K. and Bayaru, E. (2003) ‘Effect of peppermint feeding on
the digestibility, ruminal fermentation and protozoa’. Livestock production Science 82: 245-248.
Angioni, A., Barra, A., Coroneo, V., Dessi, S. and Cabras, P. (2006) Chemical composition, seasonal
variability, and antifungal activity of Lavandula stoechas L. ssp. Stoechas essential oils from stem/leaves
and flowers. Journal of Agricultural and Food Chemistry 54: 4364-4370.
Ashes, J. R., Gulati, S. K., Cook, L.J., Scott, T. W. and Donnelly, J.B. (1979) Assessing the biological
effectiveness of protected lipid sources for ruminants. Journal of American Oil Chem. Soc. 56: 522-27.
Ashes, J. R., St. Vincent Welch, P., Gulati, S. K., Scott, T. W., Brown, G. H. and Blakely, S. (1992)
Manipulation of the fatty acid composition of milk by feeding protected canola seeds. Journal of Dairy
Science 75: 1090-1096.
Association Official Analytical Chemist (AOAC) Official Method 920.39 Crude fat in Animal Feed.
Bach, A., Calsamiglia, S. and Stern, M. D. (2005) Nitrogen metabolism in the rumen. Journal of Dairy
Science 88: E9-E21.
Badee, A.Z.M., Helmy, S.A. and Morsy, N.F.S. (2011) Utilization of orange peel in the production of
terpineol by penicillium digitatum (NRRL 1202). Food Chemistry 126: 849-854.
Bakkali, F., Averbeck, S., Averbeck, D. and Idaomar, M. (2008) Biological effects of essential oils- A
review. Food and Chemical Toxicology 46: 446-475.
246
Banni, S., Angioni, E., Murru, E., Carta, G., Melis, M.P., Bauman, D and Dong, Y. Ip, C. (2001)
Vaccenic acid feeding increases tissue levels of conjugated linoleic acid and suppresses development of
premalignant lesions in rat mammary gland. Nutrition and Cancer-an International Journal 41: 91-97.
Barcelo-Coblijn, G. and Murphy, E. J. (2009) Alpha-linolenic acid and its conversion to longer chain
n_3 fatty acids: Benefits for human health and a role in maintaining tissue n_3 fatty acid levels. Progress
in Lipid Research 48:355-374.
Barcelo-Coblijn, G., Collison, L. W., Jolly, C. A. and Murphy, E. J. (2005) Dietary alpha-linolenic acid
increases brain but not heart and liver docosahexaenoic acid levels. Lipids 40: 787-798.
Bauchart, D. (1993) Lipid absorption and transport in ruminants. Journal of Dairy Science 76: 3864-
3881.
Bauchart, D., Legay-Carmier, F. and Doreau, M. (1990) Ruminal hydrolysis of dietary tri-glycerides in
dairy cows fed lipid supplemented diets. Reproduction Nutrition Development Suppl. 2: 187S.
Bauchart, D., Verite, R. and Remond, B. (1984) Long-chain fatty acid digestion in lactating cows fed
fresh grass from spring to autumn. Canadian Journal of Animal Science 64: 330-331.
Bauer, K., Garbe, D. and Surburg, H. (2001) Common Fragrance and Flavour Materials: Preparation,
Properties and Uses. Wiley-VCH, Weinheim, p. 293.
Baum, S. J., Kris-Etherton, P. M., Willett, W. C., Lichtenstein, A.H., Rudel, L. L., Maki, K. C., Whelan,
J., Ramsden, C. E. and Block, R. (2012) Fatty acids in cardiovascular health and disese: A
comprehensive update. Journal of Clinical Lipidology 6: 216-234.
Bauman, D. E., Corl, B. A. and Peterson, D. G. (2003) The biology of conjugated linoleic acid in
ruminants. In: Advances in Conjugated Linoleic Acid, Research (Sebedio, J., Christie, W. W., Adolf, R.,
Eds.). AOCS Press, Champaign, IL, USA, (pp. 146-173).
Bauman, D. E., Mather, I. H., Wall, R. J. and Lock, A. L. (2006) Major advances associated with the
biosynthesis of milk fat. Journal of Dairy Science 89: 1235-1243.
247
Bauman, D.E., Perfield, J.W., de Veth, M.J. and Lock, A.L. (2003) ‘New perspectives on lipid digestion
and metabolism in ruminants’. Proceedings of the Cornell Nutrition Conference pp. 175-189.
Beam, T.M., Jenkins, T.C., Moate, P.J., Kohn, R.A. and Palmquist, D.L. (2000) Effects of amount and
source of fat on the rates of lipolysis and biohydrogenation of fatty acids in ruminal contents. Journal of
Dairy Science 83: 2562-2573.
Beeson, W. M. and Perry, T. W. (1952) Balancing the nutritional deficiencies of roughages for beef
steers. Journal of Animal Science 11:501-515.
Belury, M. (2002) Dietary conjugated linoleic acid in health: physiological effects and mechanisms of
action. Annual Review of Nutrition 138: 403-409.
Benchaar, C. and Chouinard, P. Y. (2009) Short communication: Assessment of the potential of
cinnamaldehyde, condensed tannins and saponins to modify milk fatty acid composition of dairy cows.
Journal of Dairy Science 92: 3392-3396.
Benchaar, C. and Greathead, H. (2011) Essential oils and opportunities to mitigate enteric methane
emissions from ruminants. Animal Feed Science and Technology 166: 338-355.
Benchaar, C., Calsamiglia, S., Chaves, A. V., Fraser, G. R., Collombatto D., McAallister, T. A. and
Beauchemin, K. A. (2008) ‘A review of plant derived essential oils in ruminant nutrition and production’.
Animal Feed Science and Technology 145: 209-228.
Benchaar, C., Chaves, A. V., Fraser, G. R., Yang, Y., Beauchemin, K. A. and McAllister, T. A. (2007a)
Effects of essential oils and their compounds on in vitro rumen microbial fermentation. Canadian Journal
of Animal Science 87: 413-419.
Benchaar, C., Duynisveld, J. L. and Charmley, E. (2006b) Effects of monensin and increasing dose
levels of a mixture of essential oil compounds on intake, digestion and growth performance of beef cattle.
Canadian Journal of Animal Science 86: 91-96.
248
Benchaar, C., Petit, H. V., Berthiaume, R., Ouellet, D. R., Chiquette, J. and Chouinard, P. Y. (2007b)
‘Effects on essential oils on digestion, ruminal fermentation, rumen microbial populations, milk
production, and milk composition in dairy cows fed alfalfa silage or corn silage’. Journal of Dairy
Science 90: 886-897.
Benchaar, C., Petit, H. V., Berthiaume, R., Whyte, T. D. and Chouinard, P. Y. (2006a) ‘Effects of
addition of essential oils and monensin premix on digestion, ruminal fermentation, milk production, and
milk composition in dairy cows’. Journal of Dairy Science 89: 4352-4364.
Bergman E. N. (1990) Energy contributions of volatile fatty acids from the gastrointestinal tract in
various species. Physiology Review 70:567-90.
Bessa, R. J. B., Santos-Silva, J., Ribeiro, J. M. R. and Portugal, A. V. (2000) Reticulo-rumen
biohydrogenation and the enrichment of ruminants products with linoleic acid conjugated isomers.
Livestock Production Science 63: 201-211.
Bhatti, H.Q., Iqbal, Z., Chatha, S.A.S. and Bukhari, I.H. (2007) Variations in oil potential and chemical
composition of Eucalyptus crebra among different districts of Punjab-Pakistan. International Journal of
Agric. Biology 9: 136–138.
Biljana Damjanović-Vratnica1 , Tatjana Đakov, Danijela Šuković and Jovanka Damjanović (2011)
Antimicrobial Effect of Essential Oil Isolated from Eucalyptus globulus Labill from Montenegro. Journal
of Food Science 29: 277-284
Bleasel, N., Tate, B. and Rademaker, M., (2002) Allergic contact dermatitis following exposure to
essential oils. Australasian Journal of Dermatology 43: 211 – 213.
Bodas, R., Prieto, N., Garcia-Gonzalez, R., Andres, S., Giraldez, F. J. and Lopez, S. (2012)
Manipulation of rumen fermentation and methane production with plant secondary metabolites. Animal
Feed Science and Technology 176: 78-93.
249
Boggs, D.L., Bergen, W.G. and Hawkins, D.R. (1987) Effects of tallow supplementation and protein
withdrawal on ruminal fermentation, microbial synthesis and site of digestion. Journal of Animal Science
80: 609-616.
Borchers, R. (1965) Proteolytic activity of rumen fluid in vitro. Journal of Animal Science 24: 1033-
1038.
Borsting, C. F., Weisbjerg, M. R. and Hvelplund, T. (1992) Fatty acid digestibility in lactating cows fed
increasing amounts of protected vegetable oil, fish oil or saturated fat. Acta Agric Scand Sect A. Animal
Science 42: 148-156.
Brenner, R. R. (1989) Factors influencing fatty acid chain elongation and desaturation. In:
A.J.Vergroesen and M.Crawford, (Eds.), The role of fats in Human Nutrition. pp 46.
Brenner, R. R. and Peluffo, R. O. (1966) Effect of saturated and unsaturated fatty acids on the
desaturation in vitro of palmitic, stearic, oleic, linoleic, and linolenic acids. Journal of Biological
Chemistry 241: 5213-9.
Broderick, G. A. and Balthrop, J. E. (1979) Chemical inhibition of amino acid deamination by ruminal
microbes in vitro. Journal of Animal Science 49: 1101-1111.
Broderick, G. A. and Kang, J. H. (1980) Automated simultaneous determination of ammonia and total
amino acids in ruminal fluid and in vitro media. Journal of Dairy Science 63: 64-75.
Broudiscou, L.P., Cornu, A. and Rouzeau, A. (2007) In vitro degradation and 10 mono and
sesquiterpenes of plant origin by caprine rumen micro-organisms. Journal of the science of Food and
Agriculture 87: 1653-1658.
Bryce M. Buddle, B. M., Denis, M., Attwood, G.T., Altermann, E., Janssen, P.H., Ronimus, R.S.,
Pinares-Patiño, C.S., Muetzel, S. and Wedlock, D.N. (2011) Strategies to reduce methane emissions
from farmed ruminants grazing on pasture. The Veterinary Journal 188: 11-17.
250
Buccioni, A., Decandia, M., Minieri, S., Molle, G. and Cabiddu, A. (2012) Lipid metabolism in the
rumen: New insights on lipolysis and biohydrogenation with an emphasis on the role of endogenous plant
factors. Animal Feed Science and Technology 174: 1-25.
Burdock, G. A. (2002) Fenaroli’s Handbook of Flavour Ingredients. 4th Ed. CRC Press, Boca Raton,
USA.
Burlingame, B., Nishida, C., Uauy, R. and Weisell, R. (1999) Fats and fatty acids in human nutrition-
Joint FAO/WHO expert consultation. Annals of Nutrition and Metabolism 55: 1-308.
Burt, S. (2004) Essential oils: Their antibacterial properties and potential applications in foods-A review.
International Journal of Food microbiology 98: 223-253.
Busquet, M., Calsamiglia, S., Ferret, A. and Kamel, C. (2005a) Effects of cinnamaldehyde and garlic oil
on rumen microbial fermentation in a dual flow continuous culture. Journal of Dairy Science 88: 2508-
2516.
Busquet, M., Calsamiglia, S., Ferret, A. and Kamel, C. (2005c) Screening for the effects of natural plant
extracts and secondary plant metabolites on rumen microbial fermentation in continuous culture. Animal
Feed Science and Technology 123/124: 597–613.
Busquet, M., Calsamiglia, S., Ferret, A. and Kamel, C. (2006) ‘Plant extracts affect in vitro rumen
microbial fermentation’. Journal of Dairy Science 89: 761-771.
Busquet, M., Calsamiglia, S., Ferret, A., Carro, M.D. and Kamel, C. (2005b) Effect of garlic oil and
four of its compounds on rumen microbial fermentation. Journal of Dairy Science 88: 4393–4404.
Busquet, M., Greathead, H., Calsamiglia, S., Ferret, A. and Kamel, C. (2003) Efecto del extracto de ajo
y el cinemaldehido sobre la producción, composición y residuos en leche en vacas de alta producción.
ITEA 24: 756–758.
251
Cabiddu, A., Salis, l., Tweed, J. K. S., Molle, G., Decandia, M. and Lee, M. R. F. (2010) The influence
of plant polyphenols on lipolysis and biohydrogenation in dried forages at different phonological stages:
In vitro study. Journal of the Science of Food and Agriculture 90: 829-835.
Calder, P. C. (2006) n-3 polyunsaturated fatty acids, inflammation and inflammatory diseases. American
Journal of Clinical Nutrition 83: 1505-1519.
Calsamiglia, S., Busquet, M., Cardozo, P. W., Castillejos, L. and Ferret, A. (2007) ‘invited review:
Essential oils as modifiers of rumen microbial fermentation’. Journal of Dairy Science 90: 2580–2595.
Campbell, M. K. (1995) Biochemistry (2nd Ed.) Mount Holyoko College. Saunders College publishing.
Harcourt Brace College Publishers.
Cant, J. P., Fredeen, A. H., Macintyre, T., Gunn, J. and Crowe, N. (1997) Effect of fish oil and
monensin on milk composition in dairy cows. Canadian Journal of Animal Science 77: 125-131.
Cardozo, P. W., Calsamiglia, S., Ferret, A. and Kamel, C. (2004) Effects of natural plant extracts on
protein degradation and fermentation profiles in continuous culture. Journal Animal Science 82:3230–
3236.
Cardozo, P. W., Calsamiglia, S., Ferret, A. and Kamel, C. (2005) Screening for the effects of natural
plant extracts at different pH on in vitro rumen microbial fermentation of a high-concentrate diet for beef
cattle. Journal of Animal Science 83: 2572-2579.
Cardozo, P. W., Calsamiglia, S., Ferret, A. and Kamel, C. (2006) ‘Effects of alfalfa extract, anise,
capsicum and a mixture of cinnamaldehyde and eugenol on ruminal fermentation and protein degradation
in beef heifers fed a high-concentrate diet’. Journal of Animal Science 84: 2801-2808.
Carriquiry, M., Weber, W. J., Baumgard, L. H. and Crooker, B. A. (2008) In vitro biohydrogenation of
four dietary fats. Animal Feed Sceince and Technology 141: 339-355.

252
Carroll, S. M., Depeters, E. J. and Rosenberg, M. (2006) Efficacy of a novel whey protein gel complex
to increase the unsaturated fatty acid composition of bovine milk fat. Journal of Dairy Science 89 (2):
640-650.
Carson, C.F. and Riley, T.V. (1993) Antimicrobial activity of the essential oil of Melaleuca alternifolia.
Letters in Applied Microbiology 16: 49– 55.
Carson, C.F. and Riley, T.V. (2001) Safety, efficacy and provenance of tea tree (Melaleuca alternifolia)
oil. Contact Dermatitis 45: 65– 67.
Carson, C.F., Mee, B.J. and Riley, T.V. (2002) Mechanism of action of Melaleuca alternifolia (tea tree)
oil on Staphylococcus aureus determined by time-kill, lysis, leakage and salt tolerance assays and
electron microscopy. Antimicrobial Agents and Chemotherapy 46 (6), 1914–1920.
Castillejos, L., Calsamiglia, S. and Ferret, A. (2006) Effects of essential oil active compounds on rumen
microbial fermentation and nutrient flow in in vitro systems. Journal of Dairy Science 89: 2649-2658.
Castillejos, L., Calsamiglia, S., Ferret, A. and Losa, R. (2005) Effects of a specific blend of essential oil
compounds and the type of diet on rumen microbial fermentation and nutrient flow from a continuous
culture system. Animal Feed Science and Technology 119: 29-41.
Castillejos, L., Calsamiglia, S., Ferret, A. and Losa, R. (2007) Effects of dose and adaptation time of a
specific blend of essential oil compounds on rumen fermentation. Animal Feed Science and Technology
132: 186-201.
Castillejos, L., Calsamiglia, S., Martin-Tereso, J. and Ter Wijlen, H. (2008) In vitro evaluation of
effects of ten essential oils at three doses on ruminal fermentation of high concentrate feedlot-type diets.
Animal Feed Science and Technology 145: 259-270.
Chalchat, J. C. and Özcan, M. M. (2008) Comparative essential oil composition of flowers, leavesand
stems of basil (Ocimum basilicum L.) used as herb. Food Chemistry 110: 501-503.

253
Chang, H.C., Gage, D.A. and Oriel, P.J. (1995) Cloning and expression of a limonene degradation
pathway from Bacillus stearothermophilus in Escherichia coli. Journal of food Science 60: 551-553.
Chao S. C., Young D. G. and Oberg C. J. (2000) Screening for inhibitory activity of essential oils on
selected bacteria, fungi and viruses. Journal of Essential Oil Research 12: 639–649.
Charai, M., Mosaddak, M. and Faid, M. (1996) Chemical composition and antimicrobial activities of
two aromatic plants: Origanum majorana L. and O. compactum Benth. Journal of Essential Oil Research
8: 657– 664.
Chaves, A. V., He, M. L., Yang, W. Z. Hristov, A. N., McAllister, T. A. and Benchar, C. (2008a) Effects
of essential oils on proteolytic, deaminative and methanogenic activities of mixed ruminal bacteria.
Canadian Journal of Animal Science 88: 117-122.
Chaves, A. V., Stanford, K., Dugan, M. E. R., Gibson, L. L., McAllister, T. A., Van Herk, F. and
Benchaar, C. (2008b) ‘Effects of cinnamaldehyde, garlic and juniper berry essential oils on rumen
fermentation, blood metabolites, growth performance and carcass characteristics of growing lambs’.
Livestock production Science 117: 215-224.
Cheong, T.K. and Oriel, P.J. (2000) Cloning and expression of the limonene hydroxylase of Bacillus
stearothermophilus BR388 and utilization in two-phase limonene conversions. Appl. Biochem.
Biotechnol. 84: 903-915.
Chesworth, J. M., Stuchbury, T. and Scaife, J. R. (1998) An Introduction to Agricultural Biochemistry.
Chapman and Hall, London, UK, PP. 213.
Chikunya, S., Demirel, G., Enser, M., Wood, J. D., Wilkinson, R. G. and Sinclair, L. A. (2004)
Biohydrogenation of dietary n-3 PUFA and stability of ingested vitamin E in the rumen, and their effects
on microbial activity in sheep. British Journal of Nutrition 91: 539-550.
254
Chilliard, Y., Ferlay, A., Mansbridge, R. J. and Doreau, M. (2000) Ruminant milk fat plasticity:
Nutritional control of saturated, polyunsaturated, trans and conjugated fatty acids. Annals de Zootechnie
49: 181-205.
Chilliard, Y., Glasser, F., Ferlay, A., Bernard, L., Rouel, J. and Doreau, M. (2007) Diet, rumen
biohydrogenation and nutritional quality of cow and goat milk fat. European Journal of Lipid Science and
Technology 109: 828-855.
Chion, A. R., Tobacco, E., Giaccone, D., Peiretti, P. G., Battelli, G. and Borreani, G. (2010) Variation
of fatty acid and terpene profiles in mountain milk Toma piemontese cheese as affected by diet
composition in different seasons. Food Chemistry 121: 393-399.
Chizzola, R., Hochesteiner, W. and Hajek, S. (2004) GC analysis of the essential oils in the rumen fluid
after incubation of Thuja orientalis twigs in the Rusitec system. Research in Veterinary Science 76: 77-
82.
Choi, N. J., Enser, M., Wood, J. D. and Scollan, N. D. (2000) Effect of breed on the deposition in beef
muscle and adipose tissue of dietary n-3 polyunsaturated fatty acids. Animal Science 71: 509-519.
Chouinard, P. Y., Girard, V. and Brisson, G. J. (1998) Fatty acid profile and physical properties of milk
fat from cows fed calcium salts of fatty acids with varying unsaturation. Journal of Dairy Science 81:
794-800.
Christie, W.W. (1978) The composition, structure and function of lipids in the tissue of ruminant animals.
Progress in Lipid Research 17: 111-205.
Christie, W.W. (1983) Lipid Analysis, (2nd edition), Pergamon Press, Oxford.
Christie,W.W. (2007) The lipid Library. All about Lipids. http://www.lipidlibrary.co.uk/lipids.html.
Accessed December 25, 2012.
Cimanga, K., Kambu, K., Tona, L., Apers, S., De Bruyne, T., Hermans, N., Totte´, J., Pieters, L., and
lietinck, A.J. (2002) Correlation between chemical composition and antibacterial activity of essential oils
255
of some aromatic medicinal plants growing in the Democratic Republic of Congo. Journal of
Ethnopharmacology 79: 213– 220.
Clarke, S. D. and Jump, D. B. (1994) Dietary polyunsaturated fatty acid regulation of gene transcription.
Annual Review of Nutrition 14: 83-98.
Coates, A. M., Sioutis, S., Buckley, J. D. and Howe, P. R. C. (2009) Regular consumption of n-3 fatty
acid-enriched pork modifies cardiovascular risk factors. British Journal of Nutrition 101: 592-597.
Cobb, T. K. (1992) Effects of dietary stearic acid on plasma cholesterol levels. South Medicine Journal
85: 25-27.
Collins, R. P., Helgadottir, A., Fothergill, M. and Rhodes, I. (2002) Variations amongst survivor
populations of White clover collected from sites across Europe: growth attributes and physiological
responses to low temperature. Annals of Botany 89: 283-292.
Colomer, R., Moreno-Nogueira, J.M., Garcia-Luna, P. P., Garcia-Peris, P., Garcia-de-Lorenzo, A.,
Zaragaga, A., Quecedo, L., del Llano, J., Usan, L. and Casimiro, C. (2007) n-3 fatty acids, cancer and
cachexia: A systematic review of the literature. British Journal of Nutrition 97: 823-831.
Commission Decision of 23 February 1999 adopting a register of flavouring substances used in or on
foodstuffs drawn up in application of Regulation (EC) No 2232/96 of the European Parliament and of the
Council on 28 October 1996. 1999/217/EC: Official Journal L084, 27/03/1999, pp. 1– 137.
Commission Decision of 23 January 2002 amending Commission Decision 1999/217/EC as regards the
register of flavouring substances used in or on foodstuffs. 2002/113/EC: Official Journal L49 20/02/2002,
pp. 1 –160.
Commission Regulation (EC) No 1565/2000 of 18 July 2000 laying down the measures necessary for the
adoption of an evaluation programme in application of Regulation (EC) No 2232/96 of the
256
Commission Regulation (EC) No. 622/2002 of 11 April 2002 establishing deadlines for the submission of
information of chemically defined flavouring substances used in or on foodstuffs: Official Journal L95
12/04/2002, pp. 10–11.
Conner, D.E. and Beuchat, L.R. (1984) Effects of essential oils from plants on growth of food spoilage
yeasts. Journal of Food Science 49: 429– 434.
Connor, W. E., Prince, M. J. and Ullman, D. (1993) The hypotriglyceridemic effect of fish oil in adult-
onset diabetes without adverse glucose control. Annals of The New York Academy of Sciences 683: 337–
340.
Cook, L. J., Scott, T. W., Faichney, G. J., Davies, H. L. and Franklin, M. C. (1972) Fatty acids
interrelationships in plasma, liver, muscle and adipose tissues of cattle fed safflower oil protected from
ruminal biohydrogenation. Lipids 7: 83-88.
Cooper, S. L. (2002) Dietary manipulation of the fatty acid composition of sheep Meat. PhD Dissertation,
Open University, Milton Keynes, Uk.
Cooper, S. L., Sinclair, L. A., Wilkinson, R. G., Hallet, K. G., Enser, M. and Wood J. D. (2004)
Manipulation of the n-3 polyunsaturated fatty acid content of muscle and adipose tissue in lambs. Journal
of Animal Science 82: 1461-1470.
Corl, B. A., Barbano, D.M., Bauman, D. E. and Ip, C. (2003) cis-9, trans-11 CLA derived endogenously
from trans-11 18:1 reduces cancer risk in rats. Journal of Nutrition 133: 2893-2900.
Corl, B. A., Baumgard, L. H., Dwyer, D. A., Griinari, J. M., Phillips, B. S. and Bauman, D. E. (2001)
The role of Δ-⁹desaturase in the production of cis-9, trans-11 CLA. Journal of Nutritional Biochemistry
12: 622-630.
257
Corretti, M. C., Plontnick, G. D. and Vogel, R. A. (1995) Correlation of cold-pressor and flow-mediated
brachial artery diameter responses with the presence of coronary artery disease. American Journal of
Cardiology 75: 783-787.
Cosentino, S., Tuberoso, C.I.G., Pisano, B., Satta, M., Mascia, V., Arzedi, E. and Palmas, F. (1999) In
vitro antimicrobial activity and chemical composition of Sardinian Thymus essential oils. Letters in
Applied Microbiology 29: 130–135.
Counotte, G., H. M., Prins, R. A., Janssen, R. H. A. M. and deBie, M. J. A. (1981) The role of
Megasphaera elsdenii in the fermentation of D,L-(2-ᶦᶟC)-lactate in the rumen of dairy cattle. Applied
Environmental Microbiology 42: 649-655.
Cowan, M. M. (1999) Plant products as antimicrobial agents. Clinical Microbiology Reviews 12: 564-
582.
Cox, S. D., Mann, C. M. and Markam, J. L. (2001) Interactions between components of the essential oil
of Melaleuca alternifolia. Journal of Applied Microbiology 91: 492-497.
Cox, S. D., Mann, C. M., Markham, J. L., Bell, H. C., Gustafson, J. E., warmington, J. R. and Wyllie,
S.G. (2000) The mode of antimicrobial action of essential oil of Melaleuca alternifolia (tea tree oil).
Journal of Applied Microbiology 88: 170-175.
Crane, A., Nelson, W.O. and Brown, R.E. (1957) Effects of D-limonene and a-D-pinene on in vitro
carbohydrate dissimilation and methane formation by rumen bacteria. Journal of Dairy Science 40: 1317–
1323.
Crosthwaite, D. (1998) UK trade within the flavour and fragrance industry. International Federation of
Essential Oils and Aroma Trades—21st International Conference on Essential Oils and Aroma’s. IFEAT,
London, pp. 6 –12.
Crumb, D. J. (2011) Conjugated linoleic acid (CLA) – an overview. International Journal of Applied
Research in Natural Products 4: 12-18.

258
Czerkawski, J. W. (1972) Fate of metabolic hydrogen in the rumen. Proceedings of the Nutrition society
31: 141-146.
Danh, L.T., Ngo D. A. T., Le Thi Ngoc Hana, Jian Zhaoa, Raffaella Mammucari and Neil F. (2012)
Antioxidant activity, yield and chemical composition of lavender essential oil extracted by supercritical
CO2. Journal of Supercritical Fluids 70: 27–34.
Davidson, P.M. (1997) Chemical preservatives and natural antimicrobial compounds. In: Doyle, M.P.,
Beuchat, L.R., Montville,T.J. (Eds.), Food Microbiology: Fundamentals and Frontiers.ASM,
Washington, pp. 520–556.
Davidson, P.M. and Parish, M.E. (1989) Methods for testing the efficacy of food antimicrobials. Food
Technology 43:148–155.
Davidson, P.M., and Naidu, A.S. (2000) Phyto-phenols. In: A. Naidu (Ed). Natural Food Antimicrobial
Systems, .CRC Press, Boca Raton, FL. Pages 265-293.
Dawson, R. M. C. and Kemp, P. (1969) ‘The effect of defaunation on the phospholipids and on the
hydrogenation of unsaturated fatty acids in the rumen’. The Biochemical Journal 115: 351-352.
Dawson, R.M.C., Hemintong, N. and Hazelewood, G.P. (1977) ‘On the role of higher plants and
microbial lipases in the ruminal hydrolysis of grass lipids’. British Journal of Nutrition 38: 225-232.
De Gees, H., Steinfeld, H. and Blackburn, H. D. (1997) Livestock and the Environment: Finding a
balance. European Commission.
De Lorgeril, M., Salen, P., Martin, J.L., Monjaud, I., Delaye, J. and Mamelle, N. (1999) Mediterranean
diet, traditional risk factors, and the rate of cardiovascular complications after myocardial infarction:
Final report of the Lyon Diet Heart Study. Circulation 99: 779–785.
De Smet, S. (2012) Meat, poultry, and fish composition: Strategies for optimizing human intake of
essential nutrients. Animal Frontiers 2: 10–16
259
de Veth, M. J., Gulati, S. K., Luchini, N. D. and Bauman, D. E. (2005) Comparison of calcium salts and
formaldehyde-protected conjugated linoleic acid in inducing milk fat depression. Journal of Dairy
Science 88: 1685-1693.
Dean S. G. and Ritchie, G. (1987) Antibacterial properties of plant essential oils. International Journal of
Food Microbiology 5: 165–180.
Dehority, B. A. (2003) Rumen Microbiology. Nottingham University press, Nottingham, UK.
Delaquis, P.J., Stanich, K., Girard, B. and Mazza, G. (2002) Antimicrobial activity of individual and
mixed fractions of dill, cilantro, coriander and eucalyptus essential oils. International Journal of Food
Microbiology 74: 101–109.
Demeyer, D. I. and Van Nevel, C. J. (1995) Transformations and effects of lipids in the rumen: Three
decades of research at Ghent University. Archive of Animal Nutrition 48: 119-134.
Demirel, G., Wachira, A. M., Sinclair, L. A., Wilkinson, R. G., Wood, J. D. and Enser, M. (2004)
Effects of dietary n-3 polyunsaturated fatty acids, breed and dietary Vitamin E on the fatty acids of lamb
muscle, liver and adipose tissue. British Journal of Nutrition 91: 551-565.
Denyer, S.P. and Hugo, W.B. (1991) Mechanisms of antibacterial action—A summary. In: Denyer, S.P.,
Hugo, W.B. (Eds.),Mechanisms of Action of Chemical Biocides. Blackwell, Oxford, pp. 331–334.
Department of Health (1994) Nutritional Aspects of Cardiovascular Disease. Report on Health and social
subjects, number 46. London: H. M. Stationery Office.
Devillard, E., Mclntosh, F. M., Newbold, C. J. and Wallace, R. J. (2006) ‘Rumen ciliate protozoa
contain high concentrations of conjugated linoleic acids and VA, yet do not hydrogenate linoleic acid or
desaturate stearic acid’. The British Journal of Nutrition 96: 697-704.
Dewhurst, R. J. and Scollan, N. D. (1997) The fatty acid composition of grazed and conserved grass. In:
New meats. The potential of animal diets to change meat quality. A review of MAFF Research, 20
November 1997, University of Bristol.
260
Dewhurst, R. J., Evans, R. T., Scollan, N. D., Moorby, J. M., Merry, R. J. and Wilkins, R. J. (2003)
Comparison of grass and legume silages for milk production 2 In vivo and in sacco evaluations of rumen
function. Journal of Dairy Science 86: 2612-2621.
Dewhurst, R. J., Shingfield, K. J., Lee, M. R. F. and Scollan, N. D. (2006) ‘Increasing the
concentrations of beneficial polyunsaturated fatty acids in milk produced by dairy cows in high-forage
systems’. Animal feed Science and Technology 131: 168-206.
Doege, H. and Stahl, A. (2006) Physiology (Bethesda) 21: 259-268.
Dohme, F., Fievez, V., Raes, K. and Demeyer, D. I. (2003) Increasing levels of two different fish oils
lower ruminal biohydrogenation of eicosapentaenoic and docosahexaenoic acid in vitro. Animal Research
52: 309-320.
Donadio, J. V., Bergstralh, E. J. Jr., Offord, K. P., Spencer, D. C. and Holley, K. E. (1994) A controlled
trial of fish oil in IgA nephropathy. Mayo Nephrology Collaborative Group. The New England Journal of
Medicine 331: 1194–1199.
Doreau, M. and Chilliard, Y. (1997) Digestion and metabolism of dietary fat in farm animals. British
Journal of Nutrition 78 (Suppl.1): S15-S30.
Doreau, M. (1992) Effect of supplementation with hydrogenated fish oil on digestion in cows. Ann.
Zootech 41: 134-143.
Doreau, M., and Ferlay, A. (1994) Digestion and utilization of fatty-acids by ruminants. Animal Feed
Science and Technology 45:379-396.
Dorman, H. J. D. and Deans, S. G. (2000) Antimicrobial agents from plants: antibacterial activity of
plant volatile oils. Journal of Applied Microbiology 88: 308-316.
Dowhan, W., Bogdanov, M. and and Mileykovskaya, E. (2008) Functional roles of lipids in
membranes. In: D. E. Vance and J. E. Vance (edited). Biochemistry of Lipids, Lipoproteins and
Membranes (5th Edition), pp. 1-37, Elsevier Science.
261
Dung, N. T., Kim, J. M. and Kang, S. C. (2008) Chemical composition, antimicrobial and antioxidant
activities of the essential oil and the ethanol extract of Cleistocalyx operculatus (Roxb.) Merr and Perry
buds. Food Chemical and Toxicology 46: 3632-3639.
Dunne, P. G., Rogalski, J., Childs, S., Monahan, F. J., Kenny, D. A. and Moloney, A. P. (2011) Long
chain n-3 polyunsaturated fatty acid concentration and colour and lipid stability of muscle from heifers
offered a ruminally protected fish oil supplement. Journal of Agricultural and Food Chemistry 59: 5015-
5025.
Durmic Z., McSweeney C. S., Kemp G. W., Hutton P., Wallace R. J. and Vercoe P. E. (2008) Australian
plants with potential to inhibit bacteria and processes involved in ruminal biohydrogenation of fatty acids.
Animal Feed Science and Technology 145: 271–284.
Eburu, P. O. and Chikunya, S. (2014) Effects of Fifteen Compounds from Essential Oil Extracts on the
Metabolism of Polyunsaturated Fatty Acids by Rumen Microorganisms in vitro. Advances in Animal
Biosciences, 5 (1), 78.
Eburu, P. O. and Chikunya, S. (2015a) Effects of ten whole essential oils on rumen fermentation and
biohydrogenation of n-3 polyunsaturated fatty acids by rumen microorganisms in vitro. Advances in
Animal Biosciences, 6 (1), pp. 203.
Eburu, P. O. and Chikunya, S. (2015b) The effects of graded doses of 4-allylanisole, anethole, anise oil
and cassia oil on fermentation and biohydrogenation of n-3 polyunsaturated fatty acids by rumen
microorganisms in vitro. Advances in Animal Biosciences 6 (1), pp. 204.
Ekeren, P.A., Smith, D.R., Lunt, D.K. and Smith, S.B. (1992) Ruminal biohydrogenation of fatty acids
from high-elate sunflower seeds. Journal of Animal Science 70: 2574-80.
262
Elaissi, A., Karima, H. S, Samia, M, Khouja, M. L., Rachid, C. and Fethia, H (2011) Antibacterial
activity and chemical composition of 20 Eucalyptus species’ essential oils. Journal of Food Chemistry
129: 1427–1434.
Elmeddah, Y., Doreau, M. and Michalet-Doreau, B. (1991) Interaction of lipid supply and carbohydrates
in the diet of sheep with digestibility and ruminal digestion. Journal of Agricultural Science 116: 437-
445.
Enjalbert, F., Moncoulan, R., Vernay, M. and Griess, D. (1994) Effects of different forms of
polyunsaturated fatty acids on rumen fermentation and total nutrient digestibility of sheep fed prairie hay
based diets. Small Ruminant Research 14: 127-135.
Enjalbert, F., Nicot, M. C., Bayourthe, C., Vernay, M. and Moncoulan, R. (1997) Effects of dietary
calcium soaps of unsaturated fatty acids on digestion, milk composition and physical properties of butter.
Journal of dairy Research 64: 181-195.
Enser, M. (1984) The Chemistry, Biochemistry and Nutritional importance of animal fats. In: J.Wiseman
(Ed.) .Fats in Animal Nutrition. Butterworths London, Pp 329.
Enser, M., Hallette, K., Hewette, B., Fursey, G. A. J. and Wood, J. D. (1996) Fatty acid content and
composition of English beef, lamb and pork at retail. Meat science 42: 443-456.
Enser, M., Hallette, K., Hewette, B., Fursey, G. A. J., Wood, J. D. and Harrington, G. (1998) Fatty acid
content and composition of beef and lamb muscle in relation to production system and implications for
human nutrition. Meat science 49: 329-341.
European Parmacopoeia of the council of Europe (2005) 5th edition, 5.0, 5.1-5.8., Strasbourg, France (EP
5).
Evans, J.D. and Martin, S.A. (2000) Effects of thymol on ruminal micro-organisms. Current
Microbiology 41: 336–340.
263
Eyster, K. M. (2007) The membrane and lipids as integral participants in signal transduction: lipid signal
transduction for the non-lipid biochemist. Advances in Physiology Education 31, 5-16.
Fahy, E., Cotter, D., Sud, Manish and Subramaniam S. (2011) Lipid Classification, Structures and
tools. Biochimica et Biophysica Acta 1811: 637-647.
Fahy, E., Subramaniam, S., Alex Brown, H., Glass, C. K., Merrill, A. H., Murphy, R. C., Raetz, C. R.
H., Russell, D. W., Seyama, Y., Shaw, W., Shimizu, T., Spener, F., van Meer, G., VanNieuwenhze, M.
S., White, S. H., Witztum, J. L. and Dennis, E. A. (2005) A comprehensive classification system for
lipids. Journal of Lipid Research 46: 839-862.
Fahy, E., Subramaniam, S., Murphy, R. C., Nishijima, M., Raetz, C. R. H., Shimizu, T., Spener, F.,
van Meer, G., Wakelam, M. J. O. and Dennis, E. A. (2009) Update of the LIPID MAPS comprehensive
classification system for lipids. Journal of Lipid Research 50(s): S9-S14.
Faichney, G. J., Davies, H. L., Scott, T. W. and Cook, L. J. (1972) The incorporation of linoleic acid into
the tissues of growing steers offered a dietary supplement of formaldehyde-treated casein-safflower oil.
Australian Journal of biological Sciences 25: 205-212.
Faichney, G. J., Scott, T. W. and Cook, L. J. (1973) The utilization of growing lambs of a casein-
safflower oil supplement treated with formaldehyde. Australian Journal of biological Sciences 26: 1179-
1188.
Fandino, I., Calsamiglia, S., Ferret, A. and Blanch, M. (2008) Anise and capsicum as alternatives to
monensin to modify rumen fermentation in beef heifers fed a high concentrate diet. Animal Feed Science
and Technology 145: 409-417.
Fay, J. P., Jackober, K. D., Cheng, K-J. and Costerton, J. W. (1990) Esterase activity of pure cultures of
rumen bacteria as expressed by the hydrolysis of p-nitrophenylpalmitate. Canadian Journal of
Microbiology 36: 585-589.
264
Fearon, A.M., Mayne, C.S., Beattie, J.A.M. and Bruce, D.W. (2004) Effect of level of oil inclusion in
the diet of dairy cows at pasture on animal performance and milk composition properties. Journal of the
Science of Food and Agriculture 84: 497–504.
Feldberg, R. S., Chang, S. C., Kotik, A. N., Nadler, M., Neuwirth, Z., Sundstrom, D. C. and Thompson,
N. H. (1998) In vitro mechanism of inhibition of bacterial cell growth by allicin. Antimicrobial Agents
and Chemotherapy 32: 1763-1768.
Ferlay, A., Chabrot, J. Elmeddah, Y. and Doreau, M. (1993) Ruminal lipid balance and intestinal
digestion by dairy cows fed calcium salts of rapeseed oil. Journal of Animal Science 71: 2237-2245.
Feskens, E.J.M., Virtanen, S.M., Rasanen, L., Tuomilehto, J., Stengard, J., Pekkanen, J., Nissinen, A.
and Kromhout, D. (1995) Dietary factors determining diabetes and impaired glucose tolerance- a 20-year
follow-up of the Finnish and Dutch cohorts of the 7-countries study. Diabetes Care 18: 1104-1112.
Fievez, V., Vlaeminck, B., Jenkins, T., Enjalbert, F. and Doreau, M. (2007) Assessing rumen
biohydrogenation and its manipulation in vivo, in vitro and in situ. European Journal of Lipid science and
Technology 109: 740-756.
Folch, J., Lees, M. and Stanley, G.H.S. (1957) A simple method for the isolation and purification of
lipids from animal tissues. Journal of Biological Chemistry 226: 497-509.
Food and Agricultural Organization (2009) The State of Food and Agriculture. Livestock in balance,
Rome, Italy (2009), pp. 1–164 (http://www.fao.org/docrep/012/i0680e/i0680e.pdf)
Fotouhi, N. and Jenkins, T. C. (1992a) Resistance of fatty acyl amides to degradation and hydrogenation
by ruminal microorganisms. Journal of Dairy Science 75: 1527-1532.
Fotouhi, N. and Jenkins, T. C. (1992b) Ruminal biohydrogenation of linoleoyl methionine and calcium
linoleate in sheep. Journal of Animal Science 70: 3607-14.
265
Franklin, S. T., Martin, K. R., Baer, R. J., Schingoethe, D. J. and Hippen, A. R. (1999) Dietary marine
algae (Schizochytrium sp.) increases concentrations of conjugated linoleic , docosahexaenoic and trans
vaccenic acids in milk of dairy cows. Journal of Nutrition 129: 2048-2054.
French, P., Stanton, C., Lawless, F., O 'Riordan, E.G., Monahan, F.J., Caffrey, P.J. and Moloney,
A.P. (2000) Fatty acid composition, including conjugated linoleic acid, of intramuscular fat from steers
offered grazed grass, grass silage or concentrate-based diets. Journal of Animal Science 78:2849–2855.
Funahashi, H., Satake, M., Hasan, S., Sawai, H., Reber, H. A. and Hines, O. J. (2006) The n-3
polyunsaturated fatty acid EPA decreases pancreatic cancer cell growth in vitro. Pancreas 33: 462-462.
Garrett, W. N., Yang, Y. T., Dunkley, W. L. and Smith, L. M. (1976) Increasing the polyunsaturated fat
content of beef and lamb. Journal of Animal Science 42: 845-853.
Garton, G. A., Hobson, P.N. and Lough, A.K. (1958) Lipolysis in the rumen. Nature 182: 1511-1512.
Gershenzon, J. and Croteau, R. (1991) Terpenoids. In: G.A. Rosenthal, and M.R. Berenbaum, (eds.)
Herbivores: Their interactions with Secondary Plant Metabolites, 1st edition, Academic Press, San
Diego, CA. Pp. 165-219.
Gerson, T., John, A. and King, S. D. (1985) The effects of dietary starch and fibre on the in vitro rates of
lipolysis and hydrogenation of sheep rumen digesta. Journal of Agricultural Science (Camb.) 105: 27-30.
Gerson, T., John, A. and King, S. D. (1986) Effects of feeding ryegrass of varying maturity on the
metabolism and composition of lipids in the rumen of sheep. Journal of Agricultural Science (Camb.)
106: 445-448.
Gerson, T., John, A. and Sinclair, B. R. (1983) The effect of dietary N on in vitro lipolysis and fatty acid
hydrogenation in rumen digesta from sheep fed diets high in starch. Journal of Agricultural Science
(Camb.) 101: 97-101.
Gerson, T., King, A. S. D., Kelly, K. E. and Kelly, W. J. (1988) Influence of particle size and surface area
on in vitro rates of gas production, lipolysis of triglycerols and hydrogenation of linoleic acid by sheep
rumen digesta or Ruminococcus flavefaciens. Journal of Agricultural Science 110: 31-37.
266
Gill, A.O., Delaquis, P., Russo, P. and Holley, R.A. (2002) Evaluation of antilisterial action of cilantro
oil on vacuum packed ham. International Journal of Food Microbiology 73, 83– 92.
Gilliland, T. J., Barrett, P.D., Mann, R. L., Agnew, R. E. and Fearon, A. M. (2002) Canopy
Morphology and nutritional quality traits as potential value indicators for Lolium perenne varieties.
Journal of Agricultural Science 139: 257-273.
Giordani, R., Regli, P., Kaloustian, J., Mikail, C., Abou, L. and Portugal, H. (2004) Antifungal effect
of various essential oils against Candida albicans. Potentiation of antifungal action of Amphotericin B by
essential oil from Thymus vulgaris. Phytotherapy Research 18: 990-995.
Givens, D. I. (2005) The role of animal nutrition in improving the nutritive value of animal-derived foods
in relation to chronic disease. The proceedings of the Nutrition Society 64: 395-402.
Givens, D. I. and Gibbs, R.A. (2006) Very long chain n-3 polyunsaturated fatty acids in the food chain in
the UK and the potential of animal-derived foods to increase intake. Nutrition Bulletin 31: 104-110.
Givens, D. I., Cottrill, B. R., Davies, M., Lee, P. A., Mansbridge, R. J. and Moss, A. R. (2001) Sources
of n-3 polyunsaturated fatty acids additional to fish oil for livestock diets-a review. Nutrition abstract
review series B 71: 55R-83R.
Gladine, C., Rock, E., Morand, C., Bauchart, D. and Durand, D. (2007) Bioavailability and antioxidant
capacity of of plant extracts rich in polyphenols, give as a single acute dose, in sheep made highly
susceptible to lipoperoxidation. British Journal of Nutrition 98: 691-701.
Glasser, F., Ferlay, A. and Chiliiard, Y. (2008) Oilseed lipid supplements and fatty acid composition of
cow milk: a meta-analysis. Journal of Dairy Science 91: 4687-4703.
Goel, G., Puniya, A. K., Aguliar, C. N. and Singh, K. (2005) Interaction of gut microflora with tannins in
feeds. Naturwissenschaften 92: 497-503.
Goering, K. and Van Soest, P.J. (1979) Forage fiber analysis. Agriculture handbook 379, US Department
of Agriculture. Jacket No. 387-598.
267
Gonthier, C., Mustafa, A. F., Ouellet, D. R., Chouinard, P. Y., Berthiaume, R. and Petit, H. R. (2005)
Feeding micronized and extruded flaxseed to dairy cows: effects on blood parameters and milk fatty acid
composition. Journal of Dairy Science 88: 748-756.
Gonzalez, M.J. (1995) Fish oil, lipid peroxidation and mammary tumor growth. Journal of the American
College of Nutrition 14: 325-335.
Graber, R., Sumida, C. and Nunez, E. A. (1994) Fatty acids and cell signal transduction. Journal of Lipid
Mediators and Cell Signalling 9: 91-116.
Greathead, H. (2003) Plants and plant extracts for improving animal productivity. Proceedings of the
Nutrition Society 62: 279-290.
Griffin, S. G., Wyllie, S. G., Markham, J. L. and Leach, D. N. (1999) The role of structure and molecular
properties of terpenoids in determining their antimicrobial activity. Flavour and Fragrance Journal 14:
322-332.
Griinari, J. M., Corl, B. A., Lacy, S. H., Chouinard, P.Y., Nurmela, K. V. V. and Bauman, D. E. (2000)
Conjugated linoleic acid is synthesized endogenously in lactating dairy cows by Δ-⁹ desaturase. Journal
of Nutrition 130: 2285-2291.
Grummer, R. R., Hatfield, M. L. and Dentine, M. R. (1991) Acceptability of fat supplements in four
dairy herds. Journal of Dairy Science 73: 852-857.
Grummer, R.R. (1988) Influence of prilled fat and calcium salt of palm oil fatty acids on ruminal
fermentation and nutrient digestibility. Journal of Dairy Science 71: 117-123.
Grundy, S. M. (1994) Influence of stearic acid on cholesterol metabolism relative to other long-chain
fatty acids. American Journal of Clinical Nutrition 60: 9865-990S (Suppl.).
Guenther, E. (1948) The Essential Oils. D. Van Nostrand, New York.
Gulati, S. K., May, C., Wynn, P. C. and Scott, T. W. (2002) Milk fat enriched in n-3 fatty acids. Animal
Feed Science and Technology 98: 143-152.
268
Gulati, S. K., Scott, T. W. and Ashes, J. R. (1997) In vitro assessment of fat supplement for ruminants.
Animal Feed Science and Technology 64: 127-132.
Gunal, M., Ishlak, A. and Aboghazaleh, A. A. (2013) Evaluating the effects of six essential oils on
fermentation and biohydrogenation in in vitro rumen batch cultures. Journal of Animal Science 558: 243-
252.
Gurr, M.I. and Harwood, J.L. (1991) Lipid Biochemistry: An Introduction, 4th edition, Chapman and
Hall, London.
Gurr, M.I. and Harwood, J.L. (1996) Lipid Biochemistry: An Introduction, 4th edition, Chapman and
Hall, London.
Gurr, M.I. and Harwood, J.L. and Keith, N.F. (2002) Lipid Biochemistry: An Introduction, 5th edition,
Chapman and Hall, London.
Gustafson, J. E., Liew, Y. C., Chew, S., Markham, J. L., Bell, H. C., Wyllie, S. G. and warmington, J.R.
(1998) Effects of tea tree oil on Escherichia coli. Letters in Applied Microbiology 26: 194-198.
Harfoot, C. G. (1978) Lipid metabolism in the rumen. Progress in Lipid Research 17:21-54.
Harfoot, C. G. and Hazlewood, G. P. (1988) ‘Lipid metabolism in the rumen’. In: the rumen microbial
ecosystem (Eds. P.N. Hobson and C.S. Stewart), Pp. 285-322. Elsevier Science Publishing, New York,
NY.
Harfoot, C. G. and Hazlewood, G. P. (1997) Lipid metabolism in the rumen. In: The rumen Microbial
Ecosystem (Ed. P.N. Hobson and C.S. Stewart), Chapman and Hall. London. pp. 382-426.
Harfoot, C. G., Noble, R. C. and Moore, J. H. (1973) Food particles as a site for biohydrogenation of
unsaturated fatty acids in the rumen. Biochemical Journal 132: 829-832.
Harpaz, S., Glatman, L., Drabkin, V. and Gelman, A. (2003) Effects of herbal essential oils used to
extend the shelf life of freshwater reared Asian sea bass fish (Lates calcarifer). Journal of Food
Protection 66: 410-417.
269
Harris, W. S. (1997) n-3 Fatty acids and serum lipoproteins: Animal studies. American Journal of
Clinical Nutrition 65 (s): 1611S-1616S.
Harris, W. S., Mozaffarian, D., Lefevre, M., Toner, C. D., Colombo, J., Cunnane, S. C., Holden, J. M.,
Klurfeld, D. M., Morris, M. C. and Whelan, J. (2009) Towards establishing dietary reference intakes for
eicosapentaenoic and docosahexaenoic acids. Journal of Nutrition 139: 804-819.
Hart, K.J., Yanez-Ruiz, D.R., Duval, S.M., McEwan, N.R. and Newbold, C.J. (2008) ‘Plant extract to
manipulate rumen fermentation’. Animal Feed Science and Technology 147: 8-35.
Hartmans, K.J., Diepenhorst, P., Bakker, W. and Gorris, L.G.M. (1995) The use of carvone in
agriculture: sprout suppression of potatoes and antifungal activity against potato tuber and other plant
diseases. Industrial Crops and Products 4: 3 –13.
Harvatine, K. J. and Allen, M. S. (2006) Effects of fatty acid supplements on milk yield and energy
balance of lactating dairy cows. Journal of Dairy Science 89: 1081-1091.
Hawke, J. C. (1973) Lipids. In: Chemistry and Biochemistry of herbage (G. W. Butler and R. W. Biley,
Eds), Academic Press, London and New York. Pp. 213-263.
Hazlewood, G. P. and Dawson, R. M. C. (1975) Isolation and properties of a phospholipid-hydrolysing
bacterium from ovine rumen fluid. Journal of General Microbiology 89: 163-174.
Heguy, J., Juchem, S., DePeters, E., Rosenberg, M., Santos, J. and Taylors, S. (2006) Whey protein gel
composites of soybean and linseed oils as a dietary method to modify the unsaturated fatty acid
composition of milk lipids. Animal Feed Science and Technology 131: 370-388.
Helander, I. M., Alakomi, H. L., Latva-kala, K., Matilla-Sandholm, T., Pol, I., Smid, E. J., Gorris, L.
G. M. and Von Wright, A. (1998) Characterization of the action of selected essential oil components on
Gram-negative bacteria. Journal of Agricultural and Food Chemistry 46: 3590-3595.
Henderson, C. (1971) A study of the lipase of Anaerovibrio lipolytica: a rumen bacterium. Journal of
General Microbiology 65: 81-89.
270
Henderson, L., Gregory, J., Irving, K. and Swan, G. (2003) The National Diet and Nutrition Survey:
adults aged 19 to 64 years. Vol. 2: Energy, Protein, Carbohydrate, Fat and Alcohol Intake. The Stationary
Office, London.
Hervas, G., Frutos, P., Serrano, E., Mantecon, A. R. and Giraldez, F. J. (2000) Effect of tannic acid on
rumen degradation and intestinal digestion of treated soya bean meals in sheep. Journal of Agricultural
Science 135: 305-310.
Heyen, U. and Harder, J. (1998) Cometabolic isoterpinolene formation from isolimonene by denitrifying
Alcaligenes defragrans. FEMS Microbiology letter 169: 67-71.
Hogan, J. P. and Hogan, R. M. (1976) The evaluation of formaldehyde-treated sunflower seed-casein
supplement as a source of linoleic acid for ruminant lipids. Australian Journal of Agricultural Research
27: 129-138.
Holley, R. A. and Patel, D. (2005) Improvement in shelf-life and safety of perishable foods by plant
essential oils and smoke antimicrobials. Food Microbiology 22: 273-292.
Holman, R. T. (1998) The slow discovery of the importance of omega-3 essential fatty acids in human
health. Journal of Nutrition 128: 427S-33S.
Holman, R. T., Johnson, S. B. and Hatch, T. F. (1982) A case of human linolenic acid deficiency
involving neurological abnormalities. American Journal of Clinical Nutrition 35: 617-623.
Hristov, A., Ivan, M., Neill, L. and McAllister, T. (2003) Evaluation of several potential bioactive agents
for reducing protozoal activity in vitro. Animal Feed Science and Technology 105: 163-184.
Hudson, J. A., Cai, Y., Corner, R. J., Morvan, B. and Joblin, K. N. (2000) Identification and
enumeration of oleic acid and linoleic acid hydrating bacteria in the rumen of sheep and cows. Journal of
Applied Microbiology 88: 286-292.
Hudson, J. A., Morvan, B. and Joblin, K. A. (1998) Hydration of linoleic acid by bacteria isolated from
ruminants. FEMS Microbiology Letters 169: 277-282.
271
Hungate, R. E. (1996) The rumen and its microbes. New York academic press, New York, NY, USA.
Hungate, R.E. (1967) Hydrogen as an intermediate in the rumen fermentation. Archives für
Mikrobiologie, 59: 158–164.
Huws, S. A., Lee, M. R. F., Muetzel, S. M., Scott, M. B., Wallace, R. J. and Scollan, N. D. (2011)
Forage type and fish oil cause shifts in rumen bacterial diversity. FEMS Microbiology Ecology 73: 396-
407.
Huws, S. A., Lee, M. R. F., Muetzel, S. M., Wallace, R. J. and Scollan, N. D. (2006) Effect of forage
type and level of fish oil inclusion on bacterial diversity in the rumen. Reproduction, Nutrition and
Development 46(S1): S99.
Hylemon, P.B. and Harder, J. (1999) Biotransformation of monoterpenes, bile acids, and other
isoprenoids in anaerobic ecosystems. FEMS Microbiology Review 22:475-488.
Igarashi, M., DeMar Jr, J. C., Ma, K., Chang, L., Bell, J. M. and Rapoport, S. I. (2007) Upregulated
liver conversion of alpha-linolenic acid to docosahexaenoic acid in rats on a 15 week n-3 PUFA-deficient
diet. Journal of Lipid Research 48: 152-164.
Ilsley, S., Miller, H., Greathead, H. and Kamel, C. (2002) Herbal sow diets boost pre-weaning growth.
Pig Progress 18: 8 –10.
Inis, S.M. (2003) Perinatal Biochemistry and Physiology of Polyunsaturated fatty acids. Journal of
Pediatrics 143: S1-8.
IUPAC-IUB Commission on Biochemical Nomenclature (CBN) (1977) The nomenclature of lipids
(recommendations 1976). European Journal of Biochemistry 79: 11–21.
Jenkins, T. C. (1993) Lipid metabolism in the rumen. Journal of Dairy Science 76: 3851-3863.
Jenkins, T. C. (1995) Butylsoyamide protects soybean oil from ruminal biohydrogenation: Effects of
butylsoyamide on plasma fatty acids and nutrient digestion in sheep. Journal of Animal Science 73: 818-
823.
272
Jenkins, T. C. (1997) Thies: plasma fatty acids in sheep fed hydroxyethylsoyamide, a fatty acyl amide
that resists biohydrogenation. Lipids 32: 173-178.
Jenkins, T. C. (1998) Fatty acid composition of milk from Holstein cows fed oleamide or high-oleic
canola oil. Journal of Dairy Science 81: 794-800.
Jenkins, T. C. and Bridges, W. C. Jr. (2007) Protection of fatty acids against ruminal biohydrogenation
in cattle. European Journal of Lipid Science and Technology 109: 778-789.
Jenkins, T. C. and Palmquist, D.L. (1984) Effects of fatty acids or calcium soaps on rumen and total
nutrient digestibility of dairy rations. Journal of Dairy Science 55: 957.
Jenkins, T. C., Aboghazaleh, A. A., Freeman, S. and Thies, E. J. (2006) The production of 10-
hydroxystearic and 10-ketostearic acids is an alternative route of oleic acid transformation by the ruminal
microbiota in cattle. The Journal of Nutrition 136: 926-931.
Jenkins, T. C., Bateman, H. G. and Block, S. M. (1996) Butylsoyamide increases unsaturation of fatty
acids in plasma and milk of lactating dairy cows. Journal of dairy Science 79: 585-590.
Jenkins, T. C., Wallace, R. J., Moate, P. J. and Mosley, E. E. (2008) Board-invited review: ‘Recent
advances in biohydrogenation of unsaturated fatty acids within the rumen microbial ecosystem’. Journal
of Animal Science 86: 397-412.
Jensen, R.G. (2002) The composition of Bovine milk lipids: January 1995to December 2000. Journal of
Dairy Science 85: 295-350.
Jerkovic, I., Mastelic, J. and Milos, M. (2001) The impact of both the season of collection and drying on
the volatile constituents of Origanum vulgare L. ssp. hirtum grown wild in Croatia. International Journal
of Food Science and Technology 36: 649– 654.
Johnson, K.A. and Johnson, D.E. (1995) Methane emission from cattle. Journal of Animal Science 73:
2483.
273
Jouany, J. P. (1996) Effect of rumen protozoa on nitrogen utilization by ruminants: altering ruminal
nitrogen metabolism to improve protein utilization. Journal of Nutrition 126: 1335S-1346S.
Jouany, J. P. and Morgavi, D. P. (2007) Use of ‘natural’ products as alternative to antibiotic feed
additives in ruminant production. Animal 1: 1443-1466.
Juliano, C., Mattana, A. and Usai, M. (2000) Composition and in vitro antimicrobial activity of the
essential oil of Thymus herba-barona Loisel growing wild in Sardinia. Journal of Essential Oil. 12:516-
522.
Juven, B.J., Kanner, J., Schved, F. and Weisslowicz, H. (1994) Factors that interact with the
antibacterial action of thyme essential oil and its active constituents. Journal of Applied Bacteriology 76:
626– 631.
Kalemba, D., Matla, M. and Smetek, A. (2012) Antimicrobial activities of Essential oils. In: Dietary
Phytochemicals and Microbes (Ed. Patra, A. K.), pp. 157-183.
Kamel, C., Greathead, H.M.R., Tejido, M.L., Ranilla, M.J. and Carro, M.D. (2008) Effects of allicin
and diallyl disulfide on in vitro rumen fermentation of a mixed diet. Animal Feed Science and Technology
145:351–363.
Kamra, D.N., Pawar, M. and Singh, B. (2012) Manipulation of Ruminal Biohydrogenation by the Use of
Plants Bioactive Compounds. In: Dietary Phytochemicals and Microbes, (Ed., Patra, A.K.), Springer, PP
351-370.
Karen E. H. (2002) A Comparative Study on Turpentine Oils of Oleoresins of Pinus sylvestris L. from
Three Districts of Denizli. Research Triangle Park, North Carolina 27709 February 2002.
Kay J. K., Mackle T. R., Auldist M. J., Thomson N. A. and Bauman D. E. (2004) Endogenous synthesis
of cis-9, trans-11 CLA in dairy cows fed fresh pasture. Journal of Dairy Science 87: 369–378.
Kaylegain, K.E. and Lindsay, R.C. (1995) Handbook of milk fat fractionation technology and
applications. AOCS Press, Champaign, IL.

274
Keeney, M. (1970) ‘Lipid metabolism in the rumen’. In: Physiology and metabolism in the ruminant (ed.
A.T. Phillipson), pp.489-503.
Kemp, P. and Lander, D. J. (1984) Hydrogenation in vitro of α-linolenic acid to stearic acid by mixed
culture of pure strains of rumen bacteria. Journal of General Microbiology 130: 527-533.
Kemp, P., White, R. W. and Lander, D. J. (1975) ‘The hydrogenation of unsaturated fatty acids by five
bacterial isolates from the sheep rumen, by including a new species’. Journal of General Microbiology
90: 100-114.
Kennedy A., Martinez K., Schmidt S., Mandrup S., LaPoint K. and McIntosh M. (2010) Antiobesity
mechanisms of action of conjugated linoleic acid. Journal of Nutritional Biochemistry 21: 171–179.
Kennelly, J. J. (1996) The fatty acid composition of milk fat as influenced by feeding oilseeds. Animal
Feed Science and Technology 60: 137-152.
Kepler, C. R. and Tove, S. B. (1967) Biohydrogenation of unsaturated fatty acids III. Purification and
properties of a linoleate 12-cis, 11-trans-isomerase from Butyrivibrio fibrisolvens. Journal of Biological
Chemistry 242: 5686-5692.
Kim, E. J., Huws, S. A., Lee, M. R. F, Wood, J. D., Muetzel S. M., Wallace, R. J. and Scollan, N. D.
(2008) Fish oil increases the duodenal flow of long chain polyunsaturated fatty acids and trans-11 18:1
and decreases 18:0 in steers via changes in the rumen bacteria community. The journal of Nutrition 138:
889-896.
Kim, J. K., Huws, S. A., Lee, M. R. F. and Scollan, N, D. (2009a) Dietary Transformation of Lipid in the
Rumen Microbial Ecosystem. Asian-Australian Journal of Animal Science 22: 1341-1350.
Kim, J. Y., Park, H. D., Park, E. J., Chon, J. W. and Park, Y. K. (2009b) Growth-inhibitory and
proapoptotic effects of alpha-linoleic acid on estrogen-positive breast cancer cells: Second look at n-3
fatty acid. Annals of the New York Academy of Sciences 1171: 190-195.
275
Kim, Y. J., Liu, R. H., Rychlik, J. L. and Russell, J. B. (2002) The enrichment of a ruminal bacterium
(Megasphera elsdenii YJ-4) that produces the trans-10, cis-12 isomer of conjugated linoleic acid. Journal
of Applied Microbiology 92: 976-982.
Kinsella, J.E., Lokesh, B. and Stone, R. A. (1990) American Journal of Clinical Nutrition 52:1
Klusmeyer, T. H. and Clark, J. H. (1991) Effects of dietary fat and protein on fatty acid flow to the
duodenum and in milk produced by dairy cows. Journal of Dairy Science 74: 3055-3067.
Knight, R., Sutton, J. D., McAllan, A.B. and Smith, R.H. (1978) Effects of dietary lipid supplementation
on digestion and synthesis in the stomach of sheep. Proceedings of Nutrition Society 37: 14A.
Knobloch, K., Pauli, A., Iberl, B., Weigand, H. and Weis, N. (1989) Antibacterial and antifungal
properties of essential oil components. Journal of Essential Oil Research 1:119– 128.
Kokkini, S., Karousou, R., Dardioti, A., Krigas, N. and Lanaras, T. (1997) Autumn essential oils of
Greek oregano. Phytochemistry 44: 883–886.
Krauze-Baranowska, M., Mardarowics, M., Wiwart, M., Poblocka, L. and Dynowska, M. (2002)
Essential oils: pinus antifungal activity. Zeitschrift fuer Naturforschung 57: 478-482.
Kremer, J. M. (1996) Effects of modulation of inflammatory and immune parameters in patients with
rheumatic and inflammatory disease receiving dietary supplementation of n-3 and n-6 fatty acids. Lipids
31(S):S243–S247.
Kremer, J. M., Lawrence, D.A., Petrillo, G.F., Litts, L.L., Mullay, P.M., Rynes, R.I., Stocker, R.P.,
Parhami, N., Greenstein, N.S., Fuchs, B.R., Mathur, A., Robinson, D.R., Sperling, R.I. and Bigaouette,
J. (1995) Effects of high-dose fish oil on rheumatoid arthritis after stopping nonsteroidal anti-
inflammatory drugs – Clinical and immune correlates. Arthritis and Rheumatism 38: 1107-1114.
276
Kris-Etherton, P.M., Pearson, T.A., Wan, Y., Hargrove, R/L., Moriarty, K., Fishell, V. and Etherton, T.
(1999) High-monounsaturated fatty acid diets lower both plasma cholesterol and triacylglycerol
concentrations. American Journal of Clinical Nutrition 70: 1009-1015.
Kritchevsky, D. (2000) Antimutagenic and some other effects of conjugated linoleic acid. British
Journal of Nutrition 83: 459–465.
Kronberg, S. L., Scholljegerdes, E. J., Murphy, E. J., Ward, R. E., Maddock, T. D. and Schauer, C. S.
(2013) Treatment of flaxseed to reduce biohydrogenation of alpha-linolenic acid by ruminal microbes in
sheep and cattle, and increase n-3 fatty acid concentration in red meat. Journal of Animal Science 90:
4618-4624.
Kumar, R., Kamra, D.N., Agrawal, N. and Chaudhary, L.C. (2009) Effect of eucalyptus (Eucalyptus
globulus) oil on in vitro methanogenesis and fermentation of feed with buffalo rumen liquor. Animal.
Nutrition and Feed Technology 9: 237–243.
Kyle, D., Bingham, S. and Radmer, R. (1990) Long-chain omega-3 polyunsaturated fatty acids: prospects
for the introduction into horticultural plants. Horticultural Science 25:1523-25.
Laaksonen, D. E., Nyyssonen, K., Niskanen, Rissanen, L. and Salonen, J. T. (2005) Prediction of
cardiovascular mortality in middle-aged men by dietary and serum linoleic and polyunsaturated fatty
acids. Archives of Internal Medicine 165: 193-199.
Lambert, R.J.W., Skandamis, P.N., Coote, P. and Nychas, G.-J.E. (2001) A study of the minimum
inhibitory concentration and mode of action of oregano essential oil, thymol and carvacrol. Journal of
Applied Microbiology 91, 453–462.
Lapierre, H., Berthiaume, R., Ragio, G., Thivierge, M. C., Doepel, L., Pacheco, D., Dubreuil, P. and
Lobley, G. E. (2005) The route of absorbed nitrogen into milk protein. Animal Science 80: 11-22.
Larsson, S. C., Kumlin, M., Ingelman-Sundberg, M. and Wolk, A. (2004) Dietary long-chain n-3 fatty
acids for the prevention of cancer: A review of potential mechanisms. American Journal of Clinical
Nutrition 79: 935.

277
Latham, M. J., Storry, J. E. and Sharpe, M. E. (1972) Effect of low-roughage diets on the microflora
and lipid metabolism in the rumen. Applied Microbiology 24: 871-877.
Lattaoui, N. and Tantaoui-Elaraki, A. (1994) Individual and combined antibacterial activity of the main
components of three thyme essential oils. Rivista Italiana EPPOS 13:13– 19.
Lawson, R.E., Moss, A.R and Givens, D.I. (2001) The role of dairy products in supplying conjugated
linoleic acid to man’s diet: a review. Nutrition Research Reviews 14: 153-172.
Lee Y. J. and Jenkins T. C. (2011) Biohydrogenation of linolenic acid to stearic acid by the rumen
microbial population yields multiple intermediate conjugated diene isomers. The Journal of Nutrition
141: 1445–1450.
Lee, M. R. F., Cabiddu, A., Hou, F., Niderkorn, V., Kim, E. J. and Scollan, N. D. (2011) In vitro rumen
simulated (RUSITEC) metabolism of freshly cut or wilted grasses with contrasting polyphenol oxidase
activities. Grass Forage Science 66: 196-205.
Lee, M. R. F., Tweed, J. K. S., Cookson, A. and Sullivan, M. L. (2010) Immunogold labelling to localize
polyphenol oxidase (PPO) during wilting of red clover leaftissue and the effect of removing cellular
matrices on PPO protection of glycerol-based lipid in the rumen. Journal of the Science of Food and
Agriculture 90: 503-510.
Lee, M. R. F., Winters, A. L., Scollan, N. D., Dewhurst, R. J., Theodorou, M. K. and Minchin, F. R.
(2004) Plant-mediated lipolysis and proteolysis in red clover with different polyphenol oxidase activities.
Journal of the Science of Food and Agriculture 84: 1639-1645.
Lennarz, W. J. (1966) Lipid metabolism in the bacteria. Advances in Lipid Research 4: 175-225.
Lens-Lisbonne, C., Cremieux, A., Maillard, C. and Balansard, G. (1987) Methodes d’evaluation de
l’activite´ antibacterienne des huiles essentielles: application aux essences de thym et de cannelle. Journal
de Pharmacie de Belgique 42 (5): 297– 302.
278
Lis-Balchin, M., Ochoka, R.J., Deans, S.G., Asztemborska, M. and Hart, S. (1999) Differences in
bioactivity between the enantiomers of a-pinene. Journal of Essential Oil Research 11:393– 397.
Lock, A.L. and Shingfield, K.J. (2004) Optimising milk composition. In: Dairying – Using Science to
Meet Consumers’ Needs, (Kebreab, E., J. Mills and D.E. Beever, Eds), Nottingham University Press,
Loughborough, Leics, Pp 107-188.
Loor, J. J., Hoover, W. H., Miller-Webster, T. K., Herbein, J. H. and Polan, C. E. (2003)
Biohydrogenation of unsaturated fatty acids in continuous culture fermenters during digestion of orchard
grass or red clover with three levels of ground corn supplementation. Journal of Animal science 81: 1611-
1627.
Lopez, S., Hovell, F. D. D., Dijkstra, J. and France, J. (2003) Effects of volatile fatty acid supply on
their absorption and on water kinetics in the rumen of sheep sustained by intragastric infusions. Journal of
Animal Science 81: 2609-2616.
López-Malo, A., Alzamora, S. M., and Guerrero, S. (2000) Natural antimicrobials from plants. In:
Minimally Processed Fruits and Vegetables. Fundamentals Aspects and Applications (Alzamora, S. M.,
Tapia, M. S., and López-Malo, A., Eds.), Aspen Publishers, Gaithersburg, MD, pp. 237–264.
Lough, A. K. (1970) Aspect of lipid digestion in the ruminant. In: Physiology of Digestion and
Metabolism in the Ruminant (Ed. A.T. Philipson). Oriel Press. Newcastle upon Tyne, UK. pp.519-528.
Lourenco M., Falchero L., Tava A. and Fievez V. (2009) Alpine vegetation essential oils and their effect
on rumen lipid metabolism in vitro. In: Ruminant Physiology: Digestion, Metabolism, and Effects of
Nutrition on Reproduction and Welfare (Chilliard Y., Glasser F., Faulconnier Y., Bocquier F., Veissier I.,
Doreau M., eds), Wageningen Academic Publishers, Wageningen, the Netherlands, 88–89.
279
Lourenco, M., Cardozo, P. W., Calsamiglia, S. and Fievez, V. (2008a) Effects of saponins, quercetin,
eugenol, and cinnamaldehyde on fatty acid biohydrogenation of forage polyunsaturated fatty acids in
dual-flow continuous culture fermenters. Journal of Animal Science 86: 3045-3053.
Lourenco, M., Ramos-Morales, E. and Wallace, R. J. (2010) The role of microbes in rumen lipolysis and
biohydrogenation and their manipulation. Animal 4: 1008–1023.
Lourenco, M., Van Ranst, G., Vlaeminck, B., De Smet, S. and Fievez, V. (2008b) Influence of different
dietary forages on the fatty acid composition of rumen digesta as well as ruminant meat and milk. Animal
Feed Science and Technology 145: 418-437.
Lowe, R. F., Michael ,F., Russell Ian, A., Southwell and John D. (2004) Astartea, a New Source of (+)-
(1S, 5R)-Myrtenal. Journal of Essential Oil Research 683-685.
Lundy, F. P., Block, E., Bridges, W. C., Bertrand, J. A. and Jenkins, T. C. (2003) Ruminal
Biohydrogenation in Holstein cows fed soybean fatty acids as amides or calcium salts. Journal of Dairy
Science 87: 1038-1046.
Mach, N., Devant, M., Diaz, I., Font-Furnols, M., Oliver, M. A., Garcia, J. A. and Bach, A. (2006)
Increasing the amount of n-3 fatty acids in meat from young Holstein bulls through nutrition. Journal of
Animal Science 84: 3039-3048.
Macheboeuf, D., Morgavi, D.P., Papon, Y., Mousset, J.-L. and Arturo-Schaan, M. (2008) Dose-
response effects of essential oils on in vitro fermentation activity of the rumen microbial population.
Animal Feed Science and Technology 145: 335–350.
Mackie, R.I. and White, B. A. (1990) Recent advances in rumen microbial ecology and metabolism:
Potential impact on nutrient output. Journal of Dairy Science 73: 2971-2995.
Mahboubi, M. and Kazempour, N. (2012) Biochemical Activities of Iranian Cymbopogon olivieri (Boiss)
Bor. Essential Oil. Indian Journal of Pharmaceutical Sciences 74: 356-60.
280
Maia, M. R. G., Chaudhary, L. C., Figueres, L. and Wallace, R. J. (2007) ‘Metabolism of
polyunsaturated fatty acids and their toxicity to the microflora of the rumen’. Antonie Van Leeuwenhoek
91: 303-314.
Maia, M.R.G., Lal Chaudhary, C., Betwick, C.S., Richardson, A.J., Nest Mckain, Larson, T.R., Ian
Graham, A. and Wallace, R.J. (2010) ‘Toxicity of unsaturated fatty acids to the biohydrogenating
ruminal bacterium, Butyrivibrio fibrisolvens’. BMC Microbiology 10: 52.
Malecky, M., Broudiscou, L. P. and Schmidely, P. (2009) Effects of two levels of monoterpene blend on
rumen fermentation, terpene and nutrient flows in the duodenum and milk production in dairy goats.
Animal Feed Science and Technology 154: 24-35.
Manabe, A., Nakayama, S. and Sakamoto, K. (1987) Effects of essential oils on erythrocytes and
hepatocytes from rats and dipalitoyl phophatidylcholine-liposomes. Japanese Journal of Pharmacology
44: 77–84.
Mapiye, C., Vahmani, P., Mlambo, V., Muchenje, V., Dzama, K., Hoffman, L.C and Dugan, M.E.R.
(2015) The trans-octadecenoic fatty acid profile of beef: Implications for global food and nutrition
security. Food Research International 74: 992-1000.
Marino, M., Bersani, C. and Comi, G. (1999) Antimicrobial activity of the essential oils of Thymus
vulgaris L. measured using a bioimpedometric method. Journal of Food Protection 62 (9): 1017– 1023.
Marino, M., Bersani, C. and Comi, G. (2001) Impedance measurements to study the antimicrobial
activity of essential oils from Lamiacea and Compositae. International Journal of Food Microbiology 67:
187– 195.
Mars, A.E., Gorissen, J.P.L., Van den Beld, I. and Eggink, G. (2001) Bioconversion of limonene to
increased concentrations of perillic acid by pseudomonas putida GS1 in a fed-batch reactor. Applied
Microbiology Biotechnology 56: 101-107.
Martinez, M. and Ballabriga, A. (1987) effects of parenteral nutrition with high doses of linoleate on the
developing human liver and brain. Lipids 22: 133-138.
281
Martinez, S., Madrid, J., Hernandez, F., Meglas, M. D., Sotomator, J.A. and Jordan, M. J. (2006)
Effect of thyme essential oils (Thymus hyemalis and Thymus zygis) and Monensin on in vitro ruminal
degradability and volatile fatty acid production. Journal of Agriculture and Food Chemistry 54: 5698-
6602.
Masotti, V., Juteau, F., Bessiere, J. M. and Viano, J. (2003) Seasonal and phonological variations of the
essential oil from the narrow endemic species Artemisia molinieri and its biological activities. Journal of
the Science of Food and Agriculture 51: 7115-7121.
McAllister, T. A., Bae, H. D., Jones, G. A. and Cheng, K. J. (1994) Microbial attachment and feed
digestion in the rumen. Journal of Animal Science 72: 3004-3018.
McAllister, T.A. and Newbold, C.J. (2008) Redirecting rumen fermentation to reduce methanogenesis.
Australian Journal of Experimental Agriculture, 48: 7–17.
McDonald, I.W. and Scott, T.W. (1977) Foods of ruminant origin with elevated content of
polyunsaturated fatty acids. World Review of Nutrition Dietetics 27: 144-207.
McGimpsey, J.A., Douglas, M.H., Van Klink, J.L., Beauregard, D.A. and Perry, N.B. (1994) Seasonal
variation in essential oil yield and composition from naturalized Thymus vulgaris L. in New Zealand.
Flavour and Fragrance Journal 9: 347– 352.
McInotch, F. M., Williams, P., Losa, R., Wallace, R. J., Beever, D. A. and Newbold, C. J. (2003)
‘Effects of essential on ruminal microoganisms and their protein metabolism’. Journal of Applied and
Environmental Microbiology 69: 5011-5014.
McNeill, S. and Van Elswyk, M.E. (2012) Red meat in global nutrition. Meat Science 92: 166–173.
Menard C. R., Goodman, K. J., Corso, T. N., Brenna, J. T. and Cunnane, S. C. (1998) Recycling of
carbon into lipids synthesized de novo is a quantitatively important pathway of alpha-(U-12C) linolenate
utilization in the developing rat brain. Journal of Neurochemistry 71: 2151-2158.
282
Mendoza-Yepes, M.J., Sanchez-Hidalgo, L.E., Maertens, G. and Marin-Iniesta, F. (1997) Inhibition of
Listeria monocytogenes and other bacteria by a plant essential oil (DMC) en Spanish soft cheese. Journal
of Food Safety 17: 47– 55.
Mensink, R. P., Zock, P. L., Kester, A. D. and Katan, M. B. (2003) Effects of dietary fatty acids and
carbohydrates on the ratio of serum total to HDL cholesterol and on serum lipids and apolipoproteins: a
meta-analysis of 60 controlled trials. American Journal of Clinical Nutrition 77: 1146–1155.
Mohamed, E. I. B. and Samir, A. M. A. (2014) Composition and antimicrobial activity of essential oils
isolated from Egyptian plants against plant pathogenic bacteria and fungi. Industrial Crops and Products
52: 776-782.
Mohammed, N., Ajisaka, N., Lila, Z. A., Mikuni, K., Hara, K., Kanda, S. and Itabashi, H. (2004) Effect
of Japanese horsedish oil on methane production and ruminal fermentation in vitro and in steers. Journal
of Animal Science 82: 1839-1846.
Molero, R., Ibars, M., Calsamiglia, S., Ferret, A. and Losa, R. (2004) Effect of a specific blend of
essential oil compounds on dry matter and crude protein degradability in heifers fed diets with different
forage to concentrate rations. Animal Feed Science and Technology 114: 91-104.
Moleyar, V. and Narasimham, P. (1992) Antibacterial activity of essential oil components. International
Journal of Food Microbiology 16: 337– 342.
Molna, A., Lemberkovices, E. and Spiller, S. (1997) Detection of caraway and camomile components in
goat milk. Tejqazdasaq 57: 22-27.
Moon, C. D., Pacheco, D. M., Kelly, W. J., Leahy, S. C., Li, D., Kopecny, J. and Attwood, G. T. (2008)
Reclassification of Clostridium proteoclasticum as Butyrivibrio proteoclasticus comb, a butyrate-
producing ruminal bacterium. International Journal of Systematic and Evolutionary Microbiology 58:
2041-2045.
Morris, M. C., Sacks, F. and Rosner, B. (1994) Fish oil to reduce blood pressure a meta-analysis.
Archives of Internal Medicine 120(S):10.
283
Morrison, W. R. (1977) Cereal lipids. Proceeding of the Nutrition Society 36: 143-148.
Morvan, B., Rieu-Lesme, F., Fonty, G. and Gouet, P. (1996) In vitro interactions between rumen H2-
producing cellulolytic microorganisms and H2-utilizing acetogenic and sulfate-reducing bacteria.
Anaerobe, 2: 175–180.
Mosely, E. E., Powell, G. L., Riley, M. B. and Jenkins, T. C. (2002) Microbial biohydrogenation of oleic
acid to trans isomers in vitro. Journal of Lipid Research 43: 290-296.
Mourey, A. and Canillac, N. (2002) Anti-Listeria monocytogenes activity of essential oils components of
conifers. Food Control 13: 289– 292.
Moyler, D. (1998) CO2 extraction and other new technologies: an update on commercial adoption.
International Federation of Essential Oils and Aroma Trades—21st International Conference on
Essential Oils and Aroma’s. IFEAT, London, pp. 33– 39.
Mu, H. and Hoy, C. E. (2004) The digestion of triacylglycerols. Progress in Lipid Research 43: 105-133.
Murphy, J.J., Connolly, J.F. and McNeil, G.P. (1995) Effects on cow performance and milk fat
composition of feeding full fat soyabeans and rapeseed to dairy cows at pasture. Livestock Production
Science 44: 13–25.
Naidu, A. (2000) Overview. In: Natural food antimicrobial systems (A. S. Naidu, Ed.),). Boca Raton,
Florida: CRC Press, pp. 1-16.
Nam, I.S. and Garnsworthy, P.C. (2007) Biohydrogenation of linoleic acid by rumen fungi compared
with rumen bacteria. Journal of Applied Microbiology 45: 199-204.
Narayan, B., Miyashita, K and Hosakawa, M. (2006) Physiological effects of eicosapentaenoic acid
(EPA) and docosahexaenoic acid (DHA) – A review: Food Reviews International 22: 291-307.
National Academy of Sciences (1965; 1970; 1975; 1981; 1982; 1987) Evaluating the safety of food
chemicals. Washington, DC.
284
National Research Council (1998) Designing foods: animal products options in the marketplace. National
Academy press, Washington, DC.
Nettleton, J.A. (1991) n-3 fatty acids: Comparison of plants and seafood sources in human nutrition.
Journal of American Diet Association 91: 331-37.
Neumann, C.G., Bwibo, N.O., Murphy, S.P., Sigman, M., Whaley, S., Allen, L.H., Guthrie, D., Weiss,
R.E. and Demment, M.W. (2003) Animal source foods improve dietary quality, micronutrient status,
growth and cognitive function in Kenyan school children: Background, study design and baseline
findings. Journal of Nutrition 133: 3941S-3949S.
Newbold, C. J., El Hassan, S. M., Wang, J., Ortega, M. and Wallace, R. J. (1997) Influence of foliage
from African multipurpose trees on activity of rumen protozoa and bacteria. British Journal of Nutrition
78: 237-249.
Newbold, C. J., McInotch, F. M., Williams, P., Losa, R. and Wallace, R. J. (2004) ‘Effects of a specific
blend of essential oil compounds on rumen fermentation’. Animal Feed Science and Technology 114:
105-112.
Nikaido, H. (1994) Prevention of drug access to bacterial targets: permeability barriers and active efflux.
Science 264: 382-388.
Noble, R.C. (1981) Digestion, absorption and transport of lipids. In: Lipid metabolism in Ruminant
animals (W.W. Christie, Ed.) Pergamon Press. Pp57-93.
Noci, F., Monahan, F. J., Scollan, N. D. and Moloney, A. P. (2007) The fatty acid composition of
muscle and adipose tissue of steers offered unwilted or wilted grass silage supplemented with sunflower
oil and fish oil. British Journal of Nutrition 97: 502-513.
Noni, I. D. and Battelli, G. (2008) Terpenes and fatty acid profiles of milk fat and bitto cheese as affected
by transhumance of cows on different mountain pastures. Food Chemistry 109: 299-309.
O’brien, J.S. and Benson, A.A. (1964) Journal of Lipids Research 5: 432-436.
285
Offer, N. W., Marsden, M., Dixon, J., Speake, B. K. and Thacker, F. E. (1999) Effect of dietary fat
supplements on levels of n-3 polyunsaturated fatty acids, trans acids and conjugated linoleic acid in
bovine milk. Animal Science 69: 613-625.
O’Gara, E. A., Hill, D. J. and Maslin, D. J. (2000) Activities of garlic oil, garlic powder, and
their diallyl constituents against Helicobacter pylori. Applied Environmental Microbiology 66:
2269-2273.
Oliveira, E. A., Sampaio, A. A. M., Henrique, W., Pivaro, T. M.,Rosa, B. L., Fernandes, A. R. M. and
Andrade, A. T. (2012) Quality traits and lipid composition of meat from Nellore young bulls fed with
different oils either protected or unprotected from rumen degradation. Meat Science 90: 28-35.
Oosterhaven, K., Poolman, B. and Smid, E.J. (1995) S-carvone as a natural potato sprout inhibiting,
fungistatic and bacteriostatic compound. Industrial Crops and Products 4: 23–31.
Orav, A., Kailas, T. and Müürisepp, M. (2010) Chemical investigation of the essential oil from berries
and needles of common juniper (Juniperus communisL.) growing wild in Estonia. Natural Product
Research: Formerly Natural Product Letters 24: 1789-1799.
Or-Rashid, M. M., Odongo, N. E and McBride, B. W. (2007) Fatty acid composition of ruminal bacterial
and protozoa, with emphasis on conjugated linoleic acid, vaccenic acid, and odd chain and branched-
chain fatty acids. Journal of Animal science 85: 1228-1234.
Orskov, E.R., Fraser, C. and Gordon, J.G. (1974) Effects of processing of cereals on rumen
fermentation, digestibility, rumination time and firmness of subcutaneous fat in lambs. British Journal of
Nutrition 32: 59-69.
Ottenstein, D.M. and Bartley, D.A. (1971) Separation of free acids C2-C5 in dilute acqueous solution
column technology. Journal of Chromat. Science 9: 673-682.
286
Ouattara, B., Sabato, S.F. and Lacroix, M. (2001) Combined effect of antimicrobial coating and gamma
irradiation on shelf life extension of pre-cooked shrimp (Penaeus spp.). International Journal of Food
Microbiology 68: 1-9.
Oussalah, M., Caillet S., Saucier, L. and Lacroix, M. (2007) Inhibitory effects of selected plant essential
oils on the growth of four pathogenic bacteria: E. coli O157:H7, Salmonella typhimurium, Staphylococcus
aureus and Listeria monocytogenes. Food Control 18: 414-420.
Oussalah, M., Caillet, S. and Lacroix, M. (2006) Mechanism of action of Spanish oregano, Chinese
cinnamon, and savory essential oils against cell membranes and walls of Escherichia coli O15:H7 and
Listeria monocytogenes. Journal of Food Protection 69: 1046-1055.
Outtara, B., Simard, R. E., Holley, R. A., Piette, G. J. P. and Begin, A. (1997) Antibacterial activity of
selected fatty acids and essential oils against six meat spoilage organisms. International Journal of Food
Microbiology 37: 155-162.
Owens, F.N. and Goetsch, A.L. (1988) Ruminal fermentation. In: The Ruminant Animal: Digestive
Physiology and Nutrition, (Church, D.C. and Englewood Cliffs, NJ, Ed.), Prentice-Hall Inc., pp.145-171.
Packiyasothy, E.V. and Kyle, S. (2002) Antimicrobial properties of some herb essential oils. Food
Australia 54: 384– 387.
Palmquist, D. L. (1984) The use of fats in diets for lactating dairy cows. In: Fats in Animal Nutrition
(J.Wiseman Ed.), Butterworths, Boston, Pp 357-381.
Palmquist, D. (1988) The feeding value of fats. In: Feed Science (E.R.Orskov, Ed.). Elsevier,
Amsterdam, pp 293-311.
Palmquist, D. L. (2009) Omega-3 Fatty Acids in Metabolism, Health, and Nutrition and for Modified
Animal Products Foods. The professional Animal Scientist 25: 207-249.
Palmquist, D. L. and Jenkins, T. C. (1980) Fat in lactation rations: Review. Journal of Dairy Science 63:
1-14.
287
Palmquist, D. L., Lock, A. L., Shingfield, K. J. and Bauman, D. E. (2005) Biosynthesis of conjugated
linoleic acid in ruminants and humans. Advances in Food and Nutrition Research 50: 179-217.
Pandey, A.K., Rai, M.K. and Acharya, D. (2003) Chemical Composition and Antimycotic Activity of the
Essential Oils of Corn Mint (Mentha arvensis ) and Lemon Grass (Cymbopogon flexuosus) Against
Human Pathogenic Fungi. Parmaceutical Biology 41: 421-425.
Pandu, S. K., Srinivas, K.V.N.S., Kotesh, J. K., Niranjana, A. K., Dharmendra, K.R. and Uma, V.M. S.
(2014) Variation in the essential oil content and composition of Citronella (Cymbopogon winterianus
Jowitt.) in relation to time of harvest and weather conditions. Industrial Crops and Products 61: 240–
248.
Pariza, M. W. (2004) Perspective on the safety and effectiveness of conjugated linoleic acid. The
American Journal of Clinical Nutrition 79: 1132S-1136S.
Parker, D.R., Weiss, S.T., Troisi, R., Cassano, P.A., Vokonas, P.S. and Landsberg, L. (1993)
Relationship of dietary saturated fatty acids and body habitus to serum insulin concentrations- the
Normative Aging Study. American Journal of Clinical Nutrition 58: 129-136.
Parodi, P.W. (1977) Conjugated octadecanoic acid of milk fat. Journal of Dairy Science 60: 1550-1553.
Paster, N., Menasherov, M., Ravid, U. and Juven, B. (1995) Antifungal activity of oregano and thyme
essential oils applied as fumigants against fungi attacking stored grain. Journal of Food Protection 58:
81-85.
Patra, A. K. and Saxena J. (2010) A new perspective on the use of plant secondary mebolites to inhibit
methanogenesis. Phytochemistry 71: 1198-1222.
Patra, A. K. and Sexena, J. (2009) ‘Dietary phytochemicals as rumen modifiers’: A review of the effects
on microbial populations. Antonie Van Leeuwenhoek 96: 363-375.
288
Patra, A. K., Kamra, D. N. and Agarwal, N. (2010) ‘Effects of extracts of spices on the rumen
methanogenesis, enzyme activities and fermentation of feeds in vitro’. Journal of the Science of Food and
Agriculture 90: 511-520.
Patra, A. M. (2011) ‘Effects of Essential Oils on Rumen Fermentation, Microbial Ecology and Ruminant
Production’. Asian Journal of Animal and Veterinary Advances 10: 1683-9919.
Patra, A. M. (2012) An Overview of Antimicrobial Properties of Different Classes of Phytochemicals. In:
Dietary Phytochemicals and Microbes, (Patra, A. M., Ed) Springer, UK. PP. 1-32.
Pengelly, A. (2004) The constituents of medicinal plants, 2nd edition, Allen and Unwin, Sydney,
Australia.
Pentz, R. and Siegers, C. P. (1996) Methods for qualitative and quantitative assessment of their
ingredients. In: Galic: The Science and Therapeutic application of Allium sativum L. and Related Species
(Eds. Koch, H. P. and Lawson), Pages 109-134, Williams and Wilkins, Baltimore, MD.
Perfield, J. W., Lock, A. L., Pfeiffer, A. M. and Bauman, D. E. (2004) Effects of amide-protected and
lipid-encapsulated conjugated linoleic acid (CLA) supplements on milk fat synthesis. Journal of Dairy
Science 87: 3010-3016.
Perry, N. S., Bollen, C., Perry, E. K. and Ballard, C. (2003) Salvia for dementia therapy: a review of
pharmacological activity and pilot tolerability clinical trial. Pharmacology Biochemistry and behaviour
75: 651-659.
Petit, H. V. (2003) Digestion, milk production, milk composition, and blood composition of dairy cows
fed formaldehyde treated flaxed or sunflower seed. Journal of Dairy Science 86: 2637-2646.
Pintore, G., Usai, M., Bradesi, P., Juliano, C., Boatto, G., Tomi, F., Chessa, M., Cerri, R. and
Casanova, J. (2002) Chemical composition and antimicrobial activity of Rosmarinus officinalis L. oils
from Sardinia and Corsica. Flavour and Fragrance Journal 17: 15– 19.
289
Piperova, L. S., Sampugna, J., Teter, B. B., Kalscheur, K. F., Yurawecz, M. P., Ku, Y., Morehouse, K.
M. and Erdamn, R. A. (2002) Duodenal and milk trans octadecanoic and conjugated linoleic acid (CLA)
isomers indicate that postabsorptive synthesis is the predominat source of cis-9-containing CLA in
lactating dairy cows. Journal of Nutrition 132: 1235-1241.
Pol, I.E., Mastwijk, H.C., Slump, R.A., Popa, M.E. and Smid, E.J. (2001) Influence of food matrix on
inactivation of Bacillus cereus by combinations of nisin, pulsed electric field treatment and carvacrol.
Journal of Food Protection 64:1012– 1018.
Poumes-Ballihaut, C., Langelier, B., Houlier, F., Alessandri, J. M., Durand, G. and Latge, C. (2001)
Comparative bioavailability of dietary alpha-linolenic and docosahecaenoic acids in the growing rat.
Lipids 36: 793-800.
Prabuseenivasan, S., Jayakumar, M. and Ignacimuthu, S. (2006) In vitro antimicrobial activity of some
plant essential oils. BMC Complementary and Alternative Medicine 6: 1-8.
Prescott, L. M., Harley, J. P. and Klein, D. A. (2004) Control de microorganismos por agentes fisicos y
quimicos. Pp. 145-162. In: Microbiologia. McGraw-Hill-Interamericana de Espana, Madrid, Spain.
Prudent, D., Perineau, F., Bessiere, J.M., Michel, G.M. and Baccou, J.C. (1995) Analysis of the
essential oil of wild oregano from Martinique (Coleus aromaticus Benth.)-evaluation of its bacterioatatic
and fungistatic properties. Journal of Essential Oil Research 7: 165– 173.
Raes, K., Haak, L., Balcaen, A., Clayeys, E., Demeyer, D. and De Smet, S. (2004) Effect of linseed
feeding at similar linoleic acid levels on the fatty acid composition of double-muscled Belgian Blue
young bulls. Meat Science 66: 307-315.
290
Raheja, B. S., Sadikot, S. M., Phatak, R. B. and Rao, M. B. (1993) Significance of the n-6/n-3 ratio for
insulin action in diabetes. Annals of The New York Academy of Sciences 683: 258–271.
Reddy, A.S. and Thomas, T. L. (1996) Expression of the cynobacterial delta-6 desaturase gene results in
α-linolenic acid production in trans-genic plants. Nature Biotechnology 14: 639.
Rees, E.M.R., Lloyd, D. and Williams, A.G. (1995) The effects of co-cultivation with the
acetogen Acetitomaculum ruminis on the fermentative metabolism of the rumen fungi Neocallimastix
patriciarum and Neocallimastix sp. strain L2. FEMS Microbiology Letters 133: 175–180.
Reeves, L. M., Williams, M. L. and Jenkins, T. C. (1998) In vitro biohydrogenation and total tract
digestibility of oleamide by sheep. Journal of the Science of Food and Agriculture 77: 187-192.
Research 12: 516–522.
Reuter, H. D., Koch, J. P. and Lawson, L. (1996) Therapeutic effects and applications of garlic and its
preparations. Pp. 135-212. In: Garlic: The Science and Therapeutic Application of Allium sativum L. and
Related Species. (Eds. Koch, H. P. and Lawson, L. D.). Williams and Wilkins, Baltimore, MD.
Roengsumran, S., Petsom, A. and Thaniyavarn, S. (1997) Antibaterial activity of some essential
oils. Journal of Science Research Chula University 22: 13-19.
Roller, S and Seedhar, P. (2002) Carvacrol and cinnamic acid inhibit microbial growth in fresh-
cut melon and kiwifruit at 40C and 80C. Letters in Applied Microbiology 35: 390-394.
Roshchin, V. I., Raldugin, V. A., Baranova, R. A. and Pentegova, V. A. (1998) New triterpen acids
from Abies sibirica needles. Khim Prir Soedin 22: 648-649.
Ross, Z. M., O’Gara, E. A., Hill, D. J., Sleightholme, H. V. and Maslin, D. J. (2001) Antimicrobial
properties of garlic oil against human enteric bacteria: Evaluation of methodologies and comparisons with
garlic oil sulphide and garlic powder. Journal of Applied and Environmental Microbiology 67: 475-480.
291
Russell J. B. and Houlihan A. J. (2003) Ionophore resistance of ruminal bacteria and its potential impact
on human health. FEMS Microbiology Reviews 27: 65–74.
Russo, M., Galletti, G.C., Bocchini, P. and Carnacini, A. (1998) Essential oil chemical composition of
wild populations of Italian oregano spice (Origanum vulgare ssp. hirtum (Link) Ietswaart): A preliminary
evaluation of their use in chemotaxonomy by cluster analysis: 1. Inflorescences. Journal of Agricultural
and Food Chemistry 46: 3741– 3746.
Salem, N., Jr., Simopoulos, A. P., Galli, C. and Lagarde, M. (1996) Fatty Acids and Lipids from Cell
Biology to Human Disease. Lipids 31(S): S1–S326.
Sallam, S.M.A., Bueno, I.C.S., Brigide, P., Godoy, P.B., Vitti, D.M.S.S. and Abdalla, A.L. (2009)
Efficacy of eucalyptus oil on in vitro rumen fermentation and methane production. Options
Mediterraneennes 85: 267–272.
Salter, A.M. (2013) Dietary fatty acids and cardiovascular disease. Animal, 7 (Suppl. 1):163–171
Sangwan, N.S., Farooqi, A.H.A., Shabih, F. and Sangwan, R.S. (2001) Regulation of essential oil
production in plants. Plant Growth Reg. 34: 3-21.
Santora, J. E., Palmquist, D. L. and Roehrig, K. L. (2000) Trans-vaccenic acid is desaturated to
conjugated linoleic acid in mice. Journal of Nutrition 130: 208-215.
Sargent, J.R. (1997) Fish oils and human diet. British Journal of Nutrition 78 (S1): S5-13.
Sargent, J.R., Bell, M.V. and Henderson, R.J. (1996) Protist as source of n-3 polyunsaturated fatty acids
for vertebrate development. In: Protistological Actualities proceedings. The 2nd European Conference of
Protistology and 8th European Conference of Ciliate Biology, (G. Brugerolle and J.P.Mignot, Eds.)
Clermont-Ferrand, France 21-26 July 1995 (pp 54-64).
Sassa, T., Suto, S., Okayasu, Y. and Kihara, A. (2012) A shift in sphingolipid composition from c24 to
c16 increases susceptibility to apoptosis in hela cells. Biochimica et Biophysica Acta 7: 1031-1037.
292
Sauvant D. and Bas P. (2001) La disgestion des lipids chez le ruminants. INRA productions. Animales
14:303-310.
Savoini, G., Agazzi, A., Invernizzi, G., Cattaneo, D., Pinotti, L. and Baldi, A. (2010) Polyunsaturated
fatty acids and choline in dairy goats nutrition: Production and health benefits. Small Ruminant Research
88: 135-144.
Schauff, D. J. and Clark, J. H. (1989) Effects of prilled fatty acids and calcium salts of fatty acids in
rumen fermentation, nutrient digestibilities, milk production and milk composition. Journal of dairy
Science 72: 917-927.
Scientific Advisory Committee on Nutrition (SACN)/Committee on Toxicity (COT) (2004) Scientific
Advisory Committee on Nutrition (SACN)/Committee on Toxicity. Advice on fish consumption: benefits
and risks. (http://cot.food.gov.uk/pdfs/fishreport2004full.pdf).
Scollan, N. D., Choi, N. J., Kurt, E., Fisher, A. V., Enser, M. and Wood, J. D. (2001a) Manipulating the
fatty acid composition of muscle and adipose tissue in beef cattle. British Journal of Nutrition 85: 115-
124.
Scollan, N. D., Dannenberger, D., Nuernberg, K., Richardson, I., Mackintosh, S., Hocquette, J. F. and
Moloney, A. P. (2014) Enhancing the nutritional and health value of beef lipids and their relationship
with meat quality. Meat Science 97: 384-394.
Scollan, N. D., Dhanoa, M. S., Choi, N. J., Maeng, W. J., Enser, M. and Wood, J. D. (2001b).
Biohydrogenation and digestion of long chain fatty acids in steers fed on different sources of lipid.
Journal of Agricultural Science 136: 345-355.
Scollan, N., Hocquette, J. F., Nuernberg, K., Dannenberger, D., Richardson, I. and Moloney, A. (2006)
‘Innovations in beef production systems that enhance the nutritional and health value of beef lipids and
their relationship with meat quality’. Journal of Meat Science 74: 17-33.
Scott, T. W. and Ashes, J. R. (1993) Dietary lipids for ruminants: Protection, utilisation and effects on
remodelling of skeletal muscle phospholipids. Australian Journal of Agriculture Research 44: 495-508.
293
Scott, T. W. and Cook, L. J. (1973) Dietary modification of ruminant milk and meat fats. The coronary
heart disease and dietary controversy. New Zealand Society of Animal Production, Wellington Pp 48-64
Scott, T. W., Cook, L. J., Ferguson, K. A., McDonald, I. W., Buchanan, R. A. and Loftus, H. G. (1971)
Production of polyunsaturated fatty acid milk fat in domestic ruminants. Australian Journal of Science
32: 291-293.
Senatore, F. (1996) Influence of harvesting time on yield and composition of the essential oil of a thyme
(Thymus pulegioides L.) growing wild in Campania (Southern Italy). Journal of Agricultural and Food
Chemistry 44: 1327– 1332.
Sgwane, T. S., Wallace R. J. and Chikunya S. (2013) Proceedings of British Society of Animal Science
p.41.
Shahar, E., Folsom, A. R. and Melnick, S. L. (1994) Dietary n-3 polyunsaturated fatty acids and
smoking-related chronic obstructive pulmonary disease. Atherosclerosis risk in communities study
investigators. The New England Journal of Medicine 331:228–233.
Shingfield, K. J., Avenjarvi, S., Toivonen, V., Arola, A., Nurmela, K. V. V., Huhtanen, P. and Griinari,
J. M. (2003) Effect of dietary fish oil on biohydrogenation of fatty acids and milk fatty acid content in
cows. Animal Science 77: 165-179.
Shingfield, K. J., Bonnet, M. and Scollan, N. D. (2013) Recent development in altering the fatty acid
composition of ruminant-derived foods. Animal 7: 132-162.
Sikkema, J., De Bont, J.A.M. and Poolman, B. (1994) Interactions of cyclic hydrocarbons with
biological membranes. Journal of Biological Chemistry 269: 8022–8028.
Silva, J., Abebe, W., Sousa, S. M., Duarte, V. G., Machado, M. I. L. and Matos, F. J. A. (2003)
Analgesic and anti-inflammatory effects of essential oils of Eucalyptus. Journal of Ethnopharmacology
89: 277-283.
294
Simon, J. E. (1990) Essential oils and culinary herbs. In: Advances in New Crops. (Eds. Janick, J.,
Simon, J.E.).Timber Press, Portland, OR, pp.472-483.
Simopoulos, A. P. (1991) Omega-3 fatty acids in health and disease and in growth and development. The
American Journal of Clinical Nutrition 54: 438–463.
Simopoulos, A. P. (2000) Human Requirement for n-3 Polyunsaturated Fatty Acids. In: Symposium:
Role of poultry products in enriching the human diet with n-3 PUFA. Poultry Science 79: 961–970.
Sinclair, L. A. (2007) Nutritional manipulation of sheep of the fatty acid composition neat: a review.
Journal of Agricultural science 145: 419-434.
Sinclair, L. A., Cooper, S. L., Huntington, J. A., Wilkinson, R. G., Hallett, K. G., Enser, M. and Wood,
J. D. (2005) In vitro biohydrogenation of n-3 polyunsaturated fatty acids protected against ruminal
microbial metabolism. Animal Feed science and Technology 124: 579-596.
Singh, R., Chandra, R., Bose, M., and Luthra, P. M. (2002) Antibacterial activity of Curcuma
longa rhizome extract on pathogenic bacteria. Current science 83: 737-740.
Sioen, I., Huybrechts, I., Verbeke, W., Van Camp, J. and De Henauw, S. (2007) n-6 and n-3 PUFA
intakes of pre-school children in Flanders, Belgium. British Journal of Nutrition 98: 819-825.
Sirtori, C. R. and Galli, C. (2002) Dossier: Polyunsaturated fatty acids in biology and diseases N-3 fatty
acids diabetes. Biomedicine and Pharmacotherapy 56: 397-406.
Sivropoulou A., Papanikolaou E., Nikolaou C., Kokkini S., Lanaras T. and Arsenakis M. (1996)
Antimicrobial and cytotoxic activities of Origanum essential oils. Journal of Agricultural and Food
Chemistry 44: 1202–1205.
Skandamis, P.N. and Nychas, G.-J.E. (2001) Effect of oregano essential oil on microbiological and
physico-chemical attributes of minced meat stored in air and modified atmospheres. Journal of Applied
Microbiology 91:1011 –1022.
Smid, E.J. and Gorris, L.G.M. (1999) Natural antimicrobials for food preservation. In: Handbook of
Food Preservation (Rahman, M.S. Eds.), Marcel Dekker New York, pp. 285-308.
295
Smith, R. L., Cohen, S.M, Doull, J, Feron, V. J., Goodman, J.I, Marnett, L.J, Portoghese, P.S.,
Waddell, W.J., Wagner, B.M., Hall, B.M., Higley, N.A., Lucas-Gavin, C. and Adams, T.B. (2005) A
procedure for the safety evaluation of natural flavour complexes used as ingredients in food: essential
oils. Food and Chemical Toxicology 43:345–363.
Smith, W. L. (2007) Nutritional essential fatty acids and biologically indispensable cyclooxygenase.
Trends in Biochemical Sciences 33: 27-37.
Smith-Palmer, A., Stewart, J. and Fyfe, L. (1998) Antimicrobial properties of plant essential
oils and essences against five important food-borne pathogens. Letters in Applied Microbiology
26: 118-122.
Sofia, S., Joaquin, A., Manuel, N., Adolfo, S., Christophe, P., Myriam, W. and Erik, D. (2002)
Chemical studies of essential oils of Juniperus oxycedrus SSP. Badia. Journal of Ethnopharmacology 81:
129-134.
Soher, E. A., Bassem A. S., Mohamed, S. S. and Amal, S. H. (2014) Assessment of antimycotoxigenic
and antioxidant activity of star anise (Illicium verum) in vitro. Journal of the Saudi Society of Agricultural
Sciences (In press).
Soliva, C. R., Widmer, S. and Kreuzer, M. (2008) Ruminal fermentation of mixed diet supplemented with
St John’s Worth (Hypericum perforatum) flowers and pine (Pinus mugo) oil or mixtures containing these
preparations. Journal of Animal and Feed Sciences 17: 352-362.
Solomon, M.B., Lynch, G.P., Paroczay, E. and Norton, S. (1991) Influence of rapeseed meal, whole
rapeseed and soybean meal of fatty acid composition and cholesterol content of muscle and adipose tissue
from ram lambs. Journal of Animal Science 69: 4055-61.
296
Spanghero, M., Zanfi, C., Fabbro, E., Scicutella, N. and Camellini, C. (2008) Effects of a blend of
essential oils on some end products of in vitro rumen fermentation. Animal Feed Science and Technology
145: 364-374.
Sprecher, H. (2000) Metabolism of highly unsaturated n-3 and n-6 fatty acids. Biochimica et Biophysica
Acta 1486: 219-231.
St. John, L.C., Young, C.R., Knabe, D.A., Thompson, L.D., Schelling, G.T., Grundy, S.M. and Smith,
B. (1987) Fatty acid profiles and sensory carcass traits of tissues from steers and swine fed an elevated
monounsaturated fat diet. Journal of Animal Science 64: 1441-1447.
Stammati, A., Bonsi, P., Zucco, F., Moezelaar, R., Alakomi, H.-l. and Von Wright, A., (1999) Toxicity
of selected plant volatiles in microbial and mammalian short-term assays. Food and Chemical Toxicology
37: 813–823.
Steen, W. C. and Collette, T. W. (1989) Microbial degradation of seven amides by suspended bacterial
populations. Applied Environmental Microbiology 55: 2545-2549.
Stryer, L. (1988) Biochemistry (3rd Ed.) W.H.Freeman and Company/New York, pp 496.
Su, H. M., Bernardo, L., Mirmiran, M., Ma, X. H., Nathanielsz, P. W. and Brenna, J. T. (1999) Dietary
18:3n-3 and 22: 6n-3 as sources of 22: 6n-3 accretion in neonatal baboon brain and associated organs.
Lipids 34: S347-350 (sup).
Su, H. M., Huang, M. C., Saad, N. M., Nathanielsz, P. W. and Brenna, J. T. (2001) Fetal baboons
convert 18:3n-3 to 22: 6n-3 in vivo. A stable isotope tracer study. Journal of Lipid Research 42: 581-586.
Suburu, J., Gu, Z., Chen, H., Chen, W., Zhang, H. and Chen, Y. Q. (2013) Fatty acid metabolism:
Implications for diet, genetic variation, and disease. Food Bioscience 4: 1-12.
Sukhija, P.S. and Palmquist, D.L. (1991) Dissociation of calcium soaps of long chain fatty acids in
rumen fluid. Journal of Dairy Science 73: 1784-87.
Szumacher-Strabel, M. and Cieslak, A. (2012) Essential Oils and Rumen Microbial Populations. In:
Dietary Phytochemicals and Microbes (Ed. Patra, A. K.), pp. 157-183, Springer, New York, London.
297
Talebzadeh, R., Alipour, D., Saharkhiz, M.J., Azarfar, A. and Malecky, M. (2012) Effect of essential
oils of Zataria multiflora on in vitro rumen fermentation, protozoal population, growth and enzyme
activity of anaerobic fungus isolated from Mehraban sheep. Animal Feed science and Technology 172:
115-124.
Tamminga, S. (1992) Nutrition management of dairy cows as a contribution to pollution control. Journal
of Dairy Science 75: 345-357.
Tamminga, S., Steg-Beers, A. and van Hoven, W. (1976) Production of milk with a high content of
polyunsaturated fatty acids. 1. Experiments in relation to the efficiency of production. Neth Milk Dairy
Science Journal 30: 106-117.
Tao, N., Liu, Y., Zhang, J., Zeng, H., Tang, Y and Zhang, M. (2008) Chemical Composition of essential
oil from the peel of Satsuma mandarin. African Journal of Biotechnology 7: 1261-1264.
Tatsuoka, N., Koji, Hara, Mikuni, K., Kozo, Hara, Zashimoto, H. and Itabashi, H. (2008) Effects of the
essential oil cyclodextrin complexes on ruminal methane production in vitro. Animal Science 79: 68–75.
Telci, I., Demirtas, I. and Sahin, A. (2009) Variation in plant properties and essential oil composition of
sweet fennel (Foeniculum vulgare Mill.) fruits during stages of maturity. Industrial Crops and Products.
30: 126–130.
Theodorou, M. K., Williams, B. A., Dhanoa, M. S., McAllan, A. B. and France, J. (1994) ‘A simple gas
production method using a pressure transducer to determine the fermentation kinetics of ruminant feeds’.
Animal Feed Science and technology 48: 185-7.
Thom, T., Haase N., Rosamond, W., Howard, V. J.,Rumsfeld, J., Manolio, T., Zheng, Z.J., Flegal, K.,
O’Donnell, C., Kittner, S., Lloyd-Jones, D., Goff, D.C., Hong, Y.L., Adams, R., Friday, G., Furie, K.,
Gorelick, P., Kissela, B., Marler, J., Meigs, J., Roger, V., Sidney, S., Sorlie, P., Steinberger, J.,
Wasserthiel-Smoller, S., Wilson, M. and Wolf, P. (2006) Heart diseases and stroke statistics-2006
update, a report from the American Heart Association Statistics Committee and Stroke Statistics
Subcommittee. Circulation 113: 85-151.
298
Thormar, H. (2011) Lipids and Essential Oils as Antimicrobial Agent. John Wiley and Sons, Ltd, West
Sussex, UK.
Thoroski, J., Blank, G. and Biliaderis, C. (1989) Eugenol induced inhibition of extracellular enzyme
production by Bacillus cereus. Journal of Food Protection 52: 399– 403.
Tsigarida, E., Skandamis, P. and Nychas, G.E.J. (2000) Behaviour of Listeria monocytogenes and
autochthonous flora on meat stored under aerobic, vacuum and modified atmosphere packaging
conditions with or without the presence of oregano essential at 50C. Journal of Applied Microbiology 89:
901-909.
Troegeler-Meynadier, A., Nicot, M.C., Bayourthe, C., Moncoulon, R. and Enjalbert, F. (2003) Effects
of pH and concentrations of linoleic and linolenic acids on extent and intermediates of ruminal
biohydrogenation in vitro. Journal of Dairy Science 86:4054-4063.
Tymchuk, S. M., Khorasani, G. R. and Kenelly, J. J. (1998) Effect of feeding formaldehyde- and heat-
treated oil seed on milk yield and milk composition. Canadian journal of Animal science 78: 693-700.
Ultee, A. and Smid, E.J. (2001) Influence of carvacrol on growth and toxin production by Bacillus
cereus. International Journal of Food Microbiology 64: 373–378.
Ultee, A., Bennik, M. H. J. and Moezelaar, R. (2002) The phenolic hydroxyl group of carvacrol is
essential for against the food-borne pathogen Bacillus cereus. Journal of Applied and Environmental
Microbiology 68: 1561-1568.
Ultee, A., Kets, E.P.W. and Smid, E.J. (1999) Mechanisms of action of carvacrol on the food-borne
pathogen Bacillus cereus. Applied and Environmental Microbiology 65: 4606– 4610.
299
Van de Braak, S.A.A.J. and Leijten, G.C.J.J. (1999) Essential Oils and Oleoresins: A Survey in the
Netherlands and other Major Markets in the European Union. CBI, Centre for the Promotion of Imports
from Developing Countries, Rotterdam, p. 116.
Van de Vossenberg, J. L. and Joblin, K. N. (2003) ‘Biohydrogenation of C18 unsaturated acids to stearic
acid by a strain of Butyrivibrio hungatei from the bovine rumen’. Letters in Applied Microbiology 37:
424-428.
Van Nevel, C.J. and Demeyer, D.L. (1996) Effects of pH on biohydrogenation of polyunsaturated fatty
acids and their Ca-salts by rumen microorganisms in vitro. Archives of Animal Nutrition 49: 151-157.
Van Nevel, C.J. and Demeyer, D.L. (1988) Manipulation of rumen fermentation. In: Rumen Microbial
Ecosystem (P.N.Hobson, Ed.) pages 387-443, Applied Science, London, UK.
Van Ranst, G., Fievez, V., De Riek, J. and Van Bockstaele, E. (2009) Influence of ensiling forages at
different dry matters and silage additives on lipid metabolism and fatty acid composition. Animal Feed
Science and Technology 150: 62-74.
Van Soest, P. J. (1994) Nutritional Ecology of the Ruminant. Cornell University Press, Ithaca, NY, USA.
Vasta, V. and Bessa, R. J. B. (2012) Manipulating Ruminal Biohydrogenation by the Use of Plants
Bioactive Compounds. In: Dietary Phytochemicals and Microbes (Ed. Patra, A. K.), pp. 263-284,
Springer, New York, London.
Vasta, V., Aouadi, D., Brogna, D. M. R., Scerra, M., Luciano, G., Priolo, A. and Salem, H. B. (2013)
Effect of the dietary supplementation of essential oils from rosemary and Artemisia on muscle fatty acids
and volatile compound profiles in Barbarine lambs. Meat Science 95: 235-241.
Von Schacky, C. (2007) n-3 PUFA in CVD: influence of cytokine polymorphism. Proceeding of the
Nutrition Society 66: 166.
300
Von Schacky, C., Angerer, P., Kothy, W., Thisen K. and Mudra, H. (1999) The effect of dietary omega-
3 fatty acids on coronary atherosclerosis. A randomized, double-blind, placebo-controlled trial. Annals of
internal Medicine 130:554-562.
Wachira, A. M., Sinclair, L. A., Wilkinson, R. G., Enser, M. and Wood J. D. and Fisher, A. V. (2002)
Effects of dietary fat source and breed on the carcass composition, n-3 polyunsaturated fatty acid and
conjugated linoleic acid content of sheep meat and adipose tissue. British Journal of Nutrition 88: 697-
709.
Wachira, A. M., Sinclair, L. A., Wilkinson, R. G., Hallet, K., Enser, M. and Wood, J. D. (2000) Rumen
biohydrogenation of n-3 polyunsaturated fatty acids and their effects on microbial efficiency and nutrient
digestibility in sheep. Journal of Agricultural Science 135: 419-428.
Wahle, K.W. and James, W.P.T. (1993) Isomeric fatty acids and human health. European Journal of
Clinical Nutrition 47: 828-839.
Wallace, R. J. (2004) ‘Antimicrobial properties of plant secondary metabolites’. Proceeding of the
Nutrition Society 63: 621-629.
Wallace, R. J., Chaudhary, L. C., McKain, N., McEwan, N. R., Richardson, A. J., Vercoe, P. E.,
Walker, N. D. and Paillard, D. (2006) ‘Clostridium proteoclasticum: a ruminal bacterium that forms
stearic acid from linoleic acid’. FEMS Microbiology Letters 265: 195-201.
Wallace, R. J., McEwan, N. R., McInotch, F. M., Teferedegne, B. and Newbold, C. J. (2002) ‘Natural
products as manipulators of rumen fermentation’. Asian-Australian Journal of Animal Science 10: 1458-
1468.
Wallace, R. J., McEwan, N. R., Mcintosh, F. M. and Newbold, C. J. (2003) Proceedings of the 50th
Maryland Nutrition Conference on Natural products for manipulation of fermentation in Ruminants,
March 27-28, Timonium, Maryland (2003), pp.116-125.
301
Wang, C.J., Wang, S.P. and Zhou, H. (2009a) Influences of flavomycin, ropadiar, and saponin on
nutrient digestibility, rumen fermentation, and methane emission from sheep. Animal Feed Science and
Technology 148: 157–166.
Wang, J., Zhao, H., Kong, W., Jin, C., Zhao, Y., Qu, Y. and Xiao, X. (2009b) Micro-calorimetric assay
on the antimicrobial property of five hydroxyanthraquinone derivatives in rhubarb (Rheum palmatum L.)
to Bifidobacterium adolescentis. Phytomedicine, doi: 10.1016/ j.phymed.2009.10.009.
Wang, Y., Botolin, D., Christian, B., Busik, J., Xu, J. and Jump, D. B. (2005) Tissue-specific,
nutritional, and developmental regulation of rat fatty acid elongases. Journal of Lipid Research 46: 706-
715.
Weatherburn, M. W. (1967) Phenol-hypochlorite reaction for the determination of ammonia. Anal of
Chemistry 39: 971-974.
Webb, E. C. and O’Neill, H. A. (2008) The animal fat paradox and meat quality. Meat Science 80: 28-36.
Weimr, P.J. (1993) Effects of dilution rate and pH on the ruminal cellulolytic bacterium Fibrobacter
succinogens S85 in the cellulose fed continuous culture. Arc Microbiology 160: 288-294.
Wendakoon, C.N. and Sakaguchi, M. (1995) Inhibition of amino acid decarboxylase activity of
Enterobacter aerogenes by active components in spices. Journal of Food Protection 58: 280– 283.
Whitney, T. R., Lupton, C. J. and Smith, S. B. (2011) Redberry Juniper as a roughage source in lamb
feedlot rations: Wool and carcass characteristics, meat fatty acid profiles, and sensory panel traits. Meat
Science 89: 160-165.
WHO/FAO (2003) Diet, nutrition and the prevention of chronic diseases (p.148). Report of a Joint
WHO/FAO Expert Consultation. World Health Organnization Technical Report Series 916:1-149.
Williams, C. M. (2000) Dietary fatty acids and human health. Annales de zootechnie (Paris) 49: 165-180.
302
Wolin, M.J. (1979) The rumen fermentation: a model for microbial interactions in anaerobic
ecosystems. Advances in Microbial Ecology 3: 49–77.
Wood, J. D., Richardson, R. I., Nute, G. R., Fisher, A. V., Campo, M. M. and Kasapidou, E. (2003)
Effects of fatty acids on meat quality: A review. Meat Science 66: 21-32.
Woods, V. B. and Fearon, A. M. (2009) Dietary Sources of unsaturated fatty acids for animals and their
transfer into meat, milk and eggs: A review. Livestock Science 126: 1-20.
World Health Organization (WHO) (2003) Diet, nutrition and the prevention of chronic diseases. World
Health Organization Technical report series 916:1–148.
Wright, D. E. (1957) ‘Hydrogenation of lipids by rumen protozoa’. Nature 184: 875-876.
Wright, D. E. (1960) ‘Pectic enzymes in rumen protozoa’. Archives of Biochemistry and Biophysiscs 86:
251-254.
Wright, D. E. (1961) Bloat in cattle. XX. Lipases activity of rumen microorganisms. NZ Journal of
Agricultural Research 4: 216-223.
Wu Z. and Huber J.T .(1994) Relationship between dietary fat supplementation and milk protein
concentration in lactating cows. A review. Livestock Production Science 39:141–155.
Wu, Z., Ohajuruka, O. A. and Palmquist, D. L. (1991) Ruminal synthesis, biohydrogenation, and
digestibility of fatty acids by dairy cows. Journal of Dairy Science 74: 3025-3034.
Yang, W. Z., Ametaj, B. N., Benchaar, C. and Beauchemin, K. A. (2010) Dose response to
cinnamaldehyde supplementation in growing beef heifers: Ruminal and intestinal digestion. Journal of
Animal Science 88: 680-688.
Yang, X., Deng, S., de Philippis, R., Chen, L., Hu, C. and Zhang, W. (2012) Chemical composition
of volatile oil from Artemisia ordosica and its allelopathic effect on desert soil microalgae,
Palmellococcus miniatus. Plant Physiol. Bioch. 51:153–158.
303
Yang, Z.P., Zhang, C.M., Zhou, L., Zou, C.X., Guo, Y.Q., Li, W.T., Liu, W.T. and Wu, Y.M. (2007)
Inhibition of methanogenesis by tea saponin and tea saponin plus disodium fumarate in sheep. Journal of
Animal Feed Science and Technology 16 (Suppl. 2): 560–565.
Yu, Q., Bi-jun, X., Yan, Z., Hai-yan, Z. and Si-yi, P. (2007) Study on Aroma Components in Fruit From
Three Different Satsuma Mandarin Varieties. Agricultural Sciences in China 6: 1487-1493.