comparative life cycle assessment of rice husk utilization...
TRANSCRIPT

Comparative Life Cycle Assessment of Rice Husk
Utilization in Thailand
A thesis submitted in total fulfilment of the requirements for the
degree of Doctor of Philosophy
Jittima Prasara-A B.Eng, M.Eng
School of Global Studies, Social Science and Planning College of Design and Social Context
RMIT University August 2009

ii
Declaration
I certify that except where due acknowledgement has been made, the work is that of the
author alone; the work has not been submitted previously, in whole or in part, to qualify
for any other academic award; the content of the thesis is the result of work which has
been carried out since the official commencement date of the approved research
program; any editorial work, paid or unpaid, carried out by a third party is
acknowledged; and, ethics procedures and guidelines have been followed.
Jittima Prasara-A
27 August 2009

iii
PREFACE
The research described in this thesis has been conducted according to the requirements of the Royal Thai Government Scholarship (with Mahasarakham University as an agency) who sponsored my PhD study at RMIT University, Melbourne, Australia. The subject “Life Cycle Assessment” was provided by the Royal Thai Government Scholarship. With personal background knowledge in using rice husk ash in concrete and discussion with supervisors and several fellows, I have narrowed down my thesis topic to the present topic “Comparative Life Cycle Assessment of Rice Husk Utilization in Thailand”. Throughout my PhD study, some works described in this thesis have been presented in conferences. In the first year of my PhD study, I presented a poster about my research in “The International Conference on Green and Sustainable Innovation 2006, November
29th
– December 1st 2006, Chiang Mai, Thailand”. The aim of presenting the poster in
this conference was to find potential interviewees for the purpose of data collection (see also section 5.5.1). Moreover, some of the LCA results of this research have been presented in the conference “In Life Cycle Assessment VIII, September 30-October 2
2008, Seattle, Washington, USA.”. The purpose of presenting the LCA results in this conference was to gain useful feedback from the audiences. The improved version of the LCA results of this research was later presented in “the 6
th International Conference on
Life Cycle Assessment in the Agri-Food Sector, November 12-14 2008, Zurich,
Switzerland.”. The manuscripts of this conference paper have been peer reviewed and published in the conference proceeding: “Prasara-A, J. & Grant, T., 2008,
‘Environmental Impacts of Alternative Uses of Rice Husk for Thailand’, in Proceedings
of the 6th International Conference on LCA in the Agri-Food Sector – Towards a
sustainable management of the Food chain. November 12–14, 2008, Zurich,
Switzerland, Nemecek, T. & Gaillard, G. (eds.), Agroscope Reckenholz-Tänikon
Research Station ART, June 2009.”. The valuable comments from the conference audiences have helped me to improve my analysis. The improved version of the LCA results of this research is presented in Chapter 7. Furthermore, discussion about my research with many experts during the conferences has influenced the discussion of this research (presented in Chapter 8).
Jittima Prasara-A
August 2009

iv
ACKNOWLEDGEMENT
There are many people who I wish to thank for their contribution and support. The completion of this thesis would not be possible without their assistance and support. First of all, I would like to acknowledge the Royal Thai Government Scholarship who fully sponsored my PhD study at RMIT. Thanks also go to all the staff of the Office of Educational Affairs, the Royal Thai Embassy, Canberra, for your administrative assistance. I would like to express my sincere gratitude to my senior supervisor, Assc. Prof. Ian Thomas, Discipline Head, Environment & Planning, School of Global Studies, Social Science & Planning (GSSSP), RMIT. Thanks for your advice and guidance, for giving me great support and direction, for helping me to learn independently and helping me to bring out my confidence. Thanks for your speedy replies to my questions and reading through my draft chapters. You not only helped me to learn how to do a PhD, but also helped me to improve my English writing skills. Thanks a lot for giving me some English lessons, and your assistance in language editing for some of my works. Also, thanks for your help in seeking financial support for attending international conferences. I am deeply grateful for the super hard work you have done to support me. I have gained so much through my PhD journey. I would also like to express my sincere gratitude to my co-supervisor, Tim Grant, Adjunct Professor at the Centre for Design, RMIT. Thanks for your advice and guidance, for your expertise, for giving me technical direction when needed. Thanks for allowing me to attend professional LCA courses and Australian LCA conferences for free of charge. Thanks for your advice on our co-authoring conference papers. Also, thank you for introducing me into the LCA field. Thank you very much Tim, I am deeply grateful for your support. I would like to acknowledge Scott McAlister, Lisa Opray and Rob Rouwette, the former staff of the Centre for Design, for their kind assistance in my LCA works, thanks so much for taking your time to help with my project. Thanks also go to Andrew Carre and Dr. Amit Kapur, Centre for Design, for your suggestions and comments on my work. I would also like to acknowledge Dr. Bo P. Weidema, 2.-0 LCA consultants, Denmark, for his expertise on consequential LCI modelling which is the approach used in my LCA study (presented in Chapter 7). The LCI modelling for this research was constructed based on the course materials taken from the LCA master class conducted by Dr. Bo P. Weidema. There are some respectful supportive people in the Netherlands who contributed substantially to this research. Thanks go to Harry van Ewijk, Dr. Niels Jonkers, Dr. Fleur van Broekhuizen and Jaap Kortman, IVAM Research and Consultancy on Sustainability, Amsterdam. Thanks for your valuable comments on my work and your assistance in the development of LCI models. To Niels, thanks a lot for taking your time to read the previous version of my LCA chapters and for your valuable feedback. Thank you all for your interest in my project and my progress. I wish to express my gratitude to several people who helped with language editing in different parts of this thesis. They are my senior supervisor, Ian Thomas, Mary Vasilakakos, Translating

v
& Interpreting, GSSSP, Ben Cooke, student fellow in Environment & Planning, GSSSP, and Bronwyn Meyrick, student fellow at Centre for Design, RMIT. There are also some supportive people who gave me advice at the beginning of my study to help me get started with my project. They are Dr. Karli James, Centre for Design. Assc Prof Dave Mercer, Program Dir, M Internat Urban & Enviro Mgt, GSSSP, RMIT, and Marguerite Renouf, UQ, Queensland. Thanks Dr. Robin Goodman, senior lecturer in Environment & Planning, GSSSP for allowing me to join your group meeting. Thanks all the student fellows in this group for your useful comments on my research. Thanks also go to Sarah Holdsworth for your assistance in ethics approval application. I wish to express my thanks to Prof. Pavla Miller, the Higher Degree by Research co-ordinator in GSSSP, RMIT, for her great support and advice. Thanks so much Pavla, I am really grateful for that. Thanks also go to Brían Walsh (and before Brian, Dean Coldicott), Research Services Coordinator, GSSSP, for your administrative support. Also, thanks Prof. Jock McCulloch for your kind support. Thanks also go to staff of Graduate Research Office, RMIT for conducting useful workshops for post grad students and for your administrative assistance. To friends and student fellows in GSSSP research lounge, B15 L5. Thank you all for your friendship and moral support. Thanks go to Marcus, Chloe, Geoff, Kavindi, Ed, Sheree, Charlotte, Cathy for your kind mentoring, Craig for research proposal preparation, Tho for advice on LCA, Angela for language editing for a conference paper, Kath, Jacqui, Rutti for your comments about English grammar on some of the conference presentations. Special thanks to go Marcus for your attempt to help finding financial support for thesis production. Thanks also go to the conference attendees who provided useful feedback and suggestions for my research. Thanks Sébastien Humbert, Ecointesys, Switzerland, for your comments and your interest in my progress. Thanks Peter K. Campbell, CSIRO, Victoria, for your comments on my research and other conference audiences who provided useful comments for this research. I would also like to express my thanks to all anonymous reviewers of the conference papers for providing valuable comments for this research. I would also like to express my gratitude to several supportive people back home in Thailand. Special thanks go to Wilasinee Sangsom for your assistance in distributing questionnaires to rice mill owners, thanks so much Noi. Thanks Dr. Yanyong Inmuong, MSU, and Kerry Shannon, a former Fulbright scholar at MSU, for your assistance in preliminary research proposal preparation. Special thanks also go to Dr. Chatpet Yossapol, SUT, for your kind advice and guidance to help me get started with my project. There are several supportive people who provided useful information for this research. They are Hathaichanok Nadsathaporn, SUT, and Saipin Poonkaew, KMUTT, who provided information about environmental issues involving in rice production; Assc Prof. Suwimol Asavapisit, Rungroj Piyaphanuwat, Kasame Thepnoo, KMUTT, who provided information about the utilization of rice husk ash generated in rice husk based power plants; Dr. Pongvipa Lohsomboon and Athiwatr Jirajariyavech, TEI, who provided LCI data for Thai grid mix, cement production and steel production; Khun Nirut, CU, who shared information about rice husk utilization in Thailand; MTEC staff who provided proceeding of the Rice husk utilization workshops; Suttinee Wanichsumran and Laksavadee Teerakijwattana who shared information about using rice husk as a fuel in paddy drying; Anuchit Chamsing, Agricultural Engineering

vi
Research Institute, Department of Agriculture, who provided information about energy requirement in rice production. Specials thanks go to Khun Somboon, Division of Soil Science, Department of Agriculture, for sharing knowledge about using rice husk and rice husk ash in agriculture, and Tritib Suramaythangkoor, KMUTT, for your friendship and for sharing useful information for this research. I would also like to express my thanks to all my interviewees (for data collection) for providing useful information for this research. Without inputs from you all, this research could not be possible. Also, I wish to extend my thanks to all other supportive people whom I have not individually mentioned here. Most importantly, I wish to express my deepest gratitude to my family. I am greatly indebted to my parents, Sanun and Bungon Prasara-A and my brother, Dusit Prasara-A. Thanks so much for your unconditional love and great support. Thanks for being there when I needed someone to talk to. Thanks also go to my extended family, Mae Nang, P’Aew, P’Lhing, P’Aom and others for your encouragement and support. Thank you all.

vii
TABLE OF CONTENTS
PREFACE ........................................................................................................................ iii ACKNOWLEDGEMENT ................................................................................................iv TABLE OF CONTENTS................................................................................................ vii LIST OF FIGURES ........................................................................................................ xii LIST OF TABLES ...........................................................................................................xv LIST OF ACRONYMS AND ABBREVIATIONS...................................................... xvii SUMMARY .......................................................................................................................1 1 INTRODUCTION .....................................................................................................3
1.1 Background to the Research ..............................................................................3 1.2 Research Aim and Objectives ............................................................................5 1.3 Research Approach ............................................................................................5 1.4 Outline of the Thesis ..........................................................................................6
2 RICE PRODUCTION IN THAILAND.....................................................................8 2.1 Introduction ........................................................................................................8 2.2 Historical Background .......................................................................................8 2.3 Rice Production and Export Statistics................................................................9 2.4 Rice Production and Environmental Issues .....................................................13
2.4.1 Land preparation ......................................................................................13 2.4.2 Cultivation................................................................................................15 2.4.3 Harvesting ................................................................................................18 2.4.4 Drying and milling ...................................................................................19 2.4.5 Co-products of rice production ................................................................21
2.5 Overview..........................................................................................................22 3 THE UTILIZATION OF RICE HUSK AND RICE HUSK ASH...........................24
3.1 Introduction ......................................................................................................24 3.2 Characteristics of the Materials........................................................................24
3.2.1 Rice husk..................................................................................................24 3.2.2 Rice husk ash ...........................................................................................27
3.3 Studies on Rice Husk and Ash Uses and Environmental Issues......................30 3.3.1 Rice husk and rice husk ash applications.................................................31 3.3.2 Environmental issues ...............................................................................38
3.4 Thai Biomass Resources ..................................................................................42 3.5 Thai Biomass Energy Policies .........................................................................44
3.5.1 Thailand’s National Economic and Social Development Plan ................44 3.5.2 Biomass Energy Strategic Plans...............................................................46 3.5.3 Energy Conservation and Promotion Programme....................................49 3.5.4 Small Power Producer (SPP) ...................................................................53 3.5.5 Clean Development Mechanism (CDM) .................................................60
3.6 Overview..........................................................................................................66 4 LIFE CYCLE ASSESSMENT (LCA).....................................................................68
4.1 Introduction ......................................................................................................68

viii
4.2 Description of LCA..........................................................................................68 4.2.1 Definition of LCA....................................................................................68 4.2.2 Development of LCA...............................................................................70 4.2.3 Advantages of LCA..................................................................................71
4.3 LCA Structure ..................................................................................................72 4.3.1 Goal and scope definition.........................................................................73 4.3.2 Inventory analysis ....................................................................................74
a) Attributional and Consequential LCI modelling..............................................75 b) System expansion ............................................................................................76
4.3.3 Impact assessment....................................................................................77 a) Mandatory impact assessment elements ..........................................................77
1) Definitions of the terms related to LCIA used.............................................78 2) Definitions of impact categories ..................................................................79 3) Selection of impact categories .....................................................................81 4) Relation of the LCI results to the category indicator results .......................82
b) Optional impact assessment elements..............................................................83 c) Impact assessment methods .............................................................................85
4.3.4 Interpretation ............................................................................................87 4.3.5 LCA softwares packages..........................................................................88
4.4 Applications of LCA........................................................................................89 4.5 Limitations of LCA..........................................................................................91 4.6 LCA Practices in Thailand...............................................................................93 4.7 Overview..........................................................................................................98
5 RESEARCH METHODOLOGY.............................................................................99 5.1 Introduction ......................................................................................................99 5.2 Theoretical Perspectives...................................................................................99 5.3 Qualitative and Quantitative Approaches ......................................................102 5.4 Research Methods ..........................................................................................106
5.4.1 Literature review ....................................................................................106 5.4.2 Questionnaires........................................................................................107 5.4.3 Interviews...............................................................................................108 5.4.4 Analysis techniques................................................................................110
5.5 Information Sources .......................................................................................111 5.5.1 Investigation of the current status of rice husk utilization in Thailand..111 5.5.2 Collecting data .......................................................................................113 5.5.3 Analysing data........................................................................................114
5.6 Ethics..............................................................................................................114 5.7 Overview........................................................................................................116
6 CURRENT AND POTENTIAL USES OF RICE HUSK IN THE THAI CONTEXT ................................................................................................................................117
6.1 Introduction ....................................................................................................117 6.2 Rice Mill Survey ............................................................................................118
6.2.1 The survey results ..................................................................................118 6.2.2 Discussion of the survey results.............................................................121
6.3 Current and Potential Uses.............................................................................122 6.3.1 Rice mill industry...................................................................................124

ix
6.3.2 Electricity industry.................................................................................124 6.3.3 Cement industry .....................................................................................125 6.3.4 Agriculture industry ...............................................................................125
a) Soil conditioner and Compost........................................................................125 b) Poultry and livestock farms ...........................................................................126
6.3.5 Others .....................................................................................................127 6.3.6 Potential uses..........................................................................................127
6.4 Production Processes of the Major and Potential Uses..................................128 6.4.1 Rice mill industry...................................................................................128
a) Background ....................................................................................................128 b) Production process.........................................................................................131 c) Energy and resources consumption ...............................................................132 d) Emissions released.........................................................................................133 e) Waste management ........................................................................................133 f) Benefits of using rice husk in the rice industry ..............................................134 g) Barriers to using rice husk in the rice industry ..............................................134
6.4.2 Electricity industry.................................................................................135 a) Background ....................................................................................................135 b) Production process.........................................................................................138 c) Energy and resources consumption ...............................................................142 d) Emissions released.........................................................................................144 e) Waste management ........................................................................................145
1) Soil conditioner..........................................................................................148 2) Export.........................................................................................................149 3) Brick production ........................................................................................150 4) Light weight concrete block production ....................................................150 5) Landfill and Dumping................................................................................151
f) Benefits of using rice husk in the electricity industry ....................................151 g) Barriers to using rice husk in the electricity industry ....................................153
6.4.3 Cement industry .....................................................................................154 a) Background ....................................................................................................154 b) Production process.........................................................................................154 c) Energy and resources consumption ...............................................................157 d) Emissions released.........................................................................................160 e) Waste management ........................................................................................160 f) Benefits of using rice husk in the cement industry.........................................161 g) Barriers to using rice husk in the cement industry.........................................161
6.4.4 Cellulosic ethanol industry.....................................................................162 a) Background ....................................................................................................162 b) Production process.........................................................................................164 c) Energy and resources consumption ...............................................................167 d) Emissions released.........................................................................................167 e) Waste management ........................................................................................168 f) Benefits of using rice husk in the cellulosic ethanol production....................168 g) Barriers to using rice husk in the cellulosic ethanol production....................169
6.5 Overview and Direction for the Next Chapter ...............................................170

x
7 LIFE CYCLE ASSESSMENT OF RICE HUSK UTILIZATION ........................173 7.1 Introduction ....................................................................................................173 7.2 Goal and Scope of the LCA Study.................................................................174
7.2.1 Goal of the study ....................................................................................174 7.2.2 Functional unit of the study ...................................................................176 7.2.3 System boundaries .................................................................................178
7.3 Life Cycle Inventory Analysis .......................................................................186 7.3.1 Data sources and modelling ...................................................................186
a) Data for electricity generation system ...........................................................187 b) Data for cement production system ...............................................................189 c) Data for cellulosic ethanol system .................................................................191
7.3.2 Data quality ............................................................................................192 7.3.3 Consistency of data ................................................................................193
7.4 Impact Assessment.........................................................................................194 7.4.1 Rice husk based electricity generation and the co-product uses ............199 7.4.2 Comparison across different rice husk use systems...............................203
7.5 Interpretation of the LCA Results ..................................................................209 7.5.1 Consistency analysis ..............................................................................209 7.5.2 Process contribution analysis .................................................................210
a) Rice husk based electricity process (with landfill as the ash disposal option)............................................................................................................................214 b) Cement system...............................................................................................219 c) Cellulosic ethanol system...............................................................................220 d) Electricity system...........................................................................................233
7.5.3 Sensitivity analysis.................................................................................243 a) Impact assessment methods ...........................................................................243 b) Transportation distance for cellulosic ethanol system...................................252
7.5.4 Direction for the next chapter ................................................................257 8 DISCUSSION, CONCLUSIONS, AND OPPORTUNITIES FOR FURTHER RESEARCH...................................................................................................................258
8.1 Discussion of the Results ...............................................................................258 8.2 Electricity production option .........................................................................260
8.2.1 Benefits ..................................................................................................260 a) Fossil fuel depletion mitigation......................................................................260 b) Climate change mitigation.............................................................................265 c) Government policy support............................................................................265 d) Proven technology .........................................................................................271
8.2.2 Barriers ...................................................................................................272 a) Rice husk ash management ............................................................................272
1) Capacity of the production of light weight concrete blocks in using rice husk ash..........................................................................................................274 2) Capacity of total areas of rice fields in using rice husk ash.......................275 3) Locations of rice husk ash users ................................................................277 4) Rice husk ash quality and market ..............................................................277 5) Practicality of using rice husk ash in light weight concrete block production........................................................................................................................281

xi
6) Practicality of using rice husk ash in clay brick production ......................283 7) Practicality of using rice husk ash as a soil conditioner in rice fields .......284
b) Effect in particulate matter formation............................................................285 c) Increase in rice husk prices ............................................................................286 d) Transportation of rice husk to the power plant plants ...................................287
8.3 Cement production option..............................................................................287 8.3.1 Benefits ..................................................................................................287
a) Fossil depletion mitigation.............................................................................287 b) Climate change mitigation.............................................................................289 c) Proven technology..........................................................................................290 d) No ash management.......................................................................................291 e) Opportunity for carbon trading ......................................................................291
8.3.2 Barriers ...................................................................................................291 a) Effect in particulate matter formation............................................................291 b) Increase in rice husk prices............................................................................292 c) Rice husk is not used efficiently enough .......................................................292 d) Transportation of rice husk to the cement plants ...........................................293 e) Capacity of cement production in using rice husk in the process..................295
8.4 Cellulosic ethanol production option .............................................................297 8.4.1 Benefits ..................................................................................................297
a) Fossil fuel depletion mitigation......................................................................297 b) Climate change mitigation.............................................................................298
8.4.2 Barriers ...................................................................................................298 a) Effect in particulate matter formation............................................................298 b) Unproven technology (at the time of analysis)..............................................299 c) Rice husk ash management ............................................................................300 d) Transportation of rice husk to the ethanol plants...........................................301
8.5 Limitations of the Research ...........................................................................301 8.6 Conclusions of the Research ..........................................................................303 8.7 Opportunities for Further Research................................................................308
9 REFERENCES............................................................................................................311 APPENDICES ...............................................................................................................334
Appendix 1: LCA questionnaire ................................................................................334 Appendix 2: Interview questions ...............................................................................339 Appendix 3: LCI data used in this study....................................................................341

xii
LIST OF FIGURES
Figure 2.1 Thailand export of milled rice .................................................................... …10 Figure 2.2 Co-products of rice production ....................................................................... 22 Figure 3.1 Structure of the ENCON Programme ............................................................. 50 Figure 3.2 Organizational structure of the Ministry of Energy........................................ 51 Figure 3.3 Organizational structure of Thailand’s energy sector..................................... 52 Figure 3.4 Procedure of the implementation of CDM in Thailand .................................. 64
Figure 4.1 Stage of an LCA ............................................................................................. 73 Figure 4.2 Concept of category indicators ....................................................................... 82 Figure 4.3 Example of midpoint impact indicators and endpoint impact indicators ....... 87
Figure 5.1 Research framework ..................................................................................... 105
Figure 6.1 Energy requirements and supply in the rice industry ................................... 129 Figure 6.2 Rice husk power plant flow chart ................................................................. 139 Figure 6.3 Process overview of ethanol produced from cellulosic biomass .................. 166
Figure 7.1 Functional units for different rice husk use systems and the conventional systems ............................................................................................................................ 178 Figure 7.2 General system boundary of the study.......................................................... 180 Figure 7.3 LCI Model describing system expansion for electricity generation option. 182 Figure 7.4 LCI Model describing system expansion for cellulosic ethanol option....... 184 Figure 7.5 LCI Model describing system expansion for cement production option..... 185 Figure 7.6 Relationship between LCI results, midpoint and endpoint indicators for ReCiPe 2008 ................................................................................................................... 195 Figure 7.7 Normalized impacts of 919 MWh rice husk based electricity production
with different ash use options (analysed by Recipe Midpoint (H) V1.01 / World Recipe H / normalization) ........................................................................................................... 202 Figure 7.8 Normalized impacts of 919 MWh rice husk based electricity production
with different ash use options (except landfill) (analysed by Recipe Midpoint (H) V1.01 / World Recipe H / normalization)....................................................................... 203 Figure 7.9 Normalized impacts reduced by processing 1,000 tonnes of rice husk in
different use systems (analysed by Recipe Midpoint (H) V1.01 / World Recipe H / normalization) ................................................................................................................. 206 Figure 7.10 Example of process network diagram......................................................... 211 Figure 7.11 Process network of rice husk based electricity generation process (with the option of disposing the ash in landfill) showing impact on freshwater
eutrophication ................................................................................................................ 215 Figure 7.12 Process network of rice husk based electricity generation process

xiii
(with the option of disposing the ash in landfill) showing impact on human toxicity ... 216 Figure 7.13 Process network of rice husk based electricity generation process (with the option of disposing the ash in landfill) showing impact on freshwater
ecotoxicity ....................................................................................................................... 217 Figure 7.14 Process network of rice husk based electricity generation process (with the option of disposing the ash in landfill) showing impact on marine ecotoxicity.......................................................................................... 218 Figure 7.15 Process network of cement system showing impact on particulate matter
formation ........................................................................................................................ 219 Figure 7.16 Process network of cellulosic ethanol system showing impact on fossil fuel
depletion.......................................................................................................................... 221 Figure 7.17 Process network of cellulosic ethanol system showing impact on climate
change............................................................................................................................. 222 Figure 7.18 Process network of cellulosic ethanol system showing impact on freshwater ecotoxicity..................................................................................................... 223 Figure 7.19 Process network of cellulosic ethanol system showing impact on terrestrial
acidification .................................................................................................................... 224 Figure 7.20 Process network of cellulosic ethanol system showing impact on marine
eutrophication ................................................................................................................ 225 Figure 7.21 Process network of cellulosic ethanol system showing impact on human
toxicity............................................................................................................................. 226 Figure 7.22 Process network of cellulosic ethanol system showing impact on photochemical oxidant formation.................................................................................. 227 Figure 7.23 Process network of cellulosic ethanol system showing impact on particulate matter formation.......................................................................................... 228 Figure 7.24 Process network of cellulosic ethanol system showing impact on terrestrial
ecotoxicity ....................................................................................................................... 229 Figure 7.25 Process network of cellulosic ethanol system showing impact on marine
ecotoxicity ....................................................................................................................... 230 Figure 7.26 Process network of electricity system showing impact on climate change234 Figure 7.27 Process network of electricity system showing impact on human toxicity 235 Figure 7.28 Process network of electricity system showing impact on freshwater
ecotoxicity ....................................................................................................................... 236 Figure 7.29 Process network of electricity system showing impact on marine
ecotoxicity
......................................................................................................................................... 237 Figure 7.30 Process network of electricity system showing impact on fossil fuel
depletion.......................................................................................................................... 238 Figure 7.31 Process network of electricity system showing impact on terrestrial
acidification .................................................................................................................... 239 Figure 7.32 Process network of electricity system showing impact on particulate matter
formation ........................................................................................................................ 240 Figure 7.33 Normalized impacts reduced by processing 1,000 tonnes of rice husk in
different use systems (analysed by IMPACT 2002+, V2.02 / IMPACT 2002+ / normalization) ................................................................................................................. 248

xiv
Figure 7.34 Normalized impacts reduced by processing 1,000 tonnes of rice husk in
different use systems (analysed by Eco-indicator 99 (H), V2.03 / Europe EI 99 H/A normalization) ................................................................................................................. 250 Figure 7.35 Normalized impacts reduced by processing 1,000 tonnes of rice husk in
different use systems (with 200 km transportation distance) (analysed by Recipe Midpoint (H) V1.01 / World Recipe H / normalization) ................................................ 253 Figure 7.36 Normalized impacts reduced by processing 1,000 tonnes of rice husk in
different use systems (with 500 km transportation distance) (analysed by Recipe Midpoint (H) V1.01 / World Recipe H / normalization) ................................................ 254 Figure 7.37 Normalized impacts reduced by processing 1,000 tonnes of rice husk in
different use systems (with 1,000 km transportation distance) (analysed by Recipe Midpoint (H) V1.01 / World Recipe H / normalization) ................................................ 255 Figure 7.38 Normalized impacts reduced by processing 1,000 tonnes of rice husk in
different use systems (with 2,000 km transportation distance) (analysed by Recipe Midpoint (H) V1.01 / World Recipe H / normalization) ................................................ 256
Figure 8.1 Comparison of electricity produced from fuel oil, lignite, natural gas, diesel and SPP ........................................................................................................................... 269

xv
LIST OF TABLES
Table 2.1 Rice yield of major countries, 2005-2007........................................................ 10 Table 2.2 Major Rice: Planted area and production by region, 2005-2007 ..................... 12 Table 2.3 Second Rice: Planted area and production by region, 2006-2008 ................... 12 Table 3.1 Composition of rice husk ................................................................................. 26 Table 3.2 Selected properties of rice husk compared with other Thai fuels .................... 26 Table 3.3 Nutritional components of rice husk ................................................................ 27 Table 3.4 Composition of the Thai rice husk ash from different sources ........................ 28 Table 3.5 Rice husk ash properties produced from different burning conditions ............ 30 Table 3.6 Forecasted available unused biomass in Thailand in 2004 .............................. 44 Table 3.7 SPP project proposals accepted by EGAT (at December 1998)....................... 54 Table 3.8 SPP projects accepted by EGAT (at November 2008)..................................... 55 Table 3.9 VSPP projects accepted by EGAT (at December 2008) .................................. 58 Table 3.10 Benefits from CDM implementation in Thailand .......................................... 62 Table 3.11 CDM projects in Thailand.............................................................................. 66
Table 4.1 Examples of impact methods developed in different countries ....................... 86
Table 6.1 Number of rice mills identifying rice husk users by region ........................... 119 Table 6.2 Rice husk use proportions in different user sectors........................................ 120 Table 6.3 Given names and related industry sectors of interviewees ............................ 123 Table 6.4 Energy and environmental profile of the A. T. Biopower rice husk power plant...................................................................................................................... 145 Table 6.5 The uses of rice husk ash generated from different rice husk based power plants ............................................................................................................................... 146 Table 6.6 Inventory data of cement production.............................................................. 158 Table 7.1 Selected rice husk use pathways and the conventional systems .................... 175 Table 7.2 Selected rice husk ash applications and the competing products................... 183 Table 7.3 Simplified characteristics of different perspectives ....................................... 196 Table 7.4 The impact categories and units at midpoint level reported in ReCiPe 2008 197 Table 7.5 Characterized results of 919 MWh rice husk based electricity production with different ash use options (analysed by Recipe Midpoint (H) V1.01 / World Recipe H / characterization).................................................................... 200 Table 7.6 Characterized impacts reduced by processing 1,000 tonnes
of rice husk in different use systems (analysed by Recipe Midpoint (H) V1.01 / World Recipe H / characterization) ........... 205 Table 7.7 Total suspended particulate (TSP) and SO2 emissions of rice husk power plant and conventional power plants................................................ 242 Table 7.8 Comparison of impact categories and units between different methods used .................................................................................................... 244

xvi
Table 7.9 Characterized impacts reduced by processing 1,000 tonnes
of rice husk in different use systems (analysed by IMPACT 2002+, V2.02 / IMPACT 2002+ / characterization) ................ 247 Table 7.10 Characterized impacts reduced by processing 1,000 tonnes
of rice husk in different use systems (analysed by Eco-indicator 99 (H), V2.03 / Europe EI 99 H/A characterization)........ 249
Table 8.1 Thai electricity production classified by type of fuels used........................... 263 Table 8.2 Electricity produced from Small Power Producers ........................................ 267 Table 8.3 Annual yields of light weight concrete block production .............................. 274 Table 8.4 Total annual planted areas of major and second rice ..................................... 276 Table 8.5 Selected properties of rice husk ash from different rice husk based power plants ............................................................................................................................... 280 Table 8.6 CO2 emissions of conventional power plants................................................. 290 Table 8.7 Locations of the cement plants ....................................................................... 294 Table 8.8 Annual yields of cement production............................................................... 296

xvii
LIST OF ACRONYMS AND ABBREVIATIONS
% wt. Percent by weight
° C degree Celsius
1,4-DCB 1,4 dichlorobenzene
Al2O3 Aluminium oxide
AUDC Australian Urban Driving Cycle
Bq Becquerel (unit of the activity concentrations of C-14,
1 Bq = 1 decay per second)
C2H3Cl Chloroethylene
CDM EB CDM Executive Board
CDM Clean Development Mechanism
CEPA Committee on Energy Policy Administration
CER certified emission reduction
CFC-11 Chlorofluorocarbon
CH4 Methane
CO Carbon monoxide
CO2 Carbon dioxide
COGEN Cogeneration
DALY Disability-Adjusted Life Years
DEB Department of Energy Business
DEDE Department of Alternative Energy Development and
Efficiency
DEDP Department of Energy Development and Promotion
DMF Department of Mineral Fuels
DNA Designated National Authority
DOE Designated Operational Entity
E Egalitarian
E10 a mixture of 10% ethanol and 90% petrol
EC-ASEAN European Commission and the Association of South-East

xviii
Asian Nations
EGAT Electricity Generation Authority of Thailand
EIA Environmental Impact Assessment
EIEB Environmental Impact Evaluation Bureau
ENCON Energy Conservation and Promotion
EPPO Energy Policy and Planning Office
ESP Electrostatic Precipitator
FBC fluidized-bed combustor
Fe2O3 Iron(III) oxide
g gram
GHG greenhouse gas
GWh Gigawatt-hours = 109 watt-hours
H Hierarchist
hr hour
I Individualist
IPCC Intergovernmental Panel on Climate Change
IPP Independent Power Producer
IRG International Resources Group
ISO International Organization for Standardization
kg kilogram
km kilometre
ktoe kilo tonnes of oil equivalent
kWe kilowatt electrical
L litre
LCA Life Cycle Assessment
LCI Life Cycle Inventory
LCIA Life Cycle Impact Assessment
LOI Loss on ignition
LSU Louisiana State University (a type of paddy dryer)
m2 square metre
m3 cubic metre

xix
MEA Metropolitan Electricity Authority
mg milligram
min minute
MJ primary energy content of fossil fuels, calculated based on upper
heating values (express in MJ)
MJ surplus additional energy required for further extraction of the
resources in the future (express in MJ)
MJ megajoule
MOEN Ministry of Energy
MONRE Ministry of Natural Resources and Environment
MTEC National Metal and Materials Technology Centre
MW megawatt = 106 watts
MWh megawatt-hours = 106 watt-hours
NEPC National Energy Policy Council
NEPO National Energy Policy Office
NESDP National Economic and Social Development Plan
NH3 Ammonia
NMVOC Non Methane Volatile Organic Carbon compound
NO Nitric oxide or nitrogen monoxide
No. Number
NOx Nitrogen oxides
NSTDA National Science and Technology Development Agency
O2 oxygen
ONEP Office of Natural Resources and Environmental Policy and
Planning
org.arable organic arable land
PAF Potentially Affected Fraction (of species)
PAH polycyclic aromatic hydrocarbon
PDD Project Design Document
PDF Potentially Disappeared Fraction (of species)
PEA Provincial Electricity Authority

xx
PM 10 particulate matters of 10 micrometers or less
PM 2.5 particulate matters of less than 2.5 micrometers
PM particulate matter
PO43- phosphate
REPA Environmental Profile Analysis
RPS Renewable Portfolio Standard
SETAC Society for Environmental Toxicology and Chemistry
SiO2 Silicon dioxide
SO2 Sulfur dioxide
SPP Small Power Producer
TBCSD Thailand Business Council for Sustainable Development
TEG water Triethylene glycol released into water
TEG Triethylene glycol released into soil
TEI Thailand Environment Institute
TIS Thai Industrial Standard
tkm tonne-kilometre (unit of transportation quantity)
TOC Total organic compound
TSP Total suspended particulate
U235 Uranium-235
UK United Kingdom
UNEP United Nations Environment Programme
UNFCCC United Nations Framework Convention on Climate
Change
USA United States of America
USAID United States Agency for International Development
VOC Volatile organic compound
VSPP Very Small Power Producer

Summary
1
SUMMARY
Thailand is one of the largest rice producing nations in the world. In 2007, Thailand produced approximately 32 million tonnes of rice. Moreover, there is a trend for Thai rice exports to increase. This could imply that if the trend continues, there will be an increased quantity of rice husk in the future. Rice husk is a co-product of rice products generated in the rice milling process. This husk accounts for about 23 percent of the total paddy weight (rice crop weight). To make use of this large quantity of rice husk, the husk has traditionally been used as an energy source in the rice mills themselves. However, there is still some surplus rice husk remaining unused in the mills which causes disposal problems to the rice mill owners. In the past, this unused rice husk was disposed of by open-air burning or dumping which caused significant local pollution. To deal with this problem, substantial research has been conducted to find useful applications for rice husk. The unique features of rice husk and its ash have been found to be useful in several industrial applications. More recently, the Thai government has promoted the use of biomass for energy purposes to substitute for fossil fuel consumption and to reduce the environmental impacts caused by using fossil fuels. Therefore, rice husk, which is one of the main sources of biomass in Thailand, has already been used on a commercial scale. However, the environmental impacts associated with different rice husk applications have not yet been widely investigated in the Thai context. While there is a need to find ways of dealing with rice husk disposal, it is also important to ensure that this husk is used in ways that harm the environment least. This research aims to identify the most environmentally friendly use of rice husk for Thailand. To achieve this, the research is divided into three main stages; identification of main current and potential uses of rice husk in Thailand; data collection; and data analysis using Life Cycle Analysis approach. A range of methods such as literature review, questionnaires with rice mill owners, and interviews with industry personnel, were used to help in identifying the current and potential uses of rice husk. The major current and potential rice husk uses chosen to be examined in this research are those uses of rice husk in electricity generation, in cement manufacture and in cellulosic ethanol production. The second stage is to collect detailed data about the processes of the selected rice husk uses to be examined. This was undertaken by literature review, questionnaires and interviews with involved industry personnel. The last stage is to analyse the data collated. Life Cycle Assessment (LCA) approach and the LCA software package SimaPro (version 7.1.6) were used to assess the environmental impacts of the selected rice husk uses. The LCA results were used to assist in identifying the most environmentally friendly use of rice husk in Thailand. Results from the LCA are reviewed in the context of critical policy issues, including the Thai government biomass policies; the capacity of the production process of rice husk use options; and the infrastructure availability and practicality of the rice husk use options. Based on the goal and scope of the study, the data available for this study and

Summary
2
the review of the issues just mentioned, it is concluded that, in the short term, the most practical environmentally friendly use of rice husk across the three uses investigated is the use of rice husk in electricity generation. However, with expected oil shortages in the future, rice husk should also be considered for use in cellulosic ethanol production, as this option helps to save some amount of petrol.

Chapter 1-Introduction
3
1 INTRODUCTION
1.1 Background to the Research
Rice production in Thailand is large. Thailand is one of the largest rice producing
nations in the world. It is currently ranked the seventh largest rice producer country. In
2007, Thailand produced approximately 32 million tonnes of rice (Office of Agricultural
Economics 2007a). To produce rice, co-product such as rice husk is generated in the rice
milling process. This husk accounts for approximately 23 percent of total paddy rice
weight (rice crop weight). Thailand has been the largest rice exporter in the world since
1975 (International Rice Research Institute 2008b). Moreover, there has been an
increasing trend of Thai rice product exports for over three decades (International Rice
Research Institute 2008b). If this trend continues, there will be a large quantity of rice
produced in conjunction with a large quantity of rice husk.
This husk has caused disposal problem to the rice mill owners. Thus, the husk has
traditionally been used as an energy source within the rice mills themselves. However,
there is still some surplus rice husk remaining unused in the mills (The EC-ASEAN
COGEN Programme 1998). To prevent pollution caused by open-air burning or
dumping of rice husk, much research has been conducted to find good uses for rice husk.
The unique features of rice husk and its ash have been found to be useful in several
industrial applications. Moreover, the recent energy policy of the Thai government
promotes the use of biomass (including rice husk) for energy purposes to substitute for
fossil fuels consumption and to reduce the environmental impacts caused by using fossil
fuels (Amornkosit 2007; Coovattanachai 2006; Lertsuridej 2004). Thus, some of the rice
husk has already been utilized on a commercial scale in different industries.

Chapter 1-Introduction
4
While it is important to consume rice husk effectively in terms of technical and financial
aspects, it is also important that rice husk is consumed in a manner that harms the
environment the least. Some research has been conducted to assess the technical and
financial feasibility of some of the rice husk applications (Kunimitsu & Ueda 2005;
Sookkumnerd et al. 2007; The EC-ASEAN COGEN Programme 1998; Ueda et al.
2005). A few research investigated environmental issues of rice husk uses in Thailand
(Bhattacharya 1999; Chungsangunsit 2004). Nonetheless, the scope of these studies are
limited to only using rice husk as a fuel. The environmental impacts associated with
other rice husk applications have not yet been widely investigated within the Thai
context. While we need to find ways of dealing with rice husk disposal, it is also
important to ensure that this husk is utilized in ways that harm the environment the least.
Therefore, this research aims to identify the most environmentally friendly use of rice
husk for Thailand.
Life Cycle Assessment (LCA) is one of the several environmental management tools
(e.g. risk assessment, environmental performance evaluation, environmental auditing
and environmental impact assessment). The unique feature of LCA is that it addresses
the possible environmental impacts of the product or service through its entire life cycle.
This means that all the possible environmental impacts which flow in all stages of the
system being study are considered. Hence, LCA is a good support tool for comparing the
environmental performances of different alternatives. This can help in making a decision
among different options. This research will use LCA as a tool to assess the
environmental impacts of the main current and potential uses of rice husk in Thailand.
The LCA results will be used together with other evidence to help identify the most
environmentally friendly use of rice husk for Thailand.

Chapter 1-Introduction
5
1.2 Research Aim and Objectives
The overall aim of this research is to identify the most environmentally friendly rice
husk use in Thailand by using an LCA approach to analyse the environmental impacts of
the different rice husk uses. To achieve this aim, the specific objectives to be tackled are:
- To find out the different uses of rice husk in Thailand.
- To investigate how rice husk has been utilized in different manner.
- To analyse the environmental impacts of the major current and potential uses
of rice husk in Thailand.
These objectives are used to guide the research, as explained in the following section.
1.3 Research Approach
This research is divided into three main parts. The first part is to investigate the major
current and potential uses of rice husk in Thailand. This is done by using a range of
methods such as literature review, questionnaires with rice mill owners and interviews
with industry personnel using rice husk in their production processes. The findings from
this part of the research lead to the second part which is to collect detailed data about
how rice husk is used in different processes. The last part is to analyse the data collated
from the first two parts. In the final part, the environmental impacts of the selected main
current and potential uses of rice husk are analysed. This is undertaken by using LCA
approach and the LCA software package SimaPro (version 7.1.6). The LCA results are
used (together with other evidence) to help to identify the most environmentally friendly
use of rice husk for Thailand. The detailed discussion about the methodology employed
in this research is presented in Chapter 5.
Chapter 1-Introduction
6
1.4 Outline of the Thesis
Chapter 2 introduces facts about rice production in Thailand as background information
for this thesis. It demonstrates the importance of rice production in Thailand. Moreover,
it describes different steps involved in rice production. This informs the fact that in
producing rice, co-products such as rice husk and rice straw are also generated.
Furthermore, this chapter argues the need to ensure that these co-products, particularly
rice husk, are used in ways that harm the environment the least. Chapter 3 reviews the
literature on the utilization of rice husk and rice husk ash in general, both internationally
and in the Thai context, as well as the environmental issues associated with their uses.
This chapter provides a sense of how rice husk and rice husk ash can be used in different
applications, and surveys the studies involving evaluation of environmental aspect of
these different uses of rice husk and rice husk ash. Moreover, it highlights the need to
ensure that rice husk is used in an environmentally friendly way.
To do this, the LCA approach will be used as a tool to assess the environmental impacts
of the alternative rice husk uses. The LCA results will be used to assist in identifying the
most environmentally friendly rice husk use. Chapter 4 describes different stages of
LCA and explores its applications in different areas. This chapter points out advantages
and limitations of LCA. The information discussed in this chapter guides the conduct of
the LCA study for this research (presented in Chapter 7). Building on the information
about rice husk utilization and LCA, Chapter 5 describes the methodology employed to
inform the conduct of the overall research. To focus the research, Chapter 6 defines the
main current and potential uses of rice husk, especially on a commercial scale, within
the Thai context. The data from this overview determine the major current and potential
rice husk uses to be examined in the LCA study (described in Chapter 7). Also discussed
in this chapter are the detailed production processes, energy and resources consumption,
emissions released, waste management, as well as the benefits and barriers to using rice
husk in the selected current major and potential uses of rice husk.. These data are used in
the LCA study described in Chapter 7. Chapter 7 describes the conduct of the LCA
study examining the environmental impacts of the main current and potential rice husk

Chapter 1-Introduction
7
uses (determined in Chapter 6), and presents the LCA results. The LCA results from
Chapter 7 are discussed in the context of the key policy issues in Chapter 8 where the
conclusions for this research are presented.

Chapter 2-Rice Production in Thailand
8
2 RICE PRODUCTION IN THAILAND
2.1 Introduction
This chapter introduces facts about rice production in Thailand as background
information for this thesis. It starts by describing the historical background of Thai rice
production, and reporting recent national rice production and export statistics. This is
followed by describing the steps involved in rice production processing and co-products
derived, along with presenting a literature review on environmental issues of rice
production. The last section summarizes the key points discussed in this chapter. The
overview of this chapter highlights an importance of rice production in Thailand, and
points out the problem of rice husk disposal. Moreover, it argues the need to ensure that
rice husk is used in ways that harm the environment least.
2.2 Historical Background
Various records available indicate that rice cultivation in Thailand has existed for more
than 5,000 years. The oldest evidence (approximately 3,500 BC) is the burned rice husk
used in pottery making of the prehistoric community found in an excavation site called
‘Non Nok Tha’ in Phu Wiang District, Khon Kaen Province, which is in the north east
part of Thailand. There is also evidence in the form of cave art and artefacts in different
parts of Thailand, telling stories of rice cultivation, which reflects the way of life of
farmers in those historical periods. For example, there is a painting with red dye on rock
(over 2,000 years old) at Pha Taem - Khong Chiam Cave Art Cultural Site in Khong
Chiam District, Ubon Ratchathani Province, which displays a picture of people chasing
animals away from the paddy field. Artefacts related to rice cultivation were also found
in burial mounds at the Noen U-lok archaeological site, Non Sung District, Nakhon

Chapter 2-Rice Production in Thailand
9
Ratchasima Province (about 146 AD). This is where charred rice grains and agricultural
equipment such as machetes, scythes, or spear blades were discovered. This evidence
suggests that humans have known how to cultivate rice since 3,500 BC (Thai Rice
Foundation under Royal Patronage 2006)1. This implies that rice has always been a vital
source of food for Thais. Moreover, rice has also become important goods of Thailand.
In the past, rice was only grown as household food. Nowadays, rice is not only
cultivated for consumption within the country, it is also cultivated for export.
2.3 Rice Production and Export Statistics
Thailand is one of the leading rice producers in the world. It is currently ranked as the
seventh largest rice producer. In 2007, Thailand produced approximately 32 million
tonnes of rice (see Table 2.1). Although currently Thailand is not the largest rice
producer in the world, it has been the largest rice exporter in the world since 1975
(International Rice Research Institute 2008b). This is because the nation can produce
more rice products than it consumes (Department of Foreign Trade 2007, 2008;
International Rice Research Institute 2008b). Figure 2.1 shows the trend and gradual
increase in rice product exports over the recent period. If this trend continues, it
indicates that increasing quantities of rice products will be produced along with
increased quantity of rice husk.
1
More information about the Thai Rice Foundation under Royal Patronage can be found on
http://www.thairice.org/eng/

Chapter 2-Rice Production in Thailand
10
Table 2.1 Rice yield of major countries, 2005-2007
Production (1,000 tonnes)
Country 2005 2006 2007
World total 631,869 644,490 654,413
China 182,059 184,128 185,490
India 137,690 139,137 141,134
Indonesia 54,151 54,455 57,049
Bangladesh 39,796 43,504 43,504
Viet Nam 35,791 35,827 35,567
Myanmar 25,364 30,600 32,610
Thailand 30,292 29,642 32,099
Philippines 14,603 15,327 16,000
Brazil 13,193 11,527 11,080
Japan 11,342 10,695 10,970
Others 87,588 89,648 88,910
Source: Office of Agricultural Economics (2007a)
0
2000
4000
6000
8000
10000
12000
19
60
19
63
19
66
19
69
19
72
19
75
19
78
19
81
19
84
19
87
19
90
19
93
19
96
19
99
20
02
20
05
20
08
Year
10
00
to
nn
es
Figure 2.1 Thailand export of milled rice
Source: Modified from International Rice Research Institute (2008b)

Chapter 2-Rice Production in Thailand
11
Rice is grown in different parts of Thailand and it is cultivated in two seasons, the rice
products generated in these seasons are called major rice and second rice respectively.
Water required for major rice growing comes from rain while for the second rice it
comes from irrigation. Therefore, the major rice crop can only be cultivated in the rainy
season, unlike the second rice crop which can be grown in any season.
The main rice producer regions in Thailand are the north eastern and the central plain.
The north eastern region produces most of the major rice products since it has the largest
rice planted area. The central plain region generates most of the second rice2 because
this area has good irrigation systems. Table 2.2 and Table 2.3 show the proportion of
major and second rice production and planted areas of different regions compared to that
of the whole kingdom. The north eastern region produces almost half of the major rice
yield; while the central plain produces more than half of the second rice yield of the
whole country. Since these two regions produce most of the rice products in the nation,
they are also the main sources of rice husk. Data (about rice husk utilization in Thailand)
employed in this research (presented in Chapter 6) come from these two regions.
2
The water required for the major rice crop comes from rain while for the second rice crop, it comes from
irrigation.

Chapter 2-Rice Production in Thailand
12
Table 2.2 Major Rice: Planted area and production by region, 2005-2007
Planted area (rai) Production (tonnes) Region
2005 2006 2007 2005 2006 2007
Whole Kingdom
57,773,844 57,541,825 57,385,921 23,539,186 22,839,695 23,308,385
Northern
12,758,306 12,786,349 12,779,212 6,724,953 6,455,397 6,610,217
North
Eastern
33,002,755 32,711,384 32,773,544 10,441,986 10,292,959 10,377,733
Central Plain
9,910,249 9,946,075 9,814,339 5,597,137 5,291,414 5,515,207
Southern
2,102,534 2,098,017 2,018,826 775,110 799,925 805,228
Source: Office of Agricultural Economics (2007b)
Note: 1 rai = 1,600 square meters
Table 2.3 Second Rice: Planted area and production by region, 2006-2008
Planted area (rai) Production (tonnes) Region
2006 2007 2008 2006 2007 2008
Whole Kingdom
9,902,785 10,074,148 12,801,226 6,752,684 6,802,176 8,791,016
Northern
3,331,086 3,477,315 4,476,226 2,268,203 2,311,107 3,061,153
North eastern
658,058 900,130 1,263,292 319,292 478,412 685,058
Central Plain
5,716,711 5,485,903 6,725,838 4,071,713 3,909,721 4,876,470
Southern
196,930 210,800 335,870 93,476 102,936 168,335
Source: Office of Agricultural Economics (2008)
Note: 1 rai = 1,600 square meters
Chapter 2-Rice Production in Thailand
13
2.4 Rice Production and Environmental Issues
Basically, rice production can be divided into five main steps: land preparation,
cultivation, harvesting, drying and milling. In the following sections, the information
about rice cultivation and production comes from the International Rice Research
Institute (2003), Rice Department (2008) and Siamwalla & NaRanong (1990). The
environmental issues arising out of each step in rice production are discussed
respectively.
2.4.1 Land preparation
Land preparation consists of a set of ploughing practices. It has the functions of getting
rid of weeds, preparing the soil to an optimal physical condition and levelling the soil
surface. This would benefit plant establishment and crop growth. Land preparation
practices differ from field to field depending on crop establishment practices (see section
2.4.2). In general, land preparation consists of the following procedures:
Primary ploughing
This is the first ploughing work carried out at the beginning of the next rainy season,
after the crop harvesting season. This ensures that the soil has enough moisture to enable
the soil to be ploughed easily. It is the most aggressive tillage practice since the soil has
been packed up for some time. The aims of this primary ploughing are to aerate the soil,
cut crop residues and kill weeds. The soil is tilled to reach a reasonable depth (10-15 cm)
so the weeds’ roots are cut up and buried, while some of them are killed by being
exposed to the sun. The ploughed soil is left to dry in the sun for one to two weeks.

Chapter 2-Rice Production in Thailand
14
Secondary ploughing
Secondary ploughing is undertaken after the first ploughing and once the soil has been
allowed to dry for the desired period. It is normally less aggressive and shallower than
the primary ploughing. This ploughing is done in the opposite direction to the first
ploughing. It aims to kill weeds that have re-grown since the completion of the first
ploughing is completed and to reduce soil aggregate size. This secondary ploughing may
be repeated several times depending on soil type, type and quantity of weeds and
moisture content of the soil.
Harrowing
The last stage in land preparation is harrowing. This is done by using peg tooth harrows
to puddle the soil. The aims of this stage are to remove weeds and crop residues from the
field, to reduce soil aggregate size for crop growth and to level the farm land for water
management purposes. To assist the transplanted crop to become established (see section
2.4.2), harrowing is repeated a couple of times before water is flooded into the field to
prepare it for the scheduled transplanting.
Over all, land preparation has certain impacts on land resources. It makes the soil more
compact. When the soil becomes more compact, it loses its permeability and capacity for
infiltration, and this changes the physical and chemical characteristics of the soil. As a
consequence, the soil is prone to superficial erosion and nutrient wash (United Nations
Environment Programme 2005).
As land preparation has become more mechanized these days, the main environmental
issue arising from land preparation seems to be the energy consumption entailed
(Chamsing et al. 2005). Traditionally, land preparation was done by human and animal
labour. Nowadays, modern rice cultivation systems have used a range of machinery in
land preparation as well as in the planting and harvesting stages. Chamsing et al. (2005)
conducted an evaluation of how farmers in six selected provinces in central Thailand

Chapter 2-Rice Production in Thailand
15
used machinery in land preparation. It was found that 98 percent of research participants
used machinery for their land preparation. The use of machinery in land preparation
varied depending on the cultivation method, land size and irrigation system.
Gajaseni (1995) undertook an energy analysis of traditional and modern wetland rice
cultivation system practices, focusing on human and animal labour, tools and machinery,
planting stock (seed), chemical compounds, natural service (nutrients from flooding and
mulch), and yields of grain. It was found that the main energy input for traditional
practices relied on organic matter from flooding, while modern practices depended upon
industrially based input such as machinery, tools, chemical fertilizers and pesticides
(accounting for up to 69 % of total energy input). To increase rice yield and facilitate the
production process, modern practices have tended to have a larger energy input, which
has resulted in lower energy efficiency. Interestingly, this research found that the ratio of
total grain output to total grain input of modern practices was lower than that of
traditional practices.
Good practices in using machinery are very important for rice cultivation. Improper use
of machinery can result in yield losses, higher investment costs, and soil compaction.
For example, using unnecessarily large machinery can cause soil compaction. Once the
soil gets compacted, the land preparation by smaller machinery becomes very difficult.
This results in a higher consumption of fuel, water and fertilizer, which means higher
investment costs are required (Chamsing et al. 2005).
2.4.2 Cultivation
The rice cultivation discussed in this section includes plant establishment, water
management, nutrient use and pest management.

Chapter 2-Rice Production in Thailand
16
Plant establishment
Plant establishment is categorized into two main types: direct seeding and transplanting.
Direct seeded rice crop is grown directly from rice seeds. In highland areas, rice seeds
are planted in a small pit which is then filled up with soil. In the areas where more rain is
available, the seeds are normally broadcasted onto the soil and then incorporated by
harrowing or tilling depending on soil type, moisture levels in the soil and rainfall.
Direct seeded rice crop is planted by either dry or pre-germinated seeds. This is because
some soil conditions are not conductive to the germination of rice seeds, therefore the
seeds are pre-germinated before broadcasting.
Transplanting is the method of planting rice by growing seedlings in a nursery before
transferring them to the field. This planting method is practiced widely in Thailand. This
is because the transplant distance between the rice plant hillocks can be controlled and
so it makes weed control easier. Although transplanting requires less seed than direct
seeding, it needs much more labour and the crop takes longer to grow due to
transplanting shock.
Water Management, nutrients and pest management
For lowland rice cultivation, where good water supply is available, the water level in the
rice field is controlled to suit the different growing stages of rice. Rice is a semi-aquatic
plant; it requires a high amount of water to grow, especially in the reproductive stage.
The total water requirement is affected by several factors such as evapotranspiration,
permeability of soil, drainage, length of growing season and type of rice grown.
Nutrient management practices vary depending on the rice crop planting method, soil
type, and rice species. Fertilizers used in the rice fields can be both chemical and
organic. These two types of fertilizers contain different kinds of nutrients which benefit
the growth of rice in different ways. Organic fertilizers contain micronutrients and
microorganisms which are not usually contained in chemical fertilizers. They benefit

Chapter 2-Rice Production in Thailand
17
rice crop growth and soil health. However, organic fertilizers are often low in the major
nutrients needed for rice growth, such as nitrogen, phosphorus and potassium. Therefore,
using both chemical and organic fertilizers in combination is recommended for higher
yields. Pest and weeds management practices differ in different ecosystems of the rice
fields. This depends upon different factors such as cultivation area, growing season and
crop growing stage3.
Rice cultivation is considered to be one of the major contributors to greenhouse gases in
the agricultural sector, especially wetland rice cultivation, which is the main rice
planting practice in Thailand. However, it is considered to be a much smaller greenhouse
gases source compared to other sectors in the country. Rice cultivation releases about 10
percent of the total greenhouse gases produced by Thailand (Smith 2007; Towprayoon
2005). Wetland rice systems contribute methane and nitrous oxide emissions. Methane is
caused by anaerobic conditions in the paddy field soil, and these conditions occur due to
the continuous water supply required for rice growing. The amount of methane emitted
from a rice field depends on several factors such as soil type and the properties of soil,
rice species, climate, cultivation method, and water and nutrient management.
While much research has proven that continuous flooding in rice field causes methane
emissions, drainage flooding and re-flooding is found to cause a release of nitrous oxide.
Nitrous oxide is formed when aeration occurs during the draining and re-flooding stages.
Although drainage helps reduce methane emissions, it also increases nitrous oxide
emissions. In addition, as water supply is crucial for the growth of rice, drainage of the
water used for the rice crop can cause yield losses. Towprayoon et al. (2005) observed
methane and nitrous oxide emissions of different water drainage systems in rice fields in
central Thailand. In their research, attempting to find methods which decrease methane
and nitrous oxide emissions while also optimize rice yield, they found that methane
emission reduction can occur by draining during the rice flowering period. Nitrous oxide
emissions were related to the duration rather than the frequency of draining, so fewer
3
More information on water management, nutrients and pest management in rice field can be found in
International Rice Research Institute (2003) and Rice Department (2008).

Chapter 2-Rice Production in Thailand
18
drain days result in a reduction of nitrous oxide emissions. Mid-season drainage method
which drains the field 73 days after planting (i.e. during the flowering period) causes the
lowest yield reduction. Hence, to achieve a compromise between mitigation of
greenhouse gases and rice yield, a mid-season drainage during the flowering period by a
shortened draining duration was recommended.
Wetland rice cultivation is water consuming. As a consequence, it releases emissions to
water when draining. Also, the practice of draining fields results in releasing water into
the environment. This water is polluted with fertilizers and pesticides used in the rice
fields. The concentration of these chemicals differs from one field to another as
fertilizers and pesticides required in each field are varied depending on such different
factors as just discussed above.
2.4.3 Harvesting
Rice is normally harvested approximately 28-35 days after the rice forms a head
(heading). When rice grains are ready to be harvested, farmers will drain the field about
10 days prior to harvest. Rice harvesting can be undertaken manually or mechanically
depending on the conditions of the harvest field and the costs involved. The harvesting
process consists of cutting panicles and part of the stalk above the ground out of the
field, threshing rice grains from non-grain parts, and cleaning and bagging the grain
before transport and storage. Deciding the right time and right way of harvesting is
important as it maximizes grain yield and minimizes yield losses.
After harvesting, solid residue such as rice straws are left in the rice field. Normally this
residue ends up being burnt in the open air within the field. Due to the high cost of rice
straw utilization facilities and for the need to proceed quickly with planting the next
paddy crop, collecting rice straws out of the field does not interest farmers. The most
common practice of rice straw disposal is still burning and this causes local air pollution
(Suramaythangkoor & Gheewala 2008).

Chapter 2-Rice Production in Thailand
19
2.4.4 Drying and milling
After harvesting, the next step is drying rice grains received from the fields (rice covered
with husk, also called paddy rice, or ‘paddy’). This process is important for storage and
milling purposes. Paddy rice with the appropriate moisture content gains higher
commercial prices and higher milled rice yields. There are different methods of paddy
grain drying. Paddy rice is traditionally dried in the sun. This is the simplest method and
is the most common one in Thailand; it costs very little and it is environmentally
friendly since the sun is used as the heat source so there is no emission from the drying
process. However, this method needs intensive labour and it is difficult to control grain
temperature. There is a range of mechanical paddy dryers which are suitable for
different conditions, depending on the amount of paddy rice to be dried and its moisture
content
The last step before white rice products are derived is milling. This process normally
starts with cleaning the paddy rice, then de-husking the rice to remove the rice husk to
give brown rice. After that, sieving separates the husk from the brown rice. Before
polishing the brown rice to white rice (where the bran layer is removed from the kernel),
some small stones and inert matter picked up by paddy during the harvesting and
handling processes are taken out. After polishing, white rice contains a mix of head rice
which is 75 percent or more of the whole kernel, and large and small broken kernels.
These rice products will then be separated by a sifter. Finally, the head rice and the
broken rice are mixed to meet the requirements of the customers before packing rice
products for sale. Rice grades in the market contain 5-25 percent of broken rice
depending on country’s standards.
Low quality of paddy, inefficient harvest and post harvest practices and inappropriate
milling equipments often result in milled rice yield losses. A new technique used to help
maximize head rice yield produced from the mill is parboiling. Parboiled rice is obtained
by steaming and then having paddy rice dried before milling. This technique helps
improve milling quality by reducing rice kernel breakage. The heat from hot steam

Chapter 2-Rice Production in Thailand
20
strengthens rice grains, therefore when milled, less breakage occurs so a higher head rice
yield is gained.
Rice milling (including transportation of paddy rice to the rice mill) is an energy
demanding and polluting activity (Nadsathaporn 2007). Transportation requires fossil
fuels for vehicles which pollute the local air. The milling process generates solid residue
such as rice husk, bran and fine broken rice. It also releases pollution such as particulates
which can cause respiratory problems to humans. A rice mill consumes a large amount
of energy; it uses energy from electricity and rice husk left after the milling process (see
section 6.3.1 for more discussion on the use of rice husk in the rice mill). Moreover,
burning rice husk in a rice mill for energy purposes causes air pollution and solid waste
such as carbonized rice husk ash.
Solid residue generated from the rice milling process such as rice husk, bran and fine
broken rice are then sold to other users or used within the mill itself. Bran and fine
broken rice are sold to use in other applications such as animal feeding, while some rice
husk is used as an energy source within the mill itself. As the rice mill generates a large
amount of rice husk (accounting for more than 50 percent of all rice co-products
produced by the rice mill), not all rice husk is consumed within the mill. Some rice husk
remains within the mill, and the rice mill owner has to take a responsibility for dealing
with this rice husk. To find out ways of dealing with this rice husk, there is much
research on the utilization of rice husk and rice husk ash conducted and some of these
applications have been used on an industrial scale (these will be discussed in more detail
in Chapter 3). A review of the current and potential uses of rice husk in Thailand will be
discussed in Chapter 6.

Chapter 2-Rice Production in Thailand
21
2.4.5 Co-products of rice production
Rice production generates a large amount of co-products, approximately 3.5 times the
weight of paddy rice produced. The co-products can be classified into two main groups:
co-products generated in the rice field after harvesting and those generated in the rice
mill. Co-products from the rice field consist of rice straw and immature rice grains, and
co-products from the rice mill are rice husk, bran and fine broken rice (see Figure 2.2)
(Tauon & Panchapan 2002). It shows that for every production of 60 kg of white rice,
350 kg of by products are generated. Among these co-products, the co-product in the
rice fields such as rice straw constitutes the largest amounts (accounting for about 86
percent of all co-products). However, the rice straw is normally burned within the rice
fields (discussed in section 2.4.3). For co-products within the rice mills, rice husk
constitutes the largest quantity (more than 50 percent). As discussed in section 2.4.4,
some rice husk has been used internally as an energy source within the mills. However,
there is still some unused rice husk remaining in the mills. To assess the preferable
means of using this residue, the goal of this research is to investigate the current and
potential uses of rice husk left over from the rice milling process (apart from use within
the mills) and to analyse the environmental impacts of these uses in order to identify the
most environmentally friendly rice husk use in Thailand (see section 1.2).

Chapter 2-Rice Production in Thailand
22
Figure 2.2 Co-products of rice production
Source: Adapted from Tauon & Panchapan (2002)
2.5 Overview
Rice cultivation in Thailand has a very long history. It was found that rice has been
grown in the country for more than 5000 years. Thailand produces a large amount of rice
annually, and rice production plays an important role in the Thai economy. The nation
has been a large rice exporter for decades. Rice production consists of land preparation,
cultivation, harvesting, paddy drying and milling. The main environmental issues
associated with rice production are global warming and energy consumption. From the
later stages of rice production, co-products contain residue generated in the rice fields
(rice straw and immature grains) and residue produced by the rice mills (rice husk, bran
and fine broken rice). Within the rice fields, co-products such as rice straw is disposed of
by open-air burning. In the rice mills, some residue such as bran and broken rice are sold
Paddy rice yield For example 100 kg
White rice
~ 60 kg
All co-products ~ 350 kg
Co-products in rice field
~ 306 kg
Co-products in rice mill ~ 44 kg
Rice straw ~ 301 kg
Immature grains ~ 5 kg
Rice husk ~ 23 kg
Bran ~ 9.5 kg
Fine broken rice ~ 11.5 kg
Co
-pro
du
cts
Main product

Chapter 2-Rice Production in Thailand
23
out to other users. Some rice husk has been employed as an energy source within the rice
mills. However, there is still some unused rice husk remaining in the mills. Although,
there has been much research involved in dealing with such rice husk left over from the
milling process and even some applications have actually been used on an industrial
scale (discussed in more detail in the next chapter (Chapter 3)), the environmental
impacts associated with these rice husk uses have not yet been widely investigated.
While there is a need to find ways to deal with rice husk remaining from the milling
process, it is also important to ensure that this husk is used in ways that harm the
environment least. The later parts of this thesis (Chapter 6 and Chapter 7) will
investigate the major current and potential uses of rice husk in Thailand and analyse the
environmental impacts of these alternative uses of rice husk. The findings from Chapters
6 and 7 will be used to help to identify the most environmentally friendly rice husk use
(discussed in Chapter 8).

Chapter 3-The Utilization of Rice Husk and Rice Husk Ash
24
3 THE UTILIZATION OF RICE HUSK AND RICE HUSK
ASH
3.1 Introduction
The previous chapter (Chapter 2) highlighted the need to ensure that rice husk is used in
ways that harm the environment least. The purpose of this chapter is to review the
literature on the utilization of rice husk and rice husk ash in general, both in the
international and Thai contexts. Chapter 6 will present a detailed discussion of current
and potential rice husk utilization in the Thai context. This chapter starts by providing
descriptions of rice husk and rice husk ash and their characteristics. This is followed by
a discussion on a range of studies on the uses of rice husk and rice husk ash as well as
the environmental issues associated with their uses. Finally, Thailand’s policies related
to the utilization of rice husk are discussed. This chapter ends with a summary of the key
points discussed in it.
3.2 Characteristics of the Materials
3.2.1 Rice husk
Rice husk or rice hull is one of the co-products of rice processing in the rice mills. The
husk is produced in the first stage of the milling process, when paddy rice is husked and
then the husk is removed from other parts of the rice grain. The percentage of rice husk
in paddy rice varies across different countries and this is influenced by various factors
such as rice species, cultivation area, soil fertility, weather, irrigation efficiency, farming
practices etc. (Beagle 1978; Bhattacharya et al. 1999). However, 20 percent is generally
considered as a fair average for general rice husk (Beagle 1978; International Rice

Chapter 3-The Utilization of Rice Husk and Rice Husk Ash
25
Research Institute 2008a). In Thailand, the percentage of rice husk in paddy rice may
vary across the country because of such factors. Nevertheless, the figure used in this
thesis is 23 percent of rice paddy weight. This has been taken from the figure that has
frequently been used in recent literature: Prasertsan & Sajjakulnukit (2006), Papong et
al. (2004), Suwannakhanthi (2004), Tauon & Panchapan (2002) and National Energy
Policy Office (2002).
Physically, rice husk itself (as distinct from rice husk ash) is abrasive, light and bulky.
This makes it difficult to handle; it requires large indoor space for storage, as it can be
easily blown by the wind. Moreover, its bulky characteristics can make its transportation
difficult. For example, the trucks with a carrying capacity of 50 tonnes of paddy rice can
only carry 10 tonnes of rice husk, and this makes it costly to transport rice husk (Beagle
1978).
The components of rice husk differ from country to country4 (Beagle 1978). For
Thailand, the composition of rice husk from different regions can be slightly different.
Table 3.1 shows the composition of Thai rice husk from selected literature. This shows
that, in general, carbon and oxygen are the main chemical elements in rice husk. This
composition originates in the photosynthesis process during the growth phase of rice.
Beagle (1978) explained that the carbon fixed in rice husk results from solar conversion
of carbon dioxide and water in photosynthesis. The carbon contained in rice husk is
beneficial to some industrial applications as discussed in section 3.3.
Compared with other agricultural residues, rice husk has distinctive features, such as a
relatively high heating value and low moisture content. This indicates that rice husk is a
potential good fuel. Rice husk has a higher content of ash as compared to other
agricultural residues (the properties of rice husk ash are discussed in section 3.2.2).
However, when compared with other fuels such as coal, rice husk has a lower ash
content. Table 3.2 shows these properties of rice husk compared to other Thai
4
More information about the compositions of rice husk from different countries can be found in Beagle
(1978).

Chapter 3-The Utilization of Rice Husk and Rice Husk Ash
26
agricultural residues and coal. Note is taken that the Thai coal stated in this table is
lignite. According to Sampattagul et al. (2004), most of the coal reserves in Thailand are
low quality lignite with a low heating value. The properties of rice husk contained in
Table 3.2 are the average of the data from the three different sources in Table 3.1.
Table 3.1 Composition of rice husk
Parameter Unit Rice husk 1 a Rice husk 2
b Rice husk 3
c
Carbon % wt. 37.13 42.80 38.00
Hydrogen % wt. 4.12 4.48 4.55
Oxygen % wt. 31.60 29.33 32.40
Nitrogen % wt. 0.36 0.37 0.69
Sulphur % wt. 0.05 0.02 0.06
Ash % wt. 17.75 15.70 14.00
Moisture % wt. 9.00 7.30 10.30
Lower heating value MJ/kg 13.61 15.70 14.98
Source: a from CDM – Executive Board (2006)
b from Janvijitsakul & Kuprianov (2008)
c from Madhiyanon et al.(2006)
Note: All values were analysed on as received basis.
Table 3.2 Selected properties of rice husk compared with other Thai fuels
Properties Rice husk a Bagasse
b Saw dust
c Lignite
d
Lower heating values (MJ/kg) 15.82 7.32 13.90 11.13
Moisture content (% wt.) 8.87 53.00 15.90 30.20
Ash content (% wt.) 14.76 1.84 0.61 25.40
Source: a average values from Table 3.1
b from Kiatkittipong et al. (2009)
c from Permchart & Kouprianov (2004)
d from Sampattagul et al.(2004)
Note: All values were analysed on as received basis.

Chapter 3-The Utilization of Rice Husk and Rice Husk Ash
27
Rice husk has low nutritional values and an abrasive character. Hence, it is not normally
used to feed animals. Table 3.3 shows the nutritional components of rice husk. Note is
taken that due to the difficulty in finding any literature on the nutritional components of
the Thai rice husk specifically, the data shown in this table are the components of
general rice husk taken from Beagle (1978). These data were derived from analyses of
rice husk worldwide over a hundred-year period and are shown as a range of values.
From Table 3.3, it can be seen that rice husk contains very low amounts of protein and
fat. On the other hand, it contains high carbohydrate components (such as cellulose and
pentosans) and lignin, which is a chemical compound bound with the cell wall of
celluloses. Therefore, rice husk can be a potential source of cellulose and lignin (the
study of using cellulose and lignin from rice husk is discussed in section 3.3).
Table 3.3 Nutritional components of rice husk
Component % wt.
Moisture 2.40-11.35
Crude protein 1.70-7.26
Crude fat 0.38-2.98
Ash 13.16-29.04
Pentosans 16.94-21.95
Cellulose 34.34-43.80
Others (mainly lignin) 21.40-46.97
Source: Beagle (1978)
3.2.2 Rice husk ash
Rice husk ash is the residue remaining after burning rice husk. The characteristics of rice
husk ash vary depending on burning conditions and rice husk sources. The residue of
rice husk burning at low temperature, which leads to the presence of carbon, is
sometimes called char. Al-Khalaf & Yousif (1984) commented that rice husk ash

Chapter 3-The Utilization of Rice Husk and Rice Husk Ash
28
remaining from the open-air burning, which is normally practiced in villages (usually at
a temperature lower than 300° C), contains high levels of carbon.
Table 3.4 shows the composition of Thai rice husk ash obtained from different sources
as examples. These are the ash obtained from using rice husk as a fuel in power plants
and rice mills and the ash prepared in the laboratory for use as cementitious material.
This rice husk ash was produced in different burning conditions and the husk was from
different parts of Thailand. Note is taken that these data only refer to the properties of
the rice husk ash produced from the procedures and the rice husk sources stated in
Chatveera & Lertwattanaruk (2009) and Prasara-A (2004). The data shown in Table 3.3
indicate that different burning conditions and sources of rice husk result in different
characteristics in the ash. However, in general, the major chemical element (about 90
percent) of rice husk ash is SiO2.
Table 3.4 Composition of the Thai rice husk ash from different sources
Rice husk ash source Parameter Unit
Power plant a Rice mill a Laboratory b
SiO2 % 92.50 88.50 93.41
Al2O3 % 1.20 1.10 0.08
Fe2O3 % 2.10 2.00 0.31
SO3 % 0.10 0.10 0.17
CaO % 0.90 0.90 1.17
MgO % 0.40 0.40 0.38
K2O % 2.00 2.60 *
Na2O % 0.00 0.00 *
Loss on ignition (LOI) % 0.90 0.90 2.35
Source: a from Chatveera & Lertwattanaruk (2009)
b from Prasara-A (2004)
Note: * not analysed

Chapter 3-The Utilization of Rice Husk and Rice Husk Ash
29
The husk, if burned at high temperatures in the presence of oxygen, yields ash with a
high content of silica (more than 90 percent by weight) which is seen as the most
advantageous property of rice husk ash compared to ash obtained from burning other
solid fuels (Muthadhi et al. 2007). However, the burning conditions of rice husk result in
different forms of rice husk ash, the crystalline and amorphous forms, and these different
forms benefit different applications. While amorphous silica had been proven to be
useful in the cement, construction, and rubber industries (Mehta & Pitt 1976), crystalline
silica has been found to be useful for products such as steel, ceramics and refractory
bricks. Nevertheless, crystalline silica is considered to be carcinogenic, and so this may
limit its uses in the future (Bronzeoak Ltd. for Department of Trade and Industry 2003).
Hwang & Chandra (1997) suggested that burning time and furnace environment affect
the rice husk ash properties, such as the silica form and the surface area of ash particles.
Table 3.5 shows the ash properties produced from different burning conditions of rice
husk. From this table, it can be seen that burning rice husk at temperatures below 700° C
provides amorphous silica which has a high surface area. However, the surface area is
influenced by the holding time. Moreover, it indicates that when burning rice husk at
temperatures over 800° C, the ash obtained is in crystalline form.
In addition, amorphous silica can be obtained by burning at temperatures lower than
500°C. Muthadhi et al. (2007) reported that the combustion of rice husk at temperatures
below 500° C with the presence of oxygen in prolonged period yields amorphous silica.
Clearly, the properties of rice husk ash depend upon the burning procedures for the husk.
As just discussed above, different characteristics of rice husk ash are useful in different
applications. Therefore, it is important to consider the appropriate burning conditions of
rice husk for specific uses of the ash.

Chapter 3-The Utilization of Rice Husk and Rice Husk Ash
30
Table 3.5 Rice husk ash properties produced from different burning conditions
Properties of rice husk ash Burning
temperature Hold time
Furnace
environment Silica form Surface area
(m2/g)
1 min 122
30 min 97 500-600° C
2 hrs 76
15 min-1 hr
moderately
oxidizing amorphous
100
700-800° C >1 hr
partially
crystalline 6-10
>800° C >1 hr
highly
oxidizing crystalline <5
Source: Hwang & Chandra (1997)
Note: Moderately oxidizing = CO2 environment
Highly oxidizing = O2 environment
3.3 Studies on Rice Husk and Ash Uses and Environmental Issues
The previous section discussed the characteristics of rice husk and rice husk ash which
make them beneficial for a number of industrial applications. In this section, the
utilization of rice husk and rice husk ash will be discussed in more detail. This section
gives an overview of the possible and actual uses of rice husk and its ash in general (in
the international context) (see Chapter 6 for the uses in Thailand particularly).
Moreover, as discussed in section 3.2, the different characteristics of rice husk and its
ash is valuable in various industrial applications. Therefore, the following sub-sections
are divided according to different purposes for which the materials are used. Note is
taken that there has been much research conducted on the utilization of rice husk and
rice husk ash worldwide and extensive publications are available. However, the
information presented in the following sections is from selected publications. The last

Chapter 3-The Utilization of Rice Husk and Rice Husk Ash
31
part of this section reviews a range of studies dealing with environmental issues arising
out of the uses of rice husk and its ash.
3.3.1 Rice husk and rice husk ash applications
Energy from rice husk
In the late 1970s, Beagle (1978) reviewed the utilization of energy from rice husk in
different countries. He reported that the husk had been traditionally utilized as an energy
source within the mill itself for over a century (Beagle 1978). He further noted that the
first recorded use of rice husk as an energy source in a rice mill (in 1880) was in Burma.
Beagle also mentioned that in many countries rice husk had been used as a fuel in
households. Some used it as a fuel for rice milling operations and for paddy drying.
Some also used it as a fuel in brick kilns. Moreover, Beagle (1978) discussed in detail
the different technologies used to convert rice husk to energy.
One of advantageous energy uses of rice husk is to use it as a fuel to generate electricity.
This use was also mentioned in Beagle (1978). He reported that two power producers (in
the Philippines and Surinam) had already been using rice husk as a fuel by then.
However, he noted that the steam generated from the boiler was used only in an
electricity generator and this steam was not used for any other purpose in the process.
At present, the technologies5 for using rice husk in power generation have evolved and
rice husk is widely employed in electricity production in many rice growing countries
including Thailand. There were early attempts to use rice husk for electricity in Malaysia
as reported in Mahamud (1986), and in Indonesia (Manurung et al. 1986). More
recently, The EC-ASEAN COGEN Programme (1998) conducted a study of the
feasibility of using biomass (including rice husk) to generate electricity in Thailand.
5 Different technologies for converting energy from rice husk into heat/electricity are discussed in The
EC-ASEAN COGEN Programme (1998).

Chapter 3-The Utilization of Rice Husk and Rice Husk Ash
32
Cogeneration is the production of heat and electricity simultaneously and such heat and
electricity are used at the same time. This comes from the idea that the heat generated
from the boiler in power production (in the form of steam) was usually not used and
wasted up to 65 % of the total heat produced (Jude 2003). To make use of this wasted
heat, the cogeneration concept was established. This technology has been successfully
used in rice mills in many rice growing countries such as Cambodia, Indonesia,
Malaysia, Philippines, Vietnam and Thailand. The electricity generated was used within
the rice mills and the surplus power was sold to customers, while the heat was used to
dry the paddy rice (Bergqvist et al. 2008; Mathias 2004; Nguyen 2005).
The conversion of rice husk to energy, by burning, obviously generates residue such as
rice husk ash. As discussed in section 3.2, this ash is valuable in various applications.
Therefore, there were some attempts to achieve an efficient generation of energy from
rice husk, while also controlling the quality of the ash generated so that it would have
useful applications. For example, Mehta & Pitt (1976) (USA) successfully produced heat
and rice husk ash for use as a semi-reinforcing filler for rubber and to make hydraulic
acid-resisting cement by mixing the ash with lime. This was achieved by burning rice
husk in their specially designed furnace. Hamad (1981) (Egypt) achieved efficient rice
husk combustion while producing silica rice husk ash.
However, in practice (on a commercial scale) the ash quality does not seem to be a
concern when using rice husk to generate power. For example, Mathias (2004) discussed
the success of electricity generation from rice husk on an industrial scale. Nevertheless,
he did not discuss rice husk ash being produced from the process of power production.
This implies that the efficiency of converting rice husk into the main product, such as
electricity/heat, seems to be preferred to the option of deriving a co-product such as rice
husk ash. More recently, Bergqvist et al. (2008, p. 11) assessed the technical and
financial feasibility of rice husk based power generation in Vietnam taking into account
the ash produced from the electricity generation process. They argued that the ash
market is less stable than the electricity market. Therefore, selling electricity seems to be

Chapter 3-The Utilization of Rice Husk and Rice Husk Ash
33
a more reliable income source. In addition, they commented that the ash quality can only
be controlled by modern combustion technologies, which may not be used by small and
medium-size rice husk power producers. This would make it difficult for them to
negotiate with the rice husk ash market as it is hard to produce ash with consistent
quality.
The use of energy from rice husk in the form of briquettes was also discovered long ago.
Beagle (1978) mentioned that there were attempts in Switzerland, Japan and India to
develop machines to produce rice husk briquettes for sale. At present, rice husk
briquettes still appear to be used in many countries, including Thailand, with a much
improved production technology. For example, Toan et al. (2005) developed a highly
efficient briquetting production system in Vietnam, with a reduction of 25 percent in
electricity consumption and less CO emission compared with the traditional production
process. In Bangladesh, the surplus rice husk from using it as a fuel in rice mills was
turned into briquettes for use in small restaurants and poor households (Ahiduzzaman
2007).
Rice husk has also been used as a fuel in cement manufacturing to substitute for fossil
fuels. Murray & Price (2008, p. 12) reported that the use of biomass (including rice
husk) as a substitute fuel for fossil fuel in cement kilns had been widely used in
countries like India, Malaysia and Thailand. Moreover, they stated that rice husk can
possibly replace up to 35 percent of the total energy demand in such kilns. In Thailand,
the Thailand Environment Institute (TEI) (2004b) reported that rice husk was also used
as a substitute fuel for fossil fuels in cement manufacturing. However, the substitution
rate of rice husk was not mentioned in their report.
Rice husk can be converted into liquid fuel such as cellulosic ethanol. Being rich in
celluloses, hemicelluloses and lignin, rice husk can be used as a feedstock for cellulosic
ethanol production. There were attempts to develop techniques of converting rice husk
into ethanol, as prsented in (Saha & Cotta 2007, 2008; Saha et al. 2005) (see these
articles for detailed procedures of the cellulosic ethanol productions). In addition, there

Chapter 3-The Utilization of Rice Husk and Rice Husk Ash
34
was research attempting to produce bio-oil from the pyrolysis of rice husk, as presented
in Williams & Nugranad (2000) (UK) and Ji-lu (2007) (China). It was found that this oil
could be used as a fuel oil in boilers or furnaces without any machine upgrading
required. Moreover, Ji-lu (2007) argued that it is possible to emulsify bio-oil with diesel
to use in diesel engines, and that bio-oil could also be refined for use as a vehicle fuel.
Nevertheless, the use of bio-oil from pyrolysis in engines has not yet been developed
and implemented on commercial scale. Stucley (2006) pointed out that one of the
weaknesses of pyrolysis oil is that it cannot yet be used in engines commercially, while
this capacity is the strength of ethanol, is that it can be blended with gasoline, producing
gasohol to use in cars directly without any engine modification. However, it should be
noted that although the conversion of rice husk into these liquid fuels seems possible, the
technologies are currently in the developmental stages.
Amorphous silica from rice husk ash
Amorphous silica is reactive silica whose properties are found to be useful in many
applications. The amorphous form of silica in rice husk ash is believed to improve
concrete performance when reacted with chemicals in Portland cement (more detail
regarding the influence of rice husk ash on concrete were discussed in Hwang &
Chandra (1997)). Some research has attempted to efficiently produce amorphous silica
from rice husk to be used in making concrete, for example, in Mehta & Pitt (1976)
(USA), Al-Khalaf & Yousif (1984) (Iraq) Maeda et al. (2001) (Japan), Nehdi et al.
(2003) (Canada) and Allen (2005) (Thailand). Note is taken that, apart from the
publications mentioned above, there are also a large number of publications dealing with
the improvement of the quality of concrete containing rice husk ash. This research
includes aspects such as testing for different properties in the concrete and the
optimization of the rice husk ash ratio in concrete etc.
Apart from using high quality rice husk ash with amorphous silica in high strength
concrete, rice husk ash can also be used to substitute cement in low cost building blocks.
For example, Cook et al. (1977) (Thailand), Stroeven et al. (1999) (Vietnam) and Nair

Chapter 3-The Utilization of Rice Husk and Rice Husk Ash
35
et al. (2006) (India) reported that rice husk ash can be successfully used to make low
cost building blocks by mixing it with lime and/or cement and aggregates. This type of
block normally contains a higher ratio of rice husk ash compared with the high strength
concrete block. However, the concrete block that contains rice husk ash provides a lower
strength than normal concrete block containing only Portland cement (without any rice
husk ash substitution). Because in rural areas Portland cement is too expensive, the idea
of using rice husk ash which is locally available to substitute for cement is believed to
make affordable low strength building block with similar standard to the conventional
masonry used in rural areas.
The use of rice husk ash in concrete mixes seems promising; however, its use has not
been widespread. Bronzeoak Ltd. for Department of Trade and Industry (2003) reported
that the use of rice husk ash in concrete commercially was found only in the USA (at
2003) but nowhere else. They further discussed that the lack of awareness of the
potential of rice husk ash and limited knowledge of production processes seem to be
barriers. They also commented that the difficulty in producing high ash quality for use in
concrete mixes (amorphous silica form) also limits its uses.
Because rice husk can be a good source of energy and obviously the silica in its ash is
beneficial in cement and concrete products, some research has attempted to make a good
use of these two useful features of rice husk. Barkakati et al. (1994) (India) successfully
used rice husk as raw material and fuel in cement manufacture. The rice husk was
burned under set conditions to obtain the ash (to be used as a raw material) before being
mixed with other raw materials to produce clinker by incineration (the husk was also
used in this process to produce heat in clinker production). The cement produced from
their process was of a similar standard as the ordinary Portland cement. Ajiwe et al.
(2000) (Nigeria), successfully produced white Portland cement using rice husk as a raw
material in the process of production (with the same standard as commercial white
Portland cement). Likewise, the ash was obtained by burning rice husk in a controlled
combustion environment before being mixed with other raw materials in clinker
production. The literature discussion about the use of rice husk ash as one of the raw

Chapter 3-The Utilization of Rice Husk and Rice Husk Ash
36
materials in cement manufacture has been limited to discussion of pilot schemes; no
literature has been found on its commercial applications.
Moreover, amorphous silica has also been utilized in other applications such as cement
admixture in the solidification of hazardous wastes. Some laboratory trials show benefits
in using rice husk ash in this application, for example in Asavapisit & Macphee (2007),
Asavapisit & Ruengrit (2005) (Thailand) and El-Dakroury & Gasser (2008) (Egypt).
However, this use of rice husk ash is under investigation and has not yet been used on a
larger scale (Asavapisit & Ruengrit 2005).
Another beneficial use of amorphous ash is using it as filler in rubbers/plastics/polymers.
This is based on the idea that the properties of amorphous silica in rice husk ash have
been found to be similar to the properties of commercial fillers used. Hence, rice husk
was successfully tested to use as a filler in rubbers/plastics/polymers as appeared in
some laboratory tests, for instance, in Mehta & Pitt (1976) (USA), Ishak et al. (1997)
(Malaysia) and Costa et al. (2006) (Brazil). Though literature shows the success of using
rice husk ash as a filler in rubbers/plastics/polymers, its use on an industrial scale is not
yet in practice. Bronzeoak Ltd. for Department of Trade and Industry (2003)
commented that the use of rice husk ash in this application seemed far from market
ready.
Crystalline silica from rice husk ash
The crystalline form of silica has the special feature that it is resistant to burning, which
is useful in steel, thermal insulator, refractory brick and ceramic production. Some
research attempted to make use of this feature of rice husk ash in thermal insulator and
refractory brick production. For instance, Kapur (1980) (India), Ahmed et al. (2005)
(Bangladesh) and Gonçalves & Bergmann (2007) (Brazil) reported that it is feasible to
use rice husk ash in thermal insulator and refractory brick production. In addition, some
literature that was found shows success in using rice husk ash as a composite material in
ceramic production, for example in Padhi & Patnaikb (1995) (India), Kurama & Kurama

Chapter 3-The Utilization of Rice Husk and Rice Husk Ash
37
(2008) (Turkey) and Siqueira et al. (2009) (Brazil). Moreover, Bronzeoak Ltd. for
Department of Trade and Industry (2003) reported that rice husk ash has been
commercially used as an insulator in the steel industry. They also discussed that the
market for rice husk ash use in the steel industry has been large. In addition, there has
also been a small market for its use in refractory brick. However, they also mentioned
that the crystalline form of silica which is required for the steel industry is carcinogenic.
Therefore, they argued that the market for the use of rice husk ash in this industry would
remain stable in the future.
Other applications
Apart from the main uses of rice husk mentioned above, there are also some other minor
uses. For example, some research found that chemicals such as silicon carbide, silicon
tetrachloride and potassium silicate can be produced from rice husk to use in industrial
processes (Jain et al. 1994; Seo et al. 2003; Sujirote & Leangsuwan 2003). Moreover,
there have been successful attempts in producing useful materials such as activated
carbon, zeolite and solar grade silicon from rice husk (Chareonpanich et al. 2004;
Daifullah et al. 2004; Jain et al. 1994; Patel et al. 1987; Prasetyoko et al. 2006).
However, these uses of rice husk seem to be currently more concentrated on the
laboratory scale and are not yet commercially used. However, Bronzeoak Ltd. for
Department of Trade and Industry (2003) argued that the uses of rice husk in the silicon
chip industry and to produce activated carbon have market potential in the future.
Carbonized rice husk can be used as an oil adsorbent (Kumagai et al. 2007), however, its
use was limited to the US only (based on data up to 2003). Moreover, some minor local
uses such as using rice husk as livestock bed material and using rice husk ash as soil
stabilizer and insecticide have been reported (Ahiduzzaman 2007; Beagle 1978;
Bronzeoak Ltd. for Department of Trade and Industry 2003)

Chapter 3-The Utilization of Rice Husk and Rice Husk Ash
38
3.3.2 Environmental issues
Although one of the objectives of the research on rice husk utilization is to find ways of
disposing of rice husk to replace the dumping and open-air burning of the husk which
causes local pollution (as mentioned in the literature discussed in section 3.3.1), the
environmental impacts associated with the different utilization processes of rice husk
have not yet been widely investigated.
While there is a massive number of publications available about the possibilities and the
actual uses of rice husk and rice husk ash, the literature about the assessment of
environmental issues related to the applications of rice husk and rice husk ash is rather
limited. Most studies seem to focus on the technical and economical aspects of the
applications, and not much on the environmental aspects has been found. Nevertheless,
the literature found about the environmental issues associated with the uses of rice husk
and the ash is discussed as follows:
There have been some attempts to measure the emissions emitted from burning rice
husk. For example, Permchart & Kouprianov (2004) (Thailand) measured the emissions
from burning different biomass fuels including rice husk in a single fluidized-bed
combustor (FBC) with a conical bed using silica sand as the inert bed material.
Emissions such as CO, NO and O2 were measured. In this study, the concentration of
CO emissions was used as one criterion to select the fuels to be used in this combustion
system.
Fang et al.(2004) (China) conducted the experimental study on using rice husk as a fuel
in a circulating fluidized bed. This study aim was to find out the optimized operating
conditions yielding the highest combustion efficiency. As part of the study, emissions
such as CO, SO2 and NOx when burning rice husk in proper conditions in the circulating
fluidized bed were measured. This recording process was part of the study to assess the
performance profile of the circulating fluidized bed using rice husk as a fuel at the
optimized operating conditions.

Chapter 3-The Utilization of Rice Husk and Rice Husk Ash
39
Madhiyanon et al. (2006) (Thailand) designed a new combustion system called a novel
cyclonic fluidized-bed combustor which integrates cyclonic and fluidized-bed
combustion into one combustor. Rice husk was used as a fuel to test this newly designed
combustion system. To assess the performance of this newly designed combustor, CO,
NOx, and O2 emissions were measured. The concentrations of these emissions were used
as one indicator to determine the success of this combustion system.
Janvijitsakul & Kuprianov (2008) (Thailand) monitored concentrations of CO and NOx
and twelve polycyclic aromatic hydrocarbons (PAHs): acenaphthylene, fluorene,
phenanthrene, fluoranthene, pyrene, benz[a]anthracene, chrysene, benzo[b]fluoranthene,
benzo[k]fluoranthene, benzo[a]pyrene, dibenz[a,h]anthracene and indeno[1,2,3-
cd]pyrene emitted from burning rice husk in a fluidized-bed combustor with a cone-
shaped bed. These concentrations were used to consider the optimum excess air input
into the combustor.
Dong et al. (2007) (China) attempted to reduce NO emissions from using biomass chars.
They compared NO emissions from burning three biomass chars (sawdust, rice husk and
corn straw) and bituminous coal char in a fixed bed quartz reactor. They concluded that
the characteristics of biomass char governed NO emission released. In addition, the
biomass char produced by high temperature pyrolysis is less active in reducing NO.
Moreover, they reported that the presence of CO, O2 and SO2 improve the reduction of
NO. Finally, they suggested an optimum bed height in the burning reactor for the highest
NO reduction.
However, the measurements of emissions caused by burning rice husk in the different
systems discussed above seem to be part of the investigation of the new developed rice
husk energy technologies. This was used as one of the indicators to test the efficiency of
the newly designed burning systems. Moreover, these systems were only on an
experimental scale, and only selected emissions were measured. Some literature has
provided information on the assessment of emissions released from the actual rice husk

Chapter 3-The Utilization of Rice Husk and Rice Husk Ash
40
use practices. Kim Oanh et al. (2005) investigated emissions of particulate matter (PM)
and polycyclic aromatic hydrocarbons (PAH) from 12 selected cooking stoves in Asia
with different fuels used: wood, rice husk briquettes and anthracite coal. The purpose of
this study was to provide a database for domestic combustion. The emission factors of
PM of wood, rice husk briquettes and anthracite coal were defined as 2–5, 5 and 7 g/kg
of fuel and the emission factors of PAH were 24–114, 140 and 2 mg/kg of fuel
respectively.
Another study based on the actual practice of disposal of rice husk was found in
Yonemura & Kawashima (2007) (Japan). This study assessed the concentrations of
carbon gases and oxygen emissions and their ratios from the combustion of rice husk in
a wind tunnel. This is based on the idea that rice husk was traditionally disposed of by
open-air burning which was believed to cause local air emissions. The study found that
the combustion of rice husk under wind was relatively incomplete. The ratio of [CO] to
[CO2] appeared high (except at high wind speeds). Moreover, they reported that the ratio
of CO2 to total carbon gases was higher when burning at high wind speeds (with the
presence of flames). While burning at low wind speeds, the NMVOC and CH4 ratios to
total carbon gases were found to be higher. They further commented that the amount of
consumed O2 affect CO2, CH4 and NMVOC released during the different stages of
combustion.
Chungsangunsit et al. (2004) (Thailand) assessed the environmental profile of the Roi Et
Green Project, a pilot rice husk based power plant project of capacity 9.8 MW. The plant
consumes 290 tonnes of rice husk a day and 1,400 tonnes of water a day. The plant used
1 MW for internal use and so the surplus power of 8.8 MW was sold to the Electricity
Generation Authority of Thailand (EGAT) under the small power producer (SPP)
scheme. The raw materials consumption and emissions produced from the plant were
taken into account for an assessment of the environmental impacts caused by this power
plant. The results show that the rice husk power plant released less SO2 and NOx than
coal and oil-fired power generation, but higher than natural gas-fired power plants. The
CO2 was accounted as neutral based on an assumption that burning biomass does not

Chapter 3-The Utilization of Rice Husk and Rice Husk Ash
41
contribute CO2. However, they found out that the rice husk based power plant caused
slightly higher CO and dust emissions compared with conventional electricity
production. Finally, they concluded that using rice husk to generate power was preferred
to fossil fuel based power generation, especially coal and oil, from the environmental
emissions point of view. Nevertheless, the different possibilities of disposing of rice
husk ash generated from the process were not taken into account in this study.
Bhattacharya et al. (1999) estimated greenhouse-gas emission mitigation from using rice
husk in existing proven biomass technologies (at the time of study) in selected Asian
countries including Thailand. The consequent reduction of CO2, CH4 and N2O emissions
in terms of CO2 equivalents for a time horizon of 20 years were calculated. This study
used the potential amount of rice husk available for energy use purposes and the amount
of fossil fuels that could possibly be replaced by using rice husk in the estimation of the
mitigation of greenhouse gases. The technology options studied were direct combustion
for heat, gasification for thermal applications, direct combustion-steam turbine for
power generation, gasifier-engine for power generation and direct combustion-steam
engine for power generation. Note is taken that in the case of direct combustion based
systems, the use of rice husk ash to substitute for cement in concrete production was also
taken into account. From the results, they concluded that using rice husk in direct
combustion to replace coal for steam production shows the highest efficiency in
reducing greenhouse gases of approximately 68 million tonnes of CO2 equivalent per
year. Nonetheless, this study only assessed the greenhouse gas emissions caused from
the different uses of rice husk, other environmental indicators were not identified.
Although some literature discussed above investigated the emissions associated with
using rice husk and estimated the potential of emissions mitigation by using rice husk in
different ways, the other environmental impacts that may be caused by consuming rice
husk have not yet been identified. Moreover, only a few studies attempted to assess the
environmental impacts of rice husk uses and only one study considered different options
for rice husk uses. However, the scope of that study was still limited to using rice husk
for energy purposes. As discussed in section 3.3.1, rice husk is not only beneficial for

Chapter 3-The Utilization of Rice Husk and Rice Husk Ash
42
energy purposes, but useful materials can also be obtained from its ash. Therefore, the
uses of rice husk from both its energy content and its useful ash perspectives need to be
further investigated; and its broader environmental impact indicators need to be
assessed. Emissions released from specific rice husk use processes that will be used later
in the LCA study are presented in Chapter 6.
3.4 Thai Biomass Resources
The US Department of Energy has defined biomass as (U.S. DEPARTMENT OF
ENERGY n. d.):
… any plant derived organic matter available on a renewable basis, including
dedicated energy crops and trees, agricultural food and feed crops, agricultural
crop wastes and residues, wood wastes and residues, aquatic plants, animal
wastes, municipal wastes, and other waste materials.
Biomass is one of the oldest energy sources in the world. For many developing
countries, biomass has already been one of their primary energy sources. Biomass is
usually obtained in wood, crop and waste forms. The basic compositions of biomass are
sugar, starch, cellulose, hemicellulose, lignin, resins and tannins. With its large quantity
available and renewable production basis, biomass is considered one of the most
significant energy sources. Moreover, with the current crisis in oil prices, many
countries (including Thailand) have already introduced policies promoting the use of
energy from biomass. The energy extracted from biomass, also called ‘bioenergy’, is any
useful form of energy obtained from biomass conversion. This may include heat,
electricity, alcohol fuel, biodiesel, biogas from fermentation and energy gas from
gasifiers (Kruger 2006; Rosillo-Calle et al. 2007).
The use of bioenergy can help in climate change mitigation. Rosillo-Calle et al. (2007, p.
xx) argued that by using modern bioenergy conversion technologies, it is possible to cut
down fossil fuel consumption. This would lead to the reduction of greenhouse gases

Chapter 3-The Utilization of Rice Husk and Rice Husk Ash
43
emitted from using fossil fuels. They further argued that the efficient uses of bioenergy
are ‘greenhouse gases neutral’. This was explained by the example of when biomass is
grown for energy use and if the same amount of biomass planted is burned for energy
purposes for a certain period, there is no net CO2 released. This is because the amount of
CO2 emitted from burning biomass is equal to the amount of CO2 that biomass takes up
for its photosynthesis process in the growth phase. This clearly applies to the case of rice
husk since the growth of rice takes less time (less than a year) compared with other
biomass such as wood. Therefore, the use of rice residues such as rice husk for energy
purposes will contribute to greenhouse gases mitigation more efficiently in terms of the
time factor.
In Thailand, biomass plays an important role in the nation’s total energy sources. It has
become the second largest energy source in the country. Biomass has been used in both
the residential and the manufacturing sectors, especially in rural areas. Since biomass
fuels can provide basic energy for cooking and heating, they are the main energy source
for households and traditional industries, such as agro-processing, food processing,
wood processing industries, etc. (Papong et al. 2004; Suwannakhanthi 2004)
Thailand produces a large variety of crops such as rice, sugar cane, cassava, corn, oil
palm, etc. These crops and their residues are considered significant sources of biomass
in the country. Papong et al. (2004) assessed the main potential sources of biomass in
Thailand. They revealed that agricultural crops such as sugar cane, rice, oil palm and
wood wastes are the four main sources of biomass for the country due to their large scale
production. Moreover, with the realization that these different crops provide various
types of residues and that the residues had already been used in several applications,
they predicted the available unused potential biomass quantities as shown in Table 3.6.
Within these potential biomass resources, the residues generated from mills such as
bagasse, rice husk, oil palm bunches, fibres and shells were identified as significant
sources of biomass as the collection of these residues is more practical than that of those
remaining in the fields (for example sugar cane trash, rice straws, oil palm fronds).
According to this approach, rice husk is considered to be the second largest potential

Chapter 3-The Utilization of Rice Husk and Rice Husk Ash
44
biomass source after bagasse, considering the collectability and available unused
amount. This implies that rice husk will be utilized more in the future.
Table 3.6 Forecasted available unused biomass in Thailand in 2004
Source Residue Available unused residue
(1,000 tonnes)
Sugar cane Bagasse 4,223
Trash 20,874
Rice Rice husk 3,044
Rice straws 8,207
Oil palm Bunches 716
Fibres 97
Shells 9
Fronds 12,767
Wood industry* Wood wastes 1,800
Total 51,737
Source: Papong et al.(2004)
Note: * Data of year 2002
3.5 Thai Biomass Energy Policies
3.5.1 Thailand’s National Economic and Social Development Plan
Thailand has been heavily reliant on fossil fuel imports. Due to its limited fossil fuel
sources, more than 60 percent of the Thai conventional energy supply is imported. This
causes a massive financial burden on the nation. Moreover, with a huge dependency on
an imported energy supply, Thailand has risked its future energy supply security. As
energy is one of the economic driving forces, the Thai government has made efforts to

Chapter 3-The Utilization of Rice Husk and Rice Husk Ash
45
reduce the reliance on energy importation and to strengthen the country’s energy supply
security by promoting the use of local alternative energy sources (Lertsuridej 2004;
Sajjakulnukit et al. 2002).
As an agriculture based country, Thailand has a variety of sources of biomass which are
indigenous potential energy sources. Together with the effort to increase the
diversification of Thai energy supply sources, the use of biomass as an energy source
has been strongly supported by the Thai government since 1992, according to the
seventh National Economic and Social Development Plan (NESDP) (1992-1996). Since
the seventh NESDP, the promotion of biomass energy has continually been put on the
agenda of the later NESDPs including the current plan (the tenth NESDP (2007-2011)).
The Thai government has signed the United Nations Framework Convention on Climate
Change (UNFCCC) on 12 June 1992 and it has become effective since 28 March 1995
(Sajjakulnukit et al. 2002). The Thailand Environment Institute (TEI) (1997) (cited in
Sajjakulnukit et al. (2002)) conducted a national greenhouse gas (GHG) inventory and
reported that the energy sector was the largest GHG contributing sector to the nation,
emitting 79 million tonnes out of the total of 225 million tonnes CO2 equivalent.
Consequently, Thai energy policies have emphasized the use of biomass energy to
ensure an adequate energy supply and to protect the environment by means of GHG
reduction (Prasertsan & Sajjakulnukit 2006). This is based on an assumption that the
CO2 released from burning biomass for energy purposes will be reabsorbed again in the
growing phase of biomass, so these CO2 are accounted as neutral in GHG inventory
(IPCC 2006).
Since 1992, important biomass energy related policies have been stated in the National
Economic and Social Development Plans (NESDP) (Office of the National Economic
and Social Development Board 1992, 1997, 2002, 2007; Papong et al. 2004;
Sajjakulnukit et al. 2002; Suwannakhanthi 2004). In the seventh NESDP (1992-1996),
the utilization of biomass was promoted as one way to develop domestic energy
resources in support of the security of the nation’s energy supply. Moreover, the

Chapter 3-The Utilization of Rice Husk and Rice Husk Ash
46
government encouraged the private sector to be involved in energy development by
launching regulations to promote small power producers (more detail will be discussed
in section 3.5.4) which include the small power plants using biomass as a fuel.
The eighth NESDP (1997-2001) aimed at providing sufficient energy supply to satisfy
the country’s demand at reasonable prices. This was done by encouraging the private
sector to invest in the energy industry, including the biomass power producers. This
promotion aimed to increase the competition among private power providers, which
would result in fair prices of power. The eighth NESDP also emphasized reducing
pollution emissions from using energy. As a result, power production from biomass was
promoted in order to help increase the energy supply and to reduce the environmental
impacts caused by greenhouse gases.
The ninth NESDP (2002-2006) promoted research and development in renewable
energy technologies for commercial purposes. This promotion aimed to help increase the
scale of the use of local renewable energy to help decrease the amount of energy
imported. The ninth NESDP also emphasized the promotion of clean technology. Thus,
biomass energy technology was still on the agenda of this plan, as it would benefit the
environment by means of greenhouse gases reduction.
The recent tenth NESDP (2007-2011) remains in support of the development of
indigenous alternative energy sources to meet the domestic energy demand. At the same
time, it commits to maintaining the environment. Hence, clean energy such as biomass
has been continually promoted for the sake of energy supply security and environment
protection.
3.5.2 Biomass Energy Strategic Plans
To achieve the biomass energy related goals set in the NESDPs, the Ministry of Energy
has formulated several energy strategic plans. The Thai government has set very clear
goals in support of the consumption of renewable energy on a large scale. The Ministry

Chapter 3-The Utilization of Rice Husk and Rice Husk Ash
47
of Energy’s Strategy for Competitiveness (August 2003) set out to increase the share of
commercial renewable energy from 0.5 % in 2002 to 8 % of the primary energy demand
by 2011 (Coovattanachai 2006; Lertsuridej 2004).
Prommin Lertsuridej (2004), the Minister of Energy at that time, further explained that
this target accounts for 6,540 ktoe6 of the renewable energy supply, which were
expected to consist of:
- 1,060 ktoe from power production using renewable energy and this includes
electricity generation from hydro power, solar power, wind and biomass,
such as bagasse, rice husk, wood chips etc.
- 3,910 ktoe mainly from the utilization of traditional biomass energy such as
agricultural residues (including rice husk) and industrial waste.
- 1,570 ktoe from an increase in the substitution of gasoline by ethanol and the
substitution of diesel by bio-diesel.
In the above breakdowns of targeted renewable energy consumption types, the use of
biomass energy, which includes the use of energy from agricultural residues such as rice
husk and other residues, related to both the power producers and the utilization of
traditional biomass energy sectors. The targeted amount of increased renewable energy
used in both sectors together accounts for more than half of the whole target. This
implies that the Thai government has a strong intention to promote the use of indigenous
biomass energy such as agricultural residues, including rice husk.
Another major goal of the Energy’s Strategy for Competitiveness (2003) was to develop
mechanisms to stimulate the participation of electricity generators in using renewable
energy. To accelerate this participation, the Ministry of Energy (in 2003) proposed to
(Coovattanachai 2006; Lertsuridej 2004; Prasertsan & Sajjakulnukit 2006):
6
ktoe = kilo tonnes of oil equivalent.

Chapter 3-The Utilization of Rice Husk and Rice Husk Ash
48
- Issue regulations or legal enforcement in the Renewable Portfolio Standard
(RPS) to oblige new power plants to have at least 5 % of the total electricity
generation derived from renewable energy in their total generating capacity.
The RPS regulation was also indicated in the power development plan of the
Electricity Generating Authority of Thailand (EGAT) in 2004, and it has
been implemented since then (Electricity Generating Authority of Thailand
(EGAT) 2004).
- Support research and development of renewable energy, especially the local
potential energy such as solar energy, mini-hydro power and biomass
(agricultural and municipal wastes).
- Encourage the public participation and partnership of local communities in
renewable energy power production.
Coovattanachai (2006) cited the Energy Strategic Plan (May 2005) in his presentation
that this Plan targeted:
- To reduce oil consumption in the transportation sector by 25 % by 2009 with the use
of natural gas, gasohol7 and bio-diesel.
- To increase the consumption of bio-diesel to 8.5 million litre per day (accounting
for 10 % of diesel consumption) by 2012.
- To convert the agricultural sector into a modern energy supply base.
The recent energy policies issued by the Ministry of Energy (12 January 2009) promote
the use and development of all alternative energy to help strengthen the country’s energy
supply security and to reduce pollution emissions. In these policies, the Ministry of
Energy pays great attention to the promotion of the development and consumption of
biomass energy and bio-fuels such as ethanol and bio-diesel. At the same time, it
strongly emphasizes the need for environmental protection. The Ministry of Energy
supports environmentally friendly consumption and production of energy. In particular,
the Ministry has set goals to control the emissions released by power plants in an attempt
7
Gasohol is a mixture of gasoline and alcohol (mostly ethanol).

Chapter 3-The Utilization of Rice Husk and Rice Husk Ash
49
to help reduce the environmental impacts to the local area, and to promote the Clean
Development Mechanism (CDM) (see section 3.4.4 for more detail) within the energy
sector to help reduce greenhouse gases (Ministry of Energy 2009).
3.5.3 Energy Conservation and Promotion Programme
The Energy Conservation and Promotion (ENCON) Act was implemented in Thailand
on 3 April 1992 (Sajjakulnukit et al. 2002). The aim of this Act was to promote energy
conservation programs and renewable energy use. Following the ENCON Act, the
ENCON Fund was established by securing funding from different sources, i.e. money
transferred from the Petroleum Fund, a levy on petroleum products and additional
sources such as surcharges on electricity consumption, government subsidies,
remittances from private sector (both national and international) and the interest
accruing to the ENCON Fund (International Resources Group (IRG) for USAID 2007;
Sajjakulnukit et al. 2002).
Later on, the Energy Conservation and Promotion (ENCON) Programme was founded
on 3 August 1994 with the purpose of setting guidelines, criteria, conditions and
priorities for the ENCON Fund (Sajjakulnukit et al. 2002). The ENCON Programme
consisted of three sub-programmes based upon the nature of the works/projects.
Figure 3.1 shows the structure of the ENCON Programme. The promotion of biomass
energy was implemented under the Voluntary sub-programme. The aim of this sub-
programme was to support and cooperate with other public and private sectors to
(Prasertsan & Sajjakulnukit 2006):
- Promote the efficient energy use in both agricultural and rural industries.
- Encourage the wider use of renewable energy in order to reduce the
environmental impacts associated with the use and the production of energy.
- Support products and services contributing to energy conservation to be
successful in the market.

Chapter 3-The Utilization of Rice Husk and Rice Husk Ash
50
- Promote research and development in energy production and conservation
technologies as well as the promotion of the use of these technologies in the
larger application such as in factories, buildings and households.
The ENCON funding for the biomass projects was allocated under this sub-programme.
During the fiscal period of 1995-2002, the Voluntary sub-programme was allocated over
three billion baht8 from the ENCON Fund to implement 161 projects (at 2002), these
projects included power producers using biomass fuels such as rice husk, bagasse and
wood (Prasertsan & Sajjakulnukit 2006; Sajjakulnukit et al. 2002).
Figure 3.1 Structure of the ENCON Programme
Source: Prasertsan & Sajjakulnukit (2006)
Two government agencies were responsible for these sub-programmes, namely the
Department of Energy Development and Promotion (DEDP), which is now called the
Department of Alternative Energy Development and Efficiency (DEDE), and the
8
Baht is the currency of Thailand.
Compulsory
- Existing designated factories and buildings
- Designated factories and buildings under designing or construction
- Government buildings
Agency: DEDP
Voluntary
- Renewable energy and rural industries
- Industrial liaison
- Research & Development
- Existing non- designated factories and buildings
Agency: NEPO
Complementary
- Human Resource Development
- Public Awareness Campaign
- Research & Development
- Management and Monitoring
Agency: NEPO
ENCON Programme

Chapter 3-The Utilization of Rice Husk and Rice Husk Ash
51
National Energy Policy Office (NEPO), which is now called the Energy Policy and
Planning Office (EPPO). Both agencies are under the Ministry of Energy. Figure 3.2 and
3.3 illustrate the organizational structure of the Ministry of Energy and the structure of
the country’s energy sector.
Figure 3.2 Organizational structure of the Ministry of Energy
Source: International Resources Group (IRG) for USAID (2007)
Within the Ministry of Energy, the agencies involved in the promotion of renewable
energy are EPPO and DEDE. From the structure shown in Figure 3.2, they both operate
independently from each other. EPPO’s main functions are to recommend and set energy
policies, energy management and development plans and energy conservation measures
to satisfy the country’s energy demand, as well as to ensure the security of the nation’s
energy supply. DEDE’s responsibilities include the promotion of energy efficiency,
energy conservation regulations, development of alternative energy technologies and
dissemination of energy technologies (Department of Alternative Energy Development
Ministry of Energy
Energy and Policy Planning Office (EPPO)
Department of Alternative Energy Development and Efficiency (DEDE)
Office of the Minister
Department of Mineral Fuels (DMF)
Department of Energy Business (DEB)
Office of the Permanent of the Secretary

Chapter 3-The Utilization of Rice Husk and Rice Husk Ash
52
and Efficiency (DEDE) 2009; Energy Policy and Planning Office (EPPO) 2009a;
International Resources Group (IRG) for USAID 2007).
Figure 3.3 Organizational structure of Thailand’s energy sector
Source: International Resources Group (IRG) for USAID (2007)
Figure 3.3 gives an overview of how the key energy implementing institutes are placed
within the country. The national strategic plans and policies of the Ministry of Energy
have to be approved by the National Energy policy Council (NEPC) and the Cabinet
respectively. Moreover, EPPO seems to be the important base agency. It works under
both the Committee on Energy Policy Administration (CEPA) and the Energy
Conservation Promotion Fund Committee (ENCON Fund Committee). EPPO takes
main energy policies and plans to CEPA for approval before handing them to NEPC and
finally the Cabinet for further approval. EPPO is also responsible for the allocation of
funding for all energy efficiency programs and activities (including the biomass energy
Cabinet
Ministry of Energy
(MOEN)
Energy and Policy Planning Office (EPPO)
National Energy Policy Council (NEPC)
Energy Conservation Promotion Fund
Committee (ENCON Fund Committee)
Energy and Policy Planning Office (EPPO)
Committee on Energy Policy Administration
(CEPA)

Chapter 3-The Utilization of Rice Husk and Rice Husk Ash
53
projects) with an approval by ENCON Fund Committee (International Resources Group
(IRG) for USAID 2007). Note is taken that although the Department of Alternative
Energy Development and Efficiency (DEDE) is directly involved in biomass energy
development, it has not been seen to play as an important role as EPPO does, according
to the country’s organizational structure of the energy sector.
3.5.4 Small Power Producer (SPP)
According to the seventh NESDP (1992-1996), the government promoted the
privatisation of the energy sector to reduce the investment burden of the government and
to raise competition levels in the energy sector. The competition in the sector was
expected to increase an efficiency in energy production and to ensure adequate energy at
fair prices (Office of the National Economic and Social Development Board 1992).
Correspondingly, the Independent Power Producer (IPP) and Small Power Producer
(SPP) Scheme had drawn up by National Energy policy Council (NEPC) with the
purpose to encourage the private sector to invest in the energy industry (Amornkosit
2007; Energy Policy and Planning Office 1999; Prasertsan & Sajjakulnukit 2006).
The distinction between IPP and SPP is that the SPP is either the power producer using
cogeneration technologies or using renewable energy as a fuel, while IPP is the private
enterprise producer of electricity selling to the Electricity Generating Authority of
Thailand (EGAT), so IPP uses fossil fuels and operates on a larger scale (Energy Policy
and Planning Office 1999; Srisovanna 2004). Energy Policy and Planning Office
(EPPO) (1999, p. 2) defined SPPs as “…small power projects that are either co-
generators or facilities using renewable energy as fuel, which sell power to EGAT of not
more than 90 MW for each project” . Therefore, the power plant using biomass as a fuel
is classified as SPPs.
EGAT has conformed to this government privatisation policy well. EGAT (cited in
National Energy Policy Office (2002)) announced the purchase of electricity from SPPs
on 3 September 1996. At that early stage, (at December 1998) there were 57 SPP project

Chapter 3-The Utilization of Rice Husk and Rice Husk Ash
54
proposals accepted by EGAT of which 31 projects had already been implemented and
sold 740 MW of electricity to the EGAT (Energy Policy and Planning Office 1999).
Table 3.7 shows the SPP projects with proposals accepted by EGAT (at December 1998)
classified by fuel type. At this stage, most electricity sold to EGAT was from fossil fuels
such as natural gas. There were a number of projects using biomass energy such as
bagasse, rice husk, wood and saw dust as fuels. However, their electricity generating
capacities and the amount of power sold to the EGAT were much lower than that of the
SPPs using fossil fuels.
Table 3.7 SPP project proposals accepted by EGAT (at December 1998)
Number of Projects
Generating Capacity (MW)
Sale to EGAT (MW)
Commercial Energy
Natural gas 23 2,988 1,678
Fuel oil 1 10 9
Coal 10 1,210 618
Sub Total 34 4,208 2,305
Renewable energy
Bagasse 14 301 67.5
Rice husk, wood chips, saw dust
6 144.3 57
Municipal waste 1 3 1
Biogas 1 0.06 0.045
Black liquor 1 32.9 25
Sub Total 23 481 150
Total 57 4,689 2,455
Source: Energy Policy and Planning Office (1999)

Chapter 3-The Utilization of Rice Husk and Rice Husk Ash
55
Table 3.8 SPP projects accepted by EGAT (at November 2008)
Received Notification of
Acceptance Supplying Power to The Grid
Fuel Type No. Generating Sale No. Generating Sale
of Capacity to EGAT of Capacity
to
EGAT Projects (MW) (MW) Projects (MW) (MW)
1. Non-Conventional
Energy
Bagasse 12 284.4 101.5 10 261.6 81.5
Rice husk 8 77.7 64.3 5 57.3 46.8
Rice husk, wood chip 2 57.8 49 2 57.8 49
Black liquor 1 32.9 25 1 32.9 25
Municipal waste 1 2.5 1 1 2.5 1
Waste gas 1 19 12 1 19 6
Bagasse, wood bark, rice
husk 3 115.4 64 3 107.7 64
Palm residue, cassava root 1 9.9 8.8 1 9.9 8.8
Rice husk, bagasse,
eucalyptus 4 187.8 107.8 1 3 1.8
Wood bark, wood chip, Black liquor 1 87.2 50 1 75 50
Rubber wood chip 2 27.8 24.2 1 23 20.2
Bagasse, rice Husk,
biomass 2 37.5 26.5 2 37.5 26.5
Natural gas co-product of crude oil 1 1.95 1.72 1 1.95 1.72
wind 1 60 60 0 0 0
total 40 1001.85 595.823 30 689.15 382.323
2. Commercial Energy
Natural gas 41 4,852.50 3,169.20 21 2,319.11 1,465.20
Coal 4 392.2 196 4 392.2 196
Oil 1 10.4 9 1 10.4 9
total 46 5,255.10 3,374.20 26 2,721.71 1,670.20
3. Mixed Fuel
Waste gas from production process / oil / coal 1 108 45 1 108 45
Black liquor / coal 1 40 8 1 40 8
Coal / eucalyptus bark 2 328 180 2 328 180
total 4 476 233 4 476 233
TOTAL 90 6,732.95 4,203.02 60 3,886.86 2,285.52
Source: Energy Policy and Planning Office (2009)

Chapter 3-The Utilization of Rice Husk and Rice Husk Ash
56
Due to the economic crisis in 1997, the government terminated the purchase of
electricity from SPPs consuming commercial energy such as fossil fuels, which had to
be imported. At this point, the SPPs using renewable energy, which are more beneficial
to the country in terms of financial and environment, gained attention from the
government (Amornkosit 2007). In 1999, the ENCON Fund allocated 2,060 millions
baht to subsidize SPPs using renewable energy (National Energy Policy Office 2002;
Srisovanna 2004). Also, the regulations for power purchases from SPPs had been
improved to be of greater benefit to the SPPs using renewable energy (Amornkosit 2007;
Kalayanamitr 2004). Since 1999, the number of SPPs using renewable has increased
substantially (see Table 3.8 for the current SPPs accepted by EGAT).
As can be seen from Table 3.8, currently, the majority of electricity from SPPs sold to
EGAT still comes from the SPPs using commercial energy such as natural gas, coal and
oil. However, the number of the SPP project proposals using renewable energy accepted
by EGAT has increased significantly from 23 (at December 1998, see Table 3.7) to 70
projects (at November 2008). The total electricity from renewable energy sold to EGAT
has risen from 150 (in 1998) to 978 MW (in 2008). Within these SSPs projects (at
November 2008), there are 13 power plants using only rice husk as a fuel which account
for about 11 percent of the total power from renewable energy sold to EGAT. Moreover,
there are 19 other projects using rice husk mixed with other biomass fuels. This indicates
that over the last decade the use of rice husk as a fuel to generate electricity has been
implemented on commercial scale.
Moreover, in 2002, the Metropolitan Electricity Authority (MEA) and the Provincial
Electricity Authority (PEA), which are under EGAT, announced that they would
purchase power from Very Small Power Producers (VSPPs) to further support the
efficient use of renewable energy by SPPs. The VSPP programme also aimed to
distribute electricity generation to the rural areas and increase the public participation in
power generation (Amornkosit 2007; Kalayanamitr 2004). The Electricity Generating
Authority of Thailand (EGAT) (2009) defines VSPP as a power producer that has a
generation capacity lower than 10 MW; and is either a cogenerator or uses renewable

Chapter 3-The Utilization of Rice Husk and Rice Husk Ash
57
energy such as biogas, waste, biomass, wind and solar energy. The breakdowns of the
recent VSPPs by fuel type are shown in Table 3.9.

Chapter 3-The Utilization of Rice Husk and Rice Husk Ash
58
Table 3.9 VSPP projects accepted by EGAT (at December 2008)
Proposals
submitted Proposals accepted
Projects under
operations
Fuel type/Technology No. of Sale to
EGAT No. of
Sale to
EGAT No. of
Sale to
EGAT
Projects (MW) Projects (MW) Projects (MW)
Commercial 10 55.60 7 38.40 2 6
Coal 6 41.00 4 26.00 2 6.00
Natural gas 4 14.60 3 12.40 0 -
Solar 355 1,681.621 116 362.824 45 1.754
Biogas 78 143.203 60 79.898 18 12.519
Animal manure 14 2.77 14 2.77 8 1.33
Waste water 52 133.19 36 71.84 10 11.19
Rice straw 5 1.44 5 1.44 0 -
Others 7 5.81 5 3.86 0 -
Biomass 175 1,050.095 140 808.845 47 216.145
Palm fibre 4 18.50 4 18.50 1 8.50
Jatropha residues 1 8.00 0 - 0 -
Bagasse 37 217.80 34 195.80 23 127.30
Bagasse, rice husk 1 8.00 1 8.00 1 8.00
Rice husk 60 422.45 43 302.55 10 49.05
Rice husk, wood chips 7 49.50 6 48.00 1 8.00
Rice husk, corn cob 1 7.80 0 - 0 -
Saw dust 1 0.60 1 0.60 1 0.60
Coconut husk 4 21.15 4 21.15 0 -
Maize residues 3 9.94 2 8.14 1 0.14
Corn cob, rice husk 2 13.40 1 5.40 0 -
Palm bunches 13 62.40 11 38.40 5 6.90
Wood bark 2 12.25 1 5.50 0 -
Rice straw 3 1.46 3 1.46 3 1.46
Cassava residues 4 17.60 4 17.60 0 -
Plantation wood 12 55.75 6 22.25 0 -
Wood bark, wood chip 17 109.70 16 101.70 1 6.20
Others 3 13.80 3 13.80 0 -
Waste 24 121.760 16 84.860 2 1.600
Landfill (Biogas) 8 20.01 5 9.16 2 1.60
Incineration (Steam turbine) 16 101.75 11 75.70 0 -
Hydro power 9 6.855 4 5.130 2 0.060
Wind 89 791.13 7 10.93 1 0.08
Used oil 1 0.03 1 0.03 1 0.03
Total of renewable
energy 731 3,794.69 344 1,352.51 116 232.18
Total 741 3,850.29 351 1,390.91 118 238.18
Source: Energy Policy and Planning Office (2009)

Chapter 3-The Utilization of Rice Husk and Rice Husk Ash
59
From Table 3.9, it is clearly seen that most projects are renewable energy based VSPPs.
There are 1191 out of 1210 projects (about 98 percent of all) using renewable energy
(these include the proposals submitted, the ones that had been accepted, and the ones
that has already been implemented). Within the renewable energy based segment, the
two main fuel sources are biomass and solar. The electricity sold to EGAT from the
biomass based (including rice husk) accounts for 38.5 percent of the total power (sold to
EGAT) produced from renewable energy, whereas the power produced from solar
energy accounts for 38 percent of the total.
Within the biomass energy based VSPPs group, there are 113 projects using only rice
husk as a fuel (out of the total of 362 biomass energy based projects). The electricity
sold to EGAT from these rice husk energy based power plants all together accounts for
about 37 percent of the power produced from biomass energy, or 14 percent of the total
power sold to EGAT by all VSPPs. In addition, there are other 21 projects using rice
husk together with other biomass fuels.
The numbers of all projects (including the ones that are operational, the ones that have
been accepted and the ones with a proposal submitted) show an increasing trend for all
fuel types. This implies that more VSPPs will be established in the future. In particular,
the number of power producers using rice husk as a fuel has increased from 10 projects
(already operational) to 43 projects (proposal accepted). More recently, 60 projects have
submitted proposals. This clearly indicates that rice husk will be used more and more
within the VSPP industry.
The National Energy Policy Office (2002) identified rice husk as the most feasible
biomass fuel to use in power generation as it has a low moisture content, hence it can be
converted to energy efficiently. Also, with its small size, there is no need for a size
reduction process. Moreover, its high ash content was seen to be beneficial in other
applications. Therefore, they suggested that rice husk was the most viable biomass fuel
in terms of economics. However, they commented that there may be a problem gathering
rice husk from different mills to feed the power plants with high a capacity, as most rice
Chapter 3-The Utilization of Rice Husk and Rice Husk Ash
60
mills in Thailand have a low milling capacity. Papong et al. (2004) reported that there
were more than 40,500 rice mills around the country. Nonetheless, only 215 mills have
capacities ranging from 100 to 2,000 tonnes per day. As the majority of rice mills have a
low capacity, the husk has been used mostly in the very small scale power producers and
it seems to be used more in the future.
3.5.5 Clean Development Mechanism (CDM)
The Clean Development Mechanism was arranged under the Kyoto Protocol (drafted on
11 December 1997) to allow industrialized countries to invest in emission-reduction (or
emission removal) projects in developing countries to earn certified emission reduction
(CER) credits. Each credit is equal to one tonne of CO2. These credits can be traded and
sold, and used by industrialized countries to meet their own greenhouse gas emissions
reduction targets committed to the Kyoto Protocol (Climate Change Coordinating Unit
2009; United Nations Framework Convention on Climate Change (UNFCCC) 2009).
The CDM promotes sustainable development and emission reductions, while providing
the flexibility for industrialized nations on the way to meeting their emission reduction
targets. As for developing countries, with the investment from industrialized countries,
they will benefit from the cleaner technologies transferred and the sustainable
development in their own countries. The CDM project must be approved by the host
countries (developing countries) and must lead to sustainable development in those
countries. Finally, it must be approved by the CDM Executive Board (CDM EB) of the
United Nations Framework Convention on Climate Change (UNFCCC) (Climate
Change Coordinating Unit 2009; United Nations Framework Convention on Climate
Change (UNFCCC) 2009).
The Cabinet approved Thailand’s commitment to the Kyoto Protocol on 27 August 2002
and assigned the Ministry of Natural Resources and Environment (MONRE) to
cooperate with other organizations and undertake the procedures involving CDM. Since
then, the CDM has been implemented in Thailand, as a responsibility of the Climate

Chapter 3-The Utilization of Rice Husk and Rice Husk Ash
61
Change Coordinating Unit, Office of Natural Resources and Environmental Policy and
Planning (ONEP) under MONRE.
The Climate Change Coordinating Unit (2009) has set Thailand's policies for
implementing CDM projects which are shown as follows:
- Upon application for approval of a CDM project, each project will be approved by
the Cabinet Ministers on an individual basis.
- The projects will need to promote the country's overall goal of sustainable
development.
- The projects should create technology transfer and capacity building.
- The projects should give top priority to benefiting local communities.
- The government will provide a framework for the trading of CERs.
Due to the general increase in fossil fuel prices, top priority has been given to the
implementation of CDM projects in the energy sector to help support the strategic plans
of the Ministry of Energy and to reduce greenhouse gas emissions (Climate Change
Coordinating Unit 2009). The benefits of implementing the CDM in Thailand towards
the sustainable development stated by the Climate Change Coordinating Unit are
presented in Table 3.10. It is clearly shown that the government prioritizes the CDM
projects using renewable energy, especially projects that also benefit the agricultural
sector in terms of economic. For example, as stated in the economic benefits section, the
sale of agricultural residues such as sugar cane, rice husk and wood chips would benefit
the farmers in the local areas where the CDM projects are taking place. This implies that
a project using rice husk to produce power can qualify as a CDM project, as it is
beneficial in terms of environmental, economic and social aspects, and therefore leads to
sustainable development.

Chapter 3-The Utilization of Rice Husk and Rice Husk Ash
62
Table 3.10 Benefits from CDM implementation in Thailand
Environmental Benefits Economic Benefits Social Benefits
Local
Level
- Preserves environment in the local area where project is being implemented. - Reduces the amount of waste generated by using it as a catalyst for energy production. - Reduces the use of non-renewable energy.
- Projects relating to renewable energy will incorporate agricultural products such as palm, coconut, sunflower, jatropha as raw materials. - Farmers will be able to sell waste material such as sugarcane leaves, rice husk and wood chips for use in CDM projects. - Benefits the local labour market.
- Improves quality of lives from improved environmental quality. - Provides more choices in conducting business practices that are beneficial to the environment.
National
Level
- Improvement in the general quality of the environment. - Transfer of CDM technology, both at national and international levels.
- Projects relating to renewable energy will incorporate agricultural products such as palm, coconut, sunflower, jatropha as raw materials. - Farmers will be able to sell waste material such as sugarcane leaves, rice husk and wood chips for use in CDM projects. - Benefits the local labour market. - Products are generated by cleaner production processes. - Reduces the dependence on imported energy. - Benefits the national economy. - Tax benefits from the trading of CERs which can be used to offset the costs of funding environmental protection and energy conservation.
- Plays a role in the management of a global issue. - Increases the negotiating capability at the international arena.
Source: Climate Change Coordinating Unit (2009)

Chapter 3-The Utilization of Rice Husk and Rice Husk Ash
63
The implementation of CDM in Thailand consists of two main phases, the registration
phase and implementation phase. These two phases are further separated into seven
stages
It starts with the project proponent providing a design outline and preparing a Project
Design Document (PDD), detailing information about the project boundary, the
methodology for the calculation of the reduction of greenhouse gas emissions, the
monitoring of results, and an analysis of the environmental impacts. Then the project
documents are validated; this is done in two parts. This first part involves the Thai
Designated National Authority (DNA) which will determine whether the project is
appropriate for CDM by means of sustainable development in the country. The second
part is that the project proponent hires the Designated Operational Entity (DOE)9 to
determine whether the project meets all the requirements. After the approval from DOE,
the report will be sent to the CDM Executive Board (CDM EB) for registration. After
registration, the project commences and monitors greenhouse gas reductions as
proposed. The next step is verification of the monitoring of greenhouse gas reductions.
This is done by DOE. Thereafter, the DOE will send the report certifying the amount of
greenhouse gas reductions to CDM EB to request for the CER issuance for the
proponent. Finally, the CDM EB will proceed the issuance of the CER (Climate Change
Coordinating Unit 2009)
Figure 3.4 illustrates the process of the CDM implementation in Thailand. This figure
shows that the early steps are done under the Thai government authority (in four top
right-hand boxes) and the later steps are under the CDM EB (of UNFCCC) process.
However, it is noted by the International Resources Group (IRG) for USAID (2007) that
the measurement and the calculation of the greenhouse gases are done by the project
9 Designated Operational Entity (DOE) is a private company which is approved by the CDM EB to review
CDM projects. Its responsibilities include validation, verification and certification of CDM projects.
Within the CDM permit process, It is a responsibility of the project proponent to hire the DOE to carry out
the relative steps in the CDM permit process (Climate Change Coordinating Unit 2009).

Chapter 3-The Utilization of Rice Husk and Rice Husk Ash
64
owners and the local consultants. However, by 2009, there had been no local DOE
established to validate and verify the greenhouse gas reductions (UNFCCC Secretariat
2009a). This means that the CDM project in Thailand needs to hire DOE from outside
the country to determine whether the project meets all the requirements. Therefore, the
implementation of CDM in Thailand requires a degree of international cooperation.
Figure 3.4 Procedure of the implementation of CDM in Thailand
Source: Climate Change Coordinating Unit (2009)
Project proponent
Preliminary review by relevant Ministries
Designated Operational Entity (DOE)
ONEP proceeds to Thailand’s institutions for approval
Executive Board
DNA issues letter of approval
Project proponent
Certified Emission Reductions (CERs)
Project proponent submits PDD
and other documents to ONEP
Designated Operational Entity (DOE)
Executive Board
Thailand’s
government
procedure
Design PDD
Validation
Registration
Monitoring
Verification
Issuance

Chapter 3-The Utilization of Rice Husk and Rice Husk Ash
65
Eamopas (2004) commented that although the CDM may interest many project owners
in Thailand, its procedures involve cooperation with international organizations, and
relevant paper work is required to be in English. Moreover, the CDM process itself
needs to be well understood, in order to implement the project successfully. Therefore,
this may seem to be an obstacle in the decision making of the project owners.
To date, there are four projects from Thailand registered to the CDM Executive Board
and two projects are under review (see Table 3.11 for detail) (UNFCCC Secretariat
2009b). Most projects are co-invested by Japan. Within the registered projects, one is a
rice husk power plant. The emission reductions of this rice husk power plant project
accounts for about 11.5 percent of all the emission reductions proposed by all six
projects. The assumption is that once the barriers in implementing CDM have been
addressed, the other rice husk based projects should be able to participate. This would be
of benefit to the nation and the international community.

Chapter 3-The Utilization of Rice Husk and Rice Husk Ash
66
Table 3.11 CDM projects in Thailand
Registered Title Other Parties
Reductions
(tonne of CO2
equivalent)
18 June 07 A.T. Biopower Rice Husk Power Project
in Pichit, Thailand Japan 70,772
10 May 08 Surat Thani Biomass Power Generation
Project in Thailand Japan 106,592
Corrections
(following
review)
Siam Quality Starch Wastewater
Treatment and Energy Generation Project
in Chaiyaphum, Thailand
Japan 98,372
31 Jan 09 Cassava Waste To Energy Project,
Kalasin, Thailand (CWTE project) Japan 87,586
Under
Review
Catalytic N2O Abatement Project in the
tail gas of the Caprolactam production
plant in Thailand
Japan 152,838
25 March
09
CYY Biopower Wastewater treatment
plant including biogas reuse for thermal
oil replacement and electricity generation
Project, Thailand
Switzerland
Austria 97,468
Source: UNFCCC Secretariat (2009b)
3.6 Overview
The characteristics of rice husk and rice husk ash have been described in the first section
of this chapter. The unique features of rice husk and its ash have been found to be useful
in different industrial applications. The literature on studies of rice husk and rice husk
ash utilization was reviewed. The literature review shows that there is substantial
research on rice husk, and rice husk ash applications have been conducted. However,
many of those applications are still under investigation and have not yet been

Chapter 3-The Utilization of Rice Husk and Rice Husk Ash
67
commercially practiced. In addition, the current uses of rice husk are defined, for
example use in electricity industry, the cement and concrete industry, the steel industry
and many other small scale uses. The review of biomass resources in Thailand shows
that rice husk is one of the main biomass resources in the country. In addition, the
chapter has discussed the Thai policies related to the utilization of rice husk. This review
of the policies indicates that recently the Thai government promotes using rice husk for
energy purposes to replace fossil fuel consumption and reduce the environmental
impacts caused by using those fossil fuels. Although some rice husk has already been
used in various industrial applications in many countries including Thailand, the
environmental impacts caused by different rice husk uses have not yet widely been
investigated in the Thai context. While it is important to make good use of rice husk, it is
also necessary to ensure that this husk is used in environmentally friendly ways. The
later parts of this thesis deal with finding out the most environmentally friendly use of
rice husk in Thailand.

Chapter 4-Life Cycle Assessment (LCA)
68
4 LIFE CYCLE ASSESSMENT (LCA)
4.1 Introduction
The last chapter (Chapter 3) reviewed the utilization of rice husk in general and pointed
out the need to ensure that the husk is used in an environmentally friendly way. As the
overall aim of this research is to identify the most environmentally friendly use of rice
husk in Thailand, Life Cycle Assessment (LCA) (as stated in section 1.2) has been
chosen as the tool to assess the environmental impacts of the different rice husk uses is
This chapter describes the definition of an LCA and explores its applications in the field
of environmental management. The first section provides a description of an LCA, its
initiation and its advantages. This is followed by explaining different stages of an LCA.
In addition, the general applications of an LCA in different areas, along with the
limitations of an LCA are discussed. Moreover, the LCA applications within Thailand
are reviewed. The last section summarizes the key points discussed in this chapter.
4.2 Description of LCA
4.2.1 Definition of LCA
Life cycle assessment (LCA) is widely known as one of the tools in the area of
environmental management (e.g. risk assessment, environmental performance
evaluation, environmental auditing and environmental impact assessment). McDougall
et al. (2001) illustrated LCA as an environmental management tool used to see how a
product or service produced from ‘cradle to grave’. This means that every stages of its
life cycle will be examined, from raw materials acquisition, through manufacture,
distribution, use, possible recycle/reuse until its final disposal.

Chapter 4-Life Cycle Assessment (LCA)
69
Examples of LCA definitions given by different authors are shown below:
Guinee (2002, p. 5) (in the handbook of LCA) defined LCA as “a tool for the analysis of
the environmental burden of products at all stages in their life cycle – from the
extraction of resources, through the production of materials, product parts and the
product itself, and the use of the product to the management after it is discarded, either
by reuse, recycling or final disposal (in effect, therefore, ‘from the cradle to the
grave’).”.
The Society for Environmental Toxicology and Chemistry (SETAC) (in the first
paragraph) stated that “LCA addresses the environmental aspects and potential
environmental impacts (e.g. resource use and environmental consequences of releases)
throughout a product’s life cycle from raw material acquisition through production, use,
end-of-life treatment and disposal (i.e. cradle-to-grave).” (Society for Environmental
Toxicology and Chemistry (SETAC) n.d.).
International Organization for Standardization (2006a, p. 2) defined LCA as
“compilation and evaluation of the inputs, outputs and the potential environmental
impacts of a product system throughout its life cycle.”.
The key points arising from these three quotations are consistent and show that LCA is
used to assess the environmental impacts of a system under study. More importantly,
these three definitions of LCA presented above emphasize that the environmental
impacts associated with all stages in the system being studied need to be considered. In
other words, LCA provides holistic environmental impact of the system under study. It
helps to ensure that all possible environmental impacts in every stage in the system’s life
cycle are taken into account. Its holistic feature assists LCA to be the effective tool used
in environmental management. Thus, LCA is chosen to be used to analyse the
environmental impact of alternative rice husk uses in this research (the conduct of LCA
of rice husk utilization is presented in Chapter 7).

Chapter 4-Life Cycle Assessment (LCA)
70
4.2.2 Development of LCA
The concept of LCA has been used since the early seventies (Guinee 2002). However, in
the past, the concept was called different names, such as Resources and Environmental
Profile Analysis (REPA), Energy analysis or Product Eco-balance. LCA came to
prominence in 1989. SETAC was the first international organization to develop the LCA
approach (Guinee 2002). With its variety of members’ background, i.e. academia,
industry and government, SETAC was able to provide a scientific based platform to
LCA development. SETAC’s main aim has been to develop the technical framework for
LCA.
International Organization for Standardization (ISO) has helped to refine the LCA
approach. ISO began the development of LCA standards in 1994 (Guinee 2002). The
ISO 14040 set of standards establishes a base for the approach relating to LCA. Since
this ISO 14040 set is part of the ISO 14000 - Environmental management series of
standards - LCA is directly connected to the wide range of environmental management
tools. While SETAC focuses on the development of the technical aspects of the LCA
approach, ISO concerns both technical and organizational aspects, such as the critical
review processes and the involvement of stakeholders. The ISO LCA standards are
shown below:
- ISO 14040: Life cycle assessment- Principles and framework
- ISO 14041: Life cycle assessment – Goal and scope definition an inventory
analysis
- ISO 14042: Life cycle assessment – Life cycle impact assessment
- ISO 14043: Life cycle assessment – Life cycle interpretation
- ISO 14044: Life cycle assessment – Requirements and guidelines
- ISO 14049: Life cycle assessment – Example of application of ISO 14041 to
goal and scope definition and inventory analysis

Chapter 4-Life Cycle Assessment (LCA)
71
The ISO LCA standards mentioned above were established to provide a base line for
implementation of LCA. The LCA study in this research (refer to Chapter 7) has been
conducted based on these ISO LCA standards.
The United Nations Environment Programme (UNEP) is one of the international
organizations playing an important role in the development of LCA since 1996 (Guinee
2002). Its main focus is to promote the application of LCA, especially in developing
countries. This is to enable LCA practitioners around the world to put LCA into
effective practice, which will help the industry worldwide to prepare for the growing
pressure from consumers in terms of environmental awareness (Life Cycle Initiative
2009). Moreover, UNEP has been co-operating with SETAC to develop the LCA
approach (Guinee 2002).
4.2.3 Advantages of LCA
Thomas (2005) discussed that the primary value of LCA is that it helps to ensure all
possible environmental impacts which flow from all stages of a life cycle are identified.
Similarly, Lundie and Peters (2005) discussed that LCA was developed to account for
issues that are not identified by other environmental management tools.
It is also useful as a technique for comparing two or more alternative options in terms of
their combined possible environmental impacts and ecological sustainability (Thomas
2005). Guinee (2002) claimed that the LCA approach helps to avoid ‘problem shifting’.
He further pointed out that it is important not to fix an environmental problem by
shifting it to another stage in the life cycle of the product. For example, the use phase of
product A may require less energy than product B. However, when considering the
production phase of both products, processing of product A may consume larger amount
of energy than that of product B. Thus, the environmental impacts from all stages of the
alternative products should be taken into account before judging which product is more
environmentally friendly than the other.

Chapter 4-Life Cycle Assessment (LCA)
72
Tibor and Feldman (1996) illustrated advantages of using LCA in two different aspects;
the reduction of environmental releases and risk management. They discussed that LCA
can help the company in making a decision to select the best suppliers to use in their
production processes. In the product development, LCA can be used to find the stages
which produce the largest environmental impacts within the life cycle of
product/process, so that the production process can be improved to be more
environmentally friendly. In addition, they pointed out that LCA can be used as a risk
management tool. The LCA results can advise the company to be aware of the
environmental risks through the life cycle of the product/process.
4.3 LCA Structure
The LCA study consists of four phases: goal definition, inventory analysis, impact
assessment and interpretation. The following sections discuss the function of each stage
in an LCA, and Figure 4.1 shows the relationship between these different stages.
However, it should be noted that the framework of an LCA application discussed in this
chapter refers to the LCA in general practice. The conduct of an LCA in the utilization
of rice husk is documented in detail in Chapter 7.

Chapter 4-Life Cycle Assessment (LCA)
73
Figure 4.1 Stage of an LCA
Source: International Organization for Standardization (2006a)
4.3.1 Goal and scope definition
In this phase, the goal of the study is set; the important decisions concerning boundary
setting and the functional unit (reference unit) are defined. The goal of an LCA is set
according to the intended application. To define the scope of an LCA study, the
functions of the product/service being studied need to be clearly specified. These
identified functions are used to define the functional unit. However, the functional unit
set also needs to be consistent with the goal and scope of the LCA study. The functional
unit is a quantification of the identified functions or performance characteristics of the
product/serviced being studied (International Organization for Standardization 2000).
The functional unit is used as a reference when quantifying (in a mathematical sense)
input and output data in the next stage (inventory analysis) of an LCA study (see section
4.3.2). It was stated in ISO 14044 that the goal and scope of an LCA may need to be

Chapter 4-Life Cycle Assessment (LCA)
74
refined during the study, as unforeseen limitations, constrains and additional information
might arise during the course of the LCA, affecting the original goal and scope set for
the study (International Organization for Standardization 2006b).
4.3.2 Inventory analysis
Allen & Rosselot (1997) identified that inventory analysis is the most important stage of
an LCA application because it will impact on the remaining stages and the final result of
the study. The data collected in this stage will be used in the life cycle impact
assessment (see section 4.3.4). In this stage, the information about the product/service
system is collected and the relevant outputs and inputs, i.e. life cycle inventory (LCI)
data, of the system being studied are quantified. The inputs and outputs collected in an
LCA study include energy consumption, resources use, products, co-products and
emissions. These inputs and outputs are quantified based on the functional unit set in the
previous stage (goal and scope definition) of the LCA (International Organization for
Standardization 2000).
To quantify the LCI data, assumptions often need to be made. It was suggested in ISO
14049 (Life cycle assessment – Example of application of ISO 14041 to goal and scope
definition and inventory analysis) that any assumption or criteria used in the LCA study
needs to be clearly described in this stage. This would help the LCA practitioner to
improve data quality during the course of the study. The International Organization for
Standardization (2000) suggested that the initial LCI data should be collected using
available (at the time of data collection) data. However, the data should be fully
quantified during the course of the LCA (and subjected to sensitivity analysis) as there
may be some additional information collected during the time of study which may help
to improve the quality of the initial data collated.

Chapter 4-Life Cycle Assessment (LCA)
75
a) Attributional and Consequential LCI modelling
After inventory analysis, the LCI data obtained are modelled in order to assess the
environmental impacts of the system under study. The approach of LCI modelling is
categorized into two methods; attributional method and consequential method. The
terms attributional and consequential were first adopted in 2001 in the International
Workshop on Electricity Data for Life Cycle Inventories, held in Cincinnati, Ohio
(Curran et al. 2001; Ekvall & Weidema 2004). However, attributional/consequential LCI
modelling approaches have been previously referred to by different terms, such as
retrospective/prospective LCAs and accounting/changed-oriented LCAs, as documented
in Tillman (2000) and Ekvall et al. (2005).
Curran et al. (2001, p. 5) discussed that the distinction between these two LCI modelling
approaches is that they respond to different questions. The attributional LCI modelling
approach attempts to answer “how are things (pollutants, resources, and exchanges
among processes) flowing within the chosen temporal window?” While the
consequential LCI modelling approach attempts to answer “how will flows change in
response to decisions?’ Therefore, they suggested that the attributional model is
appropriate to use if the LCI data are to be allocated or attributed to each product being
produced in the economy at a given point in time (could mean past, present or future).
However, the consequential model is appropriate to use if the LCI data are to be used to
estimate how the environmental flows of the system being studied will change as a result
of the various potential decisions.
Tillman (2000) suggested that the choice of the LCI modelling approach to be used
should be dependent on the goal and scope of the LCA study. For instance, in an LCA
study intended to provide information to make a market claim (e.g. environmental
product declaration), attributional LCI modelling should be used. While in an LCA
study to provide support information for decision making, the consequential LCI
modelling may be more useful.
Chapter 4-Life Cycle Assessment (LCA)
76
Ekvall (2003) stated that the attributional approach describes the environmental
properties of a life cycle and its subsystem. Hence, the attributional LCI model includes
the full life cycle of a system under study. It uses average LCI data and the data are
allocated in proportion (e.g economic value). The consequential approach describes the
effects of changes within the life cycle. Ekvall (2003) discussed that the consequential
LCI model includes only the processes that are affected by changes. It uses the data
which reflect the expected effects caused by changes. Moreover, it avoids allocation by
means of system expansion (definition is described below).
This research aims to provide supporting information about rice husk disposal strategies
in Thailand (from an environmental point of view) for policy makers. Thus, the
consequential LCI modelling is considered appropriate for use in the LCA study in this
research (refer to Chapter 7).
b) System expansion
System expansion is the technique used to help avoid co-production allocation in
consequential LCI modelling. This is used when the process/system under study
generates more than one product in the same process and the co-product(s) affect the
processes outside the original system boundary set.
System expansion means the system boundary is expanded to cover alternative
production of the exported functions (the functions of the co-product(s) in the original
boundary system). In addition, other activities which are effected by the exported
functions should be included (Ekvall & Finnveden 2001). This is undertaken in order to
allow the options to be comparable in the comparative LCA study. Weidema (2001, p.
12) have summarised the role of system expansion as being “ performed to maintain
comparability of product systems in terms of product outputs through balancing a
changes in output volume of a product that occurs in only one of the product systems, by
adding an equivalent production in the other systems (or more elegantly and correctly
by subtracting the equivalent production from the one system).”.

Chapter 4-Life Cycle Assessment (LCA)
77
As consequential LCI modelling is performed to see how decisions made for the system
under study will affect the environmental flows, system expansion is used in
consequential LCI modelling. Ekvall & Weidema (2004) discussed that the aim of
consequential LCI modelling is to include what is affected by changes made to the
system under study. Thus, they claimed that the processes outside the original system
boundary set should also be included (through system expansion) since they are affected
by the changes made in the system being studied. For example, when using rice husk as
a source of energy through combustion, rice husk ash is generated as a co-product in the
combustion process. This ash will be used in other applications outside the combustion
process. This means that the uses of the ash generated from the combustion (of rice
husk) process will affect other processes outside the combustion process. Therefore, the
uses of the ash outside the combustion process need to be included in the LCA study.
4.3.3 Impact assessment
The aim of this stage is to evaluate potential environmental impacts of the
product/service system being studied using the LCI results obtained from the inventory
analysis stage (see section 4.3.2).
a) Mandatory impact assessment elements
According to ISO 14044, life cycle impact assessment (LCIA) consists of four
mandatory elements: selection of impact categories, category indicators and
characterisation models, assignment of LCI results to the selected impact categories (i.e.
classification) and calculation of category indicator results (i.e. characterisation). These
elements are discussed in the following sections.

Chapter 4-Life Cycle Assessment (LCA)
78
1) Definitions of the terms related to LCIA used
The definitions of the terms related to LCIA used in this section are listed below
(International Organization for Standardization 2006b, pp. 5,6):
- Impact category is the class representing environmental issues of concern
(e.g. environmental issues may include depletion of abiotic resources, climate
change etc. Note that the main impact categories are described below).
- Impact category indicator is a quantifiable representation of an impact
category (e.g. looking at climate change, infrared radiative forcing is an
impact category, expressed as CO2-equivalent. Note that the impact indicator
differs from category to category).
- Characterization model is the model used to convert the LCI results to the
common unit of the category indicator (the common unit allows the
calculation of the category indicator result) (e.g. considering climate change,
the baseline model developed by the Intergovernmental Panel on Climate
Change (IPCC) can be used as it defines the global warming potential of
different greenhouse gases. Note that characterization models differ from
category to category.)
- Category endpoint is an attribute or aspect of the natural environment,
human health or resources, identifying an environmental issue giving cause
for concern (e.g. the target endpoints of climate change impact category are
coral reefs, forests and crops. Note that category endpoints differ from
category to category (discussed in the following section)).
- Environmental mechanism is the system of physical, chemical and biological
processes for a given impact category, linking the life cycle inventory
analysis results to category indicators and to category endpoints (e.g. for
climate change impact category, the greenhouse gases (LCI results) enhance
radiative forcing which rises the temperature at the earth surface and this
increased temperature (global warming) affects on ecosystems, human health

Chapter 4-Life Cycle Assessment (LCA)
79
and material welfare (category endpoints). Note that each impact category
has its own environmental mechanism).
2) Definitions of impact categories
Guinee (2002) defined baseline impact categories which are included in almost all LCA
studies as depletion of abiotic resources, impact of land use, climate change,
stratospheric ozone depletion, human toxicity, ecotoxicity, Photo-oxidant formation,
acidification and eutrophication. However, it should be noted that different impact
methods may use slightly different terms than the baseline impact categories described
here (although having the same meaning). The definitions of the baseline impact
categories described in Guinee (2002) are listed below:
Depletion of abiotic resources – is a depletion of natural resources (including energy
resources) which are regarded as non-living such as iron ore, crude oil and wind energy.
This impact category is one of the most frequently discussed. Therefore, it has been
interpreted differently in a wide range of impact assessment methods. Depending on the
definition given to this impact category, some impact assessment methods only consider
the impact of depletion of abiotic resources on natural environment, while some methods
consider the impact of this impact category on both human health and natural
environment (Guinee 2002).
Impact of land use – covers a range of consequences of human land use in different
aspects such as resources, biodiversity and life function support, for example (Guinee
2002). The impacts of land use include both direct and indirect effects from occupation
and transformation of land (Centre for Design 2008).
Climate change – is the impact of emissions caused by humans on the radiative forcing
(i.e. heat radiation absorption) of the atmosphere. This is often referred to as the
“greenhouse effect”. Greenhouse gas emissions increase radiative forcing which lead to
an increase of temperature at the earth’s surface. This effect has impacts on ecosystems,

Chapter 4-Life Cycle Assessment (LCA)
80
human health and material welfare (Guinee 2002). It is one of the most discussed impact
categories. More importantly, it has been given priority in the policy of many countries
(including Thailand) who have signed and ratified the Kyoto Protocol, which aims at
reducing greenhouse gases (see section 3.5.5).
Stratospheric ozone depletion – is the thinning of the stratospheric ozone layer caused
by emissions released by humans. When the stratospheric ozone layer becomes thinner,
it means that a larger amount of solar UV-B radiation can reach the earth’s surface. The
stratospheric ozone depletion has the potential to impact human health, the natural
environment, the man-made environment and natural resources. For example, it may
cause human skin cancer or damage to plants (Guinee 2002).
Human toxicity – covers the impacts on human health caused by toxic substances present
in the environment. Guinee (2002) stated that the discussion on characterization of
toxicity-related impact categories has not been yet settled. Therefore, this may cause
high uncertainties across the LCA results obtained from the different impact assessment
methods developed.
Ecotoxicity – covers the impacts on aquatic, terrestrial and sediment ecosystems caused
by toxic substances present in the environment (Guinee 2002). Again, as mentioned
above, characterization of toxicity-related impact categories have not yet been settled.
Thus, there may be high uncertainties across the results (in this impact category) from
different impact assessment methods.
Photo-oxidant formation – is the formation of reactive chemical compounds such as
ozone, by the action of sunlight on certain primary air pollutants, including Volatile
Organic Compounds (VOCs) and carbon monoxide (CO) in the presence of nitrogen
oxides (NOx). This photo-oxidant formation is also known as “summer smog”, distinct
from “winter smog” in Europe, which is caused by inorganic compounds such as
particles, CO and sulphur compounds (Guinee 2002). The photo-oxidant formation may
harm human health, causing conditions such as respiratory problems. In addition, it may

Chapter 4-Life Cycle Assessment (LCA)
81
harm the man-made environment, including the rubber industry. Haagen-Smith &
Bradley (1953) reported that “summer smog” occurring in Los Angeles can cause severe
rubber cracking. They further explained that this is caused by the release of high
quantities of hydrocarbons into air with the presence of NOx. Moreover, it may cause
damage to the natural environment, such as food crops and plankton.
Acidification – refers to the impacts on soil, ground water, surface water, biological
organisms, ecosystems and materials (such as buildings) caused by acidifying pollutants
such as SO2 and NOx (Guinee 2002). The acidification problem is mainly seen in
Scandinavian and European countries, for example, fish mortality in Scandinavian lakes
and inefficient growth of softwood (e.g. spruce) forests, finally resulting in dieback
(Centre for Design 2008).
Eutrophication – covers the impacts caused by excessively high levels of macronutrients
present in the environment, such as Nitrogen and Phosphorus. For example, the excess
nutrient enrichment may cause an undesirable shift in species composition, and may
increase biomass production in both aquatic and terrestrial ecosystems. An increase of
biomass in aquatic ecosystems may lead to a depressed oxygen level as additional
oxygen consumption is required in biomass decomposition. Consequently, this may
make surface water unacceptable as a source of drinking water (Guinee 2002). The main
contributors to eutrophication are NOx contained in air emissions, storm water, waste
water and agricultural runoff. These are the main nutrient sources which can cause
eutrophication (Centre for Design 2008).
3) Selection of impact categories
It was stated in ISO 14044 that the chosen impact categories, category indicators and
characterization models shall be consistent with the goal and scope of the LCA study.
Moreover, they should be internationally accepted (International Organization for
Standardization 2006b). The selection of the impact categories to be examined needs to
reflect the environmental issues concerned with the system being studied, taking into

Chapter 4-Life Cycle Assessment (LCA)
82
consideration the goal and scope of the study. For instance, an LCA study to compare
biomass based electricity generation and fossil fuel based electricity generation, needs to
take into account the global warming impact category.
4) Relation of the LCI results to the category indicator results
Figure 4.2 shows the relationship between the LCI results, category indicators and
category endpoints, based on the environmental mechanism (using impact category
“acidification” as an example). It is seen that the environmental mechanism links the
LCI results to category indicators and to category endpoints respectively. However, it
should be noted that each impact category has its own environmental mechanism
(International Organization for Standardization 2006b).
Figure 4.2 Concept of category indicators
Source: International Organization for Standardization (2006b)

Chapter 4-Life Cycle Assessment (LCA)
83
The category indicator represents the quantity of environmental impact in different
impact categories. Therefore, the impact indicator chosen for each impact category must
be quantifiable. The category indicator occurs along the environmental mechanism.
Thus, it can be chosen anywhere along the line between the LCI results and the category
endpoints (International Organization for Standardization 2006b). For example, in
Figure 4.2, the total load of proton (H+) is selected as an impact indicator for the
acidification impact category. The more detailed environmental mechanism of
acidification impact category is explained in Hayashi et al. (2004). They discussed that
the increase of proton (H+) leads to a decrease of leachate pH, and increase of leachate
Al3+ concentration, and results in a reduced plant growth rate (plant is the category
endpoint) respectively. Therefore, Al3+ concentration can also be chosen as an impact
indicator for the acidification impact category as discussed in Hayashi et al. (2004).
However, other impact categories which occur along the environmental mechanism can
also be selected.
The characterization model is used to relate the LCI results to the category indicator.
ISO 14044 stated that the chosen characterization model to be used in an LCA study
should be scientifically and technically valid. In addition, it should be internationally
accepted (International Organization for Standardization 2006b).
b) Optional impact assessment elements
The mandatory elements stated in ISO 14044 stops at the classification step, which
yields impact indicator results for each selected impact category. This means that the
impact indicator results of the selected impact categories have different units. This can
make the interpretation of LCA results (see section 4.3.4) very difficult. Thus, there are
optional steps such as normalization, grouping, weighting and data quality analysis, as
described below (International Organization for Standardization 2006b):

Chapter 4-Life Cycle Assessment (LCA)
84
1) Normalization
The International Organization for Standardization (2006b, p. 21) stated that
“Normalization is the calculation of the magnitude of the category indicator results
relative to reference information (e.g. annual emission per capita). The aim of the
normalization is to understand better the relative magnitude of each indicator result of
the system under study”. Normalization is undertaken by dividing an impact indicator
result (of all impact categories) by a selected reference value (International Organization
for Standardization 2006b). In general, after normalization the results (i.e. normalized
results) are dimentionless. However, this depends upon the unit of reference value used.
For example, if reference value used is annual total emission for a given area on a capita
basis, the normalized unit becomes capita per year as discussed in (Humbert 2005;
Jolliet 2003). In any cases, normalized results of all impact indicator values are in the
same unit across all impact categories.
2) Grouping
Grouping is the assignment of impact categories into one or more sets. This is
undertaken based on the goal and scope set for the LCA study. The grouping may
involve sorting impact categories (on a nominal basis) and ranking the impact categories
in a given hierarchy. Therefore, the grouping is subjective as it is based on value-
choices. Different individuals or organizations may have different preferences
(International Organization for Standardization 2006b).
3) Weighting
According to ISO 14044, weighting is defined as “The process of converting the
indicator results of different impact categories by using numerical factors based on
values-choices. It may include aggregation of the weighted indicator results.”
(International Organization for Standardization 2006b, p. 22). Thus, the weighting

Chapter 4-Life Cycle Assessment (LCA)
85
process is highly subjective based upon specific criteria chosen by LCA practitioners to
give preference to certain environmental impact categories over others.
4) Additional LCIA data quality analysis
Additional LCIA data quality analysis may be required to check the significance,
uncertainty and sensitivity of the LCIA results. The data quality analysis uses specific
techniques (e.g. uncertainty analysis and sensitivity analysis) to help in checking the
results of LCIA. The results obtained from this analysis may lead to the revision of the
LCI stage (see section 4.3.2) (International Organization for Standardization 2006b).
As stated in the beginning of this section, normalization, grouping, weighting and data
quality analysis are optional (according to ISO 14044). The need to perform these
optional steps in an LCA study depends on the goal and scope set for the study.
c) Impact assessment methods
Several organizations in different countries have developed multiple impact assessment
methods which contain sets of indicators, as reviewed in Centre for Design (2006) and
(2008). Examples of different impact assessment methods developed by researchers and
scientists in various countries are shown in Table 4.1. The characterization model,
normalization factors and weighting factors used in these different methods are only
based on the conditions of the countries that developed the impact methods, and may not
apply to other countries. However, there exists no country specific impact assessment
methodology for Thailand. Thus, the international methods will be selected for use to
assess the environmental impacts of the selected alternative rice husk uses in this
research. As these methods use different characterization models, normalization factors
and weighting factors, they yield different results. The selection of the impact methods
to use depends on the goal and scope set for the LCA study. The selection of the impact
methods to use and the LCA results for this research is documented in section 7.4.

Chapter 4-Life Cycle Assessment (LCA)
86
Table 4.1 Examples of impact methods developed in different countries
Impact method Country
EcoPoints Switzerland
CML 1992 and 2000 The Netherlands
EPS 2000 Sweden
Eco-indicator 95 and 99 The Netherlands
Impact 2002 Switzerland
EDIP 2003 Denmark
LIME Japan
Traci 2005 USA
ReCiPe 2008 The Netherlands
Source: Centre for Design (2006; 2008)
Some methods convert LCI results into impact indicators at midpoint level (the impact
indicator occurs along an environmental mechanism, before the category endpoints).
While some methods convert the LCI results to both midpoint and endpoint indicators.
Figure 4.3 shows an example of midpoint impact indicators and endpoint impact
indicators, where it can be seen that the environmental mechanism links the LCI results
to the midpoint impact indicators and consequently, to the endpoints. It was discussed in
Centre for Design (2008) that the distinction between the results obtained at midpoint
level (i.e. midpoint impact indicator results) are relatively robust compared with the
endpoint impact indicator results. However, the interpretation of the results may be
difficult. For this reason, the endpoint impact indicator results may facilitate the
interpretation of the results as they are grouped and weighted into more limited
categories (such as human health, ecosystem and resource consumption). Nevertheless,
it should be noted that the endpoint impact indicator results are based on value-choices;
different individuals or organizations may have different preferences. Therefore, this
should be taken into consideration when interpreting the results.

Chapter 4-Life Cycle Assessment (LCA)
87
Figure 4.3 Example of midpoint impact indicators and endpoint impact indicators
Source: Goedkoop et al. (2009)
4.3.4 Interpretation
The interpretation stage is when the findings of the inventory analysis and the impact
assessment are combined to meet the previously defined goal of the study. The LCI and
LCIA results are interpreted according to the goal and scope set for the LCA study.
According to ISO 14044, the life cycle interpretation stage comprises of the following
steps (International Organization for Standardization 2006b, p. 23):

Chapter 4-Life Cycle Assessment (LCA)
88
- Identification of the significant issues based on the results of the LCI and
LCIA phases of LCA;
- An evaluation that considers completeness, sensitivity and consistency
checks;
- Conclusions, limitations, and recommendation.
These steps are performed in order to understand the uncertainty of the final results. The
interpretation stage normally includes data quality assessment and sensitivity analysis of
the LCIA results. This information may provide a direction for revising the former
stages of LCA to make them consistent with the goal and scope set for the LCA study.
In addition, it helps to identify the limitations of the LCA study when making
conclusions and recommendations.
It should be emphasised that LCA is an iterative procedure. As discussed in the sections
above regarding the stages of LCA application, the findings from one stage effect other
stages. Therefore, it is important to go back and forth within the LCA framework (refer
to Figure 4.1) to revise each stage (if necessary) in order to produce final results which
are consistent with the goal and scope set.
4.3.5 LCA softwares packages
A range of LCA software packages have been developed, mostly in European countries.
However, the leading software developed in those countries has become accepted and
implemented worldwide. All LCA software packages developed have similar aims,
which are to aid the users in the inventory stage of LCA. Some software packages also
include the impact assessment function. In addition, some also include the inventory
databases for some products and services.
Rice et al. (1997) compared twelve main European LCA software packages:
Boustead(2), EcoPro 1.3, GaBi 2.0, KCL-ECO, LCAiT 2.0, LMS Eco-lnventory Tool,

Chapter 4-Life Cycle Assessment (LCA)
89
Oeko-Base, PEMS 3.0, PIA, SimaPro 3.1, SimaTool and TEAMTM/DEAMTM. Multiple
aspects of the performance of the LCA software packages were considered, such as
volume of data, WindowsTM environment, network capabilities, impact assessment,
graphical representation of the inventory results, sensitivity analysis, units, cost, user
support, flow diagrams, burdens allocation, transparency of data, input and output
parameters, demo version and quality of data. Accordingly, they identified four main
effective LCA software packages which addressed the different aspects mentioned
above. These are the Boustead model, TEAMTM, SimaPro 3.1 and PEMS 3.0. It should
be noted that, the names of the LCA software packages mentioned in Rice et al. (1997)
may have subsequently (after conducting this research) been updated with new versions.
The chosen LCA software package used in this research is SimaPro (version 7.1.6). The
full name of SimaPro is derived from “System for Integrated Environmental Assessment
of Products”. This LCA software package is developed by PRé Consultants, the
Netherlands. This software is widely used to assess the environmental impacts of
products, processes and services. It is well known and has been widely used in many
countries (PRé Consultants 2006). Moreover, it is available for use (for this research)
through the Centre for Design, RMIT University. SimaPro has useful functions to assist
the user in completing both the life cycle inventory analysis stage and impact assessment
stage. In addition, it comes with life cycle inventory databases, which are very useful in
the life cycle inventory analysis stage. The features of other main LCA software
packages can be found in the report of Rice et al. (1997).
4.4 Applications of LCA
Guinee (2002) commented that LCA has been used in both product development and
wider applications, such as complex business strategies and government policies relating
to consumption and life style choices. Examples of LCA applications in these two main
areas are outlined below:

Chapter 4-Life Cycle Assessment (LCA)
90
Product development
- LCA may be adopted to identify opportunities to improve the environmental
performance of products at various points in their life cycle (International
Organization for Standardization 2006a).
- LCA may be used in an environmental comparison between existing products
and the newly developed products (Guinee 2002).
- LCA can be involved in ‘green’ procurement, which is part of a ‘green’
purchasing policy (Guinee 2002). It can help to compare the environmental
profiles of different choices of material/product to purchase.
- LCA can also be involved in marketing (e.g. an environmental claim, eco-
labelling scheme or environmental product declaration) (International
Organization for Standardization 2006a). LCA is performed to provide the
information required for assigning a ‘green’ label to products. This ‘green’
label enables consumers to make comparisons between products in terms of
their environmental performances.
- LCA may be implemented in eco-design, which is the design of more
environmentally friendly products (Guinee 2002). Information provided by
LCA helps the designers to choose more environmentally friendly materials
to use in the production process.
Wider applications
- Local governments could use LCA to compare the performances of the
different approaches to waste management (Guinee 2002).

Chapter 4-Life Cycle Assessment (LCA)
91
- An industry may apply LCA as a tool to prove to a government department
that using one-way packaging causes less environmental burden that using
re-usable packaging materials (Guinee 2002).
- The power industry may use LCA to compare the environmental benefits of
different types of biomass to be used as a fuel in electricity production
(Guinee 2002).
- LCA can help to provide information to make strategic plans for public
investment in new infrastructure (Guinee 2002). For example, the
transportation sector may use LCA to compare the environmental profiles of
different modes of freight transport (i.e. road, rail and water).
From the examples of LCA applications mentioned above, it is seen that LCA has been
found to be useful in a variety of applications, both in product development and wider
applications such as strategic planning and policy making. Nevertheless, LCA also has
its limitations, which need to be taken into consideration when adopting LCA in any
application. The limitations of LCA are discussed in the following section.
4.5 Limitations of LCA
In spite of a number of its advantages, LCA also has limitations. Some limitations of
LCA are outlined below:
- The implementation of LCA is expensive and time consuming (Tibor &
Feldman 1996). This may be one of the barriers to using LCA for many
companies or organizations.
- Data collection is always complicated and sometimes the data quality is poor.
Tibor & Feldman (1996) commented that the LCA approach requires a

Chapter 4-Life Cycle Assessment (LCA)
92
variety of data resources. Data collection is difficult as some organizations do
not always provide all data needed for LCA studies.
- LCA can not address localized impacts. Guinee (2002) found that LCA does
not provide a framework to identify the expected impacts caused by the
functioning of a facility in a particular area.
- LCA provides steady-state (rather than dynamic) based results. Nevertheless,
Guinee (2002) noted that, in the more detailed LCA studies, future
technological developments are increasingly taken into account.
- LCA only focuses on the physical characteristics of the industrial activities
and other economic processes; it does not take into account the market
mechanisms or secondary effects on technological developments (Guinee
2002).
- LCA only focuses on the environmental aspects of the product/service under
study; it does not take into account economic, social and other aspects
(Guinee 2002). SETAC (n.d.) (in the third paragraph) stated that “LCA
addresses environmental impacts of the system under study in the areas of
ecological health, human health and resource depletion. It does not address
economic considerations or social effects.”
- LCA is not a purely scientific process, as it requires a number of technical
assumptions, value judgments, and trade-offs (Guinee 2002; Tibor &
Feldman 1996). However, Guinee (2002) commented that the ISO LCA
standardization process (ISO 14040 series) has played an important role in
helping LCA practitioners make the required assumptions as transparent as
possible.

Chapter 4-Life Cycle Assessment (LCA)
93
- LCA does not consider all relevant environmental impacts. Finnveden (2000)
commented that since LCA does not cover all the relevant environmental
impacts, only limited types of conclusions can be drawn from the LCA
studies. In addition, Tibor & Feldman (1996) pointed out that the
comparative LCA study (to choose one product over another) can be tricky as
it may be misleading about all the possible environmental impacts included
for one product against another. Thus, the assessment can lead to a wrong
decision.
- Guinee (2002) discussed that although LCA can be used to provide
supporting information for decision making, it can not replace the decision
making process itself. Therefore, additional evidence needs to be taken into
consideration together with LCA results, before any decision can be made.
Though LCA is a very effective tool used to assess the environmental impacts of the
system under study, it also has some limitations, as discussed above. These limitations
need to be taken into account when making conclusions for an LCA study. For instance,
Guinee (2002) noted that LCA can only provide supporting information for decision
making. However, the decision made can not be based entirely on LCA results, other
evidence should be taken into consideration together with LCA results. In this research,
the LCA results (presented in Chapter 7) will be reviewed in the context of the key
policy issues, to assist in making conclusions for this research (this will be dealt with in
Chapter 8).
4.6 LCA Practices in Thailand
LCA was introduced into Thailand in 1997 by the Thai Industrial Standards Institute,
Thailand Environment Institute and Department of Industrial Works (Thailand
Environment Institute (TEI) 2004a). LCA was initially brought in to the Thai industrial
sector since it is included in the ISO 14000 series - Environmental Management - and

Chapter 4-Life Cycle Assessment (LCA)
94
was initially discussed at the workshop of the Thailand Business Council for Sustainable
Development (TBCSD). Subsequently, the Thai LCA Network was established in 2002
with the aim of helping LCA practitioners to communicate about their activities
involving LCA and to share their ideas about Life Cycle Assessment (Faculty of
Engineering Chiang Mai University Thailand 2005). However, LCA expertise is limited
to certain organizations such as universities, private institutions and governmental
organizations.
The governmental organizations which play important roles in promoting the use of
LCA within Thailand are the Thailand Research Fund, National Metal and Materials
Technology Center (MTEC) and National Science and Technology Development
Agency (NSTDA) (Thailand Environment Institute (TEI) 2004a). These organizations
are responsible for coordinating activities involving LCA, such as workshops to provide
LCA knowledge to researchers both inside and outside their organizations. Moreover,
they provide funding for other organizations with LCA expertise, such as universities
and private organizations, to conduct LCA research in order to gain the LCI data to be
used in the development of the Thai national LCI database. In addition, the findings
from the funded LCA research are used as supporting information for government policy
making (Thailand Environment Institute (TEI) 2004a).
The Thailand Research Fund has co-operated with MTEC to develop the Thai national
LCI database (Malakul et al. 2005). However, from personal communication with
MTEC staff (in November 2008), the Thai LCI database has been under development
and was not yet available to public (in 2008). Thus, the LCI data used in this research
needed to be obtained from other sources, such as the LCI databases of other countries
and the literature (discussed in detail in section 7.3).
In Thailand, LCA has been adopted in both product development and wider applications,
including strategic planning and policy making. Examples of the LCA applications in
Thailand are outlined below:

Chapter 4-Life Cycle Assessment (LCA)
95
Product development
LCA was used to identify the possibilities of reducing the environmental impacts caused
by a powder coating paint product as discussed in Jiamjumrussil et al. (2005). As a
result, they suggested that water saving equipment should be installed in the process to
help improve the environmental performance of the powder coating paint product.
Another example of LCA to reduce environmental impacts is found in Meechumma et
al. (2005), who conduced an LCA of coal utilization in coal-fired boilers to produce
electricity. The aim of the study was to identify the stage which causes highest
environmental impacts and suggest ways to reduce the impacts associated with using
coal to produce electricity. The study covers coal mining, coal transportation and coal
utilization in electricity generation. As a result, they indicated that the co-generation
stage consumes the largest amount of energy, therefore, contributing the highest
proportion of emissions in the life cycle. Hence, they suggested that the reduction of the
environmental impacts of using coal to generate electricity can be achieved by
improving the boiler efficiency, which in turn reduces the amount of coal consumed. In
addition, using higher coal quality and reducing the transportation distance can help to
lessen the environmental impacts caused by using coal in electricity generation.
In the study of Kiatsiriroat et al. (2005), LCA was used as a tool for environmental
management in a frozen food factory. The study covers farming, transportation,
manufacturing, consumption and disposal. The LCA results suggested that
manufacturing contributes the largest environmental impact in the life cycle. These
impacts are caused by the consumption of fuel oil, electricity, chemical substance, water
and packaging material. Therefore, they suggested reducing fuel consumption and
materials to improve the environmental performance of the frozen food factory.
LCA was also used in eco-design (economic and ecological design) which is a strategy
that considers environmental factors in the design and development of the product. For
instance, Mungcharoen et al. (2005) applied LCA as a tool in designing a reciprocating

Chapter 4-Life Cycle Assessment (LCA)
96
compressor for a refrigerator. As a result, the recommendations for improving the
environmental performance in each stage of the product’s life cycle were proposed.
Boondaw et al. (2005) used LCA as a tool to help in the selection of material to be used
in housing construction. They compared wood and concrete, considering processing and
manufacturing of raw materials, transportation, applications and waste management.
However, the final results were not reported in their conference paper as the research
was on-going at the time.
In addition, LCA was found to be useful to compare the environmental performance of
new products to conventional products. For example, Juangthaworn et al. (2005)
adopted LCA as a tool to assess the environmental impacts of cassava starch food
packaging compared with polystyrene. The aim of the study was to find out whether
newly developed biodegradable food packaging, such as cassava starch based
packaging, is more environmentally friendly than the conventional packaging through its
life cycle. Nevertheless, the final results were not reported in their conference paper as
the research was on-going at the time.
LCA was also involved in eco-labelling. Mungkung et al. (2005) evaluated the
advantages and limitations of using LCA in setting eco-labelling criteria, in the specific
case of a Thai farmed shrimp product. They concluded that LCA provides a basis for
setting a number of important eco-labelling criteria related to abiotic resources
consumption and emissions. However, they pointed out that the current LCA approach
can not quantify the local and site-specific impacts related to biotic natural consumption
and land use; other tools are required to quantify these impacts.
Wider applications
LCA was also found to be used in wider applications such as in government policy
making or organizational strategic planning. For example, Viseshakul (2005) of the Thai
National Economic and Social Development Board, used LCA concept to help to
estimate the total costs incurred in the production of bio-diesel (produced from palm oil)

Chapter 4-Life Cycle Assessment (LCA)
97
taking account of all costs, from the palm plantation to the esterification of the bio-
diesel. The resulting cost from LCA was used to define the size of the subsidy to be
provided by the government to the bio-diesel producers. However, this study does not
consider the environmental aspects of the bio-diesel production. Another strategic study
was reported by Suramaythangkoor & Gheewala (2008) who applied LCA to evaluate
the potential for using rice straw to generate electricity. This study took account of the
greenhouse gas emissions that could be reduced by using rice straw as a fuel in
electricity production, compared with conventional fuel such as natural gas; open air
burning of rice straw in rice fields was also avoided by this approach. The results from
this study were intended to support the national energy policy.
LCA was also used to compare the different options of waste management for a factory.
In this instance, LCA was used to evaluate the environmental impact associated with
different options for dealing with bagasse, which is a co-product generated in a sugar
mill (Kiatkittipong et al. (2009). The aim of this study was to identify the most
environmentally freindly option for bagasse use. The options to deal with bagasse
examined in this study were landfill with utilization of landfill gas, anaerobic
decomposition for biogas, incineration with energy recovery and pulp production. As a
result, the researchers concluded that using bagasse in pulp production is the most
environmentally freindly option for bagasse utilization. However, it should be noted that
these results are based on the system boundary and assumptions made in this study only.
Another example is the study of Liamsanguan & Gheewala (2008) which uses LCA as a
tool for making decisions about the appropriate municipal solid waste (MSW)
management system to be implemented. This study compares the energy consumption
and greenhouse gas emission associated with the two approaches used for current MSW
management in Phuket, a province of Thailand. These approaches are land-filling
(without energy recovery) and incineration (with energy recovery). The LCA results in
this study show that the incineration approach is superior to land-filling. Nevertheless,
land-filling is found to be superior to incineration when methane (released in land-filling
process) is recovered and used to generate electricity.

Chapter 4-Life Cycle Assessment (LCA)
98
Although LCA has been used in a number of research studies in the Thai context, both in
product development and wider applications such as strategic planning or policy
making, no evidence of the use of LCA to examine the environmental performances of
alternative rice husk uses has been found. Consequently, there has been little to guide
the current research, which could use LCA as tool to assess the environmental impacts
of the main current and potential uses of rice husk within the Thai context. The LCA
results will be used to help identify the most environmentally friendly rice husk use
option for Thailand. The undertaking of the LCA of rice husk utilization in Thailand is
presented in Chapter 7.
4.7 Overview
LCA is one of several tools used in environmental management. It is used to assess
potential environmental impacts through the life cycle of the system under study. This
means that the possible impacts associated with every stage of its life cycle are
accounted for. LCA consists of four stages: goal definition, inventory analysis, impact
assessment and interpretation. With its holistic concept, LCA is found to be useful in
several applications. Despite its many advantages, LCA also has limitations. These
limitations need to be taken into account when making conclusions for an LCA study.
For example, Guinee (2002) pointed out that decisions can not be made based entirely
on LCA results, other evidence should be taken into consideration together with the
LCA results before any decision can be made. This guidance provides direction for the
current research where LCA will be used as a tool to analyse the environmental impacts
of the main current and potential uses of rice husk in Thailand (the conduct of LCA of
rice husk utilization is presented in Chapter 7). The LCA results from Chapter 7 will be
reviewed in the context of the key policy issues, in order to make conclusions for this
research (this will be dealt with in Chapter 8). Specifically, the most environmentally
friendly rice husk use in Thailand will be identified in Chapter 8, in response to the
overall research aim stated in Chapter 1.

Chapter 5-Research Methodology
99
5 RESEARCH METHODOLOGY
5.1 Introduction
The previous chapter (Chapter 4) described Life Cycle Assessment (LCA) which is the
analysis tool (to analyse the environmental impacts of the alternative uses of rice husk)
used in the later part of this thesis (in Chapter 7). However, the methodology used for
the conduct of the overall research needs to be considered. This chapter describes and
justifies the methodology used for this research. To begin with, the general theoretical
perspectives in social research are discussed. Then, the theoretical perspective employed
for this research is justified. The next section describes the research framework designed
for this thesis. This is followed by a discussion of each method employed in the
research. In addition, the information sources used and the ethical issues raised in this
research are discussed. The last section presents the conclusion of the methodology used
to inform how the overall research is conducted.
5.2 Theoretical Perspectives
Prior to the discussion about the research methodology employed in this thesis
(discussed in section 5.3), the theoretical perspective that informs the methodology
selected will be discussed. Crotty (1998, p. 3) defined theoretical perspective as “the
philosophical stance informing the methodology and thus providing a context for the
process and grounding its logic and criteria”. In social research, there are a number of
theoretical approaches which are relevant to social science. These include positivism,
interpretivism, Marxism, critical theory, feminism and postmodernism. The perspectives
outlined by these theoretical approaches are discussed in this section. The information

Chapter 5-Research Methodology
100
about the social theoretical perspectives described below come from Bessant & Watts
(2002), Crotty (1998) and Drislane & Parkinson (2006):
Positivism
Positivist perspective is a way to gain understanding of phenomena and their
connections to the natural and social sciences. It contends that all objects have inherent
meanings in themselves. Therefore, positivism does not ascribe subjective meanings to
objects. The positivist view point focuses on clearness and accuracy of the social
knowledge and the use of scientific approach to gain an understanding of human and
social development. It is based on the view that accuracy and truth come from the
objective measurement of a situation (Crotty 1998).
Interpretivism
Distinct from positivism, interpretivism looks for meaning of human subjective
behaviour. While positivism emphasizes measurement of how people act, the
interpretivist perspective says that knowledge comes from how people think about and
report their actions. Hence, interpretivists obtain social knowledge by studying cultures
and histories of the societies, and by taking meaning from the interpretations of people
(Crotty 1998).
Marxism
Marxist ideas have been widely used in philosophy, politics, economy and sociology.
The key idea is that in different periods of time, societies have had a distinct mode of
production and distinct social relationships in the economy. Marxism promotes the
belief that in every historical period, societies are unequal and the majority of people are
subordinated by a powerful minority. Marxists, therefore, agree that human action can
be understood by learning about the class structures of a society (Bessant & Watts
2002).

Chapter 5-Research Methodology
101
Critical theory
Critical theory represents the convergences of different intellectual ideas, such as
Marxism and psychoanalysis. It agrees with some ideas of other theoretical perspectives
but disputes others. The main task of critical theorists is providing criticism; they
emphasize making judgments of human actions, rather than just describing them
(Bessant & Watts 2002; Drislane & Parkinson 2006).
Feminism
Feminism is known as an intellectual movement primarily developed by women, though
it has influenced both genders. Feminists suggest that the social world has been
dominated by men, leading to the exclusion of women in the societies, and causing
women to be marginalized in social organization and culture. The aim of feminism is to
revise the social world, to find a way to criticize, re-evaluate and transform women’s
place in their societies (Bessant & Watts 2002; Drislane & Parkinson 2006).
Postmodernism
In social theory, postmodernism is the term used to refer to a rejection of the
assumptions of the modern world or of the enlightenment. Unlike modernism that
searches for disinterested knowledge, universal truth and social progress, postmodernism
abandons entire ways of claiming truth. Instead of clarify things, postmodernists prefer
to leave things ambiguous. This perspective suggests that we live in a fragmented world
with multiple realities, and science or other approaches can not create universal
principles of the social world because there is no unitary reality waiting to be found
(Crotty 1998).
These diverse perspectives provide opportunities for the way any research could be
conducted. However, the theoretical perspective that lies behind the methodology

Chapter 5-Research Methodology
102
proposed for this thesis is interpretivism, which suggests that the social world can be
understood by investigating the subjective meaning of human action. The interpretivists
learn by taking meaning from the interpretations of people (Crotty 1998). The overall
aim of this research is to identify the most environmentally preferable option for the use
of rice husk. To achieve this aim, there are some specific objectives to be dealt with
initially. It is important to identify the different uses of rice husk in the Thai context, to
investigate how rice husk has been treated in different manners and to analyse the
environmental impacts of the selected major and potential uses of rice husk in Thailand
(stated in section 1.2). To achieve the overall aim of this research, it needs to rely on the
information provided by others, and from a range of data sources. In these situations, it
needs to assume that the data obtained from the various sources are accurate. As
discussed in the section on the limitations of LCA (see section 4.6), LCA application
requires a lot of assumptions, value judgments and trade-offs to help in analysing the
environmental impacts. To perform an LCA study, it needs to assume that the data
derived from the assumptions made are validated. Thus, the interpretivist perspective is
considered appropriated to inform the research methodology employed for this thesis.
Within this research framework, the data collected will be analysed using a standard
LCA method and software package (discussed in Chapter 7). It is important to note that
the theoretical perspective that lies behind the LCA method is positivism. Therefore, the
positivism perspective is used to imform the methodology of analysis of environmental
impacts of alternative rice husk uses discussed in Chapter 7. While having a general
relationship to a positivist philosophy, this method relies heavily on interpretations of
human and physical system interconnections.
5.3 Qualitative and Quantitative Approaches
Research methodology is the framework that leads how we select the specific methods
or techniques to gather and analyse data in order to answer the research questions
(Crotty 1998). The methodology proposed for use in this research is a combination of
both qualitative and quantitative approaches.

Chapter 5-Research Methodology
103
Bryman (2001a, p. 264) defined qualitative research as “a research strategy that usually
emphasizes words rather than quantification in the collection and analysis of data”.
Quantitative research is defined as research involving the collection of numerical data;
research showing a deductive view of a relationship between the theory and research; the
preferred research approach used in natural sciences; and research using objectivist
conception to study the social world (Bryman 2001b). However, both qualitative and
quantitative have their own specific drawbacks (Bryman 2001a, 2001b).
Corbetta (2003) compared qualitative and quantitative research from different
perspectives: research planning, data collection, data analysis and production of results.
From this, he concluded that qualitative and quantitative research yield different results
which lead to different kinds of knowledge. However, both approaches provide rich
social knowledge. Hammersley (1992) argued that there is no simple difference between
qualitative and quantitative approaches in social research. This can present a problem
when making a decision about which approach is preferable for a research situation.
Thus, he suggested that using mixed methods is a better way because it would help to
limit the complexity of the problems we face.
Creswell (2009) discussed that the research problem influences a selection of the
research approaches to be used. The main research aim of this thesis is to find out the
most environmentally preferable rice husk use (as stated in section 1.2). To achieve this
aim, there are some specific objectives to be first tackled; to find out the current rice
husk uses within the Thai context, to find out how rice husk has been treated in different
ways and to assess the environmental impacts of the main and potential rice husk uses.
To achieve these objectives, it requires both qualitative and quantitative data. For
example, to investigate the current uses of rice husk in the Thai context, qualitative data
is required. Moreover, this information (based on the context set for this study) has not
been found in documents. So, the researcher would prefer to find out this information
from people with experience in the topic. Creswell (2009) suggested that the qualitative
approach is useful when the topic has not been addressed, by engaging with a certain

Chapter 5-Research Methodology
104
sample or a particular group of people. However, in the analysis of the environmental
impacts of the alternative rice husk uses, numerical data are required and so the
quantitative approach is also found to be useful. It is clearly seen that neither the
qualitative approach nor quantitative approach by itself is enough to achieve the overall
aim of this research. Thus, this research uses the mixed approaches as suggested by
Creswell (2009).
The research framework is divided into three main stages: investigating the current
situation of the rice husk utilization in Thailand, collecting data and analysing data (see
Figure 5.1 for the links between these stages). To begin the research project, the initial
literature review is conducted in order to inform the research direction and detail.
Literature also helps to inform the first stage of the research framework, which is to
investigate the current uses of rice husk in the Thai context. Literature, communication
with people involved with rice husk utilization in Thailand, and a questionnaire
(distributed to rice mill owners) provides the needed data. The findings from the first
stage help to identify the current main and potential uses of rice husk to be examined.
The second stage is to collect detailed data about how rice husk is used in different
processes. The data required in this phase are both qualitative and quantitative. For
example, the data collated in this stage are the production processes of different
industries using rice husk, the energy and resource consumption and emissions released
in these processes, the reasons why rice husk has been used in their production processes
and the benefits/barriers of using rice husk in their industries. This clearly shows that the
information needed in the second stage is in both qualitative and quantitative forms. The
research methods chosen to gather these data are literature review, questionnaire and
interview.
The final stage of the research is to analyse the data collated from the first and second
stages. In this stage, the environmental impacts of the selected main and potential rice
husk uses are analysed and compared, to identify the most environmentally preferable
rice husk use. The LCA software SimaPro (discussed in section 5.4.4) is used for this

Chapter 5-Research Methodology
105
assessment, to identify the environmental impacts of the different rice husk uses
investigated. The qualitative data collated from the first and second stages are used to
help interpret the results in the analysis stage.
Figure 5.1 Research framework
Initial literature review
Develop research aim
Investigation of the current status of rice
husk utilization in Thailand Literature review
Contacting people
Questionnaires
Collecting data
Literature review
Interviews
Questionnaires
Identification of the
potential alternative
rice husk uses to be
examined
Analysing data
LCA approach
SimaPro software
The most environmentally friendly rice husk use
Chapter 5-Research Methodology
106
5.4 Research Methods
The research methods adopted in this research have been mentioned in the previous
section. In this section, each method used in this thesis is discussed in more detail.
5.4.1 Literature review
Literature review is one of the most important research methods used in this thesis. It is
involved in all stages of this research. In the early stage of the research, the literature
review is undertaken in order to form the research aim. This aim is then used as a guide
to narrow the scope of the literature search. Creswell (2009) discussed that the literature
review helps to determine whether the topic is practical and worth conducting.
Moreover, it helps to focus the scope of the required areas of enquiry.
The literature review is also used in the data collection of this research. As discussed
earlier in section 4.6, LCA study requires a variety of data, and those data are not always
available from specific sites. Therefore, data from other sources are needed to fill the
gaps to help assess the environmental impacts. These data are found from a range of
literature sources such as books, journals, conference papers, news paper, governmental
department statistics, organization statistics and websites.
Moreover, in the discussion of the results, the literature review is employed to compare
the findings of this research with other research works and to support the arguments
made by the researcher. As stated earlier, the literature review is used in all stages of this
research. For example, it forms an introduction to the research, it is part of the findings
of this research and it is also used in the discussion of the results. Therefore, the
literature that has been reviewed is found in several chapters in this thesis.

Chapter 5-Research Methodology
107
5.4.2 Questionnaires
The questionnaire is the most widely used data collection technique, when research
participants are to be asked the same set of questions. The questions to ask the research
participants depend on the aim and objectives of the research. To be able to construct a
questionnaire, it is necessary to understand how the data will be analysed. De Vaus
(1995) suggested that it is important to get understanding of the methods of analysis
before developing a questionnaire that can be analysed as there is no point spending time
collecting data which can not be analysed in the end.
There are two types of questionnaire used in this thesis. The first is used to investigate
the current uses of rice husk and any concerns or issues arising from these different rice
husk uses. The second is used to collect quantitative data about the energy and resource
consumption and emissions released from the different production processes which use
rice husk.
The survey of the current rice husk uses was conducted within the large rice mills in the
north eastern and central regions of Thailand. These two regions are the first and second
largest rice producers in the country (as reviewed in section 2.3). The questionnaires
were distributed to the selected large rice mills within these areas in July 2007. The
name of the selected large rice mills (to be investigated) and their contact details were
obtained from the databases of the Department of Internal Trade.
The question type used in this questionnaire is open format. This is because the
researcher aims to gain information about how the rice husk from these rice mills is
actually used, without having any assumption about the answers before hand. Moreover,
the open ended questions allowed the participants to note additional information which
may be useful for this research (but are not asked in the questionnaire). The results of the
rice mill survey are presented and discussed in the next chapter (in section 6.2).

Chapter 5-Research Methodology
108
Another questionnaire used in this research is to collect the numerical data about the
energy and resource consumption and emissions released from the production processes
of the different industries using rice husk. These data will be used in the LCA study
(refer to Chapter 7) to assess the environmental impacts of the selected main and
potential rice husk uses. These questionnaires (to collect data for an LCA study) were
distributed (in August-September 2007) at the same time the interviews were conducted
(described in section 5.4.3), as the targeted participants were similar to those who
participated in the interviews. The targeted participants for these questionnaires (to
collect data for an LCA study) were identified based on the findings of the survey on the
current rice husk uses in Thailand. The results of the survey on the current rice husk
utilisation are presented and discussed in the next chapter (in section 6.2).
As De Vaus (1995) suggested, it is imperative to understand the methods of analysis
before constructing an effective questionnaire to collect data. This is to ensure that all
the data collated can be analysed. In this research, the LCA software SimaPro (described
in section 5.4.4) is used to analyse the environmental impacts of the selected alternative
rice husk uses to be examined. Therefore, it is necessary to understand how this software
works before developing the questionnaire. The researcher learned how to use the
SimaPro software, and the data types that would be used, before constructing the LCA
questionnaire (as shown in Appendix 1). Knowing how to use the software provides the
researcher with an idea of what kinds of data are required for an analysis (of the
environmental impacts). It also helps the researcher to develop the questionnaire to
collect data for use in the LCA study (refer to Chapter 7).
5.4.3 Interviews
The type of interview used in this research is the face to face semi-structured interview
which covers particular topic areas, but allows the interviewer to elaborate on the
questions to assist the understanding of the interviewee. For example, this technique
allows the researcher to use words with the same meaning but which are more
recognizable, and also change the order of questions according to the responses of the

Chapter 5-Research Methodology
109
interviewee (Hessler 1992). The duration of the interview was limited to an hour or less,
but depended upon the interviewee’s schedule. This type of interview is considered
suitable for collecting data for this research because it gives the opportunity for both
interviewer and interviewee to discuss the process, and ensure they have understood
what each other intended to say. In addition, it gave a chance for interviewees to share
their useful ideas or suggestions (as appropriate) for this research. For example, they
might recommend other potential interviewees or provide additional information which
could be relevant to the research.
The interviews with professionals involved in using rice husks in their work were
conducted during August to September 2007 in Thailand. Interviewees were known by
personal communication, literature searches and by attending seminars in this field of
research. Then, the interviewees were contacted by telephone and/or in person to
provide them with some background of the research and to see whether they were
willing to take part. The meeting times were then arranged if they accepted an invitation.
To obtain data needed for the study, the interviewees were asked to answer questions in
relation to production processes, reasons for using rice husk in their processes and
benefits/barriers of using rice husk within their industries. The interview questions are
shown in Appendix 2.
The identification of the interviewees was based on the findings of the survey on the
current uses of rice husk (results are presented and discussed in section 6.2). These
findings assisted in the identification of the interviewees along with their affiliated
industry sectors, the details of which are presented in the next chapter (in section 6.3).
The interview transcriptions presented in this thesis were translated to English from their
original language (Thai) by the researcher. The findings of these interviews are used in
the later parts of this thesis (Chapter 6 and Chapter 8).

Chapter 5-Research Methodology
110
5.4.4 Analysis techniques
The ‘triangulation’ technique is used to help develop the data set by accessing data from
different sources. Bryman (2001a) defined triangulation as the technique which uses
more than one method or data source to study a social phenomena. Bergman (2008)
commented that there are different interpretations of the term ‘triangulation’ and these
lead to different purposes for the use of this technique. However, in this study, the
triangulation technique is used to help validate the data (from different sources) and to
seek complementary information. For example, there may be different literature
reporting the same matter, in this case, the triangulation technique is used to validate
data.
In addition, triangulation can also be used to seek complementary information to help
the researchers develop a clearer picture of their studies. Bergman (2008) discussed the
idea that using different methods to study the same domain of the social world can yield
different findings from different view points. These perspectives provide different
pictures of the same social reality. However, these perspectives may not be useful for
validating one another. Rather, bringing them together might help to present a fuller
picture of the social world studied. This implies that findings of studies on the same
problem which use different methods, may help to provide complementary information,
rather than validating each others’ data. In this research, in some situations, the
triangulation technique is used to seek the complementary information from literature.
For instance, the findings from other research works which use different research
methods, may help to interpret the results gained from the analysis of this research.
To identify the environmental impacts of the selected major and potential rice husk use
options, the Life Cycle Assessment (LCA) approach is employed in this thesis. The
concept, framework and applications of the LCA are detailed in Chapter 4. Chapter 7
describes how the LCA is conducted and presents the LCA results. SimaPro software
was used to analyse the numerical data collected (energy and materials consumption and
emissions released from the different production processes which use rice husk in their

Chapter 5-Research Methodology
111
processes). The SimaPro software name comes from the full title “System for Integrated
Environmental Assessment of Products”, developed by PRé Consultants, the
Netherlands. This software is widely used to assess the environmental impacts of
products, processes and services. It is well known and has been widely used in many
countries (PRé Consultants 2006). It is available for use (for this research) through the
Centre for Design, RMIT University (more details about the features of the SimaPro
software are discussed in section 4.3.5).
5.5 Information Sources
5.5.1 Investigation of the current status of rice husk utilization in Thailand
The investigation of the current status of rice husk utilization within the Thai context
was undertaken by conducting a literature review. This literature is from multiple
sources, such as books, journal articles, conference papers, industrial magazines, theses,
governmental reports and websites. In addition, a network of people involved in the
industries using rice husk and in the LCA field in Thailand were used to contact
individuals with expertise in the topic. The questionnaires to get information about the
current rice husk uses were also distributed to the rice mill owners within the selected
areas investigated (see section 5.4.2). The information gathered from these different
sources would help to find out about the current and potential uses of rice husk and how
the husk is used in different industries. Moreover, the LCA experts may help to
recommend the sources of data required for the LCA study (refer to Chapter 7) in this
research.
The researcher started by contacting people in the Thai LCA Network which was
established and organized by the Faculty of Engineering, Chiang Mai University in
Thailand. Its intention is to help researchers and other people who are interested in LCA
to communicate and share the ideas about Life Cycle Assessment. This network has
members in both Thailand and other countries (Faculty of Engineering Chiang Mai

Chapter 5-Research Methodology
112
University Thailand 2005). Some useful information such as the names and contact
details of the companies and other researchers involved in using rice husk in their works,
were provided by some of the members of this network. The researcher then contacted
these people to invite them to participate in this research (to collect data for the next
stage of this research). Moreover, some of them recommended other potential
interviewees and additional useful information for this research.
In addition, the researcher participated in three Thai professional activities to find the
potential interviewees. In some situations, the potential interviewees were met directly
during the professional activities, while others were identified by the participants of the
professional activities.
The Thai professional activities attended by the researcher for the purpose of finding
interviewees and information used in this research were:
- The International Conference on Green and Sustainable Innovation 2006,
November 29th
– December 1st 2006, Chiang Mai, Thailand
10.
- The Second Workshop on the Utilization of Rice Husk and Rice Husk Ash
Silica, July 18th
2007, Bangkok, Thailand11
.
- The seminar ‘Bioenergy: New hope for Thai agriculture?’, August 16th
2007,
Department of Agricultural and Resource Economics, Kasetsart University, Thailand12
.
The purposes of attending these professional activities were to find out the information
about the current uses of rice husk within the Thai context; to find the potential
interviewees to participate in this research (to collect data for the next stage of this
research); and to share information with other researchers working on similar topics.
10
One of the themes of this conference was Life Cycle Assessment (LCA). The researcher also presented
a poster about this research as one way to call for interest for the conference participants. 11
Organized by the National Metal and Materials Technology Center (MTEC), and Chulalongkorn
University, Thailand. 12
Organized by the Department of Agricultural and Resource Economics, Kasetsart University, Thailand.

Chapter 5-Research Methodology
113
5.5.2 Collecting data
The findings from the previous stage helped to identify the current major rice husk uses,
as well as the potential uses to be examined. This stage is to collect data required for this
research. As discussed in section 5.3, the data required for this research are both
qualitative and quantitative. The research methods used to collect these data are
literature review, questionnaire and interview as described in detail in section 5.4.
An understanding of the process associated with each selected rice husk use option to be
investigated was initially obtained through a literature review. This literature was from
different sources including books, journal articles, conference papers, industrial
magazines, theses, government reports, and websites. Most notably, the personal
communications with the industry personnel involved in using rice husk within their
industries are the primary sources of information for this stage. The process associated
with each chosen rice husk use option to be examined was obtained through interviews
with the industry personnel using rice husk in their processes. These data will be used in
the LCA study (refer to Chapter 7).
The inventory data (to be used in the LCA study) of the selected rice husk use options to
be examined are collected at this stage. Allen & Rosselot (1997) commented that the
inventory data collection is the most important stage of LCA applications because it will
affect other remaining stages and the final results of the LCA study. This information
was collected from the chosen specific sites. The questionnaires were used to collect the
life cycle inventory data (see section 5.4.2 for details). However, as discussed earlier,
one of the problems of an LCA study is that all the required data are not always
available from one specific site. Therefore, the information from the literature review
will be used to fill gaps in the data. The sources of the life cycle inventory data used in
this research are documented in section 7.3.1.

Chapter 5-Research Methodology
114
5.5.3 Analysing data
In this stage, the data collated from the first and second stages are analysed. The results
are interpreted in order to draw conclusions for this research. For an LCA study of this
research (conducted in Chapter 7), the LCA software package SimaPro version 7.1.6 is
used to analyse the data (discussed in section 5.4.4). Different from the data collected for
the first and second stages of this research (as discussed in sections 5.5.1 and 5.5.2), this
third stage requires other information to help in the interpretation of the results. This
information comes from a variety of literature sources, as discussed in section 5.5.2.
5.6 Ethics
All research involving humans conducted by staff or students of RMIT University need
Ethics approval before research can proceed. This research required approval as some
data were to be collected by interviews and questionnaires, requiring interaction with
people. Therefore, to ensure that the research is conducted in an ethical manner, an
ethics application was submitted, and approved, setting out the following steps:
Sending the letter inviting people’s participation
Before approaching each individual or organization, a letter was sent by email/mail, to
the potential participants, to provide plain language information about this research. The
researcher then contacted them to ask whether they would like to participate in this
research. The names and contact details of all participants were kept confidential and in
a secure place. This was done in order to protect the identity of the research participants,
as these identity markers (names and contact details) may allow others to recognise them
(Bessant & Watts 2002).
In conducting interviews, both plain language statements and consent forms were sent to
the participants to allow them to understand the purposes of this research. With this
Chapter 5-Research Methodology
115
information, the participants could make the decision as to whether they would like to
participate or not. The consent forms were sent back before the interviews were
conducted. Bessant & Watts (2002) identified the importance of making sure that the
participants are clear about the purpose of the research and what it will be used for
before they can provide their consents to participate. Therefore, they suggested using
simple plain language rather than technical terms to inform the participants about the
research. For participants in Thailand, the plain language statement and the consent form
were translated into Thai language by the researcher.
The plain language statement for this research was also sent to the participants asked to
complete the questionnaire. However, the consent form was not used in the data
collection for questionaries, as it was assumed that by sending back the completed
questionnaires the participants had consented.
Recording information
To record the information during the interviews, the participants were informed that the
researcher would be taking notes. Audio recording was used when the consent of
interviewees had been obtained. The notes taken and audio recordings did not include
personal details of interviewees. The notes were transcribed from the researcher’s note
book onto the researcher’s personal laptop then the notes from the note book were
removed. This is to ensure that the information provided by the research participants and
their contact details will not be disclosed by others who are not involved in this research.
The names and contact details of the participants and the data obtained from them were
kept in separate files. De Vaus (2001) suggested that the personal details of participants
and their answers to the questions asked by the researcher should be kept in separate
files; identification numbers should be set in a way that would not allow other people to
match personal details to the data obtained from the interviewees.

Chapter 5-Research Methodology
116
Reporting information
To respect the privacy of all the research participants, all information obtained from the
interviews and questionnaires conducted for this research were reported anonymously in
this thesis. In addition, the research participants will receive a copy of the transcription
of their statements presented in the thesis. Furthermore, once the thesis is published, the
research participants will be informed of how to obtain a copy.
5.7 Overview
The theoretical perspective chosen to inform the methodology employed for this thesis is
interpretivism, which accepts that knowledge can be gained by taking data as interpreted
by the chosen informants. To achieve the research aim, the researcher assumes that this
information is accurate and is an appropriate approach when data cannot be collected
directly. Thus, the interpretivism perspective is considered suitable for this research. The
research framework is divided into three main stages. The first stage is to investigate the
current and potential uses of rice husk in the Thai context. The second is to collect the
data of the selected alternative rice husk uses to be examined. The last is to analyse the
data collated from the first and second stages. The data required for this research are
both qualitative and quantitative. Therefore, a mixed methods approach is used to collect
data for this research. The research methods used to collect data are a literature review,
questionnaires and interviews. This approach has supplied the background to rice husk
utilization in Thailand, discussed in Chapter 6. In the analysis of the environmental
impacts of the selected rice husk use options (see Chapter 7), the Life Cycle Assessment
(LCA) approach was used as a tool (with the LCA software SimaPro).

Chapter 6-Current and Potential Uses of
Rice Husk in the Thai Context
117
6 CURRENT AND POTENTIAL USES OF RICE HUSK IN
THE THAI CONTEXT
6.1 Introduction
The previous chapter (Chapter 5) described the methodology employed to inform the
conduct of the overall research. This chapter reports the findings of the first stage of this
research which is to investigate the current and potential uses for rice husk in Thailand
(as stated in the previous chapter). This data was used to determine the components of a
life cycle analysis (LCA), and to provide specific data for this analysis. The results of
this analysis are presented in Chapter 7. Although the review of rice husk and rice husk
ash utilization (Chapter 3) shows that rice husk and its ash were found to be useful in
many applications, this chapter only focuses on actual rice husk uses, especially on a
commercial scale in Thailand, and the significant potential rice husk uses. The first
section presents an analysis of the results of the survey conducted for this research, on
the current uses of rice husk in selected rice mills in Thailand. This is followed by a
discussion on the current utilization of rice husk in broader context, based on the survey
results, as well as interviews with industry personnel and a review of relevant literature.
Detail on the production processes, energy and resources consumption, emissions
released, waste management as well as the benefits and barriers to using rice husk in the
selected current major and potential uses of rice husk are then described. The final
section summarizes the key points discussed in this chapter. More importantly, it frames
the LCA of rice husk utilization study, discussed in the next chapter.

Chapter 6-Current and Potential Uses of
Rice Husk in the Thai Context
118
6.2 Rice Mill Survey
As reviewed in section 2.3, the first and second largest rice producers in the Thailand are
the north eastern and central regions. In 2007, these two regions together generated
approximately 20.3 million tonnes of total rice products for the whole country which is
accounted for about 67.3 percent of the total rice products (Office of Agricultural
Economics 2007b, 2008). A survey of the current utilization of rice husk generated in
rice milling process of the selected large rice mills within these regions was conducted
in July 2007. The large rice mills were selected for this survey because their contact
details can be accessed through governmental department databases as discussed in
section 5.4.2. Survey participants were asked to identify the current uses of rice husk
within their own mills, and if the husk was sold, the other user sectors and the extent to
which rice husk was transferred, were also questioned (as explained in section 5.4.3).
Thirty-three surveys were sent out to rice mill owners, eleven of which were completed.
The characteristics of these rice mills are described in the section below.
6.2.1 The survey results
This section analyses the results of the survey of rice mill owners. Table 6.1 presents
the current users of rice husk identified by the rice mill owners in both regions Most of
these mills used part of the husk themselves and sold the left over husk to the other
users. Therefore, more than one rice mill sold their husk to more than one different user
sectors. Overall, nine out of eleven mill owners identified using rice husk as fuel in the
paddy drying process within their own mills. Meanwhile, seven reported that they sold
the husk to rice husk power plants; four revealed that they sold the husk to farmers
within the area for use as an odour absorbent material in poultry and livestock farms.
Two owners identified clay brick producers, charcoal producers and paper factories as
rice husk users. Three owners mentioned soil conditioner/fertilizers, pottery producers
and salt producers as other user sectors, respectively.

Chapter 6-Current and Potential Uses of
Rice Husk in the Thai Context
119
Table 6.1 Number of rice mills identifying rice husk users by region
Current use of rice husk Total (No.) North east Central
Power generation 7 5 2
Paddy drying process 9 4 5
Clay brick production 2 1 1
Charcoal production 2 - 2
Odour absorbent material in poultry
and livestock farms 4 3 1
Soil conditioner/Fertilizer 1 - 1
Paper production 2 1 1
Charcoal burner production 1 - 1
Salt production 1 1 -
Source: Results of the survey conducted by the researcher.
Note: A rice mill identified more than one use.
Table 6.2 shows how rice husk was used in different production sectors. Two rice mills
were Small Power Producers (SPPs), which produced and sold electricity to Electricity
Generating Authority of Thailand (EGAT). One was located in Surin and one in Pathum
Thani, and mostly utilized rice husk internally. They used the husk as both a fuel in the
paddy drying process and as a main fuel in their power plants. Four out of five non-SPP
rice mills in the northeastern region mainly sold their rice husk to other users and used
only a small amount of rice husk within their own mills. In the central region, two out of
four non-SPP rice mills mainly utilized the husk themselves as a fuel in paddy drying.
However, only some rice mills could provide estimateed percentage of rice husk used
within their own mills versus that sold to external husk users. Furthermore, two mills
were unable to identify what proportions of rice husk were used within their mills and
sold-out. However, they could identify whether it was a majority or minority share, and
theses are referred to as major/minor share in Table 6.2.
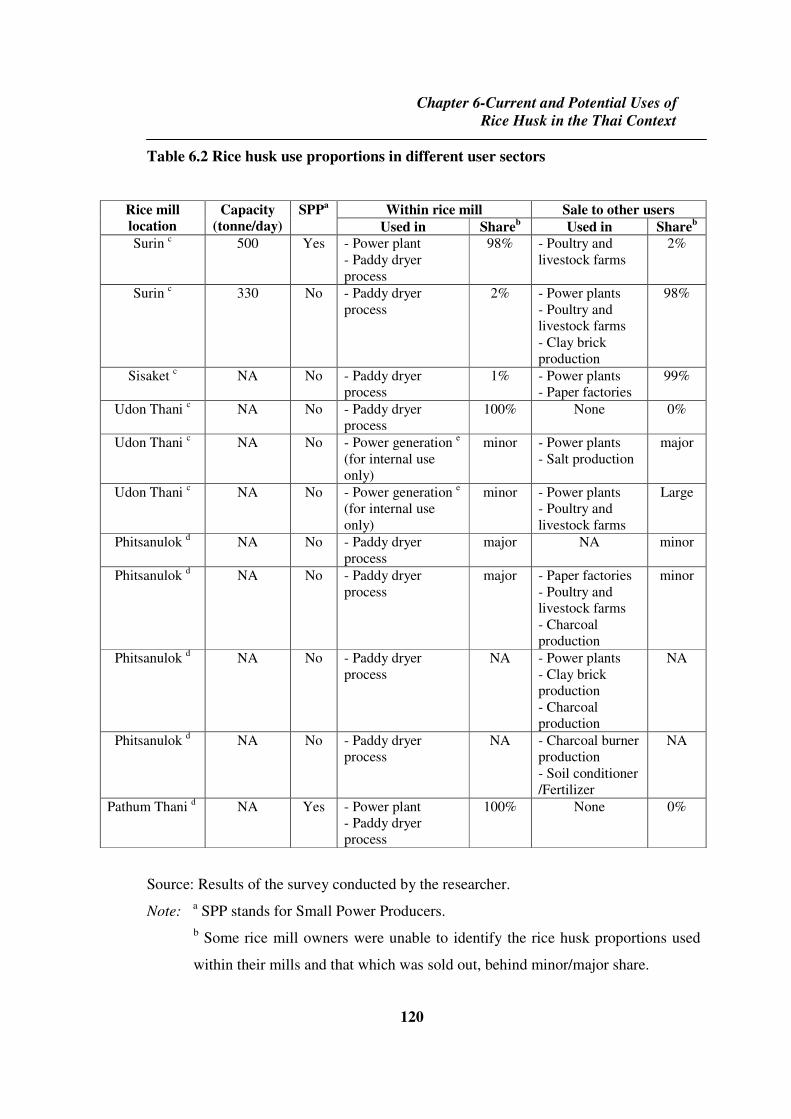
Chapter 6-Current and Potential Uses of
Rice Husk in the Thai Context
120
Table 6.2 Rice husk use proportions in different user sectors
Within rice mill Sale to other users Rice mill
location
Capacity
(tonne/day)
SPPa
Used in Shareb Used in Share
b
Surin c 500 Yes - Power plant - Paddy dryer process
98% - Poultry and livestock farms
2%
Surin c 330 No - Paddy dryer process
2% - Power plants - Poultry and livestock farms - Clay brick production
98%
Sisaket c NA No - Paddy dryer process
1% - Power plants - Paper factories
99%
Udon Thani c NA No - Paddy dryer process
100% None 0%
Udon Thani c NA No - Power generation e (for internal use only)
minor - Power plants - Salt production
major
Udon Thani c NA No - Power generation e (for internal use only)
minor - Power plants - Poultry and livestock farms
Large
Phitsanulok d NA No - Paddy dryer process
major NA minor
Phitsanulok d NA No - Paddy dryer process
major - Paper factories - Poultry and livestock farms - Charcoal production
minor
Phitsanulok d NA No - Paddy dryer process
NA - Power plants - Clay brick production - Charcoal production
NA
Phitsanulok d NA No - Paddy dryer process
NA - Charcoal burner production - Soil conditioner /Fertilizer
NA
Pathum Thani d NA Yes - Power plant - Paddy dryer process
100% None 0%
Source: Results of the survey conducted by the researcher.
Note: a SPP stands for Small Power Producers.
b Some rice mill owners were unable to identify the rice husk proportions used
within their mills and that which was sold out, behind minor/major share.

Chapter 6-Current and Potential Uses of
Rice Husk in the Thai Context
121
c Provinces in the north eastern region.
d Provinces in the central region.
e Two rice mills generated electricity for internal use only (not sell to EGAT).
NA = not answered.
6.2.2 Discussion of the survey results
Using rice husk as a fuel in paddy drying process within rice mills was given first
priority in most rice mills (mentioned by nine out of eleven rice mills); the left over husk
will then be sold to other users. One of the rice mills in the central region noted in the
survey that they have never run out of rice husk because most husk produced from the
mill was reserved for use within the rice mill, the husk was rarely sold.
Apart from the internal use of rice husk in the rice mills themselves, the main external
use was using rice husk as a fuel in power plants: seven rice mills reported that they sold
the husk to power plants. Within these, two rice mills also used the husk to generate
electricity for use within their own mills. In addition, conventional uses of rice husk
outside the mills across these two areas were similar. The main uses were as a fuel in the
power plants and as an odour absorbent material in poultry and livestock farms. Other
uses such as in clay brick and paper production were practiced in both regions.
Reflecting the different rice cultivation practices within Thailand, in the north eastern
region, non-SPP mills tended to sell their rice husk to different user sectors. As seen
from the survey results, four out of five non-SPP rice mills in this region reported that
most rice husk from their mills was sold out. One rice mill owner in Sisaket indicated
that only approximately 1% of all rice husk produced was required for the paddy drying
process (as a fuel) and the remaining 99% was sold to other users. In this area paddy rice
was harvested only once a year, and the paddy-drying period only took a month or two
per year. In the central region, paddy rice was cultivated for two seasons per year,
meaning rice husk was needed for the paddy drying process twice a year. For this

Chapter 6-Current and Potential Uses of
Rice Husk in the Thai Context
122
reason, some rice mills reserved the husk to be used internally. Nevertheless, some of
them chose to sell the husk rather than using them within their own mills.
The total rice production produced in the north eastern provinces was a little higher than
that of the provinces in the central region. The Office of Agricultural Economics (Office
of Agricultural Economics 2007b, 2008) reported that in 2007, the north eastern region’s
total rice production was about 10.8 million tonnes, whereas the central region generated
nearly 9.4 million tonnes . This implies that there is a larger volume of rice husk left
from the milling process in the north-eastern region, than in the central region. In
addition, if more rice husk was sold to different user sectors, there will be more rice
husk utilized outside rice mills in this area.
However, the survey results only show how rice husk was used in the areas investigated,
which have a limited representativeness of the overall of Thai context. While only rice
husk user sectors are listed, the actual volume of the husk distributed into different
sectors is barely examined, as there were no available records of this. This makes it
difficult to identify the main uses of rice husk. Therefore, to investigate the major uses
of rice husk in the Thai context, more information from other sources needs to be
integrated with the results of the rice mill survey discussed in this section. The next
section reviews the utilization of rice husk in Thailand in a broader context. This review
takes into account the results of the rice mill owner survey discussed in this section, in
light of the findings of a review of relevant literature and with the results of interviews
with relevant industry personnel.
6.3 Current and Potential Uses
In this section, the research draws on relevant literature, and the results of the survey
(presented in section 6.2) and of interviews with relevant industry personnel (see section
5.4.3 for detail on method), to further investigate the current utilization of rice husk in
the Thai context. For ethical reasons, the name of each interviewee used in this thesis

Chapter 6-Current and Potential Uses of
Rice Husk in the Thai Context
123
has been kept anonymous (each interviewee is given a label at random by the
researcher). Labels referred to in the later parts of this thesis along with their affiliated
industry sectors are shown in Table 6.3.
Table 6.3 Given names and related industry sectors of interviewees
Label of interviewee Industry sector
Interviewee 1 Power generation
Interviewee 2 Rice industry
Interviewee 3 Cement manufacturing
Interviewee 4 Agricultural consultant
Interviewee 5 Power generation
Interviewee 6 Power generation
Interviewee 7 Power generation
The different uses of rice husk in the Thai context are classified by industry type and
described below, based on the review of the information about rice husk utilization in
Thailand from the various sources mentioned, However, it is important to note that
although there has been substantial successful research on the utilization of rice husk in
different industries in Thailand, this section only reports the actual uses of rice husk that
have been practiced on a commercial scale.
It is difficult to define the current proportions of rice husk used in different industry
sectors across the whole of Thailand, as there were no data available at the time of the
study. Thus, the proportions of rice husk consumed in different industry sectors are not
included in this section. Only the industries using rice husk in their production processes
are named. In addition, the trend of rice husk consumption may change over time when
circumstances change. For example, Visvanathan & Chiemchaisri (2006) stated that, in
1997, 50-70 percent of rice husk was used within the rice mills themselves. In 2004,
Papong et al. (2004) reported that 38 percent of rice husk was used internally in the rice
mills. In 2007, Tinsuntisook (2007) reported that about 18 percent of rice husk generated
Chapter 6-Current and Potential Uses of
Rice Husk in the Thai Context
124
in the nation was used (in drying and milling) by the rice industry sector. This suggests
that rice husk consumption has changed over time. Moreover, it seems to be that more
recently, the volume of rice husk sold to external users has increased. Some of the rice
mill owners noted in the suyveys that they preferred to sell rice husk to the power plants
as it provides good income.
6.3.1 Rice mill industry
The results of the rice mill survey (discussed in section 6.2) indicate that rice husk has
conventionally been used as a fuel in the Thai rice mills themselves. It was also found in
some literature that rice husk has been used as an energy source through direct
combustion in the large rice mills (Papong et al. 2004; Visvanathan & Chiemchaisri
2006). The use of rice husk in this manner has been prioritised in most rice mills. This is
because rice husk is a co-product generated within the rice mills and it can be obtained
at no cost to the rice mill owners. The rice mills require energy to run the milling
machine and/or to use as a fuel in paddy drying. Thus, rice husk is considered the most
appropriate fuel to use within the mills themselves. Nevertheless, as discussed in the
previous section, some surplus rice husk remains unused in the rice mills. This husk is
then sold to husk users in other sectors (as described below).
6.3.2 Electricity industry
Rice husk based power plants, which use rice husk as a fuel within the production
process, have been found to be one of the largest rice husk consumers (outside the rice
mills), according to the rice mill survey results and in some literature (CDM – Executive
Board 2006; Editors of Engineering Today 2006; Parntaewan 2006; Ueda 2005; Anutum
2007; Chungsangunsit, 2004). Moreover, as discussed in section 3.5.4, with the support
from the Thai government in using the biomass energy such as rice husk, a large number
of small power producers using rice husk as a fuel have been established. This clearly
shows that electricity industry is one of the large-scale rice husk user sectors.

Chapter 6-Current and Potential Uses of
Rice Husk in the Thai Context
125
6.3.3 Cement industry
The cement industry is also one of Thailand’s large scale rice husk users (Anuwatwong
2006). Furthermore, as Anuwatwong (2006) argued, the high demand for rice husk in
the electricity and cement industries has resulted in high market prices of rice husk. This
has caused problems for both industries. As Ueda et al. (2007) argued, there is a need to
balance the rice husk uses among different rice husk use industries to mitigate the
competition between these. However, it is also important to assess the environmental
impacts that these large-scale rice husk users cause. This would provide the useful
supporting information for policy proposals to help reduce the conflicts between the rice
husk users.
6.3.4 Agriculture industry
Apart from using rice husk (as a fuel) within the rice mills themselves, one of its
ordinary uses is in agricultural production. Both rice husk and rice husk ash can be used
for agricultural purposes, in several ways. The different applications of rice husk and
rice husk ash include as a soil conditioner and compost; in poultry and livestock farms,
amongst others.
a) Soil conditioner and Compost
Rice husk and rice husk ash can be used as a soil conditioner (used in combination with
chemical fertilizer in the rice fields). The results of experiments conducted by
Songmuang (2000) over 20 years, show that using rice husk or its ash with chemical
fertilizer in rice fields, can increase yields up to 64% compared with rice fields not using
fertilizer. Moreover, the silica contained in rice husk and rice husk ash are believed to
help to strengthen the structure of the rice plant cells (Songmuang 2000).
Both rice husk and rice husk ash can be used as one of the components in compost
production, particularly as bulking agent (Ueda et al. 2007). However, Ueda et al.

Chapter 6-Current and Potential Uses of
Rice Husk in the Thai Context
126
(2007), maintained that the use of rice husk in the compost production is not in high
demand.
Using rice husk as a soil conditioner or as the component in the compost production can
not replace the chemical fertilizer. It can only complement the chemical fertilizer. The
plants still need chemical fertilizers at some stages of their growth for higher yields.
Songmuang (2000) argued that chemical fertilizer and organic fertilizer (such as rice
husk and rice husk ash) benefit the plants in different ways. The chemical fertilizer
provides the nutrition needed by the plants (which are not contained in the organic
fertilizer) while the organic fertilizer helps to improve the quality of the soil. Therefore,
it is suggested that the organic fertilizer is co-used with the chemical fertilizer to provide
the higher yields of plants.
b) Poultry and livestock farms
Poultry and livestock farms are one of the rice husk users in provincial areas as
mentioned in CDM13
– Executive Board (2006) and Ueda et al. (2007). Four out of
eleven rice mills surveyed also reported that these farms are husk users (see section 6.2).
Rice husk is laid on the floor to help absorb moisture and animal manure odour within
the farms. The residues taken out from the farm (the mix of husk and animal manure) are
normally then used in compost production.
While the uses of rice husk in the agricultural sector mentioned above have documented,
the actual volume of rice husk used in these ways is very limited compared with the
other large-scale rice husk use sectors, such as the electricity industry:
“The uses of rice husk in agriculture sector exist…however, when
compared with the use of rice husk as a fuel in other industry such as
13
CDM is Clean Development Mechanism and is discussed in detail in section 3.5.5.

Chapter 6-Current and Potential Uses of
Rice Husk in the Thai Context
127
the power plants, very little amount of rice husk is used in agriculture
sector.” Interviewee 4.
6.3.5 Others
Apart from the rice husk users described above, the survey results and the literature
(Bhattacharya et al. 1985; Chatveera et al. 1999; Papong et al. 2004; Visvanathan &
Chiemchaisri 2006) suggest that there are still some minor husk uses in the rural areas,
including clay brick production, charcoal production, charcoal burner production,
briquette production, salt production and in paper factories. The rice husk use industries
in the rural areas mentioned above are only in small-scale production. Therefore, they do
not use as greater volume of rice husk, as the larger rice husk users, such as power
plants.
6.3.6 Potential uses
As discussed in section 3.3.1, there are a number of potential rice husk applications.
However, in Thailand, the current major uses of rice husk seem to be as an energy
source in different industries. The industries that consume the large quantity of rice husk
at commercial scale are the rice mill, electricity and cement industries (as discussed
above). In these industries, rice husk has been used in the form of solid fuel in the
combustion process. Nevertheless, rice husk does not seem to have been used in other
form of energy. As also discussed in section 3.3.1, rice husk can potentially be converted
into liquid fuel such as cellulosic ethanol (Saha & Cotta (2008) Saha & Cotta (2007) and
Saha et al. (2005)) and as a bio-oil (Williams & Nugranad (2000) and Ji-lu (2007)).
Stucley (2006) claimed, however, that bio-oil can not yet be used in commercial
engines. While ethanol can be used to blend with petrol to make E10 (10 percent ethanol
blended with 90 percent petrol) to use in cars directly without any engine modification.
In light of the oil price crisis and Thailand’s dependency on imported fossil fuels (see
section 3.5), the use of rice husk as a feedstock in cellulosic ethanol production seems to
be an important potential rice husk use option for Thailand.

Chapter 6-Current and Potential Uses of
Rice Husk in the Thai Context
128
6.4 Production Processes of the Major and Potential Uses
As discussed in the previous section, the current main rice husk use industries in
Thailand are the rice mill, electricity and cement industries. With rising oil prices, rice
husk can potentially be used as a feedstock in the cellulosic ethanol production. In this
section, the production processes, energy and resource consumption, emissions released,
waste management as well as the benefits and barriers of the major and potential uses of
rice husk are described. The benefits and barriers of the major rice husk uses discussed
in this section are mainly derived from the view points of the rice husk users examined
in this study (the rice mill industry, electricity industry and cement industry). This
mainly draws on the transcripts of the interviews with the industry personnel (described
in section 6.3). Identifying the potential rice husk use options, such as the use of rice
husk as a feedstock in cellulosic ethanol production, is based on relevant literature, as
rice husk has not yet been utilized in this manner (in Thailand) at the time of data
collection. The information presented in this section informs how rice husk has been
treated in different applications and the issues concerned in each rice husk application.
In turn, this information provides material for and scope of, the LCA analysis described
in the next chapter (Chapter 7).
6.4.1 Rice mill industry
a) Background
Conventionally, rice husk has been used as a fuel within large rice mills in both the
paddy drying and milling processes. The husk is burned to provide the heat to paddy
dryer and boilers, which then produce steam for rotating the turbines to drive rice
milling machinery (Papong et al. 2004; Srisovanna 2004; The EC-ASEAN COGEN
Programme 1998, p. 28). In 1998, The EC-ASEAN COGEN Programme examined
energy consumption within rice mills. It found that the total energy required in rice mills

Chapter 6-Current and Potential Uses of
Rice Husk in the Thai Context
129
ranged from 30 to 60 kWh/tonne of paddy (for both drying and milling), depending on
the type of rice produced; parboiled rice needed more energy than simple white rice.
They also detailed the relationship of rice production to energy requirements and supply
within the rice mills, as shown in Figure 6.1.
Process energy required:
Paddy milling and drying: 30-60 kWh/tonne paddy
1 tonne of
Paddy
650-700 kg
White rice
Waste:
220 kg Husks ~ 90-125 kWh
Figure 6.1 Energy requirements and supply in the rice industry
Source: The EC-ASEAN COGEN Programme (1998)
Figure 6.1 shows that there is still surplus rice husk left in the rice mill after some husk
is used in paddy drying and milling. The EC-ASEAN COGEN Programme (1998)
further predicted that this excess husk has a structural power capacity of 66 MW.
However, it was noted that a rice husk fire energy system (to produce electricity) is
suitable for rice mills with a processing capacity of at least 5 tonnes per hour. Yet, they
reported that in 1996 there were only 78 rice mills that have processing capacity over 5
tonnes per hour.
Another study undertaken by Sookkumnerd et al. (2001) provided strong evidence to
suggest that using rice husk as a fuel to generate electricity in rice mills is economically
viable. They investigated proper technologies utilized to produce electricity within the
mills considering technical and economic issues. The common available technologies,

Chapter 6-Current and Potential Uses of
Rice Husk in the Thai Context
130
rice husk prices and financial rates involving investment at that time (November 2001),
were used in the models created. They suggested that rice mills with capacity of over 60
tonnes per day make only satisfactory investment yields for power generation used
within the mills. While producing electricity for both internal use and commercial
requires a minimum capacity of 300 tonnes per day. Regarding technology
considerations, a steam-engine was the best for power generation for rice mills internal
use. For both internal use and commercial purposes, steam turbine technology was the
better option.
These days, most large rice mills are electric and many of them generate electricity for
internal use and sell the surplus electricity to the grid. Srisovanna (2004) reported that
many of the eighty large rice mills with processing capacity of over 100 tonnes of paddy
per day, consume rice husk as a fuel to generate power. Together, these rice mills could
generate power of 50 MW. In addition, within this power generating capacity, 36 MW
was sold to the grid (June 1998). However, those rice mills with electricity generating
capacity of over 5 MW used rice husk, wood waste and imported coal as mixture fuel.
From the survey results, four out of the eleven rice mills produced electricity to supply
the mills themselves. Two of these sold their surplus power to the grid, while the other
two used their power generated, internally.
Rice husk, however, has still been used as a fuel for paddy drying. Although at present
most rice mills use electricity for their milling machinery, rice husk is still used as a fuel
in the paddy dryers (paddy drying and milling processes were described in details in
section 2.4.4). The Chairman of the Renewable Energy Industry Club, the Federation of
Thai Industries (in 2007) maintained that about 18 % of rice husk generated in the
country was used (in drying and milling) by the rice industry sector (Tinsuntisook 2007).
Almost all (nine) of the eleven rice mills in the rice mill survey (see section 6.2),
employed rice husk as an energy source in paddy drying. Another two rice mills that did
not use rice husk (as a fuel) in paddy drying, used the husk to produce electricity for
internal use (this includes both drying and milling machinery). Thus, at present rice mills

Chapter 6-Current and Potential Uses of
Rice Husk in the Thai Context
131
not only use rice husk as a fuel for milling and paddy drying, but also use it for
electricity generation.
b) Production process
Paddy drying practices have been discussed in section 2.4.4. Therefore, this section will
only review how rice husk has been used in paddy drying.
Rice husk has been utilized as a fuel in mechanical paddy dryers. Mechanical dryers
need both thermal and mechanical energy. Thermal energy takes up about 80 percent of
all the costs of energy required for the process. To reduce high energy costs, rice husk
has been used as a fuel to produce thermal energy, replacing petroleum based fuels such
as diesel and furnace oil (Thepent n.d.; Wutisin & et al. n. d.). Wutisin et al. (n.d.)
argued that using agricultural wastes such as rice husk and corncobs in paddy drying
could help to save more than 60 percent of energy costs, compared with the conventional
practice which uses fossil fuels. In Thailand, there are a range of paddy dryers that can
use rice husk as a fuel, from simple to advanced technologies, such as the re-circulating
batch dryer, the continuous-flow dryer and the fluidized bed dryer14
(Wutisin & et al. n.
d.).
The type of paddy dryer used depends upon the level of use (farm- or industry-level),
which in turn indicates the capacity of paddy to be dried. In all cases, the husk is burned
to produce hot air to supply to the dryer, and the heat is then sent to contact the wet
paddy rice (in a different manner for each type of dryer). For farm or village-level use, a
single type of paddy dryer may be used, whereas more than one dryer (or type of dyer)
are combined for industrial scale due to the higher capacity of the wet paddy rice to be
dried (Thepent n.d.; Wutisin & et al. n. d.).With its high efficiency, the fluidized bed
dryer seems to be popular among the Thai large rice mills. In a high capacity paddy
14
More details of each type of grain dryer can be found in Proctor (1994).

Chapter 6-Current and Potential Uses of
Rice Husk in the Thai Context
132
drying plant, it is often that LSU15
is combined with fluidized bed dryer (and also other
rice machinery). However, it is common that only fluidized bed dryers are used in paddy
drying plants.
To construct a paddy drying system, use of a rice husk burner is inevitable. A cyclonic
husk furnace16
has been developed and manufactured for use within most Thai large rice
mills and paddy drying plants (Rice Engineering Supply Co. Ltd. 2008a, 2008b, 2008c,
n.d.).
In general, any drying system starts with cleaning paddy rice then proceeds to the drying
step. In this step, hot air is supplied by the cyclonic husk furnace. The hot air then
contact the wet paddy at a set temperature, which can be adjusted depending on system
design, then the paddy goes out from the dryer for cooling in the tempering bin.
Thereafter, the paddy from the first stage drying is moved to another dryer for second
stage drying. The same cycle goes over again until the paddy has a moisture content of
13-14 % (Rice Engineering Supply Co. Ltd. 2008c). Thepent (n.d.) noted that moisture
content not only affects the period of the storage of paddy but also its milling quality. He
further argued that paddy with moisture content of 12-14 % gives highest head rice
(milled rice) yield. The number and type of the paddy dryers (also the husk furnace)
used depends upon the capacity of paddy to be dried; the higher capacity of paddy
requires more dryers and husk furnaces. For instance, an 18-20 tonnes/hour paddy
drying plant consists of three fluidized bed dryers and two cyclonic husk furnaces.
c) Energy and resources consumption
Energy is needed in any machines combined in a paddy drying system, such as a paddy
cleaner, cyclonic furnace and dryer. As this research examines how rice husk has been
15
LSU is one type of grain dryers, more details can be found in Proctor (1994). 16
Cyclonic husk furnace is one type of husk burners that is used to produce hot air supplied to paddy
dryer.

Chapter 6-Current and Potential Uses of
Rice Husk in the Thai Context
133
treated in different manners, this section will identify energy and resource consumption
in the specific part of paddy drying system that uses rice husk. The cyclonic husk
furnace is the only machine that requires rice husk in the drying system. The furnace
consists of five main parts, namely the combustion chamber, rice husk feeding system,
air feeding system, controller system and air suction blower. Rice husk is utilized as a
main fuel to generate hot air in the combustion chamber and electricity is used as an
energy source in other parts of the furnace (Swasdisevi et al. 1998). The amount of
power consumed in cyclonic furnace varies depending on the size of the machine and
the husk feed rates (Rice Engineering Supply Co. Ltd. 2008a).
d) Emissions released
There are no available data on emissions released from using rice husk in the paddy
dryers from both machine manufacturers and consumers (farmers, rice mills and paddy
drying plants). However, the cyclonic husk furnace has been developed in both
academic institutes and agricultural departments before being commercialized in the
country (Chujinda 1997; Soponronnarit & et al. 2000; Swasdisevi et al. 1998; Wutisin &
et al. n. d.). Therefore, the emissions released from using rice husk in paddy dryers can
be found in the literature just mentioned. The main sources of pollution caused by the
husk furnace are emissions to air (flue gases from combustion) and solid waste (rice
husk ash) (Swasdisevi et al. 1998). However, there is no emission to water since water is
not used in the process. Rice Engineering Supply Co., Ltd. (2008a) stated that being
waterless is one of the features of the cyclonic husk furnace. . They explained that the
system designed for this husk furnace uses air force to make ash fall to the ground and
therefore no water is needed.
e) Waste management
Waste management efficiency is determined by the users of the husk furnace. These can
be farmers, the owners of rice mills or paddy drying plants. There are several variables
affecting approaches to dealing with rice husk ash. These depend on who the users are,
Chapter 6-Current and Potential Uses of
Rice Husk in the Thai Context
134
and on the situation of the rice husk ash market in the area. For example, if the farmer is
the user of the husk furnace, rice husk ash may be used as a soil conditioner or used as
one of the components for organic fertilizer production. So it can provide added value to
the farmers and there is no waste to deal with (the process of using rice husk and rice
husk ash in compost production will be described in section 6.3.4). Sometimes, it
depends on the situation of the ash uses in the area. For example, Interviewee 2
mentioned that locally, rice husk ash had traditionally been used as one of the raw
materials in making substrate culture for use in planting pots. Therefore, rice husk ash
from rice mills or paddy drying plants in this area (mentioned by the interviewee 2) is
mostly sold to substrate culture producers.
f) Benefits of using rice husk in the rice industry
A primary reason for using rice husk in the paddy drying process (to replace the
petroleum based fuels) found from both literature and the interviews with the industry
personnel is that it helps with fuel cost reduction. The idea is that rice husk has been left
over from rice milling process as a waste. To deal with this waste and also to decrease
the fuel costs of paddy drying, the husk has been employed as a fuel in the paddy dryer:
“It is an effective way of dealing with residual from rice milling
process. Rice husk is obtained at no cost; therefore, fuel costs can
be reduced. Even if we have to buy rice husk to use in our paddy
dryer, it is still considered cheaper compared to diesel.”
Interviewee 2.
g) Barriers to using rice husk in the rice industry
There are also some problems associated with using rice husk in the paddy drying
process. As discussed in the section on emissions released and waste management, rice
husk furnace causes emissions to air, such as the flue gases released from the
combustion chamber and rice husk ash (while there is no ash when using diesel as a

Chapter 6-Current and Potential Uses of
Rice Husk in the Thai Context
135
fuel). It is the responsibility of the rice mill or paddy drying plant owners to deal with
these emissions:
“The ash released from husk furnace is hot and dusty, so it needs to
be taken care of properly. To do this, we pile the ash in a secure
place (to avoid its exposure to humans and animals) to cool it down
before preparing to sell to the ash users.” Interviewee 2.
The high price of rice husk can cause a problem for the stand alone paddy drying plants
using rice husk as a fuel. Most large paddy drying plants have rice mills themselves so
the husk from their mills can be supplied to the paddy dryers at no cost. For those who
do not have the rice mills, the husk has to be purchased from other sources. Nowadays,
rice husk prices have risen very high and this can be an obstacle for them. Rice husk has
now been utilized in several ways and a number of manufacturers employ rice husk in
their processes. Hence, this leads to an increase in the husk market prices as one
commented:
“We have to buy rice husk to use in our paddy dryer because we
don’t do rice mill anymore and now the price of husk is very
expensive. It used to be very cheap back in about five or six years
ago…it was 50-100 bahts17
/tonne only but now the price has
increased so fast…it is now about 600-700 bahts/tonne.”
Interviewee 2 (at August 2007).
6.4.2 Electricity industry
a) Background
There has been extensive research into the electricity generation from rice husk. This
was influenced by the strong support from the Thai government to promote the use of
17
Baht is the currency of Thailand.
Chapter 6-Current and Potential Uses of
Rice Husk in the Thai Context
136
biomass energy including rice husk (discussed in section 3.5). In 1998, the EC-ASEAN
COGEN Programme18 completed a detailed study on the “Evaluation of Conditions for
Electricity Production Based on Biomass” for the National Energy Policy Office
(NEPO)19
. This study analysed all important aspects of power generation by using
biomass as a fuel. This included biomass sources and its availability in Thailand,
potential biomass resources for electricity production, biomass conversion technologies
for power generation and financial assessment.
The study found that rice husk was Thailand’s second largest biomass resource (the first
was bagasse). By taking existing biomass technologies into account, the rice industry
was identified as one of the potential power producers (from biomass resources). In
1998, the structural power capacity20
of rice husk in the country was estimated at 66
MW (calculated based on the basis of sizes, a number of rice mills and the technologies
used at the time of the study only.) In terms of biomass conversion technologies used in
Thailand, the EC-ASEAN COGEN Programme reported that combustion on grate was
the most common practice. They also suggested gasification as a possible option, but not
for use in power generation system connected to the grid. In addition, they stated that
rice husk gasifiers could only be competitive with diesel power plants with power
capacity of 70-200 kWe (The EC-ASEAN COGEN Programme 1998).
Another research project by Black & Veatch Corporation, one of the consultants selected
by NEPO to assist with the programme promoting biomass energy use in Thailand,
concerns “Biomass-based Power Generation and Cogeneration within Small Rural
Industries of Thailand” (Pletka 2000). This three year project (1997-2000) aimed to
18
EC-ASEAN COGEN Programme is an economic cooperation programme between the European
Commission (EC) and the Association of South-East Asian Nations (ASEAN) coordinated by the Asian Institute of Technology (AIT), Thailand. Its aim is to promote the implementation of proven technologies generating heat and/or power from biomass. 19 The National Energy Policy Office (NEPO) is now called “Energy Policy and Planning Office
(EPPO)”. 20
Structural power capacity is power potential that could be installed in rice mills that have processing
capacity above the minimum size required by the appropriate energy technologies.

Chapter 6-Current and Potential Uses of
Rice Husk in the Thai Context
137
analyse the potential of cost effective biomass-based electricity production in small rural
industries in Thailand and to help those with viability to enter the Thailand Small Power
Producer (SPP) Program (see section 3.5 for more details). In this study, rice husk was
identified as the most viable biomass fuel in the country based on available unused
residues at the time of the study. They also noted that the figures given in their report
may differ from the other estimates of the amount of the potential biomass resource due
to different assumptions taken into account. Ten small industries (with their existing
energy facilities) in the rural areas were selected to perform feasibility studies. These
sites include different industries using different biomass fuels to generate power (namely
rice husk, wood waste, palm oil residues and bagasse); four of these were rice mills.
The results of this study showed that power capacity from those sites selected could
range from 2 to 10 MW and that all facilities studied were technically feasible. If
implemented under a reasonable plan, most of them could be financially viable. In
addition, it was reported that some of these projects had begun implementation during
the time of the research. However, Pletka (2000) also remarked that the development of
biomass-based power projects would grow fast if the Thai government adopted
favourable policy. Also, they stated that the obstacles of development should be
sufficiently addressed to help to provide more capacity and benefits of using energy
from biomass (Pletka 2000).
The Thai government seems to have been well placed to address the obstacles in the
implementation of the biomass based electricity generation at a commercial scale. The
Thai government has issued favourable policies and regulations to support the small
power producers using renewable energy (including rice husk), as discussed in detail in
section 3.5. With the support from the government, a large number of small power
producers have been established and commenced operation (see details in section 3.5).
This has assisted the electricity sector to become the largest rice husk user industry
(apart from the rice mill sector).

Chapter 6-Current and Potential Uses of
Rice Husk in the Thai Context
138
b) Production process
Energy Policy and Planning Office (2007) reported that all rice husk power plants are
steam power plants. However, the specific burning techniques used in all rice husk based
power plants in Thailand were not reported. Therefore, the information about the
technologies used in the rice husk based power plants discussed below comes from other
literature and from the interviews with the industry personnel undertaken for this
research.
Combustion technologies have been widely used in the biomass (including rice husk)
based electricity generation. Asavapisit & Piyaphanuwat (2005) reported that all
biomass based power plants operating in Thailand use combustion technology to convert
biomass to energy. Moreover, Witchakorn & Bundit (2004) stated that the existing
biomass burning systems consist of mass burn stoker boilers, stoker boilers, fluidized
bed, gasification with combustion in a close-coupled boiler and pulverized fuel
suspension fired boilers. The stoker boiler is the most common system used among those
biomass-based power plants21
.
Power production processes differ from site to site depending on the specific techniques
employed in each plant. However, all rice husk power plants consist of fundamental
units as described below. The information described in this section is derived from
several literature sources (A. T. Biopower Co. Ltd. n.d.; Anutum 2007; Anuwatwong
2006; Chungsangunsit 2004; Chungsangunsit, T et al. 2004; Editors of Engineering
Today 2006; Editors of Industrial technology review 2006; Industrial Power Technology
Pte Ltd. n.d.; Parntaewan 2006; Sustainable Energy Technology at Work n.d.; Thepnoo
2006):
An example of a flow chart of the electricity generation from rice husk is shown in
Figure 6.2. The flow chart represents the production process of the Bua Sommai rice
21
More details of major biomass technologies appear in the report of The EC-ASEAN COGEN
Programme (1998, pp. 37-50).

Chapter 6-Current and Potential Uses of
Rice Husk in the Thai Context
139
husk power plant, located in Roi-Et province, Thailand (adopted from Thepnoo (2006)).
This power plant uses stoker boiler (with travelling grate) which is the most common
type of boiler used in the Thai rice husk based power plants (Asavapisit & Piyaphanuwat
2005).
Figure 6.2 Rice husk power plant flow chart
Source: Modified from A. T. Biopower Co. Ltd. (n.d.); Thepnoo (2006)
Note: This is the flow chart of Bua Sommai rice husk power plant, located in Roi-Et
province, Thailand and this flow chart can only represent this specific site.
Black arrow = steam; grey = cleaned gas and dashed = ash.
ESP stands for Electrostatic Precipitator.

Chapter 6-Current and Potential Uses of
Rice Husk in the Thai Context
140
1) Rice husk storage and feeding system
The husk is kept in a silo or bunker before being transported to the boiler furnace (the
transportation of rice husk to the boiler furnace may be done by conveyor belt or service
hopper system). In addition, in some plants, the husk is air-blown into the furnace to
improve the combustion process. Moreover, in the plant using a suspension fired boiler
that uses the ground rice husk, a grinding machine is set up before the combustion
chamber (A. T. Biopower Co. Ltd. n.d.).
2) Boiler system
The function of this system is to produce steam for a steam turbine generator (see item 3
below). The boiler system includes a furnace and boiler; the type of machine used in this
process depends on the burning system used in the particular site. The most common
technique used is stoker (with inclined or travelling grate). However, some other
systems such as fluidized bed and suspension fired are also used in a few sites. Rice
husk is the main fuel (diesel or papers may be used at start-up in some plants) in the
furnace to produce hot flue gas to heat up water in the boiler. The heated water is then
transformed to steam.
In some plants, an economizer is installed prior to water (from water supply system (see
item 6 below)) entering the boiler, to warm up the supplied water before being heated
again in the boiler. The equipment uses the wasted energy obtained from rice husk
combustion process (taking place in the furnace). Adding this economizer in the process
would help to reduce the fuel used (rice husk). Since water is preheated before passing
into the boiler, less energy is required in the boiler to produce the steam. This means that
a quantity of rice husk used in the boiler furnace can be reduced compared with when an
economizer is not installed in the process.
Chapter 6-Current and Potential Uses of
Rice Husk in the Thai Context
141
3) Steam turbine generator
This part of the plant is where the electricity is generated (see Figure 6.2). This requires
high pressure and temperature steam to enter this unit. This high pressure and
temperature steam turns the blades of the turbine, which are connected to the electricity
generator. The electricity is then be generated. Some of the electricity produced is used
within the power plant and the surplus electricity is transferred to the grid. The pressure
and temperature of the steam produced from the boiler are set to particular values. The
values required in each plant are based on the specification of the steam turbine
generator used in the particular plant.
4) Condenser and cooling tower
The condenser is where the steam, which exits the turbine, is condensed into liquid
(water). This water (with some heat remaining) is sent back to be used in the boiler (see
Figure 6.2). The cooling tower is the unit that supplies cooling water to the condenser to
help remove heat away from the steam. The heat taken via condensing process in
cooling water will be vented away into the environment by evaporation. Additional
water is added regularly to replace some water that is lost with the heat, through
evaporation.
5) Water supply system
This sub-system supplies water to both the boiler and the cooling tower. The quality of
water required for both units are different; the boiler needs a higher water quality to help
to maintain the machine. Water required in a cooling tower can only be prepared by
coagulation, while feed water for the boiler needs to be treated in a further step called
demineralization. Demineralization is the process by which ions are removed by ion-
exchange resin. The techniques used for water pre-treatment vary from plant to plant.
For example, one power plant uses a polymer to coagulate the raw water received, and
then adds chlorine and lime for disinfection.

Chapter 6-Current and Potential Uses of
Rice Husk in the Thai Context
142
6) Rice husk ash handling systems
There are two types of ash produced by the production process: bottom and fly ash. The
former falls into the bottom of the furnace and the latter is usually captured by air
treatment equipment used in the site. The main fly ash treatment tools employed in the
Thai rice husk power plants are electrostatic precipitator (ESP), wet scrubber and bag-
house filter (Asavapisit & Piyaphanuwat 2005). The fly ash falls into the base of the
equipment during the treatment process taking place and the cleaned gas is then emitted
into the environment via the stack. Thereafter, the ash is removed from both the furnace
and the air treatment unit to be stored in the ash silo before being prepared for sale to the
rice husk ash users or for transporting to landfill. In particular, the air treatment tool such
as the wet scrubber, releases waste-water after the treatment process, so it is necessary to
install a waste water treatment system if the wet scrubber is to be used in the plant.
However, it should be noted that different combustion techniques used in the rice husk
power plants yield different types of rice husk ash. In the power plant shown in Figure
6.2 (the Bua Sommai rice husk power plant), the bottom ash and fly ash are collected
separately. However, the ash generated in other rice husk power plants using different
combustion techniques may be collected differently. For example, in plants using the
fluidized bed combustion technique, the ash is mixed with the bed (usually sand) before
being removed from the bottom of the furnace.
c) Energy and resources consumption
Information about the energy and resources consumption in the process is found in
literature such as industrial magazines, reports and online articles and personal
communication with the rice husk power plant personnel. As discussed in the section on
the production process, this information can vary from site to site depending on the plant
design. LCA requires a range of data and it is often difficult to obtain this data (as
discussed in section 4.3.2). Therefore, the energy and materials inputs and emissions

Chapter 6-Current and Potential Uses of
Rice Husk in the Thai Context
143
data of the specific rice husk power plant that has most data available are presented in
this section and will be used in the LCA study (in Chapter 7). However, it should be
noted that not all the data needed have been obtained from the specific site; some data
from other rice husk power plants have been used to fill these data gaps. Here, the data
about the energy and resources consumption of the A. T. Biopower rice husk power
plant is presented because this plant has most data available (see Table 6.4). Even so,
there are still some minor data missing and assumptions have been made to estimate
those data (these are discussed in detail in section 7.3.1).
The A. T. Biopower rice husk power plant has a generating capacity of 22.5 MW and it
is the largest rice husk power plant in Thailand (at the time of data collection in August-
September 2007) and uses the state-of-the-art technology. It has exported electricity to
EGAT since December 2005 (Energy Policy and Planning Office 2007). According to
the regulations of the Environmental Impact Evaluation Bureau, an environmental
impact assessment (EIA) was required before this power plant was established. In
Thailand, thermal power plants with a capacity of 10 MW or more are required to have
an EIA report approved by the Office of the Natural Resources and Environmental
Policy and Planning before commencing construction (Environmental Impact Evaluation
Bureau (EIEB) n. d.). As part of this, the environmental profiles of the plant need to be
monitored and reported to the office regularly. This suggests that environmental data of
the power plant are measured and available. As many small rice husk based power plants
have capacities less than 10 MW, they do not have to measure or report on their
environmental emissions to the Office of the Natural Resources and Environmental
Policy and Planning. Moreover, the A. T. Biopower rice husk power plant is one of the
Carbon Development Mechanism (CDM) projects and is also multilateral company so
much information on the plant details is available in a variety of literature sources (CDM
– Executive Board 2006).

Chapter 6-Current and Potential Uses of
Rice Husk in the Thai Context
144
d) Emissions released
Emissions released from the process are flue gases and rice husk ash produced from the
combustion chamber and sludge from the raw water treatment process. Additionally,
there may be waste water generated from the air treatment unit if wet scrubber is used in
the site. Different forms of rice husk ash are released from each power plant. In some
power plants, fly ash and bottom ash are collected in the same unit so the ash will be
mixed when taken out from the chamber. Meanwhile, some other plants have fly or
bottom ash released separately. This depends upon the ash collection system designed
for each power plant. In the case of fluidized bed power plant, bottom ash is mixed with
a bed (normally sand) when discharged.
Emissions data of the A. T. Biopower rice husk power plant are presented in Table 6.4.
However, it should be noted that the data presented in Table 6.4 are the available data
(about the energy and resources consumption and emissions released) of this specific
site. These data will be used in the LCA study of this research (see section 7.3.1) to
analyse the environmental impacts caused by using rice husk to generate electriity.
Clearly, there may be some data missing (on this specific site), such as the amount of
sludge generated in the raw water treatment unit, the chemicals used in raw water
treatment etc. Thus, as mentioned, assumptions had to be made to complete the life cycle
inventory data when performing an LCA study (these will be dealt with in the next
chapter in section 7.3.1).
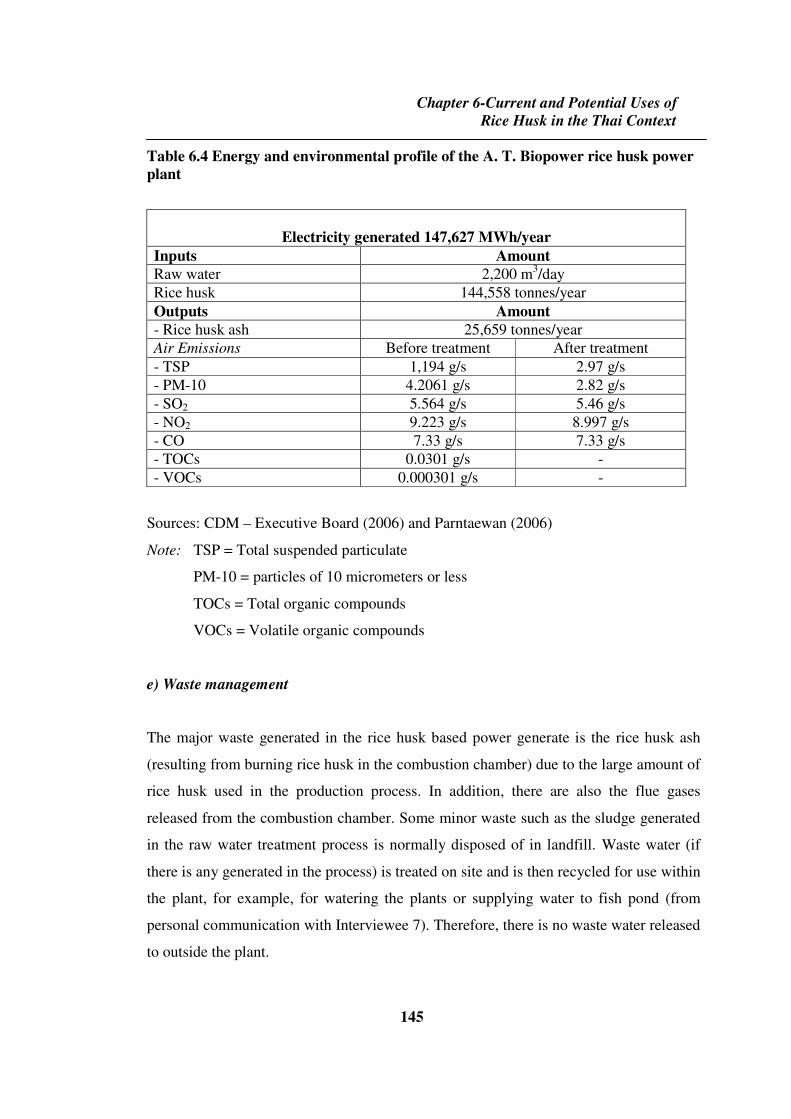
Chapter 6-Current and Potential Uses of
Rice Husk in the Thai Context
145
Table 6.4 Energy and environmental profile of the A. T. Biopower rice husk power
plant
Electricity generated 147,627 MWh/year
Inputs Amount
Raw water 2,200 m3/day
Rice husk 144,558 tonnes/year
Outputs Amount
- Rice husk ash 25,659 tonnes/year
Air Emissions Before treatment After treatment
- TSP 1,194 g/s 2.97 g/s
- PM-10 4.2061 g/s 2.82 g/s
- SO2 5.564 g/s 5.46 g/s
- NO2 9.223 g/s 8.997 g/s
- CO 7.33 g/s 7.33 g/s
- TOCs 0.0301 g/s -
- VOCs 0.000301 g/s -
Sources: CDM – Executive Board (2006) and Parntaewan (2006)
Note: TSP = Total suspended particulate
PM-10 = particles of 10 micrometers or less
TOCs = Total organic compounds
VOCs = Volatile organic compounds
e) Waste management
The major waste generated in the rice husk based power generate is the rice husk ash
(resulting from burning rice husk in the combustion chamber) due to the large amount of
rice husk used in the production process. In addition, there are also the flue gases
released from the combustion chamber. Some minor waste such as the sludge generated
in the raw water treatment process is normally disposed of in landfill. Waste water (if
there is any generated in the process) is treated on site and is then recycled for use within
the plant, for example, for watering the plants or supplying water to fish pond (from
personal communication with Interviewee 7). Therefore, there is no waste water released
to outside the plant.

Chapter 6-Current and Potential Uses of
Rice Husk in the Thai Context
146
Regarding the rice husk ash management, the ash is usually sold to different users, and
some that can not be sold is disposed of in landfill or dumped. The rice husk ash
(generated from the rice husk power plants) utilization activities differ across the nation.
Asavapisit & Piyaphanuwat (2005) carried out a survey on the uses of the ash produced
from different power plants using rice husk as a fuel across the country. The results are
presented in Table 6.5. It should be noted that there are some power plants which use
mixed fuels (rice husk mixed with other biomass fuels). The survey also investigated the
uses of the ash generated from these power plants (using rice husk mixed with other
biomass fuels).
Table 6.5 The uses of rice husk ash generated from different rice husk based power
plants
(Data for plants using rice husk are indicated in italics)
Power plant Fuels used Ash uses
1 Rice husk Use in clay brick
production
2 Rice husk, eucalyptus
barks, bagasse, corn cob Soil conditioner
3 Rice husk, eucalyptus barks, rubber wood
Landfill
4 Rice husk Soil conditioner, dumped
5 Rice husk, barks, bagasse Soil conditioner
6 Rice husk Export*
7 Rice husk Export*
Export* (if rice husk is the
only fuel used) 8
Rice husk, corn cob, barks, coal Soil conditioner (if mixed
fuels are used)
9 Rice husk Soil conditioner
10 Rice husk, barks, bagasse Soil conditioner
11 Rice husk, bagasse Landfill
Source: Asavapisit & Piyaphanuwat (2005)
Note: * Based on the interview with the industry personnel, rice husk ash is exported to
foreign counties to be used in the steel industry and semi-conductor industry.

Chapter 6-Current and Potential Uses of
Rice Husk in the Thai Context
147
Data in Table 6.5 shows that the power plants using only rice husk as a fuel sent the ash
to the different users such as clay brick producers, farmers (for use as a soil conditioner)
and for export to foreign countries for use in the steel industry and semi-conductor
industry. In addition, one power plant using only rice husk as a fuel reported that some
rice husk ash was also dumped. However, for the power plants using mixed fuels (rice
husk mixed with other biomass fuels), the uses of the ash are only limited to soil
conditioner and disposing the ash in landfill. Nevertheless, it is important to note that
this survey had been conducted in 2005, and the circumstances may have changed so the
current trend of using the ash generated from the rice husk based power plants may
change.
The uses of the rice husk ash generated from the rice husk based power plants were also
raised in the interviews with some of the rice husk power plant managers (conducted in
August-September 2007). The findings (about the ash uses) from these interviews are
similar to the findings from the survey conducted by Asavapisit & Piyaphanuwat (2005),
with the exception that that some other use such as the use of rice husk ash in the light
weight concrete block production was also mentioned. All other ash uses mentioned
(such as soil conditioner, clay brick production, landfill and export) are the same as the
findings from the survey conducted by Asavapisit & Piyaphanuwat (2005).
Thepnoo (2006) assessed the technical and economic viabilities of the uses of rice husk
ash from three different rice husk based power plants which were selected based on their
varying technology and location. The possible rice husk ash uses examined in his study
are the use of rice husk ash in clay brick production, as a soil substrate for pot plants and
the export of rice husk ash to foreign countries for use as a refractory material. However,
it should be noted that the rice husk ash uses examined in this study were selected based
on the possibilities of using rice husk in different applications, so they may not be the
actual major rice husk ash (from the rice husk based power plants) use practices across
the country. Thepnoo (2006) found that the rice husk ash from different rice husk based
power plants is suitable for different applications. This is because various rice husk

Chapter 6-Current and Potential Uses of
Rice Husk in the Thai Context
148
power plants (which use different technologies) give different characteristics of rice
husk ash and each rice husk ash application requires specific qualities of the ash.
Moreover, he found that different types of rice husk ash (bottom and fly ash) from the
same rice husk power plant have different characteristics and so they are suitable for use
in different applications.
Nevertheless, Thepnoo (2006) only analysed the technical and financial feasibilities of
the selected rice husk ash uses. The environmental aspect of different rice husk ash uses
were not considered in his study. Moreover, only limited rice husk ash applications were
investigated in his study. Other alternative rice husk ash uses should also be
investigated. While the technical and economic feasibilities of the uses of rice husk ash
(produced from the rice husk based power plants) are significant, it is also important to
consider the environmental impacts associated with the different uses of rice husk ash
produced from the rice husk based power plants.
The main uses of the ash (produced from the rice husk based power plants) along with
the description of how rice husk ash is used within each application are discussed below.
This is based on the findings on the uses of the rice husk ash produced from the rice
husk based power plants from the interviews with rice husk power plant managers, and
on the survey of the uses of rice husk ash produced from the rice husk based power
plants conducted by Asavapisit & Piyaphanuwat (2005).
1) Soil conditioner
The use of rice husk ash as a soil conditioner seems to be the major use of the ash
generated from the power plants using rice husk as a fuel. Especially in the plants using
mixed fuels (rice husk mixed with other biomass fuels), the use of the ash as a soil
conditioner seems to be the only way to deal with the ash, if not dumping or disposing of
the ash in landfill. As discussed in sections 3.2.2 and 3.3.1, one of the beneficial features
of the pure rice husk ash is that it contains high silica which is useful in different
industrial applications. However, it was found that ash generated from the power plants

Chapter 6-Current and Potential Uses of
Rice Husk in the Thai Context
149
using mixed fuels (rice husk mixed with other fuels) are only limited to use as a soil
conditioner, if not dumped or disposed of in landfill. This may be explained by the
quality of the ash generated from burning mixed fuels. As burning mixed fuels provides
the ash with different characteristics from that of the pure rice husk ash; therefore, the
ash of mixed fuels may have more limited uses than the pure rice husk ash.
Songmuang (2000) found that rice husk and rice husk ash can be used as a soil
conditioner together with chemical fertilizer in the rice fields. The suggested application
proportion is using 500 kg of rice husk (or its ash) with 30 kg of chemical fertilizer such
as ammonium phosphate per rai22
. Through experiments conducted over 20 years,
Songmuang (2000) found that using rice husk or its ash can increase rice yields up to 64
percent compared with not using fertilizer. Using rice husk or rice husk ash also helps to
improve the physical properties of the soil. In addition, silica contained in rice husk and
its ash can help to strengthen the structure of the rice plant cells (Songmuang 2000).
2) Export
Asavapisit & Piyaphanuwat (2005) mentioned, as did one of the rice husk based power
plants interviewees (Interviewee 1), that some rice husk ash produced from their power
plants is exported to other countries for use as a refractory material in the steel industry
and semi-conductor industry. However, Bronzeoak Ltd. for Department of Trade and
Industry (2003) contended that the rice husk ash silica required for the use as a
refractory material is the crystalline form of rice husk ash silica, which is proven to be
carcinogenic. Therefore, demand for rice husk ash in these industries is unlikely to be
increased in the future.
Although the export of the ash, for use in steel industry and semi-conductor industry,
provides incomes for the power plants, there are some criteria required (such as carbon
content, moisture content and bulk density). Moreover, not all rice husk power plants
22
Rai is the land unit used in Thailand, 1 rai = 1,600 square meters.

Chapter 6-Current and Potential Uses of
Rice Husk in the Thai Context
150
can produce ash with suitable quality for use in the steel industry, because there are a
variety of biomass burning technologies used in the plants and different technologies
produce husk ash with different characteristics (Thepnoo 2006). Also, it is necessary to
control consistency of the rice husk ash quality to meet all ash market criteria while
operating a power plant (if the ash is to be exported). Thepnoo (2006) found that only
one rice husk power plant (from three plants selected to be investigated) can produce ash
with all properties meeting the criteria for exporting rice husk ash for use as a refractory
material.
3) Brick production
Asavapisit & Piyaphanuwat (2005) reported that one rice husk based power plant (which
uses rice husk as the sole fuel in the process) sold the ash to clay brick producers for use
within their production process. Rice husk ash is used to substitute for clay in the
production process of the clay brick. The optimum substitution rate of rice husk (for
clay) used within the clay brick production is three percent by weight (Chatveera 2002;
Thepnoo 2006). Using rice husk at this substitution rate can successfully produce the
clay bricks which meet the standard criteria of the Thai Industrial Standard TIS 77-2545
(Building bricks) (Thai Industrial Standards Institute 2002).
4) Light weight concrete block production
In the interviews with rice husk based power plant managers, one (Interviewee 6)
reported that the ash from their plant (using rice husk as the only fuel) was occasionally
sent to lightweight concrete block plants. However, he commented that the ash was not
used widely in the concrete block production. Most of the ash in this plant was given to
villagers for free to use as a soil conditioner.
As discussed in section 3.3.1, rice husk ash can be used as a substitute for Portland
cement in concrete production. Kanarkard & Pensuwan (2002) claimed that rice husk
ash can substitute up to 40 percent by weight of cement to successfully produce blocks

Chapter 6-Current and Potential Uses of
Rice Husk in the Thai Context
151
that meet the standard criteria of the Thai Industrial Standard TIS 58-2533 (hollow non
load bearing concrete masonry units) (Thai Industrial Standards Institute 1990).
5) Landfill and Dumping
Landfill is the most common way of disposing of rice husk ash produced from the power
plants if they can not sell the ash or use it in other ways. In addition, it was also reported,
by Asavapisit & Piyaphanuwat (2005) and Thepnoo (2006), that some amount of the
rice husk ash is dumped. However, both landfill and dumping seem to be unsustainable
practices for disposing of rice husk ash. Thepnoo (2006) contended that many of the rice
husk power plants dispose of the rice husk ash as landfill and that this is not sustainable,
as in the near future these power plants will have a problem managing the land for the
landfill of rice husk ash. Moreover, he maintained that disposing of the ash in landfill
can cause pollutions to air and water. Furthermore, dumping of the ash (where there is
little care given to its disposal) clearly causes local pollution as the ash is not disposed of
properly. The ash is dumped in open areas and so its dust could easily drift by wind to
local household areas. This may also cause human health problems and may lead to the
conflict between the power plants and the local community.
f) Benefits of using rice husk in the electricity industry
The rationale behind the Thai government’s promotion of using rice husk to generate
electricity, is that rice husk is an indigenous fuel resource. Therefore, using rice husk to
generate electricity can help the country to reduce the import of fossil fuels. Moreover,
the CO2 from burning rice husk is thought to be reabsorbed in the growing phase of rice
(IPCC 2006). Thus, using rice husk to generate electricity would help to reduce the
greenhouse gases produced from the energy sector (discussed in details in section 3.5).
The Thai government not only promotes the use of rice husk as an energy source in
electricity production; it also promotes other local renewable energy sources for use as
fuels in electricity generation. However, compared with other biomass sources, rice husk

Chapter 6-Current and Potential Uses of
Rice Husk in the Thai Context
152
seems to be preferred for its low moisture content and higher energy content, as one rice
husk power plant manager commented:
“Compared with rice husk, wood wastes are cheaper. However,
rice husk has higher heating value…so, if we shift to wood wastes,
we would need more amount of the fuel. In addition, when it rains,
the wood would well absorb the moisture. Not like the husk, it
doesn’t take long to dry.” Montree (cited in Editors of Engineering
Today (2006)).
Rice husk seems to be preferred over other agricultural waste such as wood when
considering the fuel acquisition process. One power plant manager using husk as one
fuel in their power plant commented that the process of buying and selling rice husk is
easier than buying and selling timber:
“In legal terms, it is easier for the villagers to sell their rice husk to
us. The rice mill owners can just transport the husk to sell to our
power plant directly. Unlike selling woods, they need to get
authorized paper work to prove where the woods come from to
make sure that the woods are not from the reserved forestry areas.”
(Interviewee 5).
The use of rice husk to generate electricity can help farmers (if they own the rice milling
machines) and rice mill owners to earn incomes from selling rice husk to the power
plants. Moreover, it can benefit other involved local sectors:
“The rice mill owners benefit directly from earning income by
selling the husk to us…as more rice husk power plants established,
the husk will be used more and more and so this will stimulate the
employment in other involved sector such as the transportation
service.” (Interviewee 7).

Chapter 6-Current and Potential Uses of
Rice Husk in the Thai Context
153
g) Barriers to using rice husk in the electricity industry
As discussed above, the main problem of using rice husk power plants is the
management of the ash generated in the process. In spite of the many potential uses of
rice husk ash (as discussed in section 3.3.1), many rice husk power plants in Thailand
still disposed of the ash in landfill (some ash is dumped). In addition, it was also
reported by Asavapisit & Piyaphanuwat (2005) and Thepnoo (2006), that rice husk has
been used in some applications, for instance as a soil conditioner, in clay brick
production and light weight concrete block production, and export to other countries for
use as a refractory material. Thepnoo (2006) analysed the technical and financial
feasibilities of some selected rice husk ash applications. However, the literature about
the environmental impacts associated with the different current uses of the rice husk ash
(generated from the rice husk power plants) has not been found. Thus, it is important to
take into account the different disposal options of the rice husk ash (produced from the
rice husk power plants) when assessing the environmental impacts of using rice husk in
the electricity production.
Like other rice husk users, rice husk power plants face a problem because of the high
prices of rice husk. In fact, all of the rice husk power plant managers interviewed stated
that they encountered this problem. For example, one stated:
“Many rice husk power plants established within the nearby areas.
Moreover, there is a demand of rice husk in other local industries
such as the brick production and the poultry farms. The high
demand of rice husk in these areas has let the prices of rice husk
increased very high.” (Interviewee 6).
One of the other barriers of using rice husk in power plants is that rice husk is a seasonal
biomass resource; it only comes in the rice harvesting seasons.

Chapter 6-Current and Potential Uses of
Rice Husk in the Thai Context
154
“In our area, rice is harvested only once a year…when the rice is
harvested, there will be a massive amount of rice husk available for
just one or two months so we have to buy a very large amount of
rice husk to store for use in our power plant for the rest of the year.
This causes us a problem in managing the storage space. In
addition, there are high costs incurred.” (Interviewee 6).
6.4.3 Cement industry
a) Background
There is not much information about using rice husk as a substitute fuel in the Thai
cement industry available. For example, the Thailand Environment Institute (TEI)
(2004b) has reported the use of rice husk as a substitute fuel in the Thai cement
manufacture, but did not detail how rice husk is used within the process. Thus, the
information regarding how rice husk is used within the cement production process
described in this section is based on the interview with cement industry personnel. The
results of personal communication with cement industry personnel (Interviewee 3)
suggest that rice husk has been used as a substitute fuel in the Thai cement industry
since 2004. It is used to substitute for coal in clinker burning (in the specific site based
on the interviews with Interviewee 3). The substitution rate of the rice husk used (in this
specific site) ranged from 5 to 20 percent by weight, depending on the availability of
rice husk at the time.
b) Production process
The process of cement production consists of five main steps: mining; grinding and
mixing of raw materials; clinker burning; cement grinding; and bagging and
transporting. These are described below (Thailand Environment Institute (TEI) 2004b):

Chapter 6-Current and Potential Uses of
Rice Husk in the Thai Context
155
1) Mining
Limestone and shale are mined from a quarry. The process starts with drilling a rock,
which is blasted into smaller sizes. The small sized rocks are then transported to a
crushing mill by a rear dump truck. The mined limestone and shale are crushed until
they have a size of about 25 mm and are then mixed by a proportion of 3:1 to be used as
a main raw material in the next process.
2) Raw materials grinding and mixing
The chemical compositions of all raw materials are then pre-analysed. The chemical
compositions of all raw materials are required in the calculation of the proportion of raw
materials used in the process each time. The mixing process begins with the main raw
material produced by the previous process (the mix of limestone and shale) being
blended with iron ore and sand by the proportion calculated. All raw materials are fed
into a grinding mill. The mill has hot gas generated for two functions, the first is to
evaporate water contained in the raw materials and the second is to help remove the fine
powder (that is ground to the desired particle size) out from the mill. The remaining
powder is blended with the new feed stock and then ground until it reaches the fineness
required. All the fine power obtained from this process is stored in silos in preparation
for the next process.
3) Clinker burning
The fine powder is then burnt in a cement kiln, an inclined rotary furnace with inside
temperature of about 1,400 – 1,500 °C. The ground mixed raw materials are tumbled
within the kiln. At the temperature of approximately 1,450 °C, a chemical reaction
occurs, transforming the raw materials into the clinker. Thereafter, the clinker product is
cooled down from a temperature of 1,000 °C to 100 °C in the clinker cooler before being
sent to storage silos.

Chapter 6-Current and Potential Uses of
Rice Husk in the Thai Context
156
Normally, fuels used in the kiln are coal, coke, lignite, fuel oil and natural gas.
Alternative fuels such as used oil, waste tires, waste wood and rice husk are also used to
replace fossil fuels. In an interview, a cement industry representative, disclosed that up
to 20 percent of rice husk can be used as a fuel to substitute for coal in the cement kiln.
The substitution rate of rice husk used in the cement kiln can range from 5 to 20 percent
depending on the site location. This is because the availability of rice husk differs across
the country.
“The substitution rate of rice husk used in the cement kiln is ranged
from 5 to 20 percent depending on where the site is. We used to use
up to 20 percent of rice husk in this plant. However, for other
plants, rice husk is not much available. For example, one of our
plants located in the south now uses 5 percent of rice husk as there
is not much husk available in those areas.” (Interviewee 3).
4) Cement grinding
The clinker product from the storage silos is blended with gypsum. The clinker is then
sent to a cement mill to be ground. The ground cement contains about 4-5 percent of
gypsum by weight. The cement product obtained from the mill is sent to the separator to
separate the fine cement (with a size of about 200 mesh (sieve size of 0.075 mm)). This
fine cement is transported to cement silos. The cement rejected by the separator is sent
back to the mill to be re-crushed until it reaches a particle size required.
5) Bagging and transporting
Portland cement is kept in moisture controlled cement silos before being distributed to
customers. There are two types of cement packing; bulk cement and bag cement. The
bulk cement is directly loaded on trucks, cars or trains; and the bag cement is pre-packed
in a 50 kg-bag before being loaded on trucks or trains and then sent to customers. For

Chapter 6-Current and Potential Uses of
Rice Husk in the Thai Context
157
export to other countries, cement is sold in a clinker form. The customers will grind and
mix Portland cement themselves to suit their own construction purposes.
c) Energy and resources consumption
As part of the development of the Thai National Life Cycle Inventory (LCI) Database
project (more details discussed in section 4.7), the Thailand Environment Institute (TEI)
(2004b) completed a study on the LCI for the Thai cement product. The production data
were collected from two selected cement plants in Thailand over two years (2001-2003).
The energy and resources consumption data of Thai cement production are included in
the LCI data and can be found in the report of the TEI (2004b). The LCI data of the
cement product are shown in Table 6.6. These data will be used in the LCA study of this
research (see section 7.3.1) to analyse the environmental impacts caused by using rice
husk in cement manufacture. However, it is important to note that this LCI data set does
not include the use of rice husk as a substitute fuel within the process. And that all of the
LCI data presented in Table 6.6 are subject to all the assumptions made in the TEI
report (2004b) only. Therefore, there is a need to adjust some values in the LCI data set
(from this report) to which are influenced by using rice husk to substitute for coal in the
cement production process (these will be dealt with in section 7.3).
Water consumption is excluded from the LCI data set shown in Table 6.6. Although
water is consumed in the mining unit (to help to reduce particulates emitted from the
mine) and cooling water unit, water consumption is not identified in this LCI data set.
This is based on an assumption that water used for dust control in the mine will be
evaporated back to the atmosphere and that the cooling water used can potentially be
recycled to use again in the process. The water released from the cooling system is sent
to sit in the pond (built within the site) to cool down before being pumped back to be
used in the cooling system again. Therefore, only data about the electricity consumption
and the chemicals employed in the cooling water unit are included (Thailand
Environment Institute (TEI) 2004b).

Chapter 6-Current and Potential Uses of
Rice Husk in the Thai Context
158
Table 6.6 Inventory data of cement production
Product Amount Unit
Portland cement type I 1 tonne
Inputs Amount Unit
Raw material
limestone 1.19E+03 kg
shale 2.00E+02 kg
lignite 1.62E+02 kg
hi alumina clay 5.04E+01 kg
petroleum coke 4.08E+01 kg
laterite 2.96E+01 kg
anthracite 3.89E+00 kg
iron powder 3.24E+00 kg
aqueous waste 2.32E+00 kg
ammonium nitrate 1.94E-01 kg
sand 2.23E-02 kg
lubricating oil 1.79E-02 kg
dynamite 1.22E-02 kg
clay 1.99E-03 kg
Energy consumption
coal 6.91E+00 kg
lignite ETH 2.88E-01 kg
natural gas 2.27E+01 m3
petroleum gas 5.83E-02 m3
crude oil 1.62E+00 kg
high speed diesel 2.47E-05 m3
low speed diesel 6.00E-01 kg
heavy fuel oil 8.14E-01 kg
waste oil 1.17E+00 kg
reject tyre 7.17E-01 kg
Note: Table 6.6 is continued on the next page.

Chapter 6-Current and Potential Uses of
Rice Husk in the Thai Context
159
Table 6.6 Inventory data of cement production (continued)
Outputs Amount Unit
Air pollution
CO2 9.73E+02 kg
CO 3.92E-02 kg
SO2 1.01E-01 kg
NOx 1.15E+00 kg
N2O 2.46E-03 kg
methane 2.60E-01 kg
CxHy 5.28E-03 kg
non methane VOC 2.04E-02 kg
dust (from cement mill process) 2.33E+00 kg
dust (SPM) (from gypsum process) 1.15E-03 kg
dust (PM10) stationary (from gypsum process) 7.47E-04 kg
dust (PM10) mobile (from gypsum process) 5.37E-05 kg
H2S 1.38E-05 kg
Pb 4.14E-06 kg
Cd 6.53E-07 kg
Cu 4.92E-07 kg
Cr 4.31E-07 kg
Hg 1.21E-07 kg
Water pollution
Cl 2.68E-02 kg
Na 1.50E-02 kg
COD 1.10E-04 kg
sulphate 4.82E-03 kg
BOD 1.09E-05 kg
TOC 1.02E-03 kg
fats/oils 8.05E-04 kg
Fe 6.05E-04 kg
suspended substances 4.62E-06 kg
nitrite 7.72E-07 kg
nitrate 4.99E-05 kg
NH3 (as N) 4.95E-05 kg
Phosphate 2.51E-05 kg
VOC (as C) 1.50E-05 kg
Cr (III) 4.42E-06 kg
Cr (VI) 7.51E-10 kg
Pb 2.70E-06 kg
Cu 2.07E-06 kg
SO3 5.12E-07 kg
Cd 1.33E-07 kg
Hg 4.50E-09 kg
Source: Thailand Environment Institute (TEI) (2004b)
Note: All data shown in the table are based on all assumptions made by TEI (more detail
can be found in the report (Thailand Environment Institute (TEI) 2004b).

Chapter 6-Current and Potential Uses of
Rice Husk in the Thai Context
160
d) Emissions released
The emissions released from the Thai Portland cement production can be obtained from
the LCI data set reported in TEI (2004b). The LCI data of the Thai cement production
are shown in Table 6.6. These data will be used in the LCA study in the next chapter
(see section 7.3.1). However, as discussed earlier, this LCI data set does not include the
use of rice husk (as a substitute fuel) within the cement production process and this LCI
data are subject to the assumptions made by the TEI (2004b) only. Therefore, there is a
need to adjust some values in this LCI data set when using rice husk within the cement
production process (these will be dealt with in section 7.3.1).
The TEI (2004b) also compared the emissions produced by conventional cement
production (which uses 100 percent of fossil fuels), with that of the cement production
that uses industrial waste (such as used lubricant oil and used tyres) to substitute for fuel
oil by 3.4 percent of total fossil fuels used in the process (considering the heating values
of the wastes used). The results showed that the cement production using wastes as
substitute fuels causes lower CO2 emissions than conventional cement production, while
the volume of other emissions were the same for both scenarios. CO2 produced by
conventional cement production was 981 kg per tonne of cement, whereas the cement
production that used wastes as substitute fuels produced 973.98 kg per tonne of cement
(Thailand Environment Institute (TEI) 2004b).
e) Waste management
The use of rice husk as a substitute fuel in the cement kilns does not cause a problem to
the cement industry in terms of waste management. Rather, the incineration of the
wastes in the cement kilns is seen as one effective way of disposing of these wastes
(Lemarchand 2000; Mokrzycki & Uliasz- Bochenczyk 2003). Mokrzycki & Uliasz-
Bochenczyk (2003) pointed out that one of the advantages of disposing of the wastes in
the cement kilns is that there is no increase in discharges to the environment. Moreover,

Chapter 6-Current and Potential Uses of
Rice Husk in the Thai Context
161
Lemarchand (2000) added that there is no solid or liquid residues released from the
cement kilns. The mineral elements of all the raw materials, fuels and wastes used in the
cement process are physically and chemically bound in the clinker product. There are
only the air emissions released from the cement kilns. However, Lemarchand (2000)
reported that the use of waste-derived fuels in the cement kilns does not affect the
characteristics of the dust released from the cement mills. He maintained that there is no
significant difference between the dust emitted from cement plants using waste-derived
fuels and that from the plants using only fossil fuels.
f) Benefits of using rice husk in the cement industry
The main reason for using rice husk as a substitute fuel in the Thai cement industry, is to
help reduce the production costs and the pollutions caused by, the production process:
“Actually, we don’t specifically use only rice husk it can be any
available local biomass fuels. We want to use any biomass fuels to
help to save the production cost and to reduce the pollutions caused
by the process.” (Interviewee 3).
The silica contained in rice husk ash could also be used in cement and concrete
production (discussed in section 3.3.1). However, it seems that the Thai cement industry
only makes use of the rice husk as a source of energy.
g) Barriers to using rice husk in the cement industry
An increase in rice husk prices is a significant barrier for the Thai cement industry:
“The problem is that there is more demand of rice husk than the
actual supply at the moment...especially there are more and more
rice husk based power plants established recently so this has raised
the demand of rice husk dramatically and the market prices of the
husk have increased a lot. With the high competition, rice husk is

Chapter 6-Current and Potential Uses of
Rice Husk in the Thai Context
162
now costed at around 1,000-1,200 bahts23
/tonne…It’s used to be
about 700 bahts/tonne.” Interviewee 3 (at August 2007).
In addition, the cement industry personnel (Interviewee 3) believed that the
transportation of rice husk to the cement plants is one of the factors influencing the
prices of rice husk.
“Another issue is that, to buy the husk from further sources, we
have to pay more since they have to be transported for long
distances.” Interviewee 3.
As discussed earlier, only the energy contained in rice husk is fully used in the cement
production process. Its ash has not yet been used efficiently. Therefore, the added value
gain from using rice husk within the Thai cement industry is still low.
“At the moment, using rice husk helps to save the production cost
and to reduce pollutions caused from the process. However, we
have not really utilized its ash wisely. So, the added value gain
from using the husk in our production process is still low, just about
100 bahts/tonne of husk used. In the future, we would like to find
the way to gain more value from using rice husk” Interviewee 3.
6.4.4 Cellulosic ethanol industry
a) Background
Large concern for the world’s oil-based fuel supply and also for the greenhouse gases
produced through the burning of fossil fuels, has led to increased and widespread
23
Baht is the currency of Thailand.
From the interviews, it appears that rice husk prices vary across the country.

Chapter 6-Current and Potential Uses of
Rice Husk in the Thai Context
163
interest in finding alternative fuels. Bio-ethanol is one of the alternative fuels currently
used in many countries, including Thailand.
Ethanol can be produced through the fermentation of any material that contains sugar.
The raw materials utilized in ethanol production are classified into 3 major types: sugars,
starches, and cellulosic materials (Lin & Tanaka 2006). Sugars, which can be obtained
from feedstock like sugarcane, sugar beets, molasses, and fruits, are immediately
converted into ethanol via the fermentation processes. Starch-based raw materials such
as corn, cassava, potatoes, and root crops need to be hydrolysed (by enzymes from malt
or moulds) into fermentable sugars prior to fermentation. Cellulosic feedstock such as
wood, agricultural residues, waste sulphite liquor from pulp, and paper mills also need to
be hydrolysed to fermentable sugars (by acids or enzymes) before being fermented by
microorganisms into ethanol (Lin & Tanaka 2006).
Currently, ethanol is produced from sugar and starch-based materials (Hahn-Hägerdal et
al. 2006; Lin & Tanaka 2006; Williams 2005). However, as crude oil prices have risen
continuously, these raw material bases will not be adequate for ethanol production.
Much attention has been paid to ethanol production from cellulosic materials, as these
materials are considered the largest global biomass source. Intensive research into
converting cellulosic biomass into ethanol has been carried out and much effort has been
invested in introducing it into large-scale manufacture in other countries, such as USA,
Canada and some European countries. However, cellulosic ethanol commercial-scale
facilities are still pending due to their high production costs. For this reason, much
research has been conducted to improve the economic efficiency/ viability of the
production process (Hahn-Hägerdal et al. 2006; Lin & Tanaka 2006; Williams 2005).
The current main feedstock used in the Thai ethanol production is cane molasses
(Nguyen & Gheewala 2008). At the time of the field data collection in Thailand for this
research (July-September 2007), commercial scale technology of cellulosic ethanol
production had not yet been introduced in Thailand.

Chapter 6-Current and Potential Uses of
Rice Husk in the Thai Context
164
b) Production process
Given these restrictions in data on cellulosic ethanol production in Thailand, the
discussion presented in this section is based on the cellulosic ethanol production from
other countries. It should be noted that rice husk does not yet seem to be utilized as a
feedstock in the cellulosic ethanol production process at commercial scale. Thus, the
information about the production process of the cellulosic ethanol production described
here refers to the production process of the cellulosic ethanol production using general
biomass as a feedstock.
Cellulosic ethanol produced from cellulosic materials (including rice husk) basically
consists of three main stages: pre-treatment, hydrolysis and fermentation. Each stage is
described in more details as below (Graf & Koehler 2000):
1) Pre-treatment
Biomass consists of complex structures of hemicellulose, cellulose, lignin and
extractives. The pre-treatment process separates and solubilises one or more of these
components. In general, pre-treatment starts by reducing the size of feedstock to open it
up for hydrolysis. There are different types of pre-treatment methods (as reviewed in
Graf & Koehler (2000)). Usually, a particular combination of methods is used for each
type of feedstock. This is to optimize the yield of that particular biomass received after
pre-treatment process, and to reduce the degradation of substrate during hydrolysis and
to maximize the sugar yield.
2) Hydrolysis
Hydrolysis is the process of converting cellulose into sugars. The most common
methods employed to do this, are acid hydrolysis (dilute and concentrate acid) and
enzyme hydrolysis. In acid hydrolysis, lime is used in the process to neutralize acids
remaining in hydrolysate before sending the hydrolysate to the fermentation process. For

Chapter 6-Current and Potential Uses of
Rice Husk in the Thai Context
165
enzyme hydrolysis, the enzyme cellulase is used to hydrolyse cellulose contained in
biomass. However, this method does not seem to be very cost effective as the enzyme
cost is considered to be the main cost contributor to the cellulosic ethanol production
costs (Hahn-Hägerdal et al. 2006).
3) Fermentation
In fermentation, sugars obtained from hydrolysis of biomass (glucose, xylose, mannose,
galactose and arabinose) are converted into ethanol. This process requires
microorganisms such as genetically engineered yeast or bacteria to ferment all major
biomass sugars into ethanol. The conventional fermentation process takes several days.
Hence, much research has attempted to improve the efficiency of microorganisms to
provide higher ethanol yield in a shorter time.
The National Renewable Energy Laboratory (USA) has designed a process of producing
ethanol from cellulosic biomass using dilute acid pre-hydrolysis with enzymatic
saccharification and co-fermentation technology. Figure 6.3 shows an overview of the
process for manufacturing ethanol from the cellulosic biomass. This designed process
consists of feedstock handling and storage, pre-treatment and conditioning, hydrolysis
and co-fermentation, product recovery (distillation), wastewater treatment, co-generation
and ethanol storage (more details are documented in Aden et al. (2002)).
Several aspects of the process shown are worthy of discussion. Solid residues are
generated in the distillation unit. These residues are parts of the biomass that could not
be hydrolysed. The residues contain most of the lignin which could not be converted into
fermentable sugars. In the designed process (Aden et al. 2002), these unconverted solids
are used as a fuel to produce energy required the cellulosic ethanol production process.
In addition, methane released from the wastewater unit in the plant is one of the fuel
sources used in the co-generation unit. This co-generation unit produces both steam and
electricity for use within the ethanol plant. The excess electricity is sold to the grid.
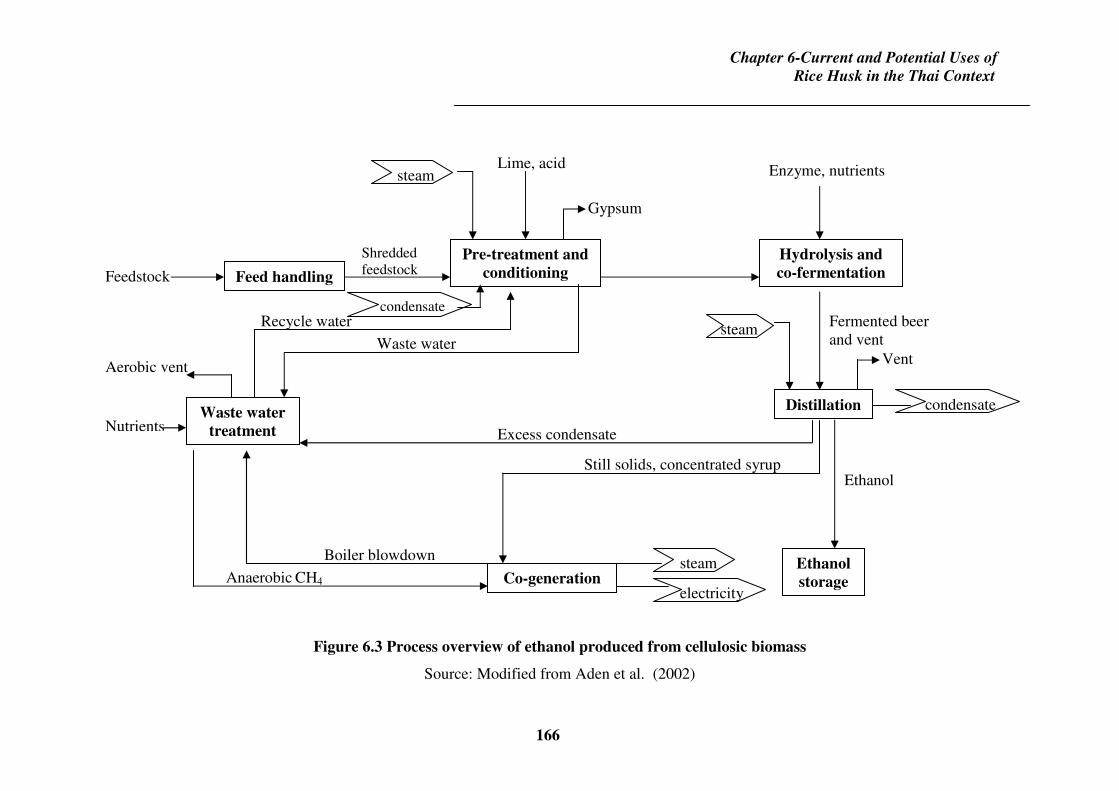
Chapter 6-Current and Potential Uses of
Rice Husk in the Thai Context
166
Figure 6.3 Process overview of ethanol produced from cellulosic biomass
Source: Modified from Aden et al. (2002)
Feed handling
Pre-treatment and
conditioning
Hydrolysis and
co-fermentation
Waste water
treatment
Co-generation
Distillation
Ethanol
storage
steam
Feedstock
Lime, acid
electricity
Shredded feedstock
steam
Gypsum
Enzyme, nutrients
steam Fermented beer and vent
Vent
Nutrients
Aerobic vent
Waste water
Recycle water condensate
condensate
Excess condensate
Boiler blowdown
Anaerobic CH4
Still solids, concentrated syrup Ethanol

Chapter 6-Current and Potential Uses of Rice Husk in the Thai Context
167
c) Energy and resources consumption
A pre-treatment process (see Figure 6.3) is performed in high temperature and high
pressure, consuming intense energy. The distillation process takes place in another unit,
also using a large amount of energy. These two unit processes are supplied with energy
by the co-generation unit, which uses the solid residues (mainly lignin) left from the
distillation unit as an energy source. Therefore, there is no external energy needed in the
co-generation process. All energy consumption required in the ethanol production
process is taken from the co-generation of the solid residues remaining within the plant
itself.
Saha et al. (2005) studied the potential of using rice husk as a feedstock in the cellulosic
ethanol production using a dilute acid pre-treatment technique and enzymatic
saccharification. They assessed the conditions that optimize the ethanol yield and found
that, under optimized conditions, 1 kg of rice husk can yield up to 0.13 kg of ethanol.
However, this experiment was performed at laboratory scale only, which may differ
from commercial scale production. This research reports the production process of the
cellulosic ethanol using rice husk as a feedstock. Therefore, the LCI data of the
cellulosic ethanol production can be adjusted to the rice husk conditions by using the
ethanol yield and some of the inputs obtained from Saha et al. (2005). However, the
amount of energy consumption was not measured in this study. This can be assumed to
be the same as the data of the cellulosic ethanol production using other biomass
feedstock. These will be dealt with in detail, in section 7.3.
d) Emissions released
Direct emissions from cellulosic ethanol production come from the fermentation process
and the co-generation unit (from burning unconverted solids). CO2 is the main emission
from the fermentation process. However, there were no available data on the amount of

Chapter 6-Current and Potential Uses of Rice Husk in the Thai Context
168
CO2 released from the fermentation of the cellulosic ethanol using rice husk as a
feedstock. Therefore, this was assumed to be the same as the amount of CO2 released
from the fermentation of the ethanol produced from other cellulosic biomass. According
to the Ecoinvent report ‘Life Cycle Inventories of Bioenergy Data v2.0 (2007)’, the CO2
emissions from the fermentation process of the ethanol produced from wood is 1.088 kg
per kg of hydrated ethanol or 1.142 kg per kg of anhydrous ethanol.
Similar to the emissions from burning biomass in co-generation, these data can be
obtained from the Ecoinvent report (Jungbluth et al. 2007). However, they need to be
adjusted to the rice husk conditions (see section 7.3.1). In addition, there is wastewater
released from wastewater treatment unit. However, this wastewater is able to be recycled
back into the process, so the ethanol plant does not discharge any wastewater emissions
into the environment.
e) Waste management
Apart from direct emissions described above, there are some other solid wastes within
the plant that need to be disposed of. They are sewage sludge from waste water
treatment, gypsum released from overliming process and the ash of the residues burning
from co-generation unit. According to Jungbluth et al. (2007), these are normally sent to
landfill.
f) Benefits of using rice husk in the cellulosic ethanol production
The use of biofuel such as ethanol can reduce fossil fuel consumption. Ethanol is
blended with petrol to produce E10 (10 percent ethanol blended with 90 percent petrol),
which can be used directly in petrol based vehicle without any engine modification.
Hahn-Hägerdal et al. (2006) stated that biofuel sources are geographically distributed
more evenly than fossil fuel sources. As the biofuel sources are locally available, the use
of biofuels may also help to strengthen the security of energy supply.

Chapter 6-Current and Potential Uses of Rice Husk in the Thai Context
169
Moreover, Farrell (2006) argued that the use of ethanol produced from cellulosic
biomass (including rice husk) can help to considerably reduce the use of ethanol from
other materials (starch and sugar). The current main feedstock used in Thai ethanol
production is from sugar-based material such as cane molasses. Thus, the use of rice
husk as a feedstock to produce ethanol may potentially help to reduce a greater amount
of greenhouse gases than conventional ethanol production (cane molasses based
ethanol).
The conventional feedstock used in Thai ethanol production, such as cane molasses, can
be used to feed animals (Hahn-Hägerdal et al. 2006). If this demand is increased in the
future, the use of rice husk (as a feedstock in the cellulosic ethanol production), which
has low nutritional value for animals (discussed in section 3.2.1), may help to reduce the
conflict between the livestock industry and the ethanol industry in the future.
g) Barriers to using rice husk in the cellulosic ethanol production
As discussed earlier, cellulosic ethanol production has high production costs. These are
mainly from the costs of the pre-treatment process which requires intense energy and
enzyme production (Emsley 2007; Hahn-Hägerdal et al. 2006). Cellulosic ethanol
production technology is still being developed to improve the economic efficiency of the
process (Hahn-Hägerdal et al. 2006). Therefore, compared with conventional ethanol
production for which has infrastructure already exists, cellulosic ethanol production will
not be competitive unless the production costs are reduced. Thus, in the mean time, the
ethanol cellulosic production is only seen to supplement conventional ethanol
production and not to compete with it.

Chapter 6-Current and Potential Uses of Rice Husk in the Thai Context
170
6.5 Overview and Direction for the Next Chapter
The current main uses of rice husk in Thailand (at the time of the field data collection in
July-August 2007) are as a fuel in the rice mill, electricity, cement and agricultural
industries. In addition, there are some minor uses of rice husk in rural areas, including as
a fuel in clay brick and charcoal production.
Conventionally, rice husk has been used as an energy source within the rice mills
themselves. The results of the rice mill survey conducted in July 2007, indicate that the
use of the husk as a fuel within the rice mills (for paddy drying) has been given priority
over selling the husk to the outside users, such as the electricity industry, the cement
industry and others. This implies that rice husk is required for use as a fuel for paddy
drying as part of the rice production. However, there is still surplus rice husk remaining
unused within the rice mills. This excess rice husk has been sold to the different outside
users.
The external (outside rice mills) rice husk user industries that consume the greatest
amount of rice husk are the electricity and cement industries. With the support from the
Thai government, a large number of rice husk based power plants have been established
and commenced operation. Many of the rice husk based power plants are co-operated
with large rice mils, as the left over rice husk from the mills can be used directly in the
power plants and therefore does not have to be transported to other locations. However,
there are also some rice husk based power plants that are not co-operated with the rice
mills; these have to buy rice husk from rice mills.
In all of the industries mentioned, rice husk is used in the form of a solid fuel, as an
energy source in production, through a combustion process. However, rice husk has not
been found to be used in other form of energy within the Thai context. Rice husk can
potentially be used as a feedstock to produce cellulosic ethanol. Ethanol is blended with
petrol to produce E10 (10 percent ethanol blended with 90 percent petrol) for use in

Chapter 6-Current and Potential Uses of Rice Husk in the Thai Context
171
petrol-based vehicles without any engine modification. With expected oil shortages, the
option of using rice husk as a feedstock in the cellulosic ethanol production is likely to
be considered.
The high demand of rice husk by various husk users, especially the large scale user
industries such as the electricity industry and the cement industry, has led to high
increases in the market price for rice husk. This is seen as one of the main obstacles to
using rice husk within all rice husk user industries. Moreover, this may lead to conflicts
among the different rice husk users.
It is evident that rice husk has been used in different ways in Thailand. Moreover, there
have been high demands for rice husk in different industries. This suggests that rice husk
has been utilized in various manners in the different production processes. However, the
environmental impacts associated with these different uses of rice husk have not yet
been investigated. While it is important to consider the technical and economic
feasibility of rice husk uses, it is also important to take into consideration the
environmental impacts caused by these different rice husk uses.
The next chapter (Chapter 7) will assess the environmental impacts of the current major
and potential rice husk uses in Thailand by using Life Cycle Assessment (LCA). Based
on the findings presented in this chapter, the uses of rice husk in electricity production,
cement manufacture and cellulosic ethanol production will be examined, as these are
seen to be the main and potential uses of rice husk. The use of rice husk in the rice mill
industry is excluded from the LCA study (see Chapter 7) as it is considered as part of
rice production. Importantly, the use of rice husk in this manner (use as a fuel in rice
mills) is assumed to be stable so that the use of rice husk as a fuel in rice mills does not
affect how rice husk is used in other applications (outside rice mills).
The main problem for rice husk based power plants is the management of the rice husk
ash produced within the process. The main uses of the ash (produced from the rice husk

Chapter 6-Current and Potential Uses of Rice Husk in the Thai Context
172
based power plants) are as soil conditioner (in rice fields), in lightweight concrete block
and clay brick production, and for export to other countries to be used as a refractory
material. In addition, it was reported that some rice husk, which could not be sold to
other ash users or could not be dealt with by other ways, is dumped, or disposed of in
landfill. As ash management is one of the main problems of rice husk power plants,
different options for the disposal of rice husk ash (produced from the power plants) will
be included in the LCA study. The option of exporting the rice husk ash for use in other
countries is excluded from the LCA study as it is not within the scope chosen of this
study, which is limited to rice husk use within Thailand. As stated in the research aim (in
Chapter 1), this study aims to find out the most environmentally friendly use of rice husk
(and its co-products such as rice husk ash) within Thailand. Thus, the rice husk ash
disposal options (in electricity production) chosen to be examined in the LCA study are
in landfill, as a soil conditioner, and in lightweight concrete block and clay brick
production. Chapter 7 discusses these in further detail.

Chapter 7-Life Cycle Assessment of Rice Husk Utilization
173
7 LIFE CYCLE ASSESSMENT OF RICE HUSK
UTILIZATION
7.1 Introduction
The previous chapter (Chapter 6) defined the current and potential uses for rice husk in
Thailand and described how rice husk has been used in different industries. The
information from Chapter 6 help to determine the major current and potential rice husk
uses to be examined in the LCA study. This chapter describes how the environmental
life cycle assessment (LCA) of the utilization of rice husk has been conducted. This
LCA study has been performed according to the international standard ISO 14040
(Environmental management − life cycle assessment − principles and framework) and
ISO 14044 (Environmental management − life cycle assessment − requirements and
guidelines). The main sections in this chapter are constructed based on the guidelines in
these standards. To begin, the goal and scope of this study are defined. This is followed
by a discussion on how the life cycle inventory data were collected and analysed. Then,
the stage of environmental impacts assessment is described and the LCA results are
presented. The final section presents an interpretation of these results. The LCA results
presented in this chapter will be reviewed in the context of related important issues, in
Chapter 8 (section 8.2). The conclusions of the research are presented in the same
chapter (section 8.3).

Chapter 7-Life Cycle Assessment of Rice Husk Utilization
174
7.2 Goal and Scope of the LCA Study
7.2.1 Goal of the study
The goal of this research is to investigate the most environmentally friendly use of rice
husk. To achieve this goal, life cycle assessment (LCA) was used to assess the
environmental impacts associated with the selected rice husk use pathways to be
investigated. To define the most environmentally friendly use of rice husk, which is the
rice husk use option that shows the reduction of environmental impacts to the largest
extent, the environmental impacts of the selected rice husk use pathways are compared
with that of the conventional production systems (the production processes of the
products that the use of rice husk is to replace). In other words, how the uses of rice husk
can help to reduce environmental impacts (in the case that they can) can be seen as how
much they can save the consumption of the conventional products. Hence, it is important
to define the products that rice husk is used as a substitute for and assess the
environmental impacts associated with these production processes. It is necessary to
know the scale of these impacts in order to calculate the relative benefits of their
substitution with rice husk. The detailed calculation is discussed in section 7.2.2.
Table 7.1 details the rice husk use pathways chosen to be investigated and their
conventional uses. Discussion about the choices of rice husk uses to examine in the LCA
study was presented in the previous chapter (section 6.5). The choices of conventional
products to be investigated are based on the view that the use of rice husk can help to
reduce emissions caused by the consumption of fossil fuels (to conform to the Thai
government policies discussed in section 3.5) but not to displace any other existing
biomass uses (that already assist to reduce the consumption of fossil fuels). Therefore,
the conventional systems selected for analysis are fossil fuels and not those that use
existing biomass products, which already contribute to the reduction of fossil fuels.

Chapter 7-Life Cycle Assessment of Rice Husk Utilization
175
Table 7.1 Selected rice husk use pathways and the conventional systems
Rice husk use system used in this
research
Conventional system
Rice husk fuel based electricity
production
Grid mix production
Cement manufacture using rice husk as a
fuel to substitute coal
Conventional cement production without
using rice husk
Cellulosic ethanol production Petrol production
The conventional product chosen for the cellulosic ethanol option was a petrol product.
However, cane molasses is the main feedstock currently used to make ethanol in
Thailand (Nguyen & Gheewala 2008). Nevertheless, in this study, the use of rice husk as
a feedstock to generate cellulosic ethanol is seen to complement existing ethanol
production in Thailand at times of high oil prices (e.g. 2008 and 2009) and ethanol
production is in high demand. Therefore, the conventional product chosen for cellulosic
ethanol system was petrol product (rather than cane molasses based ethanol).
This also applies to the cement production system. Although other biomass can be used
to replace fossil fuels in cement kilns, the conventional system here refers to the actual
production process of cement (which may already contain other wastes as substitute
fuels or materials in the process). Again, this is based on the discussion above, that rice
husk is seen to be complementing other biomass fuels used in the cement production
process, and is not seen to be competing with other exsiting biomass fuels used to
substitute for fossil fuels in cement kilns. Thus, the chosen conventional product for
cement system is the Portland cement product which contains other biomass fuels except
rice husk.
For the electricity option, it may be useful to compare the LCA results of the rice husk
based electricity generation with that of the each fossil fuel base electricity generation.
This may lead to the useful decision on what type of fossil fuel should be reduced when

Chapter 7-Life Cycle Assessment of Rice Husk Utilization
176
some amount of the Thai grid production is substituted by the electricity produced by
rice husk based power producers. However, this is not the aim of this research. Rather,
this LCA study was conducted to provide a comparison across three rice husk use
systems. Therefore, the Thai grid production was chosen as the conventional system for
the electricity option (rather than each fossil fuel based electricity production).
Nonetheless, the share amount of different fossil fuels used in the Thai grid mix
production will be considered in the interpretation of the LCA results.
The overall aim of this research is to identify the most environmentally friendly use of
rice husk (stated in section 1.2). To achieve this aim, LCA was chosen to be used as a
tool to assess the environmental impacts associated with the selected rice husk use
options. There are specific goals of the LCA section of the research:
- To assess the environmental impacts of selected rice husk use pathways.
- To determine whether the use of rice husk in different production systems will
reduce the environmental impacts of the conventional systems.
To perform an LCA, the functional unit of the system under study needs to be set. The
following section defines the functional units used in this study.
7.2.2 Functional unit of the study
As this LCA study was conducted to help in making a decision among different rice
husk use options, the functional unit for each system was defined based on disposing of
1,000 tonnes of rice husk in each rice husk use system, taking into account the use phase
of the products to find out whether there are any differences between the use of the
products generated from rice husk use systems and the conventional products. In the
cases of electricity system and cement production systems, there is no difference in how
their final products are used as compared to the conventional products (electricity from
the Thai grid and ordinary Portland cement). Hence, the functional units for these two

Chapter 7-Life Cycle Assessment of Rice Husk Utilization
177
systems were defined as the amount of the products generated by processing 1,000
tonnes of rice husk in the production processes.
Nonetheless, there is a distinction between the use of ethanol and use of petrol. Ethanol
is used to blend with gasoline to produce gasohol which can be used in existing
gasoline-powered engines while petrol can be used directly in the engines. The
percentage of ethanol in gasohol can be varied, however, the E10 (mix of 10 percent
ethanol and 90 percent of petrol) was used in this study as it can be used in existing
vehicles without any engine modification (Goettemoeller & Goettemoeller 2007).
Therefore, the functional unit of the cellulosic ethanol system was defined as the amount
of ethanol produced from 1,000 tonnes of rice husk (as a feedstock in the ethanol
process) in vehicle operation, or how far a vehicle could travel using this amount of fuel.
This study then compares vehicle operation using E10 and using petrol based on the
travel distance just described. This transportation distance is chosen to be a functional
unit for the cellulosic ethanol system because it was derived based on the same amount
of rice husk used (1,000 tonnes) in the other rice husk use systems (cement system and
electricity system).
The definitive functional units of all rice husk use systems and for their conventional
systems are shown in Figure 7.1. These definitive functional units were derived from the
information about how rice husk has been used within the different rice husk use
systems examined discussed in the previous chapter (see section 6.4.2 for electricity
production, section 6.4.3 for cement production and section 6.4.4 for cellulosic ethanol
production).
The functional units defined in Figure 7.1 were used to calculate the environmental
impacts that were reduced by using rice husk in different systems (reported in section
7.4). This was done by analysing the environmental impacts caused by all rice husk use
systems (including their conventional systems) based on the functional units defined in
Figure 7.1. From this, to obtain the reduced environment impact of using 1,000 tonnes of
rice husk in each system, the environmental impacts of the conventional system were

Chapter 7-Life Cycle Assessment of Rice Husk Utilization
178
simply subtracted from that of the rice husk use system (based on the same functional
unit). The results from this calculation indicate whether using rice husk in all systems
analysed would result in the reduction of the environmental impacts (and quantify how
much impacts in which the uses of rice husk can help to reduce). Negative results would
indicate that the use of rice husk has an effect on the reduction of the environmental
impacts.
Figure 7.1 Functional units for different rice husk use systems and the conventional
systems
7.2.3 System boundaries
A consequential LCI modelling approach was taken in this study. As the aim of this
study is to indicate the environmentally favourable use of rice husk, a consequential
modelling is considered appropriate for the study. There are options for the proper LCI
modelling to perform; whether it should be attributional or consequential modelling,
though sometimes different terms like retrospective and prospective LCI modelling had
been used instead. It was suggested that if the reason for conducting an LCA is decision
making support, then a consequential modelling is more appropriate (Ekvall et al. 2005;
1,000 tonnes rice husk
919 MWh
Electricity production
351,617 tonnes
Cement production
10,548,523 km
Vehicle operation
(using 164,245 L of
ethanol in 1,484,266
L of petrol)
919 MWh
Thai grid production
351,617 tonnes
Cement with out rice
husk production
10,548,523 km
Vehicle operation
(using 1,592,827 L
of petrol)
Substitutes for Substitutes for Substitutes for

Chapter 7-Life Cycle Assessment of Rice Husk Utilization
179
Ekvall & Weidema 2004; Tillman 2000). Section 4.3.2 contains detailed discussion on
the attributional and consequential LCI modelling.
A general system boundary of the LCA study is shown in Figure 7.2. In this system
boundary, rice production (including rice milling process) is excluded from the study.
Therefore, the use of rice husk as a fuel in the mill is also excluded from the boundary as
it is considered as part of rice production. Although the environmental impacts caused
by the rice production are considered significant, they do not influence how rice husk are
utilized. Hence, the boundary of this research covers only the transportation of rice husk
from rice mill to the rice husk use system plants and the rice husk utilizing processes. In
addition, the boundary avoids the production processes of the competing inputs that refer
to the products that rice husk (and the co-products generated from utilizing rice husk)
are used to replace in other applications.

Chapter 7-Life Cycle Assessment of Rice Husk Utilization
180
Figure 7.2 General system boundary of the study
As a consequential LCI modelling, the systems investigated only include processes that
are affected by changes in the systems analysed. For example, some rice husk use
systems provide a co-product (this is sometimes called multifunctional process) which is
used in other application systems where their conventional systems do not generate co-
products. Therefore, the uses of these co-products will affect the LCA results when
compared with the environmental impacts of the conventional processes. To deal with
this co-product allocation problem, it is suggested that the co-product allocation is
avoided by system expansion (Ekvall & Weidema 2004; Weidema 2001). The models
describing system expansion for each option are shown in Figure 7.3, 7.4 and 7.5
(electricity, cellulosic ethanol, and cement respectively). In these, it is assumed that co-
Rice
products
Rice growing Rice husk Rice husk use within rice mills
Beneficial use:
Boiler fuel, cement
feedstock, ethanol
feedstock Utilizing process:
Electricity
production, cement
manufacture, ethanol
production Marginal supply of
competing inputs
Transportation
of rice husk to
the users

Chapter 7-Life Cycle Assessment of Rice Husk Utilization
181
products are fully utilized in those co-product applications included in the system
expansion models described here.
It is conceivable that the changes in the amount of rice husk used in one system may
affect another system, and consequently affect the environmental profiles of other
systems examined; however, this is not the aim of the study. This study aims to find out
the rice husk use option, in which the substitution of fossil fuels by rice husk would
produce the greatest environmental benefit, across different options examined. Hence,
simplified consequential LCI modelling is used to assess the environmental impacts of
different rice husk use systems based on processing the same amount of rice husk (1,000
tonnes) in all production systems investigated. This also applies to the co-products by
assuming that the same amount of co-products produced is used in different co-products
use applications. These assumptions were made for a comparison purpose as all options
should be judged based on the same basis. Therefore, the most favourable rice husk use
is identified based on the same amount of rice husk consumed (1,000 tonnes).

Chapter 7-Life Cycle Assessment of Rice Husk Utilization
182
Figure 7.3 LCI Model describing system expansion for electricity generation option
In the electricity generation process, rice husk ash is produced from the rice husk
combustion process (detailed production process of rice husk based electricity
generation is discussed in Chapter 6). The products that rice husk ash substitute in
different applications are shown in Table 7.2. Based on the findings discussed in section
6.5, the ash was assumed to be sent to the ash consumers, for use as soil conditioner in
the paddy rice fields, as a substituting material for clay in clay brick production and as
substituting material for cement in lightweight concrete block production. The option of
disposing the ash in landfill was also taken into account. These were taken into account
for the LCI model. However, for the uses of the ash in industrial applications, the model
did not include the whole production processes of these products (soil conditioner, clay
brick and lightweight concrete block). Only the effects of using rice husk ash in these
production processes were taken into account. In other words, how the use of rice husk
ash in different applications may help to reduce their environmental impacts is
Electricity
Power
generation
process
Transportation
of rice husk ash
to the
consumers
Rice husk ash
- Soil conditioner
- Clay brick
- Lightweight
concrete block
Rice husk
transportation
Avoided
products:
Chemical
fertilizer, clay,
Portland cement
Rice husk ash utilizing
processes: Soil
conditioner, clay brick
and lightweight concrete
block production

Chapter 7-Life Cycle Assessment of Rice Husk Utilization
183
influenced by the materials that the rice husk ash substitutes in those applications. This
could imply that the scale of the impacts reduced by using rice husk ash in different
applications is equal to the amount of the environmental impacts caused by processing
the amount of the competing materials (which are replaced by rice husk ash) in different
applications.
The production of rice husk ash was not accounted for in this LCI model as the ash is
considered as a waste from electricity production and the applications of the ash are
considered as waste management. This means that using rice husk ash in the ash
utilizing production processes gives these applications environmental credits. Therefore,
the replaced (by rice husk ash) amount of the competing products such as chemical
fertilizer, clay, and Portland cement were avoided in this model (the substitution rate for
each application was considered and will be discussed in more details in section 7.3).
Table 7.2 Selected rice husk ash applications and the competing products
Rice husk ash use investigated Competing product
Soil conditioner Chemical fertilizer
Clay brick Clay
Lightweight concrete block Portland cement
A co-product is also generated in the cellulosic ethanol processes (see Chapter 6 for a
detailed production process of cellulosic ethanol). There are solid residues remaining
from the ethanol process which consists of mainly lignin composed in rice husk.
According to Jungbluth et al. (2007), these residues are burned in cogeneration plant to
produce both steam and electricity to use in the ethanol plant itself. Moreover, it is
assumed that both heat and electricity produced from the cogeneration plant are
sufficient for internal use and excess electricity is sold to the grid. This is considered an
environmental credit given to the cellulosic ethanol production; therefore, an amount of
electricity sold to the grid was avoided in this model.

Chapter 7-Life Cycle Assessment of Rice Husk Utilization
184
Figure 7.4 LCI Model describing system expansion for cellulosic ethanol option
In the cement production process, rice husk is used as an energy source to substitute for
coal. The husk is burned to produce heat in the clinker burning process (see Chapter 6
for a detailed production process of Portland cement). Its ash is bound with clinker to
produce cement, which means that rice husk ash finally comes out as part of the cement
product. For this reason, the chemicals contained in rice husk ash (mainly SiO2) affect
the cement quality. However, SiO2 is needed in cement product, which is usually
obtained from raw materials such as shale. Therefore, the rice husk ash produced from
burning rice husk (in clinker burning process) is considered as a substitute material for
shale. However, shale is also used to produce other chemicals (apart from SiO2) required
Cellulosic
ethanol
Cellulosic
ethanol
production
process
Burning residues
in co-generation
Solid residues (lignin)
Steam &
Electricity Electricity
to be sold
to the grid
Rice husk
transportation
Avoided product:
Electricity from
the grid
Petrol
production
Gasohol

Chapter 7-Life Cycle Assessment of Rice Husk Utilization
185
in cement product. This means that other chemicals will be lacking by taking some
amount of shale out of the process. Therefore, other minerals are added in to fulfil the
cement quality when substituting rice husk for coal in the cement production process.
However, the amount of coal ash (which is displaced by rice husk ash) was not taken
into account as it is not considered a raw material in the cement process and it is a small
amount. In this model, the quantities of the minerals added in the cement process were
included, and the amounts of coal (replaced by rice husk) and shale (replaced by rice
husk ash) were avoided.
Figure 7.5 LCI Model describing system expansion for cement production option
Production
processes of
bauxite and
iron ore
Portland cement Rice husk
transportation
Cement
production
process
Avoided product:
Coal, shale

Chapter 7-Life Cycle Assessment of Rice Husk Utilization
186
7.3 Life Cycle Inventory Analysis
Inventory data collecting is the most important stage of LCA application because it
affects other remaining stages and the final results of the analysis (Allen & Rosselot
1997). Also, it is argued that this stage is the most difficult process of LCA because of
the difficulties of collecting data. For example, Tibor & Feldman (1996) pointed out that
data collecting is always complicated and sometimes the quality of the data is poor.
Guinee (2002) also argued that a limitation of LCA approach is that data is not always
available. Further, there is no specific methodology used to obtain data, which makes it
very difficult to collect data. Moreover, the LCA method requires a variety of data
resources and this may be problematic as some organizations are not always willing to
provide the necessary data (Allen & Rosselot 1997). The difficulties in collecting LCI
data, as discussed by many authors, would result in complexity and uncertainty in the
data collected, and this would lead to a problem of data accuracy.
The same data collection problems were faced in this research. However, attempts were
made to verify data collated as much as possible. The triangulation technique was used
to help justify data in this research. Bryman (2001a) argued that ‘triangulation’ helps
researchers make their research credible. He defined triangulation as an approach in
which more than one method or source of data is used in social science research.
However, this technique could be used in any other field of research including this
research.
The following section describes how the LCI data used in this study were collected and
how they were analysed before using them in LCA models. It also describes how the
LCA models were constructed.
7.3.1 Data sources and modelling
Foreground data were obtained from several sources such as interviews with industry
personnel, LCA questionnaires, internet, published journal articles and reports. LCA
Chapter 7-Life Cycle Assessment of Rice Husk Utilization
187
questionnaires were distributed in August-September 2007 together with interviews with
different industry personnel involving with using rice husk in their production (described
in section 6.3). Background data were from LCI databases available in LCA software
used in this study (SimaPro version 7.1.6), namely Ecoinvent 2.0 and Australian Life
Cycle Inventory Database, and literature. It is worthy to note that the Thai LCI database
is being developed (Malakul et al. 2005). However, it has not yet been made available to
the public (from personal communication with the organization developing the Thai LCI
database at November 2008). However, LCI data for some production processes are
available from published reports (Lohsomboon & Jirajariyavech 2003; Thailand
Environment Institute (TEI) 2004b). The LCI data collated were inserted in the LCI
models (created in the LCA software) before the calculations of the environmental
impacts of all rice husk use system investigated were undertaken. LCI modelling was
performed in the LCA software SimaPro version 7.1.6. Data sources for each rice husk
use system and how its LCI model was created are described below:
a) Data for electricity generation system
LCI data for the electricity generation option were mainly collected from one specific
rice husk power plant. This specific site was selected because of its state-of-the-art
technology (at the time of analysis). This selection was based on the assumption that in
the future, use of newer technologies will be greater than that of old technologies, which
will affect the environmental impacts of these technologies. Therefore, this study looks
at the most modern technology available for each rice husk use system. It should be
noted that different rice husk electricity generation technologies may result in different
environmental profiles. However, it is not the aim of this study. This study compares the
environmental profiles of the selected rice husk use options. To make all options
comparable, the most advanced technology of all rice husk use systems were chosen.
Some data were taken from other literature sources to close data gaps as not all data
needed could be obtained from this site. Tibor & Feldman (1996) argued that there is
always a chance that not all data required for an LCA study are provided from one
Chapter 7-Life Cycle Assessment of Rice Husk Utilization
188
particular industry; often assumptions need to be made to help assess the environmental
impacts. In this study, as some data taken from other sources did not represent the
specific rice husk power plant technology studied, it was assumed that these data were
the same as the data for the technology chosen to study.
The LCI data for the Thai grid mix were available from a Thailand Environment
Institute (TEI) report (Lohsomboon & Jirajariyavech 2003). However, the scope of this
LCI data set is limited and so there are limitations in its use. For example, it excludes
some processes that were included in the LCI data used in the model of rice husk based
electricity production. This makes the LCI model of the Thai grid mix not comparable
with the rice husk based electricity production. Moreover, the amounts of the electricity
generated from different fuel types used in this report are the data of the year 1999-2001.
Therefore, the latest updated data on electricity generation from different fuel types were
obtained from the energy statistics of the Energy Policy and Planning Office (EPPO)
(2009b). These data include the amounts of electricity generated by the Electricity
Generating Authority of Thailand (EGAT), Independent Power Producers (IPPs) and
Small Power Producers (SPPs/VSPPs). However, it is useful to note that these data do
not take into account the electricity from other sources such as imported electricity and
electricity generated from other fuels (the types of fuels were not reported) due to the
difficulty in finding LCI data for these electricity productions. Nonetheless, the amount
of electricity from these two sources was relative small (together accounting for only 3.4
percent of the total).
The unit process data of electricity production using different fuel types, were taken
from European and Australian databases (available in SimaPro version 7.1.6). A few
available Thai LCI data sets of some products (e.g., Thai grid mix, Portland cement and
steel) were used to adapt the LCI models where possible.
Guinee (2002) also pointed to lack of available data as a limitation of LCA approach.
Even though Life Cycle Inventory databases are developing in several nations, these

Chapter 7-Life Cycle Assessment of Rice Husk Utilization
189
data are always not up-to-date or comparable. Similar to the data used for the electricity
production system, as discussed earlier, the LCI data of the Thai grid mix was available.
However, these were not up-to-date and not comparable with the LCI data of the rice
husk based electricity production examined. Therefore, some background LCI data from
other countries were used instead to make this system comparable with the rice husk use
system. Since this LCA study was conducted for the purpose of comparison across
different options, much attention was paid to making the options investigated
comparable.
The LCI used for rice husk ash disposal depends on the disposal options considered. For
example, when using the ash in light weigh concrete block production, 1 kg of ash is
used to substitute for 1 kg of Portland cement in the concrete block production, so 1 kg
of Portland cement was avoided in the LCI model. For using the ash in clay brick
production, 1 kg of ash is used to substitute for 1 kg of clay in the clay brick production.
For using the ash as a soil conditioner in rice fields, 500 kg of ash is used to substitute
for 24 kg of Ammonium sulphate, as N. For the option of disposing the ash in landfill,
the LCI data for the process of land-filling the ash were adapted from the unit process
‘Disposal, wood ash mixture, pure, 0% water, to sanitary landfill/ CH U) in Ecoinvent
2.0 database in SimaPro version 7.1.6. The LCI data for the electricity generation system
is presented in Appendix 3.1.
b) Data for cement production system
LCI data for Thai cement production were based on the report by Thailand Environment
Institute (2004b). This report shows LCI data for conventional Thai Portland cement
production processes in which rice husk are not included. The LCI data for the
production process of Portland cement with rice husk replacing 20% of coal were
adapted from the existing data in this report.
The calculation was done based on an assumption that rice husk are used to substitute
for coal by 20% based upon energy content. The Al2O3 and Fe2O3 contained in rice husk

Chapter 7-Life Cycle Assessment of Rice Husk Utilization
190
ash were not taken into account because they were in very small amounts, rice husk ash
contains more than 90 percent of SiO2 (as discussed in section 3.2.2). After substituting
rice husk in the cement process, an amount of shale was taken out as rice husk ash
contributes SiO2 to the clinker (shale is the main raw material providing SiO2 into the
process). However, shale also provides Al2O3 and Fe2O3 to the process. Hence, Al2O3
and Fe2O3 would be lacking as a result of having removed some amount of shale from
the process. These chemicals are reintroduced when bauxite and iron ore are added to
the process (Thailand Environment Institute (TEI) 2004b). Due to limited data, all
emissions were assumed to be the same as the conventional Portland cement production
(i.e. without rice husk). However, the fossil CO2 amount was deducted, based on a
calculation of CO2 emitted by burning the amount of coal replaced by rice husk.
Another limitation was adapting the distance of the transportation of rice husk from rice
mill to cement plant. The transportation of all raw materials and fuels used in the process
from their sources to the cement plant was already included in the calculation of the LCI
data in this report (Thailand Environment Institute (TEI) 2004b). Moreover, the LCI
data calculations in this report were derived from the emissions from fuels used in the
vehicles. In addition, the LCI data were reported as aggregated data. Therefore, the
transportation data of each fuel and material could not be defined from this LCI data set.
Hence, the transportation of rice husk to the cement plant was not adapted in this LCI
model. It was assumed that data for transportation of rice husk from a rice mill to the
cement plant are the same as that of other raw fuels and materials which are already
included in the LCI data set in this report. It is conceivable that the transportation
distance of rice husk to the cement plant may differ from that of the other fuels used in
the cement plant (the distance of the transportation of these fuels are already included in
the LCI data set for the Portland cement production in TEI (Thailand Environment
Institute (TEI))). This issue will be taken into account in the discussion of the LCA
results (see section 8.2). The LCI data for the cement produciton system is presented in
Appendix 3.2.

Chapter 7-Life Cycle Assessment of Rice Husk Utilization
191
c) Data for cellulosic ethanol system
As the cellulosic ethanol production using rice husk as a feedstock had not yet been
introduced to Thailand (at the time of analysis), data from other countries were used in
this study. However, there were no LCI data for the production of cellulosic ethanol
from rice husk available; the data about the production process of ethanol used for this
study were adapted from the production process of cellulosic ethanol production from
wood (Jungbluth et al. 2007). As a consequence, ethanol yield and some available inputs
were adjusted to rice husk conditions according to Saha et al. (2005). While inputs from
technosphere were proportional to dry matter input, emissions of hydrocarbons were
proportional to carbon input and all other emissions were proportional to dry matter
input according to Jungbluth et al. (2007).
In the model of the production of cellulosic ethanol from rice husk, the distance of the
transportation of rice husk from the rice mill to the ethanol plant could be adjusted, as
the transportation of the feedstock to the ethanol plant could be defined in the LCI data
of the basis product used for this model (the cellulosic ethanol production from wood
(Jungbluth et al. 2007)). This LCI data set was available in Ecoinvent database in
SimaPro version 7.1.6. The transportation distance of the rice husk from rice mill to
ethanol plant was assumed to be 200 km. This is based on the assumption that if rice
husk are to be used in cellulosic ethanol production, the transportation distance of the
husk to the ethanol plant should be longer than that of the husk to the rice husk based
power plant (defined as 100 km). This is because the rice husk based cellulosic ethanol
technology is new and has not yet been established (at the time of analysis) in Thailand.
It is assumed that when this technology is introduced, the number of plants will be less
than the number of rice husk based power plants (which already existed around the
country). This means that they should not be spread around in the country as much as the
rice husk power plants are. Therefore, the transportation distance of the rice husk to the
ethanol plant was assumed to be longer than that of the electricity production system.
However, the different transportation distances of rice husk to ethanol plant will be

Chapter 7-Life Cycle Assessment of Rice Husk Utilization
192
tested to see how they affect the overall LCA results in a sensitivity analysis (section
7.5.3.)
The model of vehicle operation using cellulosic ethanol produced from rice husk was
adapted from a model of driving a passenger car, which uses E10 (using ethanol
produced from wheat blended with petrol) per kilometre, based on the Australian Urban
Driving Cycle (AUDC) (in the Australian Life Cycle Inventory Database in SimaPro
version 7.1.6). However, the ethanol production was adapted to the production of the
cellulosic ethanol from rice husk. The LCI data for the cellulosic ethanol system is
presented in Appendix 3.3.
7.3.2 Data quality
With regard to data quality, as a simplified LCA, data used in this study are not as high
quality as the data used in the detailed LCA. As discussed in the previous section, some
process data were adapted to the Thai conditions where possible. There were only a few
sets of LCI data on the Thai production processes available. Therefore, most data
employed in this work were based on unit process data from Australia and some
European countries as these were available on the LCA software package used in this
study (SimaPro version 7.1.6) at the Centre for Design, RMIT University. The data used
were also adapted to be as consistent with the goal and scope of the study as possible.
More precision would lead to greater accuracy in LCI models in later stage; however,
this is not the aim of the study. As a comparative LCA study, an effort was made to
make all LCI models comparable.
Although data quality is considered important, data quality rating was not included in
this study as the data quality rating of some data were unknown. These were mostly the
LCI data for the Thai production processes.

Chapter 7-Life Cycle Assessment of Rice Husk Utilization
193
7.3.3 Consistency of data
With regard to the consistency of data, as much as possible, the unit process data within
SimaPro version 7.1.6 used in this study were adapted to the same level of detail. For
example, LCI data for some processes include infrastructure processes but some do not.
In this study, infrastructure processes were removed to make the system models
investigated comparable. Much attention was paid to the comparative LCI models. For
instance, the LCI model of the cellulosic ethanol system excludes the processes of the
applications of the ash of the residues remaining in the cogeneration process (part of the
cellulosic ethanol production (see section 7.2.3 for system boundary of the cellulosic
ethanol system)) as the data were not available. This model was set to be compared with
the model of the petrol product which includes the waste management processes of the
wastes generated in the refinery. To make them comparable, the waste management
processes in the model of petrol product were removed.
The biogenic CO2 was accounted for as neutral across all rice husk use options. Based on
the IPCC Guidelines for National Greenhouses Gas Inventories (IPCC 2006), CO2
released by burning rice husk is counted as neutral because it is assumed that the CO2
will be reabsorbed during the next season of the rice growing phase. Hence, this credit
was given to all rice husk use systems to make them comparable. Christensen et al.
(2008) suggested that the calculation of the contribution of waste management to global
warming can be done both ways: biogenic carbon accounting as neutral and biogenic
carbon counting. However, the boundary conditions must be clearly addressed to gain
consistent and reliable results. Though the rice growing phase was not included in this
study, the biogenic CO2 was accounted for as neutral in the LCI models for the
comparison purpose. As one of the benefits of using rice husk is that it has the carbon
neutral feature while the conventional products such as fossil fuels and minerals
(replaced by rice husk) do not. Therefore, the biogenic carbon was accounted as neutral
in all rice husk use systems.

Chapter 7-Life Cycle Assessment of Rice Husk Utilization
194
7.4 Impact Assessment
The impact assessment method used in this study is ReCiPe 2008 version 1.01, using
midpoint indicators, hierarchist (H) and world normalization factors. It was used in the
manner set up in SimaPro 7.1.6. The ReCiPe 2008 method was developed by Goedkoop
et al. (2009), based on two main approaches: the baseline method for impact
characterisation in the Handbook on Life Cycle Assessment (Guinee 2002) and the Eco-
indicator 99 impact assessment method (Goedkoop & Spriensma 2001). The ReCiPe
2008 method offers results at both midpoint and endpoint levels (Goedkoop et al. 2009).
However, this study uses the midpoint results as recommended in the Handbook on Life
Cycle Assessment (Guinee 2002, p. 68) and Centre for Design (2008) because the results
from midpoint level are relatively robust. The relationship between the LCI results, the
midpoint and endpoint impact indicators defined in ReCiPe 2008 method are shown in
Figure 7.6. From this figure, it is seen that the LCI results are converted to the midpoint
impact indicator through the environmental mechanism part 1, before they are converted
to the endpoint impact indicator through the environmental mechanism part 2. It is clear
that a number of endpoint impact categories is less than that of the midpoint categories.
Some midpoint impact indicators are aggregated into one endpoint impact indicator. The
conversion and aggregation of LCI results to the endpoint impact indicators may lead to
high uncertainty of the results. Goedkoop et al. (2009) noted that the uncertainty of the
endpoint results analysed by the ReCiPe 2008 method are relatively high compared with
that of the midpoint results. This is because the endpoint results are calculated based on
their own models. While for the midpoint results, they are based on the internationally
accepted models. Therefore, this study used the midpoint results analysed by the ReCiPe
2008 method.

Chapter 7-Life Cycle Assessment of Rice Husk Utilization
195
Figure 7.6 Relationship between LCI results, midpoint and endpoint indicators for
ReCiPe 2008
Source: Goedkoop et al. (2009)
Similar to the Eco-indicator 99 method (Goedkoop & Spriensma 2001), there are three
different versions of ReCiPe 2008 based on cultural theory: individualist (I); hierarchist
(H) and egalitarian (E). The simplified characteristics of these different perspectives are
shown in Table 7.3. As shown in this table, the Hierarchist version supposes that proper
policy can help to manage the problem of disposing of rice husk (Goedkoop et al. 2000).
The hierarchist (H) version therefore seems to be appropriate for this study since this
study aims to generate recommendations about the rice husk disposal strategies for the
policy makers. Moreover, the Eco-indicator 99 methodology report (Goedkoop &

Chapter 7-Life Cycle Assessment of Rice Husk Utilization
196
Spriensma 2001), recommended that the hierarchist (H) version be used as a default
method. They further explain that since most models are based on the consensus
building processes and a balance between short and long term perspectives, this implies
that most models work accordingly towards the hierarchist (H) perspective.
Table 7.3 Simplified characteristics of different perspectives
Perspective Time perspective Manageability Required level of
Evidence
Hierarchist (H) Balance between short
and long term
Proper policy can
avoid many problems
Inclusion based on
consensus
Individualist (I) Short term Technology can avoid
many problems
Only proven effects
Egalitarian (E) Very long term Problems can lead to
catastrophy
All possible effects
Source: Goedkoop et al. (2000, p. 29)
The impact categories and the units of these categories reported at the midpoint level in
ReCiPe 2008 method are shown in Table 7.4.

Chapter 7-Life Cycle Assessment of Rice Husk Utilization
197
Table 7.4 The impact categories and units at midpoint level reported in ReCiPe
2008
Impact category Unit
Climate change kg CO2 to air
Ozone depletion kg CFC-11 to air
Terrestrial acidification kg SO2 to air
Freshwater eutrophication kg P to freshwater
Marine eutrophication kg N to freshwater
Human toxicity kg 1,4-DCB to urban air
Photochemical oxidant formation kg NMVOC to air
Particulate matter formation kg PM10 to air
Terrestrial ecotoxicity kg 1,4-DCB to industrial soil
Freshwater ecotoxicity kg 1,4-DCB to freshwater
Marine ecotoxicity kg 1,4-DCB to marine water
Ionising radiation kg U235 to air
Agricultural land occupation m2×yr agricultural land
Urban land occupation m2×yr urban land
Natural land transformation m2 natural land
Water depletion m3 water
Mineral resource depletion kg Fe equivalent
Fossil fuel depletion kg oil equivalent
Source: (Goedkoop et al. 2009)
Note: CFC-11 = Chlorofluorocarbon
1,4-DCB = 1,4 dichlorobenzene
NMVOC = Non Methane Volatile Organic Carbon compound
PM 10 = particulate matters of 10 micrometers or less
U235 = Uranium-235

Chapter 7-Life Cycle Assessment of Rice Husk Utilization
198
While this section presents the LCA results, analysed using the method discussed the
detailed discussion of the results is documented in the next chapter (Chapter 8). All of
the results presented in this section refer to the functional units set in section 7.2.2 (see
Figure 7.1), which are based on the same volume of rice husk (1,000 tonnes) consumed
in all systems.
The results presented here are the characterized and normalized results. The weighted
results are not presented as they are only subject to the views of the particular group of
panel (in ReCiPe 2008 method) and so they may not apply to the Thai context
specifically. The important issues such as the Thai government policies regarding the
uses of rice husk, benefits and barriers of each rice husk use systems will be taken into
consideration together with all the findings in this thesis in the discussion (section 8.2).
These would help to decide the most environmentally friendly rice husk use for
Thailand.
It is worthy to note that due to the difficulty in defining the normalized factors for
Thailand specifically, the normalized factors used in this study are based on world
population (as set up in Recipe Midpoint (H) V1.01 / World Recipe H / normalization in
SimaPro version 7.1.6). In addition, all LCI data used in this study were adapted to be
comparable across all options. Though some data were adapted to Thai conditions where
possible, most data were still based on the databases of other countries. Therefore, LCA
results presented in this section should not be seen as the definitive environmental
profiles of the uses of rice husk in Thailand. Rather, they are used to help select among
different rice husk use options.
As described earlier in the system boundaries section (section 7.2.3), the different
options of co-product produced in the electricity system (rice husk ash) will be taken
into account to find out the most environmentally friendly rice husk ash disposal option
(for the electricity option). The results from this analysis will then be taken into account
in the model of the electricity system to compare with other two rice husk use systems
(cement and cellulosic ethanol systems). It should be noted that there is no co-product in

Chapter 7-Life Cycle Assessment of Rice Husk Utilization
199
the cement system as the rice husk ash is bound with clinker to produce cement. In the
cellulosic ethanol system, the waste management of the ash produced in the co-
generation plant (part of ethanol production) is excluded due to lack of data. The
following sections compare the LCA results of the rice husk based electricity production
with different rice husk ash disposal options (see section 7.4.1) and the results of
different rice husk use options (see section 7.4.2).
7.4.1 Rice husk based electricity generation and the co-product uses
In the electricity system, the use of the co-product (ash) generated in the electricity
production process is taken into account. The environmental impacts of selected rice
husk ash uses (soil conditioner, brick production, light weight concrete block production
and landfill) (refer to Table 7.2) are assessed and compared to identify the most
environmentally favourable rice husk ash application option (among the ones
investigated). Then, the best rice husk ash use option from this result is incorporated into
the electricity system model for comparison with the other two rice husk use systems
(cement and cellulosic ethanol systems) in the following section.
The impacts of the production of 919 MWh electricity produced from rice husk based
electricity generation (which refers to processing 1,000 tonnes of rice husk in the
production process) with different ash disposal options are presented in Table 7.5. The
characterized result unit differs from one impact category to another. Thus, this makes it
difficult to compare the results across different impact category analysed. Therefore, the
normalized results will be used for a comparison of the environmental impacts across the
different rice husk disposal options. This is because the normalized results in all impact
categories have the same unit (i.e. person×year), so this allows a comparison between
the results of different impact categories.

Chapter 7-Life Cycle Assessment of Rice Husk Utilization
200
Table 7.5 Characterized results of 919 MWh rice husk based electricity production
with different ash use options (analysed by Recipe Midpoint (H) V1.01 / World
Recipe H / characterization)
Impact
category
Unit Soil
conditioner
Brick Concrete
block
Landfill
Climate change kg CO2 eq -1.06E+04 9.19E+03 -1.71E+05 1.02E+04
Ozone depletion kg CFC-11 eq -2.53E-03 -5.99E-05 -1.85E-04 6.89E-05
Terrestrial acidification
kg SO2 eq 2.14E+03 2.19E+03 2.04E+03 2.20E+03
Freshwater eutrophication
kg P eq -3.18E-02 1.94E-05 -4.28E-03 1.44E+02
Marine eutrophication
kg N eq 2.39E+02 2.42E+02 2.13E+02 2.43E+02
Human toxicity kg 1,4DCB eq -7.10E+02 1.79E+01 -1.53E+04 1.06E+05
Photochemical oxidant formation
kg NMVOC eq 2.02E+03 2.06E+03 1.82E+03 2.07E+03
Particulate matter formation
kg PM10 eq 1.82E+03 1.84E+03 1.51E+03 1.85E+03
Terrestrial ecotoxicity
kg 1,4-DCB eq -5.19E-01 5.44E-01 4.96E-01 4.82E+00
Freshwater ecotoxicity
kg 1,4-DCB eq -3.64E+00 4.90E-01 -1.02E+02 3.97E+03
Marine ecotoxicity
kg 1,4-DCB eq -1.17E+01 2.29E+00 -1.05E+02 3.74E+03
Ionising radiation
kg U235 eq -1.13E+03 -1.84E+00 -3.84E+01 2.01E+01
Agricultural land occupation
m2 -5.36E+00 4.50E-02 -3.37E+00 5.57E+01
Urban land occupation
m2 -9.57E+00 -2.95E+01 -7.07E+01 3.88E+02
Natural land transformation
m2 -4.28E-02 6.52E-01 -2.32E+01 -1.11E+01
Water depletion m3 -5.25E+03 5.42E+03 -9.78E+02 5.66E+03
Metal depletion kg Fe eq -3.01E+00 -1.26E-02 -5.13E+02 6.15E-02
Fossil fuel depletion
kg oil eq -3.84E+03 3.69E+03 -1.86E+04 4.04E+03
Note: The process network diagrams showing the amount flows of impacts contributed
by different processes for selected impact categories are shown in section 7.5.2.
See notes under Table 7.4 for the explanations of some of the abbreviations of
the impact category units in this table.

Chapter 7-Life Cycle Assessment of Rice Husk Utilization
201
The normalized impacts of the production of 919 MWh electricity produced from rice
husk with different ash disposal options are presented in Figure 7.7. From the
normalized results shown in Figure 7.7, the impacts on human toxicity, freshwater and
marine ecotoxicity caused by the rice husk based electricity production with landfill as
the ash disposal option dominate the overall results24
. This clearly indicates that landfill
is the worst option across all options examined, as it causes greater impacts (specifically
on freshwater eutrophication, human toxicity, freshwater and marine ecotoxicity) than
other ash use options. However, the results in Figure 7.7 do not clearly show the most
friendly rice husk ash use option (among the other use options such as soil conditioner,
brick production and light weigh concrete block production), as the results of the landfill
option overlook the results of other ash disposal options. Therefore, the normalized
results of the other three rice husk ash use options (soil conditioner, brick production and
light weight concrete block production) are plotted in Figure 7.8) to help identify the
most favourable rice husk ash use option.
In Figure 7.8, it is clear that the most environmentally friendly option for the disposal of
rice husk ash produced from the rice husk power plant is the use of the ash in light
weight concrete block production. This option causes less impact on climate change,
terrestrial acidification, marine eutrophication, human toxicity, photochemical oxidant
formation, particulate matter formation, freshwater ecotoxicity, marine ecotoxicity and
fossil fuel depletion. All other ash uses have relatively similar benefits. This results from
the higher environmental credit given to this rice husk ash disposal option (using the ash
in light weight concrete block production) by substituting rice husk ash for Portland
cement in the concrete block production process.
24
As the overall impacts caused by the rice husk based electricity generation with landfill as an ash
disposal option are dominated by the impacts on freshwater eutrophication, human toxicity, freshwater and marine ecotoxicity, the sensitivity of the results of the rice husk based electricity production (with different ash disposal options) to the different impact method used will be analysed in section 7.5.3.

Chapter 7-Life Cycle Assessment of Rice Husk Utilization
202
-500
500
1000
1500
2000
2500
3000
clim
ate
chan
ge
ozo
ne
dep
leti
on
terr
estr
ial
acid
ific
atio
n
fres
hw
ater
eu
tro
ph
icat
ion
mar
ine
eutr
op
hic
atio
n
hu
man
to
xic
ity
ph
oto
chem
ical
ox
idan
t fo
rmat
ion
par
ticu
late
mat
ter
form
atio
n
terr
estr
ial
eco
tox
icit
y
fres
hw
ater
eco
tox
icit
y
mar
ine
eco
tox
icit
y
ion
isin
g r
adia
tio
n
agri
cult
ura
l la
nd
occ
up
atio
n
urb
an l
and
occ
up
atio
n
nat
ura
l la
nd
tra
nsf
orm
atio
n
wat
er d
eple
tio
n
met
al d
eple
tio
n
foss
il d
eple
tio
n
per
son
*y
ear Soil conditioner
Brick
Concrete block
Landfill
Figure 7.7 Normalized impacts of 919 MWh rice husk based electricity production
with different ash use options (analysed by Recipe Midpoint (H) V1.01 / World
Recipe H / normalization)
“A higher score indicates a higher environmental impact.”
Note: The process network diagrams showing the amount flows of impacts contributed
by different processes for selected impact categories are shown in section 7.5.2.

Chapter 7-Life Cycle Assessment of Rice Husk Utilization
203
-150
-100
-50
50
100
150cl
imat
e ch
ang
e
ozo
ne
dep
letio
n
terr
estr
ial ac
idif
icat
ion
fres
hw
ater
eutr
op
hic
atio
n
mar
ine
eutr
op
hic
atio
n
hu
man
tox
icit
y
ph
oto
chem
ical
oxid
ant fo
rmat
ion
par
ticu
late
mat
ter
form
atio
n
terr
estr
ial ec
oto
xic
ity
fres
hw
ater
eco
tox
icit
y
mar
ine
eco
tox
icit
y
ionis
ing r
adia
tio
n
agri
cultu
ral
lan
d o
ccup
atio
n
urb
an l
and o
ccup
atio
n
nat
ura
l la
nd t
ran
sfo
rmat
ion
wat
er d
eple
tio
n
met
al d
eple
tio
n
foss
il d
eple
tio
n
per
son*
yea
r
Soil conditioner
Brick
Concrete block
Figure 7.8 Normalized impacts of 919 MWh rice husk based electricity production
with different ash use options (except landfill) (analysed by Recipe Midpoint (H)
V1.01 / World Recipe H / normalization)
“A higher score indicates a higher environmental impact.”
Note: The process network diagrams showing the amount flows of impacts contributed
by different processes for selected impact categories are shown in section 7.5.2.
7.4.2 Comparison across different rice husk use systems
Table 7.6 shows the characterized impacts that are reduced by processing 1,000 tonnes
of rice husk in the different three systems (see Figure 7.1 for the functional units set for
the calculation of the impacts reduced by using rice husk in all systems examined). As
discussed in section 7.4.1, the characterized result units differ across impact categories,
so it is difficult to compare the results across different impact category analysed.

Chapter 7-Life Cycle Assessment of Rice Husk Utilization
204
Therefore, the normalized results (i.e. person×year), will be used for a comparison of the
environmental impacts across the different rice husk use options. Figure 7.9 shows a
comparison of the normalized results of the three different rice husk use systems
investigated. Note is taken that, for the electricity generation system, the option of
sending rice husk ash from the rice husk power plant to the light weight concrete block
production plant is taken into account as it is the most preferable rice husk ash disposal
option (results are shown in section 7.4.1).

Chapter 7-Life Cycle Assessment of Rice Husk Utilization
205
Table 7.6 Characterized impacts reduced by processing 1,000 tonnes of rice husk in
different use systems (analysed by Recipe Midpoint (H) V1.01 / World Recipe H /
characterization)
Impact
category
Unit Cement option Electricity
option
Ethanol option
Climate change kg CO2 eq -1.38E+06 -9.53E+05 -2.37E+05
Ozone depletion kg CFC-11 eq -1.60E-07 -1.85E-04 -5.50E-02
Terrestrial acidification
kg SO2 eq -3.83E+00 1.14E+03 2.18E+03
Freshwater eutrophication
kg P eq -4.60E-06 -4.28E-03 -5.49E-02
Marine eutrophication
kg N eq -1.92E+00 8.03E+00 1.30E+02
Human toxicity kg 1,4DCB eq 2.51E+01 -1.61E+04 2.38E+04
Photochemical oxidant formation
kg NMVOC eq
-1.95E+01 -1.76E+02 8.39E+02
Particulate matter formation
kg PM10 eq 1.29E+02 1.10E+03 5.54E+02
Terrestrial ecotoxicity
kg 1,4-DCB eq 1.35E-01 -3.77E-03 1.23E+01
Freshwater ecotoxicity
kg 1,4-DCB eq 9.94E-02 -1.02E+02 -1.11E+02
Marine ecotoxicity
kg 1,4-DCB eq -2.45E-01 -1.10E+02 7.36E+01
Ionising radiation
kg U235 eq -1.47E-02 -3.84E+01 -1.20E+03
Agricultural land occupation
m2 -7.25E-05 -3.37E+00 3.42E+01
Urban land occupation
m2 3.17E+00 -2.47E+02 -2.13E+00
Natural land transformation
m2 2.70E+00 -2.33E+01 1.24E-03
Water depletion m3 1.27E+03 -1.98E+03 -6.09E+03
Metal depletion kg Fe eq 2.07E+04 -5.13E+02 -4.59E+01
Fossil fuel depletion
kg oil eq -3.25E+05 -3.05E+05 -8.89E+04
Note: The functional unit of each rice husk use system is defined in Figure 7.1.
See notes under Table 7.4 for the explanations of some of the abbreviations of
the impact category units in this table.

Chapter 7-Life Cycle Assessment of Rice Husk Utilization
206
-300
-250
-200
-150
-100
-50
50
100
150
200
250cl
imat
e ch
ang
e
ozo
ne
dep
leti
on
terr
estr
ial
acid
ific
atio
n
fres
hw
ater
eutr
op
hic
atio
n
mar
ine
eutr
op
hic
atio
n
hu
man
to
xic
ity
ph
oto
chem
ical
ox
idan
t fo
rmat
ion
par
ticu
late
mat
ter
form
atio
n
terr
estr
ial
eco
tox
icit
y
fres
hw
ater
eco
tox
icit
y
mar
ine
eco
tox
icit
y
ion
isin
g r
adia
tio
n
agri
cult
ura
l la
nd
occ
up
atio
n
urb
an l
and
occ
up
atio
n
nat
ura
l la
nd
tran
sfo
rmat
ion
wat
er d
eple
tio
n
met
al d
eple
tio
n
foss
il d
eple
tio
n
per
son
*y
ear
Cement
Electricity
Ethanol
Figure 7.9 Normalized impacts reduced by processing 1,000 tonnes of rice husk in
different use systems (analysed by Recipe Midpoint (H) V1.01 / World Recipe H /
normalization)
“A higher score indicates a higher environmental impact.”
Note: The functional unit of each rice husk use system is defined in Figure 7.1.
The process network diagrams showing the amount flows of impacts contributed
by different processes for selected impact categories are shown in section 7.5.2.
Based on how the LCI models were set up for the purpose of assessing the impacts
reduced by using rice husk in the three different rice husk use systems investigated
(discussed in section 7.2.2), the negative results indicate the benefits of using rice husk
in that use option. In other words, the negative results imply that the process using rice
husk causes less impact than its conventional process.

Chapter 7-Life Cycle Assessment of Rice Husk Utilization
207
From the results in Figure 7.9, it is clear that using rice husk in most of the systems
examined can help to reduce impacts on fossil fuel depletion, climate change, human
toxicity, freshwater and marine ecotoxicity. This is indicated by the significant negative
results shown for these impact categories across all categories analysed. Different
impact categories can be compared based on the same result unit (normalized unit, i.e.
person×year). However, the results show that using rice husk in some production
systems cause higher impacts on terrestrial acidification, marine eutrophication, human
toxicity, photochemical oxidant formation, particulate matter formation, terrestrial and
marine ecotoxicity and metal depletion than their conventional processes.
From the overall results (see Figure 7.9), the cement system has the greatest effect in
reducing fossil fuel depletion and climate change when compared with other rice husk
use options. However, it causes a little higher impacts on particulate matter formation
and metal depletion than the conventional cement system, which rice husk is not used as
a substitute fuel.
The cement option shows the largest effect in reducing impacts on climate change. The
LCI model of the cement production system was adapted from the conventional cement
production process, by removing some amount of coal and shale when using rice husk in
the process. This can simply imply that the reduction of greenhouse gases results from
using rice husk as a substitute for coal in the cement production process. Therefore, this
helps to reduce greenhouse gases from burning coal. Moreover, it helps to considerably
reduce impact on fossil fuel depletion, as rice husk is used as a fuel to substitute for coal
in cement production. However, it causes a little greater impact on metal depletion when
compared with other options. This is because using rice husk in cement production
requires extra minerals, as other minerals such as bauxite and iron ore, were added into
the process when the husk were used (and some amount of shale was taken out). In
addition, the cement option contributes a little higher particulate matter formation than
its conventional process (the process contribution analysis of the cement option with
regard to this impact category will be discussed in section 7.5.3).

Chapter 7-Life Cycle Assessment of Rice Husk Utilization
208
The cellulosic ethanol option is the worst option among three rice husk use systems
investigated. It shows the least effect in reducing impacts on fossil fuel depletion and
climate change when comparing with other rice husk use options. This option has the
largest effect in reducing impact on freshwater ecotoxicity when comparing with other
rice husk use options. However, the magnitude of the impact in this impact category is
marginal when comparing across all impact caterories analysed. Moreover, the cellulosic
ethanol system causes higher impacts on terrestrial acidification, marine eutrophication,
human toxicity, photochemical oxidant formation, particulate matter formation,
terrestrial and marine ecotoxicity than petrol sytem. Moreover, the impacts on human
toxicity of this option are highest of all three rice husk use options. The processes in this
rice husk use system, which reduces (or contributes to) the impacts in the impact
categories mentioned will be discussed in the process contribution analysis (section
7.5.3).
The electricity production option helps to reduce the impact on human toxicity by the
greatest amount, compared with the other options. Moreover, it has minor effect in
reducing impacts on freshwater and marine ecotoxicity. In addition, it has a fairly
significant effect in reducing impact on climate change and fossil fuel depletion (after
cement option) when comparing the results across all impact categories. However, the
electricity option causes greater impacts on terrestrial acidification and particulate matter
formation than the Thai grid production. Moreover, the impacts on particulate matter
formation of this option are highest of all three rice husk use options. The processes in
this rice husk use system, which reduces (or contributes to) the impacts in the impact
categories mentioned will be discussed in the process contribution analysis (section
7.5.3).
In general, all of the rice husk use systems analysed show benefits over their
conventional systems in terms of fossil fuel depletion, climate change, human toxicity
(only for electricity option), freshwater ecotoxicity (except for cement option) and
marine ecotoxicity (only for electricity option). Nevertheless, they are not better than the
conventional systems in terms of the other impact categories evaluated, such as
Chapter 7-Life Cycle Assessment of Rice Husk Utilization
209
terrestrial acidification, marine eutrophication, human toxicity, photochemical oxidant
formation, particulate matter formation, terrestrial ecotoxicity and marine ecotoxicity
and metal depletion.
7.5 Interpretation of the LCA Results
The interpretation phase is where the LCA results, together with all choices and
assumptions made for an analysis are tested for their soundness and robustness (Guinee
2002). For example, when assumptions were made in an analysis, this should be tested
to see how these assumptions will affect the overall results. In this section, the
consistency, process contribution and sensitivity analysis are discussed. However, the
uncertainty analysis could not be performed as the uncertainties of many data used in
this study were unknown.
7.5.1 Consistency analysis
As data used in this LCA study were from different sources (interviews with industry
personnel, LCI databases available and literature), these may lead to high inconsistency
in the LCA results. For this reason, all unit process and emissions data selected to be
used in the LCA models were made consistent with the impact assessment methods used
where possible. This was done by making sure that all data that were supposed to be
accounted for in the impact assessment phase were accounted for. This was done with
the associated functions available in SimaPro 7.1.6. Following the impact assessment
analysis, the software reports the raw materials and substances that were not accounted
for in the results analysed. And so these raw materials and substances (that were
reported as not included in the results) were checked with the list of all data accounted
for in the impact assessment method used (available in SimaPro 7.1.6). If there was an
error, the data used in the LCI models were then adapted to the data which are accounted
for in the impact method used.

Chapter 7-Life Cycle Assessment of Rice Husk Utilization
210
7.5.2 Process contribution analysis
The process contribution analysis is used to help to determine the unit processes that
play significant roles in the LCA results. The results obtained from the process
contribution analysis can inform the LCA practitioners of the unit processes which are
needed an attention to see whether the data of that particular processes are sufficiently
representative and complete (PRé Consultants 2008). In this study, the process
contribution analysis was performed using process network diagrams (function is
available in SimaPro 7.1.6). This analysis was conducted to reveal the unit processes
that contribute impacts to the largest extent in the overall processes or rice husk use
systems. This would help to understand why a particular process or rice husk use system
impacts the overall results most. In addition, the data of the processes and systems which
play significant roles in the overall LCA results were checked for their quality (see
section 7.3.2).
Note is taken that as the data quality checking of the LCI data used in this study were
already discussed in section 7.3.2, this section only reports the results of the process
contribution analysis regarding the unit processes and rice husk use systems which play
significant roles in the overall LCA results.
Figure 7.10 explains how to interpret the process network diagram. It shows an example
of the process network diagram with labels of the information contained in the diagram
using the process of the Australian ready-mix concrete production for the greenhouse
gases impact indicator (reported as kg CO2 equivalent). The amount (measure) and unit
used in the process are shown on the top of each box. The process name is shown below
the amount and unit of the process. The impact indicator value and unit are shown at the
bottom of the box. The arrow represents the magnitude of the impact indicator value.
The thicker arrow implies the larger impact contributed by that particular process to the
overall process. For example, in Figure 7.10, the interpretation is that the production
process of Portland cement contributes the largest amount of greenhouse gases to the
production process of ready-mix concrete. It is important to note that some minor

Chapter 7-Life Cycle Assessment of Rice Husk Utilization
211
processes may not be shown in the diagram. This is because their impact indicator
values are smaller than the cut-off level set in the software SimaPro 7.1.6. However,
their impact contribution is still accounted for in the impact calculation.
0.122 MJArticlulated Truck
Engine
0.0111 kg CO2 eq
0.0914 tkmArticlulated Truck
Transport
0.00927 kg CO2 eq
0.0957 MJElectricity HV
0.0261 kg CO2 eq
0.147 kgCement (portland)
0.118 kg CO2 eq
1 kgconcrete (readymix)
0.14 kg CO2 eq
0.0957 MJElectricity HV
0.0261 kg CO2 eq
0.197 MJEnergy, from coal
0.0167 kg CO2 eq
0.379 MJEnergy, from gas
0.0224 kg CO2 eq
0.417 kgGravel
0.00647 kg CO2 eq
0.0333 kgCement replacement
for flyash
0.0241 kg CO2 eq
Figure 7.10 Example of process network diagram
The process selected for the contribution analysis is that which was found to contribute
the impacts most, compared with the others. For example, the production process of the
rice husk based electricity with landfill as the ash disposal option is chosen for the
process contribution analysis because it was found to have the greatest impact on
freshwater eutrophication, human toxicity, freshwater and marine ecotoxicity, while
electricity production with other ash disposal options did not (refer to the results
presented in Figure 7.7). In addition, the rice husk use systems selected for the process
contribution analysis are only the systems that appear to significantly reduce or
Amount and unit of process Process name
Impact indicator value and unit
Arrow indicating magnitude of indicator value

Chapter 7-Life Cycle Assessment of Rice Husk Utilization
212
contribute to impacts on the impact categories analysed (refer to the LCA results
presented in Figure 7.9).
The LCI models of rice husk use systems (i.e. electricity system, cement system and
cellulosic ethanol system) comprise two processes: the process that uses rice husk and its
conventional process (refer to the functional units of each rice husk use system in Figure
7.1). Therefore, in the process network diagram of the rice husk use systems, there are
two shadings of the arrows showing the magnitude of impact indicator. The grey arrow
represents the gross amount of negative impact and the black arrow represents the gross
amount of positive impact. If the overall result (shown in the top box of each process
network diagram) is negative, it implies that the process with grey arrow contributes
higher impact than its comparative system on the impact category analysed.
Alternatively, if the overall result is positive, it means that the process with black arrow
contributes higher impact than its comparative process. However, for normal process,
the arrow in the process network diagram is shown black only.
The implications of the findings of the process contribution analysis from the process
network diagrams shown in this section are based on how the LCI model of each
process/system is constructed (refer to the goal and scope of the study (section 7.2) and
life cycle inventory analysis (section 7.3)). For instance, in the LCI model of the
electricity system, the environmental impacts reduced by using rice husk in this system
are obtained by subtracting the impacts of the Thai grid mix production from that of the
rice husk based power generation. Thus, the amount of inputs in all processes (shown
on the top of each box) and the impact indicator values (shown at the bottom of each
box) of the Thai grid mix production system are given as negative values. While for the
rice husk based electricity system, they are given as positive values.
Therefore, if the overall result (shown in the top box of process network diagram) is
negative, this means that the Thai grid mix production (shown as grey arrow) causes
higher impact than the rice husk based electricity generation (black arrow). If the result
is positive, this means that the rice husk based electricity production causes higher

Chapter 7-Life Cycle Assessment of Rice Husk Utilization
213
impact than the Thai grid mix production. Likewise, for the other two systems (cement
and cellulosic ethanol systems), if the result is negative, this means that the conventional
system causes greater impact than the rice husk use system. If the rice husk use system
causes higher impact than the conventional system, the result is positive.
However, this rule does not apply to the avoided processes contained in the rice husk use
systems. For example, the LCI modelling of the rice husk ash disposal (in the electricity
system) was set up by avoiding the amount of the competing products (which are
replaced by rice husk ash in different applications). The result of the rice husk ash
disposal process is always negative and the arrow of the process is always shown in
grey. Nevertheless, it does not imply that the rice husk ash disposal process causes
higher impact than the Thai grid mix. The negative result (grey arrow) of the rice husk
ash disposal process implies that the rice husk ash disposal process compliments the
reduction of the impacts by displacing the electricity produced from the Thai grid mix
by rice husk based electricity production. This is because the rice husk ash disposal
process provides environmental credit (negative impact) to the electricity system by
saving some amount of the competing product (that is substituted by rice husk ash). For
the process contribution analysis of the normal process (not the rice husk use system),
the arrow representing the magnitude of impact contributed by the process is only shown
in black (positive impact).
As discussed earlier, the process contribution analysis in this section was conducted
based on the findings of the life cycle impact assessment presented in section 7.4.
Therefore, the structure of the findings of the process contribution analysis shown in this
section follows the structure of the LCA results presentation in sections 7.4.1 and 7.4.2.
This begins with the findings of the process contribution analysis of the rice husk based
electricity process with landfill as the ash disposal option, followed by the process
contribution analysis of the cement system, cellulosic ethanol system and electricity
system respectively.

Chapter 7-Life Cycle Assessment of Rice Husk Utilization
214
a) Rice husk based electricity process (with landfill as the ash disposal option)
Figure 7.7 shows that the option of disposing rice husk in landfill is the worst option as
it causes higher impacts on freshwater eutrophication, human toxicity, and freshwater
and marine ecotoxicity, than other ash use options examined. Other rice husk ash
application options have fairly similar benefits over the Thai grid mix production.
The following process network diagrams (see Figures 7.11, 7.12, 7.13 and 7.14) show
how each process in the electricity generation process (with the option of disposing the
ash in landfill) contributes to impacts on freshwater eutrophication, human toxicity and
freshwater and marine ecotoxicity respectively. The process network diagrams shown in
Figures 7.11, 7.12, 7.13 and 7.14 clearly indicate that within the production of rice husk
based electricity with the option of disposing the ash in landfill, the process of landfill is
the only process that contributes to freshwater eutrophication, human toxicity,
freshwater and marine ecotoxicity. These impacts result from the emissions in the
landfill leachate which is distributed to ground water and other sources of natural water
consequently. The main substance contributing to freshwater eutrophication is
Phosphate, and for human toxicity they are Arsenic, Selenium, Vanadium and
Molybdenum. While Vanadium, Nickel, Beryllium, Bromine, Selenium and Arsenic are
the main substances contributing to freshwater ecotoxicity; and Vanadium, Nickel,
Beryllium, Selenium and Arsenic are those onces that contribute to marine ecotoxicity.

Chapter 7-Life Cycle Assessment of Rice Husk Utilization
215
Figure 7.11 Process network of rice husk based electricity generation process (with
the option of disposing the ash in landfill) showing impact on freshwater
eutrophication
Note: 1. Black arrow represents gross positive impacts; grey arrow represents gross negative impacts.
2. The energy unit shown in this diagram is MJ as it is the base energy unit set for network
diagram in SimaPro version 7.1.6.
3. 3.31 × 10⁶ MJ = 919 MWh (the functional unit for the electricity production system shown in
Figure 7.1).
4. Some minor processes may not be shown in the diagram. This is because their impact indicator
values are smaller than the cut-off level set in the software SimaPro 7.1.6. However, their impact
contribution is still accounted for in the impact calculation.

Chapter 7-Life Cycle Assessment of Rice Husk Utilization
216
Figure 7.12 Process network of rice husk based electricity generation process (with
the option of disposing the ash in landfill) showing impact on human toxicity
Note: 1. Black arrow represents gross positive impacts; grey arrow represents gross negative impacts.
2. The energy unit shown in this diagram is MJ as it is the base energy unit set for network
diagram in SimaPro version 7.1.6.
3. 3.31 × 10⁶ MJ = 919 MWh (the functional unit for the electricity production system shown in
Figure 7.1).
4. Some minor processes may not be shown in the diagram. This is because their impact indicator
values are smaller than the cut-off level set in the software SimaPro 7.1.6. However, their impact
contribution is still accounted for in the impact calculation.

Chapter 7-Life Cycle Assessment of Rice Husk Utilization
217
Figure 7.13 Process network of rice husk based electricity generation process (with
the option of disposing the ash in landfill) showing impact on freshwater ecotoxicity
Note: 1. Black arrow represents gross positive impacts; grey arrow represents gross negative impacts.
2. The energy unit shown in this diagram is MJ as it is the base energy unit set for network
diagram in SimaPro version 7.1.6.
3. 3.31 × 10⁶ MJ = 919 MWh (the functional unit for the electricity production system shown in
Figure 7.1).
4. Some minor processes may not be shown in the diagram. This is because their impact indicator
values are smaller than the cut-off level set in the software SimaPro 7.1.6. However, their impact
contribution is still accounted for in the impact calculation.

Chapter 7-Life Cycle Assessment of Rice Husk Utilization
218
Figure 7.14 Process network of rice husk based electricity generation process (with
the option of disposing the ash in landfill) showing impact on marine ecotoxicity
Note: 1. Black arrow represents gross positive impacts; grey arrow represents gross negative impacts.
2. The energy unit shown in this diagram is MJ as it is the base energy unit set for network
diagram in SimaPro version 7.1.6.
3. 3.31 × 10⁶ MJ = 919 MWh (the functional unit for the electricity production system shown in
Figure 7.1).
4. Some minor processes may not be shown in the diagram. This is because their impact indicator
values are smaller than the cut-off level set in the software SimaPro 7.1.6. However, their impact
contribution is still accounted for in the impact calculation.

Chapter 7-Life Cycle Assessment of Rice Husk Utilization
219
b) Cement system
For the cement option, the process contribution to the impact on climate change, fossil
fuel depletion and metal depletion have already been discussed in the previous section
(section 7.4.2). Therefore, in this section, the only impact category selected for process
contribution analysis is the particulate matter formation (see Figure 7.15). The network
diagram shows that the main source of the particulate matter in the production process of
cement wherein rice husk replaces some amount of coal, is the production process of
bauxite, which is added into the cement production process when substituting rice husk
for coal in the cement process.
Figure 7.15 Process network of cement system showing impact on particulate matter
formation
Note: 1. Black arrow represents gross positive impacts; grey arrow represents gross negative impacts.

Chapter 7-Life Cycle Assessment of Rice Husk Utilization
220
2. The mass unit shown in this diagram is kg as it is the base mass unit set for network diagram
in SimaPro version 7.1.6.
3. 3.52 × 10⁸ kg = 351,617 tonnes (the functional unit for the cement production system shown in
Figure 7.1).
4. Some minor processes may not be shown in the diagram. This is because their impact indicator
values are smaller than the cut-off level set in the software SimaPro 7.1.6. However, their impact
contribution is still accounted for in the impact calculation.
c) Cellulosic ethanol system
The results of the cellulosic ethanol system (see Figure 7.9) show that the cellulosic
ethanol system has noticeable effect in reducing the impacts on fossil fuel depletion,
climate change and freshwater ecotoxicity. Nevertheless, it causes higher impacts on
terrestrial acidification, marine eutrophication, human toxicity, photochemical oxidant
formation, particulate matter formation, terrestrial and marine ecotoxicity than petrol
system. The following process network diagrams identify the processes that contribute
impacts on each the impact category mentioned (see Figures 7.16 to 7.25).
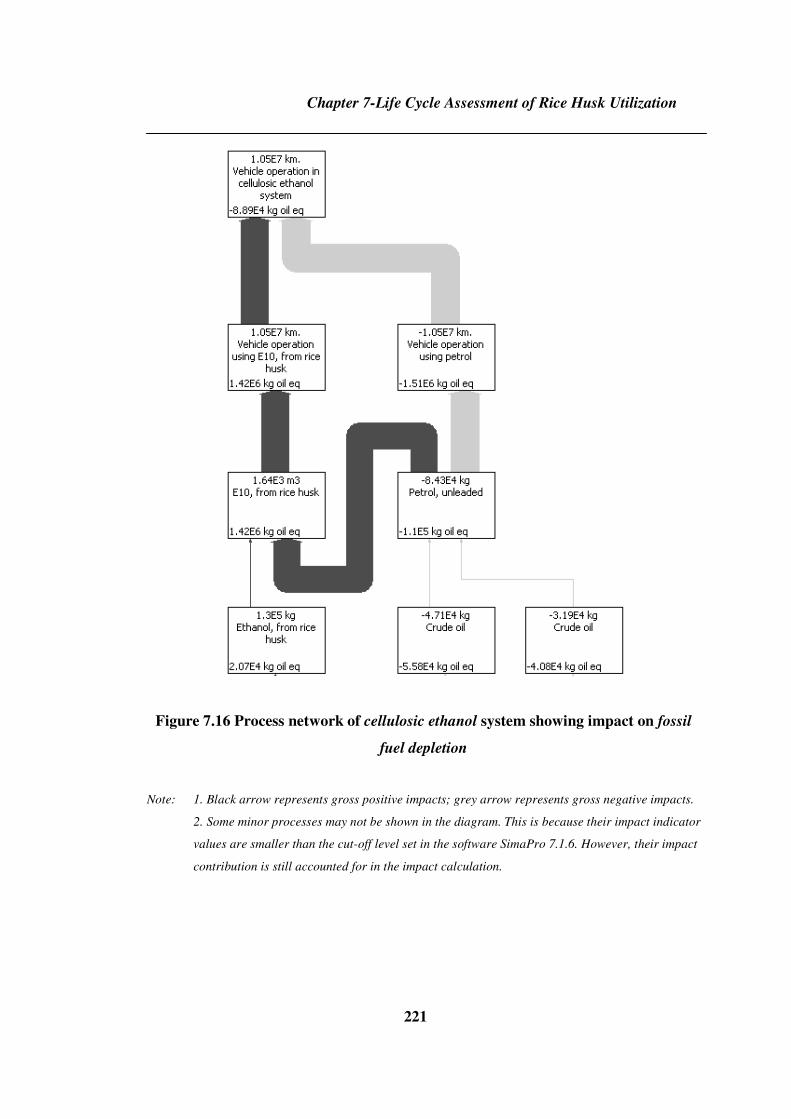
Chapter 7-Life Cycle Assessment of Rice Husk Utilization
221
Figure 7.16 Process network of cellulosic ethanol system showing impact on fossil
fuel depletion
Note: 1. Black arrow represents gross positive impacts; grey arrow represents gross negative impacts.
2. Some minor processes may not be shown in the diagram. This is because their impact indicator
values are smaller than the cut-off level set in the software SimaPro 7.1.6. However, their impact
contribution is still accounted for in the impact calculation.

Chapter 7-Life Cycle Assessment of Rice Husk Utilization
222
Figure 7.17 Process network of cellulosic ethanol system showing impact on climate
change
Note: 1. Black arrow represents gross positive impacts; grey arrow represents gross negative impacts.
2. Some minor processes may not be shown in the diagram. This is because their impact indicator
values are smaller than the cut-off level set in the software SimaPro 7.1.6. However, their impact
contribution is still accounted for in the impact calculation.

Chapter 7-Life Cycle Assessment of Rice Husk Utilization
223
Figure 7.18 Process network of cellulosic ethanol system showing impact on
freshwater ecotoxicity
Note: 1. Black arrow represents gross positive impacts; grey arrow represents gross negative impacts.
2. Some minor processes may not be shown in the diagram. This is because their impact indicator
values are smaller than the cut-off level set in the software SimaPro 7.1.6. However, their impact
contribution is still accounted for in the impact calculation.

Chapter 7-Life Cycle Assessment of Rice Husk Utilization
224
Figure 7.19 Process network of cellulosic ethanol system showing impact on
terrestrial acidification
Note: 1. Black arrow represents gross positive impacts; grey arrow represents gross negative impacts.
2. Some minor processes may not be shown in the diagram. This is because their impact indicator
values are smaller than the cut-off level set in the software SimaPro 7.1.6. However, their impact
contribution is still accounted for in the impact calculation.

Chapter 7-Life Cycle Assessment of Rice Husk Utilization
225
Figure 7.20 Process network of cellulosic ethanol system showing impact on marine
eutrophication
Note: 1. Black arrow represents gross positive impacts; grey arrow represents gross negative impacts.
2. Some minor processes may not be shown in the diagram. This is because their impact indicator
values are smaller than the cut-off level set in the software SimaPro 7.1.6. However, their impact
contribution is still accounted for in the impact calculation.

Chapter 7-Life Cycle Assessment of Rice Husk Utilization
226
Figure 7.21 Process network of cellulosic ethanol system showing impact on human
toxicity
Note: 1. Black arrow represents gross positive impacts; grey arrow represents gross negative impacts.
2. Some minor processes may not be shown in the diagram. This is because their impact indicator
values are smaller than the cut-off level set in the software SimaPro 7.1.6. However, their impact
contribution is still accounted for in the impact calculation.

Chapter 7-Life Cycle Assessment of Rice Husk Utilization
227
Figure 7.22 Process network of cellulosic ethanol system showing impact on
photochemical oxidant formation
Note: 1. Black arrow represents gross positive impacts; grey arrow represents gross negative impacts.
2. Some minor processes may not be shown in the diagram. This is because their impact indicator
values are smaller than the cut-off level set in the software SimaPro 7.1.6. However, their impact
contribution is still accounted for in the impact calculation.

Chapter 7-Life Cycle Assessment of Rice Husk Utilization
228
Figure 7.23 Process network of cellulosic ethanol system showing impact on
particulate matter formation
Note: 1. Black arrow represents gross positive impacts; grey arrow represents gross negative impacts.
2. Some minor processes may not be shown in the diagram. This is because their impact indicator
values are smaller than the cut-off level set in the software SimaPro 7.1.6. However, their impact
contribution is still accounted for in the impact calculation.

Chapter 7-Life Cycle Assessment of Rice Husk Utilization
229
Figure 7.24 Process network of cellulosic ethanol system showing impact on
terrestrial ecotoxicity
Note: 1. Black arrow represents gross positive impacts; grey arrow represents gross negative impacts.
2. Some minor processes may not be shown in the diagram. This is because their impact indicator
values are smaller than the cut-off level set in the software SimaPro 7.1.6. However, their impact
contribution is still accounted for in the impact calculation.

Chapter 7-Life Cycle Assessment of Rice Husk Utilization
230
Figure 7.25 Process network of cellulosic ethanol system showing impact on marine
ecotoxicity
Note: 1. Black arrow represents gross positive impacts; grey arrow represents gross negative impacts.
2. Some minor processes may not be shown in the diagram. This is because their impact indicator
values are smaller than the cut-off level set in the software SimaPro 7.1.6. However, their impact
contribution is still accounted for in the impact calculation.

Chapter 7-Life Cycle Assessment of Rice Husk Utilization
231
As mentioned in the beginning of this section, in the cellulosic ethanol system, if the
overall result (shown in the top box of each process network diagram) is negative, it
indicates that the vehicle operation using petrol (grey arrow) contributes more impact
than that using E10 (with cellulosic ethanol from rice husk). Conversely, if the result is
positive, it implies that the vehicle operation using E10 from rice husk (black arrow)
causes more impact than that using petrol. From the above process network diagrams of
the cellulosic ethanol system, the overall impact indicator values for fossil fuel
depletion, climate change and freshwater ecotoxicity categories are negative. This
implies that the vehicle operation using E10 from rice husk causes less impact than the
conventional system (petrol system) on these impact categories. The overall impact
indicator values for terrestrial acidification, marine eutrophication, human toxicity,
photochemical oxidant formation, particulate matter formation, terrestrial and marine
ecotoxicity are positive. This means that the vehicle operation using E10 from rice husk
causes higher impact on these impact categories than the use of petrol only.
From the network diagrams of the cellulosic ethanol option shown above, the main
process impacting fossil fuel depletion and freshwater ecotoxicity in the cellulosic
ethanol system is the production process of petrol. Petrol is used in both the cellulosic
ethanol and the petrol system. In the use phase of cellulosic ethanol, it is necessary to
blend petrol with ethanol to make E10. This E10 will then be used in petrol engine based
vehicles. However, the amount of the petrol used in the cellulosic ethanol system is less
than that used in the petrol system, as ethanol is used to substitute for some amount of
the petrol in order to make E10. This implies that the impacts on fossil fuel depletion,
and freshwater ecotoxicity that are reduced by using E10 from rice husk in vehicle
operation are equal to the impacts caused by producing the amount of the petrol replaced
by cellulosic ethanol from rice husk in the production of E10.
The cellulosic ethanol option can help to reduce fossil fuel depletion because when
petrol is substituted by E10, this means the amount of crude oil to produce petrol can
also be saved. In addition, freshwater ecotoxicity which is caused by Beryllium, Nickel,

Chapter 7-Life Cycle Assessment of Rice Husk Utilization
232
Selenium, Copper and Chorine containing in water discharged to rivers from crude oil
production can be reduced by using less amount of petrol.
For the climate change category, the network diagram (see Figure 7.17) shows that the
production process of the cellulosic ethanol causes more greenhouse gasses than the
petrol production process does. This is because the cellulosic ethanol production
requires various inputs and the production processes of these inputs contribute some
amount of greenhouse gases to the production process of the cellulosic ethanol.
However, when considering the use phase of ethanol and petrol product (vehicle
operation), the vehicle using E10 (10 percent ethanol blended with 90 percent petrol)
releases less greenhouse gas emissions than the vehicle using petrol. Moreover, the
amount of greenhouse gases emitted when operating a vehicle is a lot larger than the
amount of greenhouse gases released from the production process of the fuels (E10 and
petrol). Therefore, the use of E10 shows benefits over the use of petrol in vehicles. This
implies that the amount of greenhouse gases reduced when E10 (10 percent ethanol
blended with 90 percent petrol) is used to replace petrol in vehicles can offset the
greenhouse gas emissions released from the production process of cellulosic ethanol.
The main substances contributing to climate change are Carbon dioxide and Methane.
The network diagrams of the cellulosic ethanol option showing the impacts on terrestrial
acidification, marine eutrophication, human toxicity, photochemical oxidant formation,
particulate matter formation, terrestrial and marine ecotoxicity (see Figures 7.19 to 7.25)
show that the cellulosic ethanol system causes more impacts than the petrol system (the
overall results for these impact categories are positive). With regard to terrestrial
acidification, marine eutrophication, photochemical oxidant formation and particulate
matter formation, the production of sulphuric acid is the main contributor to these
impact categories. Sulfur dioxide, Nitrogen oxides and Ammonia are the main
stubstances contributing to terrestrial acidification. Nitrogen oxides, Ammonia and
Nitrogen contributing to marine eutrophication. Photochemical oxidant formation is
caused by Nitrogen oxides and Sulfur dioxide. While, the main substances contributing
to particulate matter formation are Sulfur dioxide, Nitrogen oxides, particulates and

Chapter 7-Life Cycle Assessment of Rice Husk Utilization
233
Ammonia. These emissions are mainly released from the production of sulphuric acid
(where the fossil fuels are burned in the distillery process) used in the cellulosic ethanol
production. This sulphuric acid is one of the main raw materials used in the ethanol
production, but is not used in petrol production. It should be noted that making cellulosic
ethanol from rice husk requires more sulphuric acid compared to other lignocellulosic
material such as wood (Jungbluth et al. 2007; Saha et al. 2005).
Moreover, the exhaust emitted from vehicles using E10 contains more SO2 and PM10
than the emissions from vehicles using petrol. Therefore, the use of E10 (with ethanol
produced from rice husk) causes more impacts on terrestrial acidification and particulate
matter formation. The impact on human toxicity comes mainly from the production of
the cellulosic ethanol itself. The main substances contributing to human toxicity are
Phosphorus, Manganese, Vanadium, Lead, Zinc, Mercury, Cadmium and Barium. This
may result from the process of burning solid residues left from ethanol distillery (to
produce heat and electricity for use in the ethanol plants and then sell the surplus amount
to the grid).
d) Electricity system
For the electricity option, based on the LCA results presented in Figure 7.9, the impact
categories chosen for the process contribution analysis are climate change, human
toxicity, freshwater ecotoxicity, marine ecotoxicity, fossil fuel depletion, terrestrial
acidification and particulate matter formation (see Figures 7.26 to 7.32). It is noted that
the impact indicator value of the rice husk ash disposal process is always negative as
discussed earlier in this section. This is because the LCI modelling of the rice husk ash
disposal in the electricity system was set up by avoiding the amount of the competing
products (which are replaced by rice husk ash in different applications). The negative
result (grey arrow) of the rice husk ash disposal process implies that the rice husk ash
disposal process compliments the reduction of the impacts by displacing the electricity
produced from the Thai grid mix by rice husk based electricity production. This is
because the rice husk ash disposal process provides environmental credit to the

Chapter 7-Life Cycle Assessment of Rice Husk Utilization
234
electricity system by saving some amount of the competing product that is substituted by
rice husk ash.
Figure 7.26 Process network of electricity system showing impact on climate change
Note: 1. Black arrow represents gross positive impacts; grey arrow represents gross negative impacts.
2. The energy unit shown in this diagram is MJ as it is the base energy unit set for network
diagram in SimaPro version 7.1.6.
3. 3.31 × 10⁶ MJ = 919 MWh (the functional unit for the electricity production system shown in
Figure 7.1).
4. Some minor processes may not be shown in the diagram. This is because their impact indicator
values are smaller than the cut-off level set in the software SimaPro 7.1.6. However, their impact
contribution is still accounted for in the impact calculation.

Chapter 7-Life Cycle Assessment of Rice Husk Utilization
235
Figure 7.27 Process network of electricity system showing impact on human toxicity
Note: 1. Black arrow represents gross positive impacts; grey arrow represents gross negative impacts.
2. The energy unit shown in this diagram is MJ as it is the base energy unit set for network
diagram in SimaPro version 7.1.6.
3. 3.31 × 10⁶ MJ = 919 MWh (the functional unit for the electricity production system shown in
Figure 7.1).
4. Some minor processes may not be shown in the diagram. This is because their impact indicator
values are smaller than the cut-off level set in the software SimaPro 7.1.6. However, their impact
contribution is still accounted for in the impact calculation.

Chapter 7-Life Cycle Assessment of Rice Husk Utilization
236
Figure 7.28 Process network of electricity system showing impact on freshwater
ecotoxicity
Note: 1. Black arrow represents gross positive impacts; grey arrow represents gross negative impacts.
2. The energy unit shown in this diagram is MJ as it is the base energy unit set for network
diagram in SimaPro version 7.1.6.
3. 3.31 × 10⁶ MJ = 919 MWh (the functional unit for the electricity production system shown in
Figure 7.1).
4. Some minor processes may not be shown in the diagram. This is because their impact indicator
values are smaller than the cut-off level set in the software SimaPro 7.1.6. However, their impact
contribution is still accounted for in the impact calculation.

Chapter 7-Life Cycle Assessment of Rice Husk Utilization
237
Figure 7.29 Process network of electricity system showing impact on marine
ecotoxicity
Note: 1. Black arrow represents gross positive impacts; grey arrow represents gross negative impacts.
2. The energy unit shown in this diagram is MJ as it is the base energy unit set for network
diagram in SimaPro version 7.1.6.
3. 3.31 × 10⁶ MJ = 919 MWh (the functional unit for the electricity production system shown in
Figure 7.1).
4. Some minor processes may not be shown in the diagram. This is because their impact indicator
values are smaller than the cut-off level set in the software SimaPro 7.1.6. However, their impact
contribution is still accounted for in the impact calculation.

Chapter 7-Life Cycle Assessment of Rice Husk Utilization
238
Figure 7.30 Process network of electricity system showing impact on fossil fuel
depletion
Note: 1. Black arrow represents gross positive impacts; grey arrow represents gross negative impacts.
2. The energy unit shown in this diagram is MJ as it is the base energy unit set for network
diagram in SimaPro version 7.1.6.
3. 3.31 × 10⁶ MJ = 919 MWh (the functional unit for the electricity production system shown in
Figure 7.1).
4. Some minor processes may not be shown in the diagram. This is because their impact indicator
values are smaller than the cut-off level set in the software SimaPro 7.1.6. However, their impact
contribution is still accounted for in the impact calculation.

Chapter 7-Life Cycle Assessment of Rice Husk Utilization
239
Figure 7.31 Process network of electricity system showing impact on terrestrial
acidification
Note: 1. Black arrow represents gross positive impacts; grey arrow represents gross negative impacts.
2. The energy unit shown in this diagram is MJ as it is the base energy unit set for network
diagram in SimaPro version 7.1.6.
3. 3.31 × 10⁶ MJ = 919 MWh (the functional unit for the electricity production system shown in
Figure 7.1).
4. Some minor processes may not be shown in the diagram. This is because their impact indicator
values are smaller than the cut-off level set in the software SimaPro 7.1.6. However, their impact
contribution is still accounted for in the impact calculation.

Chapter 7-Life Cycle Assessment of Rice Husk Utilization
240
Figure 7.32 Process network of electricity system showing impact on particulate
matter formation
Note: 1. Black arrow represents gross positive impacts; grey arrow represents gross negative impacts.
2. The energy unit shown in this diagram is MJ as it is the base energy unit set for network
diagram in SimaPro version 7.1.6.
3. 3.31 × 10⁶ MJ = 919 MWh (the functional unit for the electricity production system shown in
Figure 7.1).

Chapter 7-Life Cycle Assessment of Rice Husk Utilization
241
4. Some minor processes may not be shown in the diagram. This is because their impact indicator
values are smaller than the cut-off level set in the software SimaPro 7.1.6. However, their impact
contribution is still accounted for in the impact calculation.
With regard to climate change and fossil fuel depletion (see Figures 7.26 and 7.30), the
rice husk based electricity option shows benefits over the Thai grid (overall results are
negative). This results from the environmental credits gained when rice husk based
electricity production displaces the production of the Thai grid. Thai grid mix production
comprises of a large proportion of electricity produced from natural gas (about 70%) and
coal (about 20%) (Energy Policy and Planning Office (EPPO) 2009b). This means that
using rice husk to generate electricity can help to reduce the consumption of natural gas
and coal in Thai grid production. This would consequently help to reduce the
greenhouse gases released by burning natural gas and coal in the electricity production.
The main greenhouse gases released by the Thai grid production are Carbon dioxide and
Methane. Moreover, the use of the ash which is the co-product in rice husk power plant
to substitute for some amount of Portland cement in the production of lightweight
concrete block, provides the environmental credits to the electricity option. The
substitution of rice husk ash for cement helps to reduce the consumption of fossil fuels
and to reduce greenhouse gas emissions caused by producing the amount of Portland
cement replaced of rice husk ash in the production of lightweight concrete block.
Rice husk based electricity production causes fewer impacts on human toxicity,
freshwater and marine ecotoxicity categories than the Thai grid production does (see
Figures 7.27, 7.28 and 7.29). This is because of the environmental credits gained from
replacing some Portland cement with rice husk ash (co-product in electricity production)
in concrete block production. This means that the electricity option can help to reduce
impacts on human toxicity, freshwater and marine ecotoxicity caused by producing the
amount of Portland cement replaced by rice husk ash as discussed above. The main
substances contributing to human toxicity are Barium, Mercury and Beryllium. While,
Barium is the main contributor to freshwater and marine ecotoxicity.

Chapter 7-Life Cycle Assessment of Rice Husk Utilization
242
Figure 7.31 and 7.32 show that rice husk based electricity production causes greater
impacts on terrestrial acidification and particulate matter formation than the Thai grid
mix production does. Sulfur dioxide and Nitrogen oxides are the main contributor to
terrestrial acidification. While, particulates, Sulfur dioxide and Nitrogen oxides are the
main substances contributing to particulate matter formation. The impacts on these two
impact categories come mainly from the production process of the rice husk based
electricity itself. This is because a rice husk power plant releases more SO2 and PM10
than the Thai grid production. Table 7.7 compares the total suspended particulate (TSP)
and SO2 emissions released from the Thai rice husk power plant, the natural gas-fired
power plant and the coal-fired power plant. This makes it clear that the rice husk power
plant releases more particulate matters than the natural gas and coal based power plants.
The rice husk power plant produces less SO2 than the coal-fired power plant does.
However, it releases a lot more SO2 than the natural gas-fired power plant. The Thai grid
comprises a majority share of electricity produced from natural gas (approximately 70
%) and coal (approximately 20 %). Therefore, the rice husk power plant causes higher
SO2 than the Thai grid production.
Table 7.7 Total suspended particulate (TSP) and SO2 emissions of rice husk power
plant and conventional power plants
Power plant type Unit TSP SO2
Rice husk kg/MWh 0.08 0.32
Coal kg/MWh 0.037 2.77
Natural gas kg/MWh 0.036 0.0003
Sources: Chungsangunsit et al. (2004).
Note: Data on the emissions of conventional power plants are for year 2001.
Emissions of rice husk power plant were collected from the Roi Et Green rice
husk power plant (data of year 2004).
TSP = total suspended particulate

Chapter 7-Life Cycle Assessment of Rice Husk Utilization
243
7.5.3 Sensitivity analysis
a) Impact assessment methods
The sensitivity of the LCA results to the impact assessment methods used were assessed
by using different impact methods to analyse the results and by comparing the
differences between the results produced by these different methods. The impact
assessment methods used for the sensitivity analysis were Impact 2002+ (Jolliet et al.
2003) and Eco-indicator 99 with hierarchist (H) perspective (Goedkoop & Spriensma
2001). They were used in the way that they were set up in SimaPro version 7.1.6. The
results obtained from these two methods were compared to the results analysed by using
ReCiPe 2008 with hierarchist (H) perspective (these results are presented in the previous
section in Figure 7.9).
Table 7.8 compares the midpoint impact categories and units used in the ReCiPe 2008,
Impact 2002+ and Eco-indicator 99 methods. In general, it shows that most impact
categories are comparable, though some impact categories are given different names in
different methods. For example, the ‘climate change’ impact category in ReCiPe 2008
and Eco-indicator 99 are called ‘global warming’ in Impact 2002+. ‘Human toxicity’ in
ReCiPe 2008 (Goedkoop et al. 2009) is classified as ‘carcinogens and non-carcinogens’
in Impact 2002+ (Jolliet et al. 2003) and as ‘carcinogens’ in Eco-indicator 99 (Goedkoop
& Spriensma 2001). Photochemical oxidant formation in ReCiPe 2008 is named
‘respiratory organics’ in Impact 2002+ and indicator 99. ‘Particulate matter formation’
in ReCiPe 2008 is called ‘Respiratory inorganics’ in Impact 2002+ and in Eco-indicator
99.

Chapter 7-Life Cycle Assessment of Rice Husk Utilization
244
Table 7.8 Comparison of mid point impact categories and units between different methods used
ReCiPe 20081 Impact 2002+
2 Eco-indicator 99
3
Impact category Unit Impact category Unit Impact category Unit
Climate change kg CO2 eq Global warming kg CO2 Climate change DALY
Ozone depletion kg CFC-11 eq Ozone layer depletion kg CFC-11 Ozone layer DALY
Terrestrial acidification/nutrification
kg SO2 Terrestrial acidification kg SO2 eq
Aquatic acidification kg SO2
Freshwater eutrophication kg P eq
Marine eutrophication kg N eq Aquatic eutrophication kg PO4
3-
Acidification/ Eutrophication
PDF×m2yr
Carcinogens kg C2H3Cl Human toxicity kg 1,4DCB eq
Non-Carcinogens kg C2H3Cl Carcinogens DALY
Photochemical oxidant formation
kg NMVOC eq Respiratory organics kg ethylene Respiratory organics DALY
Particulate matter formation kg PM10 eq Respiratory inorganics kg PM2.5 Respiratory inorganics DALY
Terrestrial ecotoxicity kg 1,4-DCB eq Terrestrial ecotoxicity kg TEG soil
Freshwater ecotoxicity kg 1,4-DCB eq
Marine ecotoxicity kg 1,4-DCB eq Aquatic ecotoxicity kg TEG water
Ecotoxicity PAF×m2yr
Ionising radiation kg U235 eq Ionizing radiation Bq C-14 Radiation DALY
Agricultural land occupation m2
Urban land occupation m2
Natural land transformation m2
Land occupation m2org.arable Land use PDF×m2yr
Water depletion m3
Metal depletion kg Fe eq Mineral extraction MJ surplus Minerals MJ
surplus
Fossil fuel depletion kg oil eq Non-renewable energy MJ primary Fossil fuels MJ
surplus
Source: 1 from Goedkoop et al. (2009)
2 from Jolliet et al. (2003)
3 from Goedkoop & Spriensma (2001)

Chapter 7-Life Cycle Assessment of Rice Husk Utilization
245
Note: See notes under table 7.4 for the explanations of some of the abbreviations of the impact category units for ReCiPe
2008 method.
C2H3Cl = Chloroethylene
Bq (Becquerel) is the unit of the activity concentrations of C-14, 1 Bq = 1 decay per second.
CFC-11 = Chlorofluorocarbon
PM 2.5 represents particulate matters of less than 2.5 micrometers.
TEG water = Triethylene glycol released into water
TEG soil = Triethylene glycol released into soil m2org.arable = m2 organic arable land×year
PO4 3- = phosphate
MJ primary = the energy content of fossil fuels, calculated based on upper heating values
MJ surplus = the additional energy required for further extraction of the resources in the future
DALY = Disability-Adjusted Life Years
PAF = Potentially Affected Fraction (of species)
PDF = Potentially Disappeared Fraction (of species)
MJ surplus = the additional energy required for further extraction of the resources in the future

Chapter 7-Life Cycle Assessment of Rice Husk Utilization
246
Table 7.8 is structured on the similarities of the impact categories across all methods
used (ReCiPe 2008, Impact 2002+ and Eco-indicator 99). However, it is obvious that
across different methods, most of the comparable impact categories have different
units. This is because different methods use different impact indicators (for
comparable impact categories) and therefore, their results have different units.
Although a few comparable impact categories (across all methods used) have the
same units, the characterized impacts analysed from these methods may still be
different as the characterization factors used and the number of LCI results covered
by these methods, are different. For example, the characterized result for terrestrial
acidification for the electricity option analysed by ReCiPe 2008 is positive value,
while the characterized result for terrestrial acidification/nutrification analysed by
Impact 2002+ is negative value. Although the characterized results for these two
impact categories have the same unit (kg SO2 eq), the characterization factors used
and substances accounted for in these two impact categories (analysed by different
methods) are different. In the category terrestrial acidification (analysed by ReCiPe
2008) the substances that are accounted for are Ammonia, Nitrogen oxides and
Sulfur dioxide. Whereas, in the category terrestrial acidification/nutrification
(analysed by Impact 2002+) the substances that are accounted for are Ammonia,
Nitric oxide, Nitrogen dioxide, Nitrogen oxides and Sulfur dioxide, Sulfur oxides
and Sulfur trioxide. Moreover, the characterization factors for the same substances
are given differently in these different impact methods. Hence, the characterized
results analysed by these different methods can give discrepancy results even if they
have the same unit (kg SO2 eq).
Moreover, the normalization factors used in these methods vary. The normalization
factors (used in this study) in ReCiPe 2008 are based on world population, while the
factors in Impact 2002+ and Eco-indicator 99 are based on western European and
European population respectively (Goedkoop et al. 2009; Goedkoop & Spriensma
2001; Jolliet et al. 2003). These certainly result in different normalized results
obtained from these methods. Accordingly, the differences in the results analysed by
these different methods will be taken into consideration in the interpretation of the
LCA results.

Chapter 7-Life Cycle Assessment of Rice Husk Utilization
247
The characterized results obtained from the Impact 2002+ and Eco-indicator 99 (H)
methods and are shown in Tables 7.9 and 7.10. The normalized results from these
two methods are presented in Figures 7.33 and 7.34. These show that the results of
the three different methods, ReCiPe 2008 (H), Impact 2002+ and Eco-indicator 99
(H), are different. This is because different methods use different impact indicators,
characterization factors and normalization factors. The units of the characterized
results analysed from these different methods are defined differently. The normalized
results from these three different methods are the same (person×year); however, the
normalization factors for each method are different. To compare the results analysed
by different methods, the normalized impacts (Figures 7.9, 7.33 and 7.34) are taken
into consideration as these are all in the same unit (person×year).
Table 7.9 Characterized impacts reduced by processing 1,000 tonnes of rice husk
in different use systems (analysed by IMPACT 2002+, V2.02 / IMPACT 2002+ /
characterization)
Impact category Unit Cement
option
Electricity
option
Ethanol
option
Global warming kg CO2 -1.35E+06 -9.37E+05 -2.42E+05
Ozone layer depletion kg CFC-11 -1.60E-07 -1.85E-04 -5.50E-02
Terrestrial acid/nutri kg SO2 -4.85E+01 -2.73E+02 7.65E+03
Aquatic acidification kg SO2 2.39E+01 -6.57E+02 2.29E+03
Aquatic eutrophication kg PO4 3- -8.59E-05 -2.32E-01 1.87E+00
Carcinogens kg C2H3Cl -9.68E-01 -3.57E+02 -6.60E+01
Non-Carcinogens kg C2H3Cl 3.64E+01 -1.87E+03 1.10E+03
Respiratory organics kg ethylene -1.36E+01 -2.45E+02 -1.42E+02
Respiratory inorganics kg PM2.5 2.17E+01 2.95E+02 2.67E+02
Terrestrial ecotoxicity kg TEG soil 2.01E+04 3.90E+05 2.01E+06
Aquatic ecotoxicity kg TEG water 2.22E+04 -1.30E+07 6.90E+06
Ionizing radiation Bq C-14 -1.54E+00 -4.03E+03 -1.25E+05
Land occupation m2org.arable 2.45E+01 -1.35E+02 1.83E+00
Mineral extraction MJ surplus 2.31E+04 -2.35E+00 -1.32E+00
Non-renewable energy MJ primary -1.37E+07 -1.28E+07 -3.67E+06
Note: The functional unit of each rice husk use system is defined in Figure 7.1.
See notes under table 7.8 for the explanations of the units of the impact
categories in this table.

Chapter 7-Life Cycle Assessment of Rice Husk Utilization
248
-160
-140
-120
-100
-80
-60
-40
-20
20
40
Glo
ba
l w
arm
ing
Ozo
ne
lay
er
dep
leti
on
Te
rres
tria
l ac
id/n
utr
i
Aq
uat
ic a
cid
ific
ati
on
Aq
uat
ic e
utr
op
hic
ati
on
Ca
rcin
og
ens
No
n-C
arc
ino
gen
s
Re
spir
ato
ry o
rga
nic
s
Re
spir
ato
ry i
no
rga
nic
s
Ter
rest
ria
l e
coto
xic
ity
Aq
ua
tic
eco
tox
icit
y
Ion
izin
g r
ad
iati
on
La
nd
occ
up
ati
on
Min
era
l ex
trac
tio
n
No
n-r
en
ew
able
en
erg
y
pe
rso
n*
ye
ar
Cement
Electricity
Ethanol
Figure 7.33 Normalized impacts reduced by processing 1,000 tonnes of rice husk
in different use systems (analysed by IMPACT 2002+, V2.02 / IMPACT 2002+ /
normalization)
Note: The functional unit of each rice husk use system is defined in Figure 7.1.

Chapter 7-Life Cycle Assessment of Rice Husk Utilization
249
Table 7.10 Characterized impacts reduced by processing 1,000 tonnes of rice
husk in different use systems (analysed by Eco-indicator 99 (H), V2.03 / Europe
EI 99 H/A characterization)
Impact category Unit Cement
option
Electricity
option
Ethanol
option
Climate change DALY -2.89E-01 -1.99E-01 -4.94E-02
Ozone layer DALY -1.68E-10 -1.88E-07 -5.82E-05
Acidification/ Eutrophication PDF×m2yr -5.05E+01 -2.84E+02 8.50E+03
Carcinogens DALY 7.38E-06 -3.83E-04 1.08E-03
Resp. organics DALY -2.97E-05 -5.22E-04 -2.88E-04
Resp. inorganics DALY 1.52E-02 2.07E-01 2.16E-01
Ecotoxicity PAF×m2yr 2.72E+02 -3.95E+02 4.56E+04
Radiation DALY -3.08E-10 -8.07E-07 -2.53E-05
Land use PDF×m2yr -1.52E+01 1.84E+00 6.07E-01
Minerals MJ surplus 2.31E+04 -2.35E+00 -1.32E+00
Fossil fuels MJ surplus -1.27E+05 -1.55E+06 -5.05E+05
Note: The functional unit of each rice husk use system is defined in Figure 7.1.
See notes under table 7.8 for the explanations of the units of the impact
categories in this table.

Chapter 7-Life Cycle Assessment of Rice Husk Utilization
250
-200
-150
-100
-50
50
Cli
mat
e ch
ang
e
Ozo
ne
lay
er
Aci
dif
icati
on
/
Eu
tro
ph
icat
ion
Car
cin
og
ens
Resp
. o
rgan
ics
Res
p.
ino
rgan
ics
Eco
tox
icit
y
Rad
iati
on
Lan
d u
se
Min
era
ls
Fo
ssil
fu
els
per
son
*y
ear
Cement
Electricity
Ethanol
Figure 7.34 Normalized impacts reduced by processing 1,000 tonnes of rice husk
in different use systems (analysed by Eco-indicator 99 (H), V2.03 / Europe EI 99
H/A normalization)
Note: The functional unit of each rice husk use system is defined in Figure 7.1.
The results of the three different methods (ReCiPe 2008 (H), Impact 2002+ and Eco-
indicator 99 (H)) show that there are some similarities between the results of some
impact categories in these three different methods. The results of impacts on fossil
fuel depletion (in ReCiPe 2008) (expressed as non-renewable energy in Impact
2002+ and as fossil fuels in Eco-indicator 99) dominate the overall results obtained
from all methods. This is followed by the impacts on climate change (expressed as
global warming in Impact 2002+ and as climate change in Eco-indicator 99) and the
impacts on particulate matter formation (expressed as respiratory inorganics in
Impact 2002+ and Eco-indicator 99). Therefore, the results of these impact
categories, fossil fuel depletion, climate change and particulate matter formation will
be taken into consideration in the discussion (section 8.2).
Compared to the Impact 2002+ and Eco-indicator 99 methods, the ReCiPe 2008
method gives noticeably different results for some impact categories such as

Chapter 7-Life Cycle Assessment of Rice Husk Utilization
251
terrestrial acidification, marine eutrophication, human toxicity, photochemical
oxidant formation, metal depletion, terrestrial, freshwater and marine ecotoxicity.
This may have resulted from the development of a newer method (ReCiPe 2008)
which may have covered more LCI results than the other two methods.
Although the indicator values of the results in the same impact indicator across
different impact methods vary (as discussed before that different methods use
different characterization and normalization factors), the trends of the results
regarding climate change obtained from all methods used (ReCiPe 2008 (H), Impact
2002+ and Eco-indicator 99 (H)) are the same. This means that the results from all
methods used show that the cement production option has the largest effect (across
all rice husk use options) in reducing greenhouse gases.
Similarly, the trends of the results regarding the impact on particulate matter
formation from different impact assessment methods are the same. The results from
all methods show that the electricity production option is the worst option across the
three different rice husk use systems, as it has the greatest effect on particulate matter
formation than the other two rice husk use options (cement and cellulosic ethanol). It
is noted that Eco-indicator 99 (H) method reports that the impact on this impact
category caused by electricity option and cellulosic ethanol option are about the
same, and are higher of that of cement option. However, the results for this impact
category (particulate matter formation) are not significant when considering the
overall normalized results across different impact categories (in all methods used).
There are some similarities and differences in the results regarding fossil fuel
depletion analysed by ReCiPe 2008 (H), Impact 2002+ and Eco-indicator 99 (H). In
all methods, the most preferable option with regards to fossil fuel depletion is the
cement option. The trends of the results from ReCiPe 2008 (H), Impact 2002+
methods are the same. The cement option has the largest effect (across all rice husk
use options) in reducing fossil fuel depletion, followed by the electricity option and
the cellulosic ethanol option. However, the results from the Eco-indicator 99 (H)
method show that the electricity option is the best option for reducing fossil fuel
depletion, followed by cellulosic ethanol option and cement option respectively.

Chapter 7-Life Cycle Assessment of Rice Husk Utilization
252
Clearly, this is due to the different impact indicators used in the calculation of the
impact on fossil fuel depletion in these three methods (ReCiPe 2008 (H), Impact
2002+ and Eco-indicator 99 (H)) (discussed in more details in section 8.2).
b) Transportation distance for cellulosic ethanol system
The sensitivity of the LCA results that were affected by the assumption made for the
transportation distance for the cellulosic ethanol system (the distance of
transportation of rice husk from rice mill to ethanol plant), was also tested. The
original assumption made was 200 km (the results are shown in Figure 7.35). To
compare the overall results with the different transportation distances (of the rice
husk from rice mill to ethanol plant), the normalized results are used as all
normalized results have the same unit (person×year) and therefore allow for the
comparison of different impact categories. The normalized results obtained when the
distance are 500 km, 1,000 km and 2,000 km are shown in Figures 7.36, 7.37 and
7.38.

Chapter 7-Life Cycle Assessment of Rice Husk Utilization
253
-300
-250
-200
-150
-100
-50
50
100
150
200
250
clim
ate
chan
ge
ozo
ne
dep
leti
on
terr
estr
ial
acid
ific
atio
n
fres
hw
ater
eutr
op
hic
atio
n
mar
ine
eutr
op
hic
atio
n
hu
man
to
xic
ity
ph
oto
chem
ical
ox
idan
t fo
rmat
ion
par
ticu
late
mat
ter
form
atio
n
terr
estr
ial
eco
tox
icit
y
fres
hw
ater
eco
tox
icit
y
mar
ine
eco
tox
icit
y
ion
isin
g r
adia
tio
n
agri
cult
ura
l la
nd
occ
up
atio
n
urb
an l
and
occ
up
atio
n
nat
ura
l la
nd
tran
sfo
rmat
ion
wat
er d
eple
tio
n
met
al d
eple
tio
n
foss
il d
eple
tio
n
per
son
*y
ear
Cement
Electricity
Ethanol
Figure 7.35 Normalized impacts reduced by processing 1,000 tonnes of rice husk
in different use systems (with 200 km transportation distance) (analysed by
Recipe Midpoint (H) V1.01 / World Recipe H / normalization)
Note: The functional unit of each rice husk use system is defined in Figure 7.1.
These are the same results shown in Figure 7.9.

Chapter 7-Life Cycle Assessment of Rice Husk Utilization
254
-300
-250
-200
-150
-100
-50
50
100
150
200
250
clim
ate
chan
ge
ozo
ne
dep
leti
on
terr
estr
ial
acid
ific
atio
n
fres
hw
ater
eutr
op
hic
atio
n
mar
ine
eutr
op
hic
atio
n
hu
man
to
xic
ity
ph
oto
chem
ical
ox
idan
t
form
atio
n
par
ticu
late
mat
ter
form
atio
n
terr
estr
ial
eco
tox
icit
y
fres
hw
ater
eco
tox
icit
y
mar
ine
eco
tox
icit
y
ion
isin
g r
adia
tio
n
agri
cult
ura
l la
nd
occ
up
atio
n
urb
an l
and
occ
up
atio
n
nat
ura
l la
nd
tran
sfo
rmat
ion
wat
er d
eple
tio
n
met
al d
eple
tio
n
foss
il d
eple
tio
n
per
son
*y
ear
Cement
Electricity
Ethanol
Figure 7.36 Normalized impacts reduced by processing 1,000 tonnes of rice husk
in different use systems (with 500 km transportation distance) (analysed by
Recipe Midpoint (H) V1.01 / World Recipe H / normalization)
Note: The functional unit of each rice husk use system is defined in Figure 7.1.

Chapter 7-Life Cycle Assessment of Rice Husk Utilization
255
-300
-250
-200
-150
-100
-50
50
100
150
200
250
clim
ate
chan
ge
ozo
ne
dep
leti
on
terr
estr
ial
acid
ific
atio
n
fres
hw
ater
eutr
op
hic
atio
n
mar
ine
eutr
op
hic
atio
n
hu
man
to
xic
ity
ph
oto
chem
ical
ox
idan
t fo
rmat
ion
par
ticu
late
mat
ter
form
atio
n
terr
estr
ial
eco
tox
icit
y
fres
hw
ater
eco
tox
icit
y
mar
ine
eco
tox
icit
y
ion
isin
g r
adia
tio
n
agri
cult
ura
l la
nd
occ
up
atio
n
urb
an l
and
occ
up
atio
n
nat
ura
l la
nd
tran
sfo
rmat
ion
wat
er d
eple
tio
n
met
al d
eple
tio
n
foss
il d
eple
tio
n
per
son
*y
ear
Cement
Electricity
Ethanol
Figure 7.37 Normalized impacts reduced by processing 1,000 tonnes of rice husk
in different use systems (with 1,000 km transportation distance) (analysed by
Recipe Midpoint (H) V1.01 / World Recipe H / normalization)
Note: The functional unit of each rice husk use system is defined in Figure 7.1.

Chapter 7-Life Cycle Assessment of Rice Husk Utilization
256
-300
-250
-200
-150
-100
-50
50
100
150
200
250
clim
ate
chan
ge
ozo
ne
dep
leti
on
terr
estr
ial
acid
ific
atio
n
fres
hw
ater
eutr
op
hic
atio
n
mar
ine
eutr
op
hic
atio
n
hu
man
to
xic
ity
ph
oto
chem
ical
ox
idan
t fo
rmat
ion
par
ticu
late
mat
ter
form
atio
n
terr
estr
ial
eco
tox
icit
y
fres
hw
ater
eco
tox
icit
y
mar
ine
eco
tox
icit
y
ion
isin
g r
adia
tio
n
agri
cult
ura
l la
nd
occ
up
atio
n
urb
an l
and
occ
up
atio
n
nat
ura
l la
nd
tran
sfo
rmat
ion
wat
er d
eple
tio
n
met
al d
eple
tio
n
foss
il d
eple
tio
n
per
son
*y
ear Cement
Electricity
Ethanol
Figure 7.38 Normalized impacts reduced by processing 1,000 tonnes of rice husk
in different use systems (with 2,000 km transportation distance) (analysed by
Recipe Midpoint (H) V1.01 / World Recipe H / normalization)
Note: The functional unit of each rice husk use system is defined in Figure 7.1.
These show that the assumption made for the transportation distance (of rice husk
from rice mill to ethanol plant) for the cellulosic ethanol system has little effect on
the overall normalized results. The reduced impacts (in impact categories which
ethanol system show benefits over the petrol system) of using rice husk in the
cellulosic ethanol production are decreased when the transportation of rice husk from
rice mill to the ethanol plant is increased. In addition, the cellulosic ethanol option
causes a little more impacts on terrestrial acidification, particulate matter formation
and marine ecotoxicty when the distance of transportation is increased. This means
that the impact on these two impact categories is influenced by the emissions emitted
from the vehicles used for transportation.
However, the changes in the transportation distance of rice husk from rice mill to
ethanol plant have little influence on the overall results. When the distances are
changed to 500 km, 1,000 km and 2,000 km, the overall normalized results are
slightly different from the results when the transportation distance is assumed to be
Chapter 7-Life Cycle Assessment of Rice Husk Utilization
257
200 km (original results). However, the changes in the transportation distance of rice
husk from rice mill to ethanol plant do not affect a comparison across different rice
husk use systems. The trends of the results across all impact categories stay the same
when the transportation distance is changed. Therefore, the assumption made for the
distance of transportation of rice husk from rice mill to ethanol plant has no
significant effect on the overall normalized results.
7.5.4 Direction for the next chapter
The LCA results have been interpreted in this section. However, the conclusions of
the research will be drawn in the next chapter (see section 8.3). Broad contexts are
required to help in making conclusions for this research. Therefore, the interpretation
of the LCA results from this chapter will be reviewed in the context of the key issues
and the findings of the rice mill survey and interviews with involved industry
personnel (presented in Chapter 6) in section 8.2 before determining the conclusions
of this research in section 8.3.

Chapter 8-Discussion, Conclusions, and
Opportunity for Further Research
258
8 DISCUSSION, CONCLUSIONS, AND
OPPORTUNITIES FOR FURTHER RESEARCH
8.1 Discussion of the Results
The last two chapters (Chapters 6 and 7) reported the findings of this research. This
chapter opens with a discussion of the research results from these two chapters and
provides an overview of the anlaysis. This discussion takes into account all of the
findings in this thesis (Chapter 6 and Chapter 7) as well as the reviews on key issues
such as relevant Thai government energy policies, capacity of the production
systems, infrastructure availability and practicality of the rice husk use systems
investigated. In addition, the limitations of the research are stated before the research
conclusions are drawn. The chapter ends with suggesting opportunities for further
research.
The following sections discuss the results of each rice husk use systems investigated:
the electricity system, the cement system and the cellulosic ethanol system. To align
the discussion to the main goal of this research, which is to find out the most
environmentally friendly use of rice husk, the arguments discussed in each section
below are grouped into the categories of benefits and barriers. It is worthy to note
that the benefits and barriers of using rice husk in the three systems investigated as
discussed in the following sections, only take into account the issues which have
different effects on the different rice husk use systems examined in this study. The
benefits and barriers of different rice husk uses examined are used to help make a
comparison across the three rice husk use systems. Therefore, the benefits and
barriers of using rice husk compared with other materials in the particular
applications are not presented here (presented in section 6.4).
As stated in section 7.5.4, the LCA results from Chapter 7 will be reviewed in the
context of the key issues such as relative Thai government energy policies, capacity
Chapter 8-Discussion, Conclusions, and
Opportunity for Further Research
259
of the production systems, infrastructure availability and the practicality of the rice
husk use systems investigated as well as the findings of the rice mill survey
(described in section 6.2) and interviews with the relative industry personnel
(described in section 6.3). It is important to note that the LCA results have already
been discussed in the previous chapter (section 7.5), therefore, only the key points
from the interpretation of these will be further discussed in this section.
From the sensitivity analysis of the LCA results to the different impact methods
(ReCiPe 2008 (H), Impact 2002+ and Eco-indicator 99 (H)) (see section 7.5.3), it
was found that the results of impacts on fossil fuel depletion (in ReCiPe 2008)
(expressed as non-renewable energy in Impact 2002+ and as fossil fuels in Eco-
indicator 99) dominate the overall results (from all methods used). This is followed
by the impacts on climate change (expressed as global warming in Impact 2002+ and
as climate change in Eco-indicator 99). This implies that the results on these two
impact categories play significant roles in the overall results. Moreover, according to
the National Economic and Social Development Plans (NESDPs) (discussed in
section 3.5), the Thai government’s rationale for using biomass (such as rice husk) is
to help to reduce the consumption of fossil fuels and to decrease emissions caused by
using these fossil fuels. Hence, the results regarding fossil fuel depletion and climate
change will be taken into consideration in this section.
The results on particulate matter formation (expressed as respiratory inorganics in
Impact 2002+ and Eco-indicator 99) are noticeable in the overall results obtained
from the three methods. Therefore, the results on particulate matter formation will
also be taken into account in this section. It should be noted that the impact
categories considered in this section are those that show the compliant results across
the different impact assessment methods used (see results in the sensitivity analysis
(section 7.5.3)). For this reason, the impact categories with the results that did not
conform to the results obtained from other methods will not be discussed in this
section. For example, the ReCiPe 2008 method provides considerable results on
some impact categories such as terrestrial acidification, marine eutrophication,
human toxicity, photochemical oxidant formation, terrestrial ecotoxicity, freshwater
and marine ecotoxicty and metal depletion, while the Impact 2002+ method and Eco-

Chapter 8-Discussion, Conclusions, and
Opportunity for Further Research
260
indicator 99 do not. Hence, the results on the impact categories just mentioned will
not be taken into account in this section as they are not consistent across all methods
used.
8.2 Electricity production option
8.2.1 Benefits
a) Fossil fuel depletion mitigation
According to the results analysed by ReCiPe 2008 as presented in section 7.4.2,
using rice husk in the electricity generation system with the option of using the ash
(generated in the electricity production process) in light weight concrete block
production can help reduce fossil fuel depletion by noticeable amount, compared
with the other rice husk use options. The impact on fossil fuel depletion that is
reduced by using rice husk in the electricity production system is the second highest
(after cement option) across all rice husk use systems investigated.
However, the impacts on fossil fuel depletion of all rice husk use systems are highly
sensitive to the different impact assessment methods used (ReCiPe 2008, Impact
2002+, Eco-indicator 99 (hierarchist (H)). The ReCiPe 2008 and Impact 2002+
methods report that the cement production system is preferred over the electricity
production system and the cellulosic ethanol system, while the Eco-indicator 99 (H)
indicates that the electricity production option has benefit over the cement production
option and the cellulosic ethanol option (with regards to fossil fuel depletion).
The sensitivity of the results on fossil fuel depletion are influenced by the differences
in impact indicators used in the calculation of the impact on fossil fuel depletion in
the three different methods (ReCiPe 2008 (H), Impact 2002+ and Eco-indicator 99
(H)). The impact indicator in fossil fuel depletion analysed by the ReCiPe 2008 is
expressed as kg oil equivalent. The impact on fossil fuel depletion (non-renewable
energy) in Impact 2002+ method is reported as primary energy (MJ primary), which

Chapter 8-Discussion, Conclusions, and
Opportunity for Further Research
261
is the total energy content of fossil fuels (upper heating values). Whereas, in the Eco-
indicator 99 method, the result on fossil fuels depletion is characterized as surplus
energy (MJ surplus), which is the extra energy needed to extract fossil fuels in the
future.
The concept of surplus energy used in Eco-indicator 99 method is based on the
assumption that when fossil fuel quality is reduced, more effort is required to extract
the remaining fossil fuels. The reasoning behind is that with the market forces we
will usually extract the highest quality fossil fuels to produce the same quality of the
fuel products. This implies that the quality of the remaining fossil fuels declines
slightly when every kg of fossil fuels is used. Therefore, the extraction of the
remaining fossil fuels will always require more energy and so the Eco-indicator 99
method uses the surplus energy to express the damage to fossil fuels resources
(Goedkoop & Spriensma 2001).
The results obtained from the Eco-indicator 99 (H) method (see results in section
7.5.3) suggest that using rice husk in electricity production results in a large
reduction in the extra energy required to extract the fossil fuels in the future. This is
because the electricity from rice husk is produced to substitute electricity from the
Thai grid, which a large share of which is from natural gas (approximately 70
percent) (see table 8.1 for the share of the Thai grid electricity production classified
by type of fuels consumed). These results can be explained by the formation and
availability of different fossil fuels types. According to the Eco-indicator 99
methodology report written by Goedkoop & Spriensma (2001), the conventional oil
(and gas) has been formed within particular places while coal has been formed in the
much wider areas in the world. Thus, the scarcity of conventional oil (and gas) is
much higher than that of coal, and so the gas requires more effort to extract. This
explains why the electricity production option is more beneficial than the cement
production option (in which rice husk is used to replace coal) in terms of reducing
fossil fuel depletion based on the results from Eco-indicator 99 method.
The electricity option shows benefit over the cellulosic ethanol option. As discussed
above, in electricity option rice husk is used to replace a large amount of natural gas.

Chapter 8-Discussion, Conclusions, and
Opportunity for Further Research
262
While in cellulosic ethanol, rice husk is used to produce ethanol. Ethanol is then
blended with petrol to make E10 (10 percent of ethanol blended with 90 percent of
petrol), and E10 can be used to substitute for petrol. Although, the scarcity of both
oil (used in petrol production) and natural gas are high, efficiency of substituting rice
husk for fossil fuel in these two rice husk use options are different. The cellulosic
ethanol option has lower efficiency in substituting rice husk for fossil fuel than the
electricity option. In the electricity generation, rice husk is used directly as a fuel to
produce electricity. Whereas, in the cellulosic ethanol option, rice husk is used as a
feedstock to produce ethanol, which ethanol is then used to make E10 and E10 can
be used to substitute for petrol. Moreover, ethanol has lower energy content than
petrol. Ethanol has about two-thirds of energy content of petrol (Grant et al. 2008).
Hence, higher volume of E10 is required to replace petrol to operate vehicle on the
same distance. This makes the cellulosic ethanol option has lower efficiency in
reducing fossil fuel depletion when comparing with the electricity option.

Chapter 8-Discussion, Conclusions, and
Opportunity for Further Research
263
Table 8.1 Thai electricity production classified by type of fuels used
Year Hydro
Power
(GWh)
Fuel Oil
(GWh)
Coal &
Lignite
(GWh)
Natural
Gas
(GWh)*
Diesel
(GWh)
Imported
(GWh)
Others
(GWh)
Total
(GWh)
1986 5,532 3,335 5,541 10,252 (40.3%)
10 758 - 25,428
1987 4,056 2,188 6,698 15,624 (53.9%)
2 415 5 28,989
1988 3,718 3,142 6,800 18,720 (57.0%)
3 430 30 32,843
1989 5,512 4,739 7,870 19,195 (50.5%)
16 643 22 37,997
1990 4,900 10,013 11,053 17,765 (39.7%)
357 652 25 44,765
1991 4,505 12,636 13,785 19,051 (37.6%)
113 593 30 50,714
1992 4,159 14,929 14,815 22,943 (39.9%)
161 480 21 57,508
1993 3,613 17,495 13,504 27,953 (43.7%)
744 645 29 63,982
1994 4,404 19,647 14,131 31,485 (43.7%)
1,385 871 51 71,973
1995 6,593 21,712 15,165 33,863 (42.1%)
2,261 699 143 80,436
1996 7,215 20,984 17,580 36,433 (41.5%)
4,572 806 207 87,797
1997 7,082 19,266 19,026 44,574 (47.7%)
2,441 746 273 93,407
1998 5,089 17,534 16,590 49,021 (53.8%)
989 1,623 310 91,156
1999 3,410 15,429 16,633 53,839 (58.2%)
457 2,256 447 92,471
2000 5,891 9,611 18,197 61,186 (62.1%)
108 2,966 527 98,488
2001 6,174 2,420 20,296 71,229 (68.6%)
248 2,882 621 103,869
2002 7,367 1,969 19,292 78,910 (70.9%)
151 2,812 752 111,254
2003 7,208 2,434 19,301 85,688 (72.4%)
75 2,473 1,231 118,408
2004 5,896 5,468 20,404 90,289 (70.8%)
233 3,378 1,842 127,511
2005 5,671 7,640 20,614 94,468 (70.1%)
177 4,372 1,856 134,798
2006 7,950 7,808 24,468 94,398 (66.5%)
77 5,152 2,065 141,919
2007 7,961 2,967 30,881 98,148 (66.8%)
28 4,488 2,553 147,026
2008 6,951 990 30,743 104,480 (70.5%)
23 2,784 2,250 148,221
Source: Energy Policy and Planning Office (EPPO) (2009b)
Note: * Percentage is shown in bold.

Chapter 8-Discussion, Conclusions, and
Opportunity for Further Research
264
When considering the total energy saved by using rice husk in different rice husk use
systems examined (refer to the results analysed by the ReCiPe 2008 (H) method and
the Impact 2002+ method), the cement system is better than the other rice husk use
systems, as it helps to reduce the largest amount of total energy when compared with
other systems. This is because the cement system has the highest efficiency in
substituting for fossil fuels (by rice husk) than other rice husk use systems
concerning the energy content. Lemarchand (2000) argued that when using wastes in
the cement kilns, one hundred percent of the energy contained in the wastes can be
recovered. Likewise, all of the energy of rice husk used in the cement kilns can be
recovered. Whereas using rice husk as a fuel in the electricity generation and using it
as a feedstock to produce cellulosic ethanol is less efficient due to the loss of some
energy in the production processes.
This clearly suggests that different impact assessment methods give results on fossil
fuel depletion that reflect different issues. The results analysed by the ReCiPe 2008
(H) method and the Impact 2002+ method imply the total energy content of the
different fuels. While the results analysed by the Eco-indicator 99 method reflect the
scarcity of the different fossil fuels. However, when deciding which is the most
environmentally friendly rice husk use option with regard to fossil fuel depletion, the
results should be considered in terms of how these may help to determine the
preferred rice husk disposal strategies for Thailand.
As discussed earlier in section 3.5, the Thai government promotes the use of biomass
(including rice husk) to help to reduce reliance on imported fossil fuels, as Thailand
itself has very limited fossil fuels resources. Therefore, this study gives priority to the
results on fossil fuel depletion that concern the scarcity of different fossil fuels used:
the results analysed by the Eco-indicator 99 method, expressed as surplus energy.
Higher surplus energy means greater effort required for the extraction of fossil fuels
in the future and higher costs incurred. Therefore, surplus energy seems to be an
appropriate indicator for fossil fuel depletion in a fossil fuels importer country such
as Thailand. It is conceivable that, in the future, it may be possible to substitute one
type of fossil fuel by another type of fossil fuel in some industrial applications.

Chapter 8-Discussion, Conclusions, and
Opportunity for Further Research
265
However, the technology may have to be modified to suit the utilization of the
different fossil fuels used. Therefore, this substitution of one fossil fuel type for
another is not taken into consideration in this study as the LCI data used in this study
are obtained from the specific sites which use specific fossil fuels.
b) Climate change mitigation
Based on the results of climate change impact analysed from all methods used
(ReCiPe 2008 (H), Impact 2002+ and Eco-indicator 99 (H)) (refer to the results
presented in section 7.4.2 and section 7.5.3), using rice husk to generate electricity
(with the option of using the ash generated in the electricity production process in
light weight concrete block production) to substitute electricity from the Thai grid,
would help to reduce a large amount of greenhouse gases. The electricity option has
a second largest effect in reducing greenhouse gases (after the cement option) when
comparing across all rice husk use options examined for all impact methods used.
Based on the assumption that the CO2 from burning rice husk will be reabsorbed
during the growth phase of rice (IPCC 2006), this CO2 is not taken into account in
the LCA models. Therefore, most of the greenhouse gases reduced when using rice
husk to produce electricity is the CO2 produced from the production of the Thai grid,
which is emitted by burning different fossil fuels such as natural gas, coal, fuel oil,
and diesel oil (see Table 8.1 for the share of the electricity produced by different fuel
types in the Thai grid mix production).
c) Government policy support
The use of biomass such as rice husk has been strongly supported by the Thai
government through the renewable energy policies stated in the NESDPs since 1992,
as discussed in section 3.5 (Office of the National Economic and Social
Development Board 1992, 1997, 2002, 2007; Papong et al. 2004; Sajjakulnukit et al.
2002; Suwannakhanthi 2004). The rationale behind this is to reduce the country’s
dependency on fossil fuel imports and to decrease the environmental impacts
associated with using these fossil fuels (Prasertsan & Sajjakulnukit 2006).
Chapter 8-Discussion, Conclusions, and
Opportunity for Further Research
266
Since the national greenhouse gas (GHG) inventory conducted by the Thailand
Environment Institute (1997) (cited in Sajjakulnukit, Maneekhao & Pongnarintasut
(2002)) revealed that the energy sector was the largest greenhouse gas contributing
sector in the country, Thai energy policies have emphasized the use of biomass
energy to strengthen the security of the country’s energy supply and to mitigate the
release of greenhouse gases from energy production (Prasertsan & Sajjakulnukit
2006). Moreover, the government promoted the privatisation of the energy sector, as
stated in the seventh NESDP, for 1992-1996 (Office of the National Economic and
Social Development Board 1992). Furthermore, in 2002, the Electricity Generating
Authority of Thailand (EGAT) announced the intention to purchase electricity
produced from Very Small Power Producers (VSPPs) using renewable energy
(including biomass) (Amornkosit 2007; Kalayanamitr 2004). These have
significantly influenced the establishment of Small Power Producers (SPPs) and the
VSPPs using rice husk as a fuel. Since 1998, the number of power producers,
especially VSPPs, using rice husk as a fuel has increased dramatically (Energy
Policy and Planning Office 1999, 2009) (discussed in details in section 3.5.4).
Table 8.2 shows the share of total electricity produced by SPPs (including VSPPs).
In 2008, SPPs produced approximately 9.5 percent of electricity, which includes
electricity generated from conventional fuels (fossil fuels) and renewable fuels
(including rice husk). Nevertheless, the breakdown of the electricity generation by
type of fuels used within the SPPs sector was not reported.

Chapter 8-Discussion, Conclusions, and
Opportunity for Further Research
267
Table 8.2 Electricity produced from Small Power Producers
Year Electricity from SPP
(GWh)
Total
(GWh) Percentage
1994 13.30 71,973.25 0.02 %
1995 261.65 80,436.33 0.33 %
1996 1,232.93 87,797.24 1.40 %
1997 2,150.90 93,406.91 2.30 %
1998 3,191.85 91,155.72 3.50 %
1999 8,353.15 92,470.95 9.03 %
2000 10,175.54 98,487.52 10.33 %
2001 11,644.29 103,868.90 11.21 %
2002 12,548.25 111,253.87 11.28 %
2003 13,299.82 118,408.03 11.23 %
2004 13,440.60 127,510.51 10.54 %
2005 13,546.61 134,798.20 10.05 %
2006 13,530.95 141,918.56 9.53 %
2007 14,439.45 147,025.89 9.82 %
2008 14,036.43 148,220.93 9.47 %
Source: Energy Policy and Planning Office (EPPO) (2009b)
Note: The amount of the electricity generated by the Small Power Producers (SPPs)
shown in this graph includes the electricity produced by Very Small Power
Producers (VSPPs)
The Energy Policy and Planning Office (EPPO) (2009) has recorded the amount of
electricity sold to EGAT that was produced by SPPs and VSPPs, classified by
different fuel types (including rice husk) (data presented in section 3.5.4). However,
this was reported with the measure of power (MW). These data could not be
compared with the data of the electricity generated by SPPs shown in Table 8.2 as
the amounts of the electricity production presented in Table 8.2 (taken from EPPO
(2009b)) were measured in energy (MWh). Furthermore, apart from the rice husk
based power plants which use rice husk as an only fuel, there are a number of SPPs
using mixed fuels (mix of rice husk and other biomass). Therefore, it is difficult to
define the precise amount of electricity produced by using only rice husk as a fuel.

Chapter 8-Discussion, Conclusions, and
Opportunity for Further Research
268
Moreover, it is difficult to convert MW to MWh as the hours of operation are
unknown. However, both the numbers of rice husk based power plants and the
amounts of the electricity sold to EGAT of rice husk based power producers (data of
year 1998 and 2008) (presented in section 3.5.4) and the amounts of the electricity
produced by SPPs (including rice husk based power plants) (data of year 1994 to
2008 as shown in Table 8.2) indicate an upward trend in electricity produced from
rice husk.
As Thai energy policies (discussed in section 3.5) support the use of biomass to help
to reduce fossil fuel consumption, this research pays attention on how the electricity
generated from rice husk influences the overall Thai electricity production. The
amounts of electricity produced from different fossil fuel based power plants (of
EGAT) and SPPs (including rice husk based power plants) from year 1986 to 2008
(EPPO (2009b)) are plotted in graph as shown in Figure 8.1. The data of the fossil
fuels based electricity produced by IPPs are not taken into account as the amounts of
the electricity produced by different fuel types could not be defined.

Chapter 8-Discussion, Conclusions
and Opportunities for Further Research
269
0
5,000
10,000
15,000
20,000
25,000
30,000
35,000
40,000
19
86
19
87
19
88
19
89
19
90
19
91
19
92
19
93
19
94
19
95
19
96
19
97
19
98
19
99
20
00
20
01
20
02
20
03
20
04
20
05
20
06
20
07
20
08
Year
GW
h
Fuel oil
Lignite
Natural gas
Diesel
SPP
Figure 8.1 Comparison of electricity produced from fuel oil, lignite, natural gas, diesel and SPP
Source: Energy Policy and Planning Office (EPPO) (2009b)

Chapter 8-Discussion, Conclusions
and Opportunities for Further Research
270
Note: The data of the electricity generated from all fossil fuel types shown in this graph are from only the power plants of the Electricity
Generating Authority of Thailand (EGAT) and excludes the electricity generated by other source such as the Independent Power
Producers (IPPs).
The amount of the electricity generated by the Small Power Producers (SPPs) shown in this graph includes the electricity produced
by Very Small Power Producers (VSPPs).

Chapter 8-Discussion, Conclusions
and Opportunities for Further Research
271
This graph shows that the consumption of fuel oil in the Thai electricity generation has
dropped sharply since 1996. Also, the use of diesel in electricity production has declined
since 1997. This implies that these changes have been affected by government policy to
reduce the importing of oil. The production of electricity generated from SPPs has
increased substantially since 1994 and this trend is could continue. This clearly suggests
that the electricity produced from SPPs has been substituting the electricity produced
from fuel oil and diesel. However, the consumption of natural gas and lignite show
increasing trends. These have also been influenced by the Thai government policy
promoting the use of indigenous energy resources. Apart from the large variety of
renewable energy resources, fossil fuel such as natural gas is one of the local energy
resources of Thailand (Lertsuridej 2004). The coal supply for Thailand is sourced both
domestically and via imports. However, all coal supplied for electricity production by
EGAT is produced within the country (Intarapravich 1991). These imply that both
natural gas and coal supply for electricity production can be produced within Thailand
itself. Therefore, there is still increasing demand for these fuels (natural gas and coal) in
the Thai electricity production sector.
Sampattagul et al. (2004) reported that most of the Thai coal reserves are low quality
lignite which has high sulphur content and low heating value. They further commented
that these would cause significant damage to the environment and decrease the
efficiency of coal-fire power plants. Therefore, apart from using rice husk to substitute
for imported fossil fuels (such as fuel oil and diesel), rice husk should also be used (to
generate electricity) as a substitute for coal. This would help to reduce the environmental
impacts caused by the electricity sector.
d) Proven technology
One of the benefits of using rice husk in electricity generation is that its technology has
been proven. Rice husk based electricity power plants have been operational at
commercial scale at least since 1998, according to the report of the Energy Policy and

Chapter 8-Discussion, Conclusions
and Opportunities for Further Research
272
Planning Office (1999). Moreover, the National Energy Policy Office (NEPO)25
assigned the EC-ASEAN COGEN Programme26
to conduct a detailed study on the
‘Evaluation of Conditions for Electricity Production Based on Biomass’ appeared in
(The EC-ASEAN COGEN Programme 1998). Furthermore, it was reported that the first
pilot rice husk power plant started operation in 2000 (Chungsangunsit, Thipwimon et al.
2004). In addition, the recent (in 2008) large number of rice husk based power plants
established (presented in section 3.5.4) clearly implies the mature technology of using
rice husk in electricity production (the detailed general production process of rice husk
based power generation can be found in section 6.4.2). This also implies a large capacity
of the rice husk based power generation to use rice husk.
8.2.2 Barriers
a) Rice husk ash management
One of the issues with using rice husk as a fuel in electricity generation is the
management of the residue (rice husk ash) generated in the combustion process. The
LCA study (refer to Chapter 7) takes into account the different options for rice husk ash
disposal. The LCA results (see results in section 7.4.1) indicate that the most
environmentally friendly rice husk ash disposal option is the use of the ash in light
weight concrete block production. This option causes less impact in all impact categories
than other ash disposal options. All other ash disposal options have relatively similar
benefits, with the exception of landfill. The landfill option causes greater impacts
(specifically on freshwater eutrophication, human toxicity, freshwater ecotoxicity and
marine ecotoxicity) than other ash use options. Rice husk ash is used to substitute for
Portland cement in the production of light weight concrete block. Hence, the higher
25 The National Energy Policy Office (NEPO) is now called “Energy Policy and Planning Office
(EPPO)”. 26
EC-ASEAN COGEN Programme is an economic cooperation programme between the European
Commission (EC) and the Association of South-East Asian Nations (ASEAN) coordinated by the Asian Institute of Technology (AIT), Thailand. Its aim is to promote the implementation of proven technologies generating heat and/or power from biomass.

Chapter 8-Discussion, Conclusions
and Opportunities for Further Research
273
environmental credit given to this rice husk ash disposal option (using the ash in light
weight concrete block production) results from the higher environmental impacts caused
by Portland cement production when compared with other competing products (which
rice husk ash is used to substitute for in other ash disposal options) such as chemical
fertilizer (in soil conditioner option) and clay (in clay brick production option).
The capacities of different production processes in taking rice husk ash to use within the
processes are also considered. This could be deduced from the annual yields of the
products that use rice husk in their production processes (light weight concrete block,
clay brick and paddy rice fields). The actual amounts of rice husk ash used in different
applications were not presented as they were unknown. However, this is not the aim of
the research. The capacities of the production processes investigated are identified to see
whether the production processes have enough capacity to take rice husk ash generated
from rice husk based power plants. Therefore, the estimation of the capacities of
different production processes examined is based on the assumption that the same
amount of rice husk ash is used in all rice husk ash application processes (assuming that
all rice husk in the country is used as a fuel to generate electricity). It is conceivable that,
in reality, all rice husk in the country could not be used in this manner. However, this
assumption was made for the purpose of comparison (across different rice husk ash
applications).
The annual yields of industrial products such as light weight concrete block are found in
the industry statistics reported by the Office of Industrial Economics (2009) and are
shown in Table 8.3. However, the yields of the clay brick production are not reported in
these statistics; therefore, they are not presented in this section. It is worthy to note that
the industry statistics of the Office of Industrial Economics (2009) only include the main
industrial products which play significant roles in the country’s economy. Hence, it
could imply that the clay brick production is in smaller scale than the light weight
concrete block production.

Chapter 8-Discussion, Conclusions
and Opportunities for Further Research
274
1) Capacity of the production of light weight concrete blocks in using rice husk ash
Table 8.3 presents the annual yields of the production of light weigh concrete blocks
from the year 2000 to 2008. This table shows that there was an increasing trend of the
production of light weight concrete blocks from 2000 to 2002. There was a reversal and
substantial decrease in 2003 but subsequently there has been slight annual increase since
to the present (2008). The annual yields of light weight concrete blocks in 2008 will be
taken into consideration in this section.
Table 8.3 Annual yields of light weight concrete block production
Year Production (block)
2000 16,875,731
2001 19,577,107
2002 25,866,732
2003 18,024,379
2004 19,880,182
2005 19,455,085
2006 19,689,006
2007 22,108,771
2008 21,314,056
Source: Office of Industrial Economics (2009)
Assuming that all rice husk in the nation is used in electricity generation, in 2007, the
ash generated from burning rice husk is estimated as approximately 4.7 million tones or
4.7×10⁹ kg (based on the rice production statistics reported by the Office of Agricultural
Economics (2007a) and the average Thai rice husk ash content value taken from Table
3.2). According to Kanarkard & Pensuwan (2002), one light weight concrete block

Chapter 8-Discussion, Conclusions
and Opportunities for Further Research
275
contains 0.553 kg of rice husk ash27
; therefore, the production process of the total light
weight concrete blocks in recent year (2008) can take 1.18 × 10⁷ kg of rice husk ash in
the production processes. Compared to the amount of ash estimated (based on the
assumption that all rice husk in the nation is used to generate electricity) (4.7×10⁹ kg),
the production processes of the total lightweight concrete blocks in the whole country do
not have enough capacity to take all rice husk ash estimated to be available. However, as
stated above that, it is not possible to use all rice husk in the electricity industry.
Therefore, the capacity of the production processes of the total light weigh concrete
blocks is considered substantial.
2) Capacity of total areas of rice fields in using rice husk ash
The total areas of paddy rice fields in the country is reported in the Office of
Agricultural Economics (2007b; 2008) statistics (discussed in section 2.2). The total
planted areas of the major and second of the year 2006 and 2007 are presented in Table
8.4 (data are taken from Tables 2.2 and 2.3). Due to the time difference of the cultivation
of the major and the second rice, only the planted areas of both the major and second
rice reported in the same year are presented in Table 8.4. The latest year of the data of
the major rice reported in these statistics is the year 2007; it is the year 2008 for the data
of the second rice. Therefore, only total planted areas of the major and second rice of the
year 2006 and 2007 are presented in this table. Table 8.4 shows that the total planted
areas of the major and second rice are not so different from year to year.
27
The calculation is based on the light weigh concrete block production approach described in Kanarkard
& Pensuwan (2002). A concrete block has a volume of 0.006 m3 and an average density of 2,075kg/m3. The concrete block production uses concrete mix ratio of 1:3:5 (binder : sand : gravel) by volume. The binder is consisted of cement and rice husk ash with the ratio of 60:40 (cement : rice husk ash) by weight.

Chapter 8-Discussion, Conclusions
and Opportunities for Further Research
276
Table 8.4 Total annual planted areas of major and second rice
Year Planted areas (rai)
2006 67,444,610
2007 67,460,069
Source: Office of Agricultural Economics (2007b; 2008)
Note: Rai is the land unit used in Thailand, 1 rai = 1,600 square meters.
Based on 22 years of research (from 1976-1997), Songmuang (2000) suggested using
500 kg of rice husk ash as a soil conditioner28
in one rai of rice field. According to this,
the total planted areas of major and second rice in the year 2007 can take approximately
33.7×10⁹ kg of rice husk ash. Based on the assumption that all rice husk in the country is
used in electricity production, the ash generated is estimated at about 4.7×10⁹ kg (as
discussed earlier). Therefore, the total rice fields in Thailand have enough capacity to
take rice husk ash (generated from rice husk based electricity generation) even if all rice
husk in the country is used as a fuel in rice husk based power plants.
The LCA results (see results in section 7.4.1) further show that land-filling of rice husk
ash causes high impacts on human toxicity, freshwater and marine ecotoxicity.
Therefore, it is strongly recommended that rice husk ash should not be disposed of in
landfill. Rather, it should be used in industrial applications. The use of rice husk ash in
industrial applications can both add economic value for the power plant owners and it
also benefits the environment. Rice husk ash is used as a substitute for other products
such as Portland cement, chemical fertilizer and clay in the production processes. This
means that the use of rice husk ash in different industrial applications will help to reduce
the environmental impacts caused by producing the amounts of the competing products
28
It was suggested that rice husk ash uses together with chemical fertilizer such as ammonium phosphate
in rice fields to give the higher yields of rice. Using rice husk ash together with ammonium phosphate gives higher yields than using only chemical fertilizer or only rice husk ash in the rice fields. The suggested application ratio of rice husk ash : ammonium phosphate is 500 kg of rice husk ash : 30 kg of ammonium phosphate in 1 rai of rice field (Songmuang 2000).
Chapter 8-Discussion, Conclusions
and Opportunities for Further Research
277
(Portland cement, chemical fertilizer and clay) which are replaced by rice husk ash in
those production processes.
3) Locations of rice husk ash users
Lightweight concrete block plants, clay brick plants and rice fields, are all located
around Thailand. The locations of the plants of the industrial products such as light
weight concrete block and clay brick are found in the factory profiles29
reported in the
Department of Industrial Works (2009). The locations of the rice fields are found in the
statistics reported by the Office of Agricultural Economics (2007b; 2008) (discussed in
section 2.2). The locations of light weight concrete block plants, clay brick plants and
rice fields should not influence how rice husk ash is used since they are all spread
around the country. So, there should not be a significant difference in transportation of
rice husk ash from rice husk based power plants to different rice husk ash users, such as
the light weight concrete block plants, clay brick plants and rice fields.
4) Rice husk ash quality and market
As discussed in section 3.3.1, ash quality may affect the ash market since different
applications require different forms of rice husk ash. For example, the amorphous silica
form in rice husk ash is beneficial in concrete production. However, it is difficult to
control the ash quality as the quality of the ash can only be controlled in the modern
combustion technologies and these high technologies may not be used in most rice husk
power producers in the country, which are mostly small and medium-size. Therefore,
this may make the ash market unstable as it is difficult for rice husk based power
producers to produce ash of consistent quality (Bergqvist et al. 2008). Moreover,
Bergqvist et al. (2008) maintained that the electricity market seems to be a more reliable
29
The locations of all the concrete block factories and the clay brick factories are not presented in this
section as they are very large data. However, these can be found in the factory profiles reported by the Department of Industrial. They are shown on the website: http://www.diw.go.th/diw_web/html/versionthai/data/Download_fac2.asp The factory profiles are classified by industry type (the information is in Thai).

Chapter 8-Discussion, Conclusions
and Opportunities for Further Research
278
source of incomes for the power plant owners; therefore, the ash market does not seem
to be a priority concern of the rice husk based power producers.
However, the rice husk ash applications chosen to be examined in this study (using the
ash in light weight concrete block production and clay brick production and using as a
soil conditioner in the rice fields) do not seem to require a specific form of rice husk ash.
According to Kanarkard & Pensuwan (2002), both the rice husk ash obtained from using
as a fuel in paddy drying (black rice husk) and the ash obtained from using as a fuel in
clay brick kiln (white rice husk ash) can be used (to substitute for 40% of Portland
cement) to successfully produce the blocks that meet the standard criteria of the Thai
Industrial Standard TIS 58-2533 (hollow non load bearing concrete masonry units) (Thai
Industrial Standards Institute 1990). However, this refers to the properties of the rice
husk ash obtained from the two specific sites stated in the Kanarkard & Pensuwan
(2002) only. In addition, Chatveera & Lertwattanaruk (2009) found that rice husk ash
from (one specific) rice husk power plant can be used to substitute for Portland cement.
Moreover, they found that the rice husk ash can help to improve the resistance to sodium
sulfate attack of the mortars. The properties of the mortars containing rice husk ash
(from the power plant) tested in this study imply the feasibility of using rice husk ash to
substitute for Portland cement (from the specific rice husk power plant stated in
Chatveera, B. & Lertwattanaruk (2009)) in light weight concrete block production.
According to Chatveera (2002) and Thepnoo (2006), both the rice husk ash remaining
from using rice husk as a fuel in clay brick kiln and the ash from rice husk power plants
can be blended with clay30
to successfully produce the clay bricks which meet the
standard criteria of the Thai Industrial Standard TIS 77-2545 (Building bricks) (Thai
Industrial Standards Institute 2002). Again, this refers to the properties of the rice husk
ash obtained from the specific sites mentioned in Chatveera (2002) and Thepnoo (2006)
only. Moreover, Chatveera (2002) found that the clay bricks containing ground rice husk
ash have higher quality than the normal clay bricks (without rice husk ash). He reported
30
The optimum substitution rate of rice husk ash for clay is 3 percent by weight in both Chatveera (2002)
and Thepnoo (2006).

Chapter 8-Discussion, Conclusions
and Opportunities for Further Research
279
that the bricks containing 3 percent of ground rice husk ash (by weight) have 23 percent
higher compressive strength than the ordinary clay bricks. In addition, using rice husk
ash in clay bricks can help to reduce cracking in the bricks. Further, Chatveera (2002)
commented that the substitution of rice husk ash for clay can reduce some investment
cost of the clay brick production as the ash was considered a waste from the clay brick
production and it was obtained at no cost. However, in this study, the ash was obtained
within the brick factory itself and so there is no issue in transportation of rice husk ash
from other sources (Chatveera 2002). Therefore, when considering using the ash from
the rice husk power plants in clay brick production, the transportation of the ash from
the rice husk power plants to the clay brick factories has to be taken into consideration.
Songmuang (2000) noted that that rice husk ash used in his study was industry waste
and that the silica contained in the rice husk ash benefits the quality of the rice plants.
However, he did not discuss the specific properties of the rice husk ash used as a soil
conditioner, or the specific form of the silica required. This may imply that using the
ash as a soil conditioner does not require specific form of silica contained in rice husk
ash and that general rice husk ash can be used as a soil conditioner. As stated earlier, the
results of the study of Songmuang (2000) are based on 22 years of research (1976-1997).
It is assumed here that the ash used in this study were obtained from the rice industry
(using the rice husk as a fuel in rice mills) as the experiment started since 1976. Since
then, rice husk has mostly been used as a fuel in rice mills as discussed in section 3.3.1.
Rice husk was later found to be used commercially in other industries such as the power
industry (at least) since 1998, according to the report of the Energy Policy and Planning
Office (1999).
However, it is important to note that different rice husk based power plants produce
different qualities of the ash. This results from the different combustion techniques31
31 Details of different combustion techniques used in rice husk power plants can be found in The EC-
ASEAN COGEN Programme (1998).

Chapter 8-Discussion, Conclusions
and Opportunities for Further Research
280
used in different power plants and different techniques in collecting the ash32
. Thepnoo
(2006) examined the physical and chemical properties of four types of the rice husk ash
obtained from the three different rice husk power plants (see Table 8.5 for the selected
properties of rice husk ash from different rice husk based power plants). He found that
different combustion technologies give different characteristics of rice husk ash.
Moreover, the different types of rice husk ash from the same power plant show different
properties. This clearly implies that the ash from different rice husk power plants is
suitable for different applications depending on the properties of the ash from the
particular rice husk power plant and particular types of ash (fly ash or bottom ash).
However, he did not test the form of the silica contained in the rice husk ash examined.
Table 8.5 Selected properties of rice husk ash from different rice husk based power
plants
Properties Unit Power plants
PRG1
(fly ash
mixed with
bottom ash)
Biomass2
(fly ash)
Bua
Sommai3
(fly ash)
Bua
Sommai3
(bottom
ash)
SiO2 % wt. 89.81 90.01 68.72 78.80
Loss on ignition (LOI)
% wt. 4.52 3.90 15.84 12.18
Moisture content
% wt. 0.85 0.99 1.64 1.58
Bulk density
kg/m3 228 349 170 107
Fineness
% wt. (remained on the No.325
sieve)
82 73 75 90
Source: Thepnoo (2006)
Note: Background details of each rice husk power plants investigated can be found in
Thepnoo (2006).
32
Different approaches used to collect rice husk ash can give different types of the ash : bottom ash and
fly ash (see section 6.42 for detailed discussion).

Chapter 8-Discussion, Conclusions
and Opportunities for Further Research
281
1 uses stoker combustion technique with inclined grate and cyclone to collect the
ash.
2 uses fluidized bed combustion technique and dust separator to collect the fly
ash (the bottom ash was not used in this study as it was mixed with the sand at
the bottom of the furnace).
3 uses stoker combustion technique with travelling grate and Electrostatic
Precipitator (ESP) to collect the ash.
Apart from finding the right market for the different rice husk ash qualities generated in
the different rice husk power plants, another market issue is that there is a lack of
awareness of the potential of using rice husk ash in industrial applications as one rice
husk power plant manager commented:
“There is not much public information about the potentials of using
rice husk ash in the industrial applications so this is one of the
barriers in finding the rice husk ash market.” Interviewee 6.
5) Practicality of using rice husk ash in light weight concrete block production
Using rice husk ash produced from the rice husk based power plants (to substitute for
some amount of Portland cement) in lightweight concrete block production seems to be
reasonably practical when considering the different factors discussed earlier (capacity of
using rice husk ash in the production process, location of the concrete block plants and
the quality of the ash). Moreover, The LCA results (see results in section 7.4.1) show
that this rice husk ash use option is the most environmentally friendly across all rice
husk ash use options investigated. In addition, the total lightweight concrete block
production has a large capacity in taking rice husk ash to use within the production
process. Furthermore, the concrete block factories are located all around the country so
this should not be an issue in transporting rice husk ash from the rice husk power plants
to the concrete block plants. In fact, if not using rice husk ash in the process, the
concrete block plants still need to transport the Portland cement from the local retailers

Chapter 8-Discussion, Conclusions
and Opportunities for Further Research
282
to the concrete block plants. Assuming that the rice husk ash (sent to the concrete block
plants) is from the local rice husk power plants and the Portland cement is from the local
stores. This should not result in a significant difference between the transportation
distances of rice husk ash from the rice husk power plants and from the local cement
retailers to the concrete block plants.
When using rice husk ash in the production process, lightweight concrete block
production still requires Portland cement, as the rice husk ash can not wholly substitute
for Portland cement. According to Kanarkard & Pensuwan (2002), rice husk ash can
substitute for only 40 percent of cement in the production process. Therefore, there is a
need to transport both the Portland cement (from the local retailers) and the rice husk ash
(from rice husk power plants) to the concrete block plants. However, 1 kg of cement can
be replaced by 1 kg of rice husk ash. Therefore, technically, the transportation of both
the rice husk ash (from rice husk power plants) and the Portland cement has a similar
total work load to the transportation of only Portland cement from the local retailers
(when not using rice husk ash in the production process), assuming that the distances
between the local rice husk power plant and from the local cement store to the concrete
block plant are the same. This is because that there is the same total amount of the
materials (rice husk ash and cement or only cement if not using rice husk ash) to
transport on the same (assumed) distance.
In other words, this means that when using rice husk ash in the production process, there
will be multiple transportation trips carrying the same total amount of the materials (rice
husk ash and cement) with the single trip (or a greater number of trips) only carrying
cement if rice husk ash is not being used in the process. Nevertheless, in practice,
additional costs (such as the labour costs) may be incurred when more transportation
trips need to be made. However, when considering the cost of the materials, rice husk
ash (as a co-product from the rice husk power plants) should be cheaper than Portland
cement. Further, there may be other costs involved when using rice husk ash in the light
weight concrete block production. Nevertheless, these are not discussed in this section as
the study focuses on the life cycle environmental perspective of different uses of rice

Chapter 8-Discussion, Conclusions
and Opportunities for Further Research
283
husk (and rice husk ash) as stated earlier in the introduction chapter (Chapter 1) rather
than from an economic perspective. It is recognised that the economic issue is important
so the costing involved in the different uses of rice husk ash produced from the rice husk
power plants should be further studied.
6) Practicality of using rice husk ash in clay brick production
Based on the different factors discussed above, using rice husk ash produced from the
rice husk based power plants (to substitute for some amount of clay) in the clay brick
production seems to be less practical compared with the light weight concrete block
production option. This is because rice husk is normally used as a fuel in the clay brick
kilns; therefore, the clay brick production can produce its own rice husk ash. According
to Chatveera (2002) the ash remaining from using rice husk as a fuel in clay brick kilns
can be used back in the production process (to blend with clay). He found that the bricks
containing rice husk ash have higher compressive strength and durability than the
ordinary clay bricks. However, Chatveera (2002) reported that the silica contained in the
rice husk ash produced in the clay brick kilns are mostly in the crystalline form. As
discussed earlier in section 3.2.2, the crystalline silica had been considered carcinogenic
and so this may limit its uses in the future (Bronzeoak Ltd. for Department of Trade and
Industry 2003).
Taking this into consideration, it may be possible to use rice husk ash containing non-
crystalline silica from the rice husk based power plants in the clay brick production.
However, the transportation of rice husk ash from the rice husk power plants to the clay
brick plants may be an issue. This is likely to increase production costs and so the use of
the ash from outside source such as the rice husk power plants in the clay brick
production may not interest the business owners. Moreover, this will cause
environmental impacts associated with the transportation of rice husk ash from the
power plants to the clay brick plants.

Chapter 8-Discussion, Conclusions
and Opportunities for Further Research
284
7) Practicality of using rice husk ash as a soil conditioner in rice fields
Using rice husk ash produced from the rice husk based power plants (to substitute for
some amount of chemical fertilizer) as a soil conditioner in the rice fields seems to be
practical when considering different factors discussed earlier (capacity of using rice husk
ash in the rice fields, location of the rice fields and the quality of the ash). As discussed
earlier, the total planted areas of rice in the country has the greatest capacity (across all
rice husk ash use options investigated) to take rice husk ash to use within the production
process (i.e. on rice fields). The rice fields are located all around the nation so this
should not be an issue in transporting rice husk ash from the rice husk power plants to
the rice fields. Assuming that the rice husk ash (sent to the rice fields) is from local rice
husk power plants and the chemical fertilizer is from the local stores. This should not
make a significant difference between the distances of the transportation of rice husk ash
from the rice husk power plants and from the local chemical fertilizer retailers to the rice
fields.
Songmuang (2000) suggested that rice husk ash be used in combination with chemical
fertilizer to produce the higher rice yields. Therefore, if the rice husk ash is to be used in
the rice fields, there is a need to transport both the rice husk ash (from the rice husk
power plants) and the chemical fertilizer to the rice fields. However, a very large
quantity of rice husk ash is required to use as a soil conditioner in rice fields when
compared with the conventional practice (using only chemical fertilizer). According to
Songmuang (2000), the conventional rice planting practice only uses chemical fertilizers
such as ammonium phosphate, at the rate of 30 kg per rai33
. For the use of both
chemical fertilizer and rice husk ash, the suggested application rate is using 500 kg of
rice husk ash together with 30 kg of ammonium phosphate per rai of rice field. So, this
means that an extra 500 kg of rice husk ash is needed (to use as a soil conditioner in the
rice fields) compared with the conventional practice, which only needs 30 kg of
ammonium phosphate per rai of rice field.
33
Rai is the land unit used in Thailand, 1 rai = 1,600 square meters.

Chapter 8-Discussion, Conclusions
and Opportunities for Further Research
285
Songmuang (2000) reported that using rice husk ash in combination with ammonium
phosphate at the rate mentioned gives 14.3 percent higher yields than the conventional
practice (uses only chemical fertilizer). However, there are additional tasks required if
rice husk ash is to be used in rice fields. For example, there is an additional
transportation (of the rice husk ash to the rice fields) required. This would mean more
work than if transporting just chemical fertilizer (for the conventional practice). The
transportation of such a large amount of rice husk ash (to the rice fields) would lead to
environmental impacts caused by different factors such as fossil fuels used in the
vehicles and the emissions from the vehicles. Moreover, there may be other associated
costs incurred such as labour costs. However, it should be noted that rice husk ash (as a
co-product from the rice husk power plants) should be cheaper than the chemical
fertilizer and using rice husk ash as a soil conditioner can increase the rice yields.
Therefore, the cost-benefit analysis of using rice husk ash (from the rice husk power
plants) as a soil conditioner in the rice fields compared with the conventional rice
planting practice should be further examined.
b) Effect in particulate matter formation
Based on the results on the climate change analysed from all methods used (ReCiPe
2008 (H), Impact 2002+ and Eco-indicator 99 (H)) (see results in section 7.4.2 and
section 7.5.3), the rice husk based electricity generation releases more particulate
matters than the Thai grid production due to higher total suspended particulates (TSP)
produced by rice husk power plant (the detailed discussion was documented in the
process contribution analysis section (section 7.5.2)). Furthermore, the amount of
particulate matters produced by using rice husk in the electricity production is highest
across all rice husk use options examined. However, when compared with the results
across all impact categories analysed, the impact on particulate matter formation is not
as significant as the impacts on fossil fuel depletion and climate change based on
normalized basis.

Chapter 8-Discussion, Conclusions
and Opportunities for Further Research
286
c) Increase in rice husk prices
Rice husk based power plants are now faced with an increase in husk prices. This is
caused by the competition (for rice husk) with other rice husk users. Montree, the
manager of the Biomass Power rice husk based power plant located in Chainat Province
in the central region of Thailand (at 2006), noted:
“About 5 years ago, the husk price was 350 bahts34
/tonne and now
the price reaches 850 baht/tonne…there are about 10 rice husk
based power plants at the moment and all of them are struggling
with the high prices of rice husk and sometimes with the shortage of
the husk…there is enough rice husk in our province so we have
never lacked of the husk. However, we have to pay more for rice
husk as the market prices of the husk have increased.” Montree
(cited in Editors of Engineering Today (2006)).
Apart from the competition for rice husk with other rice husk based power plants, the
power plants also have to compete with other large-scale rice husk users, such as the
cement plants. Rungrat, (cited in Anuwatwong (2006)), the managing director of the
Biomass Power rice husk based power plant (at 2006), stated:
“We have a problem competing with the cement plants around the
nearby provinces to buy rice husk. They have bought out about 40-
50 percent of all the rice husk in the market in these areas35
. This
has let the husk prices increased very high so we have to pay more
for rice husk than before.” Rungrat (cited in Anuwatwong (2006)).
34
Baht is the currency of Thailand. 35
This means 40-50 percent of rice husk in the specific areas mentioned in this quote only; it does not
mean 40-50 percent of the total rice husk in the country.
Chapter 8-Discussion, Conclusions
and Opportunities for Further Research
287
d) Transportation of rice husk to the power plant plants
As discussed in section 6.4.2, the original idea of using rice husk as a fuel to generate
electricity was to find good use for excess rice husk remaining in rice mills. The
electricity generated from rice husk is for use within the rice mills and the excess
amount of electricity generated is sold to the grid. Therefore, many rice husk based
power plants are co-operated with rice mills. In this case, the transportation of rice husk
to the power plants is not seen as a barrier to using rice husk in electricity production.
However, there are also some rice husk based power plants which are not co-operated
with rice mills. The transportation of rice husk to the plants not only results in higher
prices of rice husk, but also higher environmental impacts associated with the
transportation.
8.3 Cement production option
8.3.1 Benefits
a) Fossil depletion mitigation
According to the normalized results analysed by the chosen impact assessment method
(ReCiPe 2008) presented in section 7.4.2, using rice husk in the cement production
system can help to reduce the impact on fossil fuel depletion by the greatest amount
when comparing across all rice husk use systems.
However, as discussed earlier in the section on the electricity production option (section
8.2), the results on fossil fuel depletion to the different impact assessment methods used
are highly sensitive to the different impact assessment methods used (Impact 2002+,
Eco-indicator 99. The ReCiPe 2008 and Impact 2002+ methods indicate that the cement
production system is better in reducing fossil fuel depletion than the other rice husk use

Chapter 8-Discussion, Conclusions
and Opportunities for Further Research
288
systems while the Eco-indicator 99 shows that the electricity production option is
preferred to the other systems.
This results from the differences in impact indicators used in different methods as
discussed earlier in the section of the electricity generation option (section 8.2). The
ReCiPe 2008 method uses kg oil equivalent as an impact indicator for the fossil fuel
depletion impact category. While the Impact 2002+ method uses MJ primary (total
energy content of fossil fuels based on upper heating values) and the Eco-indicator 99
method uses MJ surplus (extra energy required to extract fossil fuels in the future) for
the fossil fuel depletion impact indicator. This implies that the results regarding fossil
fuel depletion from ReCiPe 2008 and the Impact 2002+ methods reflect the energy
content of the fossil fuels that are replaced by rice husk in different rice husk use
systems. The results from the Eco-indicator 99 method reflect the scarcity of the fossil
fuels replaced by rice husk as discussed earlier in the section of the electricity generation
option (section 8.2).
The LCA results analysed by the ReCiPe 2008 and the Impact 2002+ methods (see
results in sections 7.4.2 and 7.5.3) imply that the cement production option is preferred
over the electricity option and the ethanol option, when considering the total energy
content of the fossil fuel replaced by rice husk (coal in the cement production option,
mainly natural gas (about 70 percent) in the electricity production option and oil in the
ethanol option). This is because it has higher efficiency in substituting rice husk for
fossil fuel than the other options as discussed in details earlier in the section of the
electricity generation option (section 8.2).
However, when considering the extra energy required for future extraction (of fossil
fuels that are replaced by rice husk) based on the results obtained from the Eco-indicator
99 method (see results in section 7.5.3), the cement option shows the least effect in
reducing fossil fuel depletion. This is because the surplus energy (in Eco-indicator 99
method) reflects the scarcity of the fossil fuels. In cement option, rice husk is used to
replace coal which according to Goedkoop & Spriensma (2001), is less scarce than oil

Chapter 8-Discussion, Conclusions
and Opportunities for Further Research
289
and gas which rice husk is used to substitute for in ethanol option and electricity option.
Therefore, the results analysed by the Eco-indicator 99 method show that the cement
option has the least effect in reducing fossil fuel depletion across all rice husk use
options examined, considering the extra energy required for future extraction of fossil
fuels.
b) Climate change mitigation
The cement production option is the most preferable option with regard to climate
change, based on the results produced from all methods used (ReCiPe 2008 (H), Impact
2002+ and Eco-indicator 99 (H)), Since rice husk is used as an energy source to
substitute for coal in cement production, this results in the reduction of CO2 emitted
from burning the amount of coal which is replaced by rice husk. The CO2 released from
burning rice husk are not taken into account in the LCA models according to IPCC
(2006), as it is believed that this CO2 will be reabsorbed during the growing phase of
rice. Moreover, compared with other fossil fuels, burning coal produces more CO2.
Table 8.6 shows the CO2 emissions of different fossil fuel based power plants and rice
husk based power plant. It is clear that coal based power plants produces significantly
more CO2 than the oil and natural gas based power plants, while the CO2 emitted from
the rice husk based power plant is accounted as neutral as it is considered as part of the
global carbon cycle. The coal based power plant releases more than two times the
amount of CO2 emitted from the natural gas based power plant. Since rice husk is used
to substitute some coal in cement production, it can help to lessen the large amount of
CO2 emission by not having to burn the amount of coal substituted by rice husk. This
makes the cement production option the most efficient in reducing greenhouse gases
across all rice husk use systems investigated.

Chapter 8-Discussion, Conclusions
and Opportunities for Further Research
290
Table 8.6 CO2 emissions of conventional power plants
Power plant type Unit CO2
Coal kg/MWh 1,269.52
Oil kg/MWh 812.61
Natural gas kg/MWh 568.88
Rice husk kg/MWh Nearly zero*
Source: Chungsangunsit et al. (2004).
Note: The data of the fossil fuel based power plants presented in this table are the data
of year 2001.
* CO2 produced from burning rice husk is not considered contributing to global
warming because it is considered as part of the global carbon cycle
c) Proven technology
Rice husk can be used as a fuel (to substitute for fossil fuels) in existing concrete
manufacturing infrastructure without any modification in the technology. However, the
substitution rate is limited to control the quality of the Portland cement (based on the
interview with the cement industry personnel (Interviewee 336
) and Thailand
Environment Institute (TEI) (2004b). Thailand has started using wastes as substitutes for
fuels and materials since 2000 (Thailand Environment Institute (TEI) 2004b). It was
stated in the report of TEI (2004b) that rice husk is one of the wastes used as substitute
fuels in the cement manufacture. However, the quantity of rice husk used was not
mentioned in this report.
36
The name of each interviewee in this thesis is presented anonymously (each interviewee is given a
name by the researcher). Names of interviewees referred to in this section and their affiliated industry
sectors can be found in section 6.3.
Chapter 8-Discussion, Conclusions
and Opportunities for Further Research
291
d) No ash management
One of the benefits of using rice husk in the cement manufacture is that there is no ash
generated in the production process. Therefore, there is no issue in rice husk ash
management. The rice husk ash (generated from burning rice husk in the cement kiln) is
finally bound with the ash of other raw materials and fuels used in the production
process to produce the clinker (see detailed production process of Portland cement in
section 6.4.3).
e) Opportunity for carbon trading
The LCA results (refer to section 7.4.2) indicate that the cement production option is the
most preferable option when considering climate change (the discussion about the LCA
results with regard to the climate change was documented earlier in this sub-section).
This means that using rice husk in the cement manufacture can help to reduce
greenhouse gases by the greatest amount compared with the other two rice husk use
options (electricity and the cellulosic ethanol options). This has given the biggest
opportunity for carbon trading in the cement industry when compared with other rice
husk use systems examined (based on using the same amount of rice husk in different
rice husk use systems investigated). The background information about the
implementation of carbon trading in Thailand is discussed in details in section 3.5.5.
8.3.2 Barriers
a) Effect in particulate matter formation
Based on the results on the climate change analysed from all methods used (ReCiPe
2008 (H), Impact 2002+ and Eco-indicator 99 (H)) (see results in section 7.4.2 and
section 7.5.3), using rice husk as a fuel (to substitute for some amount of coal) in the
cement production process contributes a little higher particulate matter formation than in
the conventional process (without using rice husk in the process). Nevertheless, the

Chapter 8-Discussion, Conclusions
and Opportunities for Further Research
292
amounts of the particulate matters produced by using rice husk in the cement production
are the least across all rice husk use options examined. Furthermore, when compared to
the results (in particulate matter formation) across all impact categories analysed, the
impact on particulate matter formation is not as significant as the impacts on fossil fuel
depletion and climate change based on normalized basis.
b) Increase in rice husk prices
Like other rice husk users, cement plants face a problem of high prices of rice husk. The
competition with other rice husk users for rice husk to use in the cement plants leads to
the increase prices of rice husk:
“The problem is that there is more demand of rice husk than the
actual supply at the moment...especially there are more and more
rice husk based power plants established recently so this has raised
the demand of rice husk dramatically and the market prices of the
husk have increased a lot. With the high competition, rice husk is
now costed at around 1,000-1,200 bahts/tonne…It’s used to be
about 700 bahts/tonne.” Interviewee 3 (at August 2007).
c) Rice husk is not used efficiently enough
As discussed in section 3.3.1, amorphous silica contained in the rice husk is found to be
useful in cement and concrete production. However, this amorphous silica can only be
produced in the controlled burning conditions (see the properties of rice husk ash
produced in different burning conditions in Table 3.5 in section 3.2.2). Hwang &
Chandra (1997) discussed that burning rice husk at temperature below 700° C provides
amorphous silica (contained in rice husk ash) and that burning rice husk at temperatures
over 800° C produces crystalline silica ash. However, rice husk is burnt (together with
the raw materials and fuels used in the process) at the temperature of about 1,400 –
1,500 °C in the cement kiln (Thailand Environment Institute (TEI) 2004b) (see section

Chapter 8-Discussion, Conclusions
and Opportunities for Further Research
293
6.4.3 for detailed cement production process). This temperature would probably turn the
rice husk into the crystalline silica ash and not the amorphous silica (which is found to
be useful in the cement and concrete production as discussed in section3.3.1). In this
study, rice husk is used as a fuel (to substitute 20 percent of coal in the process). The
rice husk is burned in the cement kiln with other raw materials and fuels used. Finally,
its ash is bound with the ash of other raw materials and fuels to produce the cement
product. This means that the silica contained in the rice husk ash substitutes for the silica
which is normally required in the cement production (usually is obtained from shale).
Based on the interview with cement industry personnel (Interviewee 3) and from the
Thailand Environment Institute (2004b), sand is the admixture which is normally used
when lacking of silica (from shale). This means that if not using rice husk as a fuel (to
substitute for coal and hence the rice husk ash generated in the process gives the extra
silica to the process), sand would be used as an additional source for silica. However,
sand is considered relative cheap compared to other raw materials (based on an
interview with cement industry personnel (Interviewee 3)). This implies that the rice
husk used as a fuel in the cement production process has not gained high added value
that may be possible:
“At the moment, we have not utilized the rice husk to its full
potentials. It is now used to substituted some amount of coal…coal
is still used as a main fuel. Its ash provides the silica for the cement
process. However, we normally get additional silica from sand
which is quite cheap. So, the added value gain from using the husk
in our production process is still low, just about 100 bahts/tonne of
husk used. In the future, we would like to find the way to gain more
value from using rice husk” Interviewee 3 (at August 2007).
d) Transportation of rice husk to the cement plants
When considering the locations of the cement plants in Thailand, the plants are most
located in the particular areas and not spread around the country. Table 8.7 shows the
locations of the cement plants in Thailand. The locations of the cement plants are found
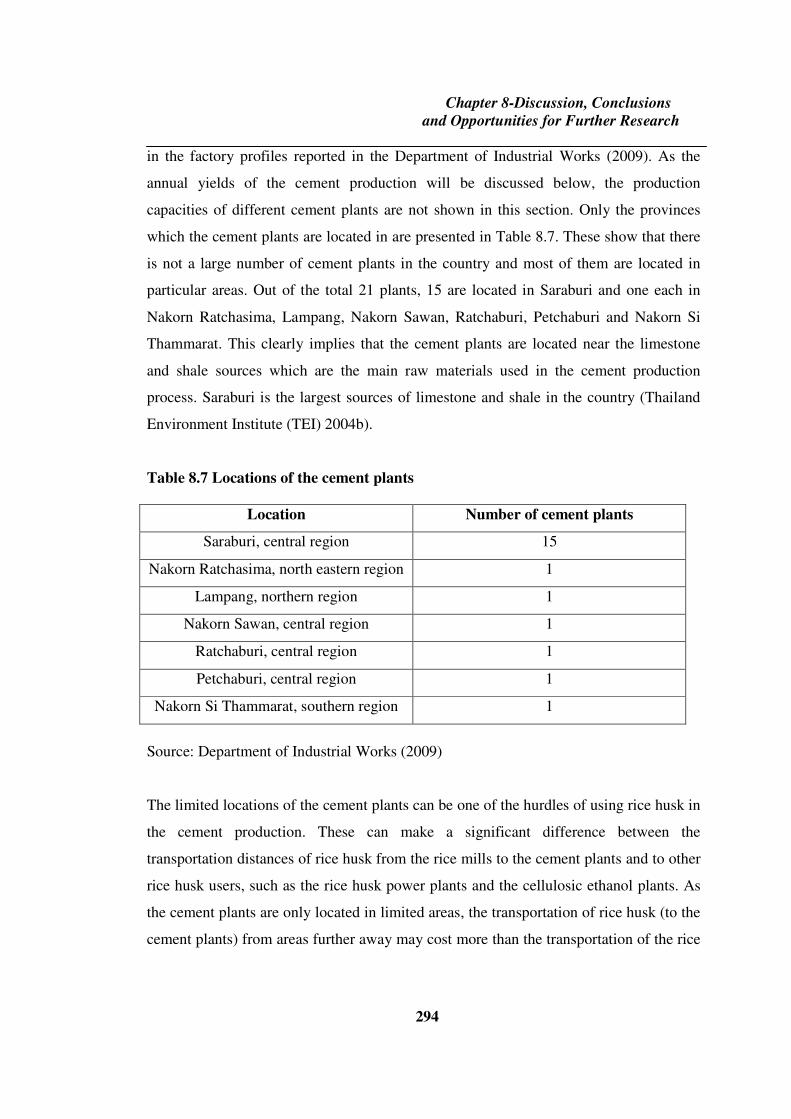
Chapter 8-Discussion, Conclusions
and Opportunities for Further Research
294
in the factory profiles reported in the Department of Industrial Works (2009). As the
annual yields of the cement production will be discussed below, the production
capacities of different cement plants are not shown in this section. Only the provinces
which the cement plants are located in are presented in Table 8.7. These show that there
is not a large number of cement plants in the country and most of them are located in
particular areas. Out of the total 21 plants, 15 are located in Saraburi and one each in
Nakorn Ratchasima, Lampang, Nakorn Sawan, Ratchaburi, Petchaburi and Nakorn Si
Thammarat. This clearly implies that the cement plants are located near the limestone
and shale sources which are the main raw materials used in the cement production
process. Saraburi is the largest sources of limestone and shale in the country (Thailand
Environment Institute (TEI) 2004b).
Table 8.7 Locations of the cement plants
Location Number of cement plants
Saraburi, central region 15
Nakorn Ratchasima, north eastern region 1
Lampang, northern region 1
Nakorn Sawan, central region 1
Ratchaburi, central region 1
Petchaburi, central region 1
Nakorn Si Thammarat, southern region 1
Source: Department of Industrial Works (2009)
The limited locations of the cement plants can be one of the hurdles of using rice husk in
the cement production. These can make a significant difference between the
transportation distances of rice husk from the rice mills to the cement plants and to other
rice husk users, such as the rice husk power plants and the cellulosic ethanol plants. As
the cement plants are only located in limited areas, the transportation of rice husk (to the
cement plants) from areas further away may cost more than the transportation of the rice

Chapter 8-Discussion, Conclusions
and Opportunities for Further Research
295
husk from local sources to the cement plants (based on the interview with the cement
industry personnel (Interview 3)).
As discussed above, the cement plants face the problem with the high prices of rice husk
due to the competition for rice husk with other rice husk users such as the rice husk
based power plants in the nearby areas. If the cement plants are to buy the rice husk
from sources that are located further away (so it is more expensive due to the
transportation cost), it may not be very cost-effective. Moreover, this would lead to the
higher environmental impacts associated with the transportation of rice husk from
further away areas. As discussed earlier, the current situation of using rice husk (to
substitute for coal) in the cement production process does not add great value. Therefore,
if the husk prices are too expensive, using rice husk in cement production process may
not interest the cement plant owners as there may be other choices of alternative fuels
which may be cheaper than rice husk and could be found within the local areas.
e) Capacity of cement production in using rice husk in the process
Table 8.8 shows the annual yields of the cement production in Thailand from 1999 to
2008. This table shows that, in general, there has been a gradually increase in the trend
in the production of cement since 1999 until now. Though the trend was slightly dropped
since 2006, the current (2008) yield is taken into consideration in this section. From
Table 8.8, in 2008, Thailand produced about 73.7 million tonnes of cement.

Chapter 8-Discussion, Conclusions
and Opportunities for Further Research
296
Table 8.8 Annual yields of cement production
Year Production (tonne)
1999 55,567,061
2000 54,574,480
2001 61,367,841
2002 69,539,714
2003 65,883,405
2004 71,542,628
2005 79,075,284
2006 83,825,435
2007 78,154,597
2008 73,711,917
Source: Office of Industrial Economics (2009)
In 2007, Thailand produced approximately 32 million tonnes of rice (Office of
Agricultural Economics 2007a) (see Table 2.1). Therefore, in 2007, the rice husk
generated from the rice mills is estimated as approximately 7.36 million tonnes or
7.36×10⁹ kg (based on the rice production statistics reported by the Office of
Agricultural Economics (2007a) and the average Thai rice husk percentage used in this
study as discussed in section 3.2.1).
Based on the assumption that rice husk is used to replace 20 percent of coal in the
cement production process based on energy content and the LCI data from (Thailand
Environment Institute (TEI) 2004b), 1 tonne of Portland cement contains 2.844 kg of
rice husk in the process. Assuming that all rice husk in the nation is used in the cement
production, the total production of cement can take only 2.10×10⁸ kg of rice husk.
Obviously, it is not enough to use all of the rice husk in the country (estimated as about
7.36×10⁹ kg). However, this value is calculated based on the assumption that all rice
husk in the country is used in cement production. In reality, all of the rice husk can not

Chapter 8-Discussion, Conclusions
and Opportunities for Further Research
297
be used in this manner. The assumption was made for the purpose of comparison (across
different rice husk use options investigated). Therefore, the total cement production is
still considered to have a fairly large capacity in taking rice husk to use in the production
process.
8.4 Cellulosic ethanol production option
8.4.1 Benefits
a) Fossil fuel depletion mitigation
According to the LCA results analysed by the chosen impact assessment method
(ReCiPe 2008) presented in section 7.4.2, and other methods used for a sensitivity
analysis such as Impact 2002+, Eco-indicator 99 (results are presented in section 7.5.3),
using rice husk in the cellulosic ethanol system has the least effect in reducing fossil fuel
depletion when compared with the other rice husk use options. However, when
considering the normalized results (results in all impact categories have the same unit
((person×year)), it can help to reduce on the depletion of fossil fuels by the greatest
amount when compared with the results in other impact categories. As discussed in the
process contribution analysis (section 7.5.2), this results from the reduction in using
petrol. When E10 (10 percent ethanol blended with 90 percent petrol) is used in the
vehicle, some amount of petrol is substituted by ethanol. According to the functional
units set in section 7.2.2 (see Figure 7.1), when every 100 liters of E10 is used in the
vehicle, it can help to save approximately 6.6 litres of petrol. So it can help to reduce
fossil fuel depletion caused by having to produce 6.6 litres of petrol (in every 100 litres
of E10 used). However, the amount of the impact on fossil fuel depletion reduced by the
cellulosic ethanol option is smallest across all rice husk use options.
This implies that the production process of petrol has greater impact on fossil fuel
depletion than the production process of the cellulosic ethanol. This is because there is

Chapter 8-Discussion, Conclusions
and Opportunities for Further Research
298
little amount of fossil fuel required in the production process of the cellulosic ethanol,
this may be the fuel used in the vehicles used in the transportation of rice husk from the
rice mills to the cellulosic ethanol plants. While, in the production process of petrol, the
main raw material and energy used are fossil fuels.
b) Climate change mitigation
Based on the results on climate change analysed from all methods used (ReCiPe 2008
(H), Impact 2002+ and Eco-indicator 99 (H)), the cellulosic ethanol system has the least
effect in reducing impact on climate change across all rice husk use systems. As
discussed in the process contribution analysis (section 7.5.2), the reduction in
greenhouse gases occurred during the use phase (vehicle operation) of the products (E10
and petrol) and not in the production processes of the products. The exhausted emissions
from the vehicles using E10 contain less greenhouse gases than the emissions from the
vehicles using petrol. The reduction in greenhouse gases by the cellulosic ethanol system
may result from the lower carbon content of ethanol when comparing with petrol (Grant
et al. 2008). This means that CO2 emission released by using E10 (10 percent of ethanol
blended with 90 percent of petrol) would be less than that of petrol. However, when
considering the production processes of the products (E10 and petrol), the production
process of the cellulosic ethanol actually causes a little higher greenhouse gases than the
production process of petrol (see section 7.5.2). Nevertheless, when considering the
overall system (including the use phase of the products), the vehicle operation using E10
from rice husk causes less greenhouse gases than the vehicle operation using petrol.
8.4.2 Barriers
a) Effect in particulate matter formation
Based on the climate change results analysed from all of the methods used (ReCiPe
2008 (H), Impact 2002+ and Eco-indicator 99 (H)) (see results in section 7.4.2 and
section 7.5.3), using rice husk in the cellulosic ethanol system contributes slightly more

Chapter 8-Discussion, Conclusions
and Opportunities for Further Research
299
particulate matters than the petrol system. The main sources of the particulate matters
are the exhausted emissions from the vehicles using E10 and the production process of
sulphuric acid, which is the main input used in the production process of the cellulosic
ethanol using rice husk as a feedstock. Nevertheless, when compared with the other rice
husk use systems examined, the amount of particulate matters produced by using rice
husk in the cellulosic ethanol system is higher than in the cement system, but it is less
than in the electricity system. However, when comparing the results in particulate matter
formation across all impact categories analysed, the impact on particulate matter
formation is not as significant as the impacts on fossil fuel depletion and climate change
based on normalized basis.
b) Unproven technology (at the time of analysis)
As discussed in section 6.4.4, the technology of the cellulosic ethanol has not yet been
proven to be used widely at the commercial scale in Thailand. With much research in the
development of the cellulosic ethanol production, the technology exists; however, the
costs are still high (Goettemoeller & Goettemoeller 2007). The current feedstock used to
make ethanol in Thailand is cane molasses, which has simple conversion process and
existing distillery infrastructure (Nguyen & Gheewala 2008). However, as stated earlier
in goal and scope of the LCA study (see section 7.2), this study explores the use of rice
husk as a feedstock to generate cellulosic ethanol a supplement to the existing ethanol
production in Thailand and not to compete with the existing ethanol production.
Nevertheless, its practicality needs to be taken into consideration when making a
comparison across different rice husk use options investigated.
Thailand’s first pilot scale cellulosic ethanol plant has commenced operation in July
2008 (Praiwan 2008). The plant is owned by a sugar mill company and uses bagasse as a
feedstock. This cellulosic ethanol plant (using bagasse as a feed stock) is co-located with
the molasses based ethanol plant (Biofuels Digest 2008). However, the plant has not yet
planned to use rice husk as a feedstock. According to Biofuels Digest (2008), the Thai
Roong Ruang Group, the plant’s owner, announced that the plant will use bagasse, wood

Chapter 8-Discussion, Conclusions
and Opportunities for Further Research
300
chips, corn stover and rice straw as feedstock. Nevertheless, it should be noted that the
LCI data of the cellulosic ethanol used in this study (refer to section 7.3.1) are based on
the LCI data of other country as the LCI data of the Thai cellulosic ethanol production
were not available (at the time of analysis).
As discussed above, rice husk has not yet been used as a feedstock in cellulosic ethanol
production within the Thai context. Thus, it is difficult to estimate the capacity of the
cellulosic ethanol plants in using rice husk because there is no infrastructure for rice
husk based cellulosic ethanol existed (at the time of anlysis). Therefore, the capacity of
rice husk based cellulosic ethanol production is not discussed here. However, the
cellulosic ethanol produced from rice husk is seen to be supplement to petrol production
in the time of oil shortage like thesedays. As discussed in section 3.5, the Thai
government promotes the use of biomass such as rice husk to reduce the the import of
fossil fuel such as oil. Therefore, if the commercial rice husk based cellulosic ethanol
technology can be successfully established in Thailand, it is assumed this there will be a
high demand for rice husk for use as a feedstock in the cellulosic ethanol production.
Consequenctly, the capacity of the cellulosic ethanol plants in using rice husk should not
be seen as a barrier to using rice husk.
c) Rice husk ash management
According to the production process of the cellolosic ethanol plant in Jungbluth et al.
(2007), the residues remaining in the ethanol distillery are burned in the co-generator
(part of the ethanol plant) to produce both the heat and electricity to use within the
ethanol production (and sell the excess electricity to the grid). Therefore, there is a need
to deal with the ash (of the residues burnt in the co-generator). However, the ash
disposal options are not yet studied due to a lack of LCI data. As the cellulosic ethanol
production requires various inputs in the process, the characteristics of the ash (of the
residues remaining in the distillery) may differ from the general rice husk ash, which is
burned without prior being reacted with any chemicals. Therefore, it may not be
reasonable to assume that the uses of the ash generated in the co-generator in the

Chapter 8-Discussion, Conclusions
and Opportunities for Further Research
301
cellulosic ethanol plant, are the same as the ash generated from the rice husk based
power plants. Due to the lack of data about the characteristics of the ash and its uses, ash
management was removed from the LCI model of the cellulosic ethanol system.
However, to make the LCI model of the cellulosic ethanol system comparable with its
conventional system (petrol system), the waste management of the petrol system was
also removed from this model.
d) Transportation of rice husk to the ethanol plants
As discussed above, rice husk has not yet been used as a feedstock in cellulosic ethanol
production within the Thai context. However, if the commercial rice husk based
cellulosic ethanol technology is to be introduced into the Thai context, it is assumed that
the rice husk based cellulosic ethanol plants should not be scattered around the country
as much as the existing rice husk use technologies are. If the rice husk based cellulosic
ethanol plants are to be co-operated with the rice mills, the transportation of rice husk to
the ethanol plants should not be a barrier to using rice husk this way. However, if the
plants are to be located away from the rice mills, the transportation of rice husk to
ethanol plants can be a problem of using rice husk in the cellulosic ethanol plants.
8.5 Limitations of the Research
There are several important limitations associated with the way this research has been
undertaken and which potentially affect the conclusions (presented in section 8.6). First,
the scope of this study covers only three main and potential uses of rice husk: as a fuel in
electricity production, as a substitute for some amount of coal in cement manufacture
and as a feedstock in cellulosic ethanol production. In reality, rice husk are also used in
other ways. However, the conclusions made for this research are based on only these
selected rice husk use options to examine.

Chapter 8-Discussion, Conclusions
and Opportunities for Further Research
302
Further, as discussed in the life cycle inventory analysis section (section 7.3), some of
the LCI data are obtained from the actual sites but some were calculated based on some
assumptions (see section 7.3). This is because some data required for the research were
unavailable. For example, the emissions data in the LCI model of the cement system
were assumed to be the same as the emissions of the conventional production (without
using rice husk in the process) except that some amount of CO2 was deducted. This was
based on the estimated CO2 emitted when burning the amount of coal replaced by rice
husk in the process, as discussed in section 7.3.1. This is because data on the actual
emissions when co-firing rice husk with other fuels used in the cement production
process were not available at the time of analysis. However, more precision on the LCI
data would lead to the more accuracy of the LCI results.
The system boundary of the LCI model of the electricity system was expanded to cover
the disposal of rice husk ash generated from the rice husk base power plant. However, it
was limited to only four rice husk ash disposal options: soil conditioner (in the paddy
rice fields), clay brick production (to substitute for some amount of clay), lightweight
concrete block production (to substitute for some amount of cement) and landfill. In
reality, there are more alternative rice husk ash use options. Nevertheless, the
conclusions drawn in this research are based only on the four selected rice husk ash
disposal options stated.
This study does not take into account the waste management of the cellulosic ethanol
system, as these data were not available at the time of study. The inclusion of the
disposal of the ash generated in the co-generator (part of the cellolosic ethanol
production) would lead to greater accuracy of the LCI results.
More generally, the LCI data used in this study are based on the best available
technologies (at the time of analysis) and are obtained from specific sites and
publications only. However, in reality, it is not possible that all rice husk in the country
are used with the same utilization technologies. For example, there are different
technologies of rice husk based electricity generation. Nevertheless, this study only uses

Chapter 8-Discussion, Conclusions
and Opportunities for Further Research
303
the data from the specific plant which was deemed to have state-of-the-art technology, at
the time of analysis. It should also be noted that the different rice husk utilization
technologies may result in different environmental profiles.
The LCA results are reviewed in the selected key issues, including Thai energy policies,
capacity of the production systems, infrastructure availability and practicality of the rice
husk use systems. These are influenced by different factors depending on the
circumstances of each rice husk (and rice husk ash) uses investigated as discussed above
in section 8.2. However, the uses of rice husk (and rice husk ash) can also be influenced
by other issues which are not included in this study. Nevertheless, the conclusions drawn
in this research are based on the important issues stated in sections 8.2, 8.3 and 8.4.
8.6 Conclusions of the Research
Based on the information from various sources including relevant literature, interviews
with relative industry personnel as well as the rice mill survey results, it was found that
rice husk has been conventionally used as a fuel within the rice mills themselves. Apart
from internal use within rice mills, a large amount of rice husk has been sent to the
external users such as rice husk based power plants and cement plants, for use as a fuel
within their production processes. Moreover, there are also some minor uses, for
instance as a fuel in clay brick production and charcoal production, as an odour
absorbent material in poultry and livestock farms and as one ingredient in compost
production. Furthermore, as one of the cellulosic materials, rice husk can potentially be
used as a feedstock in the production process of the cellulosic ethanol.
However, this research considers the use of rice husk as a fuel in the rice mills as part of
the rice production. This study aims at finding out the best way of dealing with the rice
husk left over from using within the rice mills. Therefore, the internal use of rice husk in
the rice mills is not taken into account in assessing the environmental impacts, through a

Chapter 8-Discussion, Conclusions
and Opportunities for Further Research
304
life cycle analysis. Only the main and potential external uses of rice husk are taken into
account.
With the available data, this research selected three major and potential rice husk uses,
and analysed the environmental impacts caused by these different rice husk uses by
applying LCA approach (with the software SimaPro version 7.1.6 as the analytical tool).
These included the use of rice husk as a fuel in the rice husk based power production,
the use of rice husk as a fuel (to substitute for 20 percent of coal) in the cement
production and the use of rice husk as a feedstock in the production process of the
cellulosic ethanol (and ethanol is then used to blend with petrol to produce E10 to use in
vehicles).
Based on the LCA results and the reviews of the key issues discussed above, the
electricity generation option is the most practical environmentally friendly option. Based
on the LCA results considering the impacts on fossil fuel depletion, climate change and
particulate matter formation (as they show the significant results in all impact methods
used based on normalized basis), the electricity generation option can help to reasonably
reduce fossil fuel depletion and climate change when compared with the other rice husk
use options investigated. Though the LCA results do not indicate that this option is the
best of the options examined across all impact methods used (it is ranked the second best
in most of the methods used for both the fossil fuel depletion and the climate change
impact categories), the reviews on the key issues considered (the Thai government
energy policies, capacity of the production systems, infrastructure availability and
practicality of the rice husk use systems) imply that the electricity system is the most
practical environmentally friendly option (at the time of analysis).
However, compared with conventional systems, using rice husk in the three systems
investigated result in slightly higher particulate matter. Furthermore, the amount of the
particulate matter released by the electricity system is the highest across all rice husk use
systems examined. Nevertheless, when compared the results across all impact categories

Chapter 8-Discussion, Conclusions
and Opportunities for Further Research
305
analysed, the impact on particulate matter formation is not as significant as the impacts
on fossil fuel depletion and climate change based on normalized basis.
Thailand has very limited local fossil fuels sources so the scarcity of different fossil
fuels is considered an appropriate indicator in fossil fuel depletion. Higher scarcity
means more effort is required in the extraction of the fossil fuels, and by implication,
higher costs. Thus, the results in fossil fuel depletion analysed by Eco-indicator 99
method have been used in this study. This is because the Eco-indicator 99 method
expresses the damage in fossil fuel depletion as surplus energy (the energy required for
future extraction of fossil fuels) which reflects the scarcity of the fossil fuels used.
Based on the LCA results from the Eco-indicator 99 method, the electricity system can
help to save the largest amount of the energy required for future extraction of the fossil
fuels used (surplus energy) than the other rice husk use systems. This is because the
electricity generated by the rice husk based power plants is substituted for the electricity
from the Thai grid mix which has a very large share of the electricity generated from
natural gas (approximately 70.5 percent in 2008). This means that using rice husk to
generate electricity can help to save a large amount of the energy required for future
extraction of natural gas. When considering the formation of different fossil fuels, the
scarcity of the natural gas is higher than that of coal which rice husk substitutes for in
the cement system. Therefore, the electricity system is preferred over the cement system
when considering the fossil fuel depletion, based on the energy required for future
extraction of the fossil fuels used. Moreover, the electricity system is preferred over the
cellulosic ethanol system. This is becaused the electricity system has higher efficiency in
substituting rice husk for fossil fuels. Rice husk is used directly as a fuel in electricity
production, while it is used as a feedstock to produce cellulosic ethanol. The ethanol is
then used to blend with petrol to produce E10, and E10 can be used to substitute for
petrol.
The electricity option has the second largest effect in reducing climate change (after
cement option) based on the results of all methods used. The reduction in greenhouse

Chapter 8-Discussion, Conclusions
and Opportunities for Further Research
306
gas emissions caused by the electricity option is based on the assumption that the CO2
from burning rice husk will be reabsorbed during the growth phase of rice. Therefore,
this CO2 is not taken into account in the LCA models. Hence, using rice husk in
electricity generation can help to reduce the amount of CO2 produced from the
production of the Thai grid, which is released from burning different fossil fuels such as
natural gas, coal, fuel oil, and diesel oil.
The cement option can help to save the largest amount of greenhouse gases across the
three rice husk use options investigated. Rice husk is used as a substitute for coal as a
fuel in the cement production process. This means that the emissions released by
burning coal are replaced by the emissions from burning rice husk. However, the CO2
emitted from burning biomass such as rice husk, is accounted as neutral. Hence, the CO2
from burning coal is omitted when using rice husk in the cement production process.
Moreover, burning coal releases higher CO2 than other fossil fuels such as natural gas
and oil. Therefore, this makes the cement option the best option in climate change,
across all rice husk use options examined.
Nevertheless, the cement option has the least effect in reducing the impact on fossil fuel
depletion based on the energy required for future extraction of fossil fuels (expressed as
surplus energy). This is because coal has been formed in much wider areas in the world
while other fossil fuels, such as oil and natural gas, have formed in particular areas. This
implies that coal is more available so it requires less energy for future extraction, which
implies less costs incurred, than the other fuels such as oil and natural gas.
The cellulosic ethanol option has the least effect in reducing fossil fuel depletion and
climate change when comparing across all rice husk use options. This is because the
cellulosic ethanol option has lowest efficiency in substituting rice husk for fossil fuel
when comparing with other rice husk use options. While rice husk is used directly as a
fuel in the electricity and cement options, it is used as a feedstock to produce cellulosic
ethanol. In addition, the cellulosic ethanol production process requires high intense of
energy and various inputs, which the production processes of these inputs are associated

Chapter 8-Discussion, Conclusions
and Opportunities for Further Research
307
with fossil fuel consumption and greenhouse gas emissions. Moreover, ethanol has
lower energy content than petrol. Therefore, higher volume of E10 is required to
substitute for petrol to operate vehicle on the same distance. These make the cellulosic
ethanol option has lowest efficiency in substituting rice husk for fossil fuel across all
rice husk use options.
When reviewing the LCA results in the context of the key issues such as the Thai energy
policies, the capacity of the production systems, infrastructure availability and the
practicality of the rice husk use systems, the electricity system is the most practical
environmentally friendly option across the three rice husk use systems examined. The
Thai government promotes the use of biomass (including rice husk) energy in the energy
sector to strengthen the security of the country’s energy supply and to reduce greenhouse
gases released from the energy production. In addition, the government has promoted
the privatisation of the energy sector by establishing the Small Power Producers (SPPs)
scheme (including the Very Small Power Producers (VSPPs)) to support small power
producers using renewable energy (including rice husk) as a fuel. With support from the
government, a large number of small rice husk based power producers have been
established, suggesting a large capacity to use rice husk in electricity production
(compared with cement production and cellulosic ethanol production). Moreover, the
technologies of rice husk based electricity production have been proven to be successful,
as rice husk based power plants have operated at a commercial scale in Thailand, for
more than a decade (at least since 1998). Meanwhile, the commercial technologies of the
cellulosic ethanol production are still under development.
Based on the goal and scope, and data available for this research, it is concluded that, in
the short term, using rice husk as a fuel in electricity production is the most practical
environmentally friendly of the three rice husk use options investigated. This conclusion
is made based on the review of the LCA results in the context of the key issues such as
the Thai energy policies, the capacity of the production systems, infrastructure
availability and the practicality of the rice husk use systems. However, with expected oil
shortages in the future, rice husk should also be considered for use in cellulosic ethanol,

Chapter 8-Discussion, Conclusions
and Opportunities for Further Research
308
as this option can help to save some amount of petrol. However, the production process
of rice husk based cellulosic ethanol needs improvement to increase yields while using
less fuel and materials. This may help to increase the amount of the environmental
impacts that are reduced by the cellulosic ethanol system.
The most environmentally friendly disposal option of rice husk ash produced from the
rice husk power plants is the use of the ash in lightweight concrete block production (to
substitute for 40 percent of Portland cement) as this option helps to reduce the greatest
impact (in all impact categories analysed) across all rice husk ash disposal options
investigated (landfill, light weight concrete block production, clay brick production and
soil conditioner). All of the other ash disposal options have relative similar benefits
except landfill. It is suggested that rice husk ash from the rice husk power plants should
never be disposed of in landfill as there is no environmental credit gained by disposing
of the ash in this way. Moreover, the landfill option causes higher impacts than other ash
use options (specifically the impacts on freshwater eutrophication, human toxicity,
freshwater and marine ecotoxicity) than other ash use options. The ash from the rice
husk power plants should be sent to other ash users to be used in industrial applications.
In this way it will gain environmental credit and also give added value to rice husk
power plants. However, it is worthy to note that different rice husk power plants and
different types of ash (bottom and fly ash) produce ash with different characteristics.
Therefore, this may affect how the ash from different rice husk power plants can be
used.
8.7 Opportunities for Further Research
This research has been conducted with the aim to provide the supporting information
about rice husk disposal strategies in Thailand for decision makers. However, because of
time constraints on data collection, this study only considers the environmental aspect of
the major current and potential uses of rice husk. Therefore, to provide stronger
supporting information, further research could consider additional aspects such as the

Chapter 8-Discussion, Conclusions
and Opportunities for Further Research
309
economic and social aspects. As discussed earlier in section 4.6, the LCA results can
only provide the information from an environmental perspective. However, information
on other elements such as costing and social consideration is required in making a
decision of the type made by governments.
The data used in this study are based on the actual practices of rice husk use in Thailand
(for the electricity option and the cement option). This study does not examine different
scenarios of these rice husk uses. Therefore, different scenarios could be investigated.
For example, in the cement option, a different substitution rate of rice husk for coal
should be studied. However, as discussed earlier, the substitution rate used in this
research is the actual rate used by the Thai cement plants (using rice husk to substitute
for 20 percent of coal based on the energy content) because using rice husk to substitute
for coal at this rate does not affect the standard of final cement product and so does not
affect the economics of the product. This means that using rice husk (with the
substitution rate used in this research) will not affect the existing market. However, if
different substitution rates are to be analysed, an economic feasibility study should also
be included.
As stated earlier, the LCI data for the cellulosic ethanol option are based on the database
from European countries, as data on Thai cellulosic ethanol production were not
available at the time of analysis. The use of the data on Thai cellulosic ethanol
production (when they are available) would be more representative for the Thai context
and lead to the more accuracy of the overall LCA results. Similarly, the other unit
processes used in this study, (in the LCI models created in the SimaPro version 7.1.6)
are taken from the databases of other countries such as Australia and some European
countries as the Thai LCI database were not available for use in this research at the time
of analysis. Again, the use of the Thai unit processes would be more representative for
the Thai context. However, for the comparative LCA study such as this study,
consistency of the data across the different options was important.
Chapter 8-Discussion, Conclusions
and Opportunities for Further Research
310
In this study, the LCA results are reviewed in the context of selected key issues,
including Thai energy policies, the capacity of the production systems, infrastructure
availability and practicality of the rice husk use systems. Other issues may be considered
to provide the broader perspective in the consideration of the practicality of using rice
husk and rice husk ash in Thailand.
Though there are different methods of impact assessment, this study uses the ReCiPe
2008, Impact 2002+ and Eco-indicator 99 methods, which were set up in the LCA
software SimaPro version 7.1.6. It would be valuable to see how the results obtained
from other impact methods can be compared with the results obtained from this study.
While LCA is found to be an effective tool to assess the environmental impacts of the
rice husk uses in Thailand, the research into the utility of using LCA to help decision
making between alternative rice husk uses has not been found in literature. Future
research may be undertaken to evaluate how useful LCA is when compared with other
tools, which can be used to assess the environmental impacts of alternative uses of rice
husk.
As discussed earlier, this research aims to provide supporting information about the rice
husk disposal strategies in Thailand (from an environmental point of view) for policy
makers. However, the research to envisage the connections between LCA
implementation on this topic and the Thai government policies and activities has not
been found in literature. Further research could explore the relationship between the
LCA application on the topic and the Thai government policies and activities.

Chapter 9-References
311
9 REFERENCES
Note: The bibliography shown below with mark (*) are translated from the original
Thai publications.
All Thai references used in this thesis are put in the later part of this chapter in
alphabetical order which are described in Thai and the Buddhist Era, which is
543 years older than the Christian Era, is used to indicate the year for these
references.
A. T. Biopower Co. Ltd. n.d., Generation Technology, A. T. Biopower Co., Ltd., viewed 19 February 2008, <http://www.atbiopower.co.th/news_highlights/gen_tech_e.htm>. Aden, A, Ruth, M, Ibsen, K, Jechura, J, Neeves, K, Sheehan, J, Wallace, B, Montague, L, Slayton, A & Lukas, J 2002, Lignocellulosic Biomass to Ethanol Process Design and
Economics Utilizing Co-Current Dilute Acid Prehydrolysis and Enzymatic Hydrolysis
for Corn Stover, NREL/TP-510-32438, National Renewable Energy Laboratory, Colorado. Ahiduzzaman, M 2007, 'Rice Husk Energy Technologies in Bangladesh', Agricultural
Engineering International: the CIGR Ejournal, vol. IX, no. 1. Ahmed, B, Kamruzzaman, M, Ahammed, MZ & Hossain, I 2005, 'Production of high temperature refractory bricks from rice husk ash', J. Bangladesh Soc. Agric. Sci.
Technol., vol. 2, no. 3&4, pp. 45-8. Ajiwe, V, Okeke, C & Akigwe, F 2000, 'A preliminary study of manufacture of cement from rice husk ash', Bioresource Technology, vol. 73, pp. 37-9. Al-Khalaf, MN & Yousif, HA 1984, 'Use of rice husk ash in concrete', International
Journal of Cement Composites and Lightweight Concrete, vol. 6, no. 4, pp. 241-8. Allen, DT & Rosselot, KS 1997, 'Life-Cycle Assessment', in Pollution Prevention for
Chemical Processes, John Wiley & Sons, Inc., New York. Allen, ML 2005, The Manufacture of a Cement Extender from Rice-Husk using Basket-
Burner, viewed 1 August 2006, <http://journeytoforever.org/farm_library/RiceHusks.pdf>.

Chapter 9-References
312
Amornkosit, N 2007, Renewable Energy Policy: Recent Policies on SPP/VSPP, Energy Policy and Planning Office, BITEC, Bangkok, 6 June, <http://www.eppo.go.th/encon/SPP-VSPP-2007-06-06.pdf>. * Anutum, K 2007, Rice husk power plant: Biomass to energy, viewed 8 February 2008, <http://www.thailandindustry.com/home/VisitFactory_preview.php?id=1252§ion=11&rcount=Y>. * Anuwatwong, S 2006, Agricultural wastes as a fuel in power plant, viewed 21 November 2007, <http://www.thailandindustry.com/home/VisitFactory_preview.php?id=488§ion=11&rcount=Y>. Asavapisit, S & Ruengrit, N 2005, 'The role of RHA-blended cement in stabilizing metal-containing wastes', Cement and Concrete Composites, vol. 27, no. 7-8, pp. 782-7. * Asavapisit, S & Piyaphanuwat, R 2005, Survey of Biomass Power Plants in Thailand, Division of Environmental Technology, School of Energy and Materials, King Mongkut's University of Technology Thonburi, Survey. Asavapisit, S & Macphee, DE 2007, 'Immobilization of metal-containing waste in alkali-activated lime-RHA cementitious matrices', Cement and Concrete Research, vol. 37, no. 5, pp. 776-80. Barkakati, P, Bordoloi, D & Borthakur, PC 1994, 'Paddy husk as raw material and fuel for making portland cement', Cement and Concrete Research, vol. 24, no. 4, pp. 613-20. Beagle, EC 1978, Rice-husk, conversion to energy FAO agricultural services bulletin ; 31, Food and Agriculture Organization of the United Nations, Rome. Bergman, MM 2008, Advances in mixed methods research : theories and applications, SAGE, London. Bergqvist, MM, Wardh, KS, Das, A & Ahlgren, EO 2008, 'A techno-economic assessment of rice husk-based power generation in the Mekong River Delta of Vietnam', International Journal of Energy Research, vol. 32, no. 12, pp. 1136-50. Bessant, J & Watts, R 2002, Sociology Australia, 2nd edn, Allen & Unwin, Crows Nest, N.S.W. Bhattacharya, SC, Bhatia, R, Islam, MN & Shah, N 1985, 'Densified biomass in Thailand: Potential, status and problems', Biomass, vol. 8, no. 4, pp. 255-66. Bhattacharya, SC, Arul Joe, M, Kandhekar, Z, Abdul Salam, P & Shrestha, RM 1999, 'Greenhouse-gas emission mitigation from the use of agricultural residues: the case of ricehusk', Energy, vol. 24, no. 1, pp. 43-59.

Chapter 9-References
313
Biofuels Digest 2008, Thai Roong to develop Thailand’s first pilot-scale cellulosic
ethanol plant, Biofuels Digest, viewed 12 July 2009, <http://www.biofuelsdigest.com/blog2/2008/06/20/thai-roong-to-develop-thailands-first-pilot-scale-cellulosic-ethanol-plant/>. Boondaw, S, Yeung, L & Mungkut, R 2005, 'Sustainability Assessment of Wood-Based and Concrete-Based Houses in Thailand Using Life Cycle Assessment', paper presented to Capacity Building on Life Cycle Assessment in APEC Economies, Bangkok, Thailand, 15-16 December. Bronzeoak Ltd. for UK Department of Trade and Industry 2003, Rice Husk Ash Market
Study, UK Department of Trade and Industry. Bryman, A 2001a, 'The nature of qualitative research', in Social Research Methods, Oxford University Press, Oxford, pp. 263-88. ---- 2001b, 'The nature of quantitative research', in Social Research Methods, Oxford University Press, Oxford, pp. 61-81. CDM – Executive Board 2006, Clean Development Mechanism Project Design
Document Form (CDM-PDD), United Nations Framework Convention on Climate Change viewed 8 February 2008, <http://www.dnv.com/focus/climate_change/Upload/Pichit%20PDD%20_Sept%202006_.pdf>. Centre for Design 2006, Professional education course: Life Cycle Assessment 2006, Cradle to grave environmental impact for informed design decisions, Centre for Design, Melbourne. ---- 2008, Professional education course: Life Cycle Assessment 2008, Cradle to grave environmental impact for informed design decisions, Centre for Design, Melbourne. * Chamsing, A, Senanarong, A, Sngiamphongse, S, Sutthivaree, P, Wannarong, K, Khaehanchannarong, Y & Sangpunta, P 2005, Evaluation of Land Preparation
Machinery Using for Irrigated Rice Production Area, Agricultural Engineering Research Institute, Department of Agriculture, Bangkok. Chareonpanich, M, Namto, T, Kongkachuichay, P & Limtrakul, J 2004, 'Synthesis of ZSM-5 zeolite from lignite fly ash and rice husk ash', Fuel Processing Technology, vol. 85, no. 15, pp. 1623-34. * Chatveera, B 2002, 'Properties of Rice Husk Ash Brick', Journal of the National
Research Council of Thailand, vol. 34, no. 1, pp. 95-111.

Chapter 9-References
314
Chatveera, B & Lertwattanaruk, P 2009, 'Evaluation of sulfate resistance of cement mortars containing black rice husk ash', Journal of Environmental Management, vol. 90, no. 3, pp. 1435-41. * Chatveera, B, Uypornprasert, W & Dumrongsil, S 1999, 'Properties of Rice Husk Ash from Bricks Burning Industry', paper presented to the 5th National Convention on Civil Engineering, Hotel Ambassador City Jomtien, 24-26 March. Christensen, TH, Gentil, E, Boldrin, A, Larsen, AW & Hauschild, MZ 2008, 'Biogenic Carbon Accounting in LCA-Modelling: Comparison of Different Criteria', paper presented to ORBIT2008, Wageningen, the Netherlands, 13-15 October. * Chujinda, A 1997, 'Rice Husk Furnace for Fluidized Bed Paddy Dryer ', King Mongkut's University of Technology Thonburi. Chungsangunsit, T 2004, 'Life Cycle Assessment of Energy Production from Rice Husk: A Case Study in Thailand', King Mongkut's University of Technology Thonburi. Chungsangunsit, T, Gheewala, SH & Patumsawad, S 2004, 'Environmental Assessment of Electricity Production from Rice Husk: A Case Study in Thailand', paper presented to International Conference on Electric Supply Industry in Transition : Issues and Prospects for Asia, Bangkok, Thailand, 14 - 16 January. Climate Change Coordinating Unit 2009, CDM, Office of Natural Resources and Environmental Policy and Planning, viewed 24 April 2009, <http://www2.onep.go.th/CDM/en/cdm.html>. Cook, DJ, Pama, RP & Paul, BK 1977, 'Rice husk ash-lime-cement mixes for use in masonry units', Building and Environment, vol. 12, no. 4, pp. 281-8. Coovattanachai, N 2006, Overview of "Biomass to Energy" in Thailand: The Current
Situation and Government Policy, JGSEE, KMUTT, Thailand, The Grand Hotel, Bangkok, 14 February <http://www.jgsee.kmutt.ac.th/new/announcement/30/14Feb06_The%20Grand%20Hotel%20Bangkok-edit-10-2-49.ppt>. Corbetta, P 2003, Social research: theory, methods and techniques SAGE Publications, London. Costa, HMd, Ramos, VD, Visconte, LLY & Furtado, CRG 2006, 'Design and analysis of single-factor experiments: Analysis of variance of the effect of rice husk ash and commercial fillers in NR compounds ', Polymer Bulletin, vol. 58, no. 3, pp. 597-610. Creswell, JW 2009, Research design : qualitative, quantitative, and mixed methods
approaches, Sage Publications, London.

Chapter 9-References
315
Crotty, M 1998, The foundations of social research: meaning and perspective in the
research process, Allen & Unwin, NSW. Curran, MA, Mann, M & Norris, G 2001, Report on the International Workshop on
Electricity Data for Life Cycle Inventories, U.S. Environmental Protection Agency, Cincinnati, Ohio, USA, October 23-25, <http://www.epa.gov/nrmrl/pubs/600r02041/600r02041.pdf>. Daifullah, AAM, Girgis, BS & Gad, HMH 2004, 'A study of the factors affecting the removal of humic acid by activated carbon prepared from biomass material', Colloids
and Surfaces A: Physicochemical and Engineering Aspects, vol. 235, no. 1-3, pp. 1-10. De Vaus, DA 1995, 'Constructing Questionnaires', in Surveys in Social Research 4th edn, Routledge, London. ---- 2001, Research design in social research SAGE, London. Department of Alternative Energy Development and Efficiency (DEDE) 2009, Duties
and Responsibilities, Department of Alternative Energy Development and Efficiency (DEDE), viewed 22 April 2009, <http://www.dede.go.th/dede/index.php?id=478>. * Department of Foreign Trade 2007, Rice Situation, Department of Foreign Trade, viewed 11 January 2009, <http://www.dft.moc.go.th/level4Frame.asp?sPage=the_files/$$8/level4/ricesituation.rtf&level4=640>. * ---- 2008, Thai Rice Export Statistics: Year 2005-2008, Department of Foreign Trade, viewed 11 January 2009, <http://www.dft.moc.go.th/level4Frame.asp?sPage=the_files/$$10/level4/Yc46.htm&level4=223>. * Department of Industrial Works 2009, Factory Profiles Classified by Industry Type, viewed 26 May 2009, <http://www.diw.go.th/diw_web/html/versionthai/data/Download_fac2.asp>. Dong, L, Gao, S, Song, W & Xu, G 2007, 'Experimental study of NO reduction over biomass char', Fuel Processing Technology, vol. 88, no. 7, pp. 707-15. Drislane, R & Parkinson, G 2006, Online dictionary of the social sciences, Athabasca university viewed 5 August 2006, <http://bitbucket.icaap.org/dict.pl?alpha=I>. * Eamopas, K 2004, 'Greenhouse Gases and CDM', Renewable Energy Production and
Environmental Management, no. 1, pp. 15-22. * Editors of Engineering Today 2006, 'Chinat Power Plant Turns Rice Husks to Power and Sell Those of 5000 KW to EGAT', Engineering Today, vol. 4, no. 39, pp. 68-71.

Chapter 9-References
316
* Editors of Industrial technology review 2006, 'Plant Visit at Rice Husk Power Plant', Industrial technology review, vol. 12, no. 154 pp. 186-91. Ekvall, T 2003, 'Attributional and consequential LCI modelling', paper presented to InLCA/LCM 2003, Seattle, Washington, USA, September 22-25. Ekvall, T & Finnveden, G 2001, 'Allocation in ISO 14041--a critical review', Journal of
Cleaner Production, vol. 9, no. 3, pp. 197-208. Ekvall, T & Weidema, BP 2004, 'System Boundaries and Input Data in Consequential Life Cycle Inventory Analysis', The International Journal of Life Cycle Assessment, vol. 9, no. 3, pp. 161 – 71. Ekvall, T, Tillman, A-M & Molander, S 2005, 'Normative ethics and methodology for life cycle assessment', Journal of Cleaner Production, vol. 13, no. 13-14, pp. 1225-34. El-Dakroury, A & Gasser, MS 2008, 'Rice husk ash (RHA) as cement admixture for immobilization of liquid radioactive waste at different temperatures', Journal of Nuclear
Materials, vol. 381, no. 3, pp. 271-7. Electricity Generating Authority of Thailand (EGAT) 2004, Annual Report 2004, Electricity Generating Authority of Thailand (EGAT), Bangkok. ---- 2009, Power Develpment Plan 2007: Revision 2, 912000-5201, Electricity Generating Authority of Thailand (EGAT), Bangkok. Emsley, AM 2007, 'Cellulosic ethanol re-ignites the fire of cellulose degradation ', Cellulose, vol. 15, no. 2, pp. 187-92. Energy Policy and Planning Office 1999, Privatisation and Liberalisation of the Energy
Sector in Thailand, Energy Policy and Planning Office, viewed 20 April 2009, <http://www.eppo.go.th/doc/idp-07-PrivLib.doc>. ---- 2007, Data on IPP, SPP, VSPP, Power Division, Energy Policy and Planning Office, viewed 8 February 2008, <http://www.eppo.go.th/power/data/index.html>. ---- 2009, Data on IPP, SPP, VSPP, Power Policy Bureau, Energy Policy and Planning Office, viewed 20 April 2009, <http://www.eppo.go.th/power/data/index.html>. Energy Policy and Planning Office (EPPO) 2009a, Vision and Mission, Energy Policy Planning Office (EPPO), viewed 22 April 2009, <http://www.eppo.go.th/admin/index_about-E.html>. ---- 2009b, Energy Statistics, Energy Policy Planning Office (EPPO), viewed 25 May 2009, <http://www.eppo.go.th/info/5electricity_stat.htm>.

Chapter 9-References
317
Environmental Impact Evaluation Bureau (EIEB) n. d., Type and sizes of projects or
activities requiring EIA report, Office of Natural Resources and Environmental Policy and Planning (ONEP), viewed 21 February 2008, <http://www.onep.go.th/eia/ENGLISH/size/e_size_index.htm>. Faculty of Engineering Chiang Mai University Thailand 2005, Thai LCA Network, viewed 2 August 2006, <http://doi.eng.cmu.ac.th/Thailca/>. Fang, M, Yang, L, Chen, G, Shi, Z, Luo, Z & Cen, K 2004, 'Experimental study on rice husk combustion in a circulating fluidized bed', Fuel Processing Technology, vol. 85, no. 11, pp. 1273-82. Farrell, AE, Plevin, RJ, Turner, BT, Jones, AD, O’Hare, M & Kammen, DM 2006, 'Ethanol Can Contribute to Energy and Environmental Goals', Science, vol. 311, pp. 506-8. Finnveden, Gr 2000, 'On the Limitations of Life Cycle Assessment and Environmental Systems Analysis Tools in General', The International Journal of Life Cycle Assessment, vol. 5, no. 4, pp. 229-38. Gajaseni, J 1995, 'Energy analysis of wetland rice systems in Thailand', Agriculture,
Ecosystems & Environment, vol. 52, no. 2-3, pp. 173-8. Goedkoop, M & Spriensma, R 2001, Eco-indicator 99 : A damage oriented method for
Life Cycle Impact Assessment : Methodology Report, PRé Consultants, Amersfoot, Netherlands. Goedkoop, M, Effting, S & Collignon, M 2000, Eco-indicator 99 : A damage oriented
method for Life-Cycle Impact Assessment : Manual for Designers, PRé Consultants, Amersfoot, Netherlands. Goedkoop, M, Heijungs, R, Huijbregts, M, Schryver, AD, Struijs, J & Zelm, Rv 2009, ReCiPe 2008: A life cycle impact assessment method which comprises harmonised
category indicators at the midpoint and the endpoint level, First edition, Report I:
Characterisation, Ministry of Housing, Spatial Planning and the Environment (VROM), the Netherlands. Goettemoeller, J & Goettemoeller, A 2007, Sustainable ethanol : biofuels, biorefineries,
cellulosic biomass, flex-fuel vehicles, and sustainable farming for energy independence
Prairie Oak Pub., Maryville, MO. Gonçalves, MRF & Bergmann, CP 2007, 'Thermal insulators made with rice husk ashes: Production and correlation between properties and microstructure', Construction and
Building Materials, vol. 21, no. 12, pp. 2059-65.

Chapter 9-References
318
Graf, A & Koehler, T 2000, 'Appendix B: Overview of Cellulose-Ethanol Production Technology', in Oregon Cellulose-Ethanol Study: An evaluation of the potential for
ethanol production in Oregon using cellulose-based feedstocks, Oregon Office of Energy, pp. 57-60. Grant, T, Beer, T, Campbell, PK & Batten, D 2008, Life Cycle Assessment of
Environmental Outcomes and Greenhouse Gas Emissions from Biofuels Production in
Western Australia, Report KN29A/WA/F2.6, Department of Agriculture and Food Government of Western Australia. Guinee, JB (ed.) 2002, Handbook on life cycle assessment : operational guide to the ISO
standards, vol. 7, Eco-Efficiency in Industry and Science, Kluwer Academic Publishers, Dordrecht. Haagen-Smith, AJ & Bradley, CE 1953, 'Ozone Formation in Photochemical Oxidation of Organic Substances', Industrial and Engineering Chemistry, vol. 45, no. 9, pp. 2086-9. Hahn-Hägerdal, B, Galbe, M, Gorwa-Grauslund, MF, Lidén, G & Zacchi, G 2006, 'Bio-ethanol - the fuel of tomorrow from the residues of today', Trends in Biotechnology, vol. 24, no. 12, pp. 549-56. Hamad, MA 1981, 'Combustion of rice hulls in a static bed', Energy in Agriculture, vol. 1, pp. 311-5. Hammersley, M 1992, 'Deconstructing the qualitative-quantitative divide', in J Brannen (ed.), Mixing Methods: Qualitative and Quantitative Research, Avebury, Aldershot, pp. 39-55. Hayashi, K, Okazaki, M, Itsubo, N & Inaba, A 2004, 'Development of damage function of acidification for terrestrial ecosystems based on the effect of aluminum toxicity on net primary production ', The International Journal of Life Cycle Assessment, vol. 9, no. 1, pp. 13-22. Hessler, RM 1992, 'Interviewing', in Social Research Methods, West Pub. Co, St. Paul. Humbert, S, Margni, M & Jolliet, O 2005, IMPACT 2002+:User Guide, Draft for
version 2.1, Industrial Ecology & Life Cycle Systems Group, GECOS, Swiss Federal Institute of Technology Lausanne (EPFL), Lausanne, Switzerland. Hwang, CL & Chandra, S 1997, 'The Use of Rice Husk Ash in Concrete', in S Chandra (ed.), Waste materials used in concrete manufacturing, William Andrew. Industrial Power Technology Pte Ltd. n.d., Project References, viewed 19 December 2007, <http://www.ipttech.net/sommai.htm>.

Chapter 9-References
319
Intarapravich, D 1991, Coal and the environment in Thailand Honolulu, Hawaii, USA, 11-12 July, <http://www.tdri.or.th/reports/published/n20.pdf>. International Organization for Standardization 2000, Environmental management : life
cycle assessment - examples of application of ISO 14041 to goal and scope definition
and inventory analysis = Management environnemental : analyse du cycle de vie -
exemples d'application de l'ISO 14041 traitant de la d'efinition de l'objectif et du champ
d'etude et analyse de l'inventaire, 1 st. edn, ISO/TR 14049:2000(E), ISO, Geneva, Switzerland ---- 2006a, Environmental management : life cycle assessment ; principles and
framework = Management environnemental - analyse du cycle de vie - principes et
cadre, 2 nd. edn, ISO 14040:2006, ISO, Geneva, Switzerland ---- 2006b, Environmental management : life cycle assessment ; requirements and
guidelines = Management environnemental - analyse du cycle de vie - principes et
cadre, 1 st. edn, ISO 14044:2006, ISO, Geneva, Switzerland International Resources Group (IRG) for USAID 2007, Thailand Country Report: from
Ideas to Action: Clean Energy Solutions for Asia to Address Climate Change, the United States Agency for International Development (USAID). International Rice Research Institute 2003, Rice: Seed to Market, International Rice Research Institute, viewed 18 December 2008, <http://www.knowledgebank.irri.org/Rice/Ricedefault.htm>. ---- 2008a, Commercial rice milling systems: byproducts and their utilization, International Rice Research Institute, viewed 3 March 2009, <http://www.knowledgebank.irri.org/riceMilling/default.htm>. ---- 2008b, World Rice Statistics, International Rice Research Institute, viewed 11 January 2009, <http://beta.irri.org/statistics/index.php?option=com_frontpage&Itemid=1>. IPCC 2006, 2006 IPCC Guidelines for National Greenhouse Gas Inventories: Volume 4
Agriculture, Forestry and Other Land Use the National Greenhouse Gas Inventories Programme, Japan. Ishak, ZAM, Bakar, AA, Ishiaku, US, Hashim, AS & Azahari, B 1997, 'An investigation of the potential of rice husk ash as a filler for epoxidized natural rubber--II. Fatigue behaviour', European Polymer Journal, vol. 33, no. 1, pp. 73-9. Jain, A, Rajeswara Rao, T, Sambi, SS & Grover, PD 1994, 'Energy and chemicals from rice husk', Biomass and Bioenergy, vol. 7, no. 1-6, pp. 285-9.

Chapter 9-References
320
Janvijitsakul, K & Kuprianov, VI 2008, 'Major gaseous and PAH emissions from a fluidized-bed combustor firing rice husk with high combustion efficiency', Fuel
Processing Technology, vol. 89, no. 8, pp. 777-87. Ji-lu, Z 2007, 'Bio-oil from fast pyrolysis of rice husk: Yields and related properties and improvement of the pyrolysis system', Journal of Analytical and Applied Pyrolysis, vol. 80, no. 1, pp. 30-5. Jiamjumrussil, K, Charoenpanich, M, Mungcharoen, T, Malakul, P, Yuvaniyama, C, Papong, S & Chomhumsri, K 2005, 'Life Cycle Assessment of Powder Coating Paints in Thailand', paper presented to Capacity Building on Life Cycle Assessment in APEC Economies, Bangkok, Thailand, 15-16 December. Jolliet, O, Margni, M, Charles, R, Humbert, S, Payet, J, Rebitzer, G & Rosenbaum, R 2003, 'IMPACT 2002+: A new life cycle impact assessment methodology', The
International Journal of Life Cycle Assessment, vol. 8, no. 6, pp. 324-30. Juangthaworn, A, Mungcharoen, N, Poovarodom, N & Mungkung, R 2005, 'Life Cycle Assessment of Polysty Compare to Cassava Starch Food Packaging', paper presented to Capacity Building on Life Cycle Assessment in APEC Economies, Bangkok, Thailand, 15-16 December. Jude, MJ 2003, A Case Study on a Rice Husk Cogeneration Power Plant, Sunway Hotel, Phnom Penh, Cambodia, 26-27 March, <http://www.cd4cdm.org/Asia/Cambodia/First%20National%20Workshop/G-Angkor%20Rice-MJ-Mar03.ppt#256,1,Slide 1>. Jungbluth, N, Emmenegger, MF, Dinkel, F, Stettler, C, Doka, G, Chudacoff, M, Dauriat, A, Gnansounou, E, Sutter, J, Spielmann, M, Kljun, N, Keller, M & Schleiss, K 2007, Life Cycle Inventories of Bioenergy: Data v2.0 (2007), ecoinvent report No. 17, ESU-services Ltd., Uster. Kalayanamitr, C 2004, 'Thai Cogeneration Policy Experiences', paper presented to Experiences 2004 Cogeneration Day in Lao PDR, Lane Xang Hotel, Vientiane, Lao PDR, 2 October 2004, <http://www.cogen3.net/presentations/asean/cogendayk2004Lao/Thaicogenerationpolicyexperience.pdf>. * Kanarkard, S & Pensuwan, W 2002, 'Compressive strength of concrete block blended with rice husk ash', paper presented to the 8th National Convention on Civil Engineering, Hotel Sofitel Raja Orchid, Khon Kaen, Thailand 23-25 October. Kapur, PC 1980, 'Thermal insulations from rice husk ash, an agricultural waste', Ceramurgia International, vol. 6, no. 2, pp. 75-8.

Chapter 9-References
321
Kiatkittipong, W, Wongsuchoto, P & Pavasant, P 2009, 'Life cycle assessment of bagasse waste management options', Waste Management, vol. 29, no. 5, pp. 1628-33. Kiatsiriroat, T, Vorayos, N, Sampattagul, S & Chaiwong, K 2005, 'Use of LCA as a tool for Energy and Environmental Management in industry: A Case Study of a Frozen-food factory.' paper presented to Capacity Building on Life Cycle Assessment in APEC Economies, Bangkok, Thailand, 15-16 December. Kim Oanh, NT, Albina, DO, Ping, L & Wang, X 2005, 'Emission of particulate matter and polycyclic aromatic hydrocarbons from select cookstove-fuel systems in Asia', Biomass and Bioenergy, vol. 28, no. 6, pp. 579-90. Kruger, P 2006, Alternative energy resources : the quest for sustainable energy, John Wiley & Sons, Hoboken, New Jersey. Kumagai, S, Noguchi, Y, Kurimoto, Y & Takeda, K 2007, 'Oil adsorbent produced by the carbonization of rice husks', Waste Management, vol. 27, no. 4, pp. 554-61. Kunimitsu, Y & Ueda, T 2005, 'Macro Economic Impacts of Installing Rice Husk Electricity Power Plants in Thailand', paper presented to Biomass Asia Workshop 2, Bangkok, Thailand, 13-15 December. Kurama, S & Kurama, H 2008, 'The reaction kinetics of rice husk based cordierite ceramics', Ceramics International, vol. 34, no. 2, pp. 269-72. Lemarchand, D 2000, 'Burning issues', International Cement Review, pp. 65-7. Lertsuridej, P 2004, 'Policy on New and Renewable Energy Technology Promotion in Thailand', 14th International Photovoltaic Science and Engineering Conference, 26-30 January Liamsanguan, C & Gheewala, SH 2008, 'LCA: A decision support tool for environmental assessment of MSW management systems', Journal of Environmental
Management, vol. 87, no. 1, pp. 132-8. Life Cycle Initiative 2009, About the Life Cycle Initiative, Life Cycle Initiative, viewed 9 August 2009. Lin, Y & Tanaka, S 2006, 'Ethanol fermentation from biomass resources: current state and prospects', Applied Microbiology and Biotechnology, vol. 69, no. 6, pp. 627-42. Lohsomboon, P & Jirajariyavech, A 2003, Final Report for the Project on Life Cycle
Assessment for Asian Countries - Phase III, Business and Environment Program, Thailand Environment Institute, Bangkok.

Chapter 9-References
322
Lundie, S & Peters, G 2005, 'Cycle Assessment of Food Waste Management Options', Journal of Cleaner Production, vol. 13, pp. 275-86. Madhiyanon, T, Lapirattanakun, A, Sathitruangsak, P & Soponronnarit, S 2006, 'A novel cyclonic fluidized-bed combustor ([psi]-FBC): Combustion and thermal efficiency, temperature distributions, combustion intensity, and emission of pollutants', Combustion
and Flame, vol. 146, no. 1-2, pp. 232-45. Maeda, N, Wada, I, Kawakami, M, Ueda, T & Pushpalal, G 2001, 'Development oF a New Furnace for the Production of Rice Husk Ash ', paper presented to Seventh CANMET/ACI International Conference on Fly Ash, Silica Fume, Slag and Natural Pozzolans in Concrete Chennai (Madras), India, 22-27 July 2001. Mahamud, A 1986, 'Burning of Rice Husk for Power Generation', paper presented to ASEAN Conference on Energy from Biomass: Development Towards Efficient Utilization of Biomass Energy, Penang, Malaysia, 13-15 October. Malakul, P, Piumsomboon, P, Pruitichaiwiboon, P, Charutavai, K & Mungcharoen, T 2005, 'National LCI Database Development in Thailand', paper presented to Capacity Building on Life Cycle Assessment in APEC Economies, Bangkok, Thailand, 15-16 December. Manurung, R, Susanto, H & Sudarno, H 1986, 'Experiences in the Operation of Rice Husk Gasification for Rural Electricity', paper presented to ASEAN Conference on Energy from Biomass: Development Towards Efficient Utilization of Biomass Energy, Penang, Malaysia, 13-15 October. Mathias, AJ 2004, Successful Development of A Cogeneration Project: A Case Study in
the Rice Milling Industry, The Centrepoint Hotel, Bandar Seri Begawan, 23-24 November, <http://www.cogen3.net/presentations/asean/cogenweek2004brunei/Riceindustrycogeneration.pdf>. McDougall, F, White, P, Franke, M & Hindle, P 2001, 'Life cycle assessment', in Integrated Solid Waste Management: A life cycle inventory, 2 nd edn, Blackwell Science, Malden, pp. 85-102. Meechumma, P, Wiwattanadate, D & Tangtrakul, M 2005, 'Life Cycle Assessment of Coal Utilization in Coal-Fired Boilers', paper presented to Capacity Building on Life Cycle Assessment in APEC Economies, Bangkok, Thailand, 15-16 December. Mehta, PK & Pitt, N 1976, 'Energy and industrial materials from crop residues', Resource Recovery and Conservation, vol. 2, no. 1, pp. 23-38. * Ministry of Energy 2009, Energy Policy, viewed 20 April 2009, <http://www.energy.go.th/moen/Index.aspx?MenuID=212>.

Chapter 9-References
323
Mokrzycki, E & Uliasz- Bochenczyk, A 2003, 'Alternative fuels for the cement industry', Applied Energy, vol. 74, no. 1-2, pp. 95-100. Mungcharoen, T, Boonyawatana, S, Papong, S, Malakul, P, Tongsri, R, Vachanrat, C & Bunkum, S 2005, 'Application of Life Cycle Assessment and EcoDesign for Eco-Product Development in Thailand: Case Study for Eco-Compressor', paper presented to Capacity Building on Life Cycle Assessment in APEC Economies, Bangkok, Thailand, 15-16 December. Mungkung, RT, Haes, HAUd & Clift, R 2005, 'Potentials and Limitations of Life Cycle Assessment in Setting EcoLabelling Criteria: A Case Study of Thai Shrimp Aquaculture Product', paper presented to Capacity Building on Life Cycle Assessment in APEC Economies, Bangkok, Thailand, 15-16 December. Murray, A & Price, L 2008, Use of Alternative Fuels in Cement Manufacture: Analysis
of Fuel Characteristics and Feasibility for Use in the Chinese Cement Sector, Office of Technology Cooperation and Assistance, U.S. Environmental Protection Agency. Muthadhi, A, Anitha, R & Kothandaraman, S 2007, 'Rice Husk Ash — Properties and its Uses : A Review', Journal of the Institution of Engineers (India). Civil Engineering
Division (Online), vol. 88, pp. 50-6. * Nadsathaporn, H 2007, 'Environmental Life Cycle Assessment of Rice Products', Suranaree University of Technology. Nair, DG, Jagadish, KS & Fraaij, A 2006, 'Reactive pozzolanas from rice husk ash: An alternative to cement for rural housing', Cement and Concrete Research, vol. 36, no. 6, pp. 1062-71. * National Energy Policy Office 2002, 'Promotion of the Utilization of Biomass in Thailand', Energy Policy Journal, no. 55. Nehdi, M, Duquette, J & El Damatty, A 2003, 'Performance of rice husk ash produced using a new technology as a mineral admixture in concrete', Cement and Concrete
Research, vol. 33, no. 8, pp. 1203-10. Nguyen, NT 2005, 'Rice husk potential and utilization in Vietnam', paper presented to Biomass Asia Workshop 2, Bangkok, Thailand, 13-15 December. Nguyen, TLT & Gheewala, SH 2008, 'Fuel ethanol from cane molasses in Thailand: Environmental and cost performance', Energy Policy, vol. 36, no. 5, pp. 1589-99. Office of Agricultural Economics 2007a, Rice: Harvested area, production and yield of
major countries, 2005-2007, Office of Agricultural Economics, viewed 8 January 2009, <http://www.oae.go.th/statistic/yearbook50/section1/sec1rice.pdf>.

Chapter 9-References
324
---- 2007b, Major rice: Area, production and yield by region and province, 2005-2007, Office of Agricultural Economics, viewed 8 January 2009, <http://www.oae.go.th/statistic/yearbook50/section1/sec1table4.pdf>. ---- 2008, Second rice: Area, production and yield by region and province, 2006-2008, Office of Agricultural Economics, viewed 8 January 2009, <http://www.oae.go.th/statistic/yearbook50/section1/sec1table6.pdf>. * Office of Industrial Economics 2009, Industry Statistics, viewed 26 May 2009, <http://www.oie.go.th/industrystat_th.asp>. Office of the National Economic and Social Development Board 1992, The Seventh
National Economic and Social Development Plan (1992-1996), Office of the National Economic and Social Development Board, viewed 15 April 2009, <http://www.nesdb.go.th/Default.aspx?tabid=89>. ---- 1997, The Eighth National Economic and Social Development Plan (1997-2001), Office of the National Economic and Social Development Board, viewed 15 April 2009, <http://www.nesdb.go.th/Default.aspx?tabid=90>. ---- 2002, The Ninth National Economic and Social Development Plan (2002-2006), Office of the National Economic and Social Development Board, viewed 15 April 2009, <http://www.nesdb.go.th/Default.aspx?tabid=91>. ---- 2007, Summary of the Tenth National Economic and Social Development Plan
(2007-2011), Office of the National Economic and Social Development Board, viewed 15 April 2009, <http://www.nesdb.go.th/Default.aspx?tabid=139>. Padhi, BK & Patnaikb, C 1995, 'Development of Si,N,O, S&N, and Sic Ceramic Materials Using Rice Husk', Ceramics International, vol. 21, no. 213-220, pp. 269-72. Papong, S, Yuvaniyama, C, Lohsomboon, P & Malakul, P 2004, Overview of Biomass
Utilization in Thailand, Cleaner Technology Advancement Program, National Metal and Material Technology Center, Bangkok. * Parntaewan, A 2006, 'The Pichit plant: the first rice husk fuelled power plant to use Suspension Firing System', Engineering Today, vol. 4, no. 43, pp. 72-6. Patel, M, Karera, A & Prasanna, P 1987, 'Effect of thermal and chemical treatments on carbon and silica contents in rice husk ', Journal of Materials Science, vol. 22, no. 7, pp. 2457-64. Permchart, W & Kouprianov, VI 2004, 'Emission performance and combustion efficiency of a conical fluidized-bed combustor firing various biomass fuels', Bioresource Technology, vol. 92, no. 1, pp. 83-91.

Chapter 9-References
325
Pletka, R 2000, Biomass-Based Power Generation and Cogeneration within Small Rural
Industries of Thailand, Black & Veatch Corporation, Kansas, USA. Praiwan, Y 2008, 'First bagasse ethanol plant ready to open', Bangkok Post, 20 June. * Prasara-A, J 2004, 'A Study of the Use of Lime - Rice Husk Ash in Paving Block ', King Mongkut's University of Technology Thonburi. Prasertsan, S & Sajjakulnukit, B 2006, 'Biomass and biogas energy in Thailand: Potential, opportunity and barriers', Renewable Energy, vol. 31, no. 5, pp. 599-610. Prasetyoko, D, Ramli, Z, Endud, S, Hamdan, H & Sulikowski, B 2006, 'Conversion of rice husk ash to zeolite beta', Waste Management, vol. 26, no. 10, pp. 1173-9. PRé Consultants 2006, SimaPro 7 the powerful Life Cycle tool, viewed 1 August 2006, <http://www.pre.nl/simapro/simapro_lca_software.htm>. ---- 2008, SimaPro 7: Introduction into LCA, Report version 4.2. Proctor, DL 1994, Grain storage techniques - Evolution and trends in developing
countries FAO, viewed 23 January 2008, <http://www.fao.org/docrep/T1838E/T1838E00.htm#Contents>. * Rice Department 2008, Rice Knowledge Bank, Rice Department, viewed 20 January 2009, <http://www.ricethailand.go.th/rkb/index.html>. Rice Engineering Supply Co. Ltd. 2008a, Cyclonic Husk Furnace, Rice Engineering Supply Co., Ltd., viewed 28 January 2008, <http://www.riceengineer.com/index.php?option=com_content&task=view&id=39&Itemid=80>. ---- 2008b, Drying System, Rice Engineering Supply Co., Ltd., viewed 28 January 2008, <http://www.riceengineer.com/index.php?option=com_content&task=blogcategory&id=13&Itemid=79>. ---- 2008c, Fluidized Bed Dryer, Rice Engineering Supply Co., Ltd., viewed 28 January 2008, <http://www.riceengineer.com/index.php?option=com_content&task=view&id=40&Itemid=81>. ---- n.d., Drying Machines, Rice Engineering Supply Co., Ltd., viewed 28 January 2008, <http://www.riceengineer.com/catalogue/spec%20of%20drying.pdf>. Rice, G, Clift, R & Burns, R 1997, 'Comparison of currently available european LCA software', The International Journal of Life Cycle Assessment, vol. 2, no. 1, pp. 53-9.

Chapter 9-References
326
Rosillo-Calle, F, De Groot, P, Hemstock, SL & Woods, J (eds) 2007, The biomass
assessment handbook : bioenergy for a sustainable environment, Earthscan, London. Saha, BC & Cotta, MA 2007, 'Enzymatic saccharification and fermentation of alkaline peroxide pretreated rice hulls to ethanol', Enzyme and Microbial Technology, vol. 41, no. 4, pp. 528-32. ---- 2008, 'Lime pretreatment, enzymatic saccharification and fermentation of rice hulls to ethanol', Biomass and Bioenergy, vol. 32, no. 10, pp. 971-7. Saha, BC, Iten, LB, Cotta, MA & Wu, YV 2005, 'Dilute Acid Pretreatment, Enzymatic Saccharification, and Fermentation of Rice Hulls to Ethanol', Biotechnol. Prog., vol. 21, pp. 816-22. Sajjakulnukit, B, Maneekhao, V & Pongnarintasut, V 2002, 'Policy analysis to identify the barriers to the development of bioenergy in Thailand', Energy for Sustainable
Development, vol. 6, no. 3, pp. 21-30. Sampattagul, S, Kato, S, Kiatsiriroat, T & Widiyanto, A 2004, 'Life cycle considerations of the flue gas desulphurization system at a lignite-fired power plant in Thailand ', The
International Journal of Life Cycle Assessment, vol. 9, no. 6, pp. 387-93. Seo, ESM, Andreoli, M & Chiba, R 2003, 'Silicon tetrachloride production by chlorination method using rice husk as raw material', Journal of Materials Processing
Technology, vol. 141, no. 3, pp. 351-6. * Siamwalla, A & NaRanong, V 1990, Knowledge of Rice, Thailand Development Research Institute (TDRI), Bangkok. Siqueira, EJ, Yoshida, IVP, Pardini, LC & Schiavon, MA 2009, 'Preparation and characterization of ceramic composites derived from rice husk ash and polysiloxane', Ceramics International, vol. 35, no. 1, pp. 213-20. Smith, P, Martino, D, Cai, Z, Gwary, D, Janzen, H, Kumar, P, McCarl, B, Ogle, S, O'Mara, F, Rice, C, Scholes, B, Sirotenko, O, Howden, M, McAllister, T, Pan, G, Romanenkov, V, Schneider, U & Towprayoon, S 2007, 'Policy and technological constraints to implementation of greenhouse gas mitigation options in agriculture', Agriculture, Ecosystems & Environment, vol. 118, no. 1-4, pp. 6-28. Society for Environmental Toxicology and Chemistry (SETAC) n.d., Life-Cycle
Assessment (LCA), viewed 25 July 2009, <http://www.setac.org/node/32>. * Songmuang, P 2000, Use of Organic Fertilizers in Rice Field, Division of Soil Science, Department of Agriculture, Bangkok.

Chapter 9-References
327
Sookkumnerd, C, Ito, N & Kito, K 2007, 'Feasibility of husk-fuelled steam engines as prime mover of grid-connected generators under the Thai very small renewable energy power producer (VSPP) program', Journal of Cleaner Production, vol. 15, no. 3, pp. 266-74. * Sookkumnerd, C, Chinsuwan, A, Chaisut, K & Watyotha, C 2001, Potential of
utilization of rice husk as energy source for rice mill, Postharvest Technology Information Network, Chiang Mai University, Thailand, viewed 7 December 2007, <http://www.phtnet.org/download/FullPaper/pdf/1stSeminarCMU/ae072.pdf>. * Soponronnarit, S & et al. 2000, 'Cyclonic Rice Husk Furnace for Paddy Drying', Journal of the Royal Institute, vol. 26, no. 2, pp. 68-80. Srisovanna, P 2004, 'Thailand's Biomass Energy', paper presented to Electricity Supply Industry in Transition: Issues and Prospect for Asia, AIT, Thailand, 14-16 January. Stroeven, P, Bui, DD & Sabuni, E 1999, 'Ash of vegetable waste used for economic production of low to high strength hydraulic binders', Fuel, vol. 78, no. 2, pp. 153-9. Stucley, C 2006, Prospects for Pyrolysis Bio-oil in Australia, the Esplanade Hotel, Fremantle 6-7 December, <http://www.renoil.com.au/BioenergyConf.pdf>. Sujirote, K & Leangsuwan, P 2003, 'Silicon carbide formation from pretreated rice husks', Journal of Materials Science, vol. 38, pp. 4739-44. Suramaythangkoor, T & Gheewala, SH 2008, 'Potential of practical implementation of rice straw-based power generation in Thailand', Energy Policy, vol. 36, no. 8, pp. 3193-7. Sustainable Energy Technology at Work n.d., A.T. Biopower Rice Husk Power project in
Pichit, Sustainable Energy Technology at Work, viewed 19 February 2008, <http://www.setatwork.eu/downloads/gp9%20Thailand_AT_Biopower.pdf>. Suwannakhanthi, N 2004, Overview for Thailand’s Renewable Energy Focusing on
Biomass Energy, Bureau of Energy Research, Department of Alternative Energy Development and Efficiency, Bangkok. Swasdisevi, T, Soponronnarit, S, Shujinda, A, Wetchacama, S & Thepant, V 1998, 'Rice husk furnace for fluidized bed paddy dryer ', Compiled Research and Technical Papers,
KMITT, pp. 628-36. * Tauon, M & Panchapan, S 2002, 'Development of rice-residue application in agriculture ', Journal of Academic Service Centre Khon Kaen University, vol. 10, no. 1, pp. 72-8.

Chapter 9-References
328
* Thai Industrial Standards Institute 1990, Thai Industrial Standard TIS 58-2533:
Hollow non load bearing concrete masonry units, Ministry of Industry, Bangkok. * ---- 2002, Thai Industrial Standard TIS 77-2545: Building bricks, Ministry of Industry, Bangkok. Thai Rice Foundation under Royal Patronage 2006, All about rice: origin, Thai Rice Foundation under Royal Patronage, viewed 17 December 2008, <http://www.thairice.org/eng/aboutRice/origin.htm>. * Thailand Environment Institute (TEI) 2004a, Handbook on Life Cycle Assessment of
Product, Thailand Environment Institute (TEI), Bangkok. ---- 2004b, Life Cycle Inventory for Cement Product and Steel Making towards
Sustainable Development: Final report for the Thailand Research Fund, Thailand Environment Institute (TEI), Bangkok. The EC-ASEAN COGEN Programme 1998, Evaluation of Conditions for Electricity
Production Based on Biomass: Final report for RAMBOLL, The EC-ASEAN COGEN Programme, Bangkok. * Thepent, V n.d., Grain dryers, Agricultural Engineering Research Institute, Dapertment of Agriculture, viewed 22 January 2008, <http://www.doa.go.th/AedWeb/Dryer.htm>. * Thepnoo, K 2006, 'Study of Utilization of Rice Husk Ash from Small Scale Biomass Power Plant', King Mongkut's University of Technology Thonburi. Thomas, I 2005, Environmental Management Processes and Practices for Australia, 1st, edn, The Federation Press, Sydney. Tibor, T & Feldman, I 1996, 'Life cycle assessment', in ISO 14000: A guide to the new
environmental management standards, 1st, edn, Irwin Professional, Chicago, pp. 131-50. Tillman, A-M 2000, 'Significance of decision-making for LCA methodology', Environmental Impact Assessment Review, vol. 20, no. 1, pp. 113-23. Tinsuntisook, P 2007, Promotion of Renewable Energy Technologies: Action Plan for
the Development of the Market in Thailand, The Federation of Thai Industries, viewed 18 December 2007, <http://internet1.off.fti.or.th/filemanager/data/internet/2007_IEI/5E_RenewableEnergy.pdf>.

Chapter 9-References
329
Toan, PK, Cuong, ND & Leon, MA 2005, 'Activities and Achievements of a Biomass Briquetting Project in Vietnam', paper presented to World Renewable Energy Regional Conference, Jakarta, Indonesia, 18-21 April Towprayoon, S, Smakgahn, K & Poonkaew, S 2005, 'Mitigation of methane and nitrous oxide emissions from drained irrigated rice fields', Chemosphere, vol. 59, no. 11, pp. 1547-56. U.S. Department oF Energy n. d., Bioenergy, U.S. Department oF Energy, viewed 5 May 2009, <http://www.energy.gov/energysources/bioenergy.htm>. Ueda, T, Kunimitsu, Y & Shinogi, Y 2005, 'Reuse of rice husk in Thailand', paper presented to Biomass Asia Workshop 2, Bangkok, Thailand, 13-15 December. ---- 2007, 'Potential conflicts for the reuse of rice husk in Thailand', Paddy and Water
Environment, vol. 5, no. 2, pp. 123-9. UNFCCC Secretariat 2009a, List of DOEs, United Nations Framework Convention on Climate Change, viewed 25 Augustl 2009, <http://cdm.unfccc.int/DOE/list/index.html>. ---- 2009b, Project Search, United Nations Framework Convention on Climate Change, viewed 25 April 2009, <http://cdm.unfccc.int/Projects/projsearch.html>. United Nations Environment Programme 2005, Integrated Assessment of the Impact of
Trade Liberalization on the Rice Sector: UNEP Country Projects Round III : a Synthesis
Report, United Nations Environment Programme. United Nations Framework Convention on Climate Change (UNFCCC) 2009, About
CDM, United Nations Framework Convention on Climate Change (UNFCCC), viewed 24 April 2009, <http://cdm.unfccc.int/about/index.html>. Viseshakul, P 2005, 'Life Cycle Assessment for Bio-Fuel's Pricing Policy', paper presented to Capacity Building on Life Cycle Assessment in APEC Economies, Bangkok, Thailand, 15-16 December. Visvanathan, C & Chiemchaisri, C 2006, Management of Agricultural Wastes and
Residues in Thailand: Wastes to Energy Approach, Putrajaya, Malaysia, 21-23 March, <http://www.swlf.ait.ac.th/UpdData/International/MAWA.pdf>. Weidema, B 2001, 'Avoiding Co-Product Allocation in Life-Cycle Assessment', Journal
of Industrial Ecology, vol. 4, no. 3, pp. 11-33. Williams, J 2005, 'Countdown to Commercialization', Ethanol Producer Magazine, no. April 2005.

Chapter 9-References
330
Williams, PT & Nugranad, N 2000, 'Comparison of products from the pyrolysis and catalytic pyrolysis of rice husks', Energy, vol. 25, no. 6, pp. 493-513. Witchakorn, C & Bundit, E-A 2004, 'Sizing and Location of Electricity Power Generation from Rice Husk in Thailand', paper presented to 19th World Energy Congress, Sydney, Australia. * Wutisin, P & et al. n. d., Cyclonic Husk Furnace, Agricultural Engineering Research Institute Department of Agriculture, viewed 22 January 2008, <http://www.doa.go.th/AedWeb/Cyclone.htm>. Yonemura, S & Kawashima, S 2007, 'Concentrations of carbon gases and oxygen and their emission ratios from the combustion of rice hulls in a wind tunnel', Atmospheric
Environment, vol. 41, no. 7, pp. 1407-16.
Thai References
�ก�� ���� 2549, ก�� �ก��ก��������������ก�����ก��������� !��"#�#���$��%ก,
#&���&�'���&((�#&��� �)*�����+,-&* )���#&����.����")&/��#$���� .,���+��� )&/��#$�������#+)$0 ���#&����+���.����"�������ก���'�0�", ก�0�������.�.
�ก"��*& +ก$&2 �0'��� 2550, ���� !��"#�#���34����&��ก�� ��ก�3�)5��+���, viewed 8 February
2008, <http://www.thailandindustry.com/home/VisitFactory_preview.php?id=1252§ion=11&rcount=Y>.
� ��6ก�(�� �0#+*�#� � 2549, ���� !����� �#+)$0���3�������ก���ก�*���7��34����&�, viewed
21 November 2007, <http://www.thailandindustry.com/home/VisitFactory_preview.php?id=488§ion=11&rcount=Y>.
กก +ก$&2 ��"/����8�) 2547, 'Greenhouse Gases and CDM', #��)������9�&*��+����$�����ก���+$ก��)&/��#$���� :�+��"/ 1 ��� 15-22.
ก��������0*)��ก��� 2552, ����������*������8�������0*)��ก���, viewed 26 May
2009, <http://www.diw.go.th/diw_web/html/versionthai/data/Download_fac2.asp>.

Chapter 9-References
331
ก��ก�����# 2552, ��.�.#������3/�����#, viewed 20 January 2009,
<http://www.brrd.in.th/rkb/>.
ก��ก��.��*5������� 2552a, )��ก��,����#, viewed 11 January 2009,
<http://www.dft.moc.go.th/level4Frame.asp?sPage=the_files/$$8/level4/ricesituation.rtf&level4=640>.
---- 2552b, ��&��,ก��)5���ก���#������ �; 2548-2551 (�.. . - �.�(., viewed 11 January
2009, <http://www.dft.moc.go.th/level4Frame.asp?sPage=the_files/$$10/level4/Yc46.htm&level4=223>.
ก����#���+��� 2552, �������+����������� , viewed 20 April 2009,
<http://www.energy.go.th/moen/Index.aspx?MenuID=212>.
ก�����,�'&ก�� (Engineering Today) 2549, '���� !��+���������ก����7� !� �!� ก 9 .5,000 ก&��#+**�', Engineering Today �;�"/ 4 :�+��"/ 39 ��� 68-71.
ก�����,�'&ก�� (Industrial technology review) 2549, '��"/���� ������ !��"#�#���34����&� "�ก��"', Industrial technology review �;�"/ 12 :�+��"/ 154 ��� 186-191, no. .
�&**&�� ���)����� 2547, ก�� �ก��ก������"4�����ก��9)����#�ก���?���%�ก��34, #&���&�'���&((�#& #ก��� �)*�����+,-&* )���#&����.����")&/��#$���� .,���+������#+)$0 ���#&����+���.����"�������ก���'�0�", ก�0�������.�.
�ก+�� )0�ก?��&$ ���.,� 2544, +ก�8�����ก������ก����3/�9�&*��+���)?���+����)"���#,
��#+*ก�����.����"��+�ก���ก%��ก"/�# ���#&����+���"�����5, viewed 7 December 2007,
<http://www.phtnet.org/download/FullPaper/pdf/1stSeminarCMU/ae072.pdf>.
�0�:+*� :+*�#"�� 2545, '.0,)��+*&����&69)������ก��', #��)��)?�+ก��.,�ก���ก��#&�+���5���*&, �;�"/ 34, ��5��"/ 1, ��� MAT171-175.
�0�:+*� :+*�#"�� ��� .,� 2542, '.0,)��+*&��������ก���"/���3���กก�������7��34����&��ก���?��&6��(', ��ก)�����ก��ก������0�#&��ก�� #& #ก�����'���5���*& .�+4��"/ 5, ��5��"/ 1, ��� MAT171-175, ������ �����)@��$���@&*"4 �����"�, 24-26 �"�.�.

Chapter 9-References
332
����)�&6 )����3�� 2543, ก������0A��&��"�������#, ก���6�"#&��� ก��#&��ก���ก�*�, ก�0����B.
�&�� #0C&)&'� ���.,� �.�.�., �*��9��ก������@�.�, )���+#&�+��ก�*�#& #ก��� ก��#&��ก���ก�*�, viewed 22 January 2008, <http://www.doa.go.th/AedWeb/Cyclone.htm>.
��.� *D��05 ��� )+*&8�� �E(����.� 2545, 'ก���+C�ก�����#+)$0���3������ก���#�ก���ก�*�', #��)�� ����&ก��#&��ก�� �;�"/ 10 :�+��"/ 1 ��� 72-78.
#&���� ������� �.�.�., �.�3/���$.#���34 �����+กก���?���, )���+#&�+��ก�*�ก��� ก��#&��ก���ก�*�, viewed 22 January 2008, <http://www.doa.go.th/AedWeb/Dryer.htm>.
)���+)&/��#$������� 2547, .5�3�ก���+$�?�ก�������&#+F�+ก��"#&*���9�&*8+,-�, )���+)&/��#$�������.
)���*& �)8,�,G�'&2 ���.,� 2543, '�*��9��ก������@�.�)?���+�ก�����������#���3�ก',
#��)������+,-&*�)�� �;�"/ 26 ��5��"/ 2 ��� 68-80.
)��+� �ก5��ก� ��� #&$� ��%()0#��, 2545, 'ก?��+��+�����+$���.�ก�"*��%�ก9)������ก��',
��ก)�����ก��ก������0�#&��ก�� #& #ก�����'���5���*& .�+4��"/ 8, ��5� 3, ��� MAT138-143,
������ �@ H��� ���� ��.&$ �.���ก5, 23-25 *0��.�.
)?�+ก��� ��6ก&��0*)��ก��� 2552, )�&*&�0*)��ก���, )?�+ก��� ��6ก&��0*)��ก���,
ก����#��0*)��ก���, viewed 26 May 2009, <http://www.oie.go.th/industrystat_th.asp>.
)?�+ก��.,�ก���ก���������+�����5���*& 2545, 'ก��)5��)�&�ก�������+�����ก�"#�#��������� ���' #��)���������+��� :�+��"/ 55, <http://www.eppo.go.th/vrs/VRS55-06-
biomass.html>.
)?�+ก����*�6�9�&*8+,-��0*)��ก��� 2533, ��ก.58-2533 : ��*�6�9�&*8+,-��0*)��ก���.�ก�"*��%�ก��5�+�4?��+ก, ก����#��0*)��ก���, ก�0�������.�.
---- 2545, ��ก.77-2545 : ��*�6�9�&*8+,-��0*)��ก����&6ก5�)����)��+(, ก����#��0*)��ก���, ก�0�������.�.

Chapter 9-References
333
)0#&�� �+ #�& &�6 ��� �05����� �H��8�0#+*� 2548, 9�ก��)?��#����� !���+����"#�#�,
)���#&����.����")&/��#$����, .,���+������#+)$0, ���#&����+���.����"�������ก���'�0�".
��+��ก +$)���� 2550, ก�������&#����"#&*��&�)&/��#$�������9�&*8+,-����#, #&���&�'���&((�#& #ก��� �)*�����+,-&* )���#& #ก���)&/��#$���� ���#&����+���.����")0���", .����)"��.
�$& +ก$&2 ��&$� 2540, �*��9��ก��)?���+��.�3/�����������#���3�ก��� ��&�$@���$, #&���&�'���&((�#& #ก��� �)*�����+,-&* )���#&����.����"�0,�8�� .,���+������#+)$0 ���#&����+���.����"�������ก���'�0�", ก�0�������.�.
�0�&* :/?�)&��� ���.,� 2548, �$)�������&9�ก������.�3/���+ก�ก��ก�*�)?���+��*�"��$&�����#�������, �����9���#&�+�����?��; 2548 ��5��"/ 1 )���+#&�+��ก�*�#& #ก��� ก��#&��ก���ก�*�, ก�0�������.�.
�+���� )���#��� ��� #&���� , ���� 2533, ����#�.#������3/�����#, )���+#&�+���3/�ก���+C������ ���, ก�0����B.
���&)� ����#+ 2549, '���� !���+����ก�� �.�&�&*� �����.����"�9�����������*+#��5���ก������ ', Engineering Today �;�"/ 4 :�+��"/ 43 ��� 72-76.

Appendices
334
APPENDICES
Appendix 1: LCA questionnaire

Appendices
335
LCA questionnaire for production process using rice husk
- Please attempt to fill data in for all fields.
- Data should be compiled on annual basis for the latest complete year.
- Please contact [email protected] if you need assistance.
- Process flows should be related to the total product supplied.
- Where inputs/outputs are shared by multiple products, estimate the contribution
for which the main product is responsible for.
- Use comment fields to note uncertainties or peculiarities of data or processes.
1) General
Location of Plant
This questionnaire applies to production of
Name of Process Supplier
Year
Your Name and contact detail
Confidentiality requirements
2) Main product
Main product (what is the output of this process) Annual output Unit
Note: please fill in this information as it is critical for calculating emissions/resource
use per unit of production.
3) Other co-product(s)
Co-products (e.g. energy, chemicals, useable by-products)
Annual outputs Unit
Use in: (market, internal use) Comments

Appendices
336
4) Energy inputs
Energy Total annual inputs Unit Comments
Natural Gas
Electrical
Diesel
Coal
Fuel oil
LPG
Other (specify)
5) Process inputs
Material inputs (main and ancillary materials)
Total annual inputs Unit
Method of transport
Estimated distance
travelled (km) Place of origin Comments
6) Emission to air
Emission Amount Unit Comments
CO2
NOx
CO
Formaldehyde
VOCs
SOx
Other (specify)

Appendices
337
7) Emission to water
Emission Amount Unit Comments
Waste water volume to sewer
-
-
-
-
-
Treatment chemicals and energy use prior to discharge
-
-
-
-
-
Pollutant concentrations or masses at point of discharge
-
-
-
-
-
8) Solid wastes
Solid waste Amount Unit Sent to: (landfill, waste treatment)
Estimated distance
travelled (km) Destination Comments
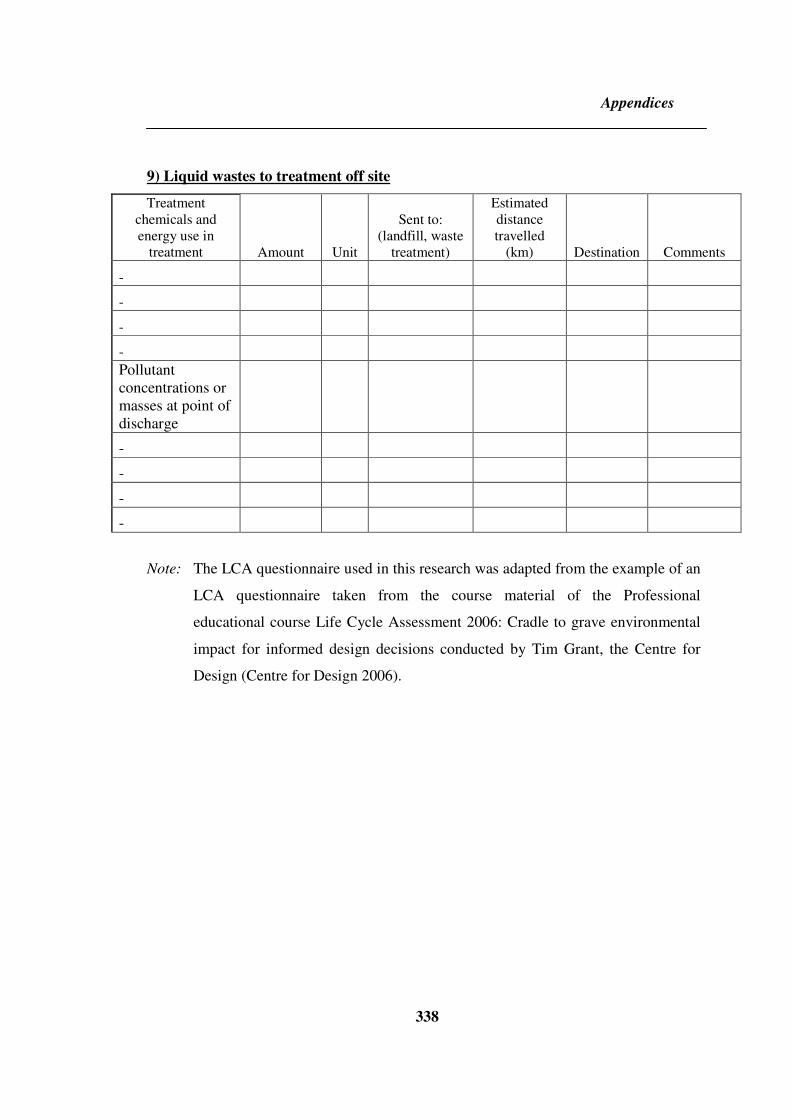
Appendices
338
9) Liquid wastes to treatment off site
Treatment chemicals and energy use in
treatment Amount Unit
Sent to: (landfill, waste
treatment)
Estimated distance travelled
(km) Destination Comments
-
-
-
-
Pollutant concentrations or masses at point of discharge
-
-
-
-
Note: The LCA questionnaire used in this research was adapted from the example of an
LCA questionnaire taken from the course material of the Professional
educational course Life Cycle Assessment 2006: Cradle to grave environmental
impact for informed design decisions conducted by Tim Grant, the Centre for
Design (Centre for Design 2006).

Appendices
339
Appendix 2: Interview questions

Appendices
340
Interview questions for industry personnel involving using rice husk
1) What is your position in your organization/company?
2) What is your job’s description?
3) Does the use of rice husk involve in your past (when?) and/or current work? If
so, in what way?
4) Why rice husk has been selected to utilize in your work?
5) Can you explain how rice husk is used in the process? (If the interviewee is in
the position that can provide technical information, the LCA questionnaire (see
Appendix 1) was also handed in to ask for life cycle inventory data to be used in
this research).
6) If not using rice husk in the process, what are other materials to be used?
7) What are the benefit and barriers of using rice husk in the process?
8) Do the government support your organization/company to use rice husk in the
production process? If so, how?
9) Do you think the use of rice husk in your area is a good alternative? Why?
10) Do you consider rice husk as a waste, co-product or resource?
11) What are the things needed to be changed/improved to allow rice husk to be used
more effectively? In what way? Why?
Note: These interview questions are translated from their original language
(Thai) to English by the researcher.

Appendices
341
Appendix 3: LCI data used in this study
Appendix 3 consists of:
Appendix 3.1: LCI data for electricity generation system
Appendix 3.2: LCI data for cement production system
Appendix 3.3: LCI data for cellulosic ethanol system

Appendices
342
Appendix 3.1: LCI data for electricity generation system
LCI data for rice husk based electricity generation system
Product Amount Unit Note
Electricity
132,864 MWh
Materials/fuels
Rice husk
144,558,000 kg
Oxygen, from air
97,594,866 calculated from combustion products of rice husk
Water, decarbonised
761,200,000 kg for water pretreatment process
Calcium chloride 354 kg for demineralization (every month)
Sulphuric acid 251 kg for demineralization
Sodium hydroxide 74 kg for demineralization
Sulphuric acid 15 kg for regeneration of resin
Sodium hydroxide 30 kg for regeneration of resin
Articulated Truck, 28 tonne load on 30 tonne truck
2,565,900 tkm
transportation of rice husk ash from power plant to concrete block plant
Articulated Truck, 28 tonne load on 30 tonne truck
14,455,800 tkm
transportation of rice husk from rice mill to power plant
Emissions to air
Carbon dioxide, biogenic
196,461,739 kg
Carbon monoxide, biogenic
219,126 kg
Nitrogen oxides
268,960 kg
Particulates, < 10 um
84,302 kg
Sulfur dioxide
163,223 kg
Particulates, unspecified
88,786 kg
Evapouration
705,107,994 kg includes moisture from rice husk and vapour from combustion
Waste to treatment
*Disposal of rice husk ash
25,659,045 kg
^ Waste water treatment
69,763,980 kg
Note: - The production of rice husk is not included in the impact assessment. This
study only considers the environmental flows affected by using the same amount

Appendices
343
of rice husk (1,000 tonnes) in all systems investigated. This means that the
amount of rice husk consumed is constant across all systems, therefore, it will
not change.
- The functional units of all rice husk use systems are defined in Figure 7.1 in the
thesis.
- * The LCI used for ash disposal depends on the disposal options considered.
For example, when using the ash in light weigh concrete block production, 1 kg
of ash is used to substitute for 1 kg of Portland cement in the concrete block
production, so 1 kg of Portland cement was avoided in the LCI model. For using
the ash in clay brick production, 1 kg of ash is used to substitute for 1 kg of clay
in the clay brick production. For using the ash as a soil conditioner in rice fields,
500 kg of ash is used to substitute for 24 kg of Ammonium sulphate, as N. For
the option of disposing the ash in landfill, the LCI data for the process of land-
filling the ash were adapted from the unit process ‘Disposal, wood ash mixture,
pure, 0% water, to sanitary landfill/ CH U) in Ecoinvent 2.0 database in SimaPro
version 7.1.6.
- ^ Due to lacking of data, only electricity used in waste water treatment process
was considered. It was assumed that in processing 1 tonne of rice husk in the
electricity generation process, it requires 0.197 kWh of electricity (adapted from
the dataset 'wood chips, in cogen 6400 kWth, wood, emission control/ CH U').
- The LCI data presented in this table were derived based on the assumptions
made for this study only. The sources of data and assumptions made for this
study are documented in section 7.3 in the thesis.

Appendices
344
LCI data for Thai grid mix production system
Product Amount Unit
Electricity, Thai grid mix 143188 GWh
Materials/fuels
Electricity, hydropower 6951 GWh
Electricity, oil 990 GWh
Electricity, lignite 30743 GWh
Electricity, natural gas 104480 GWh
Electricity, diesel 23 GWh
Note: - As discussed in section 7.3, due to lacking of data for Thai electricity
production, the unit processes of electricity production from Australian LCI
database in SimaPro 7.1.6 were used in this study.
- The functional units of all rice husk use systems are defined in Figure 7.1 in the
thesis.
- The LCI data presented in this table are the data for the electricity produced
from power plants. The LCI data used in this study were the data for actual Thai
grid mix production sent out which takes into account the distribution lossess and
the electricity required for use within the power plants themselves. It was
assumed that 1 kWh Thai grid mix production sent out requires 1.0613 kWh of
the electricity produced by the power plants.
- The LCI data presented in this table were derived based on the assumptions
made for this study only. The sources of data and assumptions made for this
study are documented in section 7.3 in the thesis.

Appendices
345
Appendix 3.2: LCI data for cement production system
LCI data for cement production system using rice husk to substitute for coal
Product Amount Unit Note
Portland cement 1.00E+00 tonne
Resources
Materials/fuels
Rice husk 2.84E+00 kg
Limestone 1.19E+03 kg
Shale 1.99E+02 kg
when rice husk is used in the process, some amount of shale (main source of SiO2) is reduced as rice husk contributes some amount of SiO2 when burned in cement kiln
Lignite 1.62E+02 kg
Alumina clay 5.04E+01 kg
Petroleum coke 4.08E+01 kg
Laterite 2.96E+01 kg
Anthracite 3.89E+00 kg
Iron powder 3.24E+00 kg
Aqueous waste 2.32E+00 kg
Ammonium nitrate 1.94E-01 m3
Sand 2.23E-02 kg
Lubricating oil 1.79E-02 kg
Dynamite 1.22E-02 kg
Clay 1.99E-03 kg
Bauxite 1.28E-01 kg
added to reintroduce Al2O3 (lossed from reducing shale) after substituting rice husk for coal in the process
Iron ore 4.30E-02 kg
added to reintroduce for Fe2O3 (lossed from reducing shale) after substituting rice husks into the process
Oxygen 3.27E+02 kg
Coal 5.53E+00 kg
was substituted by rice husk by 20 % considering energy content
Lignite 2.88E-01 kg
Natural gas 2.27E+01 m3
Petroleum gas 5.83E-02 m3
Crude oil 1.62E+00 kg
High speed diesel 2.47E-05 m3
Low speed diesel 6.00E-01 kg
Heavy fuel oil 8.14E-01 kg

Appendices
346
Waste oil 1.17E+00 kg
Reject tyre 7.17E-01 kg
Emissions to air
Carbon dioxide, fossil 9.69E+02 kg
Sulfur dioxide 1.01E-01 kg
Nitrogen oxides 1.15E+00 kg
Dinitrogen monoxide 2.46E-03 kg
Methane 2.60E-01 kg
Carbon monoxide 3.92E-02 kg
Hydrocarbons 5.28E-03 kg
NMVOC 2.04E-02 kg
Dust, unspecified 2.33E+00 kg
Particulates, SPM 1.15E-03 kg
Particulates, < 10 um (stationary) 7.47E-04 kg
Particulates, < 10 um (mobile) 5.37E-05 kg
Hydrogen sulfide 1.38E-05 kg
Lead 4.14E-06 kg
Cadmium 6.53E-07 kg
Copper 4.92E-07 kg
Chromium 4.31E-07 kg
Mercury 1.21E-07 kg
Carbon dioxide, biogenic 3.80E+00 kg
Emissions to water
Chloride 2.68E-02 kg
Sodium 1.50E-02 kg
COD, Chemical Oxygen Demand 1.10E-04 kg
Sulfate 4.82E-03 kg
BOD5, Biological Oxygen Demand 1.09E-05 kg
TOC, Total Organic Carbon 1.02E-03 kg
Oil and grease 8.05E-04 kg
Iron 6.05E-04 kg
Suspended substances 4.62E-06 kg
Nitrite 7.72E-07 kg
Nitrate 4.99E-05 kg
Ammonia, as N 4.95E-05 kg
Phosphate 2.51E-05 kg
VOC, as C 1.50E-05 kg
Chromium, ion 4.42E-06 kg
Chromium VI 7.51E-10 kg
Lead 2.70E-06 kg
Copper 2.07E-06 kg
Sulfur trioxide 5.12E-07 kg
Cadmium 1.33E-07 kg
Mercury 4.50E-09 kg

Appendices
347
Note: - The production of rice husk is not included in the impact assessment. This
study only considers the environmental flows affected by using the same amount
of rice husk (1,000 tonnes) in all systems investigated. This means that the
amount of rice husk consumed is constant across all systems, therefore, it will
not change.
- The functional units of all rice husk use systems are defined in Figure 7.1 in the
thesis.
- The LCI data for the conventional cement product are presented in Table 6.6 in
the thesis.
- The LCI data presented in this table were derived based on the assumptions
made for this study only. The sources of data and assumptions made for this
study are documented in section 7.3 in the thesis.

Appendices
348
Appendix 3.3: LCI data for cellulosic ethanol system
LCI data for cellulosic ethanol system
Product Amount Unit Note
Ethanol 1.30E-01 kg
Avoided product
Electricity 6.49E-03 kWh
surplus electricity produced from burning unconverted solids remaining at distillery
Materials/fuels
Rice husk 1.00E+00 kg
Tap water 1.52E+00 kg
Sulphuric acid 1.23E-01 kg
Ammonium sulphate, as N 2.25E-04 kg
Diammonium phosphate, as N 3.17E-04 kg
Ammonia 1.25E-02 kg
Magnesium sulphate 1.03E-04 kg
Calcium chloride 2.27E-04 kg
Chemicals organic 4.53E-05 kg
Chlorine 1.10E-06 kg
Sodium chloride 1.38E-05 kg
Lubricating oil 1.10E-05 kg
Water, decarbonised 2.64E-03 kg
Urea, as N 9.01E-05 kg
Articulated Truck, 28 tonne load on 30 tonne truck 2.00E-01 tkm assume distance of 200 km
Emissions to air
Carbon dioxide, biogenic 9.76E-01 kg
Acetaldehyde 2.05E-07 kg
Ammonia 5.71E-05 kg
Arsenic 3.36E-09 kg
Benzene 2.56E-06 kg
Benzene, ethyl- 8.44E-08 kg
Benzene, hexachloro- 2.03E-14 kg
Benzo(a)pyrene 1.41E-09 kg
Bromine 2.02E-07 kg
Cadmium 2.35E-09 kg
Calcium 1.97E-05 kg
Carbon monoxide, biogenic 2.55E-05 kg
Chlorine 6.06E-07 kg
Chromium 1.33E-08 kg
Chromium VI 1.34E-10 kg
Copper 7.40E-08 kg
Dinitrogen monoxide 7.40E-05 kg
Dioxins 1.13E-13 kg

Appendices
349
Fluorine 1.68E-07 kg
Formaldehyde 4.73E-07 kg
Hydrocarbons, aliphatic, alkanes, unspecified 2.56E-06 kg
Hydrocarbons, aliphatic, unsaturated 8.71E-06 kg
Lead 8.37E-08 kg
Magnesium 1.21E-06 kg
Manganese 5.75E-07 kg
Mercury 1.01E-09 kg
Methane, biogenic 1.22E-06 kg
m-Xylene 3.38E-07 kg
Nickel 2.02E-08 kg
Nitrogen oxides 1.48E-04 kg
NMVOC 2.22E-06 kg
PAH, polycyclic aromatic hydrocarbons 3.09E-08 kg
Particulates, < 2.5 um 1.83E-05 kg
Phenol, pentachloro- 2.96E-11 kg
Phosphorus 1.01E-06 kg
Potassium 7.87E-05 kg
Sodium 4.37E-06 kg
Sulfur dioxide 8.37E-06 kg
Toluene 8.44E-07 kg
Zinc 1.01E-06 kg
Emissions to water
Waste water and evapouration 1.52E+00 kg
Tailpipe emissions of vehicle operation using E10 per km Unit Amount
Carbon dioxide, fossil g 3.17E+02
Carbon dioxide, biogenic g 2.34E+01
Carbon monoxide g 4.66E+00
NMVOC (non-methane volatile organic compounds) g 3.26E-02
Nitrogen oxides g 5.41E-01
Methane g 1.45E-03
Dinitrogen monoxide g 5.31E-03
Note: - These LCI data were adapted from data for unit process ‘ethanol, 95% in H2O,
from wood, at distillery/kg/CH U in Ecoinvent 2.0 database in SimaPro version
7.1.6 and Saha et al. (2005).
- The production of rice husk is not included in the impact assessment. This
study only considers the environmental flows affected by using the same amount

Appendices
350
of rice husk (1,000 tonnes) in all systems investigated. This means that the
amount of rice husk consumed is constant across all systems, therefore, it will
not change.
- Waste management is excluded from the study because data are not available.
- The functional units of all rice husk use systems are defined in Figure 7.1 in the
thesis.
- To operate vehicle for 1 km, it requires 0.156 L of E10.
- 1 L of E10 consists of 0.657 kg of petrol and 0.079 kg of ethanol.
- Tailpipe emissions of vehicle operation using E10 produced from rice husk
were adapted from the data for unit process ‘E10, from wheat, AUDC tailpipe
emissions /AU’ in Australian LCI database in SimaPro version 7.1.6.
- The LCI data presented in this table were derived based on the assumptions
made for this study only. The sources of data and assumptions made for this
study are documented in section 7.3 in the thesis.

Appendices
351
LCI data for petrol system
Product Amount Unit
Petrol 1.00E+00 kg
Resources
Rhenium, in crude ore, in ground 3.23E-09 kg
Water, river 5.59E-04 m3
Water, cooling 3.98E-03 m3
Materials/fuels
Methyl tert-butyl ether 5.00E-02 kg
Tap water 1.50E-02 kg
Calcium chloride 1.60E-05 kg
Hydrochloric acid 8.79E-05 kg
Iron sulphate 4.94E-05 kg
Lime, hydrated 3.46E-05 kg
Lubricating oil 2.45E-05 kg
Nitrogen, liquid 8.14E-04 kg
Soap 2.65E-06 kg
Sodium hypochlorite 4.94E-05 kg
Sulphuric acid 1.18E-05 kg
Transport, lorry >16t, fleet average 1.32E-03 tkm
Transport, freight, rail 7.95E-03 tkm
Crude oil 7.03E-02 kg
Crude oil 5.25E-01 kg
Crude oil 3.55E-01 kg
Electricity 2.85E-02 kWh
Refinery gas, burned in furnace 2.32E+00 MJ
Heavy fuel oil, burned in refinery furnace 5.35E-01 MJ
Refinery gas, burned in flare 8.45E-02 MJ
Ammonia, liquid 1.98E-06 kg
Chlorine, liquid 1.64E-04 kg
Chemicals organic 1.74E-04 kg
Propylene glycol, liquid 2.27E-05 kg
Molybdenum 9.40E-08 kg
Nickel 1.46E-08 kg
Palladium 9.72E-08 kg
Platinum 3.08E-09 kg
Rhodium 3.08E-09 kg
Zeolite 2.03E-05 kg
Zinc 2.19E-07 kg
Emissions to air

Appendices
352
Ammonia 7.26E-08 kg
Dinitrogen monoxide 1.51E-06 kg
Nitrogen oxides 2.86E-05 kg
Benzene 5.82E-06 kg
Benzene, ethyl- 1.45E-06 kg
Butane 5.82E-05 kg
Butene 1.45E-06 kg
Ethane 1.45E-05 kg
Ethene 2.91E-06 kg
Heptane 1.45E-05 kg
Hexane 2.91E-05 kg
Hydrocarbons, aliphatic, alkanes, unspecified 4.43E-11 kg
Hydrocarbons, aliphatic, unsaturated 2.43E-12 kg
Hydrocarbons, aromatic 6.65E-13 kg
Methane, fossil 1.63E-05 kg
Particulates, > 10 um 9.89E-06 kg
Pentane 7.28E-05 kg
Propane 5.82E-05 kg
Propene 2.91E-06 kg
Toluene 8.73E-06 kg
Xylene 5.82E-06 kg
Heat, waste 2.72E-02 MJ
Sulfur dioxide 3.18E-05 kg
Emissions to water
t-Butyl methyl ether 7.65E-07 kg
Aluminum 2.80E-08 kg
Barium 5.59E-08 kg
Boron 2.23E-07 kg
Calcium, ion 2.80E-05 kg
Chloride 4.45E-05 kg
Cyanide 9.68E-08 kg
Fluoride 2.50E-06 kg
Hydrocarbons, aromatic 4.02E-07 kg
Iron, ion 2.80E-07 kg
Magnesium 1.39E-05 kg
Manganese 1.12E-07 kg
Mercury 5.59E-11 kg
Molybdenum 5.59E-09 kg
Nitrate 4.59E-06 kg
Phosphorus 2.16E-07 kg
Potassium, ion 5.59E-06 kg

Appendices
353
Selenium 8.39E-09 kg
Silver, ion 2.80E-08 kg
Sodium, ion 1.68E-04 kg
Sulfide 5.59E-08 kg
Suspended solids, unspecified 5.59E-06 kg
Toluene 5.59E-07 kg
Xylene 5.59E-08 kg
Ammonium, ion 3.79E-06 kg
AOX, Adsorbable Organic Halogen as Cl 9.02E-09 kg
Benzene 1.28E-08 kg
PAH, polycyclic aromatic hydrocarbons 9.02E-09 kg
Sulfate 1.14E-04 kg
Arsenic, ion 5.55E-09 kg
Cadmium, ion 5.55E-09 kg
Chromium, ion 1.25E-07 kg
Copper, ion 5.55E-09 kg
Lead 1.76E-07 kg
Nickel, ion 7.33E-09 kg
Strontium 3.89E-07 kg
Vanadium, ion 1.67E-08 kg
Zinc, ion 9.57E-08 kg
Benzene, ethyl- 1.11E-10 kg
BOD5, Biological Oxygen Demand 4.01E-06 kg
DOC, Dissolved Organic Carbon 3.91E-08 kg
TOC, Total Organic Carbon 1.58E-05 kg
COD, Chemical Oxygen Demand 4.10E-05 kg
Hydrocarbons, unspecified 2.26E-07 kg
Nitrogen, organic bound 1.09E-05 kg
Oils, unspecified 5.77E-07 kg
Phenol 9.95E-08 kg
Tailpipe emissions of vehicle operation using petrol per km Unit Amount
Carbon dioxide, fossil g 3.41E+02
Carbon monoxide g 4.83E+00
NMVOC (non-methane volatile organic compounds) g 3.24E-02
Nitrogen oxides g 4.62E-01
Methane g 1.44E-03
Dinitrogen monoxide g 4.83E-03
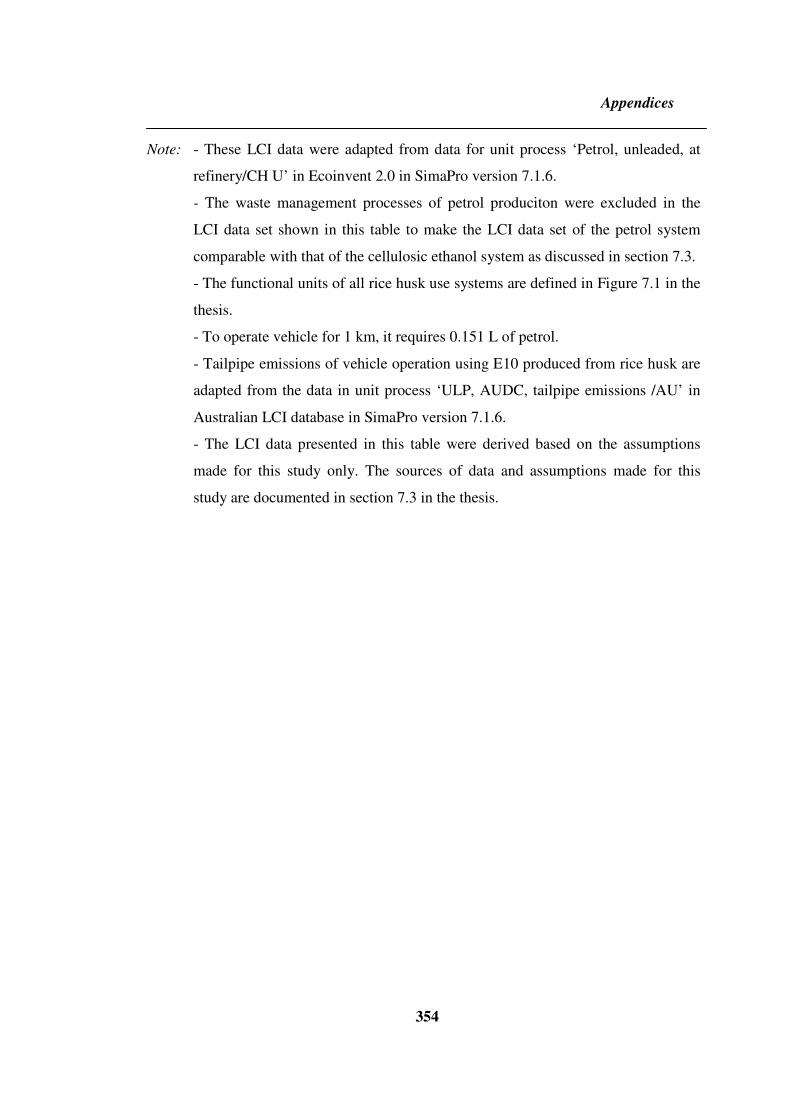
Appendices
354
Note: - These LCI data were adapted from data for unit process ‘Petrol, unleaded, at
refinery/CH U’ in Ecoinvent 2.0 in SimaPro version 7.1.6.
- The waste management processes of petrol produciton were excluded in the
LCI data set shown in this table to make the LCI data set of the petrol system
comparable with that of the cellulosic ethanol system as discussed in section 7.3.
- The functional units of all rice husk use systems are defined in Figure 7.1 in the
thesis.
- To operate vehicle for 1 km, it requires 0.151 L of petrol.
- Tailpipe emissions of vehicle operation using E10 produced from rice husk are
adapted from the data in unit process ‘ULP, AUDC, tailpipe emissions /AU’ in
Australian LCI database in SimaPro version 7.1.6.
- The LCI data presented in this table were derived based on the assumptions
made for this study only. The sources of data and assumptions made for this
study are documented in section 7.3 in the thesis.