comparative overwintering capabilities of africanized and
TRANSCRIPT
Louisiana State UniversityLSU Digital Commons
LSU Historical Dissertations and Theses Graduate School
1991
Comparative Overwintering Capabilities ofAfricanized and European Honey Bees.Jose Damaso VillaLouisiana State University and Agricultural & Mechanical College
Follow this and additional works at: https://digitalcommons.lsu.edu/gradschool_disstheses
This Dissertation is brought to you for free and open access by the Graduate School at LSU Digital Commons. It has been accepted for inclusion inLSU Historical Dissertations and Theses by an authorized administrator of LSU Digital Commons. For more information, please [email protected].
Recommended CitationVilla, Jose Damaso, "Comparative Overwintering Capabilities of Africanized and European Honey Bees." (1991). LSU HistoricalDissertations and Theses. 5282.https://digitalcommons.lsu.edu/gradschool_disstheses/5282
INFORMATION TO USERS
This manuscript has been reproduced from the microfilm master. UMI films the text directly from the original or copy submitted. Thus, some thesis and dissertation copies are in typewriter face, while others may be from any type of computer printer.
The quality of this reproduction is dependent upon the quality of the copy submitted. Broken or indistinct print, colored or poor quality illustrations and photographs, print bleedthrough, substandard margins, and improper alignment can adversely affect reproduction.
In the unlikely event that the author did not send UMI a complete manuscript and there are missing pages, these will be noted. Also, if unauthorized copyright material had to be removed, a note will indicate the deletion.
Oversize materials (e.g., maps, drawings, charts) are reproduced by sectioning the original, beginning at the upper left-hand corner and continuing from left to right in equal sections with small overlaps. Each original is also photographed in one exposure and is included in reduced form at the back of the book.
Photographs included in the original manuscript have been reproduced xerographically in this copy. Higher quality 6" x 9" black and white photographic prints are available for any photographs or illustrations appearing in this copy for an additional charge. Contact UMI directly to order.
University Microfilms International A Bell & Howell Information C om pany
300 North Z eeb Road. Ann Arbor. Ml 48106-1346 USA 313/761-4700 800/521-0600
Order N um ber 9219582
C om parative overw intering capabilities o f A fricanized and European honey bees
Villa, Jose Damaso, Ph.D.
The Louisiana State University and Agricultural and Mechanical Col., 1991
UMI300 N. Zeeb Rd.Ann Arbor, MI 48106
COMPARATIVE OVERWINTERING CAPABILITIES OF AFRICANIZED AND EUROPEAN HONEY BEES
A Dissertation
Submitted to the Graduate Faculty of the Louisiana State University and
Agricultural and Mechanical College in partial fulfillment of the requirements for the degree of
Doctor of Philosophy
inThe Department of Entomology
byJose D. Villa
B.Sc.Agr., University of Guelph, 1980 M.A., University of Kansas, 1985
December 1991
DEDICATION
This dissertation is dedicated to the memory of my father, and to the many projects which he initiated. He introduced me to the magical world of honey bees, among many other wonders. Just as this particular project, others which he initiated will be finalized by people inspired by his concern for a better world, his energy and his optimism.
ACKNOWLEDGEMENTS
Many friends and colleagues have helped with this project. Financial support was provided by the USDA, ARS Honey-Bee Breeding & Genetics Laboratory in Baton Rouge. Colleagues at this laboratory and members of my advisory committee at Louisiana State University provided useful suggestions in the planning stages of research. During research seasons in Venezuela, Anita Collins, Lorraine Davis, Dan Winfrey, Rick Hellmich, and Tony Stelzer shared long hours of hard work and camaraderie. Alcides Escalona and Roberto Colmenares assisted with field research and helped me through all sorts of difficulties. Rick Hellmich, Tom Rinderer and Tony Stelzer kindly assisted in the planning and execution of the experiment in Germany. I thank Robert Danka, Ben Oldroyd, Tom Rinderer, Steve Sheppard and Martha Weiss for providing helpful comments on chapters in this dissertation. Jim Grace, John Harbo, Seth Johnson, Dorothy Pashley, and Joseph Woodring suggested improvements on earlier versions of this dissertation.
My mother, my brothers and sisters, and my sons contributed with their love and encouragement, despite numerous geographical barriers.
TABLE OF CONTENTS
DEDICATION................................................. iiACKNOWLEDGEMENTS .......................................... iiiLIST OF TABLES ............................................. viLIST OF FIGURES ............................................ viiA B S T R A C T ....................................................viiiINTRODUCTION AND LITERATURE REVIEW ..................... 1
Economic Considerations ............................. 2Ecology of Africanized Bees in the Tropics ......... 6Overwintering in European Honeybees ................ 7
Temperature Regulation.. ....................... 7Metabolic Rates ................................ 9Brood Rearing ................................... 15Physiological Changes of Workers in Winter ... 16
Overwintering Experiments with Africanized Bees ... 17THERMOREGULATORY BEHAVIOR, STORE CONSUMPTION, AND SURVIVAL
OF AFRICANIZED AND EUROPEAN BEES UNDER COLD CONDITIONS ............................................ 21Introduction ......................................... 22Materials and Methods ............................... 25Results ............................................... 30Discussion ............................................ 42
"OVERWINTERING" OF AFRICANIZED, EUROPEAN AND HYBRID HONEYBEES IN THE ANDES OF VENEZUELA ..................... 46Introduction ......................................... 47Materials and Methods................................ 49Results ............................................... 54Discussion............................................ 63
OVERWINTERING OF EUROPEAN, AFRICANIZED AND HYBRID HONEYBEES IN GERMANY ...................................... 67
Introduction ......................................... 69Materials and Methods ............................... 70Results and Discussion .............................. 71References Cited ..................................... 73
iv
CONCLUSIONS 74
REFERENCES ................................................. 79
APPENDIX A - Conversion factors for the calculation ofmetabolic rates in different units ................. 87
APPENDIX B - Analysis of Variance tables for all tests intext .................................................. 88
V I T A ........................................................ 96
V
LIST OF TABLES1.1 Metabolic rates (ml O, /g hr) of immature honey bees
at different stages of development ................ 101.2 Metabolic rates (ml 02 /g hr) of isolated adult
workers of different ages, at different levels of activity, times of day and temperatures ........... 11
1.3 Metabolic rates (ml Oz /g hr) of small artificially-formed groups of honey bees, in different seasons and at different temperatures............................ 12
1.4 Metabolic rates (ml 02 /g hr) of naturally occurringgroups of honey bees at different temperatures .... 13
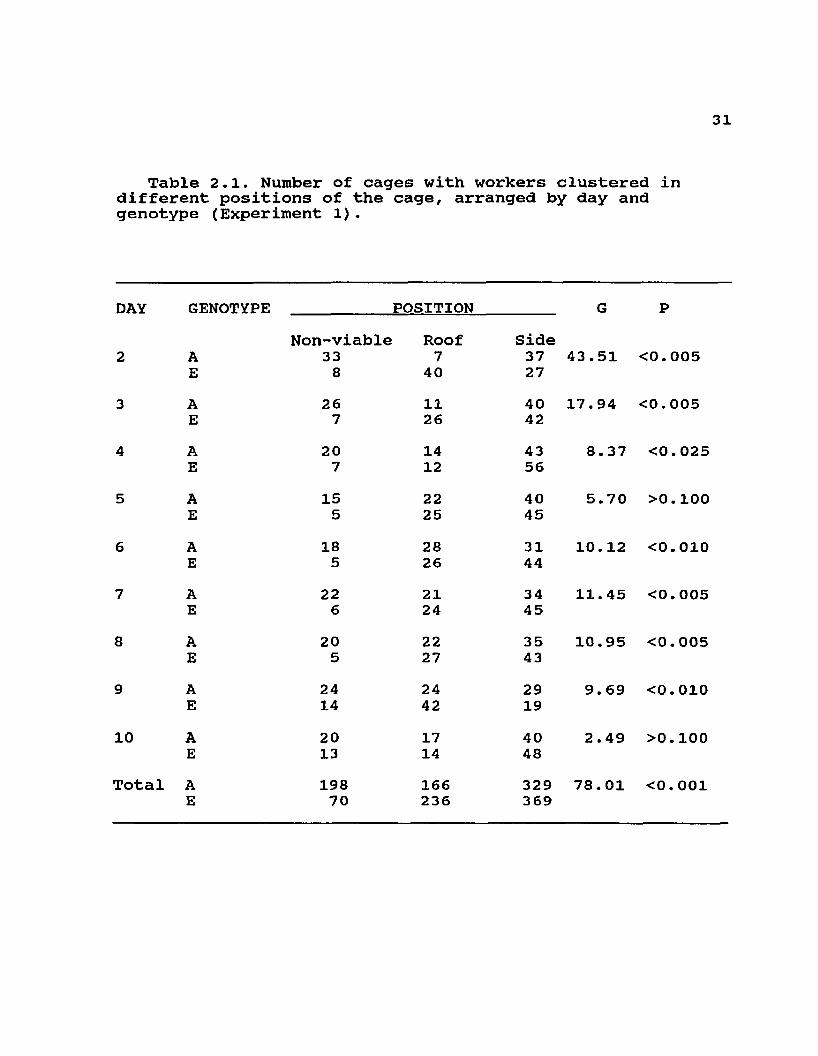
2.1 Number of cages with workers clustered in differentpositions, arranged by day and genotype............ 31
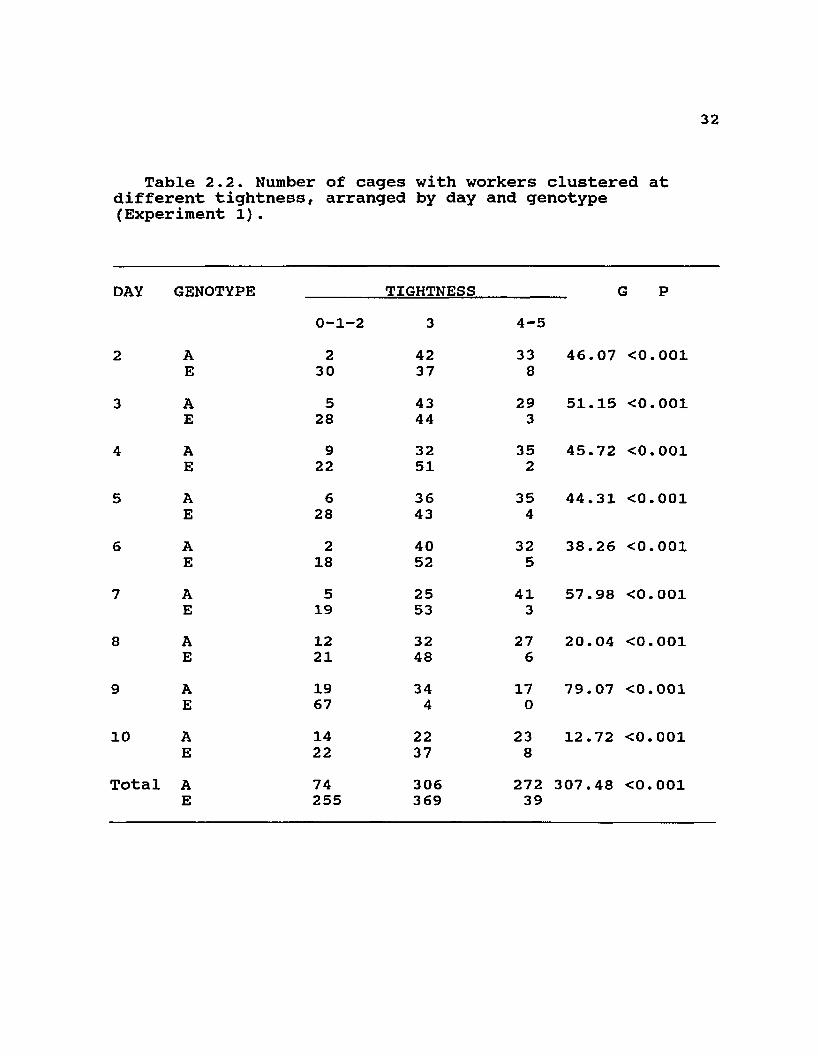
2.2 Number of cages with workers clustered at different tightness, arranged by day and genotype ............ 32
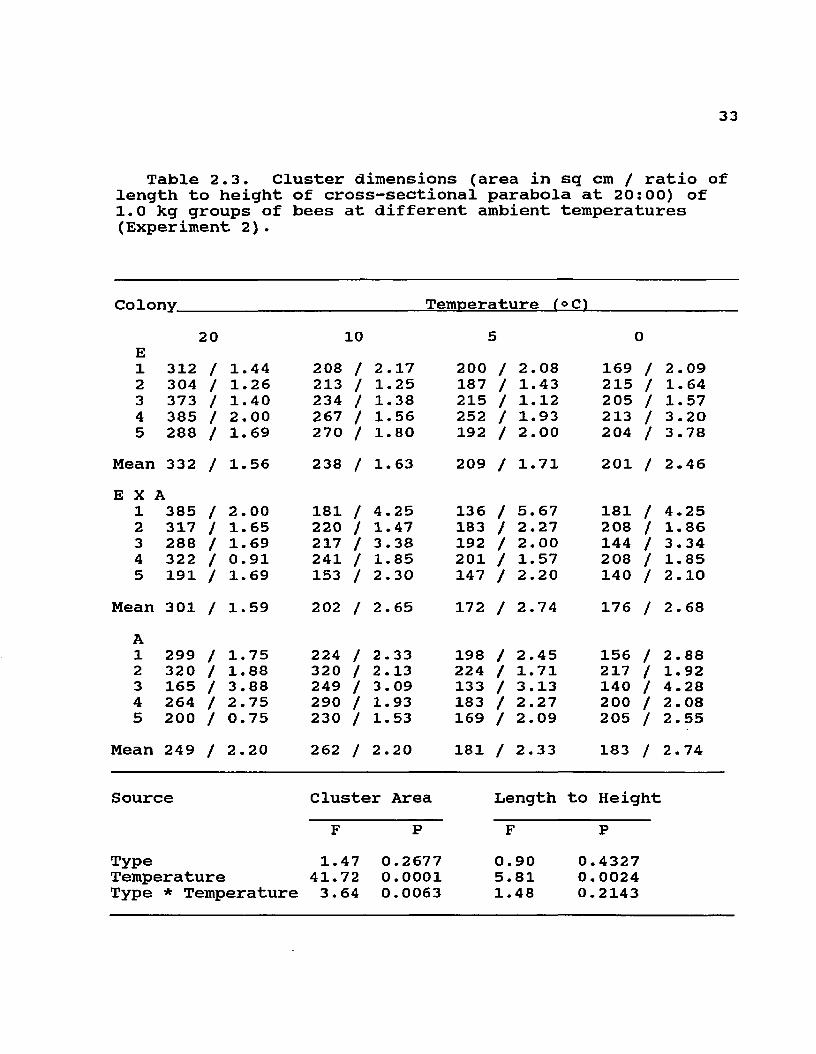
2.3 Cluster dimensions (area in sg cm / ratio of length to height of cross-sectional parabola at 20:00) of 1.0 kg of workers at different ambient temperatures ... 33
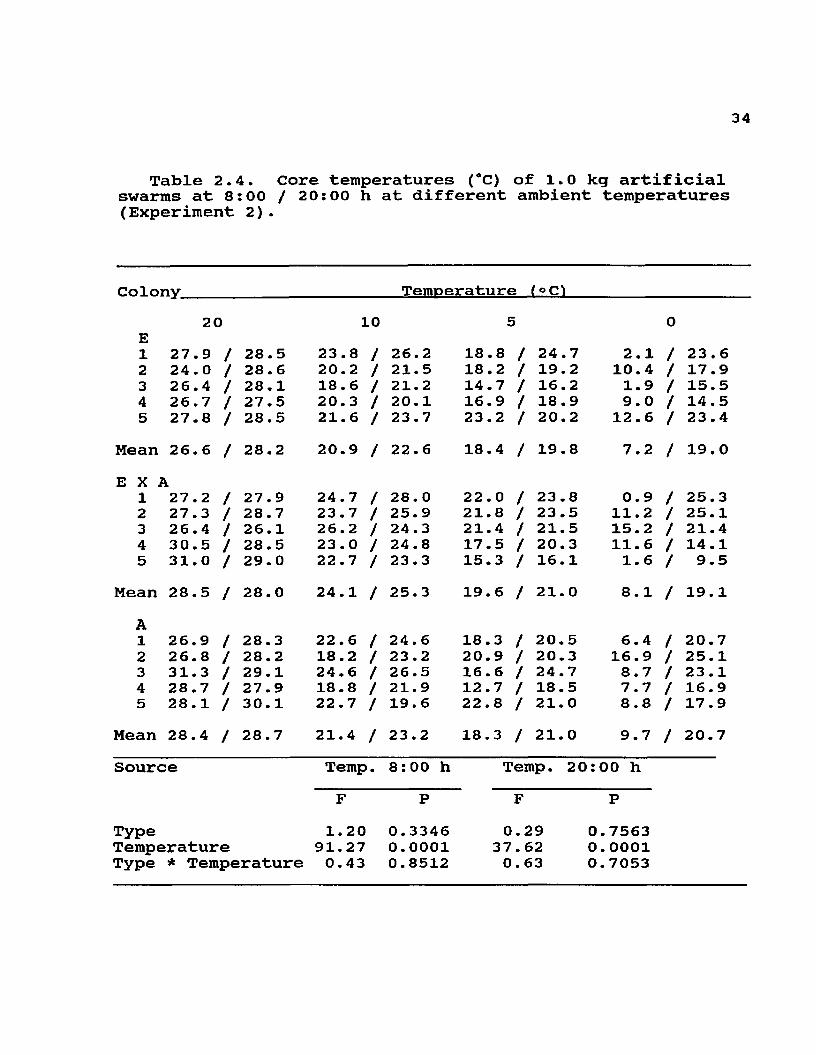
2.4 Core temperatures (°C) of 1.0 kg artificial swarms at8:00 / 20:00 h at different ambient temperatures .. 34
2.5 Sugar syrup removed (g) by groups of bees of two genotypes at cold temperatures...................... 39
2.6 Initial and final conditions of colonies maintainedin cold room for 73 days at 0°C .................... 40
3.1 Tested genotypes, number of colonies of each genotype, initial colony conditions, duration of the experiment, weight loss and average survival time in two experiments in the Andes ........................ 56
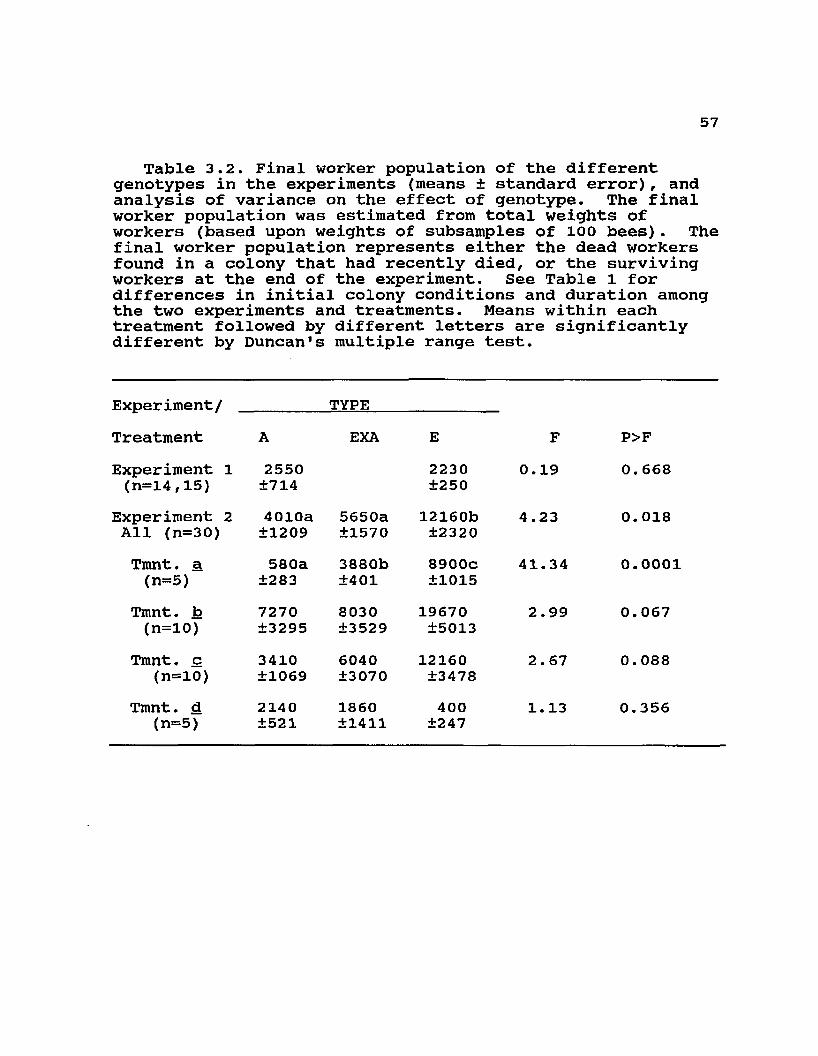
3.2 Final worker population of the different genotypes in the experiments and analysis of variance on the effect of genotype .................................... 57
3.3 Rates of weight loss (kg wt loss/kg bees*week) of the different genotypes used in the experiments and analysis of variance of the effect of genotype .... 58
4.l Means ± standard errors and analysis of variance onthe effect of type on total weight loss, adult worker population, and brood area .......................... 72
vi
LIST OF FIGURES
1.1 Graphic model illustrating potential interactions of factors influencing Africanized bee density in the United States ....................................... 5
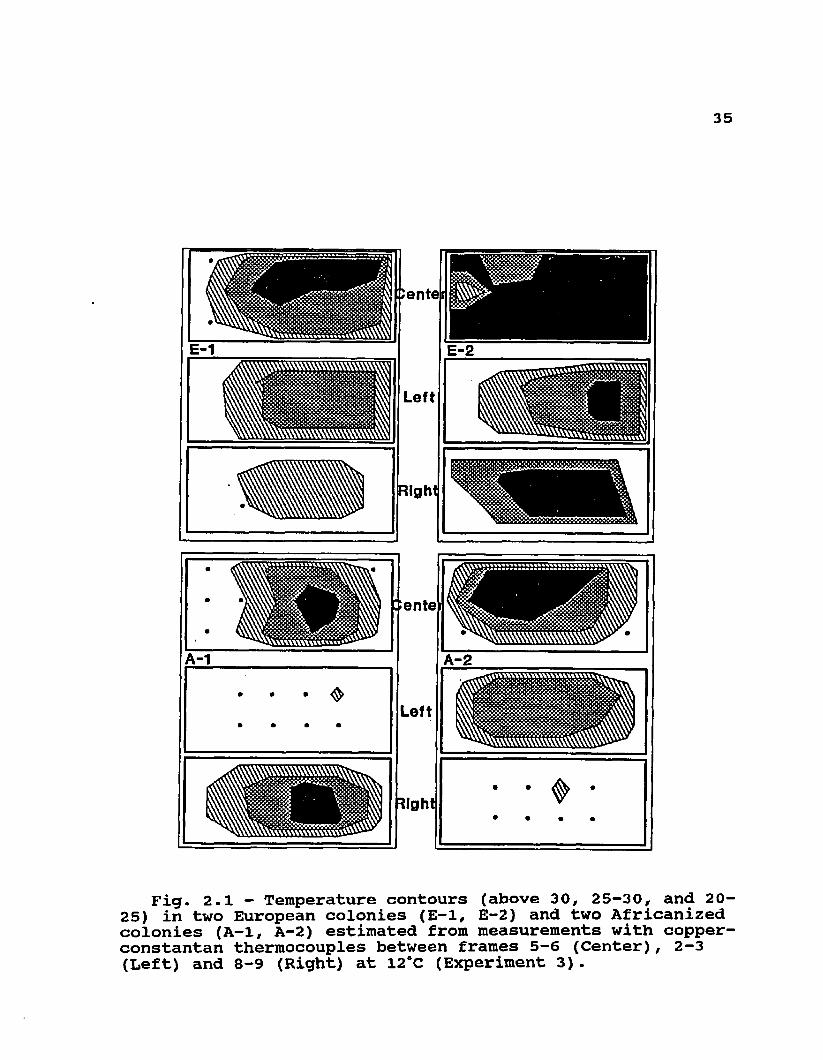
2.1 Temperature contours in two European colonies andtwo Africanized colonies at 12°C .................. 35
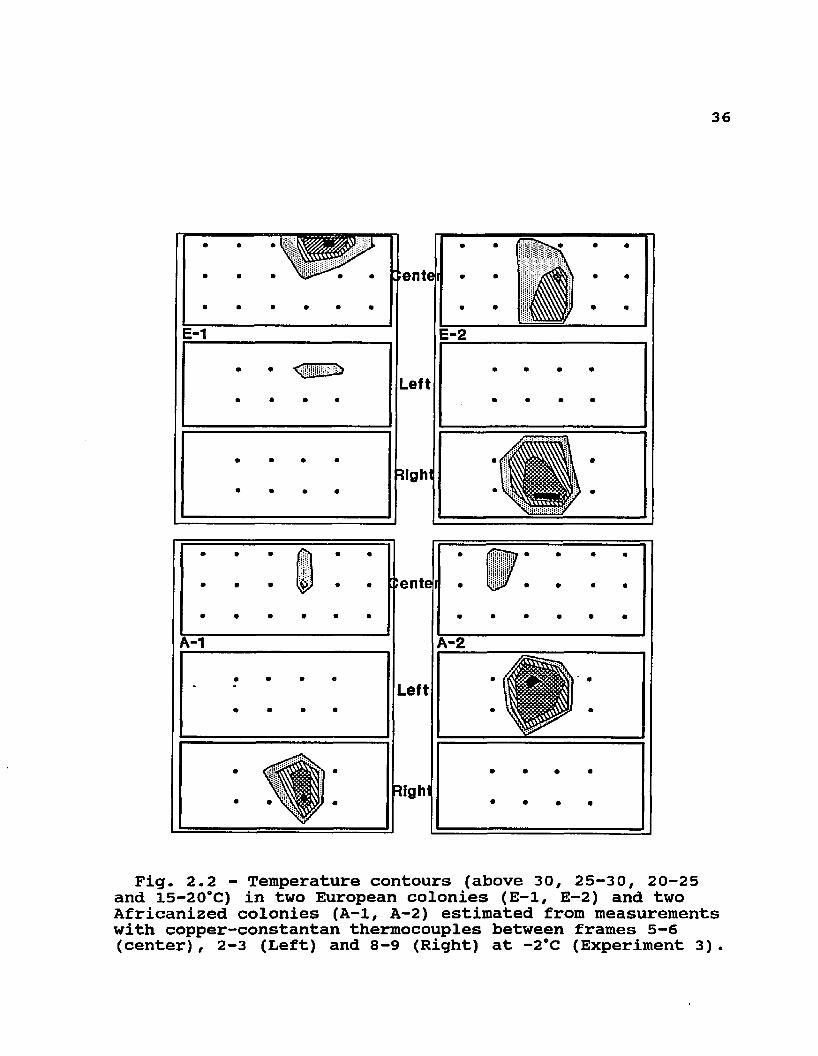
2.2 Temperature contours in two European colonies andtwo Africanized colonies at -2*C .................. 36
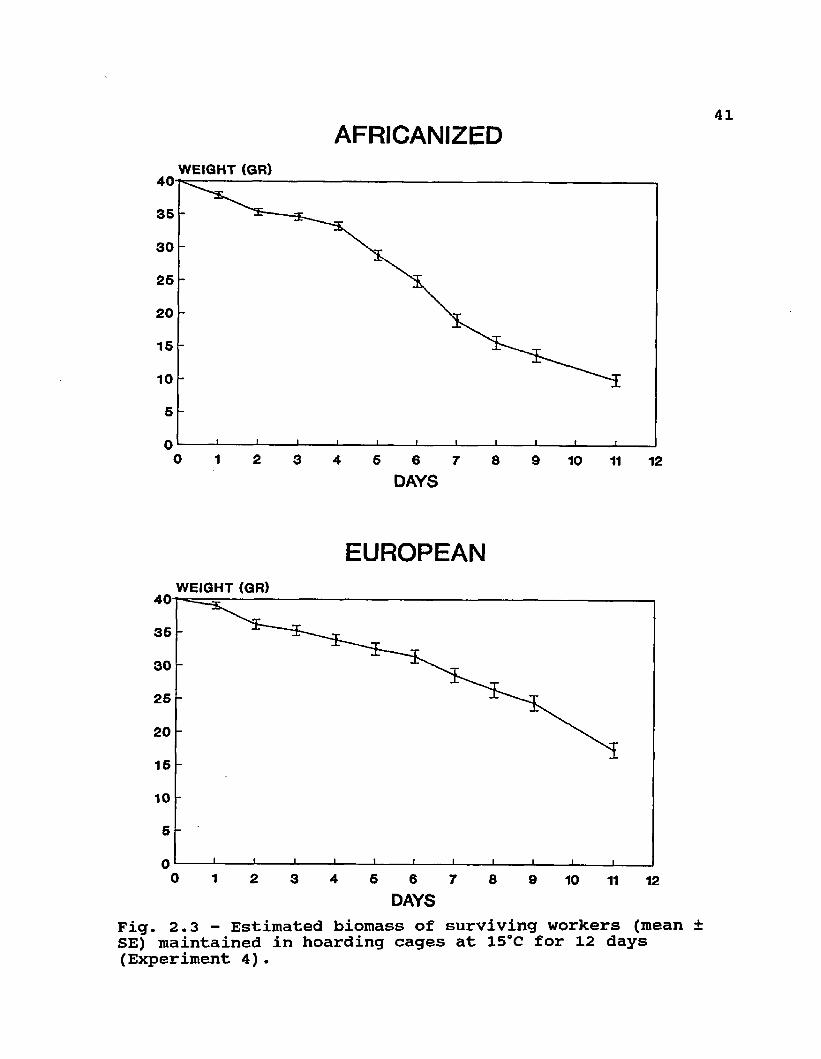
2.3 Estimated biomass of surviving workers (mean ± SE) maintained in hoarding cages at around 15°C for 12 days ................................................. 41
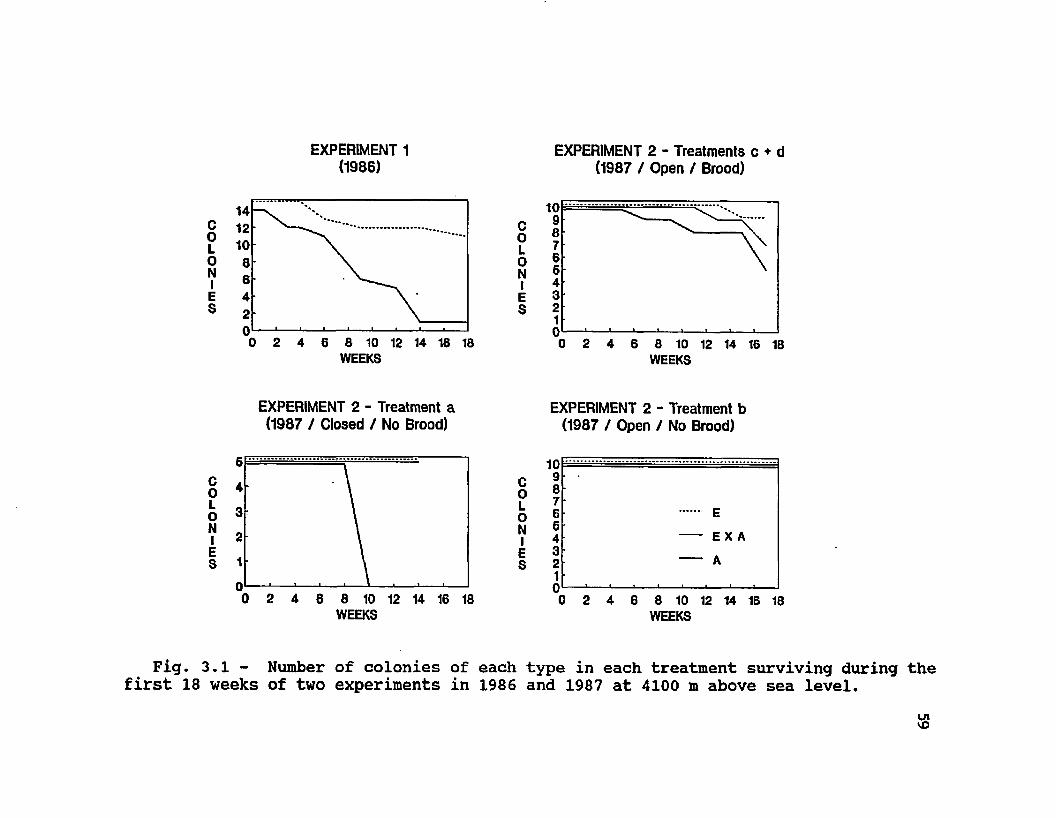
3.1 Number of colonies of each type in each treatment surviving during the first 18 weeks of two experiments in 1986 and 1987 at 4100 m above sea level ........ 59
3.2 Average maximum cluster diameter in colonies of each type in each one of the treatments in the two experiments conducted in 1986 and 1987 ............ 60
3.3 Cumulative average number of dead workers in the closed colonies of Experiment 2, treatment a ............. 61
4.1 Average total weights of nine Africanized, eight Carniolan, and five A X C colonies from 31 Octoberto 21 February...................................... 70
4.2 Average brood areas (± SE) of nine Africanized, eight Carniolan, and five A X C colonies between 18 August and 13 November, and on 21 February ............... 71
vii
ABSTRACT
The potential of tropical Africanized honey bees to survive through winter was investigated to predict their possible geographical range and density in the United States. Experiments were conducted in cold rooms, at high elevations in tropical mountains, and during a winter season in Germany. The performance and survival of isolated groups of workers and of intact Africanized colonies were compared with those of European origin, and in some experiments, with those of hybrid crosses.
In cold rooms, groups of 40 g of Africanized workers exposed to air currents at 15°C aggregated in different positions and in tighter conformations than European workers, but these differences were not observed in larger groups (1.0 kg) or in colonies exposed to temperatures between 0 and 20°c. Rates of sucrose syrup removal from feeders by both the small and large groups of Africanized workers were significantly lower than for European groups of the same biomass.
viii
In cold room and field experiments with different treatments of initial worker and brood population, the rate of colony weight loss relative to average population did not consistently differ between Africanized, European, and hybrid colonies. Therefore, overwintering Africanized colonies may not exhaust their honey stores earlier than would European colonies.
The clearest difference between Africanized and European field colonies in these studies was the earlier mortality of workers and colonies, despite the presence of honey stores. Africanized colonies did not show evidence of the increased worker longevity found in overwintering European colonies. However, Africanized colonies had a decrease in brood production similar to that found in European colonies. Most Africanized colony deaths resulted from attrition of their worker population. Colony mortality was especially high in Africanized colonies when flight was restricted. The increased length of flightless periods associated with increasing latitude, will decrease the density of Africanized bees. Hybrids between Africanized and European bees had intermediate values for most parameters, suggesting that overwintering factors will favor a highly African region in the south of the United States, a transition zone containing hybrid bees further north, and highly European regions beyond this transition zone.
Chapter 1.
Introduction and Literature Review
1
2The recent arrival of the first Africanized honey-bee
swarms to the United States (October 1990) has produced a shift in the agricultural and scientific communities' perspective on this insect. Africanized bees are no longer a mysterious exotic pest: their presence on U.S. soil poses an as yet unquantified challenge to future agricultural production and a threat to public health smaller than publicized by the media. The biological mechanisms allowing Africanized bees to colonize most of Latin America will become secondary considerations; assessing the current managed and feral European honey-bee populations in the U.S. and their potential genetic resistance to African introgression will be of primary concern. An evaluation of the overwintering potential of Africanized honey bees is pivotal to an understanding of the future situation in the U.S., and is a likely focus of attention by academia, industry and the media.
Economic considerations The U.S. beekeeping industry is one of the largest in
the world, currently in third place after the Soviet Republics (formerly the USSR) and China in estimated honey production (Bee World 1987). As is the case in all countries, the monetary value of products directly resulting from beekeeping is minute compared to other agricultural enterprises. For example, in 1987, the value of honey
3produced in the U.S. was only 1.6% of the value of cotton production (72 million dollars vs. 4.5 billion dollars (USDA1988)).
However, the indirect benefits of beekeeping activities are much greater than the actual value of bee products. The total yearly value of U.S. agricultural production requiring or benefitting from honey-bee pollination has been estimated at 2 0 billion dollars (Levin 1984). As honey bees are not the sole pollinators of these crops, Robinson et al. (1989) have calculated that their relative contribution to total fruit set, is worth 9 billion dollars. Almond production in California, which is entirely dependent on honey-bee pollination, uses between 650,000 and 800,000 colonies at rental fees ranging from 15 to 35 dollars per hive and produces an almond crop worth close to half a billion dollars (Robinson et al. 1989).
Both beekeeping production and the pollination of agricultural crops may be affected by the arrival of Africanized bees in the U.S. Aside from a listing of possible effects, the intensity of negative consequences is difficult to quantify. McDowell (1984) modelled the economic impact upon beekeeping in the southern tier of states and calculated that the value of honey, queen and package production could decrease by as much as 58 million a year. Taylor (1985) listed a series of biological, ecological and regulatory conditions that would lead to a
4low impact and a high impact scenario. All these predictions are initial approximations of possible outcomes. Rinderer (1987) has pointed out the uncertainties inherent in modelling a future pest situation which is based upon hybridization with a 'beneficial' insect, and for which fitness parameters in temperate regions are not well understood.
Given the potential inaccuracy of these predictions, an experimental evaluation of the overwintering ability of Africanized bees will contribute to a better understanding of their impact in the U.S. Experimental procedures can test and refine models such as those of Taylor (1977) and Taylor & Spivak (1984) which are based upon extrapolation from ranges in other continents.
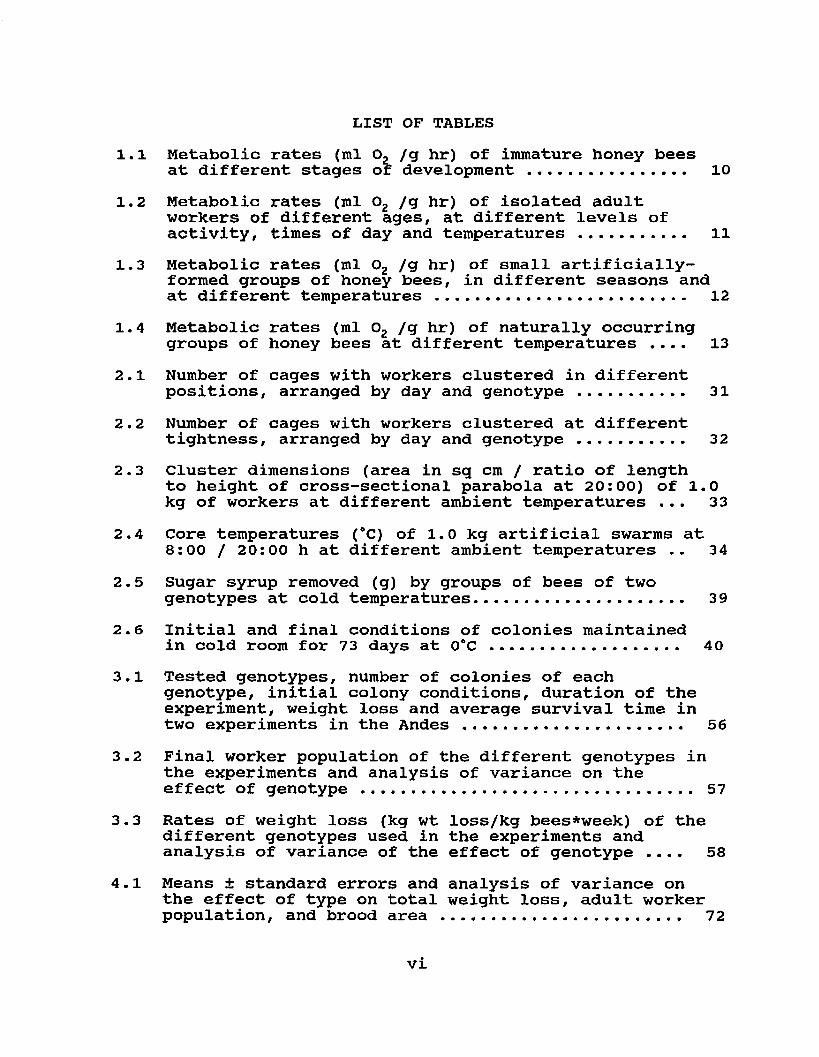
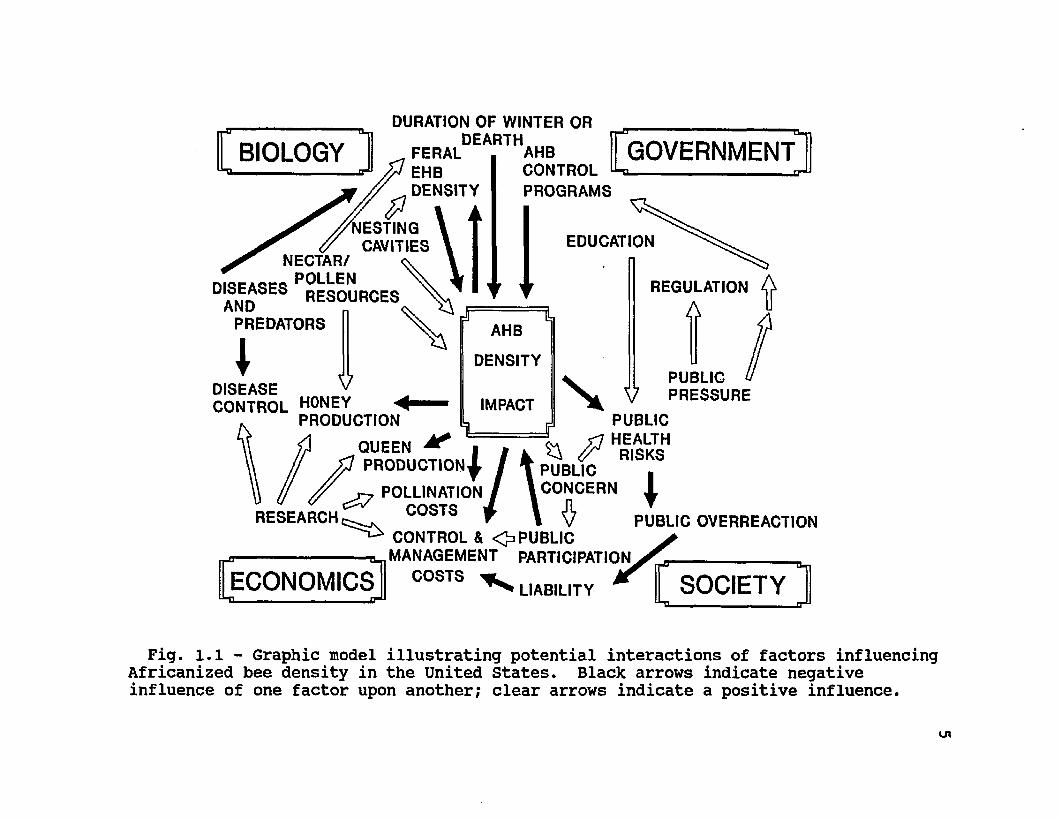
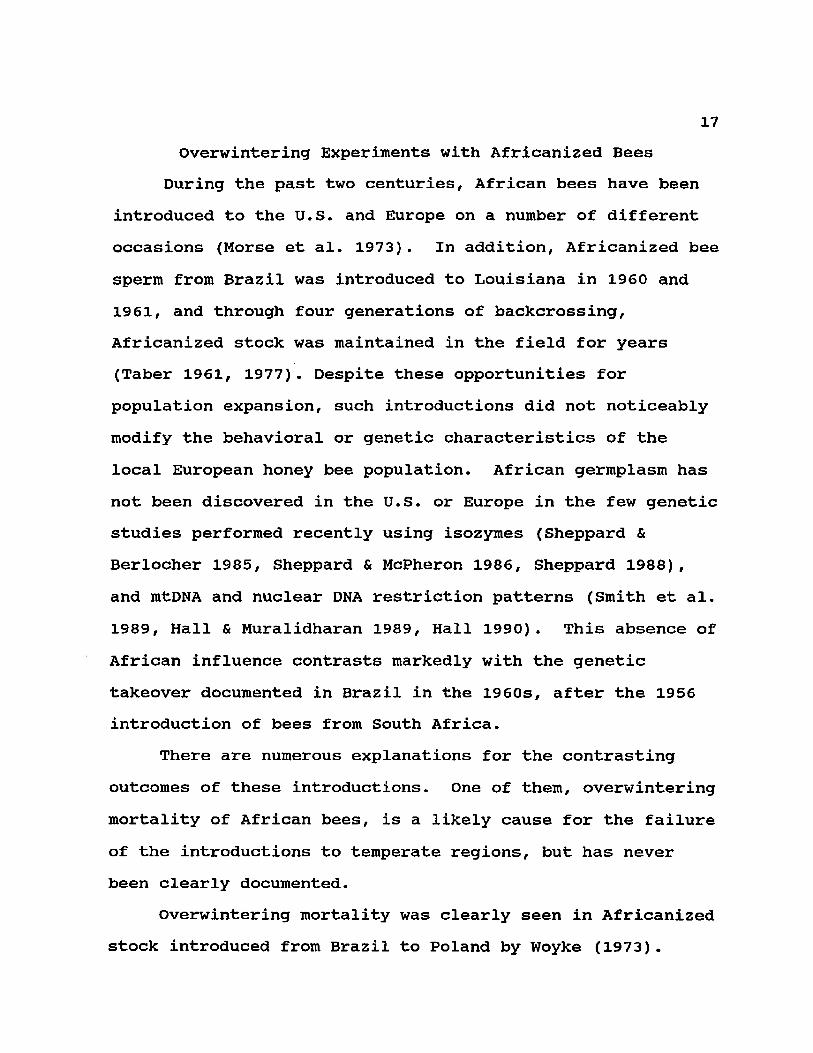
Overwintering experiments can elucidate the potential natural ranges of Africanized bees based upon biological and ecological parameters. However, an accurate model of the bees' density and impact following their arrival in the U.S. will necessarily depend on a number of other parameters, as well. These include novel human attitudes towards insects, more intense government regulation of the human movement of bees, a precarious economic situation in beekeeping, and the presence of an unquantified density of feral and managed European honey bees (see Fig. 1.1).
BIOLOGY
NESTINGCAVITIES
DURATION OF WINTER ORDEARTH
FERAL AHBEHB CONTROLDENSITY PROGRAMS
NECTAR/
Da n d S E S ^ S O U R C E S PREDATORS*
\ )
GOVERNMENT
EDUCATION
VDISEASECONTROL HONEY
PRODUCTION
AHB
DENSITY
IMPACT
QUEEN |p r o d u c t i o n *
POLLINATION
RESEARCH COSTS
REGULATION
A
VPUBLIC
’ r 7 HEALTH ^ RISKS
PUBLIC CONCERN
PUBLIC PRESSURE
\PUBLIC OVERREACTION
ECONOMICS
CONTROL & O P U B L I C MANAGEMENT PARTICIPATION
C O STS _LIABILITY SOCIETY
Fig. l.l - Graphic model illustrating potential interactions of factors influencing Africanized bee density in the United States. Black arrows indicate negative influence of one factor upon another; clear arrows indicate a positive influence.
6Ecology of Africanized Bees in the Tropics
European honey bees were introduced into Latin America on numerous occasions in the past three centuries, but naturalized feral colonies resulting from these introductions occurred in relatively low densities. By contrast, Africanized honey bees have colonized close to 15 million sg km of the same land (21 times the area of Texas) in the last 3 decades. The higher fitness of Africanized bees in the tropics can be ascribed to a long list of parameters: shorter development time of workers and queens (Kerr et al. 1972), foraging of workers at an earlier age (Winston & Katz 1981), higher allocation of foragers to pollen collection (Danka et al. 1987), efficient nectar collection by foragers for scattered low reward resources (Rinderer et al. 1984), frequent colony reproduction (Otis 1980), seasonal absconding during unfavorable resource conditions (Winston et al. 1979), higher allocation of collected resources to brood production (Pesante 1985), and production of greater number of drones earlier in the season (Rinderer et al. 1987). The relative contribution of each of these factors to the transformation of the honey-bee population by African-like bees has not been established. Recent discoveries of African-like mitochondrial DNA restriction patterns in 59 out of 61 feral colonies from Brazil to Mexico (Hall & Muralidharan 1989, Smith et al.1989) point to the preponderance of African maternal lines
in tropical America. A recent latitudinal survey in Argentina has indicated that the preponderance of Africanized morphological, isozymic, and mitochondrial types grade into more European-like types further south (Sheppard et al. 1991).
Overwintering by European Honey Bees The survival of European honey-bee colonies through
winter periods depends on a close integration of behavior and physiology. The maintenance of colony thermal homeostasis combines individual behavior with colonial behavior to ensure adequate thermogenesis and efficient heat conservation. Colony growth patterns as well as changes in worker longevity and physiological state have a close correspondence with predictable seasonal patterns. Temperature Regulation
Individual workers are capable of actively maintaining thoracic temperatures different from ambient, within the ranges normally encountered by foragers (Esch 1960, Heinrich 1979) . Metabolic heat is generated either in flight or at rest by contraction of thoracic muscles, with metabolic expenditure closely related to the frequency of action potentials (Esch 1960, Bastian & Esch 1970). Elimination of excess heat is possible by proventicular regurgitation and exposure of droplets for evaporative cooling (Heinrich
81980a, 1980b), allowing foragers to fly at temperatures up to 40°C (Cooper et al. 1985).
Colonial mechanisms for heat conservation and loss are superimposed upon individual behavior. Short bursts of thermogenesis by individual workers (Esch I960, Roth 1965) together with aggregation allow increasingly higher core temperatures with increases in group size even in unnaturally small groups (Free & Spencer-Booth 1958, Woyke & Jasinski 1982). Groups of natural sizes maintain core temperatures between 20 and 30°C in broodless colonies, but increase it to 35°C when brood is being produced (Gates 1914, Hess 1926, Owens 1971). Temperatures are generally lower away from this central core and tend to be highly variable at the mantle, ranging from 9 to 4 0°C (Hess 192 6, Lensky 1964). During periods of low ambient temperature, the mantle consists of a group of workers closely packed together and acting as an insulating shell; isotherms at the mantle are in close proximity while those at the core are broadly separated (Owens 1971). During periods of high environmental temperature, increasingly higher numbers of foragers collect water for evaporative cooling, which is performed not only by extruding droplets from the mouthparts but also by spreading water over comb surfaces (Lindauer 1955).
9Metabolic Rates
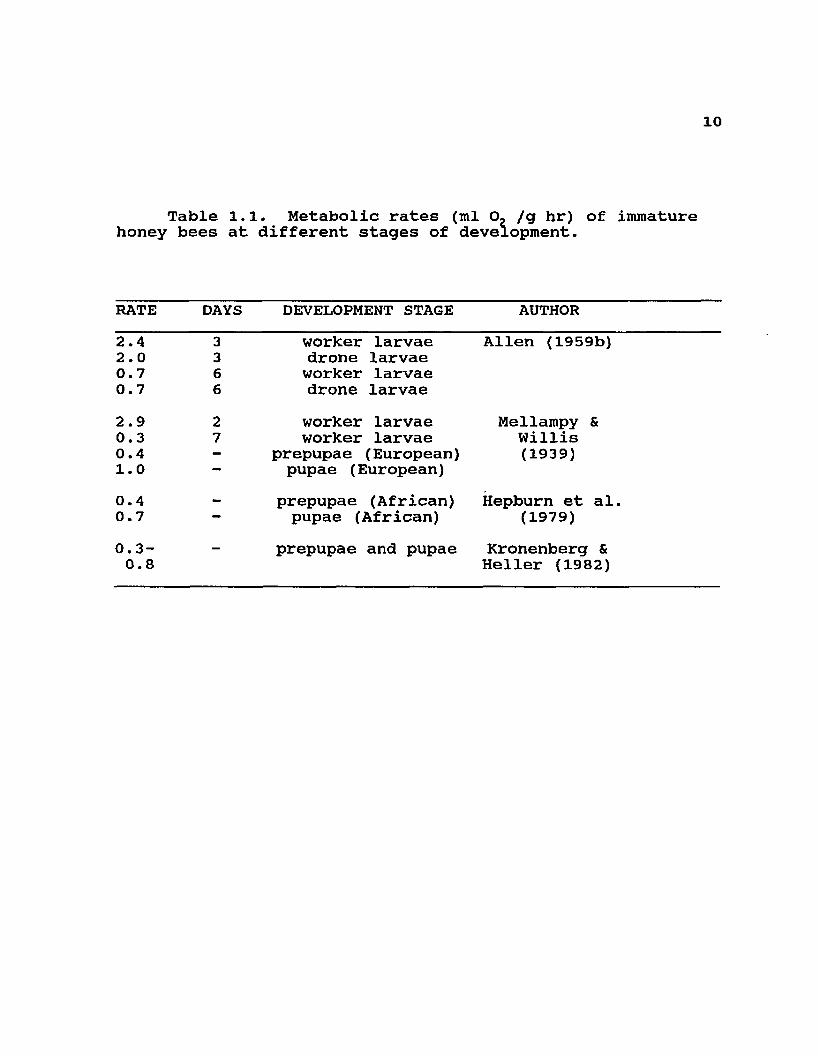
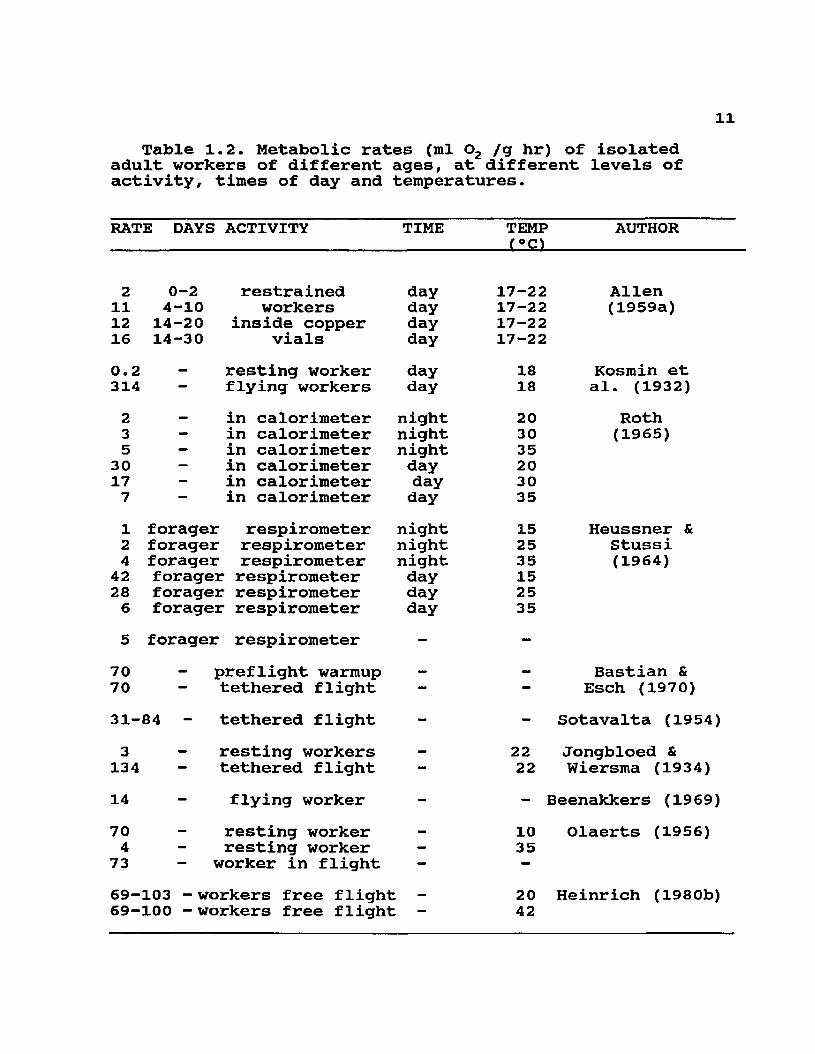
Maintenance of body temperature above ambient entails an energetic cost for individuals and colonies which can be measured as metabolic rates. Metabolic rate measurements of isolated bees and of groups of workers vary tremendously (see Tables 1.1, 1.2, 1.3 and 1.4; see Appendix A for an explanation of how these values were obtained from the literature). Some of this variation is probably due to the use of different measurement techniques, by different investigators, over a period of close to a century. Another source of variation is surely biological in origin since measurements were taken on bees of different ages, at different times of day, in different seasons of the year, and under different conditions of confinement or restriction, all of which have been shown to influence metabolic rates. Probably the greatest source of variation in these measurements arises from the 'aerobic scope' of honey bees, that is, the difference between 'resting' and 'active' metabolic rates. The influence of behavior upon the 'setting' of metabolic rates cautions against reliance on measurements for which techniques, biological states and the conditions regulating behavior have not been standardized.
An examination of the available information, based largely upon European bees, elucidates some general trends (Tables 1.1, 1.2, 1.3 and 1.4). Given the variation
1 0
Table 1.1. Metabolic rates (ml O- /g hr) of immature honey bees at different stages of development.
RATE DAYS DEVELOPMENT STAGE AUTHOR2.4 3 worker larvae Allen (1959b)2.0 3 drone larvae0.7 6 worker larvae0.7 6 drone larvae2.9 2 worker larvae Mellampy &
Willis0.3 7 worker larvae0.4 - prepupae (European) (1939)1.0 pupae (European)0.4 - prepupae (African) Hepburn et al.0.7 • pupae (African) (1979)0.3-0.8
prepupae and pupae Kronenberg & Heller (1982)
1 1
Table 1.2. Metabolic rates (ml 02 /g hr) of isolated adult workers of different ages, at different levels of activity, times of day and temperatures.
RATE DAYS ACTIVITY TIME TEMP ( °C)
AUTHOR
2 0-2 restrained day 17-22 Allen11 4-10 workers day 17-22 (1959a)12 14-20 inside copper day 17-2216 14-30 vials day 17-220.2 — resting worker day 18 Kosmin et314 — flying workers day 18 al. (1932)2 — in calorimeter night 20 Roth3 — in calorimeter night 30 (1965)5 — in calorimeter night 35
30 — in calorimeter day 2017 - in calorimeter day 307 — in calorimeter day 351 forager respirometer night 15 Heussner &2 forager respirometer night 25 Stussi4 forager respirometer night 35 (1964)
42 forager respirometer day 1528 forager respirometer day 256 forager respirometer day 355 forager respirometer - -
70 — preflight warmup — — Bastian &70 tethered flight — — Esch (1970)31-84 - tethered flight - - Sotavalta (1954)3 — resting workers — 22 Jongbloed &
134 — tethered flight — 22 Wiersma (1934)14 - flying worker - - Beenakkers (1969)70 — resting worker — 10 Olaerts (1956)4 — resting worker - 35
73 — worker in flight — —
69-103 - workers free flight 20 Heinrich (1980b)69-100 - workers free flight 42
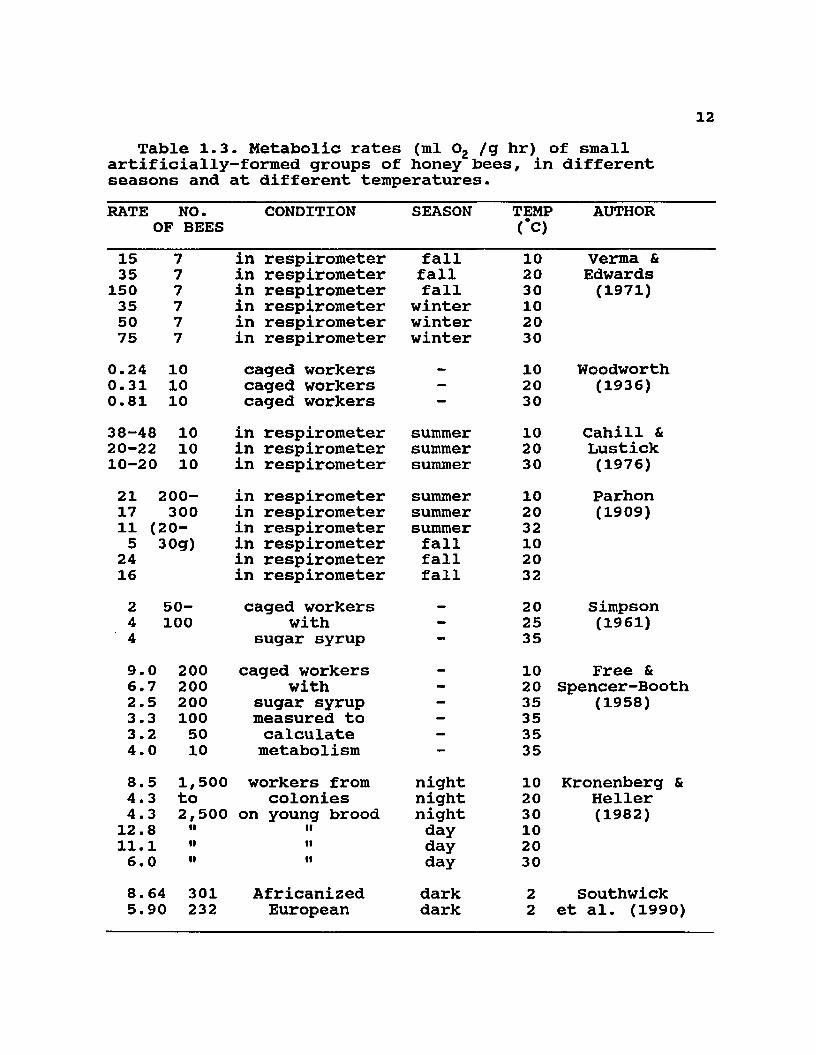
Table 1.3. Metabolic rates (ml 02 /g hr) of small artificially-formed groups of honey bees, in different seasons and at different temperatures.RATE NO.
OF BEESCONDITION SEASON TEMP
(°C)AUTHOR
15 7 in respirometer fall 10 Verma &35 7 in respirometer fall 20 Edwards
150 7 in respirometer fall 30 (1971)35 7 in respirometer winter 1050 7 in respirometer winter 2075 7 in respirometer winter 30
0.24 10 caged workers — 10 Woodworth0.31 10 caged workers - 20 (1936)0.81 10 caged workers — 3038-48 10 in respirometer summer 10 Cahill &20-22 10 in respirometer summer 20 Lustick10-20 10 in respirometer summer 30 (1976)21 200- in respirometer summer 10 Parhon17 300 in respirometer summer 20 (1909)11 (20- in respirometer summer 325 30g) in respirometer fall 10
24 in respirometer fall 2016 in respirometer fall 322 50- caged workers — 20 Simpson4 100 with — 25 (1961)4 sugar syrup “ 359.0 200 caged workers — 10 Free &6.7 200 with - 20 Spencer-Booth2.5 200 sugar syrup — 35 (1958)3.3 100 measured to — 353.2 50 calculate - 354.0 10 metabolism — 358.5 1,500 workers from night 10 Kronenberg &4.3 to colonies night 20 Heller4.3 2,500 on young brood night 30 (1982)
12.8 •i ii day 1011.1 i t ii day 206.0 i i ii day 308.64 301 Africanized dark 2 Southwick5.90 232 European dark 2 et al. (1990)
13
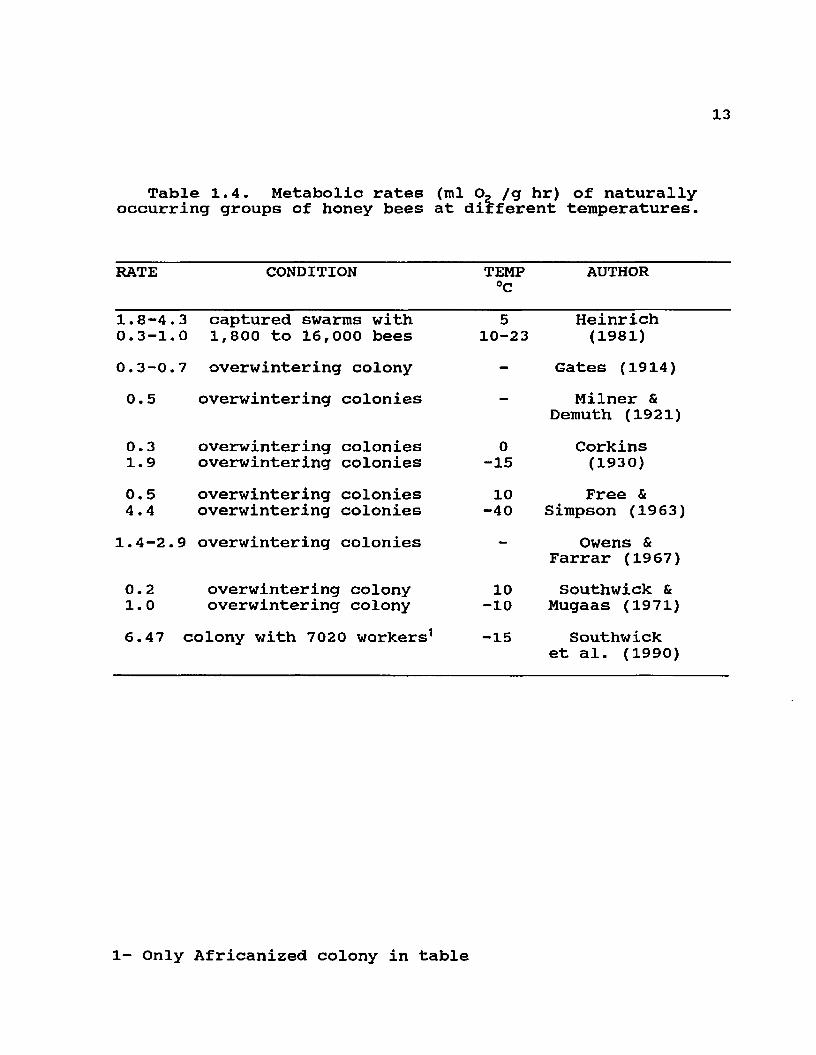
Table 1.4. Metabolic rates (ml O, /g hr) of naturally occurring groups of honey bees at different temperatures.
RATE CONDITION TEMP AUTHOR°C
1.8-4.3 0.3-1.0
captured swarms with 1,800 to 16,000 bees
510-23
Heinrich(1981)
0.3-0.7 overwintering colony - Gates (1914)0.5 overwintering colonies — Milner &
Demuth (1921)0.31.9
overwintering colonies overwintering colonies
0-15
Corkins(1930)
0.54.4
overwintering colonies overwintering colonies
10-40
Free & Simpson (1963)
1.4-2.9 overwintering colonies — Owens & Farrar (1967)
0.21.0
overwintering colony overwintering colony
10-10
Southwick & Mugaas (1971)
6.47 colony with 7020 workers1 -15 Southwick et al. (1990)
1- Only Africanized colony in table
14explained above there are exceptions to every generalization in any one of the categories.
The respiratory rates of isolated bees and of small groups of workers tend to be within the same order of magnitude (10-100 ml 02 /g hr) , while larger swarms and overwintering colonies usually have lower rates ( < 10 ml Oz /g hr). There is a clear circadian rhythm of activity, with metabolic rates decreasing at night both in isolation and in groups (Roth 1965, Heussner & Stussi 1964, Kronenberg & Heller 1982). Resting metabolic rates seem to be much lower in brood than in adults (Allen 1959b, Mellampy & Willis 1939, Hepburn et al. 1979, Kronenberg & Heller 1982), and they seem to increase with the age of adults (Allen 1959a). Isolated individuals exhibit a typical homeothermic inverse relationship between metabolic rates and external temperatures during the day and a more relaxed poikilothermic response at night (Roth 1965, Heussner & Stussi 1964). However, as group size increases responses are not as clear (compare Verma & Edwards 1971 with Cahill & Lustick 1976), although Southwick et al. (1990) report strong relationships between biomass and decreased metabolic rates. All of these differences are relatively small compared to the differences between metabolic rates at rest and in flight (Kosmin et al. 1932, Jongbloed & Wiersma 1934).
15Brood-rearina
The amount of brood produced by honey bee colonies in temperate and tropical regions varies seasonally in adaptive patterns closely matching environmental conditions and resource availability (Nolan 1925, Pesante 1985). Temperate regions typically have a burst of brood production in the spring, with increased probability of colonies swarming during that period. This spring maximum is usually followed by lower rates of brood production in the summer and fall. Depending on latitude, brood production either decreases to a very low value or actually stops during the winter (Avitabile 1978). Generally, patterns of brood production are not as peaked in tropical areas, where brood production is continuous and directly influenced by floral resources.
The proximate factors that regulate brood production in tropical and temperate environments appear to be different. In the tropics, where photoperiods are not highly variable, flowering phenologies are more dependent on rainfall patterns. Colony growth patterns are dependent on nutritional potential dictated by these rainfall patterns.In temperate regions the nutritional potential from floral resources obviously imposes a constraint on colony growth, but photoperiod appears to directly regulate brood production. In experimental European colonies with adequate and constant nutrition, brood areas varied according to set artificial photoperiods; increasing daylengths caused
16increases in brood area and decreasing light periods brought about decreases in brood areas (Kefuss 1978). Photoperiod alone explains the initiation of brood-rearing soon after the winter solstice (Avitabile 1978). Unfortunately, there are no comparative data on whether Africanized bees respond similarly to these photoperiodic cues.Physiological Changes of Workers in Winter
Lack of brood-rearing during winter months brings about a series of correlated physiological changes. Maurizio (1968) described these changes with the term 'winter bees' and distinguished them from 'summer bees' by comparing size of hypopharyngeal glands and fat body development. More recent physiological studies have shown that winter workers also differ in vitellogenin and JH titres (Fluri et al.1977), and in protein metabolism and haemolymph composition (Crailsheim 1985, 1986). These physiological changes presumably increase the longevity of winter workers and thereby promote survivorship of colonies during winter periods where brood production is interrupted (Maurizio 1950). Experiments with caged bees clearly demonstrated that lack of brood-rearing combined with ample protein nutrition were sufficient to prolong the lifespan of workers at any time of the year (Maurizio 1950). The appearance of 'winter' European bees is therefore caused by lack of brood rearing activities.
1 7
Overwintering Experiments with Africanized Bees During the past two centuries, African bees have been
introduced to the U.S. and Europe on a number of different occasions (Morse et al. 1973). In addition, Africanized bee sperm from Brazil was introduced to Louisiana in 1960 and 1961, and through four generations of backcrossing, Africanized stock was maintained in the field for years (Taber 1961, 1977). Despite these opportunities for population expansion, such introductions did not noticeably modify the behavioral or genetic characteristics of the local European honey bee population. African germplasm has not been discovered in the U.S. or Europe in the few genetic studies performed recently using isozymes (Sheppard & Berlocher 1985, Sheppard & McPheron 1986, Sheppard 1988), and mtDNA and nuclear DNA restriction patterns (Smith et al. 1989, Hall & Muralidharan 1989, Hall 1990). This absence of African influence contrasts markedly with the genetic takeover documented in Brazil in the 1960s, after the 1956 introduction of bees from South Africa.
There are numerous explanations for the contrasting outcomes of these introductions. One of them, overwintering mortality of African bees, is a likely cause for the failure of the introductions to temperate regions, but has never been clearly documented.
Overwintering mortality was clearly seen in Africanized stock introduced from Brazil to Poland by Woyke (1973).
Colonies with Africanized queens and their worker offspring survived the early parts of winter, but had high mortalities after 3 months of winter. Hybrids showed improved overwintering capacity over the 'pure' Africanized types. Interestingly, colonies starting the winter with Africanized queens and European workers (progeny of other queens) survived so well that this system has been used to maintain African germplasm over several winters (J. Woyke, pers. comm.). Some Africanized colonies did survive the winter, indicating that climatic limits are not absolute.
Earlier experimental studies conducted in South America had not detected obvious differences in survival between Africanized and European colonies. Mortality of both large colonies and small nuclei were reported as similar during a 3 month winter period at 32° S, and 1400 m above sea level in Cordoba, Argentina (Krell et al. 1985), or at 3 0° S and 2700 m above sea level in San Juan (Dietz et al. 1986). Similarly, no major differences were found in survivorship of colonies in cold rooms in Argentina maintained for 78 days in 1984 (Dietz et. al 1988) and for 90 days in 1985 (Dietz et al. 1989). A 10-day study at 4250 m above sea level close to the equator in Colombia did not find appreciable differences between the two groups (Villa et al. 1987). As has been stated before (Villa et. al 1987), the duration of these earlier experiments and the temperature extremes to which these colonies were exposed might have
19been insufficient to allow detectable expression of ecologically significant behavioral and physiological differences.
A recent experiment by Southwick et al. (1990) showed much higher 'minimum maintained oxygen consumption' by groups of Africanized workers than by European workers maintained at 2°C, specially at sizes below 100 g (Table 1.3). A larger group of 7020 Africanized workers with queen and brood maintained adequate core temperatures at ambient temperatures of -15°C, but had a metabolic rate higher than that reported for European bees at similar temperatures (Table 1.4). It is unclear how these results led the authors to predict the range for Africanized bees in the U.S., since their predictions are based upon lines with equal numbers of consecutive days of flightlessness (under 10°C), and not upon considerations of energy balance.
The experiments described in this thesis represent a new set of studies on the overwintering potential of Africanized honey bees. Side-by-side comparisons were made using groups of Africanized and European bees, and in some experiments their hybrids, of sizes ranging from 40 g to normal field colonies in order to answer the following questions:1) Are there differences in the aggregation and insulative behavior (clustering) and in their thermoregulatory abilities?
202) Are there differences in the rates of store consumption resulting from different metabolic rates or from different 'strategies' of utilization of stores?3) Are there differences in worker longevity and in survivorship of colonies exposed to long periods of low temperature and confinement?
These type of comparisons were made under the following circumstances:1) In artificially-formed groups and in colonies all under cold room conditions. (Chapter 2).2) In colonies moved to a highland location (4100 m above sea level) in Venezuela during the rainy seasons of 1986 and 1987 (Chapter 3).3) In colonies derived from Africanized germplasm in Germany in 1988 (Chapter 4).
Chapter 2.
Thermoregulatory Behavior, store Consumption, and Survival of Africanized and European Bees
under Cold Room Conditions
21
22Introduction
Africanized and European honey bees have been categorized respectively as "tropically and temperately adapted" organisms based upon their native ranges and life history characteristics (e.g. Danka et al. 1987, Winston et al. 1984). Differences in the ranges of these two genotypes as feral bees after their human-assisted introduction to the Americas have also been explained as a consequence of these contrasting evolutionary strategies (Taylor 1977, Taylor & Spivak 1983, Taylor 1985, Winston et al. 1984). Temperate areas of North America have had feral European honey bees for several centuries (Kritsky 1991). Tropical areas of South America did not appear to have sizable European- derived populations yet were occupied at fast rates by African-derived honey bees since 1956 (Taylor 1977) . The adaptation paradigm has been further substantiated by the much slower movement of African-derived honey bees into subtropical areas of Brazil and Argentina and by the appearance of a •climatic barrier' beyond which only European bees are reported (Kerr et al. 1982) . Even though Dietz et al. (1985, 1989) have questioned whether the distribution pattern in Argentina truly represents a stable equilibrium and whether it is caused by different tolerances to winter conditions, recent surveys using mtDNA, isozymes and morphometries have shown the existence of three intergrading latitudinal bands: a largely African zone, a
23hybrid zone, and a largely European zone (Sheppard et al. 1991).
The tendency to categorize the Africanized and European honey bee differential distribution in terms of adaptation to different environments has led to several hypotheses to explain possible differential survival under cold or winter conditions: 1) Africanized bees could be less precise at maintaining thermal homeostasis through imperfect heat generation and aggregation (Nufiez 1979); 2) smaller worker size and less precise aggregation might produce higher mass specific metabolic rates at cold temperatures and lead to the early depletion of already small winter stores (Taylor 1977) ; or 3) "Tropical" life history traits such as shorter worker lifespan and continued brood production during winter months might lead to colony winter mortality (Taylor &Spivak 1984).
Attempts to experimentally confirm these hypothetical causes of winter mortality have produced ambiguous results. The only available evidence on differences in thermoregulatory capacity comes from recordings of thermoregulatory difficulties in two African colonies at high ambient temperatures in Gabon (Darchen 1973) and from lack of clustering behavior in one small group of Africanized workers compared to a European group at 10°C (Nunez 1979). In contrast, side by side comparisons of Africanized and European colonies at high and low ambient
24temperatures failed to show differences in temperature regulation and demonstrated strong aggregation of both Africanized and European workers at low temperatures (Villa et al. 1987).
Experiments on weight loss of colonies at low temperatures in Argentina (Krell et al. 1985, Dietz et al. 1988, 1989), and in Colombia and Venezuela (Villa et al. 1987), have not indicated significant differences from European bees that could lead to earlier depletion of honey stores by Africanized bees. In contrast, direct measurements of metabolic rates on groups of different sizes showed different slopes in the VOz line (logarithmic regression line comparing oxygen consumption and biomass of groups of workers) for the two types of bees, suggesting that groups of Africanized bees smaller than 1000 g could have increasingly higher store consumption rates than European groups of similar sizes (Southwick et al. 1990).
Experiments testing differences in life history traits have once again been unclear in detecting mechanisms that might impair Africanized colony overwintering. Although Woyke (1973) reported fast Africanized colony attrition after 90 days in Poland, Krell et al. (1985) and Dietz et al. (1986, 1988, 1989) showed that mortalities of Africanized and European colonies in Argentina during winter months or in cold rooms were similar.
These new experiments were conducted in cold rooms to test the hypotheses of reduced thermoregulatory abilities, increased store consumption rates, and shorter worker lifespan of Africanized bees. The results of these experiments point to clear differences in some aspects of thermoregulatory ability that could impair winter survival of complete Africanized colonies in the field (and which are confirmed in field tests reported in chapters 3 and 4) .
Materials and Methods Experiments were conducted in a cold room in Acarigua,
Venezuela during 1986 and 1987. Bees of three different genotypes were obtained as needed from research apiaries maintained in the area; hives in those apiaries had marked queens of known European origin (E) or feral Africanized origin (A), or European daughter queens that had mated with feral drones and therefore produced largely hybrid workers (E X A ) . Four different experimental arrangements were designed to compare different behavioral and physiological components of overwintering. In these experiments, different combinations of group size, and the presence orabsence of brood and comb were used.Experiment 1 : Forty g of workers in hoarding cages
Combs with emerging brood from 64 colonies (31 A, 33 E)were placed inside screen bags in incubators at 35°C, 90%R.H. As the emergence of workers continued, 40 g of adult
26workers without a queen (weighed to the nearest individual bee) were removed at a time from each bag and shaken into hoarding cages with all wooden sides except for the glass front and screen bottom (Kulincevic & Rothenbuhler 1973). Filled cages were provided with sugar syrup and water, and were maintained at room temperature for up to 3 days until 75 cages from the European colonies and 77 cages from the Africanized colonies had been filled. Copper-constantan thermocouples were placed in 54 of the cages through the roof of the cage between the food vials.
At the beginning of the experiment all cages were giventwo vials with 50% sucrose, and the thermostat of the cold room was decreased to 15°C (±2.5°C). Whenever the thermostat closed the electrical circuit, the cooling unit inside the room produced an air current reaching each one of the cages, producing a cooling potential beyond that of still air at 15°C. For the first eleven days, dead bees at the bottom of each cage were counted and removed. At thesame time, the position of the clustered bees and the degreeof aggregation of bees in each cage were recorded. An observer blind to the identity of cages classified each cage into one of four position categories previously observed in preliminary trials (against back wall, on bottom of cage, symmetrical hanging from roof, or on roof and side wall), and into one of five cluster tightness categories (0 indicating no grouping and highly mobile bees, to 5 as very
27tightly packed and immobile bees). Cluster positions against the back wall or on the bottom of the cage (and therefore separated from the feeders) were placed into a class (non-viable), and the daily frequencies in each of the resulting three classes (non-viable, roof, and side) for each genotype were analyzed by G-tests (Sokal & Rohlf 1981). Cluster tightness rankings were grouped into 3 classes (0,1,2; 3; and 4,5) to have sufficient numbers in each cell for analysis by genotype and by day with G-tests. Because groups clustered in positions away from the feeders in many cages, the thermocouples in the first 54 cages were moved to cages with clusters near the feeder on day 7, and only temperatures obtained from within the cluster were used to compare differences among genotypes with ANOVA.
After daily observations of clustering, the cold room was opened for two hours so that the change to ambient temperatures ( > 25°C) would allow workers to move, feed and relocate if necessary. Then the room was cooled again to around 15°C for the next 22 hours. Syrup vials were weighed and replaced according to need on days 2, 4, 6, 8 and 10.The rate of sugar syrup consumption per g of live bees for each 2-day period was calculated using the information on syrup consumption, number of dead bees, and average initial bee weight for each cage. These values were compared by repeated measures ANOVA (Steel & Torrie 1980, SAS Institute 1985).
28Experiment 2 : One kg of workers in screen cages
Workers (1.0 kg) without their queen were shaken from 5 A, 5 E and 5 E X A colonies into a wooden box with screened sides (15 x 25 x 35 cm). They were given a weighed feeder can with 50% sucrose solution over a screened hole (diameter 10 cm) at the top of the cage. The cages were then placed in the cold room and maintained for 5 days (24 h at a time) at 20, 10, 5, 20, and 0"C. At each temperature, the maximum cross-sectional parabolic dimensions of the hanging cluster (maximum length and height as observed from the screened side) were measured at 20:00 hrs and at 8:00 hrs of the following day. Maximum cross-sectional areas of the clusters, as well as ratios of length to height were compared by repeated measures ANOVA. At the same times, cluster core temperatures were recorded with copper- constantan thermocouples connected to a telethermometer.
The rate of syrup consumption was imprecise from leakage of syrup due to the rapid changes in temperatures in this first test. A second set of 10 A and 10 E 1.0 kg screened groups were maintained at 12.5°C for a period of 5 days. Total consumption of sucrose syrup by the two genotypes in this second test was compared by ANOVA. Experiment 3 : Colonies without brood
Ten weighed combs with honey were placed into each of four empty screened hives. Copper constantan thermocouples were distributed in 7 cm grids arranged inside each of the
colonies as follows (see Fig. 2.1 and 2.2): 3 rows and 6 columns in the space between combs 5 and 6 (center); 2 rows and 4 columns in the spaces between combs 2 and 3 (left), and between combs 8 and 9 (right). Workers (1.5 kg) with a free queen (2 A, 2 E) were added to each one of the four hives. Temperatures were scanned at 7:00 and 19:00 hours during 3 days while ambient temperature oscillated between 10 and 15cC; temperatures were gradually decreased for 5 days until they oscillated between -2 and +2°C; a series of measurements were then made at the same times for 3 days at these new temperatures. Isotherms for 15, 20, 25, and 30°C were drawn for each one of the sections between combs (center, left and right) by interpolating the location of these temperatures between adjacent thermocouples.Experiment 4 : Colonies with brood
Five A and five E colonies were selected as matched pairs from research apiaries. Comb weight and brood area were measured in the field. Colonies were then screened, transported, reweighed, and taken into a cold room at 15°C. Adult worker biomass was estimated as the difference between total weight and comb / hive weight. Temperatures were decreased over a period of 10 days to 0"C, except for a period of 5 days where they rose to ambient due to failure of the cooling unit's compressor. Colonies remained in this cold room for 73 days.
At the end of the experiment, weights of comb and of dead adults were taken, and brood areas were remeasured.The final brood area, total adult mortality, comb weight change, and rate of store consumption (kg stores/ mean kg adults/ week) were compared by ANOVA.
ResultsThere was a distinct genotypic difference in the daily
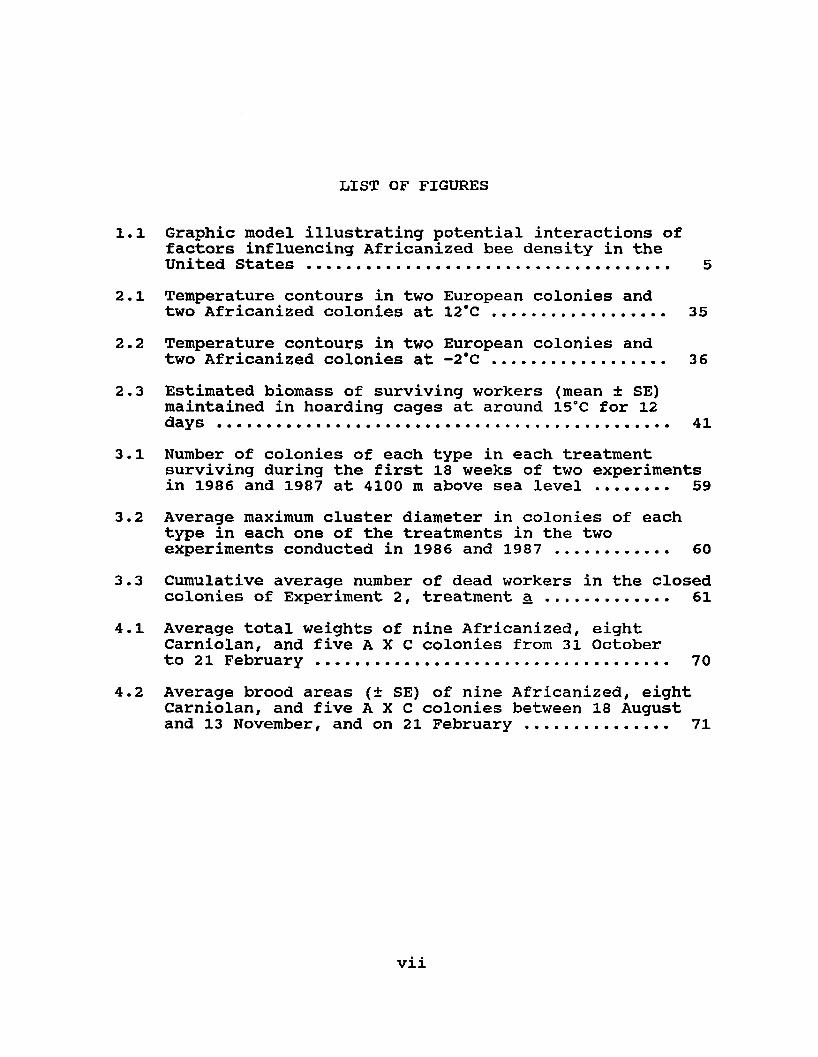
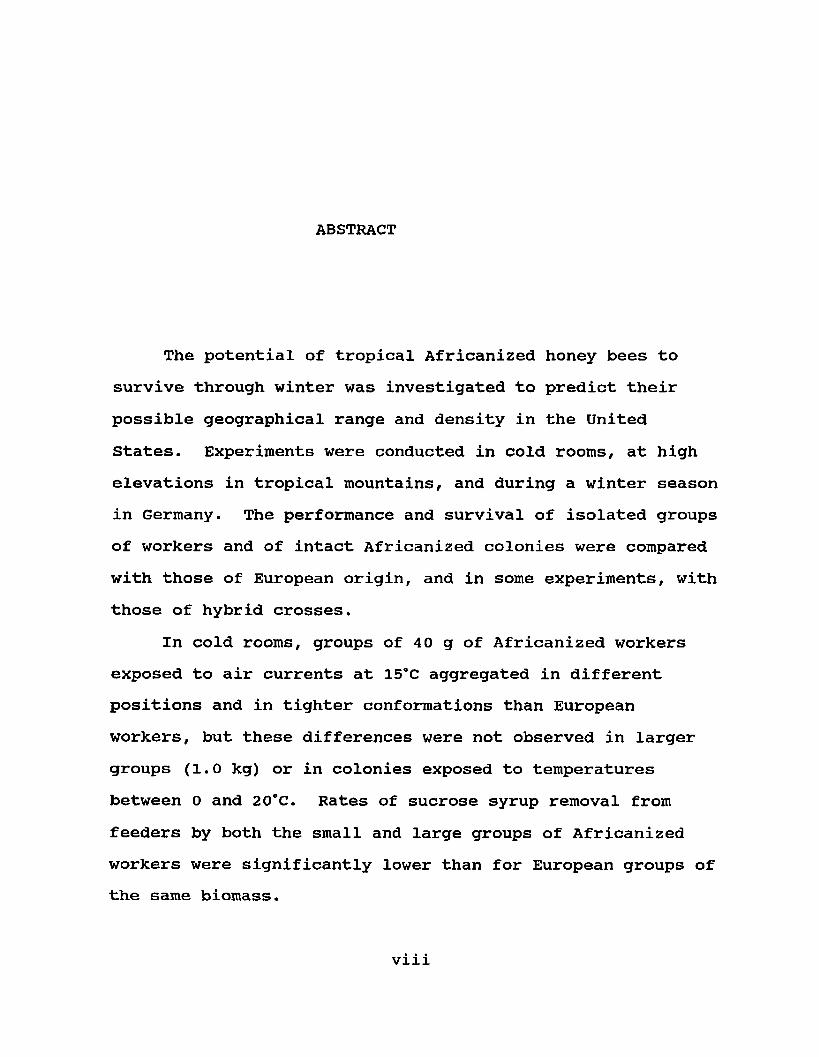
categorical distribution of cluster position and cluster tightness of small groups of bees exposed to cooling by air currents at 15°C (Tables 2.1 and 2.2). These differences were fairly consistent through the days of the experiments as indicated by significant G values for most days. Cluster measurements were not significantly different in larger 1.0 kg groups in screened cages (Table 2.3). In this case, the maximum cross-sectional area did not differ significantly among the three genotypes, and neither did the ratio of cluster length to height. These two attributes of clustering were strongly influenced by decreasing temperature in all genotypes. Although only two colonies of each type were used to measure temperatures in broodless hives with comb, the same biomass of A and E workers appeared to consistently occupy similar volumes at each temperature (12 and -2°C) and much smaller volumes at the lower temperature than at the higher temperature (see Fig2.1 and 2.2). Measurements within each colony at each
31
Table 2.1. Number of cages with workers clustered in different positions of the cage, arranged by day and genotype (Experiment 1).
DAY GENOTYPE POSITION G PNon-viable Roof Side
2 A 33 7 37 43.51 <0.005E 8 40 27
3 A 26 11 40 17.94 <0.005E 7 26 42
4 A 20 14 43 8.37 <0.025E 7 12 56
5 A 15 22 40 5.70 >0.100E 5 25 45
6 A 18 28 31 10.12 <0.010E 5 26 44
7 A 22 21 34 11.45 <0.005E 6 24 45
8 A 20 22 35 10.95 <0.005E 5 27 43
9 A 24 24 29 9.69 <0.010E 14 42 19
10 A 20 17 40 2.49 >0.100E 13 14 48
Total A 198 166 329 78. 01 <0.001E 70 236 369
32
Table 2.2. Number of cages with workers clustered at different tightness, arranged by day and genotype (Experiment 1).
DAY GENOTYPE TIGHTNESS G P0 1 H 1 to 3 4-5
2 A 2 42 33 46.07 <0.001E 30 37 8
3 A 5 43 29 51.15 <0.001E 28 44 3
4 A 9 32 35 45.72 <0.001E 22 51 2
5 A 6 36 35 44.31 <0.001E 28 43 4
6 A 2 40 32 38.26 <0.001E 18 52 5
7 A 5 25 41 57.98 <0.001E 19 53 3
8 A 12 32 27 20.04 <0.001E 21 48 6
9 A 19 34 17 79.07 <0.001E 67 4 0
10 A 14 22 23 12.72 <0.001E 22 37 8
Total A 74 306 272 307.48 <0.001E 255 369 39
33
Table 2.3. Cluster dimensions (area in sq cm / ratio of length to height of cross-sectional parabola at 20:00) of 1.0 kg groups of bees at different ambient temperatures (Experiment 2).
Colony Temperature (oC)
E1 312
20/ 1.44 208
10/ 2 . 17
i200
5/ 2.08 169
0/ 2 . 09
2 304 / 1.26 213 / 1. 25 187 / 1.43 215 / 1. 643 373 / 1.40 234 / 1.38 215 / 1. 12 205 / 1.574 385 / 2.00 267 / 1.56 252 / 1.93 213 / 3.205 288 / 1.69 270 / 1.80 192 / 2.00 204 / 3 .78
Mean 332 / 1.56 238 / 1.63 209 / 1.71 201 / 2.46E X A
1 385 / 2.00 181 / 4.25 136 / 5.67 181 / 4.252 317 / 1.65 220 / 1.47 183 / 2.27 208 / 1. 863 288 / 1.69 217 / 3.38 192 / 2.00 144 / 3.344 322 / 0.91 241 / 1.85 201 / 1.57 208 / 1.855 191 / 1.69 153 / 2.30 147 / 2.20 140 / 2 . 10
Mean 301 / 1.59 202 / 2.65 172 / 2.74 176 / 2 . 68A1 299 / 1.75 224 / 2.33 198 / 2.45 156 / 2.882 320 / 1.88 320 / 2.13 224 / 1.71 217 / 1.923 165 / 3.88 249 / 3.09 133 / 3.13 140 / 4.284 264 / 2.75 290 / 1.93 183 / 2 .27 200 / 2. 085 200 / 0.75 230 / 1.53 169 / 2.09 205 / 2. 55
Mean 249 / 2 .20 262 / 2.20 181 / 2.33 183 / 2. 74
Source Cluster■ Area Length to HeightF P F P
Type 1.47 0.2677 0.90 0.4327Temperature 41.72 0.0001 5.81 0.0024Type * Temperature 3.64 0.0063 1.48 0.2143
34
Table 2.4. Core temperatures (°C) of 1.0 kg artificial swarms at 8:00 / 20:00 h at different ambient temperatures (Experiment 2).
Colony________________________Temperature (° C^
E1
20 10 5 027.9 / 28.5 23.8 / 26.2 18.8 / 24 .7 2.1 / 23.6
2 24.0 / 28.6 20.2 / 21.5 18.2 / 19.2 10.4 / 17.93 26.4 / 28. 1 18.6 / 21.2 14.7 / 16.2 1.9 / 15.54 26.7 / 27.5 20.3 / 20.1 16.9 / 18.9 9.0 / 14 . 55 27.8 / 28.5 21.6 / 23.7 23.2 / 20.2 12.6 / 23.4
Mean 26.6 / 28.2 20.9 / 22.6 18.4 / 19.8 7.2 / 19.0E X i
1\27.2 / 27.9 24.7 / 28.0 22 . 0 / 23 .8 0.9 / 25. 3
2 27.3 / 28.7 23.7 / 25.9 21.8 / 23.5 11.2 / 25.13 26.4 / 26.1 26.2 / 24.3 21.4 / 21.5 15.2 / 21.44 30.5 / 28.5 23.0 / 24.8 17.5 / 20.3 11.6 / 14.15 31.0 / 29. 0 22.7 / 23 . 3 15.3 / 16.1 1.6 / 9.5
Mean 28.5 / 28.0 24.1 / 25.3 19. 6 / 21.0 8.1 / 19.1A1 26.9 / 28. 3 22.6 / 24.6 18.3 / 20.5 6.4 / 20.72 26.8 / 28.2 18.2 / 23.2 20.9 / 20.3 16.9 / 25.13 31.3 / 29.1 24.6 / 26.5 16. 6 / 24.7 8.7 / 23 .14 28.7 / 27.9 18.8 / 21.9 12.7 / 18.5 7.7 / 16.95 28.1 / 30.1 22.7 / 19. 6 22.8 / 21.0 8.8 / 17.9
Mean 28.4 / 28.7 21.4 / 23.2 18.3 / 21.0 9.7 / 20.7Source Temp. 8:00 h Temp. 20:00 h
F P F PType 1.20 0.3346 0.29 0.7563Temperature 91.27 0.0001 37.62 0.0001Type * Temperature 0.43 0.8512 0.63 0.7053
35
E-1
A-1
J e n te
i
K \ w m w « K ^
• • $
L e f t
Right
E -2
T O i^M iSK ^SSasaoeG W & K -
e n te
L e f t
Right
A -2
M M
• # ^ *
Fig. 2.1 — Temperature contours (above 30, 25—30, and 20- 25) in two European colonies (E-1, E-2) and two Africanized colonies (A-1, A-2) estimated from measurements with copper- constantan thermocouples between frames 5-6 (Center), 2-3 (Left) and 8-9 (Right) at 12*C (Experiment 3).
36
E-1
A-1
e n t e i
L e f t
Right
E -2
[Jen te
L e f t
A -2
Right
• • •
• m
• •
Fig. 2.2 - Temperature contours (above 30, 25-30, 20-25 and 15—20"C) in two European colonies (E-1, E-2) and two Africanized colonies (A-1, A-2) estimated from measurements with copper-constantan thermocouples between frames 5-6 (center) , 2-3 (Left) and 8-9 (Right) at -2*C (Experiment 3) .
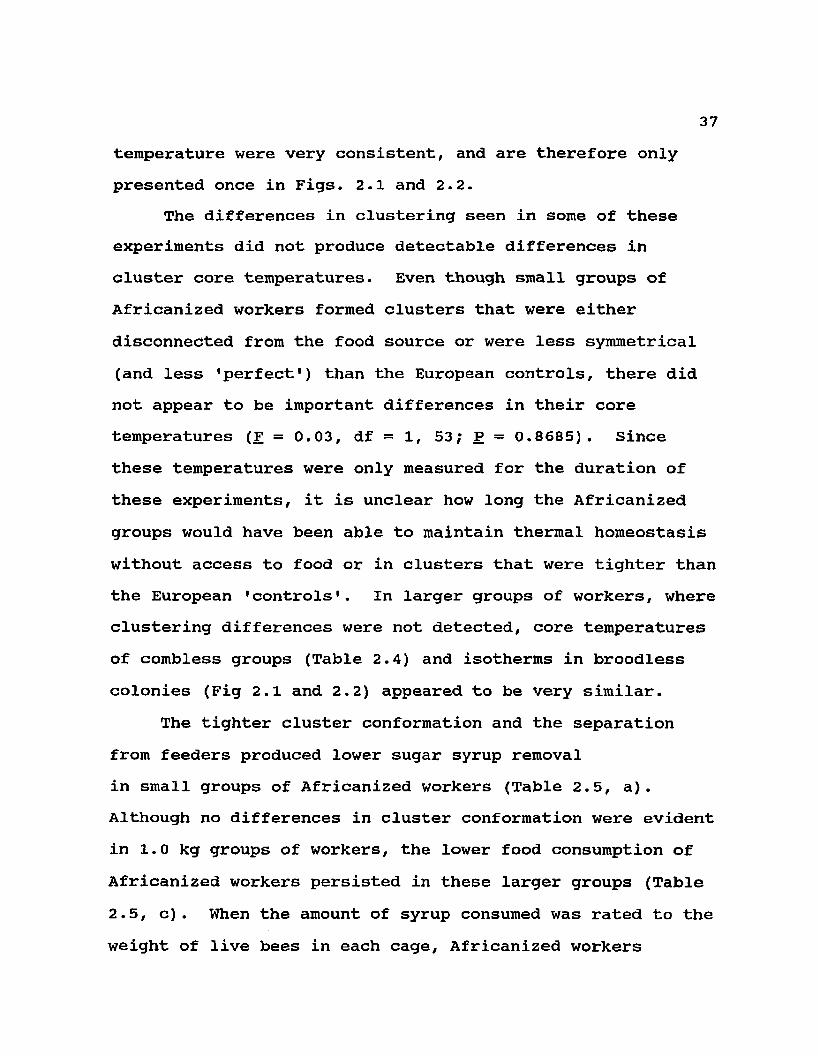
37temperature were very consistent, and are therefore only presented once in Figs. 2.1 and 2.2.
The differences in clustering seen in some of these experiments did not produce detectable differences in cluster core temperatures. Even though small groups of Africanized workers formed clusters that were either disconnected from the food source or were less symmetrical (and less 'perfect') than the European controls, there did not appear to be important differences in their core temperatures (F = 0.03, df = 1, 53; P = 0.8685). Since these temperatures were only measured for the duration of these experiments, it is unclear how long the Africanized groups would have been able to maintain thermal homeostasis without access to food or in clusters that were tighter than the European 'controls'. In larger groups of workers, where clustering differences were not detected, core temperatures of combless groups (Table 2.4) and isotherms in broodless colonies (Fig 2.1 and 2.2) appeared to be very similar.
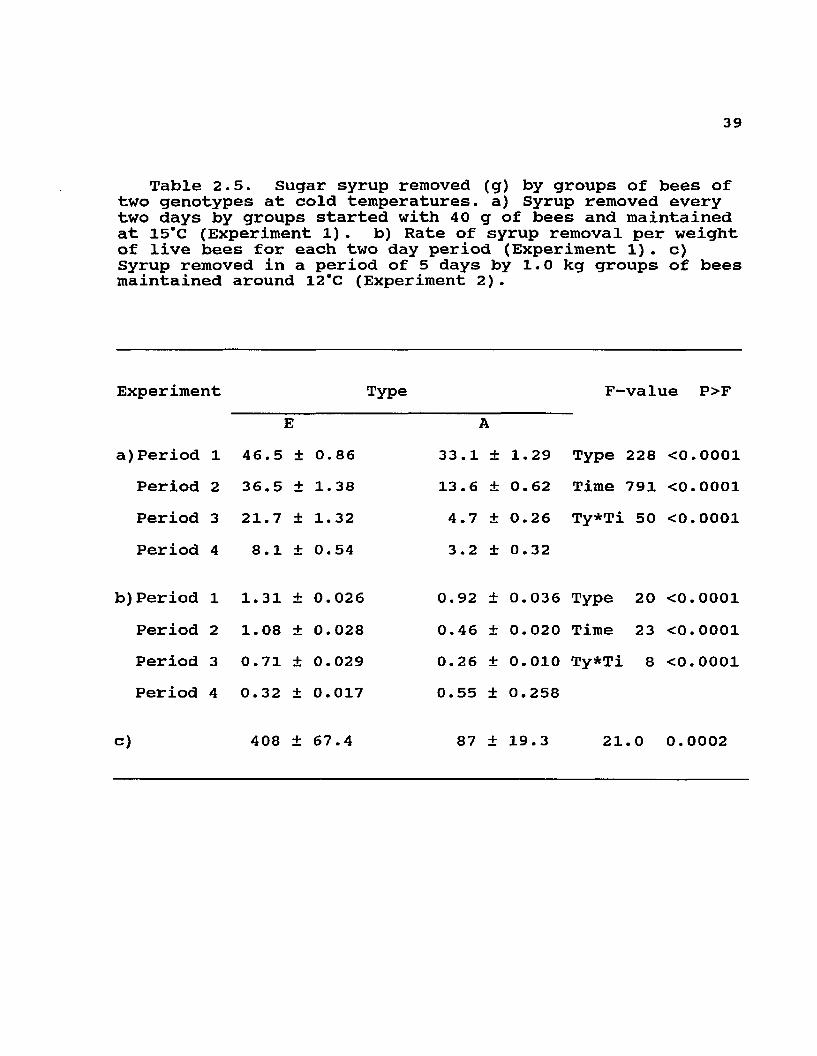
The tighter cluster conformation and the separation from feeders produced lower sugar syrup removal in small groups of Africanized workers (Table 2.5, a). Although no differences in cluster conformation were evident in 1.0 kg groups of workers, the lower food consumption of Africanized workers persisted in these larger groups (Table 2.5, c). When the amount of syrup consumed was rated to the weight of live bees in each cage, Africanized workers
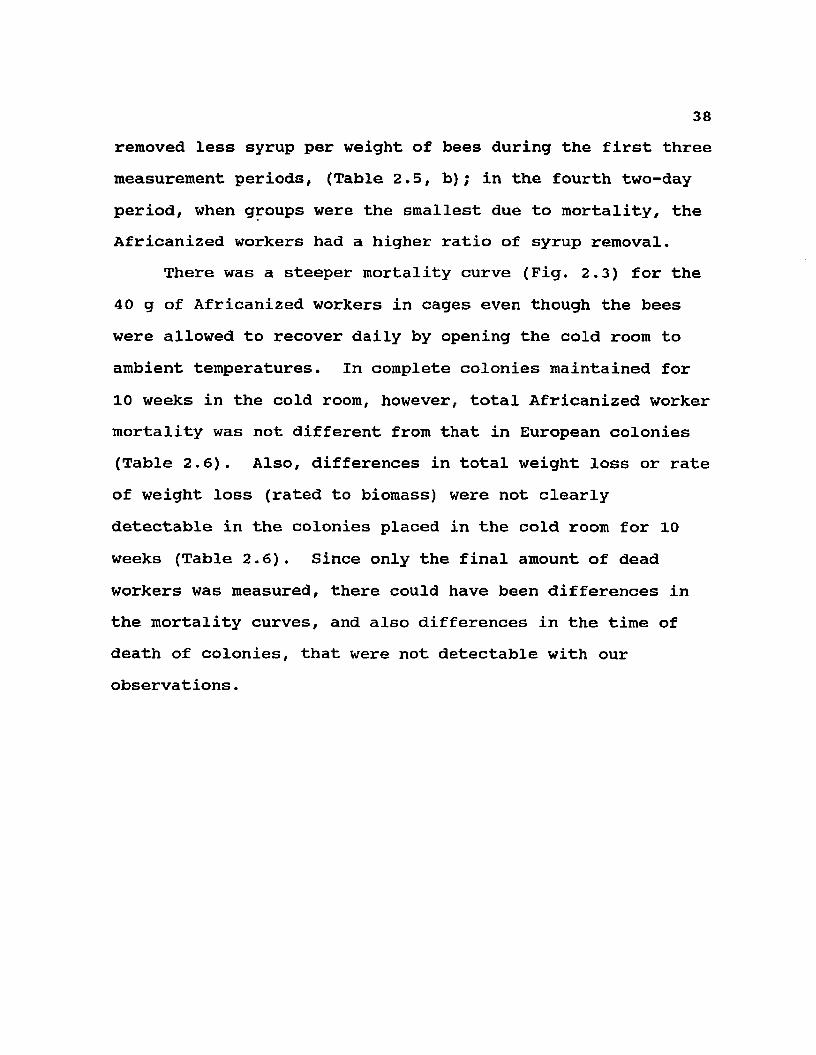
38removed less syrup per weight of bees during the first three measurement periods, (Table 2.5, b); in the fourth two-day period, when groups were the smallest due to mortality, the Africanized workers had a higher ratio of syrup removal.
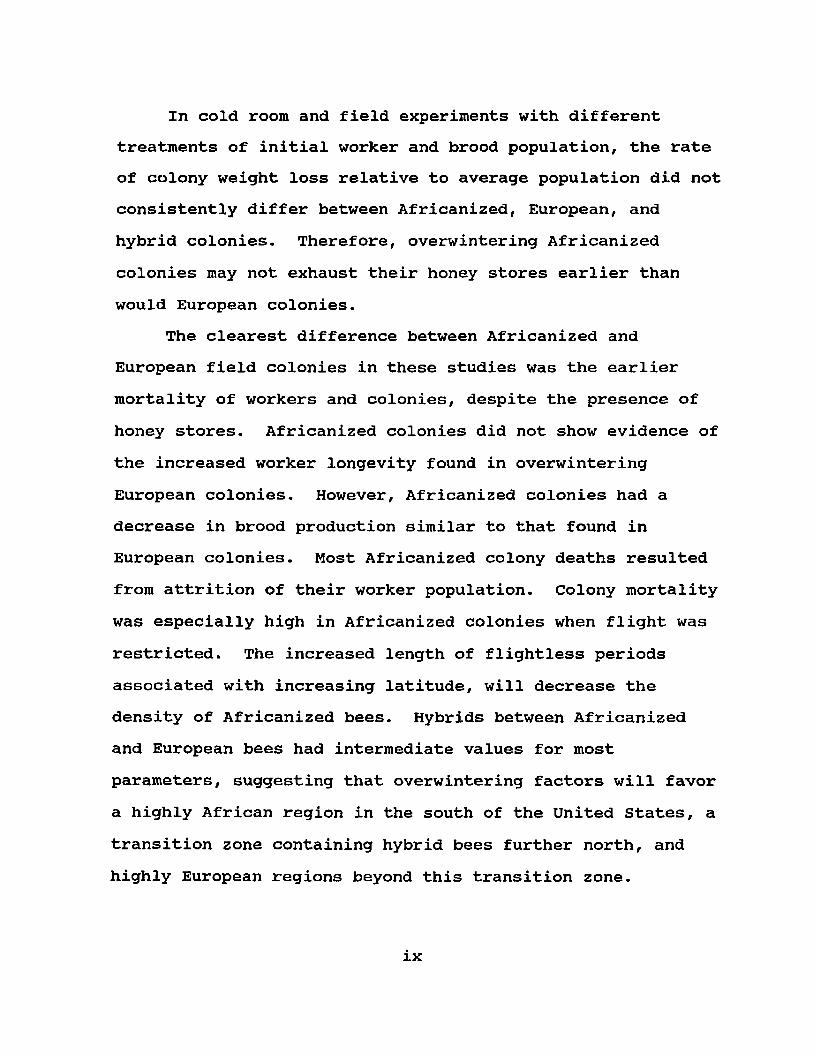
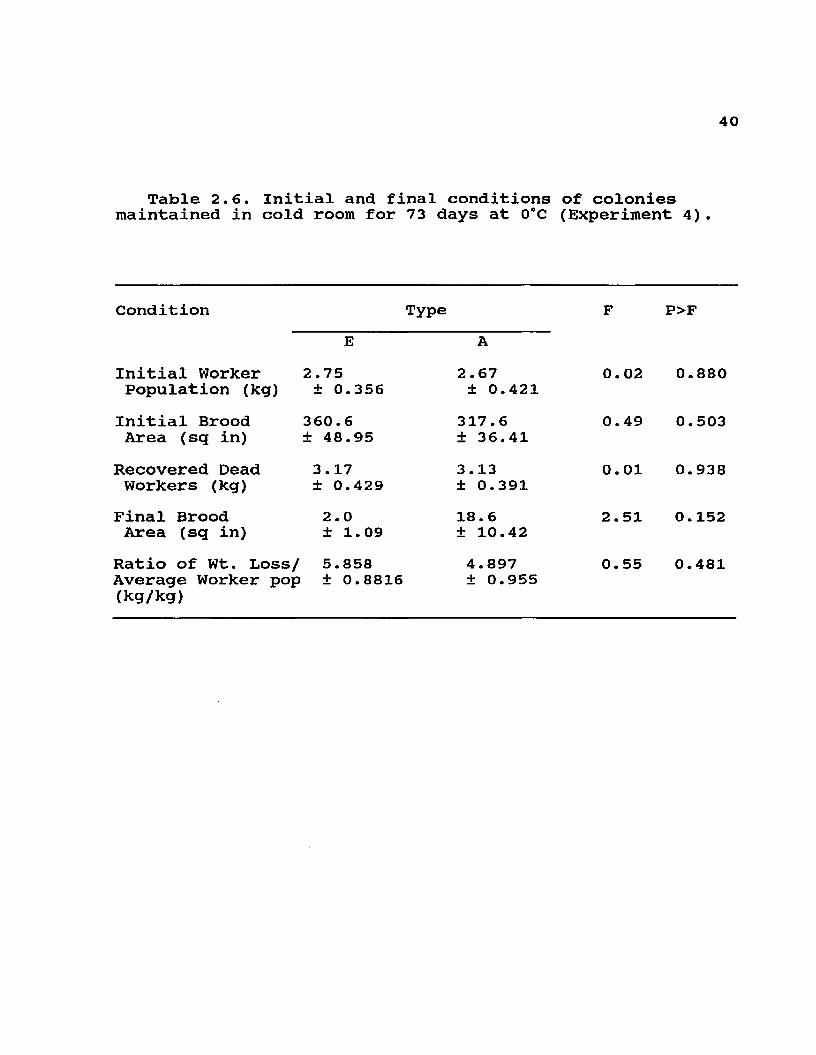
There was a steeper mortality curve (Fig. 2.3) for the 40 g of Africanized workers in cages even though the bees were allowed to recover daily by opening the cold room to ambient temperatures. In complete colonies maintained for 10 weeks in the cold room, however, total Africanized worker mortality was not different from that in European colonies (Table 2.6). Also, differences in total weight loss or rate of weight loss (rated to biomass) were not clearly detectable in the colonies placed in the cold room for 10 weeks (Table 2.6). Since only the final amount of dead workers was measured, there could have been differences in the mortality curves, and also differences in the time of death of colonies, that were not detectable with our observations.
39
Table 2.5. Sugar syrup removed (g) by groups of bees of two genotypes at cold temperatures, a) Syrup removed every two days by groups started with 40 g of bees and maintained at 15°C (Experiment 1) . b) Rate of syrup removal per weight of live bees for each two day period (Experiment 1). c)Syrup removed in a period of 5 days by 1.0 kg groups of bees maintained around 12*C (Experiment 2).
Experiment Type F-value P>FE
a)Period 1 46.5 ± 0.86Period 2 36.5 ± 1.38Period 3 21.7 ± 1.32
33.1 ± 1.29 Type 228 <0.000113.6 ± 0.62 Time 791 <0.00014.7 ± 0.26 Ty*Ti 50 <0.0001
Period 4 8.1 + 0.54 3.2 ± 0.32
b)Period 1 1.31 + 0.026 0.92 ± 0. 036 Type 20Period 2 1.08 + 0.028 0.46 ± 0. 020 Time 23Period 3 0.71 + 0.029 0.26 ± 0. 010 Ty*Ti 8Period 4 0.32 + 0.017 0.55 + 0.258
c) 408 ± 67.4 87 + 19.3 21. 0
4 0
Table 2.6. Initial and final conditions of colonies maintained in cold room for 73 days at 0°C (Experiment 4) .
Condition Type F P>FE A
Initial Worker 2.75 2.67 0.02 0.880Population (kg) ± 0.356 ± 0.421
Initial Brood 360.6 317.6 0.49 0.503Area (sq in) ±48.95 ±36.41
Recovered Dead 3.17 3.13 0.01 0.938Workers (kg) ± 0.429 ± 0.391
Final Brood 2.0 18.6 2.51 0.152Area (sq in) ± 1 .09 ±10.42
Ratio of Wt. Loss/ 5.858 Average Worker pop ± 0.8816 (kg/kg)
4.897 ± 0.955
0.55 0.481
AFRICANIZEDWEIGHT (GR)40
35
30
25
2015
10
O 1 2 3 4 6 6 8 97 10 11 12DAYS
EUROPEANWEIGHT (GR)
40
35
30
25
2015
10
0 21 3 4 6 6 7 8 9 10 11 12DAYS
Fig. 2.3 - Estimated biomass of surviving workers (mean SE) maintained in hoarding cages at 15°C for 12 days (Experiment 4).
42Discussion
This series of experiments provides evidence of differences between Africanized and European honey bees that could help explain some of the reported ecological distributions of the two genotypes. At the same time, they indicate that some of the earlier interpretations of winter mortality of Africanized colonies were not correct, and that some of the behavioral mechanisms associated with survival at cold temperatures are present in Africanized bees and could be improved both by hybridization with European bees and by natural selection.
The aggregation at low temperatures by small groups of Africanized workers was remarkably different from that observed in European groups. Africanized workers tended to cluster in tighter groups, and in positions where few or no workers had contact with the feeders. A similar phenomenon had been observed earlier at 25°C in groups of 100 workers (Villa et al. 1987). Differences in clustering were not detectable using the dimensions taken in the combless 1.0 kg groups. It could either be that these particular measurements were inappropriate to detect differences in total volume or in shape, or that in groups of these sizes the clustering differences of smaller groups disappear. The fact that the shapes of temperature isolines appeared to be similar in the 1.5 kg groups with comb at low temperatures
43suggest that differences in aggregation of small groups may not be evident in larger groups.
These differences in clustering behavior could have arisen through selection under very different temporal distributions of temperature. In the highlands of Africa and in subtropical South Africa, daily ranges in temperature are greater than seasonal ranges in mean temperature. A short-term strategy of tight clustering to decrease heat loss during cool periods in the night, or during short cold spells, using only crop-stored carbohydrates could be advantageous for African bees under such conditions. A longer-term strategy of much more symmetrical clustering, with improved food transmission across workers from stores in areas of the hive with comb could have been selected for in European bees exposed to longer winters.
It is yet unclear whether these reductionist observations on unnaturally small groups have any implications for the long-term survival of Africanized colonies. It could be that imperfect behavioral interactions among workers in larger colonies could lead to overwintering problems. There were also clear differences in food utilization in the combless groups of workers, whether small or large. The lower food consumption of all Africanized groups compared to European controls in similar situations suggest that the tighter conformation of workers might impair food exchange, even in the groups where
44clustering differences were not detectable with our measurements.
The significantly lower food utilization in these combless groups of Africanized bees contrasts remarkably with the higher 'minimum maintained oxygen consumption' measured by Southwick et al. (1990) in Africanized bees at 2°C in groups ranging from 50 to 8000 individuals. Even though direct measurements of oxygen consumption can be more precise in detecting an instantaneous metabolic rate, measurements of store consumption can provide a much more realistic assesment of the energetic costs of thermoregulation over longer periods of time. Significantly different rankings in the rate of store consumption in Africanized, hybrid and European bees (chapters 3 and 4) under different experimental conditions indicate that differences among European and Africanized bees in this character will be specified by local environmental conditions each winter, and will not be a significant factor determining higher overwintering mortality of Africanized colonies.
Other factors in which Africanized and European bees differed significantly in these tests will likely be more important in determining overwintering mortality. The potentially tighter clustering of Africanized workers could be maladaptive if it persists through long periods of confinement. It could lead to impaired food transmission
and the separation of the cluster from honey stores. If this factor is compounded by shorter lifespans of workers which occurs during active months (Winston & Katz 1981), a significant proportion of highly African colonies could die in areas having longer winters.
The increased mortality of highly African colonies during winter will likely exert selective pressures to produce a more hybrid population. The improved overwintering capabilities of this hybrid population as well as other more 'temperate* life history characteristics will likely produce a broad hybrid zone in the United States, similar to one already found in Argentina (Sheppard et al. 1991). The absolute limit of any African-derived characters in the honey bee population of the United States is difficult to predict at this point. Future more refined experiments addressing some of these differences will help in characterizing the attributes of the incoming Africanized population and will produce more precise models of its overwintering ranges.

Chapter 3.
"Overwintering" of Africanized, European, and Hybrid Honey Bees in the Andes of Venezuela
46
47Introduction
The natural range expansion of Africanized honey bees (Apis mellifera L.) has recently continued into Texas. Although their threat to the general public is minor, their potential to disrupt beekeeping (McDowell 1984) and pollination services (Danka et al. 1987) is major. The extent to which Africanized genes will affect the feral and managed honey-bee population of the United States will largely depend upon the overwintering ability of colonies showing varied levels of Africanization. Hence, clarifying their overwintering ability is useful for predicting their possible negative effects in the U.S.
Due to regulatory concerns, overwintering studies with Africanized bees have only been possible in a few temperate countries. Experiments in Poland (Woyke 1974) and in Germany (Villa et al. 1990) demonstrated high mortality for Africanized colonies exposed to winter conditions; Africanized x European hybrids showed improved overwintering capability. In contrast to the results from Europe, experiments in Argentina have led to predictions that Africanized honey bees could potentially overwinter in most of the United States (Dietz et al. 1986).
In addition to trials in temperate countries under winter conditions, high altitudes in tropical countries have provided sites to test the performance of Africanized colonies at low temperatures. Several studies have examined
48survivorship of Africanized bees along altitudinal transects (500 to 2800 m above sea level) in Colombia and Costa Rica (Villa 1987, Spivak 1989, Gentry 1991). Contrary to expectations, Africanized colonies outperformed European colonies at these elevations by effectively balancing resource collection with brood production. These earlier studies are not good predictors of colony survivorship through temperate winters: gradients along tropical mountains do not closely simulate latitudinal gradients due to the reduced yearly variation in temperature at any site close to the equator. Rather, each elevational band on tropical mountains presents a uniform thermal environment, which is approximately equivalent to a specific time of year in a temperate location, and does not resemble an annual seasonal cycle associated with a specific temperate latitude.
Above 4000 m in the tropics, low temperatures cause reduced plant density and productivity, generating a year- round condition analogous to temperate winter (Mani 1968). Homeothermic insects are absent at these highest elevations because they probably cannot attain positive energy budgets. Honey-bee colonies with homeothermic characteristics similar to those of birds and mammals (Southwick 1983), will experience a year-round negative energy budget under these conditions.
49A total of 120 colonies of Africanized, European and
hybrid bees were exposed to these simulated winter conditions (4100 m above sea level). Initial amounts of adult bees, presence or absence of brood, and screening to prevent flight were experimentally varied. Environmental conditions also impacted flight activity, in one year temperatures seldom reached flight thresholds, in the second year maximum temperatures permitted flight of all colonies except those that were experimentally confined. The effects of these preplanned and unplanned conditions upon the performance ratings were evaluated. These evaluations provide useful indications on the winter survival of feral and managed honey bee colonies in the United States.
Materials and MethodsTwo separate experiments were conducted in 1986 and
1987 at Pico Aguila, Merida, Venezuela, 4100 m above sea level (8° 51' N, 70° 50' W). Colonies of each of three types of bees (Africanized, European, and European X Africanized) were selected from research apiaries in the lowlands (Acarigua, Portuguesa) at the begining of each rainy season (May); abbreviated as E, A, and E X A, respectively. E colonies were headed by mated commercial queens introduced from the U. S., A colonies by mated queens captured from feral lowland swarms, and E X A by European virgins mated in areas having high densities of feral
50Africanized bees. All colonies had worker populations that were the progeny of the resident queen and all queens were less than 1 year old.Experiment 1 : Field colonies in 1986
Fifteen A and fifteen E colonies were formed using only adult bees in initial amounts of 0.5, 1.0, 1.25, 1.50, 1.75, 2.00, 2.25 and 2.50 kg. Weighed groups of adult workers were shaken into screened cages for transportation to the mountains. These bees were then reintroduced at the highland site into preweighed Langstroth hives with 2-3 empty combs produced on European-sized foundation and 7-8 combs of the same dimensions provisioned with honey and pollen. Colonies were checked for cluster size and general condition on nine occassions between their installation on 15 May and the final inspection on 27 October.Precipitation during this period was above average. This generated daily fog, maintained temperatures during all observation periods below 7°C, and produced enough snow to cause the collapse of the roof in a nearby storage facility that had been unaffected for many years. At the end of the experiment, surviving colonies were returned to the lowlands for final measurements.Experiment 2 : Field colonies in 1987
Thirty colonies of each group (A, E, and E X A) were divided among the following 4 treatments (see Table 3.1 for comparison with Experiment 1) :
51Colonies closed, 2.0 kg workers, no brood added, n=5;
b. Colonies open, 2.0 kg workers, no brood added, n=10;c. Colonies open, 1.5 kg workers, initial brood added, n=10;d. Colonies open, 1.5 kg workers, initial brood added, brood measured, n=5.
The broodless colonies in treatments a and b were prepared with 2.0 kg of adult bees and transported on 6 May. Colonies in treatment a differed from those in treatment b in that they were screened; workers could not fly and void feces, nor could they forage during the short periods when temperatures exceeded flight thresholds. All free-flying colonies (treatments b, c and d) were fitted with a simple mesh pollen trap to reduce the amount of incoming pollen.
The colonies having brood, treatments c and d, were formed by adding 1.5 kg of workers to 4-5 weighed and measured brood combs from the same colony introduced into preweighed hives with 5-6 combs of honey and pollen. They were transported to the highlands on 13 and 19 May, respectively. The colonies in treatment c differed from the colonies in treatment d in that measurements of brood area were taken in the d group every two weeks for the first ten weeks.
Using marked E and A queens and European daughter queens reared and mated in highly Africanized areas assures that colonies represented European, Africanized and European X Africanized populations. To verify these identities and
52assay the possible drifting of foragers across groups of the same type, workers were sampled on 8 June. Measurements of forewing length on 10 bees out of each colony (Rinderer et al. 1987), were followed by 25 computer-assisted morphometric measurements (Daly & Balling 1978, Daly et al. 1982) on all A x E colonies and on several A and E colonies that had intermediate forewing lengths.
Observations of colony conditions were made every week for the first 4 weeks, biweekly until the 10th week, and, later in the experiment, at longer intervals until the end of the experiment on 24 March 1988.
The weather during the 1987 season differed greatly from that of the previous year. The rainy season was greatly delayed and cloud cover and fog were minimal, allowing day temperatures to rise well above flight thresholds (up to 15°C) .Colony Survival and Colony Size
At each inspection, surviving colonies were opened rapidly and the maximum cluster diameter was estimated as the number of combs having clustered bees. Cluster diameters were compared by analysis of variance as repeated measures using type as a subplot, with a cluster diameter of 0 assigned to dead colonies. Remaining bees were weighed when a colony's population dropped below 200 g of workers, when the colony died, or at the end of each experiment.Total weights of the remaining population and weights of
53subsamples of 100 bees were used bo estimate the final number of workers in colonies.Worker Mortality and Physiological State
Dead workers were recovered from the bottom of the closed and broodless colonies in Experiment 2, treatment a, during each inspection. The total numbers of dead workers at each interval were compared using analysis of variance of repeated measures. On week 5, a sample of live workers from these colonies was transported on ice and frozen within 6 hours of removal. The frozen heads of each of 3 bees from each colony were oven-dried, weighed and analysed for nitrogen content using a Microkjeldahl procedure with spectrophotometric determination of Nessler's reagent.Total nitrogen and percentage of nitrogen were compared between groups by ANOVA.Brood Production
Brood areas were measured only in colonies of Experiment 2, treatment d, because of the possible adverse effects of exposing brood to cold weather. To minimize the effects of cold during brood measurements, the colony and brood were placed in a wooden box with infrared lights over the brood chamber. Due to high queen losses in the hybrid colonies (probably exacerbated by these manipulations) only the brood areas of the A and E groups were compared.
54Food Consumption
Weight loss was calculated for each colony. The weight, loss per kg of bees per week was calculated by dividing the total weight loss of the hive by the average weight of the worker population (average between initial and final bee weights), and again by the survival time of the colony. Rates of weight loss were compared by ANOVA.
ResultsColony Identities
Colony identities determined by morphometric measurements for Experiment 2 matched our initial identity assignments. Forewing measurements on samples of the 30 European and 30 Africanized colonies unambiguously identified 28 and 21 colonies, respectively. The use of 25 characters correctly identified all of the remaining A and E colonies. The 3 0 E X A colonies had an average discriminant score (D) of 1.245, intermediate between the average D for the European population (-1.306) and D for the Africanized population (3.839) given by Daly & Balling (1978), with individual colony scores ranging from -0.445 to 2.638.Colony Survival and Colony Size
Survivorship of colonies of the different genetic origins during the first four months (the duration of a winter season) varied considerably between the two years (Exp. 1 vs. Exp. 2) and initial treatments (Table 3.1,
Fig. 3.1). High mortalities of Africanized colonies wereseen during Experiment 1 and in Experiment 2, treatment a,where colonies began as broodless colonies and wereprevented from flying. In Experiment 1, 13 of 14 A colonieshad died by week 18, while 10 E colonies had survived tothat date. In Experiment 2, treatment a, all 5 A colonieswere dead on week 10, while all 5 E and 5 E X A had survivedto week 13 when they were depopulated for measurments offinal size. The differences between E and A colony survivalwere less marked in the free-flying, initially broodrightcolonies of treatments c and d, and nonexistent in theinitially broodless colonies of treatment b.
»The death of colonies in the initial period was caused
by a rapid decline of worker population. Estimates of colony population (maximum cluster diameter) throughout the course of the two experiments show curves that parallel colony mortalities (Fig. 3.2). In Experiment 1, Africanized colonies consistently had smaller clusters (F = 17.95, df 1, P = 0.0002). In Experiment 2, colonies in the broodright treatment c also had significant differences between types (E = E X A > A) (F = 6.14, df = 2, P = 0.0063), and also a significant effect of time (F = 124.86, df = 16, P <0.0001). In the other free-flying colonies of Experiment 2, (treatments b and d) there were no differences between types in cluster diameter (F = 0.11, df = 2, P = 0.89; F = 2.60, df = 2, P = 0.11, respectively). Just as for total colony
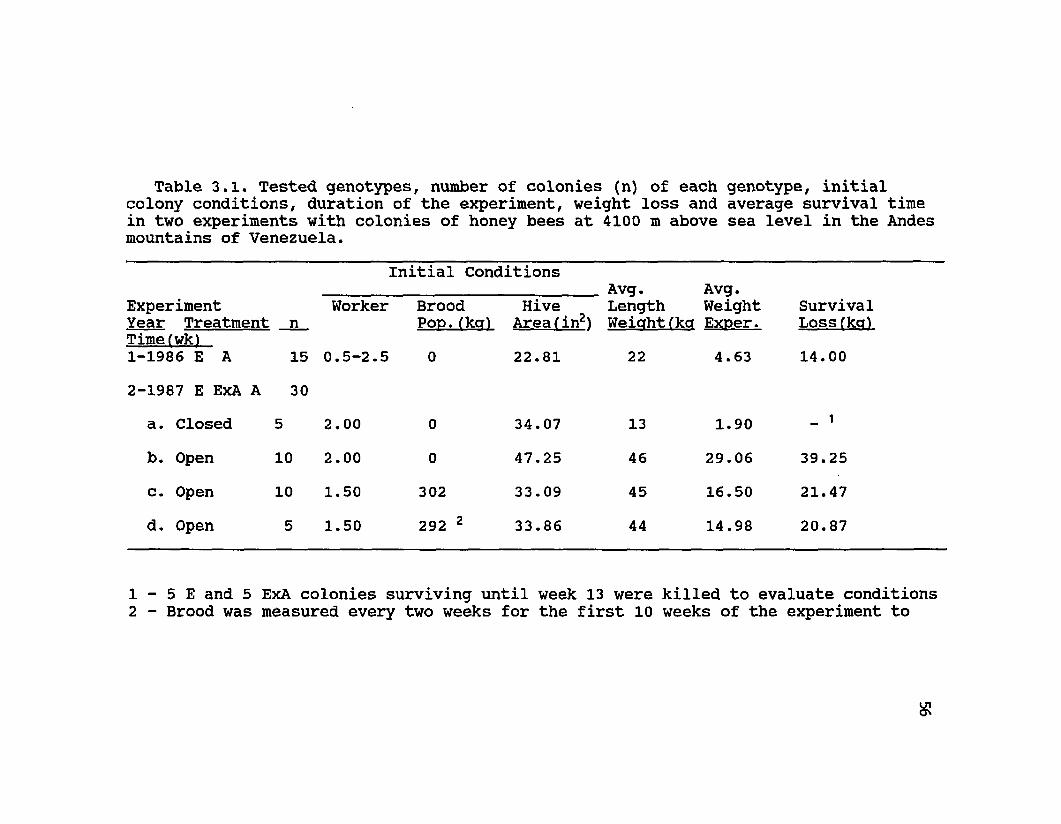
Table 3.1. Tested genotypes, number of colonies (n) of each genotype, initial colony conditions, duration of the experiment, weight loss and average survival time in two experiments with colonies of honey bees at 4100 m above sea level in the Andes mountains of Venezuela.
Initial ConditionsAvg. Avg.
Experiment Year Treatment Timefwk)1-1986 E A
n15
Worker
0.5-2.5
Brood Pop.(kq)0
Hive Area fin2)22.81
Length Weight Weiahtfkcr Exner.
22 4.63
SurvrLossf]14.00
2-1987 E ExA A 30a. Closed 5 2.00 0 34.07 13 1.90 _ i
b. Open 10 2.00 0 47.25 46 29.06 39.25c. Open 10 1.50 302 33.09 45 16.50 21.47d. Open 5 1.50 292 2 33.86 44 14.98 20.87
1 - 5 E and 5 ExA colonies surviving until week 13 were killed to evaluate conditions2 - Brood was measured every two weeks for the first 10 weeks of the experiment to
57
Table 3.2. Final worker population of the different genotypes in the experiments (means ± standard error), and analysis of variance on the effect of genotype. The final worker population was estimated from total weights of workers (based upon weights of subsamples of 100 bees). The final worker population represents either the dead workers found in a colony that had recently died, or the surviving workers at the end of the experiment. See Table 1 for differences in initial colony conditions and duration among the two experiments and treatments. Means within each treatment followed by different letters are significantlydifferent by Duncan1s multiple range test.
Experiment/ TYPETreatment A EXA E F P>FExperiment 1 (n=14,15)
2550±714
2230±250
0.19 0. 668
Experiment 2 All (n=30)
4010a±1209
5650a±1570
12160b±2320
4.23 0.018
Tmnt. a (n=5)
580a±283
3880b±401
8900C±1015
41.34 0.0001
Tmnt. b (n=10)
7270±3295
8030±3529
19670±5013
2.99 0.067
Tmnt. c (n=10)
3410±1069
6040±3070
12160±3478
2.67 0. 088
Tmnt. d (n=5)
2140±521
1860±1411
400±247
1.13 0.356
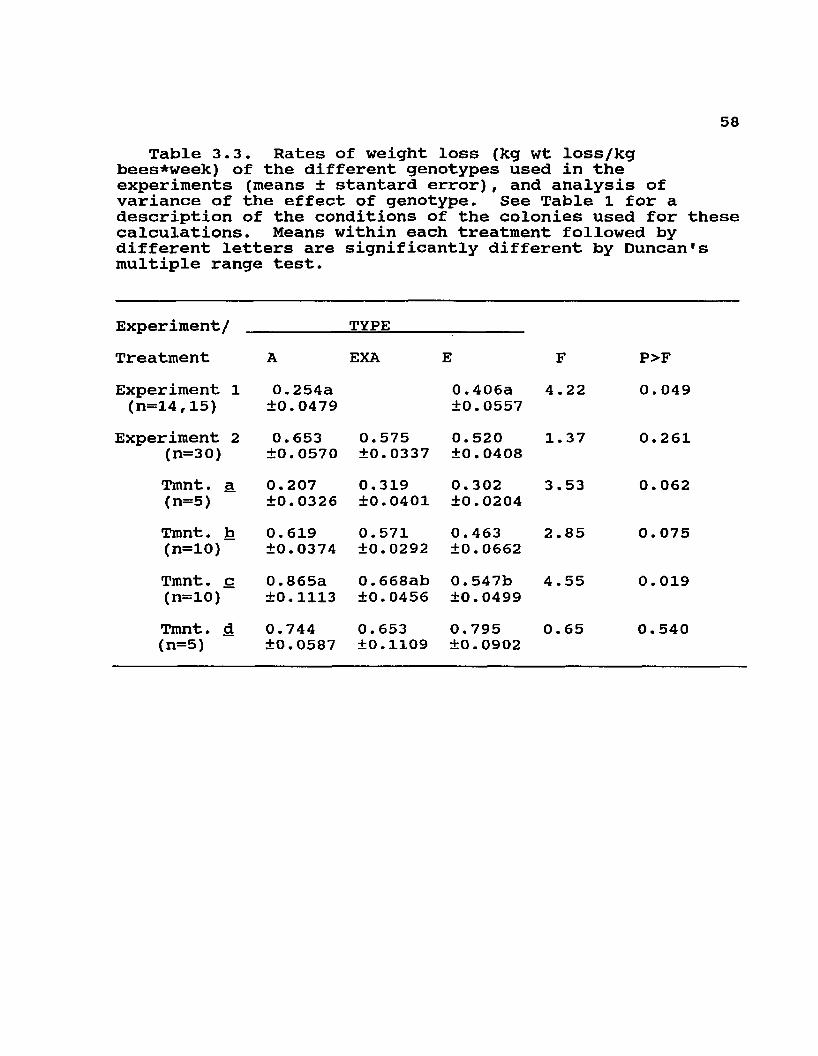
58Table 3.3. Rates of weight loss (kg wt loss/kg
bees*week) of the different genotypes used in the experiments (means ± stantard error), and analysis of variance of the effect of genotype. See Table 1 for a description of the conditions of the colonies used for these calculations. Means within each treatment followed by different letters are significantly different by Duncan's multiple range test.
Experiment/Treatment
TYPEEXA
riment 1 0.254a 0.406a14,15) ±0.0479 ±0.0557riment 2 0.653 0.575 0.520(n=30) ±0.0570 ±0.0337 ±0.0408Tmnt. a 0.207 0. 319 0.302(n=5) ±0.0326 ±0.0401 ±0.0204Tmnt. b 0. 619 0.571 0.463(n=10) ±0.0374 ±0.0292 ±0.0662Tmnt. c 0.865a 0.668ab 0.547b(n=10) ±0.1113 ±0.0456 ±0.0499Tmnt. d 0.744 0. 653 0.795(n=5) ±0.0587 ±0.1109 ±0.0902
F4.22
1.37
3.53
2 .85
4.55
0. 65
P>F0.049
0.261
0.062
0. 075
0.019
0.540
EXPERIMENT 1(1986)
EXPERIMENT 2 - Treatments c + d(1987 / Open / Brood)
CoL0 N1ES0 2 4 6 8 10 12 14 16 18
WEEKS
EXPERIMENT 2 - Treatment a (1987 / Closed / No Brood)
coL0 N1ES0 2 4 6 8 10 12 14 16 18
WEEKS
COL0 N1ES0 2 4 6 8 10 12 14 16 18
WEEKS
EXPERIMENT 2 - Treatment b (1987 / Open / No Brood)
CoL0 N1ES
109876643210
EXA
0 2 4 6 8 10 12 14 16 18WEEKS
Fig. 3.1 - Number of colonies of each type in each treatment surviving during the first 18 weeks of two experiments in 1986 and 1987 at 4100 m above sea level.
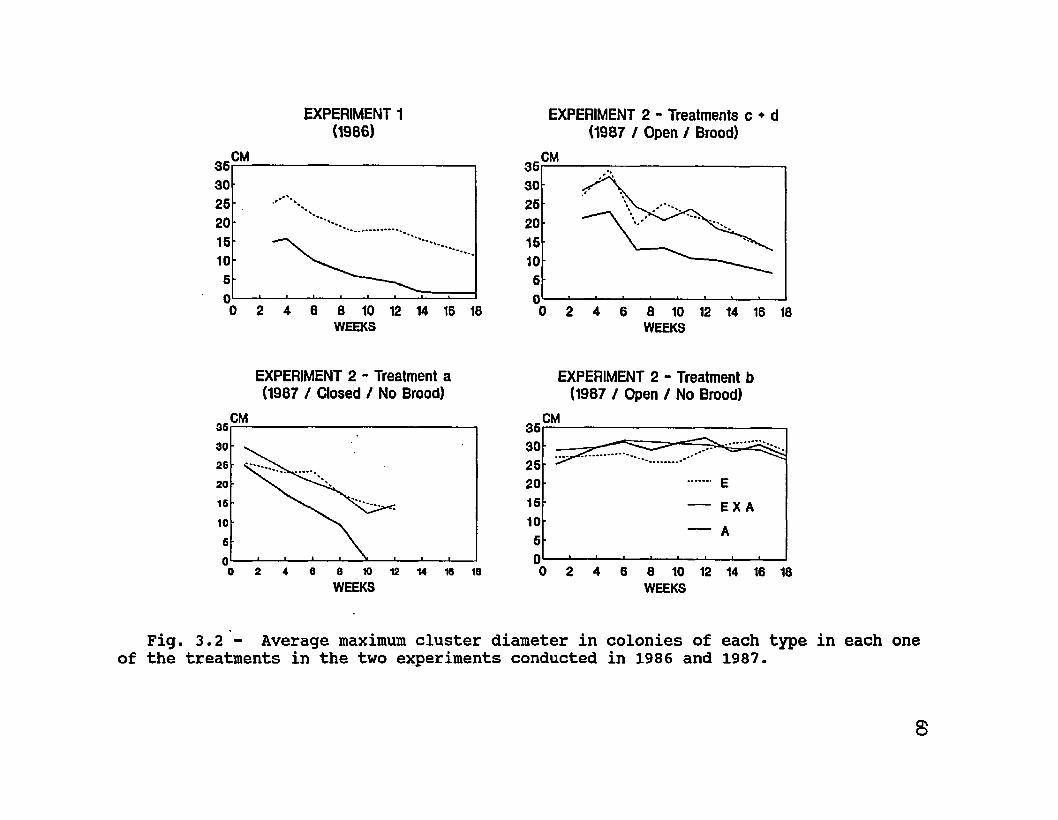
EXPERIMENT 1(1986)
CM3630
0 2 4 6 8 10 12 14 16 18WEEKS
EXPERIMENT 2 - Treatments c ♦ d(1987 / Open / Brood)
CM3530
20
0 2 4 6 8 10 12 14 16 18WEEKS
EXPERIMENT 2 - Treatment a (1987 / Closed / No Brood)
363026201610
60 2 4 6 8 10 12 14 18 180
WEEKS
EXPERIMENT 2 - Treatment b (1987 / Open / No Brood)
CM3530
20EXA
0 2 4 6 8 10 12 14 16 18WEEKS
Fig. 3.2 - Average maximum cluster diameter in colonies of each type in each one of the treatments in the two experiments conducted in 1986 and 1987.
s
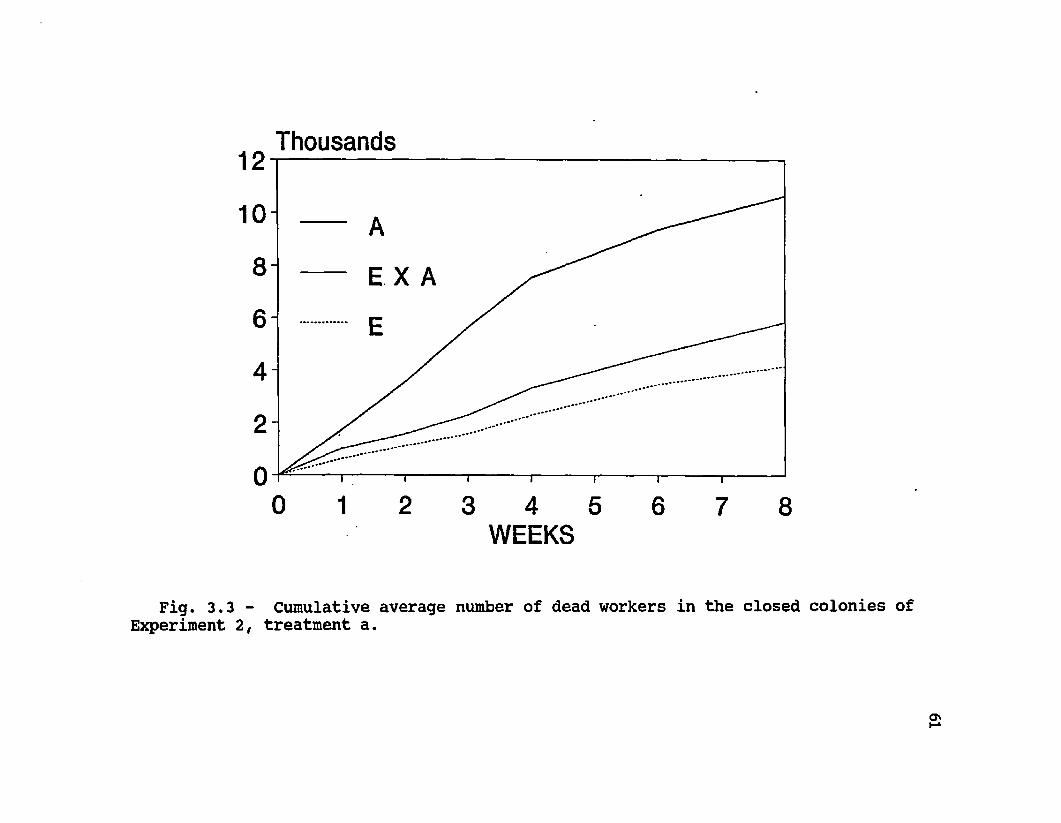
12
10
8 6 4 2 0
0 1 2 3 4 5 6 7 8WEEKS
Fig. 3,3 - Cumulative average number of dead workers in the closed colonies of Experiment 2, treatment a.
Thousands
E X A
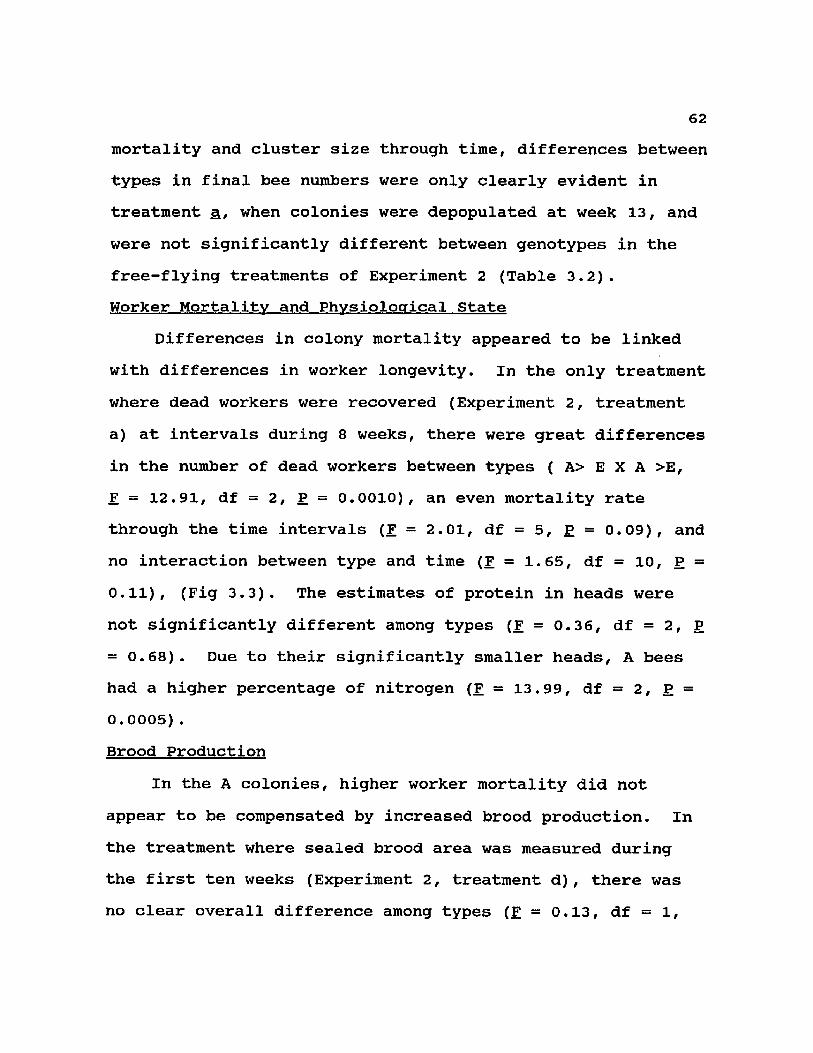
62mortality and cluster size through time, differences between types in final bee numbers were only clearly evident in treatment a, when colonies were depopulated at week 13, and were not significantly different between genotypes in the free-flying treatments of Experiment 2 (Table 3.2).Worker Mortality and Physiological State
Differences in colony mortality appeared to be linked with differences in worker longevity. In the only treatment where dead workers were recovered (Experiment 2, treatment a) at intervals during 8 weeks, there were great differences in the number of dead workers between types ( A> E X A >E,F = 12.91, df = 2, P = 0.0010), an even mortality rate through the time intervals (F = 2.01, df = 5, P = 0.09), and no interaction between type and time (F = 1.65, df = 10, P = 0.11), (Fig 3.3). The estimates of protein in heads were not significantly different among types (F = 0.36, df = 2, P = 0.68). Due to their significantly smaller heads, A bees had a higher percentage of nitrogen (F = 13.99, df = 2, P = 0.0005).Brood Production
In the A colonies, higher worker mortality did not appear to be compensated by increased brood production. In the treatment where sealed brood area was measured during the first ten weeks (Experiment 2, treatment d), there was no clear overall difference among types (F = 0.13, df = 1,
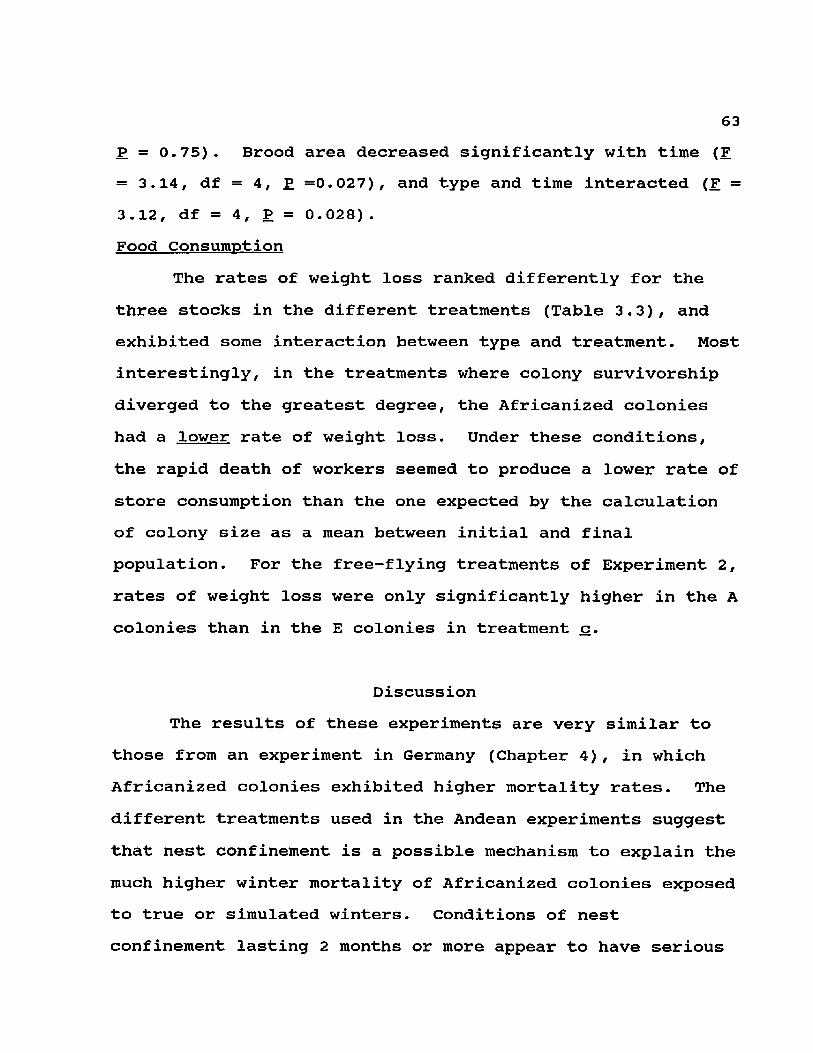
63P = 0.75). Brood area decreased significantly with time (F = 3.14, df = 4, P =0.027), and type and time interacted (F = 3.12, df = 4, P = 0.028).Food Consumption
The rates of weight loss ranked differently for the three stocks in the different treatments (Table 3.3), and exhibited some interaction between type and treatment. Most interestingly, in the treatments where colony survivorship diverged to the greatest degree, the Africanized colonies had a lower rate of weight loss. Under these conditions, the rapid death of workers seemed to produce a lower rate of store consumption than the one expected by the calculation of colony size as a mean between initial and final population. For the free-flying treatments of Experiment 2, rates of weight loss were only significantly higher in the A colonies than in the E colonies in treatment c.
DiscussionThe results of these experiments are very similar to
those from an experiment in Germany (Chapter 4), in which Africanized colonies exhibited higher mortality rates. The different treatments used in the Andean experiments suggest that nest confinement is a possible mechanism to explain the much higher winter mortality of Africanized colonies exposed to true or simulated winters. Conditions of nest confinement lasting 2 months or more appear to have serious
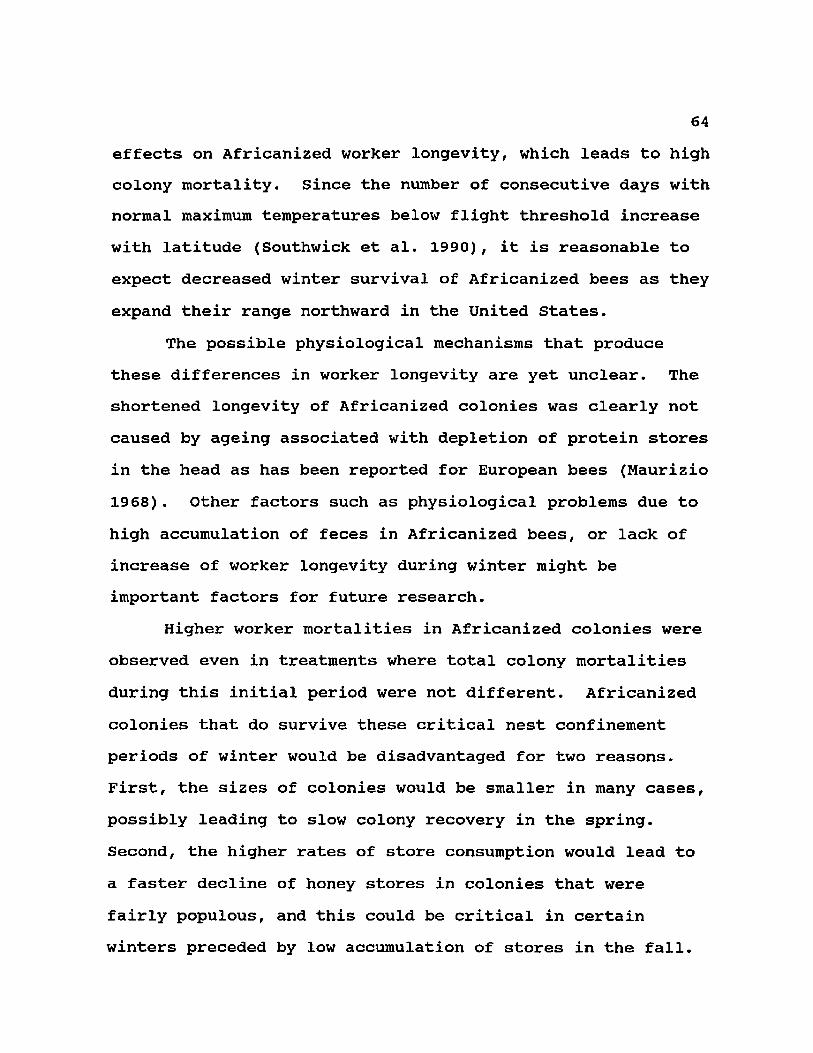
64effects on Africanized worker longevity, which leads to high colony mortality. Since the number of consecutive days with normal maximum temperatures below flight threshold increase with latitude (Southwick et al. 1990), it is reasonable to expect decreased winter survival of Africanized bees as they expand their range northward in the United States.
The possible physiological mechanisms that produce these differences in worker longevity are yet unclear. The shortened longevity of Africanized colonies was clearly not caused by ageing associated with depletion of protein stores in the head as has been reported for European bees (Maurizio 1968). Other factors such as physiological problems due to high accumulation of feces in Africanized bees, or lack of increase of worker longevity during winter might be important factors for future research.
Higher worker mortalities in Africanized colonies were observed even in treatments where total colony mortalities during this initial period were not different. Africanized colonies that do survive these critical nest confinement periods of winter would be disadvantaged for two reasons. First, the sizes of colonies would be smaller in many cases, possibly leading to slow colony recovery in the spring. Second, the higher rates of store consumption would lead to a faster decline of honey stores in colonies that were fairly populous, and this could be critical in certain winters preceded by low accumulation of stores in the fall.
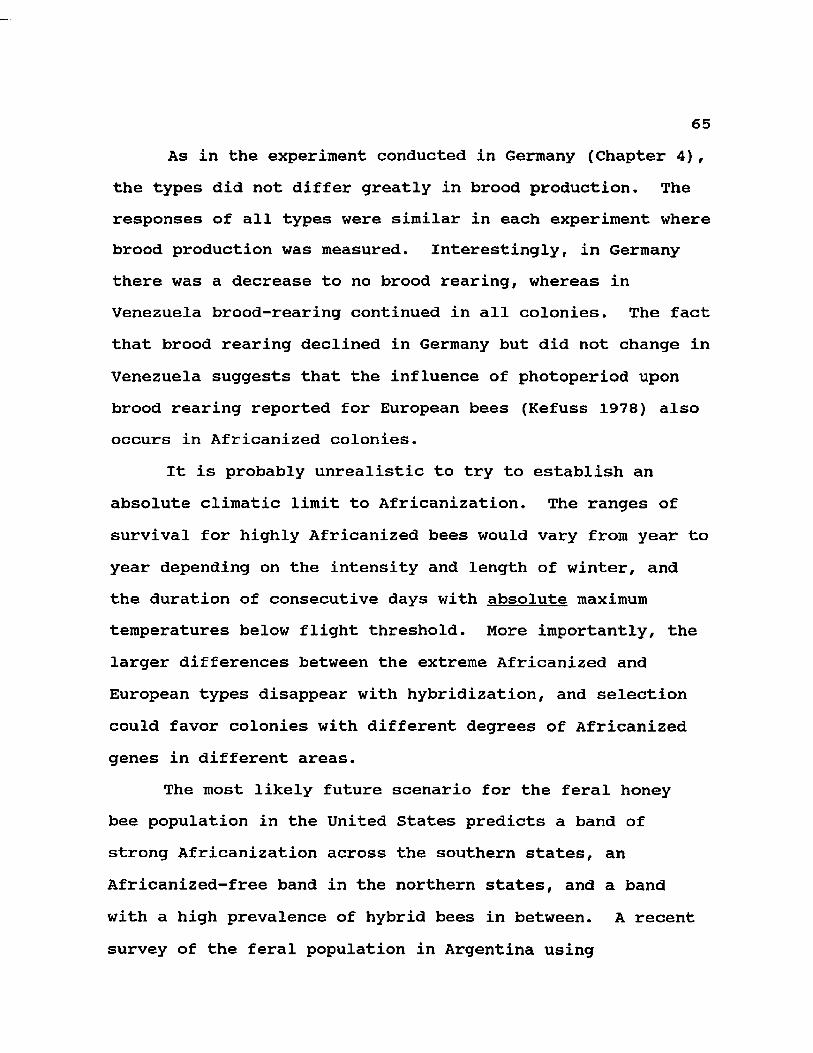
65As in the experiment conducted in Germany (Chapter 4),
the types did not differ greatly in brood production. The responses of all types were similar in each experiment where brood production was measured. Interestingly, in Germany there was a decrease to no brood rearing, whereas in Venezuela brood-rearing continued in all colonies. The fact that brood rearing declined in Germany but did not change in Venezuela suggests that the influence of photoperiod upon brood rearing reported for European bees (Kefuss 1978) also occurs in Africanized colonies.
It is probably unrealistic to try to establish an absolute climatic limit to Africanization. The ranges of survival for highly Africanized bees would vary from year to year depending on the intensity and length of winter, and the duration of consecutive days with absolute maximum temperatures below flight threshold. More importantly, the larger differences between the extreme Africanized and European types disappear with hybridization, and selection could favor colonies with different degrees of Africanized genes in different areas.
The most likely future scenario for the feral honey bee population in the United States predicts a band of strong Africanization across the southern states, an Africanized-free band in the northern states, and a band with a high prevalence of hybrid bees in between. A recent survey of the feral population in Argentina using
66mitochondrial DNA and multivariate analysis of morphological characters supports this view (Sheppard et al. 1991). Feral population characteristics will exert different degrees of introgressive pressure on the honey bee population maintained by beekeepers. Although possible, it will be more difficult to continue beekeeping with European bees in the southern U.S. than in the northern U.S.
Chapter 4.
Overwintering of Africanized, European and Hybrid Honey Bees in Germany
(published in Environmental Entomology 20(1): 39-43)
67
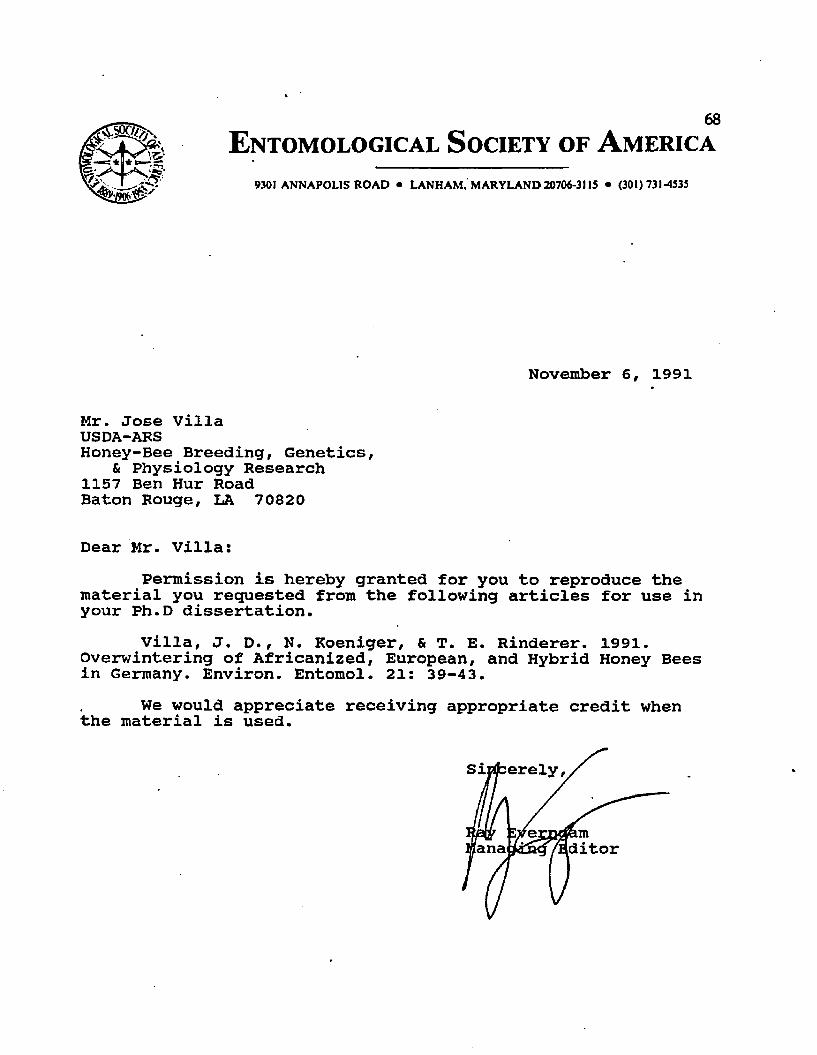
68
E n t o m o l o g ic a l S o ciety o f A m e r ic a
9301 ANNAPOLIS ROAD • LANHAM, MARYLAND 20706-3115 • (301)731-4535
November 6, 1991
Mr. Jose Villa USDA-ARSHoney-Bee Breeding, Genetics,
& Physiology Research 1157 Ben Hur Road Baton Rouge, LA 70820
Dear Mr. Villa:Permission is hereby granted for you to reproduce the
material you requested from the following articles for use in your Ph.D dissertation.
Villa, J. D., N. Koeniger, & T. E. Rinderer. 1991. Overwintering of Africanized, European, and Hybrid Honey Bees in Germany. Environ. Entomol. 21: 39-43.
We would appreciate receiving appropriate credit when the material is used.
332%
Overwintering of Africanized, European, and Hybrid Honey Bees in Germany
JOSE D. VILLA, NIKOLAUS KOENIGER,1 a n d THOMAS E. RINDERER
Honey-Bee Breeding, Genetics & Physiology Laboratory, USDA-ARS,Baton Rouge, Louisiana 70820
Environ. Entomol. 20(1): 39-43 (1961)ABSTRACT The survival of Africanized honey bees, Apis mellifera L., in temperate regions was evaluated in Germany during the 1988-1989 winter. Africanized, local European, and Africanized x European colonies were started by queen introductions on 5 August, and all surviving colonies were depopulated on 21 February. Five of nine Africanized colonies had died by the end of the experiment, whereas all eight European and all five Africanized x European colonies survived. Brood production of the three genotypes declined from 18 August until 13 November with significant differences on two of the seven measurement dates. Brood areas were not different among surviving colonies that had resumed brood production by 21 February. Changes in total colony weights through time were not different. Significant differences were found in the rates of colony weight loss (kilograms total weight/ average kilograms of adult bee$»time) and in final adult population size. The higher attrition of worker populations and the higher mortality of Africanized colonies suggest a possible reduction of their adverse effect as their range expands northward to temperate areas in the United States. The intermediate values for all characters in the Africanized x European colonies suggest that genes underlying overwintering characters are additive. This additivity will permit different levels of hybridization for different ecological zones, thus complicating predictions about absolute climatic limits.
KEY WORDS Insecta, Apis mellifera, hybrids, overwintering
The GENUS Apis provides unique opportunities for studying adaptations by closely related taxa to different ecological conditions. Comparative studies are possible within the original range of species and subspecies as well as in areas where they have been introduced. The relocation for apicultural purposes has brought both tropical (African) and temperate (European) subspecies of Apis mellifera L. to the Americas. These introductions provided an opportunity to study whether the bees’ prior adaptations to tropical and temperate environments are suitable to new habitats with similar climatic conditions. These fortuitous circumstances permit testing of four possible treatment combinations by matching two major groups of subspecies with two broad sets of environmental conditions.
The first combination, temperate subspecies in temperate environments, has resulted in the successful establishment of European bees as feral populations in North America (e.g., Seeley 1978). The second combination, tropical subspecies in tropical environments, has produced a more dramatic colonization of tropical South America by African-descended honey bees (Taylor 1977). The third combination, temperate bees in tropical areas, has yielded sparsely distributed feral popula
1 Instftut fQr Bienenkunde (Polytechnische Gescllschaft), Fach- bereich Biologic der J. W. Goethe-Univerjitat Frankfurt, K.-v.- Friich-W eg 2, D-6370 Oberursel, Federal Republic of Geirnany.
tions of European bees in tropical America, especially in lowland ecosystems (J.D.V., unpublished data). The fourth combination, tropical bees in temperate regions, has thus far been tested only in Argentina where Africanized bees arrived in the mid 1960s (Kerr et al. 1982). The distribution and density of feral Africanized honey bees in Argentina has not been clearly defined (see Kerr et al. 1982, Dietz et al. 1985).
No studies so far have clearly shown very obvious physiological limits to Africanized honey bee colony overwintering in the New World (Dietz et al. 1986,1988,1989; Krell et al. 1985; Villa et al. 1987). Results of these studies are limited by the fact that colonies were not exposed to the lower ranges of “winter" temperatures, or to the full complement of environmental factors associated with winter. Moving established colonies with stores to South American mountains or placing them in cold rooms failed to expose colonies to extreme winter temperatures, short-day photoperiod regimes, and deprivation from foraging for periods longer than 3 mo associated with extreme winters. These tests also failed to encompass the necessary preparation of colonies for winter, where storage of honey and pollen, as well as reduction of brood rearing, are essential to survival.
Another large-scale fortuitous natural experiment will soon begin to test potential climatic limits to Africanized honey bees, given that Africanized bees are starting to move into southern Texas along
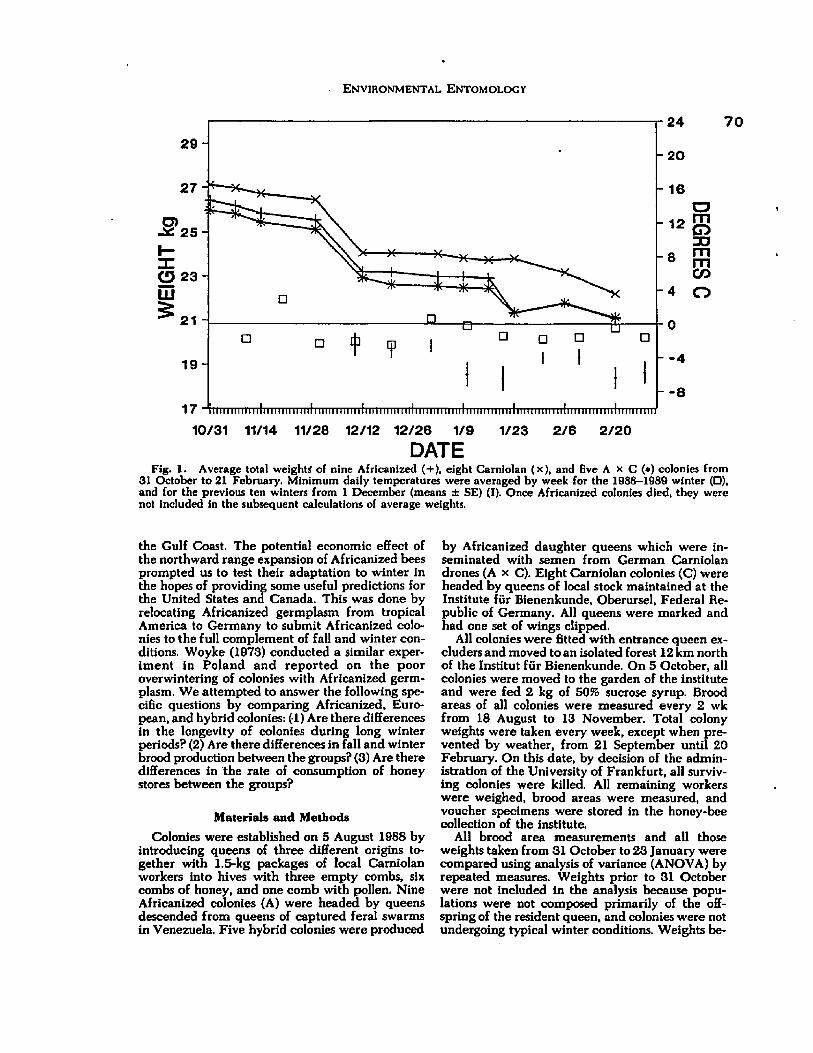
Environmental Entomology
2429- -2027- - 16
-5*25- - 12
I-XCD 23- LU
-8-4
- -4- -8
I I I I I I I I I ! I l l I I I I I I I l l l l I I I 1 1 I I I I I 11 I I I I I I I I i l l I I I I 1 1 I I I T17
7 0
OmoJOmmco
10/31 11/14 11/28 12/12 12/26 1/9 1/23 2/6 2/20DATE
Fig. 1. Average total weights of nine Africanized (+), eight Camiolan (x), and five A x C (*) colonies from 31 October to 21 February. Minimum daily temperatures were averaged by week for the 1988-1989 winter (□), and for the previous ten winters from 1 December (means ± SE) (I). Once Africanized colonies died, they were not included in the subsequent calculations of average weights.
the Gulf Coast. The potential economic effect of the northward range expansion of Africanized bees prompted us to test their adaptation to winter in the hopes of providing some useful predictions for the United States and Canada. This was done by relocating Africanized germplasm from tropical America to Germany to submit Africanized colonies to the full complement of fall and winter conditions. Woyke (1973) conducted a similar experiment in Poland and reported on the poor overwintering of colonies with Africanized germplasm. We attempted to answer the following specific questions by comparing Africanized, European, and hybrid colonies: (1) Are there differences in the longevity of colonies during long winter periods? (2) Are there differences in fall and winter brood production between the groups? (3) Are there differences in the rate of consumption of honey stores between the groups?
Materials and Methods
Colonies were established on 5 August 1988 by introducing queens of three different origins together with 1.5-kg packages of local Camiolan workers into hives with three empty combs, six combs of honey, and one comb with pollen. Nine Africanized colonies (A) were headed by queens descended from queens of captured feral swarms in Venezuela. Five hybrid colonies were produced
by Africanized daughter queens which were inseminated with semen from German Camiolan drones (A x C). Eight Camiolan colonies (C) were headed by queens of local stock maintained at the Institute fur Bienenkunde, Oberursel, Federal Republic of Germany. All queens were marked and had one set of wings clipped.
All colonies were fitted with entrance queen excluders and moved to an isolated forest 12 km north of the Institut fur Bienenkunde. On 5 October, all colonies were moved to the garden of the institute and were fed 2 kg of 50% sucrose syrup. Brood areas of all colonies were measured every 2 wk from 18 August to 13 November. Total colony weights were taken every week, except when prevented by weather, from 21 September until 20 February. On this date, by decision of the administration of the University of Frankfurt, all surviving colonies were killed. All remaining workers were weighed, brood areas were measured, and voucher specimens were stored in the honey-bee collection of the institute.
All brood area measurements and all those weights taken from 31 October to 23 January were compared using analysis of variance (ANOVA) by repeated measures. Weights prior to 31 October were not included in the analysis because populations were not composed primarily of the offspring of the resident queen, and colonies were not undergoing typical winter conditions. Weights be-
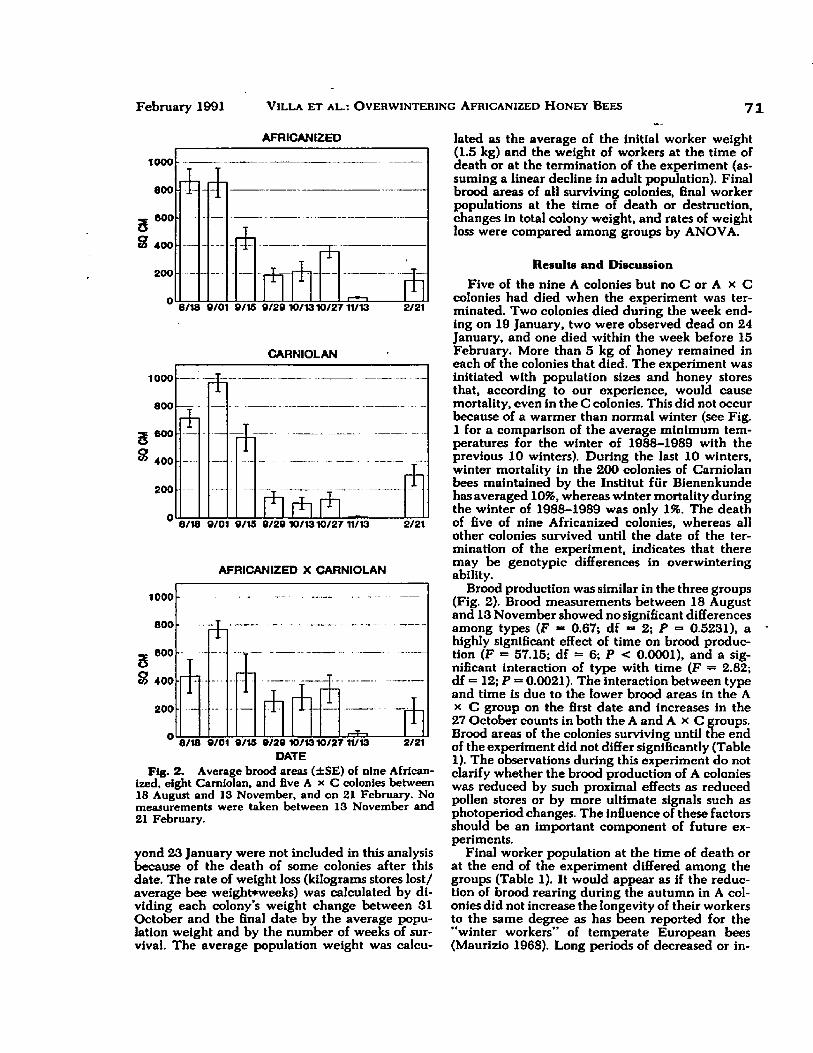
February 1991 V i l l a e t a l .: O v e r w i n t e r i n g A f r i c a n i z e d H o n e y B e e s 71
1000
8 0 0
_ 8 0 0 o8 4 0 0
200
° 8/18 B/01 9 /16 9 /2 9 1 0 /1 3 1 0 /2 7 1V13 2/21
CARNIOLAN
1000
8 0 0
g 80° 8 400
200
0
AFRICANIZED X CARNIOLAN
1000
8 0 0
_ 800 SB 4 0 0
200
0Fig. 2. Average brood areas (±SE) of nine African
ized. eight Camiolan. and five A x C colonies between 18 August and 13 November, and on 21 February. No measurements were taken between 13 November and 21 February.
yond 23 January were not included in this analysis because of the death of some colonies after this date. The rate of weight loss (kilograms stores lost/ average bee weight*weeks) was calculated by dividing each colony’s weight change between 31 October and the final date by the average population weight and by the number of weeks of survival. The average population weight was calcu-
i8/18 9 /01 9 /16 9 /2 9 1 0 /1 3 1 0 /2 7 11/13
DATE2/21
_£l8/18 9 /01 9/16 9 /2 9 10/1310/27 tl/13 2/21
AFRICANIZED
-
—
- 1 5 — f t -t * i
Iated as the average of the initial worker weight (1.5 kg) and the weight of workers at the time of death or at the termination of the experiment (assuming a linear decline in adult population). Final brood areas of all surviving colonies, final worker populations at the time of death or destruction, changes in total colony weight, and rates of weight loss were compared among groups by ANOVA.
Results and Discussion
Five of the nine A colonies but no C or A x C colonies had died when the experiment was terminated. Two colonies died during the week ending on 19 January, two were observed dead on 24 January, and one died within the week before 15 February. More than 5 kg of honey remained in each of the colonies that died. The experiment was initiated with population sizes and honey stores that, according to our experience, would cause mortality, even in the C colonies. This did not occur because of a warmer than normal winter (see Fig. 1 for a comparison of the average minimum temperatures for the winter of 1988-1989 with the previous 10 winters). During the last 10 winters, winter mortality in the 200 colonies of Camiolan bees maintained by the Institut fur Bienenkunde has averaged 10%, whereas winter mortality during the winter of 1988-1989 was only 1%. The death of five of nine Africanized colonies, whereas all other colonies survived until the date of the termination of the experiment, indicates that there may be genotypic differences in overwintering ability.
Brood production was similar in the three groups (Fig. 2). Brood measurements between 18 August and 13 November showed no significant differences among types (F = 0.67; df = 2; P = 0.5231), a highly significant effect of time on brood production (F = 57.15; df = 6; P < 0.0001), and a significant interaction of type with time (F = 2.82; df = 12; P = 0.0021). The interaction between type and time is due to the lower brood areas in the A x C group on the first date and increases in the 27 October counts in both the A and A x C groups. Brood areas of the colonies surviving until the end of the experiment did not differ significantly (Table 1). The observations during this experiment do not clarify whether the brood production of A colonies was reduced by such proximal effects as reduced pollen stores or by more ultimate signals such as photoperiod changes. The influence of these factors should be an important component of future experiments.
Final worker population at the time of death or at the end of the experiment differed among the groups (Table 1). It would appear as if the reduction of brood rearing during the autumn in A colonies did not increase the longevity of their workers to the same degree as has been reported for the "winter workers” of temperate European bees (Maurizio 1968). Long periods of decreased or in
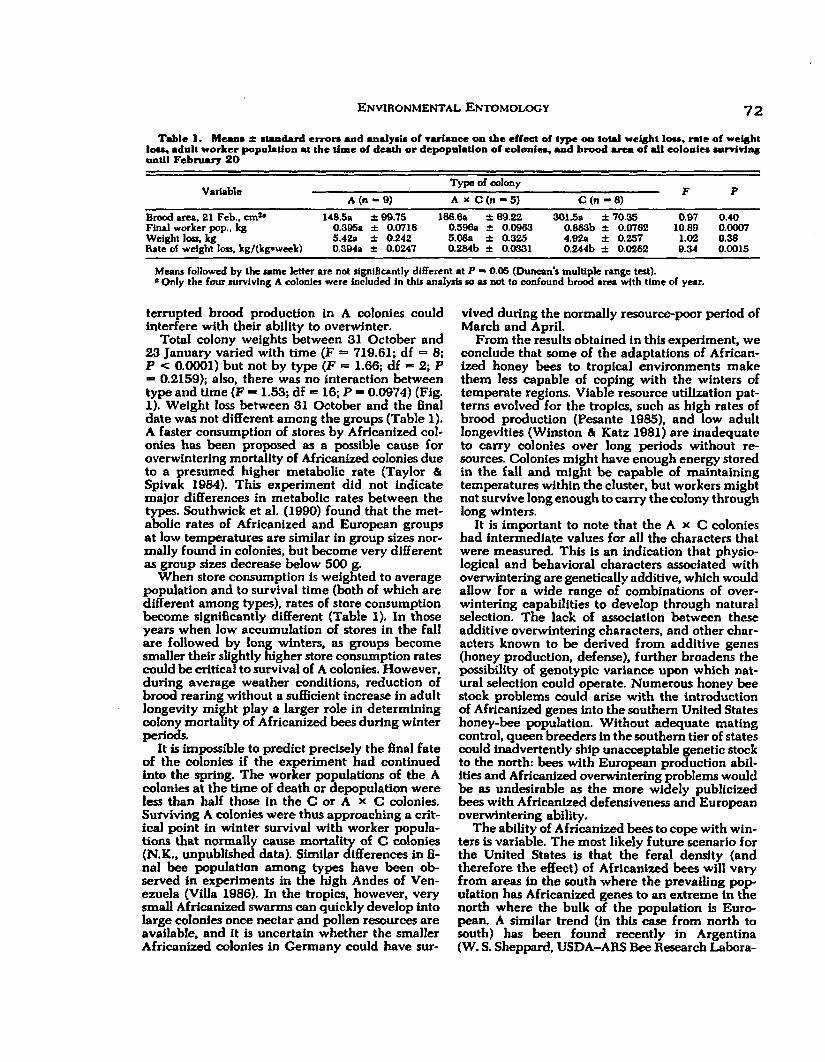
Environmental Entomology 72T ab le 1. Mean* ± itandard errors and analysis o f variance o n the e ffec t o f type on total w eight lo ss , rate o f weight
lo ss , adnlt w orker population at the tim e o f death o r depopulation o f c o lo n ie s , and brood area o f a ll co lo n ies surviving until February 2 0
VariableType of colony p p
A (n “ 9) A x C (n - 5) C(n - 8)Brood area, 21 Feb., cm*®Final worker pop., kg W eight loss, kgRate of weight loss, kg/(kg»week)
148,5a ± 99.75 0.395a ± 0.0718 5.42a ± 0.242 0.394a ± 0.0247
186.6a ± 89.22 0.596a ± 0.0963 5.08a ± 0.325 0.284b ± 0.0331
301.5a ± 70.35 0.883b ± 0.0762 4.92a ± 0.257 0.244b ± 0.0262
0.9710.89
1.02B.34
0.400.00070.380.0015
Means followed by the same letter a re not significantly different a t P — 0.05 (Duncan's m ultiple range test).* Only the four surviving A colonies were included in this analysis so as not to confound brood area with tim e of year.
terrupted brood production in A colonies could interfere with their ability to overwinter.
Total colony weights between 31 October and 23 January varied with time (F = 719.61; df = 8; P < 0.0001) but not by type (F ■= 1.66; df = 2; P = 0.2159); also, there was no interaction between type and time {F =» 1.53; df = 16; P = 0.0974) (Fig. 1). Weight loss between 31 October and the final date was not different among the groups (Table 1). A faster consumption of stores by Africanized colonies has been proposed as a possible cause for overwintering mortality of Africanized colonies due to a presumed higher metabolic rate (Taylor & Spivak 1984). This experiment did not indicate major differences in metabolic rates between the types. Southwick et al. (1990) found that the metabolic rates of Africanized and European groups at low temperatures are similar in group sizes normally found in colonies, but become very different as group sizes decrease below 500 g.
When store consumption is weighted to average population and to survival time (both of which are different among types), rates of store consumption become significantly different (Table 1). In those years when low accumulation of stores in the fall are followed by long winters, as groups become smaller their slightly higher store consumption rates could be critical to survival of A colonies. However, during average weather conditions, reduction of brood rearing without a sufficient increase in adult longevity might play a larger role in determining colony mortality of Africanized bees during winter periods.
It is impossible to predict precisely the final fate of the colonies if the experiment had continued into the spring. The worker populations of the A colonies at the time of death or depopulation were less than half those in the C or A x C colonies. Surviving A colonies were thus approaching a critical point in winter survival with worker populations that normally cause mortality of C colonies (N.K., unpublished data). Similar differences in final bee population among types have been observed in experiments in the high Andes of Venezuela (Villa 1986). In the tropics, however, very small Africanized swarms can quickly develop into large colonies once nectar and pollen resources are available, and it is uncertain whether the smaller Africanized colonies in Germany could have sur
vived during the normally resource-poor period of March and April.
From the results obtained in this experiment, we conclude that some of the adaptations of Africanized honey bees to tropical environments make them less capable of coping with the winters of temperate regions. Viable resource utilization patterns evolved for the tropics, such as high rates of brood production (Pesante 1985), and low adult longevities (Winston & Katz 1981) are inadequate to carry colonies over long periods without resources. Colonies might have enough energy stored in the fall and might be capable of maintaining temperatures within the cluster, but workers might not survive long enough to carry the colony through long winters.
It is important to note that the A x C colonies had intermediate values for all the characters that were measured. This is an indication that physiological and behavioral characters associated with overwintering are genetically additive, which would allow for a wide range of combinations of overwintering capabilities to develop through natural selection. The lack of association between these additive overwintering characters, and other characters known to be derived from additive genes (honey production, defense), further broadens the possibility of genotypic variance upon which natural selection could operate. Numerous honey bee stock problems could arise with the introduction of Africanized genes into the southern United States honey-bee population. Without adequate mating control, queen breeders in the southern tier of states could inadvertently ship unacceptable genetic stock to the north: bees with European production abilities and Africanized overwintering problems would be as undesirable as the more widely publicized bees with Africanized defensiveness and European overwintering ability.
The ability of Africanized bees to cope with winters is variable. The most likely future scenario for the United States is that the feral density (and therefore the effect) of Africanized bees will vary from areas in the south where the prevailing population has Africanized genes to an extreme in the north where the bulk of the population is European. A similar trend (in this case from north to south) has been found recently in Argentina (W. S. Sheppard, USDA-ARS Bee Research La bora-
February 1991 V i l l a e t a l .: O v e r w i n t e r i n g A f r i c a n i z e d H o n e y B e e s
73
tory, Beltsville, Md., personal communication). The final setting of these relative frequencies in North America will depend not only on the average absolute differences in overwintering mortality but also on the genetic variability of the colonizing Africanized population, on the level of introgres- sion of additive genes with the European population, on the yearly variability in the intensity and duration of winters, and on the strength of human response to the undesirable characters of Africanized bees.
AcknowledgmentWe are grateful to S. Fuchs and C. Rau for their good
care of the experimental colonies during the winter of 1988-1989, and to W. Gotz, M. Ullman, and W. Wurkner for their help with beekeeping. This study is in cooperation with the Louisiana Agricultural Experiment Station.
References CitedDietz, A., R. Krell & F. A. Eischen. 1985. Preliminary
investigation on the distribution of Africanized honey bees in Argentina. Apidologie 16: 99-108.
Dietz, A., R. Krell & J. Pettis. 1986. Study on winter survival of Africanized and European honey bees in San Juan, Argentina, pp. 87-91. In Proceedings of the Africanized honey bee symposium, February 11- 12, 1986, Atlanta. American Farm Bureau Research Foundation, Park Ridge, 111.
1988. Survival of Africanized and European honeybee colonies confined in a refrigeration chamber, pp. 237-242. In G. R. Needham et al. [eds.], Africanized bees and bee mites. Wiley, New York.
Dietz, A., J. F. Leitner, C. Vergara & M. Mejia. 1989. Effect of prolonged confinement in a refrigeration chamber on the survival of Africanized and European honey bee colonies, in Proceedings of the fourth American bee research conference. Am. Bee J. 129: 815.
Kerr, W. E., S. L. del Rio & M. D. Barrionuevo. 1982. The southern limits of the distribution of the Africanized honey bee in South America. Am. Bee J. 122: 196-198.
Krell, R., A. Dietz & F. A. Eischen. 1985. A preliminary study on winter survival of Africanized and European honey bees in Cordoba, Argentina. Apidologie 16: 109-118.
Maurizio, A. 1968. Evolution et longevite des adultes, pp. 129-144. In R. Chauvin [ed.], Traite de biologie de 1‘abellle. Masson, Paris.
Pesante, D. G. 1985. Africanized and European honey bee (Apis mellifera L.) pollen and nectar foraging behavior and honey production in the Neotropics. Ph.D. dissertation, Louisiana State University, Baton Rouge.
Seeley, T. D. 1978. Life history strategy of the honey bee, Apts mellifera. Oecologia (Berl.) 32: 109-118.
Southwick, E. E., D. W. Roubik & J. M. Williams. 1990. Comparative energy balance in groups of Africanized and European honey bees: ecological implications. J. Comp. Physiol. 97A: 1-7.
Taylor, O. R. 1977. The past and possible future spread of Africanized honeybees in the Americas. Bee World 58: 19-30.
Taylor, O. R. & M. Spivak. 1984. Climatic limits of tropical African honeybees in the Americas. Bee World 65: 38-47.
Villa, J. D. 1986. Performance of Africanized colonies at high elevations in Colombia, in Proceedings of the first American bee research conference. Am. Bee J. 126: 835.
Villa, J. D., C. C. Gentry & O. R. Taylor. 1987. Preliminary observations on thermoregulation, clustering, and energy utilization in African and European honey bees. J. Kans. Entomol. Soc. 60: 4-14.
Winston, M. L. & S. J. Katz. 1981. Longevity of cross- fostered honey bee workers (Apis mellifera) of European and Africanized races. Can. J. Zoo!. 59: 1571- 1575.
Woyke, J. 1973. Experiences with Apis mellifera adansonii in Brazil and Poland. Apiacta (Buchar.) (Engl. Ed.) 8: 115-116.
Received for publication 27 April 1990; accepted 31July 1990.
CONCLUSIONS
The experiments described in this dissertation help to clarify an area of honey-bee biology in which ecological inference had been in contradiction with experimental work. Earlier ecological inference had attempted to predict the possible occupation of temperate regions by African-derived honey bees by using current ranges and trying to match climatic data to potential overwintering limits in unoccupied areas. This approach had predicted the occupation of only a small part of the United States by Africanized honey bees. In contradiction, experiments in cold rooms, at middle elevations in the tropics, and in Argentina had not shown clear evidence for overwintering mortality of Africanized honey bees, and had led some authors to predict the potential overwintering range of Africanized honey bees to include most of the continental United States.
This new set of experiments tested more rigorously hypotheses that had been presented to explain the higher winter mortality of Africanized bees. These hypotheses were tested by exposing both small groups of workers and large colonies to more extreme temperatures and for longer periods than had been done previously. It is now clearer which components of overwintering behavior and physiology are
74
75different between European and Africanized colonies, and which ones are similar or of no ecological consequence. The components of overwintering in which Africanized and European bees might differ are the following:
1) Temperature Regulation: Two experiments performed in cold rooms showed that Africanized honey bees respond to cold temperatures by aggregating and maintaining temperatures above ambient in a similar way to European bees. Differences in the way artificially-formed small groups of workers cluster suggest very different strategies for dealing with cold temperatures: a short-term strategy in Africanized workers and a long-term strategy in European colonies.
2) Metabolic Rates: The consumption of stores by honeybee groups of different sizes and of the two genotypes did not show clear patterns that could produce overwintering mortality due to the exhaustion of stores. Four tests showed significantly higher rates of store consumption by European bees (Experiments 1 and 2 in Chapter 2, Experiment 1 and treatment a of Experiment 2 in Chapter 3), while two tests showed significantly higher rates for Africanized colonies (treatment c of Experiment 2 in Chapter 3 , and the single experiment of Chapter 4). Four tests indicated no significant differences in the rates of store consumption (Experiment 4 of Chapter 2, treatments a, b, and d of Experiment 2 in Chapter 3). It thus appears as if a faster
76rate of honey store depletion is not a valid explanation for winter mortality of Africanized colonies.
3) Brood Rearing: There were also no clear differencesbetween the brood-rearing patterns of Africanized and European colonies, whether they were maintained in cold rooms, at high elevations, or in a true winter in Germany. Africanized colonies appeared to regulate brood production using both availability of resources and photoperiodic cues.
4) Physiological Changes in Workers: The most striking difference between the two types of bees was in the mortality of workers in small groups over a period of days (Experiment 1 of Chapter 2), and in confined field colonies over a period of weeks (treatment a, Experiment 2 of Chapter3). This higher mortality of workers also produced significantly smaller colony sizes at the time that other experiments were terminated (Experiment 2 of Chapter 2, and the experiment in Chapter 3). The two tests that showed no significant differences in final population between the types (Experiment 4 of Chapter 2, and Experiment 1 of Chapter 3) were designed to evaluate total survival time of colonies rather than to evaluate final condition at a given time. The physiological bases for these differences in worker longevity are yet unclear, since the amount of protein in Africanized worker heads was not lower than in European bees as would have been expected from aging (treatment a of Experiment 2 in Chapter 2).
Only one of the postulated hypotheses to explain overwintering mortality in Africanized colonies has been clearly substantiated by these experiments. It appears as if thermoregulatory difficulties, or depletion of honey stores because of higher metabolic rates or because of uninterrupted brood rearing are not the causes of overwintering mortality. The shorter lifespan pf workers, the physiological effects of winter confinement, and their effects on colony adult population are probably the principal causes of Africanized colony mortality. The intermediate values for hybrid colonies (whether the maternal side was Africanized or European) in tests where overall significant differences were encountered, suggests that most overwintering characters are polygenic. It is therefore likely that a graded cline of decreasing Africanization will be formed as Africanized bees move further north in the United States.
These experiments have also generated questions that could be clarified with future experiments:1) Can the clustering differences of small groups of workers affect food transmission and worker interactions in larger groups leading to reduced cold tolerance and survival?2) How do Africanized and European colonies differ in the use of food resources and photoperiod to regulate their brood production?
783) What is the physiological basis for the reduced longevity of Africanized workers exposed to winter conditions and confinement?4) What genetic mechanisms govern worker longevity, and the appearance of 'winter bees'?
REFERENCES
Allen, M.D. 1959a. Respiration rate of worker honeybees of different ages and at different temperatures. J. Exp. Biol. 36: 92-101.
Allen, M.D. 1959b. Respiration rates of larvae of drone and worker honey bees, Apis mellifera. J. Econ. Entomol. 52: 399-402.
Avitabile, A. 1978. Brood rearing in honeybee colonies from late autumn to early spring. J. Apic. Res. 17: 69-73.
Bastian, J. & H. Esch. 1970. The nervous control of the indirect flight muscles of the honeybee. Z. Vergl. Physiol. 67: 307-324.
Bee World. 1987. World Honey Crop Report. Bee World 68: 186-187.
Beenakkers, A.M. 1969. Carbohydrate and fat as a fuel for insect flight. J. Insect Physiol. 15: 353-361.
Cahill, K. & S. Lustick. 1976. Oxygen consumption andthermoregulation in Apis mellifera workers and drones. Comp. Biochem. Physiol. 55A: 355-357.
Cooper, P.D., W.M. Schaffer & S.L. Buchmann. 1985.Temperature regulation of honey bees (Apis mellifera) in the Sonoran Desert. J. Exp. Biol. 114: 1-14.
Corkins, C. L. 1930. The metabolism of the honeybee colony during winter. Bull. Wyo. Agric. Exp. Sta. 175: 1-54.
Crailsheim, K. 1985. Distribution of haemolymph in thehoneybee (Apis mellifica) in relation to season, age and temperature. J. Insect Physiol. 31: 707-713.
Crailsheim, K. 1986. Dependence of protein metabolism onage and season in the honeybee (Apis mellifica carnica Pollm.). J. Insect Physiol. 32: 629-634.
Danka, R. G., T. E. Rinderer & A. M. Collins. 1987.Responses of Africanized honey bees (Hymenoptera:Apidae) to pollination management stress. J. Econ. Entomol. 80: 621-624.
Danka, R. G., R.L. Hellmich, T.E. Rinderer & A.M. Collins. 1987. Diet-selection ecology of tropically and temperately adapted honey bees. Anim. Behav. 35: 1858-1863.
79
80Daly, H. V. & S. S. Balling. 1978. Identification of
Africanized honey bees in the Western hemisphere by discriminant analysis. J. Kansas Entomol. Soc. 51: 857- 869.
Daly, H. V., K. Hoelmer, P. Norman & T. Allen. 1982.Computer-assisted measurement and identification of honey bees (Hymenoptera: Apidae). Ann. Entomol. Soc. Amer. 75: 591-594.
Darchen, R. 1973. La thermoregulation et l'ecologie dequelques especes d'abeilles sociales d'Afrique (Apidae, Trigonini et Apis mellifera var. adansonii). Apidologie 4: 341-370.
Dietz, A., R. Krell & F.A. Eischen. 1985. Preliminaryinvestigation on the distribution of Africanized honey bees in Argentina. Apidologie 16: 99-108.
Dietz, A., R. Krell & J. Pettis. 1986. study on wintersurvival of Africanized and European honey bees in San Juan, Argentina, pp. 87-91. In Proceedings of the Africanized honey bee symposium, February 11-12, 1986, Atlanta. American Farm Bureau Research Foundation,Park Ridge, 111.
Dietz, A., R. Krell & J. Pettis. 1988. Survival ofAfricanized and European honey-bee colonies confined in a refrigeration chamber, pp. 237-242. In G. R. Needham et al. (eds.), Africanized bees and bee Mites. Wiley, New York.
Dietz, A., J.F. Leitner, C. Vergara & M. Mejia. 1989. Effect of prolonged confinement in a refrigeration chamber on the survival of Africanized and European honey bee colonies. In Proceedings of the fourth American bee research conference. Am. Bee J. 129: 815.
Esch, H. 1960. Uber die Korpertemperaturen un denWarmehaushal von Apis mellifera. Z. Vergl. Physiol. 43: 305-335.
Fluri, P., H, Wille, L. Gerig & M. Luscher. 1977. Juvenile hormone, vitellogenin and haemocyte composition in winter worker bees (Apis mellifera). Experientia. 33: 1240-1241.
Free, J.B. & J. Simpson. 1963. The respiratory metabolism of honey-bee colonies at low temperatures. Entomol.Exp. Appl. 6: 234-238.
81Free, J. B. & Y. Spencer-Booth. 1958. Observations on the
temperature regulation and food consumption of honeybees (Apis mellifera). J. Exp. Biol. 35: 930-937.
Gates, B. N. 1914. The temperature of the bee colony. U. S. Dep. Agr. Bull. 96: 1-29.
Gentry, C. C. 1991. Comparative foraging and resourceutilization between African and European honey bees in the tropical dearth season. Ph.D. dissertation, University of Kansas, Lawrence.
Hall, H.G. 1990. Parental analysis of introgressivehybridization between African and European honeybees using nuclear DNA RFLPs. Genetics 125: 611-621.
Hall, H.G., K. Muralidharan. 1989. Evidence frommitochondrial DNA that African honey bees spread as continuous maternal lineages. Nature 339: 211-213.
Heinrich. B. 1972. Energetics of temperature regulationand foraging in a bumblebee, Bombus terricola Kirby. J. Comp. Physiol. 77: 49-64.
Heinrich, B. 1979. Thermoregualtion of African and European honeybees during foraging, attack, and hive exits and returns. J. Exp. Biol. 80: 217-229.
Heinrich, B. 1980a. Mechanisms of body-temperatureregulation in honeybees, Apis mellifera. I - Regulation of head temperature. J.Exp. Biol. 85: 61-72.
Heinrich, B. 1980b. Mechanisms of body-temperature regulation in honeybees, Apis mellifera. II - Regulation of thoracic temperature at high air temperature. J. Exp. Biol. 85: 73 87.
Heinrich, B. 1981. The mechanisms and energetics ofhoneybee swarm temperature regulation. J. Exp. Biol. 91: 25-55.
Hepburn, H.R., R.C. Cantrill, P.R. Thompson & E. Kennedi. 1979. Metabolism of carbohydrate, lipid and protein during development of sealed worker brood of the African bee. J. Apic. Res. 18: 30-35.
Hess, W.R. 1926. Die temperaturregulierung im Bienenvolk.Z. vergl. Physiol. 4: 465-487.
Heussner, A. & T. Stussi. 1964. Metabolisme energetique de l'abeille isolee: son role dans la thermoregulation de la ruche. Ins. Soc. 11: 239-266.
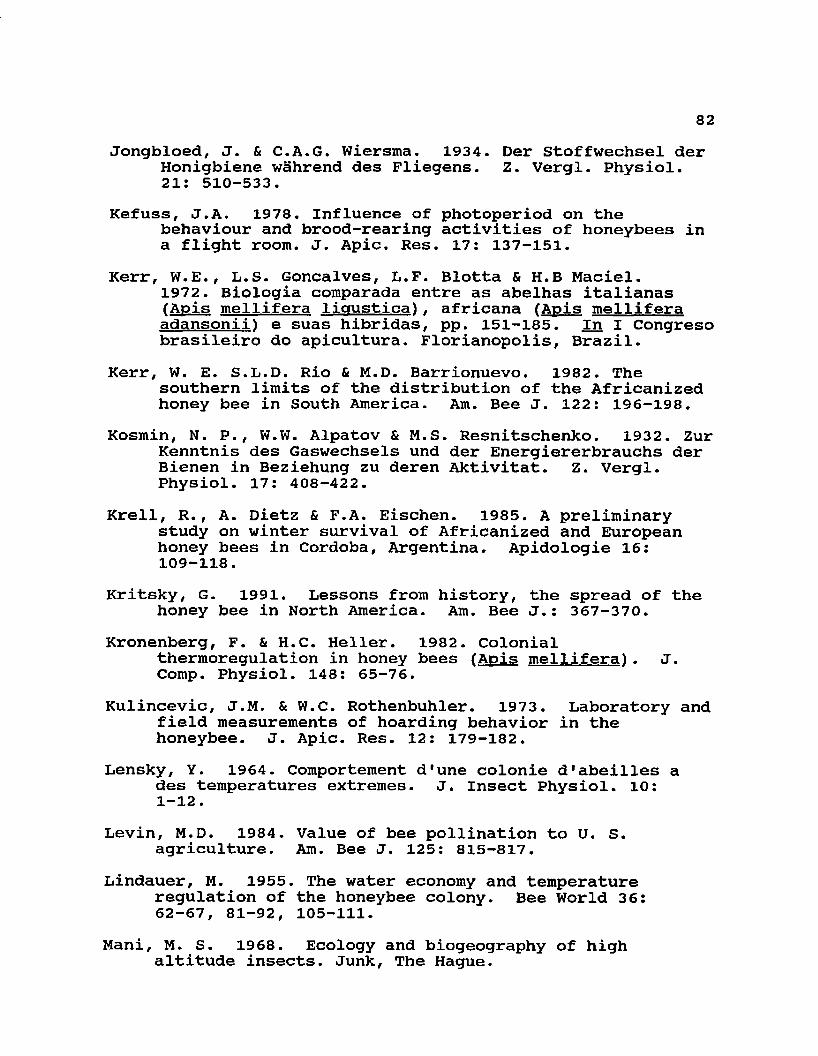
82Jongbloed, J. & C.A.G. Wiersma. 1934. Der Stoffwechsel der
Honigbiene wahrend des Fliegens. Z. Vergl. Physiol.21: 510-533.
Kefuss, J.A. 1978. Influence of photoperiod on thebehaviour and brood-rearing activities of honeybees in a flight room. J. Apic. Res. 17: 137-151.
Kerr, W.E., L.S. Goncalves, L.F. Blotta & H.B Maciel.1972. Biologia comparada entre as abelhas italianas (Apis mellifera liqustica), africana (Apis mellifera adansonii) e suas hibridas, pp. 151-185. In I Congreso brasileiro do apicultura. Florianopolis, Brazil.
Kerr, W. E. S.L.D. Rio & M.D. Barrionuevo. 1982. Thesouthern limits of the distribution of the Africanized honey bee in South America. Am. Bee J. 122: 196-198.
Kosmin, N. P., W.W. Alpatov & M.S. Resnitschenko. 1932. Zur Kenntnis des Gaswechsels und der Energiererbrauchs der Bienen in Beziehung zu deren Aktivitat. Z. Vergl. Physiol. 17: 408-422.
Krell, R., A. Dietz & F.A. Eischen. 1985. A preliminary study on winter survival of Africanized and European honey bees in Cordoba, Argentina. Apidologie 16: 109-118.
Kritsky, G. 1991. Lessons from history, the spread of the honey bee in North America. Am. Bee J.: 367-370.
Kronenberg, F. & H.C. Heller. 1982. Colonialthermoregulation in honey bees (Apis mellifera}. J. Comp. Physiol. 148: 65-76.
Kulincevic, J.M. & W.C. Rothenbuhler. 1973. Laboratory andfield measurements of hoarding behavior in the honeybee. J. Apic. Res. 12: 179-182.
Lensky, Y. 1964. Comportement d'une colonie d'abeilles a des temperatures extremes. J. Insect Physiol. 10:1-12.
Levin, M.D. 1984. Value of bee pollination to U. S. agriculture. Am. Bee J. 125: 815-817.
Lindauer, M. 1955. The water economy and temperature regulation of the honeybee colony. Bee World 36:62-67, 81-92, 105-111.
Mani, M. S. 1968. Ecology and biogeography of high altitude insects. Junk, The Hague.
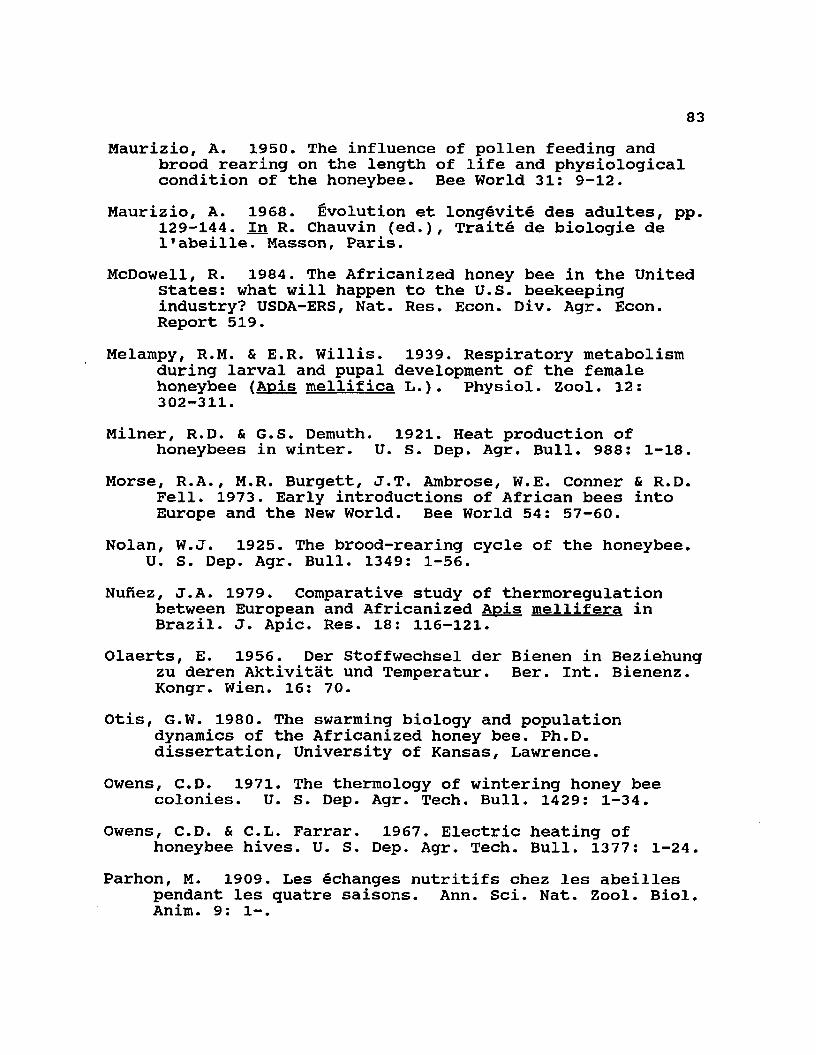
83Maurizio, A. 1950. The influence of pollen feeding and
brood rearing on the length of life and physiological condition of the honeybee. Bee World 31: 9-12.
Maurizio, A. 1968. Evolution et long^vite des adultes, pp. 129-144. In R. Chauvin (ed.), Traits de biologie de l'abeille. Masson, Paris.
McDowell, R. 1984. The Africanized honey bee in the United States: what will happen to the U.S. beekeeping industry? USDA-ERS, Nat. Res. Econ. Div. Agr. Econ. Report 519.
Melampy, R.M. & E.R. Willis. 1939. Respiratory metabolism during larval and pupal development of the female honeybee (Apis mellifica L.). Physiol. Zool. 12: 302-311.
Milner, R.D. & G.S. Demuth. 1921. Heat production ofhoneybees in winter. U. S. Dep. Agr. Bull. 988: 1-18.
Morse, R.A., M.R. Burgett, J.T. Ambrose, W.E. Conner & R.D. Fell. 1973. Early introductions of African bees into Europe and the New World. Bee World 54: 57-60.
Nolan, W.J. 1925. The brood-rearing cycle of the honeybee.U. S. Dep. Agr. Bull. 1349: 1-56.
Nufiez, J.A. 1979. Comparative study of thermoregulation between European and Africanized Apis mellifera in Brazil. J. Apic. Res. 18: 116-121.
Olaerts, E. 1956. Der Stoffwechsel der Bienen in Beziehung zu deren Aktivitat und Temperatur. Ber. Int. Bienenz. Kongr. Wien. 16: 70.
Otis, G.W. 1980. The swarming biology and population dynamics of the Africanized honey bee. Ph.D. dissertation, University of Kansas, Lawrence.
Owens, C.D. 1971. The thermology of wintering honey bee colonies. U. S. Dep. Agr. Tech. Bull. 1429: 1-34.
Owens, C.D. & C.L. Farrar. 1967. Electric heating ofhoneybee hives. U. S. Dep. Agr. Tech. Bull. 1377: 1-24.
Parhon, M. 1909. Les echanges nutritifs chez les abeillespendant les quatre saisons. Ann. Sci. Nat. Zool. Biol. Anim. 9: 1-.
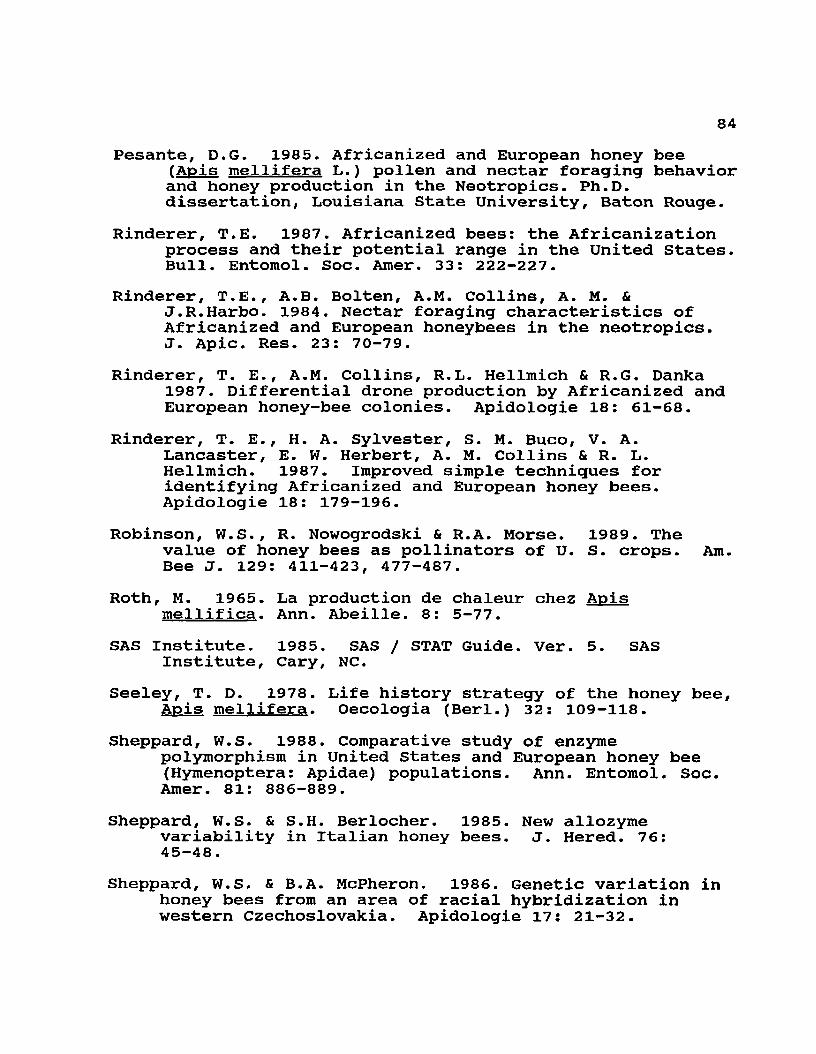
84Pesante, D.G. 1985. Africanized and European honey bee
fApis mellifera L.) pollen and nectar foraging behavior and honey production in the Neotropics. Ph.D. dissertation, Louisiana State University, Baton Rouge.
Rinderer, T.E. 1987. Africanized bees: the Africanizationprocess and their potential range in the United States. Bull. Entomol. Soc. Amer. 33: 222-227.
Rinderer, T.E., A.B. Bolten, A.M. Collins, A. M. &J.R.Harbo. 1984. Nectar foraging characteristics of Africanized and European honeybees in the neotropics.J. Apic. Res. 23: 70-79.
Rinderer, T. E., A.M. Collins, R.L. Hellmich & R.G. Danka1987. Differential drone production by Africanized and European honey-bee colonies. Apidologie 18: 61-68.
Rinderer, T. E., H. A. Sylvester, S. M. Buco, V. A.Lancaster, E. W. Herbert, A. M. Collins & R. L. Hellmich. 1987. Improved simple techniques for identifying Africanized and European honey bees. Apidologie 18: 179-196.
Robinson, W.S., R. Nowogrodski & R.A. Morse. 1989. Thevalue of honey bees as pollinators of U. S. crops. Am. Bee J. 129: 411-423, 477-487.
Roth, M. 1965. La production de chaleur chez Apis mellifica. Ann. Abeille. 8: 5-77.
SAS Institute. 1985. SAS / STAT Guide. Ver. 5. SAS Institute, Cary, NC.
Seeley, T. D. 1978. Life history strategy of the honey bee, Apis mellifera. Oecologia (Berl.) 32: 109-118.
Sheppard, W.S. 1988. Comparative study of enzymepolymorphism in United States and European honey bee (Hymenoptera: Apidae) populations. Ann. Entomol. Soc. Amer. 81: 886-889.
Sheppard, W.S. & S.H. Berlocher. 1985. New allozymevariability in Italian honey bees. J. Hered. 76:45-48.
Sheppard, W.S. & B.A. McPheron. 1986. Genetic variation in honey bees from an area of racial hybridization in western Czechoslovakia. Apidologie 17: 21-32.
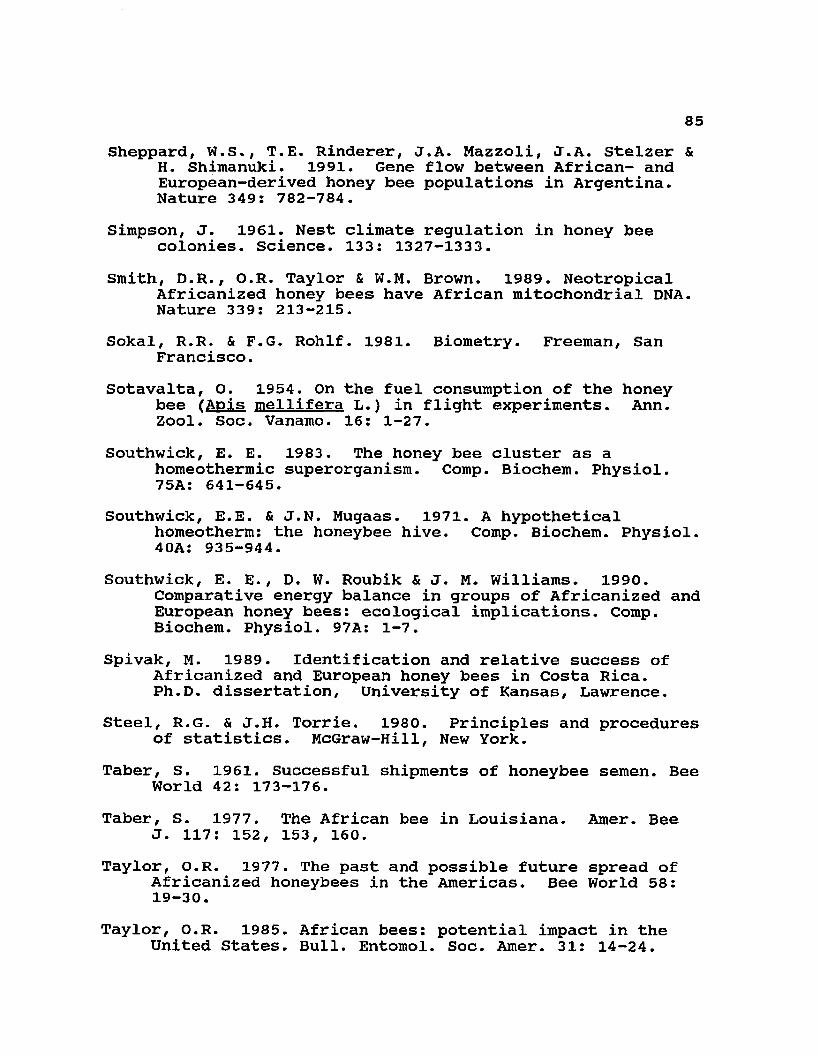
85Sheppard, W.S., T.E. Rinderer, J.A. Mazzoli, J.A. Stelzer &
H. Shimanuki. 1991. Gene flow between African- and European-derived honey bee populations in Argentina. Nature 349: 782-784.
Simpson, J. 1961. Nest climate regulation in honey bee colonies, science. 133: 1327-1333.
Smith, D.R., O.R. Taylor & W.M. Brown. 1989. NeotropicalAfricanized honey bees have African mitochondrial DNA. Nature 339: 213-215.
Sokal, R.R. & F.G. Rohlf. 1981. Biometry. Freeman, San Francisco.
Sotavalta, O. 1954. On the fuel consumption of the honey bee (Apis mellifera L.) in flight experiments. Ann. Zool. Soc. Vanamo. 16: 1-27.
Southwick, E. E. 1983. The honey bee cluster as ahomeothermic superorganism. Comp. Biochem. Physiol. 75A: 641-645.
Southwick, E.E. & J.N. Mugaas. 1971. A hypotheticalhomeotherm: the honeybee hive. Comp. Biochem. Physiol. 40A: 935-944.
Southwick, E. E., D. W. Roubik & J. M. Williams. 1990.Comparative energy balance in groups of Africanized and European honey bees: ecological implications. Comp. Biochem. Physiol. 97A: 1-7.
Spivak, M. 1989. Identification and relative success of Africanized and European honey bees in Costa Rica.Ph.D. dissertation, University of Kansas, Lawrence.
Steel, R.G. & J.H. Torrie. 1980. Principles and procedures of statistics. McGraw-Hill, New York.
Taber, S. 1961. Successful shipments of honeybee semen. Bee World 42: 173-176.
Taber, S. 1977. The African bee in Louisiana. Amer. Bee J. 117: 152, 153, 160.
Taylor, O.R. 1977. The past and possible future spread of Africanized honeybees in the Americas. Bee World 58: 19-30.
Taylor, O.R. 1985. African bees: potential impact in the United States. Bull. Entomol. Soc. Amer. 31: 14-24.
86Taylor, O.R. & M. Spivak. 1984. Climatic limits of tropical
African honeybees in the Americas. Bee World 65: 38-47.USDA. 1988. Agricultural Statistics 1988. U.S. Government
Printing Office, Washington.Verma, L.R. & O.K. Edwards. 1971. Metabolic acclimatization
to temperature and temperature tolerance in Apis mellifera and Apis cerana indica kept in India. J. Apic. Res. 10: 105-108.
Villa, J. D. 1987. Africanized and European colonyconditions at different elevations in Colombia. Am.Bee J. 127: 53-57.
Villa, J.D., C.C. Gentry & O.R. Taylor. 1987. Preliminary observations on thermoregulation, clustering, and energy utilization in African and European honey bees. J. Kansas Entomol. Soc. 60: 4-14.
Villa, J. D., N. Koeniger & T. E. Rinderer. 1991.Overwintering of Africanized, European and hybrid honey bees in Germany. Environ. Entomol. 20: 39-43.
Winston, M.L. & S.J. Katz. 1981. Longevity ofcross-fostered honey bee workers (Apis mellifera) of European and Africanized races. Can. J. Zool. 59: 1571-1575.
Winston, M.L., G.W. Otis & O.R. Taylor. 1979. Abscondingbehaviour of the Africanized honeybee. J. Apic. Res.18: 85-94.
Winston, M.L., O.R. Taylor & G.W. Otis. 1984. Somedifferences between temperate European and tropical African and South American honeybees. Bee World 64: 12-21.
Woodworth, C.E. 1936. Effect of reduced temperature and pressure on honeybee respiration. J. Econ. Entomol.29: 1128-1132.
Woyke, J. 1973. Experiences with Apis mellifera adansoniiin Brazil and Poland. Apiacta (Buchar.) (Engl. Ed.) 8: 115-116.
Woyke, J. & Z. Jasinski. 1982. Influence of the number ofattendant workers on the number of spermatozoa entering the spermatheca of instrumentally inseminated queens kept outdoors in mating nuclei. J. Apic. Res. 21: 129-133.
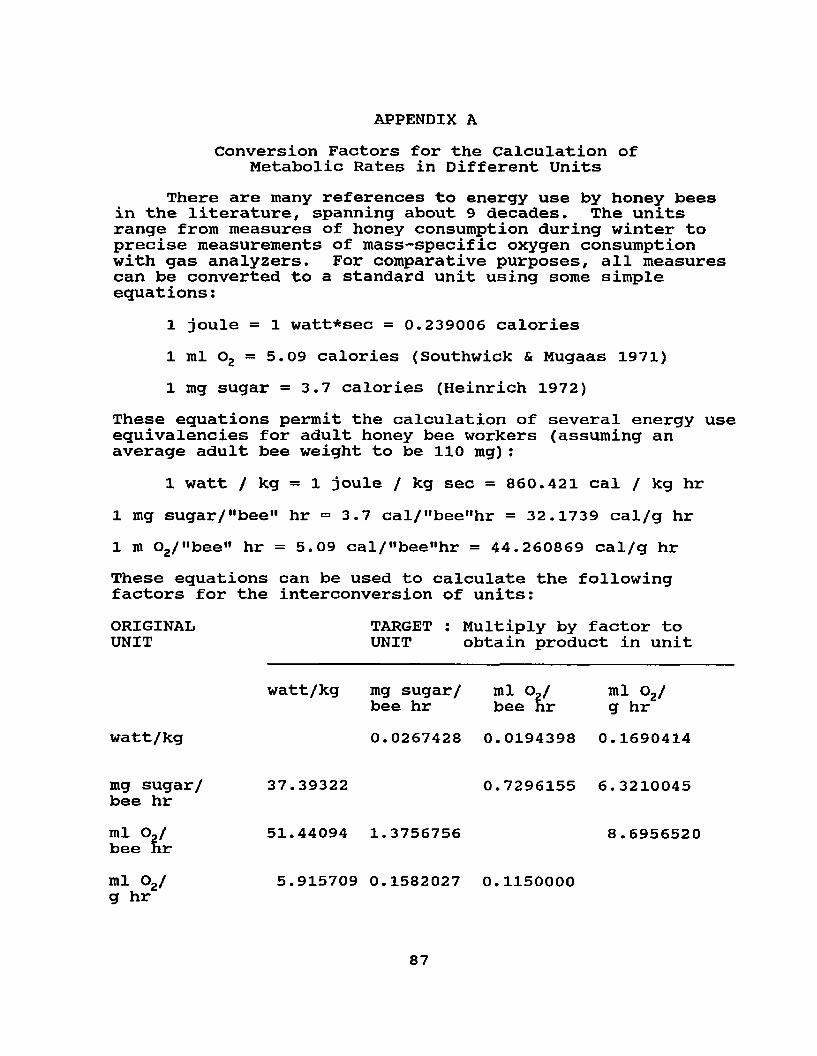
APPENDIX AConversion Factors for the Calculation of
Metabolic Rates in Different UnitsThere are many references to energy use by honey bees
in the literature, spanning about 9 decades. The units range from measures of honey consumption during winter to precise measurements of mass-specific oxygen consumption with gas analyzers. For comparative purposes, all measures can be converted to a standard unit using some simple equations:
1 joule = 1 watt*sec = 0.239006 calories1 ml Oz = 5.09 calories (Southwick & Mugaas 1971)1 mg sugar = 3.7 calories (Heinrich 1972)
These equations permit the calculation of several energy use equivalencies for adult honey bee workers (assuming an average adult bee weight to be 110 mg) :
1 watt / kg = 1 joule / kg sec = 860.421 cal / kg hr1 mg sugar/"bee" hr = 3.7 cal/l,bee,,hr = 32.1739 cal/g hr1 m 02/"bee" hr = 5.09 cal/"beenhr = 44.260869 cal/g hrThese equations can be used to calculate the following factors for the interconversion of units:ORIGINAL TARGET : Multiply by factor toUNIT UNIT obtain product in unit
watt/kg mg sugar/ ml 02/bee hr bee hr
ml Oz/g hr
watt/kg 0.0267428 0.0194398 0.1690414
mg sugar/ bee hr
37.39322 0.7296155 6.3210045
ml 0,1 bee hr
51.44094 1.3756756 8.6956520
ml 0,1 g hr
5.915709 0.1582027 0.1150000
87
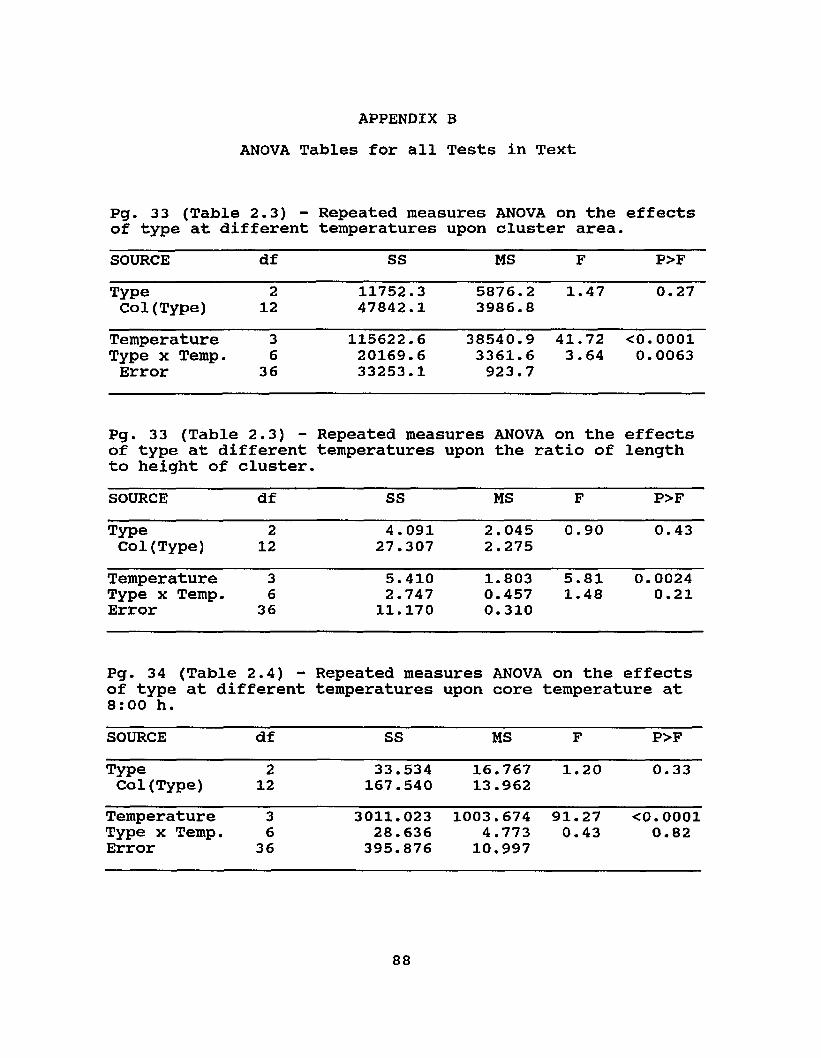
APPENDIX B ANOVA Tables for all Tests in Text
Pg. 33 (Table 2.3) - Repeated measures ANOVA on the effects of type at different temperatures upon cluster area.SOURCE df SS MS F P>FType 2 11752.3 5876.2 1.47 0.27Col(Type) 12 47842.1 3986.8
Temperature 3 115622.6 38540.9 41.72 <0.0001Type x Temp. 6 20169.6 3361.6 3.64 0.0063Error 36 33253.1 923.7
Pg. 33 (Table 2.3) - Repeated measures ANOVA on the of type at different temperatures upon the ratio of to height of cluster.
effectslength
SOURCE df SS MS F P>FType 2 4.091 2.045 0.90 0.43Col(Type) 12 27.307 2.275
Temperature 3 5.410 1.803 5.81 0.0024Type x Temp. 6 2.747 0.457 1.48 0.21Error 36 11.170 0.310
Pg. 34 (Table 2.4) - Repeated measures ANOVA of type at different temperatures upon core 8:00 h.
t on the effects temperature at
SOURCE df SS MS F P>FType 2 33.534 16.767 1.20 0.33Col(Type) 12 167.540 13.962
Temperature 3 3011.023 1003.674 91.27 <0.0001Type x Temp. 6 28.636 4.773 0.43 0.82Error 36 395.876 10.997
88
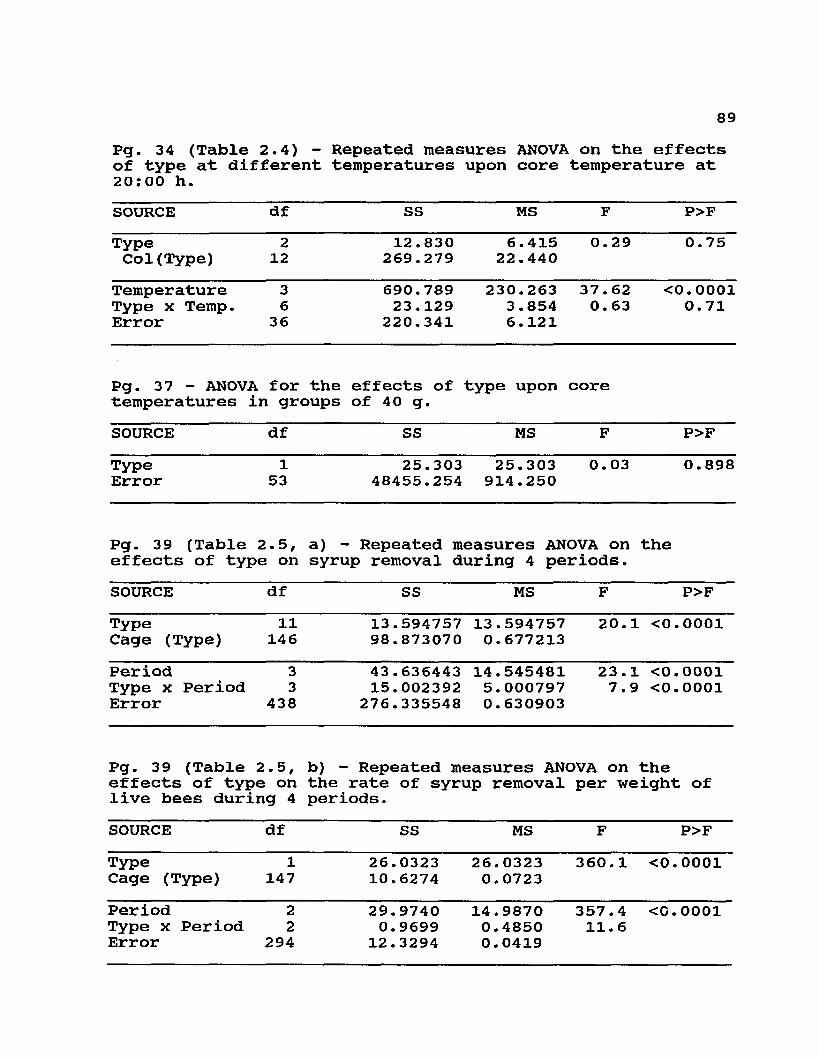
Pg. 34 (Table 2.4) - Repeated measures ANOVA on the effectsof type at different temperatures upon core temperature at20:00 h.SOURCE df SS MS F P>FType Col(Type)
212
12.830269.279
6.41522.440
0. 29 0.75
Temperature Type x Temp. Error
36
36690.78923.129
220.341230.263
3.854 6.121
37. 62 0. 63
<0.0001 0.71
Pg. 37 - ANOVA for the temperatures in groups
effects of of 40 g.
type upon core
SOURCE df SS MS F P>FTypeError
153
25.303 48455.254
25.303914.250
0. 03 0.898
Pg. 39 (Table 2.5, effects of type on
a) - Repeated measures ANOVA on syrup removal during 4 periods.
the
SOURCE df SS MS F P>FTypeCage (Type)
11146
13.59475798.873070
13.5947570.677213
20.1 <0.0001
PeriodType x Period Error
33
43843.636443 15.002392
276.33554814.545481 5.000797 0.630903
23 .1 7.9
<0.0001 <0.0001
Pg. 39 (Table 2.5, effects of type on live bees during 4
b) - Repeated measures ANOVA on the the rate of syrup removal per weight of periods.
SOURCE df SS MS F P>FTypeCage (Type)
1147
26.032310.6274
26.03230.0723
360. 1 <0.0001
PeriodType x Period Error
22
29429.97400.9699
12.329414.98700.48500.0419
357.411.6
<0.0001
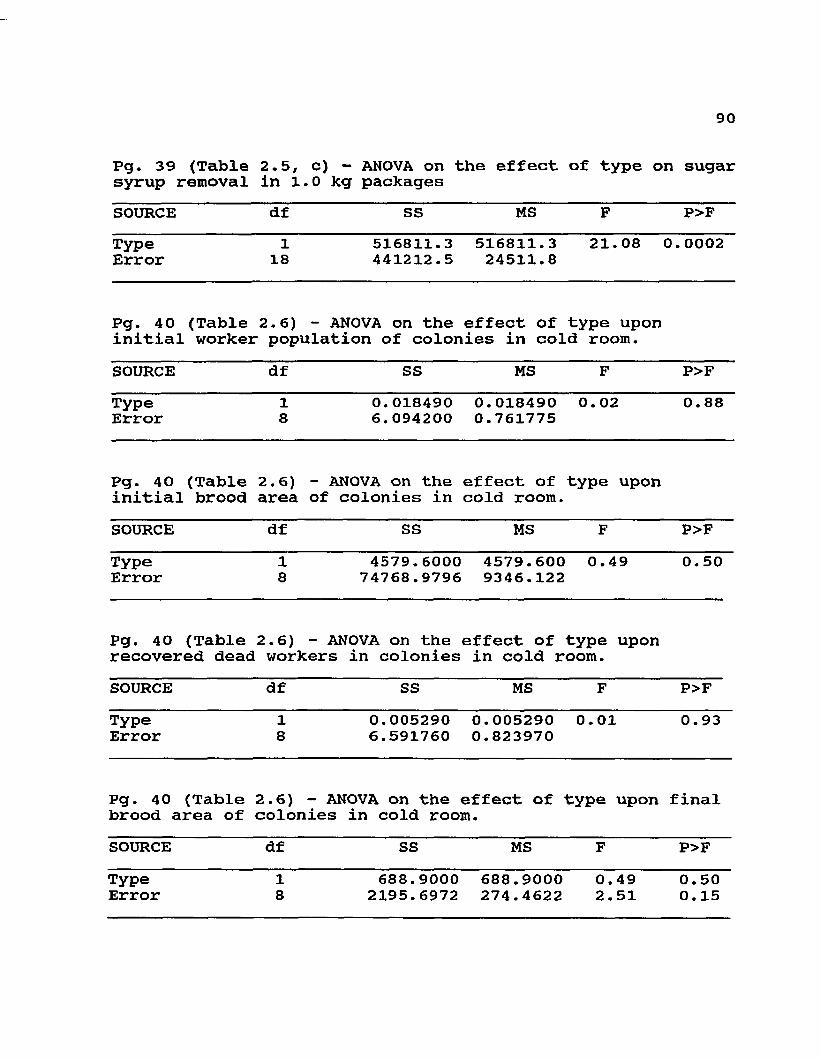
90
Pg. 39 (Table syrup removal
2.5, in 1
C) - ANOVA on .0 kg packages
the effect of type on sugar
SOURCE df SS MS F P>FType 1 516811.3 516811.3 21.08 0.0002Error 18 441212.5 24511.8
Pg. 40 (Table 2.6) - ANOVA on the effect of type upon initial worker population of colonies in cold room.SOURCE df SS MS F P>FType 1 0.018490 0.018490 0.02 0.88Error 8 6.094200 0.761775
Pg. 40 (Table 2.6) - ANOVA on the effect of type uponinitial brood area of colonies in cold room.SOURCE df SS MS F P>FType 1 4579.6000 4579.600 0.49 0. 50Error 8 74768.9796 9346.122
Pg. 40 (Table 2.6) - ANOVA on the effect of type uponrecovered dead workers in colonies in cold room.SOURCE df SS MS F P>FType 1 0.005290 0.005290 0.01 0.93Error 8 6.591760 0.823970
Pg. 40 (Table 2.6) - ANOVA on the effect of type upon finalbrood area of colonies in cold room.SOURCE df SS MS F P>FTypeError
18
688.9000 688.9000 0.49 0.502195.6972 274.4622 2.51 0.15
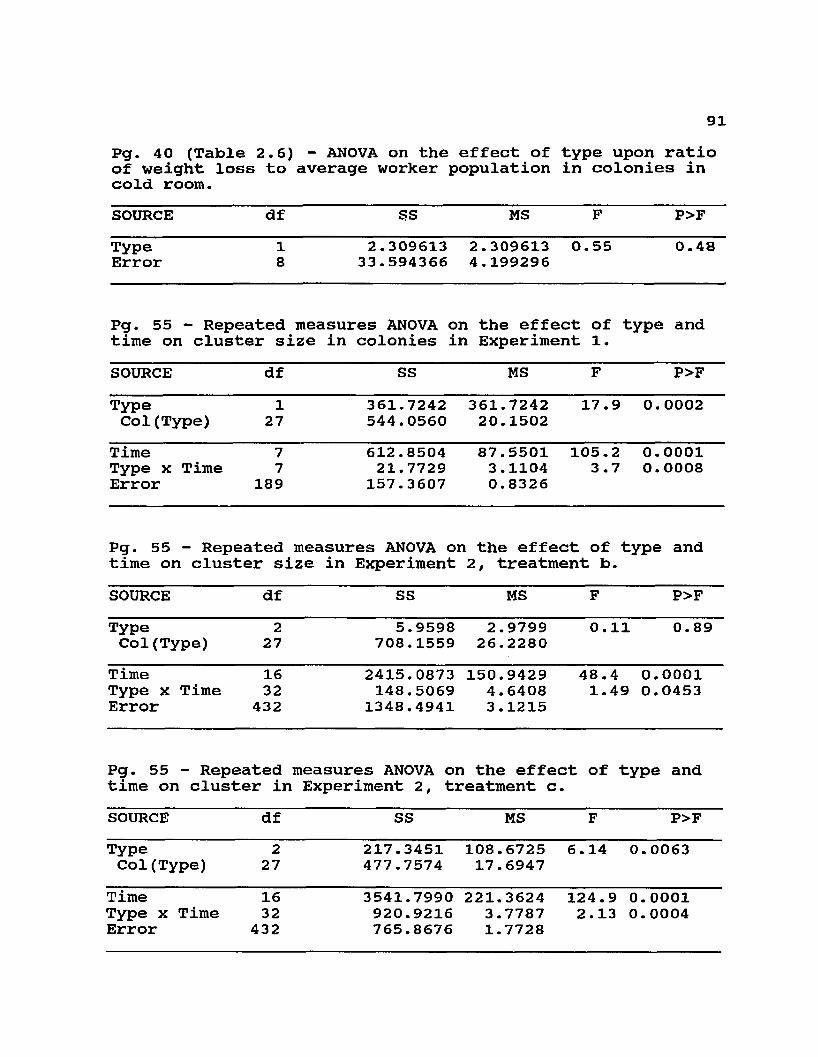
Pg. 40 (Table 2.6) - ANOVA on the effect of type upon ratioof weight loss to average worker population in colonies incold room.SOURCE df SS MS F P>FType 1 2.309613 2.309613 0.55 0.48Error 8 33.594366 4.199296
Pg. 55 — Repeated measures ANOVA on time on cluster size in colonies in
the effect of Experiment 1.
type and
SOURCE df SS MS F P>FType 1 361.7242 361.7242 17.9 0.0002Col(Type) 27 544.0560 20.1502
Time 7 612.8504 87.5501 105.2 0.0001Type x Time 7 21.7729 3.1104 3.7 0.0008Error 189 157.3607 0.8326
Pg. 55 - Repeated measures ANOVA on the effect of type and time on cluster size in Experiment 2, treatment b.SOURCE df SS MS F P>FType 2 5.9598 2.9799 0.11 0.89Col(Type) 27 708.1559 26.2280
Time 16 2415.0873 150.9429 48.4 0.0001Type x Time 32 148.5069 4.6408 1.49 0.0453Error 432 1348.4941 3.1215
Pg. 55 - Repeated time on cluster in
measures ANOVA on the effect of Experiment 2, treatment c.
type and
SOURCE df SS MS F P>FType 2 217.3451 108.6725 6.14 0.0063Col(Type) 27 477.7574 17.6947
Time 16 3541.7990 221.3624 124.9 0.0001Type x Time 32 920.9216 3.7787 2.13 0.0004Error 432 765.8676 1.7728
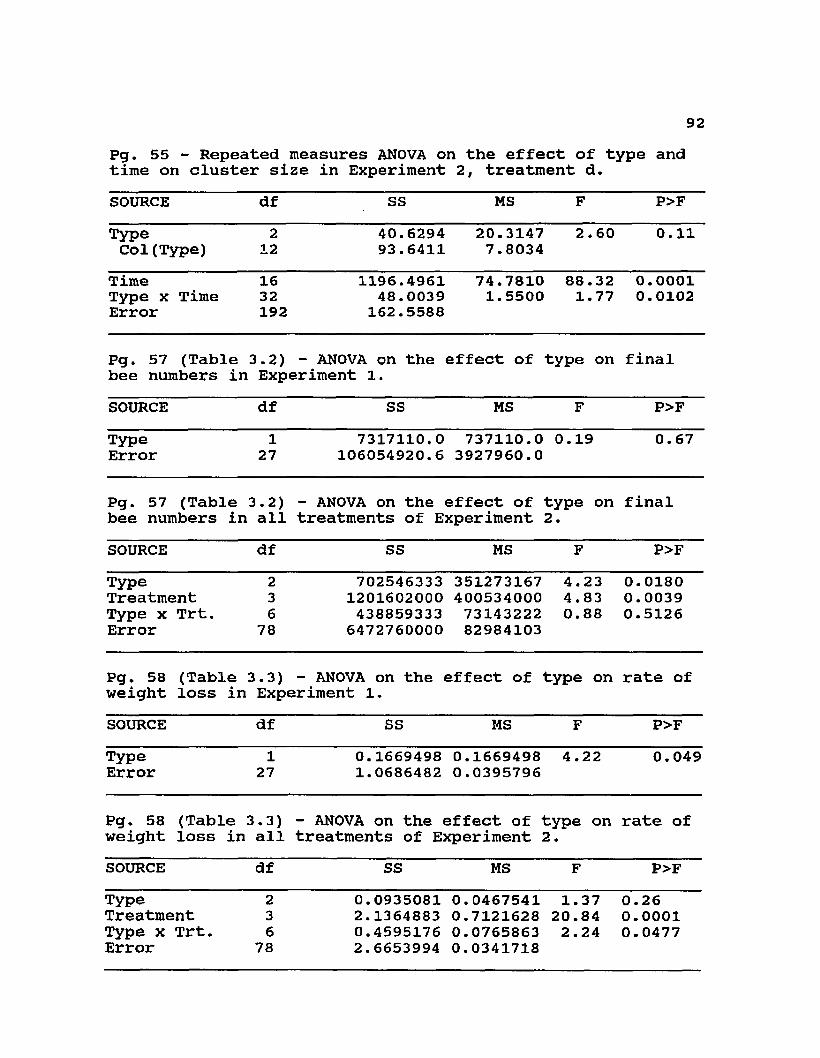
92Pg. 55 - Repeated measures ANOVA on the effect of type andtime on cluster size in Experiment 2, treatment d.SOURCE df SS MS F P>FType Col(Type)
212
40.6294 20.3147 2.60 93.6411 7.8034
0.11
Time Type x Error
Time1632192
1196.4961 74.7810 88.32 48.0039 1.5500 1.77
162.55880.00010.0102
Pg. 57 (Table bee numbers in
3.2) - ANOVA on the effect of type on i Experiment 1.
final
SOURCE df SS MS F P>FTypeError
127
7317110.0 737110.0 0.19 106054920.6 3927960.0
0.67
Pg. 57 (Table bee numbers in
3.2) - ANOVA on the effect of type on all treatments of Experiment 2.
final
SOURCE df SS MS F P>FTypeTreatment Type x Trt. Error
236
78
702546333 351273167 4.23 1201602000 400534000 4.83 438859333 73143222 0.88
6472760000 82984103
0.01800.00390.5126
Pg. 58 weight
(Table loss in
3.3) - ANOVA on the effect of type on Experiment 1.
rate of
SOURCE df SS MS F P>FTypeError
127
0.1669498 0.1669498 4.22 1.0686482 0.0395796
0.049
Pg. 58 weight
(Table loss in
3.3)all
- ANOVA on the effect of type on treatments of Experiment 2.
rate of
SOURCE df SS MS F P>FTypeTreatment Type x Trt. Error
236
78
0.0935081 0.0467541 1.37 2.1364883 0.7121628 20.84 0.4595176 0.0765863 2.24 2.6653994 0.0341718
0.260.00010.0477
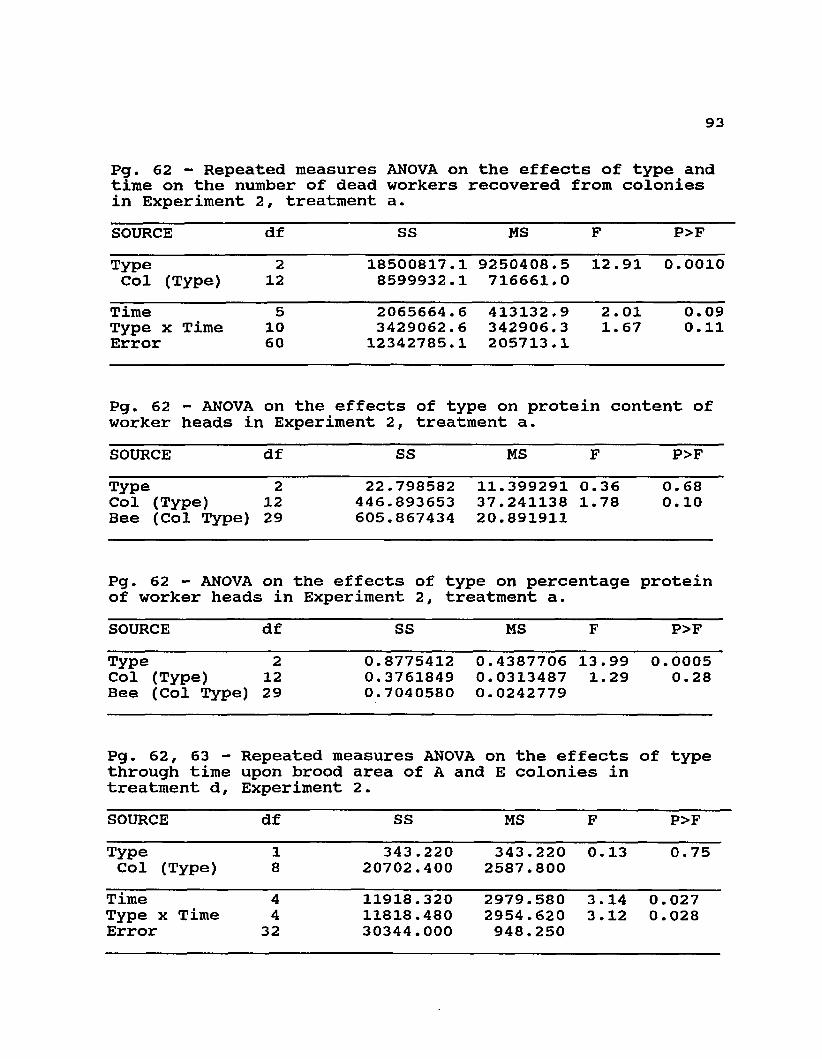
93
Pg. 62 - Repeated measures ANOVA on the effects of type andtime on the number of dead workers recovered from coloniesin Experiment 2, treatment a.SOURCE df SS MS F P>FType 2 18500817.1 9250408.5 12.91 0.0010Col (Type) 12 8599932.1 716661.0
Time 5 2065664.6 413132.9 2.01 0.09Type x Time 10 3429062.6 342906.3 1. 67 0.11Error 60 12342785.1 205713.1
Pg. 62 - ANOVA on the effects of type on protein content of worker heads in Experiment 2, treatment a.SOURCE df SS MS F P>FType 2 22.798582 11.399291 0.36 0. 68Col (Type) 12 446.893653 37.241138 1.78 0.10Bee (Col Type) 29 605.867434 20.891911
Pg. 62 - ANOVA on the effects of type on percentage protein of worker heads in Experiment 2, treatment a.SOURCE df SS MS F P>FType 2 0.8775412 0.4387706 13.99 0.0005Col (Type) 12 0.3761849 0.0313487 1.29 0.28Bee (Col Type) 29 0.7040580 0.0242779
Pg. 62, 63 - Repeated measures ANOVA on the effects of type through time upon brood area of A and E colonies in treatment d, Experiment 2.SOURCE df SS MS F P>FType 1 343 .220 343.220 0. 13 0. 75Col (Type) 8 20702.400 2587.800
Time 4 11918.320 2979.580 3.14 0.027Type x Time 4 11818.480 2954.620 3.12 0.028Error 32 30344.000 948.250
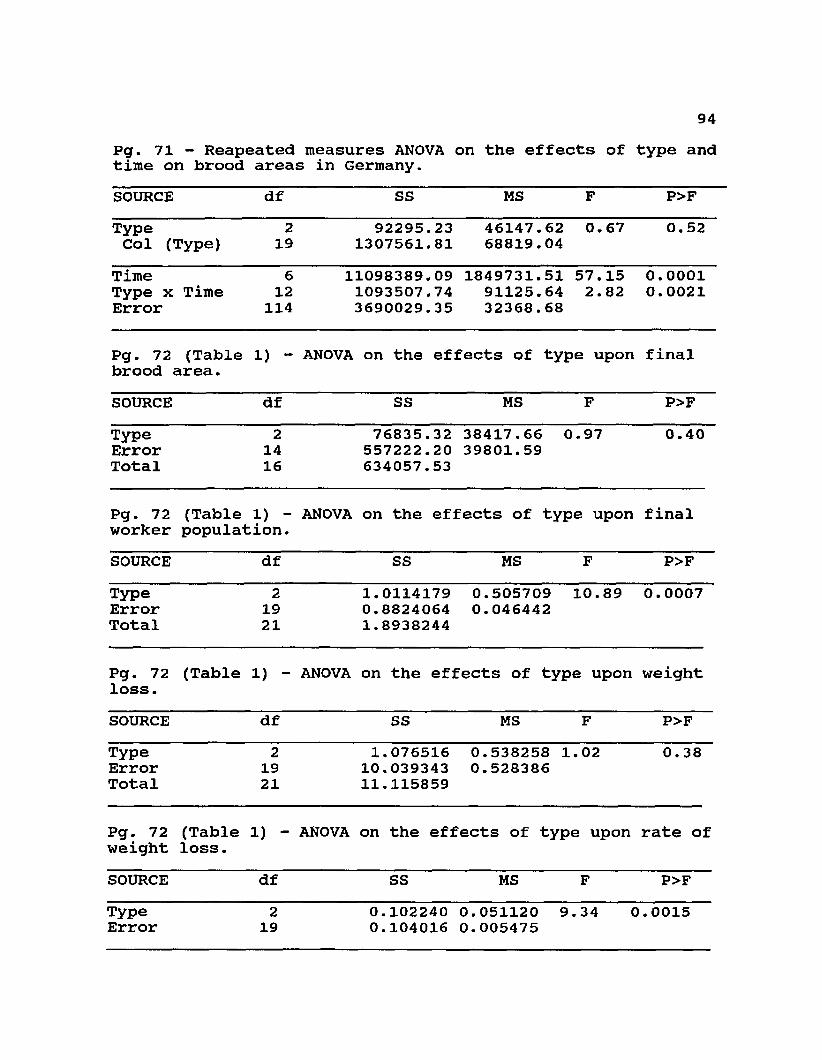
Pg. 71 - Reapeated measures ANOVA on the effects of type andtime on brood areas in Germany.SOURCE df SS MS F P>FType Col (Type)
219
92295.231307561.81
46147.62 0.67 68819.04
0.52
Time Type x Error
Time6
12114
11098389.091093507.743690029.35
1849731.51 57.15 91125.64 2.82 32368.68
0.00010.0021
Pg. 72 (Table brood area. 1) " ANOVA on the effects of type upon final
SOURCE df SS MS F P>FTypeErrorTotal
21416
76835.32557222.20634057.53
38417.66 0.97 39801.59
0.40
Pg. 72 worker
(Table 1) - population.
ANOVA on the effects of type upon final
SOURCE df SS MS F P>FTypeErrorTotal
21921
1.01141790.88240641.8938244
0.505709 10.89 0.046442
0.0007
Pg. 72 loss.
(Table 1) - ANOVA on the effects of type upon weight
SOURCE df SS MS F P>FTypeErrorTotal
21921
1.07651610.03934311.115859
0.538258 1.02 0.528386
0.38
Pg. 72 weight
(Tableloss. 1) " ANOVA on the effects of type upon rate of
SOURCE df SS MS F P>FTypeError
219
0.1022400.104016
0.051120 9.34 0 0.005475
.0015
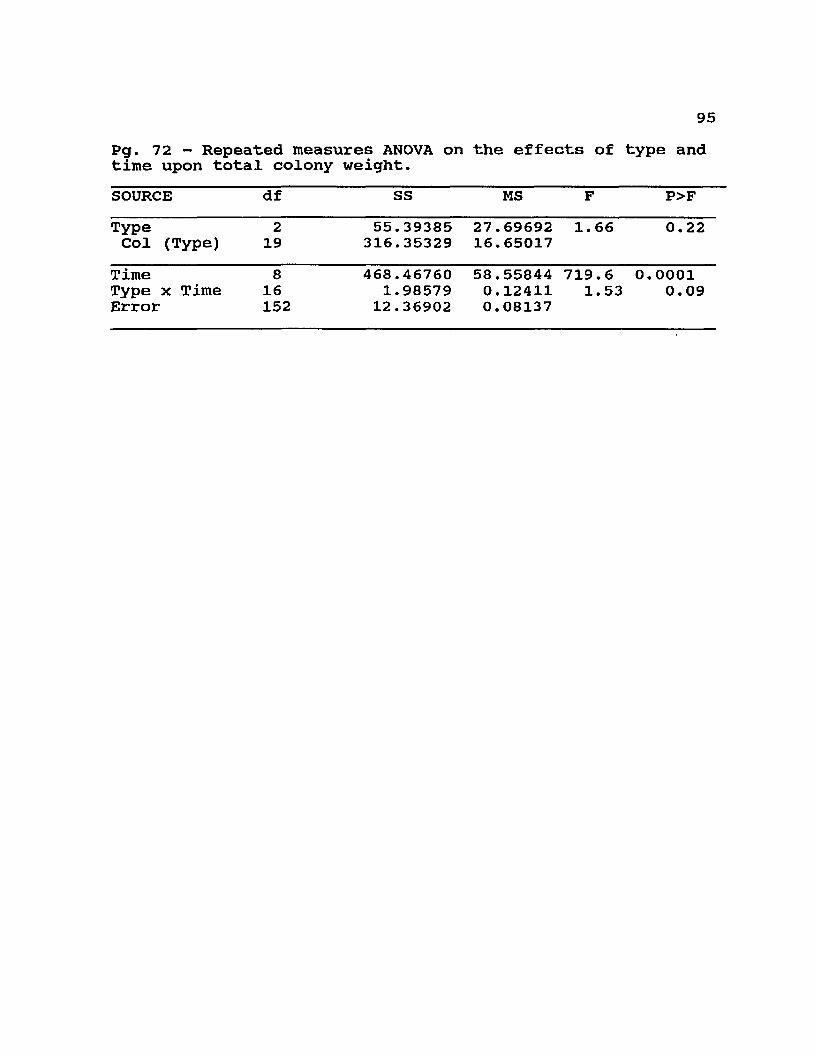
Pg. 72 - Repeated measures ANOVA on the effects of type andtime upon total colony weight.SOURCE df SS MS F P>FType 2 55.39385 27.69692 1. 66 0.22col (Type) 19 316.35329 16.65017
Time 8 468.46760 58.55844 719.6 0.0001Type x Time 16 1.98579 0.12411 1.53 0.09Error 152 12.36902 0.08137
VITAJos& D. Villa was born December 11, 1956 in Chicago. A
few months later he was taken home to Envigado, Colombia where he lived with his parents until the age of 21. He graduated from the Columbus School in Medellin in 1974 and attended the Universidad Nacional campus at Medellin for 6 semesters in Agronomy.
Through the purchase of some hives by his father, he became very interested in apiculture and in 1978, transfered to the University of Guelph, where he obtained a Bachelor of Science in Agriculture, with a major in Entomology- Apiculture. In 1981, he began a Masters program at the University of Kansas, taking courses while working as a teaching assistant in Introductory Biology. In 1982, he returned to Medellin, for data collection for his thesis. During this period he also participated in an apiculture research project at the Universidad Nacional and assisted several extension programs in beekeeping.
He returned to the United States in 1985 and joined the staff at the USDA, ARS Honey-Bee Breeding, Genetics & Physiology Research laboratory in Baton Rouge as part of a cooperative education Ph.D. program in Entomology at Lousiana State University. He participated in two research seasons in Venezuela, and took courses at Louisiana State University, until the middle of 1987. He then took a position as technical advisor to a joint program between the
USDA, APHIS and the Mexican Ministry of Agriculture intended to delay the arrival of Africanized honey bees to the United States. He returned to his graduate career at the beginning of 1989, and has continued research in the population dynamics of European honey bees in Louisiana.
Jos& is a member of the Entomological Society of America and Sigma Xi. He enjoys Renaissance and Baroque music, gardening, and hiking. He is interested in conservation of biodiversity, tropical ecology, and sustainable agriculture.
DOCTORAL EXAMINATION AND DISSERTATION REPORT
Candidate: J o se D. V i l la
Major Field: Entomology
Title of Dissertation: C om p arative o v e r w in te r in g c a p a b i l i t i e s o f A f r ic a n iz e d andEuropean h on ey b e e s
Approved:
Major Professor and Chairman
Dean of the Graduate School
EXAMINING COMMITTEE:
F~ CxSvKA
g XDate of Examination:
J u ly 3 1 , 1991