comparative performance of broiler chickens offered … sorghum...objectives using mixture design to...
TRANSCRIPT

Comparative performance of broiler chickens offered ten equivalent diets based on three grain sorghum varieties
as determined by response surface mixture design
Sonia Y Liu, Ha H Truong, Ali Khoddami, Amy F Moss, Peter C Thomson, Thomas H Roberts and Peter H Selle

Objectives
Using mixture design to generate response surfaces to interpret variations in performance of broilers offered nutritionally equivalent diets based on three different
sorghum grains

Experimental diets
• Three characterised sorghum (Block I,
Liberty and HP) with different protein, kafirin and phytate contents were used to formulate three nutritionally equivalent basal diets
• Through 3.2 mm hammer-mill screen • Steam-pelleted at a conditioning
temperature of 80°C • Following steam-pelleting, the three
basal diets were proportionally mixed to form ten dietary treatments
HP (0,0,100)
(0, 50, 50)
(50, 0, 50)
Block I
(100, 0, 0)
Liberty
(0, 100, 0)
(50, 50, 0)
(33.3, 33.3, 33.3)
(16.7, 16.7, 66.6) (16.7, 66.6, 16.7)
(66.6, 16.7, 16.7)
0
10
20
30
40
50
60
70
80
90
0 20 40 60 80 100

• 6 replicates (6 birds per cage) of 360 male Ross 308 chicks • 7 to 28 days post-hatch • Total excreta collected from day 25-27 post-hatch • Differences were considered significant at P < 0.05 by using
the JMP® 9.0.0 (SAS Institute Inc. JMP Software, Cary, NC). Response surface and contour plots are generated by R 3.0.3.
Bird management

Dietary effects on weight gain (P = 0.139)
1387
1431
1409 1421 1420
1441
1359
1432 1432
1392
1 2 3 4 5 6 7 8 9 10 Treatment 1A 2B 3C 4D 5E 6F 7G 8H 9I 10J Block I (%) 100 0 0 50 50 0 66.6 16.7 16.7 33.3 HP (%) 0 100 0 50 0 50 16.7 66.6 16.7 33.3 Liberty (%) 0 0 100 0 50 50 16.7 16.7 66.6 33.3

The predicted optimal weight gain 1439 g/bird was achieved when the proportions of diets based on Block I, HP and Liberty were equal to 0.0%, 79.2% and 20.8%, respectively.

Dietary effects on FCR (P = 0.142)
1.660
1.631
1.663 1.664
1.650
1.608
1.647
1.615 1.606
1.626
1 2 3 4 5 6 7 8 9 10 Treatment 1A 2B 3C 4D 5E 6F 7G 8H 9I 10J Block I (%) 100 0 0 50 50 0 66.6 16.7 16.7 33.3 HP (%) 0 100 0 50 0 50 16.7 66.6 16.7 33.3 Liberty (%) 0 0 100 0 50 50 16.7 16.7 66.6 33.3

The predicted optimal FCR 1.486 g/g was achieved when the proportions of diets based on Block I, HP and Liberty equal to 0.0%, 55.6% and 44.4%, respectively.

Dietary effects on AMEn (P = 0.158)
11.87 11.85
12.14
11.81
12.00
12.20
12.05 12.03
12.14
11.90
1 2 3 4 5 6 7 8 9 10 Treatment 1A 2B 3C 4D 5E 6F 7G 8H 9I 10J Block I (%) 100 0 0 50 50 0 66.6 16.7 16.7 33.3 HP (%) 0 100 0 50 0 50 16.7 66.6 16.7 33.3 Liberty (%) 0 0 100 0 50 50 16.7 16.7 66.6 33.3

The predicted optimal AMEn 12.38 MJ/kg was achieved when the proportions of diets based on Block I, HP and Liberty equal to 0.0%, 32.0% and 68.0%, respectively.

Dietary effects on ME:GE ratios (P = 0.029)
0.800a 0.800a
0.827c
0.802a
0.814abc
0.832c
0.807ab
0.816abc
0.823abc
0.811abc
1 2 3 4 5 6 7 8 9 10 Treatment 1A 2B 3C 4D 5E 6F 7G 8H 9I 10J Block I (%) 100 0 0 50 50 0 66.6 16.7 16.7 33.3 HP (%) 0 100 0 50 0 50 16.7 66.6 16.7 33.3 Liberty (%) 0 0 100 0 50 50 16.7 16.7 66.6 33.3
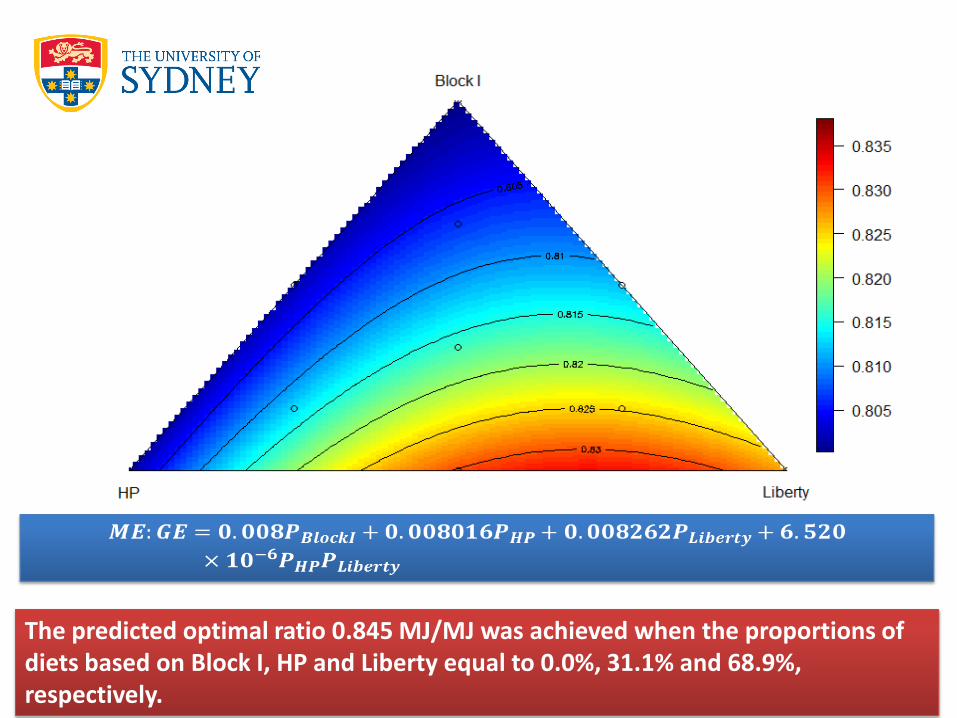
The predicted optimal ratio 0.845 MJ/MJ was achieved when the proportions of diets based on Block I, HP and Liberty equal to 0.0%, 31.1% and 68.9%, respectively.

Distal ileal protein digestibility = 0.00618𝑃𝐵𝑙𝑜𝑐𝑘𝐼 + 0.00691𝑃𝐻𝑃 + 0.00651𝑃𝐿𝑖𝑏𝑒𝑟𝑡𝑦
The predicted optimal distal ileal protein digestibility of 0.691 will be achieved when the diet contain 100% sorghum HP.

In contrast, the relationship between starch digestibility and the proportions of the three basal diets may be predicted by the following equation:
Distal ileal starch digestibility = 0.00887𝑃𝐵𝑙𝑜𝑐𝑘𝐼 + 0.00883𝑃𝐻𝑃 + 0.00894𝑃𝐿𝑖𝑏𝑒𝑟𝑡𝑦
The predicted optimal distal ileal protein digestibility of 0.894 will be achieved when the
diet contain 100% sorghum Liberty.

Nutrient concentrations in three sorghums

Kafirin Phenols Phytate ME:GE AMEn
Kafirin
Phenols
Phytate
ME:GE
AMEn
1.000
r = 0.999
P < 0.001
r = 0.965
P < 0.001
r = -0.796
P = 0.006
r= -0.658
P = 0.039
1.000
r = 0.951
P < 0.001
r = -0.776
P = 0.008
r= -0.633
P = 0.049
1.000
r = -0.863
P = 0.001
r= -0.744
P = 0.014
1.000
r = -0.920
P < 0.001
1.000

Conclusions
• Optimal growth performance and nutrient utilisation in broiler chickens can be predicted by contour plot biometrics
• The predicted optimal FCR 1.486 g/g was achieved when the proportions of diets based on Block I, HP and Liberty equal to 0.0%, 55.6% and 44.4%, respectively.

Acknowledgements