comparative protein structure modeling · 2005-04-12 · comparative protein structure modeling 833...
TRANSCRIPT

Comparative Protein Structure Modeling 831
831
From: The Proteomics Protocols HandbookEdited by: J. M. Walker © Humana Press Inc., Totowa, NJ
66
Comparative Protein Structure Modeling
M. S. Madhusudhan, Marc A. Marti-Renom, Narayanan Eswar, BinoJohn, Ursula Pieper, Rachel Karchin, Min-Yi Shen, and Andrej Sali
1. Introduction
Three-dimensional protein structures are invaluable sources of information for thefunctional annotation of protein molecules. These structures are best determined byexperimental methods such as X-ray crystallography and nuclear magnetic resonance(NMR) spectroscopy. However, the experimental methods cannot always be applied.In such cases, prediction of the protein structure by computational methods canfrequently result in a useful model.
Protein structures can be modeled either ab initio from sequence alone or bycomparative methods that rely on a database of known protein structures (1,2). Abinitio methods are largely based on the laws of physics, while comparative methods,including comparative (or homology) modeling and threading, are based primarily onstatistical learning. Although there have been significant improvements in the ab initio(3) and threading methods (4), comparative modeling gives the most accurate results ifa known protein structure that is sufficiently similar to the modeled sequence is avail-able (1).
To predict protein structure by comparative modeling, two conditions have to bemet (5,6). First, the sequence to be modeled (i.e., the target sequence) must havedetectable similarity to another sequence of known structure (i.e., the template).Second, it must be possible to compute an accurate alignment between the targetsequence and the template structure. The whole prediction process consists of foldassignment, target–template alignment, model building, and model evaluation (Fig. 1).
A simple predictor of the overall model accuracy is the degree of sequence similar-ity between the target and the template (Fig. 2). The higher is the sequence similarity tothe template, the more accurate is the model. Although high-accuracy models are mostinformative, low-accuracy models may also provide coarse structural and functionalannotation (Fig. 3) (1).
Comparative models can currently be built for domains in approx 57% of the approx1.5 million protein sequences in the TrEMBL database (7). However, approximatelytwo-thirds of the models are likely to contain significant errors because they are basedon less than 30% sequence identity to the closest known protein structure. The primarysources of geometrical errors in the final models based on less than 30% sequenceidentity are the mistakes in the target–template alignment. Other errors include incor-

832 Madhusudhan et al.
Fig. 1. A flow chart of the steps involved in comparative protein structure modeling.
rect fold assignments as well as incorrect modeling of loops, correctly aligned coresegments, and side chains. No current modeling program can generally recover froman incorrect starting alignment. Therefore, one of the priorities for methods developersis to improve the accuracy of sequence-structure alignment and/or to minimize thedependence of the modeling methods on the input sequence-structure alignment.
The importance of comparative modeling derives partly from its role in structuralgenomics (8–10). Structural genomics aims to structurally characterize most proteinsequences by an efficient combination of experiment and prediction (9,11–14). Thisaim will be achieved by careful selection of target proteins and their structure determi-nation by X-ray crystallography or NMR spectroscopy. There are a variety of targetselection schemes (15), ranging from focusing on only novel folds to selecting all pro-teins in a model genome. A model-centric view requires that targets be selected suchthat most of the remaining sequences can be modeled with useful accuracy by com-parative modeling. Even with structural genomics, the structure of most of the proteinswill be modeled, not determined by experiment. As mentioned above, the accuracy ofcomparative models and correspondingly the variety of their applications decreasesharply below the 30% sequence-identity cutoff, mainly as a result of a rapid increasein alignment errors. Thus, structural genomics should determine protein structures suchthat most of the remaining sequences are related to at least one known structure at

Comparative Protein Structure Modeling 833
Fig. 2. Average accuracy of models calculated by ModPipe (218) with respect to the per-centage sequence identity to the template. The average overlap of the experimentally deter-mined protein structure with its calculated model (lower dashed line) and with the template onwhich the model was based (upper dashed line) are shown as a function of the target–templatesequence identity. This sequence identity is calculated from the modeling alignment. The struc-ture overlap is defined as the fraction of the equivalent Cα atoms after rigid superimposition ofthe two structures. Two Cα atoms are considered equivalent if they are within 3.5Å of eachother. The points in the curves correspond to the median values, and the error bars in the posi-tive and negative directions correspond to the average positive and negative differences fromthe median, respectively. The shaded area between the two curves corresponds approximatelyto the model error that arises from the alignment error.
higher than 30% sequence identity (15,16). It was estimated that this cutoff requires aminimum of 16,000 targets to cover 90% of all protein domain families, includingthose of membrane proteins (16). These 16,000 structures will allow the modeling of avery much larger number of proteins. For example, New York Structural GenomicsResearch Consortium measured the impact of its structures by documenting the num-ber and accuracy of the corresponding models for detectably related proteins in thenon-redundant sequence database. For each new structure, on the average approx 100protein sequences without any prior structural characterization could be modeled atleast at the fold level (http://www.nysgxrc.org/). This large leverage of structure deter-mination by protein structure modeling illustrates and justifies the premise of struc-tural genomics.
This chapter describes methods and computer programs used in all the steps of com-parative modeling (Table 1). We conclude by reviewing several sample applications ofthe models.

834 Madhusudhan et al.
Fig. 3. Accuracy and applications of protein structure models. The vertical axis indicates thedifferent ranges of applicability of comparative protein structure modeling, the correspondingaccuracy of protein structure models, and their sample applications. (A) The docosahexaenoicfatty acid ligand was docked into a high accuracy comparative model of brain lipid-bindingprotein (right), modeled based on its 62% sequence identity to the crystallographic structure ofadipocyte lipid-binding protein (PDB code 1adl). A number of fatty acids were ranked for theiraffinity to brain lipid-binding protein consistently with site-directed mutagenesis and affinitychromatography experiments (194), even though the ligand specificity profile of this protein isdifferent from that of the template structure (left). (B) A putative proteoglycan binding patchwas identified on a medium accuracy comparative model of mouse mast cell protease 7 (right),modeled based on its 39% sequence identity to the crystallographic structure of bovine pancre-atic trypsin (2ptn) that does not bind proteoglycans. The prediction was confirmed by site-directed mutagenesis and heparin-affinity chromatography experiments (193). Typical accuracyof a comparative model in this range of sequence similarity is indicated by a comparison of atrypsin model with the actual structure. (C) A molecular model of the whole yeast ribosome(right) was calculated by fitting atomic rRNA and protein models into the electron density ofthe 80S ribosomal particle, obtained by electron microscopy at 15Å resolution (229). Most ofthe models for 40 out of the 75 ribosomal proteins were based on template structures that wereapprox 30% sequentially identical. Typical accuracy of a comparative model in this range ofsequence similarity is indicated by a comparison of a model for a domain in L2 Protein fromBacillus Stearothermophilus with the actual structure (1rl2).

Comparative Protein Structure Modeling 835
Table 1Programs and Web Servers Useful in Comparative Protein Structure Modeling
Name World-Wide Web addressb Referencec
Databases
BALIBASE http://www-igbmc.u-strasbg.fr/BioInfo/BAliBASE/ 196CATH http://www.biochem.ucl.ac.uk/bsm/cath/ 197GENBANK http://www.ncbi.nlm.nih.gov/Genbank/ 198GENECENSUS http://bioinfo.mbb.yale.edu/genome/ 199MODBASE http://www.salilab.org/modbase/ 7PDB http://www.pdb.org 200PRESAGE http://presage.berkeley.edu 201SCOP http://scop.mrc-lmb.cam.ac.uk/scop/ 202SWISSPROT-TREMBL http://www.expasy.org 203
Template search
123D http://123d.ncifcrf.gov/ 2043D PSSM http://www.sbg.bio.ic.ac.uk/~3dpssm 77BLAST http://www.ncbi.nlm.nih.gov/BLAST/ 22DALI http://www2.ebi.ac.uk/dali/ 19FASTA http://www.ebi.ac.uk/fasta33/ 23MATCHMAKER http://bioinformatics.burnham-inst.org 205PREDICTPROTEIN http://cubic.bioc.columbia.edu/predictprotein/ 206PROFIT http://www.bioinfo.org.uk/software 207THREADER http://bioinf.cs.ucl.ac.uk/threader/threader.html 70UCLA-DOE FOLD SERVER http://fold.doe-mbi.ucla.edu 208SUPERFAMILY http://supfam.mrc-lmb.cam.ac.uk/SUPERFAMILY/ 209
Target–template alignment
BCM SERVERF http://searchlauncher.bcm.tmc.edu 210BLAST2 http://www.ncbi.nlm.nih.gov/blast/bl2seq/bl2.html 211BLOCK MAKERF http://blocks.fhcrc.org/ 212CLUSTALW http://www2.ebi.ac.uk/clustalw/ 62MULTALIN http://prodes.toulouse.inra.fr/multalin/ 213SEA http://ffas.ljcrf.edu/sea/ 214FFAS03 http://ffas.ljcrf.edu/ 26,64SAM-T02 http://www.soe.ucsc.edu/research/compbio/ 215
HMM-apps/FUGUE http://www-cryst.bioc.cam.ac.uk/fugue 75TCOFFEE http://www.ch.embnet.org/software/TCoffee.html 216COMPASS ftp://iole.swmed.edu/pub/compass/ 27MUSCLE http://www.drive5.com/muscle 217SALIGN http://www.salilab.org/modeller 218USC SEQALN http://www-hto.usc.edu/software/seqaln 219
Modeling
COMPOSER http://www.tripos.com/sciTech/inSilicoDisc/ 87CONGEN http://www.congenomics.com/congen/congen_toc.html 94ICM http://www.molsoft.com/bioinfomatics/ a220DISCOVERY STUDIO http://www.accelrys.com/composer.html b
(continued)
836 Madhusudhan et al.
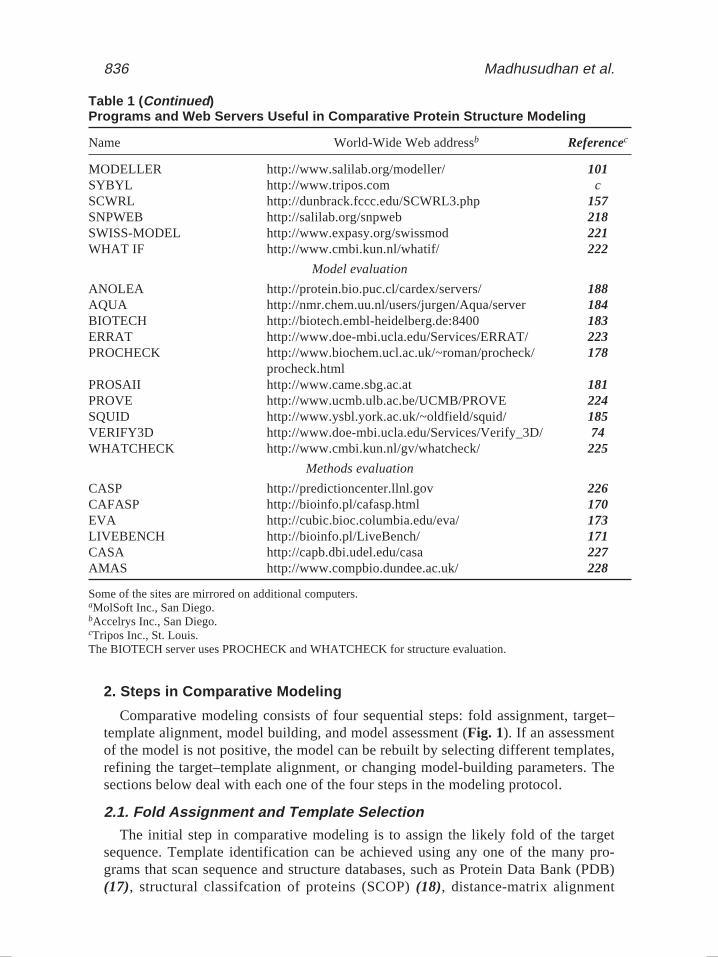
Table 1 (Continued)Programs and Web Servers Useful in Comparative Protein Structure Modeling
Name World-Wide Web addressb Referencec
MODELLER http://www.salilab.org/modeller/ 101SYBYL http://www.tripos.com cSCWRL http://dunbrack.fccc.edu/SCWRL3.php 157SNPWEB http://salilab.org/snpweb 218SWISS-MODEL http://www.expasy.org/swissmod 221WHAT IF http://www.cmbi.kun.nl/whatif/ 222
Model evaluation
ANOLEA http://protein.bio.puc.cl/cardex/servers/ 188AQUA http://nmr.chem.uu.nl/users/jurgen/Aqua/server 184BIOTECH http://biotech.embl-heidelberg.de:8400 183ERRAT http://www.doe-mbi.ucla.edu/Services/ERRAT/ 223PROCHECK http://www.biochem.ucl.ac.uk/~roman/procheck/ 178
procheck.htmlPROSAII http://www.came.sbg.ac.at 181PROVE http://www.ucmb.ulb.ac.be/UCMB/PROVE 224SQUID http://www.ysbl.york.ac.uk/~oldfield/squid/ 185VERIFY3D http://www.doe-mbi.ucla.edu/Services/Verify_3D/ 74WHATCHECK http://www.cmbi.kun.nl/gv/whatcheck/ 225
Methods evaluation
CASP http://predictioncenter.llnl.gov 226CAFASP http://bioinfo.pl/cafasp.html 170EVA http://cubic.bioc.columbia.edu/eva/ 173LIVEBENCH http://bioinfo.pl/LiveBench/ 171CASA http://capb.dbi.udel.edu/casa 227AMAS http://www.compbio.dundee.ac.uk/ 228
Some of the sites are mirrored on additional computers.aMolSoft Inc., San Diego.bAccelrys Inc., San Diego.cTripos Inc., St. Louis.The BIOTECH server uses PROCHECK and WHATCHECK for structure evaluation.
2. Steps in Comparative Modeling
Comparative modeling consists of four sequential steps: fold assignment, target–template alignment, model building, and model assessment (Fig. 1). If an assessmentof the model is not positive, the model can be rebuilt by selecting different templates,refining the target–template alignment, or changing model-building parameters. Thesections below deal with each one of the four steps in the modeling protocol.
2.1. Fold Assignment and Template Selection
The initial step in comparative modeling is to assign the likely fold of the targetsequence. Template identification can be achieved using any one of the many pro-grams that scan sequence and structure databases, such as Protein Data Bank (PDB)(17), structural classifcation of proteins (SCOP) (18), distance-matrix alignment

Comparative Protein Structure Modeling 837
(DALI) (19), and Class, Architecture, Topology, and Homology (CATH) (20,21)(Table 1). Template search methods can be categorized into three different classes:
First, pairwise comparison methods, which include the popular programs BasicLocal Alignment Search Tool (BLAST) (22) and FASTA (23), align the target sequencewith all the sequences in the database of known structures. The performance and effi-ciency of this class of methods has been studied extensively (24). Second, sequenceprofile methods, such as position specific iterative (PSI)-BLAST (25) and HMMER(http://hmmer.wustl.edu), rely on profiles derived from multiple sequence alignmentsto increase the sensitivity and accuracy of the template search. The profile enhancesthe sensitivity of the search (26–29). Profiles are also utilized by the intermediatesequence search algorithms that establish a homology between two remotely relatedsequences through an intermediary sequence (30–36). Third, the so-called threadingmethods use a combination of sequence and structure considerations to detect similari-ties between sequences and structures (37–41). In these methods, the target sequence isthreaded through a library of 3-D profiles or folds, and each threading is assessed basedon a certain scoring function. Commonly used methods and servers in this categoryinclude Superfamily (42) and GenThreader (43). The threading methods are moreeffective in detecting homology at low sequence similarity than the methods relying onsequence information alone (44).
The three different classes of methods are best suited for identifying templates indifferent regimes of the sequence-identity spectrum. The pairwise sequence compari-son methods are the least sensitive and are best used to detect close homologs. Theprofile-based methods are usually capable of recognizing homologs sharing onlyapprox 25% sequence identity. Threading methods can sometimes recognize commonfolds even in the absence of any statistically significant sequence similarity. Becausemost of the fold assignment methods involve sequence alignment, some of them arediscussed in more detail in the following section about sequence-structure alignment.
While a correct fold assignment can be used to build a useful model, an incorrectfold assignment renders the resulting model useless. Thus, when using a fold-recogni-tion method, it is crucial to be aware of the accuracy of the method. In an assessment ofdifferent fold-recognition methods, the best method detected 75% of the closest struc-tures correctly for a set of sequences related at the “family” level in the SCOP database(18). However, at the superfamily and fold levels, the accuracy dropped to 29 and 15%,respectively (44).
Once a list of all related protein structures is obtained, templates that are appropriatefor the given modeling problem have to be selected. Usually, a higher overall sequenceidentity between the target and the template sequence yields a better template. Severalother factors should also be considered in selecting templates.
Constructing a phylogenetic tree for the whole family can frequently help in select-ing a template from the subfamily that is closest in structure to the target sequence.Databases of structure-based phylogenies, such as the database of Phylogeny and Align-ment (PALI) (45), are useful in making a distinction between the sequence and struc-ture similarity, which can be a key consideration for template identification.
Accuracy of the template structure is another important factor in template selection.The resolution and the R-factor of a crystallographic structure and the number ofrestraints per residue for an NMR structure are indicative of structure accuracy.
838 Madhusudhan et al.
It is also crucial to compare the environment of the template to the required environ-ment for the model. The term environment is used in a broad sense and includes allfactors that determine protein structure, except its sequence (e.g., solvent, pH, ligands,and quaternary interactions). For example, if the objective of the model-building exer-cise is to dock ligands in the model, it is usually best to use a template that is itselfbound to an identical or similar ligand. In general, prior biological information aboutthe target sequence can be valuable in identifying an appropriate template (46,47).
Prioritization of the criteria for template selection depends on the purpose of thecomparative model. For instance, if a protein–ligand model is to be constructed, thechoice of the template that contains a similar ligand is probably more important thanthe resolution of the template. On the other hand, if a model is to be used to analyze thegeometry of the active site of an enzyme, it is preferable to use a high-resolution tem-plate. It is not necessary to select only one template. In fact, the use of several tem-plates approximately equidistant from the target sequence generally increases the modelaccuracy (48,49).
2.2. Target–Template Alignment
After identifying the template(s), the next crucial step in comparative modeling is toaccurately align the target sequence to the template(s). Although most template-recog-nition methods produce a target–template alignment, there is frequently a need to use aspecialized alignment method to realign the sequences because the template-identifica-tion step is often optimized to identify distant relationships, sometimes at the expenseof alignment accuracy. The sequence-structure alignment is a vital step in the model-building process, and an erroneous alignment will almost certainly lead to the con-struction of an incorrect model.
An alignment between two sequences of residues is usually calculated by optimiz-ing an alignment scoring function (50). The two common ingredients of the scoringfunction are a gap penalty function and a matrix of substitution scores for matchingevery residue in one sequence to every residue in the other sequence. The alignmentscore is usually a sum of the gap penalties, which depend linearly on the gap lengths,and the pairwise substitution scores, which depend on the matched residue types. Theoriginal and still widely used optimization method for sequence alignment is based ondynamic programming (51–53). Since its inception, the scoring function and its opti-mization by dynamic programming have been improved for alignment accuracy andspeed, and applied to a variety of alignment problems.
In the next few paragraphs, we examine different methods to obtain substitutionscore matrices and gap penalties that optimize the accuracy of the output alignments.We examine the use of information from related multiple sequences and structures toenhance alignment accuracy and coverage, especially when target–template sequenceidentity decreases below 30%.
2.2.1. Using Multiple Sequence Information
The accuracy of a pairwise alignment method that uses dynamic programminggreatly depends on the matrix of substitution scores and the gap penalties. Matriceswith values for each of the possible residue type substitutions, such as Block Substitu-tion Matrix (BLOSUM) (54) and point accepted mutation (PAM) (55), are useful onlywhen sequence similarity is readily recognizable (e.g., above 30% sequence identity).

Comparative Protein Structure Modeling 839
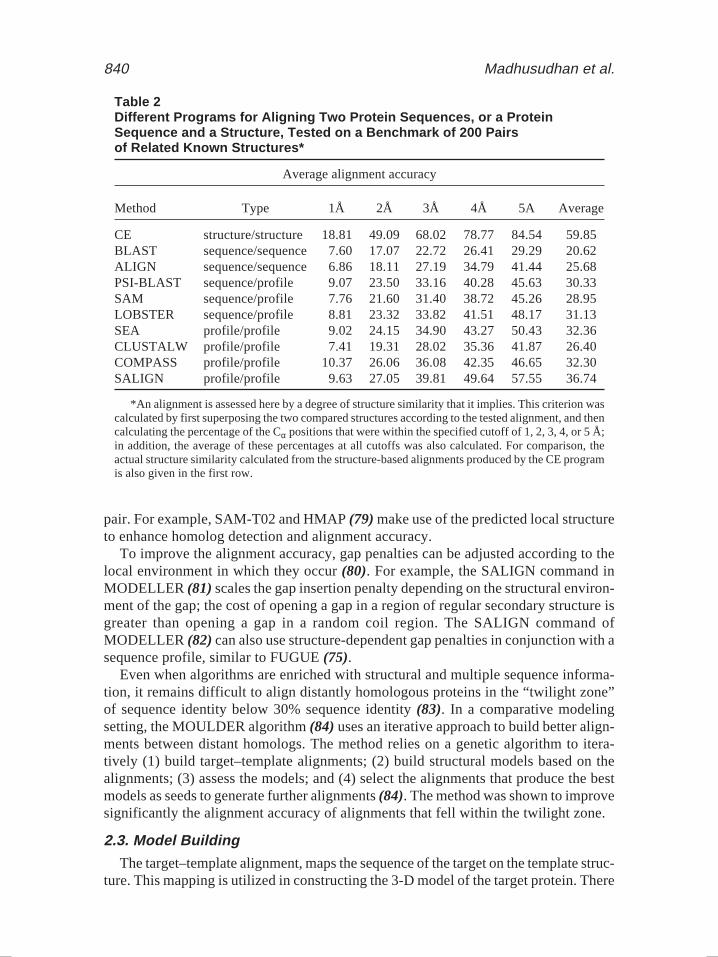
To increase the accuracy of the alignment between more divergent sequences, somemethods construct the substitution scores by relying on substitution patterns revealedin a multiple sequence alignment (MSA) of many members of the corresponding pro-tein family. A multiple sequence alignment is converted into a sequence profile thatlists the likelihood of the 20 standard amino acid residue types at every position in agiven MSA. Alignments based on sequence profiles rather than single sequences havebeen shown to be significantly more accurate (56–58) (Table 2). This improvement isreflected in the accuracy and extent of the resulting homology models.
Two popular profile alignment methods are PSI-BLAST (25) and SAM-T98 (59).Both methods take a single sequence as input and produce a sequence profile or ahidden Markov model (HMM) as output. PSI-BLAST relies on the BLAST algorithm(22) to collect homologs of a query sequence and to construct its profile by iterativelyscanning a sequence database (25,32). SAM-T98 first uses BLAST to prefilter a largesequence database. It then constructs a multiple alignment and a HMM in parallelthrough several rounds of database searching and HMM building. The HMM is derivedonly from the sequences that score better than a specified threshold.
The latest generation of alignment methods extends sequence profile or MSA build-ing to both sequences of interest, and aligns the two profiles or MSAs, rather than theindividual sequences. These methods have been shown to be more sensitive thansequence-profile methods (26–28,60). The CLUSTALW program compares two MSAsby using a substitution matrix for all pairs of positions from the two alignments (61,62);each single value in this matrix is an average of residue-residue substitution scoresover two matched alignment positions. The LAMA program aligns two MSAs by firsttransforming them into position-specific scoring matrices (PSSMs) and then compar-ing the two PSSMs to each other by the Pearson correlation coefficient (63). The FFASprogram aligns two sequence profiles with each other using a dot product (26,64). Arelated approach, using mutual entropy, has been used by Yona and Levitt (65,66) toconstruct the ProtoMap database of protein sequence families (66–68). Most recently,the COMPASS program was developed to locally align two MSAs with assessment ofstatistical significance (27). The SALIGN command in the program MODELLER con-structs a scoring matrix by comparing two profiles with mutual entropy and correlationcoefficient measures (60). These methods compare two profiles by matching everyposition in one profile to each position in the other profile, followed by either local orglobal dynamic programming to calculate the optimal alignment.
2.2.2. Using Structural Information
Alignment accuracy can be significantly improved by incorporating informationabout protein structure. Threading and 3-D template-matching methods consider pro-tein structure information for one of the sequences in a pairwise comparison (69–71).For a review of this class of methods, see (38–41,72). A combination of threading andsequence alignment scoring functions can also be used (43,73).
Another approach is to incorporate structural information into profile methods, bymaking substitution scores dependent on solvent exposure, secondary structure type,hydrogen bonding properties, and so on (74). Some methods in this category areFUGUE (75), 3D-PSSM (76,77), and SAM-T02 multitrack HMMs (78). These meth-ods lie between traditional sequence-based algorithms and threading methods. The useof structural data is not restricted to the structure side of the aligned sequence-structure
840 Madhusudhan et al.
Table 2Different Programs for Aligning Two Protein Sequences, or a ProteinSequence and a Structure, Tested on a Benchmark of 200 Pairsof Related Known Structures*
Average alignment accuracy
Method Type 1Å 2Å 3Å 4Å 5A Average
CE structure/structure 18.81 49.09 68.02 78.77 84.54 59.85BLAST sequence/sequence 7.60 17.07 22.72 26.41 29.29 20.62ALIGN sequence/sequence 6.86 18.11 27.19 34.79 41.44 25.68PSI-BLAST sequence/profile 9.07 23.50 33.16 40.28 45.63 30.33SAM sequence/profile 7.76 21.60 31.40 38.72 45.26 28.95LOBSTER sequence/profile 8.81 23.32 33.82 41.51 48.17 31.13SEA profile/profile 9.02 24.15 34.90 43.27 50.43 32.36CLUSTALW profile/profile 7.41 19.31 28.02 35.36 41.87 26.40COMPASS profile/profile 10.37 26.06 36.08 42.35 46.65 32.30SALIGN profile/profile 9.63 27.05 39.81 49.64 57.55 36.74
*An alignment is assessed here by a degree of structure similarity that it implies. This criterion wascalculated by first superposing the two compared structures according to the tested alignment, and thencalculating the percentage of the Cα positions that were within the specified cutoff of 1, 2, 3, 4, or 5 Å;in addition, the average of these percentages at all cutoffs was also calculated. For comparison, theactual structure similarity calculated from the structure-based alignments produced by the CE programis also given in the first row.
pair. For example, SAM-T02 and HMAP (79) make use of the predicted local structureto enhance homolog detection and alignment accuracy.
To improve the alignment accuracy, gap penalties can be adjusted according to thelocal environment in which they occur (80). For example, the SALIGN command inMODELLER (81) scales the gap insertion penalty depending on the structural environ-ment of the gap; the cost of opening a gap in a region of regular secondary structure isgreater than opening a gap in a random coil region. The SALIGN command ofMODELLER (82) can also use structure-dependent gap penalties in conjunction with asequence profile, similar to FUGUE (75).
Even when algorithms are enriched with structural and multiple sequence informa-tion, it remains difficult to align distantly homologous proteins in the “twilight zone”of sequence identity below 30% sequence identity (83). In a comparative modelingsetting, the MOULDER algorithm (84) uses an iterative approach to build better align-ments between distant homologs. The method relies on a genetic algorithm to itera-tively (1) build target–template alignments; (2) build structural models based on thealignments; (3) assess the models; and (4) select the alignments that produce the bestmodels as seeds to generate further alignments (84). The method was shown to improvesignificantly the alignment accuracy of alignments that fell within the twilight zone.
2.3. Model Building
The target–template alignment, maps the sequence of the target on the template struc-ture. This mapping is utilized in constructing the 3-D model of the target protein. There
Comparative Protein Structure Modeling 841
are several methods of constructing the model, and some of these approaches arereviewed below. The various model-building procedures lead to the construction ofmodels of similar accuracy when used optimally (85). In addition to the differentschemes for building whole models, this review also examines techniques for con-structing inserted loop segments of the target that have no corresponding template andfor packing the side chains on a given backbone scaffold.
2.3.1. Modeling by Assembly of Rigid Bodies
The first and still widely used approach in comparative modeling is to assemble amodel from a small number of rigid bodies obtained from the aligned protein structures(6,86). The approach is based on the natural dissection of the protein structure intoconserved core regions, variable loops that connect them, and side chains that decoratethe backbone. For example, the following semiautomated procedure is implemented inthe computer program COMPOSER (87). First, the template structures are selectedand superposed. Second, the “framework” is calculated by averaging the coordinatesof the Cα atoms of structurally conserved regions in the template structures. Third, themain-chain atoms of each core region in the target model are obtained by superposingon the framework the core segment from the template whose sequence is closest to thetarget. Fourth, the loops are generated by scanning a database of all known proteinstructures to identify the structurally variable regions that fit the anchor core regionsand have a compatible sequence (88). Fifth, the side chains are modeled based on theirintrinsic conformational preferences and on the conformation of the equivalent sidechains in the template structures (87). And finally, the stereochemistry of the model isimproved either by a restrained energy minimization or a molecular dynamics refine-ment. The accuracy of a model can be somewhat increased when more than one tem-plate structure is used to construct the framework and when the templates are averagedinto the framework using weights corresponding to their sequence similarities to thetarget sequence (48). Possible future improvements of modeling by rigid-body assem-bly include incorporation of rigid-body shifts, such as the relative shifts in the packingof α-helices and β-sheets (89).
2.3.2. Modeling by Segment Matching or Coordinate Reconstruction
The basis of modeling by coordinate reconstruction is the finding that mosthexapeptide segments of protein structure can be clustered into only 100 structurallydifferent classes (90,91). Thus, comparative models can be constructed by using a sub-set of atomic positions from template structures as “guiding” positions, and by identi-fying and assembling short, all-atom segments that fit these guiding positions. Theguiding positions usually correspond to the Cα atoms of the segments that are con-served in the alignment between the template structure and the target sequence. Theall-atom segments that fit the guiding positions can be obtained either by scanning allthe known protein structures, including those that are not related to the sequence beingmodeled (92,93), or by a conformational search restrained by an energy function(94,95). For example, a general method for modeling by segment matching is guidedby the positions of some atoms (usually Cα atoms) to find the matching segments in therepresentative database of all known protein structures (96). This method can constructboth main-chain and side-chain atoms, and can also model unaligned regions (gaps). Itis implemented in the program SegMod. Even some side-chain modeling methods (97)

842 Madhusudhan et al.
and the class of loop construction methods based on finding suitable fragments in thedatabase of known structures (98) can be seen as segment-matching or coordinate-reconstruction methods.
2.3.3. Modeling by Satisfaction of Spatial Restraints
The methods in this class begin by generating many constraints or restraints on thestructure of the target sequence, using its alignment to related protein structures as aguide. The procedure is conceptually similar to that used in determination of proteinstructures from NMR-derived restraints. The restraints are generally obtained byassuming that the corresponding distances between aligned residues in the templateand the target structures are similar. These homology-derived restraints are usuallysupplemented by stereochemical restraints on bond lengths, bond angles, dihedralangles, and nonbonded atom–atom contacts that are obtained from a molecular-mechanics force field. The model is then derived by minimizing the violations of allthe restraints. This optimization can be achieved either by distance geometry or real-space optimization. For example, an elegant distance-geometry approach constructsall-atom models from lower and upper bounds on distances and dihedral angles (99).
We now describe our own approach to comparative modeling by satisfaction of spe-cial restrains in more detail (100–103). The approach was developed to use as manydifferent types of data about the target sequence as possible. It is implemented in thecomputer program MODELLER (101). The comparative modeling procedure beginswith an alignment of the target sequence with related known 3-D structures. The out-put, obtained without any user intervention, is a 3-D model for the target sequencecontaining all main-chain and side-chain nonhydrogen atoms.
In the first step of model building, distance and dihedral angle restraints on the tar-get sequence are derived from its alignment with template 3-D structures. The form ofthese restraints was obtained from a statistical analysis of the relationships betweensimilar protein structures. The analysis relied on a database of 105 family alignmentsthat included 416 proteins of known 3-D structure (103). By scanning the database ofalignments, tables quantifying various correlations were obtained, such as the correla-tions between two equivalent Cα-Cα distances, or between equivalent main-chaindihedral angles from two related proteins (101). These relationships are expressed asconditional probability density functions (PDFs) and can be used directly as spatialrestraints. For example, probabilities for different values of the main-chain dihedralangles are calculated from the type of a residue considered, from main-chain confor-mation of an equivalent residue, and from sequence similarity between the two pro-teins. Another example is the PDF for a certain Cα-Cα distance given equivalentdistances in two related protein structures. An important feature of the method is thatthe forms of spatial restraints were obtained empirically, from a database of proteinstructure alignments.
In the second step, the spatial restraints and the CHARMM22 force-field termsenforcing proper stereochemistry (104,105) are combined into an objective function.The general form of the objective function is similar to that in molecular dynamicsprograms, such as CHARMM22 (105). The objective function depends on the Carte-sian coordinates of approx 10,000 atoms (3-D points) that form the modeled molecules.For a 10,000-atom system, there can be on the order of 200,000 restraints. The func-tional form of each term is simple; it includes a quadratic function, harmonic lower and

Comparative Protein Structure Modeling 843
upper bounds, cosine, a weighted sum of a few Gaussian functions, Coulomb’s law,Lennard–Jones potential, and cubic splines. The geometric features presently include adistance; an angle; a dihedral angle; a pair of dihedral angles between two, three, fouratoms and eight atoms, respectively; the shortest distance in the set of distances; sol-vent accessibility in Å2; and atom density, expressed as the number of atoms around thecentral atom. Some restraints can be used to restrain pseudo-atoms such as the gravitycenter of several atoms.
Finally, the model is obtained by optimizing the objective function in Cartesianspace. The optimization is carried out by the use of the variable target function method(106) employing methods of conjugate gradients and molecular dynamics with simu-lated annealing (107). Several slightly different models can be calculated by varyingthe initial structure, and the variability among these models can be used to estimate thelower bound on the errors in the corresponding regions of the fold.
Because the modeling by satisfaction of spatial restraints can use many differenttypes of information about the target sequence, it is perhaps the most promising of allcomparative modeling techniques. One of the strengths of modeling by satisfaction ofspatial restraints is that constraints or restraints derived from a number of differentsources can easily be added to the homology-derived restraints. For example, restraintscould be provided by rules for secondary structure packing (108), analyses of hydro-phobicity (109) and correlated mutations (110), empirical potentials of mean force(111), NMR experiments (112), cross-linking experiments, fluorescence spectroscopy,image reconstruction in electron microscopy, site-directed mutagenesis (113), intu-ition, and so on. In this way, a comparative model, especially in the difficult cases,could be improved by making it consistent with available experimental data and/orwith more general knowledge about protein structure.
Accuracies of the various model-building methods are relatively similar when usedoptimally (85). Other factors such as template selection and alignment accuracy usu-ally have a larger impact on the model accuracy, especially for models based on lessthan 40% sequence identity to the templates. However, it is important that a modelingmethod allow a degree of flexibility and automation to obtain better models more eas-ily and rapidly. For example, a method should allow for an easy recalculation of amodel when a change is made in the alignment; it should be straightforward to calcu-late models based on several templates; and the method should provide tools for incor-poration of prior knowledge about the target (e.g., cross-linking restraints, predictedsecondary structure) and allow ab initio modeling of insertions (e.g., loops), which canbe crucial for annotation of function. Loop modeling is an especially important aspectof comparative modeling in the range from 30 to 50% sequence identity. In this rangeof overall similarity, loops among the homologs vary while the core regions are stillrelatively conserved and aligned accurately.
2.3.4. Loop Modeling
In comparative modeling, target sequences often have residues inserted relative tothe template structures, or have regions that are structurally different from the corre-sponding regions in the templates. Thus, no structural information about these insertedsegments can be extracted from the template structures. These regions frequently cor-respond to surface loops. Loops often play an important role in defining the functionalspecificity of a given protein framework, forming the active and binding sites. The

844 Madhusudhan et al.
accuracy of loop modeling is a major factor determining the usefulness of comparativemodels in applications such as ligand docking. Loop modeling can be seen as a mini-protein folding problem, because the correct conformation of a given segment of apolypeptide chain has to be calculated mainly from the sequence of the segment itself.However, loops are generally too short to provide sufficient information about theirlocal fold. Even identical decapeptides in different proteins do not always have thesame conformation (114,115). Some additional restraints are provided by the coreanchor regions that span the loop, and by the structure of the rest of a protein thatcradles the loop. Although many loop-modeling methods have been described, it is stillnot possible to model correctly and confidently loops longer than approximately eightresidues (102).
There are two main classes of loop-modeling methods: (1) the database searchapproaches that scan a database of all known protein structures to find segments fittingthe anchor core regions (98,116); and (2) the conformational search approaches thatrely on an optimization of a scoring function (117,118). There are also methods thatcombine these two approaches (119,120).
The database search approach to loop modeling is accurate and efficient when adatabase of specific loops is created to address the modeling of the same class of loops,such as β-hairpins (121), or loops on a specific fold, such as the hyper-variable regionsin the immunoglobulin fold (116,122). There are attempts to classify loop conforma-tions into more general categories, thus extending the applicability of the databasesearch approach to more cases (123–125). However, the database methods are limitedby the fact that the number of possible conformations increases exponentially with thelength of a loop. As a result, only loops up to four to seven residues long have most oftheir conceivable conformations present in the database of known protein structures(126,127). Even according to the more optimistic estimate, approx 30% and 60% of allthe possible eight- and nine-residue loop conformations, respectively, are missing fromthe database (126). This limitation is made even worse by the requirement for an over-lap of at least one residue between the database fragment and the anchor core regions,which means that the modeling of a 5-residue insertion requires at least a 7-residuefragment from the database (92). Despite the rapid growth of the database of knownstructures, it does not seem possible to cover most of the conformations of a 9-residuesegment in the foreseeable future. On the other hand, most of the insertions in a familyof homologous proteins are shorter than 10–12 residues (102).
To overcome the limitations of the database search methods, conformational searchmethods were developed (117,128). There are many such methods, exploiting differentprotein representations, objective function terms, and optimization or enumerationalgorithms. The search algorithms include the minimum perturbation method (129),molecular dynamics simulations (94,119), genetic algorithms (130), Monte Carlo andsimulated annealing (131–133), multiple-copy simultaneous search (134), self-consis-tent field optimization (135), and an enumeration based on the graph theory (136). Theaccuracy of loop predictions can be further improved by clustering the sampled loopconformations and therefore partially accounting for the entropic contribution to thefree energy (137). Another way to improve the accuracy of loop predictions is to con-sider the solvent effects. Improvements in implicit solvation models, such as the gener-alized Born solvation model (GB) (138) and surface-generalized Born with nonpolar

Comparative Protein Structure Modeling 845
correction (SGB/NP) (139), motivated their use in loop modeling. The solvent contri-bution to the free energy can be added to the scoring function for optimization, or it canbe used to rank the sampled loop conformations after they are generated with a scoringfunction that does not include the solvent terms (2,140–143).
The loop modeling module in MODELLER implements the optimization-basedapproach (2,102). The main reasons are the generality and conceptual simplicity ofscoring function minimization, as well as the limitations on the database approachimposed by a relatively small number of known protein structures (126). Loop predic-tion by optimization is applicable to simultaneous modeling of several loops and loopsinteracting with ligands, which is not straightforward for the database searchapproaches. Loop optimization in MODELLER relies on conjugate gradients andmolecular dynamics with simulated annealing. The pseudo-energy function is a sum ofmany terms, including some terms from the CHARMM22 molecular mechanics forcefield (104) and spatial restraints based on distributions of distances (111,144) and dihe-dral angles in known protein structures. The method was tested on a large number ofloops of known structure, both in the native and near-native environments (102).
2.3.5. Side-Chain Modeling
Two simplifications are frequently applied in the modeling of side-chain conforma-tions. First, amino acid replacements often leave the backbone conformation almostunchanged (145), allowing us to fix the backbone during the search for the best side-chain conformations. Second, most side chains in high-resolution crystallographicstructures can be represented by a limited number of conformers that comply withstereochemical and energetic constraints (146). This observation motivated Ponder andRichards to develop the first library of side-chain rotamers for the 17 types of residueswith dihedral angle degrees of freedom in their side chains, based on 10 high-resolu-tion protein structures determined by X-ray crystallography (147). Subsequently, anumber of additional libraries have been derived (148–152).
Rotamers on a fixed backbone are often used when all the side chains need to bemodeled on a given backbone. This approach overcomes the combinatorial explosionassociated with a full conformational search of all the side chains, and is applied bysome comparative modeling (6) and protein design approaches (153). However, approx15% of the side chains cannot be represented well by these libraries (154). In addition,it has been shown that the accuracy of side-chain modeling on a fixed backbonedecreases rapidly when the backbone errors are larger than only 0.5 Å (155). Fortu-nately, these two approximations may be unnecessary in the modeling of a single-pointmutation that in general does not trigger changes in many dihedral angles (152).
Earlier methods for side-chain modeling often put less emphasis on the energy orscoring function. The function was usually greatly simplified, and consisted of theempirical rotamer preferences and simple repulsion terms for non-bonded contacts(151). Nevertheless, these approaches have been justified by their performance. Forexample, a method based on a rotamer library compared favorably with that based on amolecular-mechanics force field (156) , and more recently all the new and most effi-cient methods are also based on rotamer library (152,157). In contrast, a lot of attentionhas been paid to the optimization procedure. The various approaches include a MonteCarlo simulation (158), simulated annealing (159), a combination of Monte Carlo andsimulated annealing (160), the dead-end elimination theorem (161,162), genetic algo-

846 Madhusudhan et al.
rithms (148), neural network with simulated annealing (163), mean field optimization(164), and combinatorial searches (151,165,166). It was suggested that the modelingaccuracy for up to 10-residue segments is currently limited by the accuracy of the scor-ing function, not by the thoroughness of the search algorithms (102). Several recentpapers focused on the testing of more sophisticated potential functions for conforma-tional search (166,167) and development of new scoring functions for side-chain mod-eling (168), report favorable performance compared to earlier studies.
3. Errors in Comparative Modeling
It is crucial for method developers and users alike to assess the accuracy of theirmethods. An attempt to address this problem has been made by the Critical Assessmentof Techniques for Proteins Structure Prediction (CASP) (169) and the Critical Assess-ment of Fully Automated Structure Prediction (CAFASP) experiments (170). How-ever, both CASP and CAFASP assess methods only over a limited number of targetprotein sequences (85,171). To overcome this limitation, two additional evaluationexperiments have been described, LiveBench (171) and EVA (172,173). EVA is alarge-scale and continuously running Web server that automatically assesses proteinstructure prediction servers in the categories of secondary structure prediction, residue-residue contact prediction, fold assignment, and comparative modeling. The aims ofEVA are (1) to evaluate continuously and automatically blind predictions by predictionservers, based on identical and sufficiently large data sets; (2) to provide weekly updatesof the method assessments on the Web; and (3) to enable developers, non-expert users,and reviewers to determine the performance of the tested prediction servers.
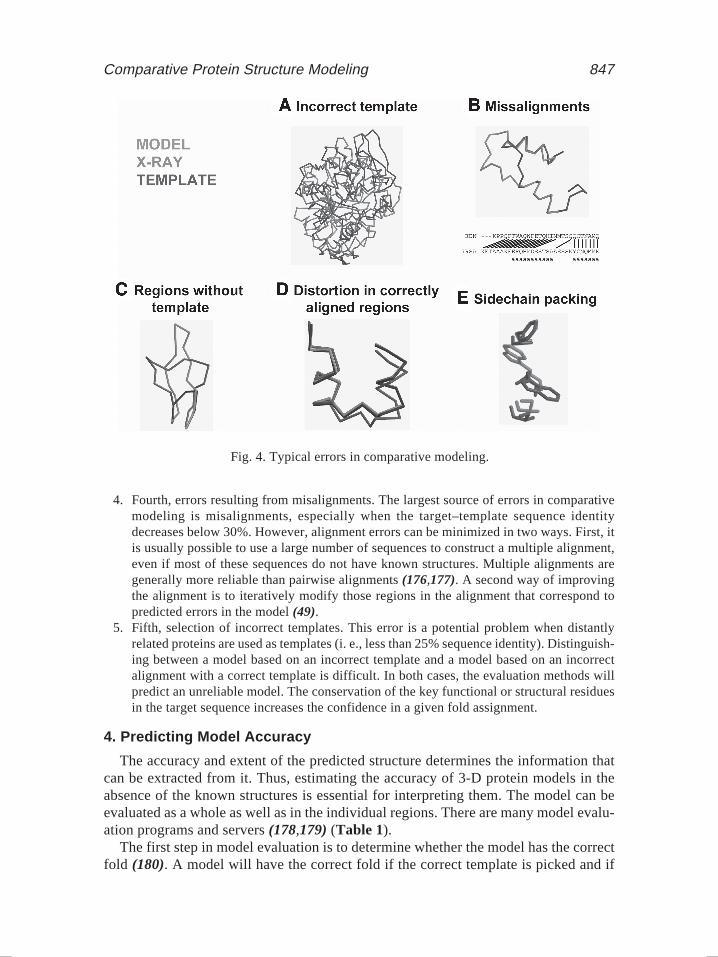
As the similarity between the target and the templates decreases, the errors in themodel increase. Errors in comparative models can be divided into five categories asfollows (49) (Fig. 4).
1. First, errors in side-chain packing. As the sequences diverge, the packing of the atoms inthe protein core changes. Sometimes, even the conformation of identical side chains is notconserved, a pitfall for many comparative modeling methods. Side-chain errors are criti-cal if they occur in regions that are involved in protein function, such as active sites andligand-binding sites.
2. Second, distortions and shifts in correctly aligned regions. As a consequence of sequencedivergence, the main-chain conformation changes, even if the overall fold remainsthe same. Therefore, it is possible that in some correctly aligned segments of a model, thetemplate is locally different (<3 Å) from the target, resulting in errors in that region. Thestructural differences are sometimes not due to differences in sequence, but are a conse-quence of artifacts in structure determination, or structure determination in different envi-ronments (e.g., packing of subunits in a crystal). The simultaneous use of several templatescan minimize this kind of an error (49,174).
3. Third, errors in regions without a template. Segments of the target sequence that have noequivalent region in the template structure (i.e., insertions or loops) are the most difficultregions to model. As mentioned in the section on loop modeling, this problem is akin to abinitio fold prediction. If the insertion is relatively short, less than nine residues long, somemethods can correctly predict the conformation of the backbone (102,119,143,175).Conditions for successful prediction are the correct alignment and an accurately modeledenvironment surrounding the insertion.
Comparative Protein Structure Modeling 847
Fig. 4. Typical errors in comparative modeling.
4. Fourth, errors resulting from misalignments. The largest source of errors in comparativemodeling is misalignments, especially when the target–template sequence identitydecreases below 30%. However, alignment errors can be minimized in two ways. First, itis usually possible to use a large number of sequences to construct a multiple alignment,even if most of these sequences do not have known structures. Multiple alignments aregenerally more reliable than pairwise alignments (176,177). A second way of improvingthe alignment is to iteratively modify those regions in the alignment that correspond topredicted errors in the model (49).
5. Fifth, selection of incorrect templates. This error is a potential problem when distantlyrelated proteins are used as templates (i. e., less than 25% sequence identity). Distinguish-ing between a model based on an incorrect template and a model based on an incorrectalignment with a correct template is difficult. In both cases, the evaluation methods willpredict an unreliable model. The conservation of the key functional or structural residuesin the target sequence increases the confidence in a given fold assignment.
4. Predicting Model Accuracy
The accuracy and extent of the predicted structure determines the information thatcan be extracted from it. Thus, estimating the accuracy of 3-D protein models in theabsence of the known structures is essential for interpreting them. The model can beevaluated as a whole as well as in the individual regions. There are many model evalu-ation programs and servers (178,179) (Table 1).
The first step in model evaluation is to determine whether the model has the correctfold (180). A model will have the correct fold if the correct template is picked and if

848 Madhusudhan et al.
that template is aligned at least approximately correctly with the target sequence. Theconfidence in the fold of a model is generally increased by a high sequence similaritywith the closest template, an energy-based Z-score (180,181), or by conservation of thekey functional or structural residues in the target sequence.
Once the fold of a model is accepted, a more detailed evaluation of the overall modelaccuracy can be obtained, based on the similarity between the target and templatesequences (180). Sequence identity above 30% is a relatively good predictor of theexpected accuracy, because the deviation from the least-squares curve relatingsequence identity to the accuracy is relatively small. The reasons are the well-knownrelationship between structure and sequence similarities of two proteins (145), the “geo-metrical” nature of modeling (which forces the model to be as close to the template aspossible) (101), and the inability of any current modeling procedure to recover from anincorrect alignment (49). The dispersion of the model-target structure overlap increaseswith the decrease in sequence identity. If the target–template sequence identity fallsbelow 30%, the sequence identity becomes unreliable as a predictor of the model accu-racy. Models that deviate significantly from the average accuracy are frequent. It is insuch cases that model evaluation methods are particularly useful.
In addition to the target–template sequence similarity, the environment can stronglyinfluence the accuracy of a model. For instance, some calcium-binding proteins un-dergo large conformational changes when bound to calcium. If a calcium-free templateis used to model the calcium-bound state of the target, it is likely that the model will beincorrect irrespective of the target–template similarity or accuracy of the template struc-ture (182). This observation also applies to the experimental determination of proteinstructure; a structure must be determined in the functionally meaningful environment.
A basic requirement for a model is to have good stereochemistry. Some useful pro-grams for evaluating stereochemistry are PROCHECK (183), PROCHECK-NMR(184), AQUA (184), SQUID (185), and WHATCHECK (186). The features of a modelthat are checked by these programs include bond lengths, bond angles, peptide-bondand side-chain ring planarities, chirality, main-chain and side-chain torsion angles, andclashes between non-bonded pairs of atoms.
There are also methods for testing 3-D models that implicitly take into account manyspatial features compiled from high-resolution protein structures. These methods arebased on 3-D profiles and statistical potentials of mean force (74,111,144). Programsimplementing this approach include VERIFY3D (74), PROSAII (181), HARMONY(187), ANOLEA (188), and DFIRE (189). These programs evaluate the environmentof each residue in a model with respect to the expected environment as found in thehigh-resolution X-ray structures. There is a concern about the theoretical validity ofthe energy profiles for detecting regional errors in models (102). It is likely that thecontributions of the individual residues to the overall free energy of folding vary widely,even when normalized by the number of atoms or interactions made. If this expectationis correct, the correlation between the prediction errors and energy peaks is greatlyweakened, resulting in the loss of predictive power of the energy profile. Despite theseconcerns, error profiles have been useful in some applications (190).

Comparative Protein Structure Modeling 849
5. Applications of Comparative Modeling
Comparative models have been used in a myriad of applications (1,191). The appli-cability of a model depends on its accuracy (Fig. 3). We now list typical applications ofcomparative models.
Models that are built using as templates protein structures with which they share lessthan approx 25% in sequence identity are usually used for fold assignment. Such mod-els often have less than 50% of their Cα positions within 3.5 Å of the actual structure.Nevertheless, fold assignment is frequently sufficient to assign coarse protein function(20,192). At this level of target–template similarity, model evaluation can be used as adiscriminator between correct and incorrect fold assignment (49,144,180).
Models built on approx 35% sequence identity to the templates, on the average coverabout 85% of the residues to within 3.5 Å of their correct positions. Since the activeand binding sites of proteins are frequently more conserved than the rest of the fold,they tend to be modeled more accurately than the rest of the fold (180). In general,medium-resolution models frequently allow a refinement of the functional predictionbased on sequence alone, because ligand binding is most directly determined by thestructure of the binding site rather than its sequence. It may be possible to correctlypredict important features of the target protein that do not occur in the template struc-ture. For example, the location of a binding site can be predicted from clusters ofcharged residues (193) , and the size of a ligand may be predicted from the volume ofthe binding-site cleft (194). Medium-resolution models can also be used to constructsite-directed mutants with altered binding capacity, which in turn could test hypothesesabout the sequence-structure-function relationships. Other problems that can beaddressed with medium-resolution comparative models include designing proteins thathave compact structures—without long tails, loops, and exposed hydrophobic resi-dues—for better crystallization; or designing proteins with added disulfide bonds forextra stability.
The high end of the accuracy spectrum corresponds to models based on 50%sequence identity or more. The average accuracy of these models approaches that oflow-resolution X-ray structures (3Å resolution) or medium-resolution NMR structures(10 distance restraints per residue) (49). The alignments on which these models arebased generally contain almost no errors. In addition to the already listed applications,high-accuracy models can be used for docking of small ligands (130) or whole proteinsonto the given protein (195). For an overall view of the scope of applicability of com-putational models, see refs. 1,191.
Acknowledgments
Our research has been supported by Sandler Family Supporting Foundation, NIH/NIGMS R01 GM 54762, NIH/NIGMS P50 GM62529, NIH/NCI R33 CA84699, SunAcademic Equipment Grant EDUD-7824-020257-US, an IBM SUR grant, and an Intelcomputer hardware gift.

850 Madhusudhan et al.
References
1. Baker, D. and Sali, A. (2001) Protein structure prediction and structural genomics. Sci-ence 294, 93–96.
2. Fiser, A., Feig, M., Brooks, C. L. III, and Sali, A. (2002) Evolution and physics in com-parative protein structure modeling. Acc. Chem. Res. 35, 413–421.
3. Bradley, P., Chivian, D., Meiler, J., et al. (2003) Rosetta predictions in CASP5: successes,failures, and prospects for complete automation. Proteins 53 Suppl. 6, 457–468.
4. Kinch, L. N., Wrabl, J. O., Krishna, S. S., et al. (2003) CASP5 assessment of fold recog-nition target predictions. Proteins 53 Suppl. 6, 395–409.
5. Marti-Renom, M. A., Stuart, A., Fiser, A., et al. (2000) Comparative protein structuremodeling of genes and genomes. Annu. Rev. Biophys. Biomol. Struct. 29, 291–325.
6. Blundell, T. L., Sibanda, B. L., Sternberg, M. J., and Thornton, J. M. (1987) Knowledge-based prediction of protein structures and the design of novel molecules. Nature 326,347–352.
7. Pieper, U., Eswar, N., Braberg, H., et al. (2004) MODBASE, a database of annotatedcomparative protein structure models, and associated resources. Nucleic Acids Res. 32,D217–D222.
8. Chance, M. R., Bresnick, A. R., Burley, S. K., et al. (2002) Structural Genomics: A pipe-line for providing structures for the biologist. Protein Sci. 11, 723–738.
9. Burley, S. K., Almo, S. C., Bonanno, J. B., et al. (1999) Structural genomics: beyond thehuman genome project. Nat. Genet. 23, 151–157.
10. Sanchez, R., Pieper, U., Mirkovic, N., et al. (2000) MODBASE, a database of annotatedcomparative protein structure models. Nucleic Acids Res. 28, 250–253 .
11. Sali, A. and Kuriyan, J. (1999) Challenges at the frontiers of structural biology. TrendsCell Biol. 9, M20–M24.
12. Montelione, G. T. and Anderson, S. (1999) Structural genomics: keystone for a HumanProteome Project. Nat. Struct. Biol. 6, 11–12.
13. Sali, A. (1998) 100,000 protein structures for the biologist. Nat. Struct. Biol. 5, 1029–1032.14. Gerstein, M., Edwards, A., Arrowsmith, C. H., and Montelione, G. T. (2003) Structural
genomics: current progress. Science 299, 1663.15. Brenner, S. E. (2000) Target selection for structural genomics. Nat. Struct. Biol. 7 Suppl.,
967–969.16. Vitkup, D., Melamud, E., Moult, J., and Sander, C. (2001) Completeness in structural
genomics. Nat. Struct. Biol. 8, 559–566.17. Westbrook, J., Feng, Z., Jain, S., et al. (2002) The Protein Data Bank: unifying the archive.
Nucleic Acids Res. 30, 245–248.18. Lo Conte, L., Brenner, S. E., Hubbard, T. J., Chothia, C., and Murzin, A. G. (2002) SCOP
database in 2002: refinements accommodate structural genomics. Nucleic Acids Res. 30,264–267.
19. Holm, L. and Sander, C. (1999) Protein folds and families: sequence and structure align-ments. Nucleic Acids Res. 27, 244–247.
20. Orengo, C. A., Bray, J. E., Buchan, D. W., et al. (2002) The CATH protein familydatabase: a resource for structural and functional annotation of genomes. Proteomics2, 11–21.
21. Pearl, F. M., Lee, D., Bray, J. E., et al. (2002) The CATH extended protein-family data-base: Providing structural annotations for genome sequences. Protein Sci. 11, 233–244.
22. Altschul, S. F., Gish, W., Miller, W., Myers, E. W., and Lipman, D. J. (1990) Basic localalignment search tool. J. Mol. Biol. 215, 403–410.
23. Pearson, W. R. (1990) Rapid and sensitive sequence comparison with FASTP and FASTA.Methods Enzymol. 183, 63–98.
Comparative Protein Structure Modeling 851
24. Brenner, S. E., Chothia, C., and Hubbard, T. J. (1998) Assessing sequence comparisonmethods with reliable structurally identified distant evolutionary relationships. Proc. Natl.Acad. Sci. USA 95, 6073–6078.
25. Altschul, S. F., Madden, T. L., Schaffer, A. A., et al. (1997) Gapped BLAST and PSI-BLAST: a new generation of protein database search programs. Nucleic Acids Res. 25,3389–3402.
26. Rychlewski, L., Jaroszewski, L., Li, W., and Godzik, A. (2000) Comparison of sequenceprofiles. Strategies for structural predictions using sequence information. Protein Sci. 9,232–241.
27. Sadreyev, R. and Grishin, N. (2003) COMPASS: a tool for comparison of multiple pro-tein alignments with assessment of statistical significance. J. Mol. Biol. 326, 317–336.
28. Panchenko, A. R. (2003) Finding weak similarities between proteins by sequence profilecomparison. Nucleic Acids Res. 31, 683–689.
29. Wallner, B., Fang, H., Ohlson, T., Frey-Skott, J., and Elofsson, A. (2004) Using evolution-ary information for the query and target improves fold recognition. Proteins 54, 342–50.
30. Teichmann, S. A., Chothia, C., Church, G. M., and Park, J. (2000) Fast assignment ofprotein structures to sequences using the intermediate sequence library PDB-ISL.Bioinformatics 16, 117–124.
31. Li, W., Pio, F., Pawlowski, K., and Godzik, A. (2000) Saturated BLAST: an automatedmultiple intermediate sequence search used to detect distant homology. Bioinformatics16, 1105–1110.
32. Park, J., Karplus, K., Barrett, C., et al. (1998) Sequence comparisons using multiple se-quences detect three times as many remote homologues as pairwise methods. J. Mol. Biol.284, 1201–1210.
33. Gerstein, M. (1998) Measurement of the effectiveness of transitive sequence comparison,through a third ‘intermediate’ sequence. Bioinformatics 14, 707–714.
34. Pipenbacher, P., Schliep, A., Schneckener, S., et al. (2002) ProClust: improved clusteringof protein sequences with an extended graph-based approach. Bioinformatics 18 Suppl.2, S182–S191.
35. Salamov, A. A., Suwa, M., Orengo, C. A., and Swindells, M. B. (1999) Combining sensi-tive database searches with multiple intermediates to detect distant homologues. ProteinEng. 12, 95–100.
36. John, B. and Sali, A. (2004) Detection of homologous proteins by an intermediatesequence search. Protein Sci. 13, 54–62.
37. Jones, D. T. (1997) Successful ab initio prediction of the tertiary structure of NK-lysinusing multiple sequences and recognized supersecondary structural motifs. ProteinsSuppl. 1, 185–191.
38. Smith, T. F., Lo Conte, L., Bienkowska, J., et al. (1997) Current limitations to proteinthreading approaches. J. Comput. Biol. 4, 217–225.
39. Torda, A. E. (1997) Perspectives in protein-fold recognition. Curr. Opin. Struct. Biol. 7,200–205.
40. Levitt, M. (1997) Competitive assessment of protein fold recognition and alignment accu-racy. Proteins Suppl. 1, 92–104.
41. David, R., Korenberg, M. J., and Hunter, I. W. (2000) 3D-1D threading methods for pro-tein fold recognition. Pharmacogenomics 1, 445–455.
42. Gough, J., Karplus, K., Hughey, R., and Chothia, C. (2001) Assignment of homology togenome sequences using a library of hidden Markov models that represent all proteins ofknown structure. J. Mol. Biol. 313, 903–919.
43. Jones, D. T. (1999) GenTHREADER: an efficient and reliable protein fold recognitionmethod for genomic sequences. J. Mol. Biol. 287, 797–815.
852 Madhusudhan et al.
44. Lindahl, E. and Elofsson, A. (2000) Identification of related proteins on family, super-family and fold level. J. Mol. Biol. 295, 613–625.
45. Balaji, S., Sujatha, S., Kumar, S. S., and Srinivasan, N. (2001) PALI-a database of Phy-logeny and ALIgnment of homologous protein structures. Nucleic Acids Res. 29, 61–65.
46. Navaratnam, N., Fujino, T., Bayliss, J., et al. (1998) Escherichia coli cytidine deaminaseprovides a molecular model for ApoB RNA editing and a mechanism for RNA substraterecognition. J. Mol. Biol. 275, 695–714.
47. Reva, B., Finkelstein, A., and Topiol, S. (2002) Threading with chemostructural restric-tions method for predicting fold and functionally significant residues: application todipeptidylpeptidase IV (DPP-IV). Proteins 47, 180–193.
48. Srinivasan, S., March, C. J., and Sudarsanam, S. (1993) An automated method for model-ing proteins on known templates using distance geometry. Protein Sci. 2, 277–289.
49. Sanchez, R. and Sali, A. (1997) Evaluation of comparative protein structure modeling byMODELLER-3. Proteins Suppl. 1, 50–58.
50. Barton, G. J. (1996) Protein sequence alignment and database scanning. In: (Sternberg,M. J. E., ed.) Protein Structure Prediction: A Practical Approach, IRL Press at OxfordUniversity Press, Oxford, UK.
51. Needleman, S. B. and Wunsch, C. D. (1970) A general method applicable to the searchfor similarities in the amino acid sequence of two proteins. J. Mol. Biol. 48, 443–453.
52. Sellers, P. H. (1974) Theory and computation of evolutionary distances. Siam Journal onApplied Mathematics 26, 787–793.
53. Smith, T. F. and Waterman, M. S. (1981) Identification of common molecular subse-quences. J. Mol. Biol. 147, 195–197.
54. Henikoff, S. and Henikoff, J. G. (1992) Amino acid substitution matrices from proteinblocks. Proc. Natl. Acad. Sci. USA 89, 10,915–10,919.
55. Dayhoff, M., Schwartz, R., and BC, O. (1978) A model of evolutionary change in pro-teins, 345–352, National Biomedical Research Foundation, Washington, DC.
56. Gribskov, M., McLachlan, A. D., and Eisenberg, D. (1987) Profile analysis: detection ofdistantly related proteins. Proc. Natl. Acad. Sci. USA 84, 4355–4358.
57. Gribskov, M. (1994) Profile analysis. Methods Mol. Biol. 25, 247–266.58. Gribskov, M., Luthy, R., and Eisenberg, D. (1990) Profile analysis. Methods Enzymol.
183, 146–159.59. Karplus, K., Barrett, C., and Hughey, R. (1998) Hidden Markov models for detecting
remote protein homologies. Bioinformatics 14, 846–856.60. Marti-Renom, M. A., Madhusudhan, M. S., and Sali, A. (2004) Alignment of protein
sequences by their profiles. Protein Sci. 13(4), 1071–1087.61. Higgins, D. G. and Sharp, P. M. (1988) CLUSTAL: a package for performing multiple
sequence alignment on a microcomputer. Gene 73, 237–244.62. Thompson, J. D., Higgins, D. G., and Gibson, T. J. (1994) CLUSTAL W: improving the
sensitivity of progressive multiple sequence alignment through sequence weighting, posi-tion-specific gap penalties and weight matrix choice. Nucleic Acids Res. 22, 4673–4680.
63. Pietrokovski, S. (1996) Searching databases of conserved sequence regions by aligningprotein multiple-alignments. Nucleic Acids Res. 24, 3836–3845.
64. Jaroszewski, L., Rychlewski, L., and Godzik, A. (2000) Improving the quality of twilight-zone alignments. Protein Sci. 9, 1487–1496.
65. Yona, G., Linial, N., and Linial, M. (2000) ProtoMap: automatic classification of proteinsequences and hierarchy of protein families. Nucleic Acids Res. 28, 49–55.
66. Yona, G. and Levitt, M. (2002) Within the twilight zone: a sensitive profile-profile com-parison tool based on information theory. J. Mol. Biol. 315, 1257–1275.
Comparative Protein Structure Modeling 853
67. Yona, G., Linial, N., and Linial, M. (1999) ProtoMap: automatic classification of proteinsequences, a hierarchy of protein families, and local maps of the protein space. Proteins37, 360–378.
68. Yona, G. and Levitt, M. (2000) Towards a complete map of the protein space based on aunified sequence and structure analysis of all known proteins. ISMB 8, 395–406.
69. Bowie, J. U., Luthy, R., and Eisenberg, D. (1991) A method to identify protein sequencesthat fold into a known three-dimensional structure. Science 253, 164–170.
70. Jones, D. T., Taylor, W. R., and Thornton, J. M. (1992) A new approach to protein foldrecognition. Nature 358, 86–89.
71. Godzik, A. and Skolnick, J. (1992) Sequence-structure matching in globular proteins:application to supersecondary and tertiary structure determination. Proc. Natl. Acad. Sci.USA 89, 12,098–12,102.
72. Jones, D. T. (1997) Progress in protein structure prediction. Curr. Opin. Struct. Biol. 7,377–387.
73. Teodorescu, O., Galor, T., Pillardy, J., and Elber, R. (2004) Enriching the sequence sub-stitution matrix by structural information. Proteins 54, 41–8.
74. Luthy, R., Bowie, J. U., and Eisenberg, D. (1992) Assessment of protein models withthree-dimensional profiles. Nature 356, 83–85.
75. Shi, J., Blundell, T. L., and Mizuguchi, K. (2001) FUGUE: sequence-structure homologyrecognition using environment-specific substitution tables and structure-dependent gappenalties. J. Mol. Biol. 310, 243–257.
76. Bates, P. A., Kelley, L. A., MacCallum, R. M., and Sternberg, M. J. (2001) Enhancementof protein modeling by human intervention in applying the automatic programs 3D-JIG-SAW and 3D-PSSM. Proteins Suppl. 5, 39–46.
77. Kelley, L. A., MacCallum, R. M., and Sternberg, M. J. (2000) Enhanced genome annota-tion using structural profiles in the program 3D-PSSM. J. Mol. Biol. 299, 499–520.
78. Karchin, R., Cline, M., Mandel-Gutfreund, Y., and Karplus, K. (2003) Hidden Markovmodels that use predicted local structure for fold recognition: alphabets of backbonegeometry. Proteins 51, 504–514.
79. Tang, K. S., Fersht, A. R., and Itzhaki, L. S. (2003) Sequential unfolding of ankyrin repeatsin tumor suppressor p16. Structure (Camb.) 11, 67–73.
80. Zhu, Z. Y., Sali, A., and Blundell, T. L. (1992) A variable gap penalty function and fea-ture weights for protein 3-D structure comparisons. Protein Eng. 5, 43–51.
81. Madhusudhan, M. S., Marti-Renom, M. A., Sanchez, R., and Sali, A. (2004) Variable gappenalty function for protein sequence—structure alignment. in preparation.
82. Madhusudhan, M. S., Marti-Renom, M. A., Eswar, N., and Sali, A. (2004) SALIGN: acomprehensive sequence/structure alignment algorithm. in preparation.
83. Venclovas, C. (2003) Comparative modeling in CASP5: progress is evident, but align-ment errors remain a significant hindrance. Proteins 53 Suppl. 6, 380–388.
84. John, B. and Sali, A. (2003) Comparative protein structure modeling by iterative align-ment, model building and model assessment. Nucleic Acids Res. 31, 3982–3992.
85. Marti-Renom, M. A., Madhusudhan, M. S., Fiser, A., Rost, B., and Sali, A. (2002) Reli-ability of assessment of protein structure prediction methods. Structure 10, 435–440.
86. Browne, W. J., North, A. C. T., Phillips, D. C., et al. (1969) A possible three-dimensionalstructure of bovine lactalbumin based onthat of hen’s egg-white lysosyme. J. Mol. Biol.42, 65–86.
87. Sutcliffe, M. J., Haneef, I., Carney, D., and Blundell, T. L. (1987) Knowledge based mod-elling of homologous proteins, Part I: Three- dimensional frameworks derived from thesimultaneous superposition of multiple structures. Protein Eng. 1, 377–384.

854 Madhusudhan et al.
88. Topham, C. M., McLeod, A., Eisenmenger, F., et al. (1993) Fragment ranking in model-ling of protein structure. Conformationally constrained environmental amino acid substi-tution tables. J. Mol. Biol. 229, 194–220.
89. Nagarajaram, H. A., Reddy, B. V., and Blundell, T. L. (1999) Analysis and prediction ofinter-strand packing distances between beta-sheets of globular proteins. Protein Eng. 12,1055–1062.
90. Unger, R., Harel, D., Wherland, S., and Sussman, J. L. (1989) A 3D building blocksapproach to analyzing and predicting structure of proteins. Proteins 5, 355–373.
91. Bystroff, C. and Baker, D. (1998) Prediction of local structure in proteins using a libraryof sequence-structure motifs. J. Mol. Biol. 281, 565–577.
92. Claessens, M., Van Cutsem, E., Lasters, I., and Wodak, S. (1989) Modelling the polypep-tide backbone with ’spare parts’ from known protein structures. Protein Eng. 2, 335–345.
93. Holm, L. and Sander, C. (1991) Database algorithm for generating protein backbone andside-chain co-ordinates from a C alpha trace application to model building and detectionof co-ordinate errors. J. Mol. Biol. 218, 183–194.
94. Bruccoleri, R. E. and Karplus, M. (1990) Conformational sampling using high-tempera-ture molecular dynamics. Biopolymers 29, 1847–1862.
95. van Gelder, C. W., Leusen, F. J., Leunissen, J. A., and Noordik, J. H. (1994) A moleculardynamics approach for the generation of complete protein structures from limited coordi-nate data. Proteins 18, 174–185.
96. Levitt, M. (1992) Accurate modeling of protein conformation by automatic segmentmatching. J. Mol. Biol. 226, 507–533.
97. Chinea, G., Padron, G., Hooft, R. W., Sander, C., and Vriend, G. (1995) The use of posi-tion-specific rotamers in model building by homology. Proteins 23, 415–421.
98. Jones, T. A. and Thirup, S. (1986) Using known substructures in protein model buildingand crystallography. EMBO J. 5, 819–822.
99. Havel, T. F. and Snow, M. E. (1991) A new method for building protein conformationsfrom sequence alignments with homologues of known structure. J. Mol. Biol. 217, 1–7.
100. Sali, A., Overington, J. P., Johnson, M. S., and Blundell, T. L. (1990) From comparisonsof protein sequences and structures to protein modelling and design. Trends Biochem. Sci.15, 235–240.
101. Sali, A. and Blundell, T. L. (1993) Comparative protein modelling by satisfaction of spa-tial restraints. J. Mol. Biol. 234, 779–815.
102. Fiser, A., Do, R. K., and Sali, A. (2000) Modeling of loops in protein structures. ProteinSci. 9, 1753–1773.
103. Sali, A. and Overington, J. P. (1994) Derivation of rules for comparative protein model-ing from a database of protein structure alignments. Protein Sci. 3, 1582–1596.
104. MacKerell, A. D., Jr., Bashford, D., Bellott, M., et al. (1998) All-atom empirical poten-tial for molecular modleing and dynamics studies of proteins. J. Phys. Chem. B 102,3586–3616.
105. Brooks, B. R., Bruccoleri, R. E., Olafson, B. D., et al. (1983) CHARMM: A programfor macromolecular energy minimization and dynamics calculations. J. Comp. Chem. 4,187–217.
106. Braun, W. and Go, N. (1985) Calculation of protein conformations by proton-proton dis-tance constraints. A new efficient algorithm. J. Mol. Biol. 186, 611–626.
107. Clore, G. M., Brunger, A. T., Karplus, M., and Gronenborn, A. M. (1986) Application ofmolecular dynamics with interproton distance restraints to three-dimensional proteinstructure determination. A model study of crambin. J. Mol. Biol. 191, 523–551.
108. Cohen, F. E. and Kuntz, I. D. (1989) Tertiary structure prediction. In: (Fasman, G. D., ed.)Prediction of Protein Structure and the Principles of Protein Conformations, Plenum,New York, NY: 647–705.

Comparative Protein Structure Modeling 855
109. Aszodi, A. and Taylor, W. R. (1994) Secondary structure formation in model polypeptidechains. Protein Eng. 7, 633–644.
110. Taylor, W. R. and Hatrick, K. (1994) Compensating changes in protein multiple sequencealignments. Protein Eng. 7, 341–348.
111. Sippl, M. J. (1990) Calculation of conformational ensembles from potentials of meanforce. An approach to the knowledge-based prediction of local structures in globular pro-teins. J. Mol. Biol. 213, 859–883.
112. Sutcliffe, M. J., Dobson, C. M., and Oswald, R. E. (1992) Solution structure of neuronalbungarotoxin determined by two-dimensional NMR spectroscopy: calculation of tertiarystructure using systematic homologous model building, dynamical simulated annealing,and restrained molecular dynamics. Biochemistry 31, 2962–2970.
113. Boissel, J. P., Lee, W. R., Presnell, S. R., Cohen, F. E., and Bunn, H. F. (1993) Erythro-poietin structure-function relationships. Mutant proteins that test a model of tertiary struc-ture. J. Biol. Chem. 268, 15,983–15,993.
114. Kabsch, W. and Sander, C. (1984) On the use of sequence homologies to predict proteinstructure: identical pentapeptides can have completely different conformations. Proc. Natl.Acad. Sci. USA 81, 1075–1078.
115. Mezei, M. (1998) Chameleon sequences in the PDB. Protein Eng. 11, 411–414.116. Chothia, C. and Lesk, A. M. (1987) Canonical structures for the hypervariable regions of
immunoglobulins. J. Mol. Biol. 196, 901–917.117. Bruccoleri, R. E. and Karplus, M. (1987) Prediction of the folding of short polypeptide
segments by uniform conformational sampling. Biopolymers 26, 137–168.118. Shenkin, P. S., Yarmush, D. L., Fine, R. M., Wang, H. J., and Levinthal, C. (1987) Pre-
dicting antibody hypervariable loop conformation. I. Ensembles of random conforma-tions for ringlike structures. Biopolymers 26, 2053–2085.
119. van Vlijmen, H. W. and Karplus, M. (1997) PDB-based protein loop prediction: param-eters for selection and methods for optimization. J. Mol. Biol. 267, 975–1001.
120. Deane, C. M. and Blundell, T. L. (2001) CODA: a combined algorithm for predicting thestructurally variable regions of protein models. Protein Sci. 10, 599–612.
121. Sibanda, B. L., Blundell, T. L., and Thornton, J. M. (1989) Conformation of beta-hairpinsin protein structures. A systematic classification with applications to modelling byhomology, electron density fitting and protein engineering. J. Mol. Biol. 206, 759–777.
122. Chothia, C., Lesk, A. M., Tramontano, A., et al. (1989) Conformations of immunoglobu-lin hypervariable regions. Nature 342, 877–883.
123. Rufino, S. D., Donate, L. E., Canard, L. H., and Blundell, T. L. (1997) Predicting theconformational class of short and medium size loops connecting regular secondary struc-tures: application to comparative modelling. J. Mol. Biol. 267, 352–367.
124. Oliva, B., Bates, P. A., Querol, E., Aviles, F. X., and Sternberg, M. J. (1997) An auto-mated classification of the structure of protein loops. J. Mol. Biol. 266, 814–830.
125. Ring, C. S., Kneller, D. G., Langridge, R., and Cohen, F. E. (1992) Taxonomy and confor-mational analysis of loops in proteins. J. Mol. Biol. 224, 685–699.
126. Fidelis, K., Stern, P. S., Bacon, D., and Moult, J. (1994) Comparison of systematicsearch and database methods for constructing segments of protein structure. ProteinEng. 7, 953–960.
127. Lessel, U. and Schomburg, D. (1994) Similarities between protein 3-D structures. ProteinEng. 7, 1175–1187.
128. Moult, J. and James, M. N. (1986) An algorithm for determining the conformation ofpolypeptide segments in proteins by systematic search. Proteins 1, 146–163.
129. Fine, R. M., Wang, H., Shenkin, P. S., Yarmush, D. L., and Levinthal, C. (1986) Predict-ing antibody hypervariable loop conformations. II: Minimization and molecular dynam-

856 Madhusudhan et al.
ics studies of MCPC603 from many randomly generated loop conformations. Proteins 1,342–362.
130. Ring, C. S., Sun, E., McKerrow, J. H., et al. (1993) Structure-based inhibitor design byusing protein models for the development of antiparasitic agents. Proc. Natl. Acad. Sci.USA 90, 3583–3587.
131. Abagyan, R. and Totrov, M. (1994) Biased probability Monte Carlo conformationalsearches and electrostatic calculations for peptides and proteins. J. Mol. Biol. 235,983–1002.
132. Collura, V., Higo, J., and Garnier, J. (1993) Modeling of protein loops by simulatedannealing. Protein Sci. 2, 1502–1510.
133. Higo, J., Collura, V., and Garnier, J. (1992) Development of an extended simulatedannealing method: application to the modeling of complementary determining regions ofimmunoglobulins. Biopolymers 32, 33–43.
134. Zheng, Q., Rosenfeld, R., Vajda, S., and DeLisi, C. (1993) Determining protein loop con-formation using scaling-relaxation techniques. Protein Sci. 2, 1242–1248.
135. Koehl, P. and Delarue, M. (1995) A self consistent mean field approach to simultaneousgap closure and side-chain positioning in homology modelling. Nat. Struct. Biol. 2,163–170.
136. Samudrala, R. and Moult, J. (1998) A graph-theoretic algorithm for comparative model-ing of protein structure. J. Mol. Biol. 279, 287–302.
137. Xiang, Z., Soto, C. S., and Honig, B. (2002) Evaluating conformational free energies: thecolony energy and its application to the problem of loop prediction. Proc. Natl. Acad. Sci.USA 99, 7432–7437.
138. Still, W. C., Tempczyk, A., Hawley, R. C., and Hendrickson, T. (1990) Semianalyticaltreatment of solvation for molecular mechanics and dynamics. J. Am. Chem. Soc. 112,6127–6129.
139. Ghosh, A., Rapp, C.S., and Friesner, R.A. (1998) Generalized born model based on asurface integral formulation. J. Phys. Chem. B 102, 10,983–10,990.
140. de Bakker, P. I., DePristo, M. A., Burke, D. F., and Blundell, T. L. (2003) Ab initio con-struction of polypeptide fragments: Accuracy of loop decoy discrimination by an all-atomstatistical potential and the AMBER force field with the Generalized Born solvationmodel. Proteins 51, 21–40.
141. DePristo, M. A., de Bakker, P. I., Lovell, S. C., and Blundell, T. L. (2003) Ab initioconstruction of polypeptide fragments: efficient generation of accurate, representativeensembles. Proteins 51, 41–55.
142. Felts, A. K., Gallicchio, E., Wallqvist, A., and Levy, R. M. (2002) Distinguishing nativeconformations of proteins from decoys with an effective free energy estimator based onthe OPLS all-atom force field and the Surface Generalized Born solvent model. Proteins48, 404–422.
143. Jacobson, M., Pincus, D., Rapp, C. S., et al. (2004) A hierarchical approach to all-atomloop prediction. Proteins 55, 351–367.
144. Melo, F., Sanchez, R., and Sali, A. (2002) Statistical potentials for fold assessment. ProteinSci. 11, 430–448.
145. Chothia, C. and Lesk, A. M. (1986) The relation between the divergence of sequence andstructure in proteins. EMBO J. 5, 823–826.
146. Janin, J. and Chothia, C. (1978) Role of hydrophobicity in the binding of coenzymes.Appendix. Translational and rotational contribution to the free energy of dissociation.Biochemistry 17, 2943–2948.
147. Ponder, J. W. and Richards, F. M. (1987) Tertiary templates for proteins. Use of packingcriteria in the enumeration of allowed sequences for different structural classes. J. Mol.Biol. 193, 775–791.

Comparative Protein Structure Modeling 857
148. Tuffery, P., Etchebest, C., Hazout, S., and Lavery, R. (1991) A new approach to the rapiddetermination of protein side chain conformations. J. Biomol. Struct. Dyn. 8, 1267–1289.
149. Mendes, J., Baptista, A. M., Carrondo, M. A., and Soares, C. M. (1999) Improved model-ing of side-chains in proteins with rotamer-based methods: a flexible rotamer model. Pro-teins 37, 530–543.
150. Dunbrack, R. L., Jr. and Cohen, F. E. (1997) Bayesian statistical analysis of protein side-chain rotamer preferences. Protein Sci. 6, 1661–1681.
151. Dunbrack, R. L. and Karplus, M. (1993) Backbone-dependent rotamer library for pro-teins. Application to side-chain prediction. J. Mol. Biol. 230, 543–574.
152. Xiang, Z. and Honig, B. (2001) Extending the accuracy limits of prediction for side-chainconformations. J. Mol. Biol. 311, 421–430.
153. Desjarlais, J. R. and Handel, T. M. (1999) Side-chain and backbone flexibility in proteincore design. J. Mol. Biol. 290, 305–318.
154. De Filippis, V., Sander, C., and Vriend, G. (1994) Predicting local structural changes thatresult from point mutations. Protein Eng. 7, 1203–1208.
155. Chung, S. Y. and Subbiah, S. (1996) How similar must a template protein be for homol-ogy modeling by side-chain packing methods? Pac. Symp. Biocomput. 126–141.
156. Cregut, D., Liautard, J. P., and Chiche, L. (1994) Homology modelling of annexin I:implicit solvation improves side-chain prediction and combination of evaluation criteriaallows recognition of different types of conformational error. Protein Eng. 7, 1333–1344.
157. Canutescu, A. A., Shelenkov, A. A., and Dunbrack, R. L., Jr. (2003) A graph-theory algo-rithm for rapid protein side-chain prediction. Protein Sci. 12, 2001–2014.
158. Eisenmenger, F., Argos, P., and Abagyan, R. (1993) A method to configure protein side-chains from the main-chain trace in homology modelling. J. Mol. Biol. 231, 849–860.
159. Lee, G. M., Varma, A., and Palsson, B. O. (1991) Application of population balance modelto the loss of hybridoma antibody productivity. Biotechnol. Prog. 7, 72–75.
160. Holm, L. and Sander, C. (1992) Fast and simple Monte Carlo algorithm for side chainoptimization in proteins: application to model building by homology. Proteins 14,213–223.
161. Lasters, I. and Desmet, J. (1993) The fuzzy-end elimination theorem: correctly imple-menting the side chain placement algorithm based on the dead-end elimination theorem.Protein Eng. 6, 717–722.
162. Looger, L. L. and Hellinga, H. W. (2001) Generalized dead-end elimination algorithmsmake large-scale protein side-chain structure prediction tractable: implications for pro-tein design and structural genomics. J. Mol. Biol. 307, 429–445.
163. Hwang, J. K. and Liao, W. F. (1995) Side-chain prediction by neural networks and simu-lated annealing optimization. Protein Eng. 8, 363–370.
164. Koehl, P. and Delarue, M. (1994) Application of a self-consistent mean field theory topredict protein side-chains conformation and estimate their conformational entropy.J. Mol. Biol. 239, 249–275.
165. Bower, M. J., Cohen, F. E., and Dunbrack, R. L., Jr. (1997) Prediction of protein side-chain rotamers from a backbone-dependent rotamer library: a new homology modelingtool. J. Mol. Biol. 267, 1268–1282.
166. Petrella, R. J., Lazaridis, T., and Karplus, M. (1998) Protein sidechain conformer predic-tion: a test of the energy function. Fold Des. 3, 353–377.
167. Jacobson, M. P., Kaminski, G. A., Friesner, R. A., and Rapp, C. S. (2002) Force fieldvalidation using protein side chain prediction. J. Phys. Chem. B 106, 11,673–11,680.
168. Liang, S. and Grishin, N. V. (2002) Side-chain modeling with an optimized scoring func-tion. Protein Sci. 11, 322–331.
169. Zemla, A., Venclovas, Moult, J., and Fidelis, K. (2001) Processing and evaluation ofpredictions in CASP4. Proteins 45 Suppl. 5, 13–21.

858 Madhusudhan et al.
170. Fischer, D., Elofsson, A., Rychlewski, L., et al. (2001) CAFASP2: The second criticalassessment of fully automated structure prediction methods. Proteins 45 Suppl. 5,171–183.
171. Bujnicki, J. M., Elofsson, A., Fischer, D., and Rychlewski, L. (2001) LiveBench-1: con-tinuous benchmarking of protein structure prediction servers. Protein Sci. 10, 352–361.
172. Eyrich, V. A., Marti-Renom, M. A., Przybylski, D., et al. (2001) EVA: continuous auto-matic evaluation of protein structure prediction servers. Bioinformatics 17, 1242–1243.
173. Koh, I. Y., Eyrich, V. A., Marti-Renom, M. A., et al. (2003) EVA: Evaluation of proteinstructure prediction servers. Nucleic Acids Res. 31, 3311–3315.
174. Srinivasan, N. and Blundell, T. L. (1993) An evaluation of the performance of an auto-mated procedure for comparative modelling of protein tertiary structure. Protein Eng. 6,501–512.
175. Coutsias, E. A., Seok, C., Jacobson, M. P., and Dill, K. A. (2004) A kinematic view ofloop closure. J. Comput. Chem. 25, 510–528.
176. Barton, G. J. and Sternberg, M. J. (1987) A strategy for the rapid multiple alignment ofprotein sequences. Confidence levels from tertiary structure comparisons. J. Mol. Biol.198, 327–337.
177. Taylor, W. R., Flores, T. P., and Orengo, C. A. (1994) Multiple protein structure align-ment. Protein Sci. 3, 1858–1870.
178. Laskowski, R. A., McArthur, A. G., and Thornton, J. M. (1998) PROCHECK: a program tocheck the stereochemical quality of portein structures. J. Appl. Crystallog. 26, 283–291.
179. Wilson, C., Gregoret, L. M., and Agard, D. A. (1993) Modeling side-chain conformation forhomologous proteins using an energy-based rotamer search. J. Mol. Biol. 229, 996–1006.
180. Sanchez, R. and Sali, A. (1998) Large-scale protein structure modeling of the Saccharo-myces cerevisiae genome. Proc. Natl. Acad. Sci. USA 95, 13,597–13,602.
181. Sippl, M. J. (1993) Boltzmann’s principle, knowledge-based mean fields and protein fold-ing. An approach to the computational determination of protein structures. J. Comput.Aided Mol. Des. 7, 473–501.
182. Pawlowski, K., Bierzynski, A., and Godzik, A. (1996) Structural diversity in a family ofhomologous proteins. J. Mol. Biol. 258, 349–366.
183. Laskowski, R. A., MacArthur, M. W., and Thornton, J. M. (1998) Validation of proteinmodels derived from experiment. Curr. Opin. Struct. Biol. 8, 631–639.
184. Laskowski, R. A., Rullmann, J. A., MacArthur, M. W., Kaptein, R., and Thornton, J. M.(1996) AQUA and PROCHECK-NMR: programs for checking the quality of protein struc-tures solved by NMR. J. Biomol. NMR 8, 477–486.
185. Oldfield, T. J. (1992) SQUID: a program for the analysis and display of data from crystal-lography and molecular dynamics. J. Mol. Graph. 10, 247–252.
186. Hooft, R. W., Vriend, G., Sander, C., and Abola, E. E. (1996) Errors in protein structures.Nature 381, 272.
187. Topham, C. M., Srinivasan, N., Thorpe, C. J., Overington, J. P., and Kalsheker, N. A. (1994)Comparative modelling of major house dust mite allergen Der p I: structure validation usingan extended environmental amino acid propensity table. Protein Eng. 7, 869–894.
188. Melo, F. and Feytmans, E. (1998) Assessing protein structures with a non-local atomicinteraction energy. J. Mol. Biol. 277, 1141–1152.
189. Zhou, H. and Zhou, Y. (2002) Distance-scaled, finite ideal-gas reference state improvesstructure-derived potentials of mean force for structure selection and stability prediction.Protein Sci. 11, 2714–2726.
190. Miwa, J. M., Ibanez-Tallon, I., Crabtree, G. W., et al. (1999) lynx1, an endogenous toxin-like modulator of nicotinic acetylcholine receptors in the mammalian CNS. Neuron 23,105–114.
Comparative Protein Structure Modeling 859
191. Johnson, M. S., Srinivasan, N., Sowdhamini, R., and Blundell, T. L. (1994) Knowledge-based protein modelling. CRC Crit. Rev. Biochem. Mol. Biol. 29, 1–68.
192. Orengo, C. A., Michie, A. D., Jones, S., et al. (1997) CATH—a hierarchic classificationof protein domain structures. Structure 5, 1093–1108.
193. Matsumoto, R., Sali, A., Ghildyal, N., Karplus, M., and Stevens, R. L. (1995) Packagingof proteases and proteoglycans in the granules of mast cells and other hematopoietic cells.A cluster of histidines on mouse mast cell protease 7 regulates its binding to heparinserglycin proteoglycans. J. Biol. Chem. 270, 19,524–19,531.
194. Xu, L. Z., Sanchez, R., Sali, A., and Heintz, N. (1996) Ligand specificity of brain lipid-binding protein. J. Biol. Chem. 271, 24,711–24,719.
195. Vakser, I. A. (1995) Protein docking for low-resolution structures. Protein Eng. 8, 371–377.196. Thompson, J. D., Plewniak, F., and Poch, O. (1999) BAliBASE: a benchmark alignment
database for the evaluation of multiple alignment programs. Bioinformatics 15, 87–88.197. Pearl, F. M., Bennett, C. F., Bray, J. E., et al. (2003) The CATH database: an extended
protein family resource for structural and functional genomics. Nucleic Acids Res. 31,452–455.
198. Benson, D. A., Karsch-Mizrachi, I., Lipman, D. J., Ostell, J., and Wheeler, D. L. (2004)GenBank: update. Nucleic Acids Res. 32 Database issue, D23–D26.
199. Lin, J., Qian, J., Greenbaum, D., et al. (2002) GeneCensus: genome comparisons in terms ofmetabolic pathway activity and protein family sharing. Nucleic Acids Res. 30, 4574–4582.
200. Bourne, P. E., Addess, K. J., Bluhm, W. F., et al. (2004) The distribution and querysystems of the RCSB Protein Data Bank. Nucleic Acids Res. 32 Database issue,D223–D225.
201. Brenner, S. E., Barken, D., and Levitt, M. (1999) The PRESAGE database for structuralgenomics. Nucleic Acids Res. 27, 251–253.
202. Andreeva, A., Howorth, D., Brenner, S. E., et al. (2004) SCOP database in 2004: refine-ments integrate structure and sequence family data. Nucleic Acids Res. 32 Database issue,D226–D229.
203. Boeckmann, B., Bairoch, A., Apweiler, R., et al. (2003) The SWISS-PROT proteinknowledgebase and its supplement TrEMBL in 2003. Nucleic Acids Res. 31, 365–370.
204. Alexandrov, N. N., Nussinov, R., and Zimmer, R. M. (1996) Fast protein fold recognitionvia sequence to structure alignment and contact capacity potentials. Pac. Symp.Biocomput. 53–72.
205. Godzik, A., Kolinski, A., and Skolnick, J. (1992) Topology fingerprint approach to theinverse protein folding problem. J. Mol. Biol. 227, 227–238.
206. Rost, B. and Liu, J. (2003) The PredictProtein server. Nucleic Acids Res. 31, 3300–3304.207. Flockner, H., Braxenthaler, M., Lackner, P., et al. (1995) Progress in fold recognition.
Proteins 23, 376–386.208. Mallick, P., Weiss, R., and Eisenberg, D. (2002) The directional atomic solvation energy:
an atom-based potential for the assignment of protein sequences to known folds. Proc.Natl. Acad. Sci. USA 99, 16,041–16,046.
209. Gough, J. and Chothia, C. (2002) SUPERFAMILY: HMMs representing all proteins ofknown structure. SCOP sequence searches, alignments and genome assignments. NucleicAcids Res. 30, 268–272.
210. Worley, K. C., Culpepper, P., Wiese, B. A., and Smith, R. F. (1998) BEAUTY-X:enhanced BLAST searches for DNA queries. Bioinformatics 14, 890–891.
211. Tatusova, T. A. and Madden, T. L. (1999) BLAST 2 Sequences, a new tool for comparingprotein and nucleotide sequences. FEMS Microbiol. Lett. 174, 247–250.
212. Henikoff, J. G., Pietrokovski, S., McCallum, C. M., and Henikoff, S. (2000) Blocks-basedmethods for detecting protein homology. Electrophoresis 21, 1700–1706.

860 Madhusudhan et al.
213. Corpet, F. (1988) Multiple sequence alignment with hierarchical clustering. Nucleic AcidsRes. 16, 10,881–10,890.
214. Ye, Y., Jaroszewski, L., Li, W., and Godzik, A. (2003) A segment alignment approach toprotein comparison. Bioinformatics 19, 742.
215. Karplus, K., Karchin, R., Draper, J., et al. (2003) Combining local-structure, fold-recogni-tion, and new fold methods for protein structure prediction. Proteins 53 Suppl. 6, 491–496.
216. Notredame, C., Higgins, D. G., and Heringa, J. (2000) T-Coffee: A novel method for fastand accurate multiple sequence alignment. J. Mol. Biol. 302, 205–217.
217. Edgar, R. C. and Sjolander, K. (2004) COACH: profile-profile alignment of protein fami-lies using hidden Markov models. Bioinformatics 20(8), 1309–1318.
218. Eswar, N., John, B., Mirkovic, N., et al. (2003) Tools for comparative protein structuremodeling and analysis. Nucleic Acids Res. 31, 3375–3380.
219. Pearson, W. R. (1995) Comparison of methods for searching protein sequence databases.Protein Sci. 4, 1145–1160.
220. Abagyan, R., Frishman, D., and Argos, P. (1994) Recognition of distantly related proteinsthrough energy calculations. Proteins 19, 132–140.
221. Schwede, T., Kopp, J., Guex, N., and Peitsch, M. C. (2003) SWISS-MODEL: an auto-mated protein homology-modeling server. Nucleic Acids Res. 31, 3381–3385.
222. Vriend, G. (1990) WHAT IF: a molecular modeling and drug design program. J. Mol.Graph. 8, 56.
223. Colovos, C. and Yeates, T. O. (1993) Verification of protein structures: patterns ofnonbonded atomic interactions. Protein Sci. 2, 1511–1519.
224. Pontius, J., Richelle, J., and Wodak, S. J. (1996) Deviations from standard atomic vol-umes as a quality measure for protein crystal structures. J. Mol. Biol. 264, 121–136.
225. Hooft, R. W., Sander, C., and Vriend, G. (1996) Verification of protein structure: side-chain planarity. J. Appl. Crystallog. 714–716.
226. Moult, J., Fidelis, K., Zemla, A., and Hubbard, T. (2001) Critical assessment of methodsof protein structure prediction (CASP): Round IV. Proteins 45 Suppl. 5, 2–7.
227. Kahsay, R. Y., Wang, G., Dongre, N., Gao, G., and Dunbrack, R. L., Jr. (2002) CASA: aserver for the critical assessment of protein sequence alignment accuracy. Bioinformatics18, 496–497.
228. Livingstone, C. D. and Barton, G. J. (1993) Protein sequence alignments: a strategy forthe hierarchical analysis of residue conservation. Comput. Appl. Biosci. 9, 745–756.
229. Beckmann, R., Spahn, C. M., Eswar, N., et al. (2001) Architecture of the protein-conduct-ing channel associated with the translating 80S ribosome. Cell 107, 361–372.