comparative study of established test methods for aggregate · pdf filecomparative study of...
TRANSCRIPT

UPTEC W13044
Examensarbete 30 hpFebruari 2014
Comparative study of established test methods for aggregate strength and durability of Archean rocks from Botswana
Jessica Stålheim


ABSTRACTComparative study of established test methods for aggregate strength and durabilityof Archean rocks from BotswanaJessica Stålheim
In the current situation, river sand is used for building of roads and as raw material forconcrete in Botswana. River sand is a finite resource and important to preserve as itacts as natural water purification, groundwater aquifer and protection against soil erosion.Mining of bedrock may be a good alternative to replace the river sand with crushed rock(aggregates) in concrete and as road materials.
The main purpose of this thesis was to determine if the rock grain size can be usedas a parameter to indicate durability and rock strength. It was also of interest to find outif the grain size correlates with established technical analysis and strength test methods.This knowledge can be used as a prospecting tool when searching for new quarry sites inthe future.
In this master’s thesis, rock samples from the Gaborone granite complex have beenanalysed to examine how established test methods and the mineral grain size correspondswith the rock strength. By comparing technical properties (Los Angeles (LA) value ,aggregate crushing value (ACV), aggregate impact value (AIV) and 10 percent fines ag-gregate crushing test (10 % FACT)) with quantitative analysis (mineral grain size andmineral grain size distribution), it is possible to determine the mineral grain size corre-spondence to rock strength. Generally the result show that more fine-grained granitesshow better technical properties than more coarse-grained granites. The calculated meangrain size show weak negative correlation to ACV value, and a positive correlation to LA-, AIV- and 10 % FACT values. Best correlation can be seen between mean grain size andLA values (R2= 0.61) and AIV values (R2= 0.58). Low mean grain size tend to give bettertechnical properties in form of lower LA- and AIV values. The cumulative distributioncurve show that a high concentration of very fine material or fine material tend to con-tribute to a lower LA value. The results indicate that equigranular rocks with low meangrain size contributes to good technical properties, but when it comes to uneven grainedrock more factors must be taken into account to estimate technical properties.
Keywords: Los Angeles value, Aggregate crushing value, Aggregate impact value, 10percent aggregate crushing value test, mean grain size, mean grain size distribution
Copyright © Jessica Stålheim and the Department of Earth ScienceUppsala University UPTEC W13044 ISSN 1401-5765Published digitally at the Department of Earth Sciences, Uppsala University, 2014
I

REFERATJämförande studie av etablerade testmetoder för ballastmaterials styrke- och håll-barhetsegenskaper hos Arkeiska bergarter i BotswanaJessica Stålheim
I dagsläget används flodsand i Botswana vid byggnation av vägar samt råmaterial förbetongkonstruktioner. Flodsand är en ändlig resurs och viktig att bevara då den mednuvarande brytningstakt kommer att försvinna inom ett årtionde. I vissa områden utgörsanden dessutom en akvifär för grundvatten. Ett alternativ till den viktiga flodsanden äratt ersätta denna med krossat berg (aggregat).
Huvudsyftet med detta examensarbete var att undersöka om bergets kornstorleken kananvändas som parameter för att indikera ballastmaterialets styrke- och hållbarhetsegen-skaper. Det är också av intresse att undersöka om kornstorleken korrelerar med redanetablerade styrketestmetoder. Denna kunskap kan användas som prospekteringsverktygför att hitta lämpliga bergtäkter i framtiden.
I detta examensarbete har bergartsprover från Gaboronegraniten analyserats för attbestämma hur bergkrossmaterialets styrka påverkas av bergets kornstorleken. Genom attjämföra tekniska egenskaper (Los Angeles (LA) value, aggregate impact value (AIV), ag-gregate crushing value (ACV), 10 percent fines aggregate crushing test (10 % FACT)) medkvantitativa analyser (kornstorlek och kornstorleksfördelning\ ) för graniterna så kan korn-storlekens betydelse för dessa parametrar bestämmas. Resultaten visar generellt att merfinkorniga graniter uppvisar bättre tekniska egenskaper än mera grovkorniga. Den uträk-nade medelkornstorleken för granitproverna visar negativ svag korrelation med ACV-värderna, och positiv korrelation med LA-, AIV- och 10 % FACT-värdena. Bäst kor-relation visar medelkornstorleken med LA-värdena (R2= 0,61) och AIV-värdena (R2=0,58). Låg medelkornstorlek tenderar att ge bättre tekniska egenskaper i form av lägreLA- och AIV-värden. Kumulativa distributionskurvor påvisar att hög andel mycket finteller fint material i granitproven tenderar bidra till ett lägre LA-värde. Resultaten visar attjämnkorniga bergarter med finare kornstorlek generellt bidrar till bra tekniska egenskaper,men för ojämnkorniga bergarter spelar fler faktorer in för de tekniska egenskaperna.
Nyckelord: Los Angeles value, Aggregate crushing value, Aggregate impact value,10 percent aggregate crushing value test, medelkornstorlek, kumulativ distribution
Copyright © Jessica Stålheim och Institutionen för geovetenskaper,Uppsala Universitet UPTEC W13044 ISSN 1401-5765Publicerad digitalt vid institutionen för geovetenskaper, Uppsala Universitet, 2014
II

PREFACEThis master’s thesis is the last part of the Master of Science program in Water and En-vironmental Engineering of 30 ECTS at Uppsala University. It started in April 2013 andwas performed during the summer. The major part of the thesis was carried out in Up-psala, Sweden, one week was spent in Botswana doing field studies and three days wasspent at CBI Betonginstitutet (CBI) in Borås performing microscopic analysis. The the-sis was made in cooperation with Sveriges Geologiska Undersökning (SGU) and CBI,and was a part of MeetingPoints Mining (MPM) project in Southern Africa financed bySIDA (Swedish International Development Agency). The supervisors of the thesis wasMattias Göransson at SGU and Karin Appelquist at CBI. The subject reviewer was KarinHögdahl at the Department of Earth science at Uppsala University. In order to evaluatethe obtained results from the performed measurements complementary data were needed.This data were supplied by several people at the Geological survey of Botswana (DGS)in Lobatse.
I would like to express my special thanks and gratitude to my supervisor MattiasGöransson for all geological knowledge, review of the report and all the help and guidancehe has given me during this time. I also thank my co-supervisor Karin Appelquist forher guidance and assistance with the microscopic analysis at CBI, and her review of thereport. Jan-Erik Lindqvist, thanks for your help with the 3D distribution at CBI. A specialthanks to Karin Högdahl who critically examined my report and helped me improve mythesis. In addition, I would like to thank all the people from SGU and DGS for sharingtheir expertise before, during and after the trip to Botswana. Thank you for an interestingand valuable stay, this thesis would not have been done without your guidance and help.
III

POPULÄRVETENSKAPLIG SAMMANFATTNINGBotswana är en av de snabbast växande ekonomierna i världen och runt huvudstadenGaborone pågår ett ständigt byggande av fler bostäder och bättre vägar. Även fast Botswanabestår av 70 % öken råder det brist på rätt sandmaterial för ballast i betong och vägar.Ökensanden är för finkornig för att kunna används som betongmaterial och därför oan-vändbar. I dagsläget tas sand från Botswanas floder och används som ballast i betong.Denna sand fungerar väldigt bra som betongmaterial men den är en ändlig resurs somkommer att ta slut inom ett årtionde om samma byggnadstempo hålls. Flodsanden böräven bevaras av miljömässiga skäl och för att Botswana ska kunna fortsätta sin utveck-lingstakt även om tio år krävs en lösning på ballastproblemet. En lösning på problemetär att krossat berg kan ersätta flodsanden och på så vis kan utvecklingen av Botswanafortsätta.
MeetingPoints Mining med ekonomisk finansiering av SIDA håller i dagsläget på attkartlägga Botswanas berggrund för att finna lämpliga platser för att bryta berg. Olikabergarter har skilda egenskaper när det gäller styrka och hållbarhet och är därför olikalämpade som användning i ballast. För att ta reda på om en bergart är lämpad som bal-lastmaterial har en rad etablerade styrketester utförts på 28 graniter av den geologiskaundersökningen i Botswana.
Huvudsyftet med detta examensarbete är att undersöka om mineralkornstorleken hosen bergart kan användas som indikator för att uppskatta ett bergmaterials styrke- ochhållbarhetsegenskaper. Tidigare studier tyder på att en mindre medelkornstorlek ger ettstarkare bergsmaterial än berg med större medelkornstorlek.
I detta examensarbete har 28 bergartsprover från Gaboronegraniten analyserats. Styr-ketestmetoderna som dessa granitprover genomgått är Los Angeles value test (LA), ag-gregate impact value test (AIV), aggregate crushing test (ACV) och 10 percent fines ag-gregate crushing value test (10 % FACT). För varje prov finns även data för grain densitetsamt vattenabsorption. Alla prover har tyvärr inte resultat från alla styrketester. Av dessa28 bergartsprover har sex prover även genomgått en petrografisk analys där mineralin-nehåll och textur bestämts, samt en mineralkornstorleksfördelning. Mineralkornstorleks-fördelningen delar in kornen i olika storleksintervall så det blir möjligt att se hur mångaprocent av kornen som är fin-, medel-, respektive grovkorniga. Genom att jämföra detekniska styrkeparametrar med kvantitativa analyser såsom mineralkornstorlek och min-eralkornstorleksfördelning så kan kornstorlekens betydelse för dessa parametrar bestäm-mas.
Resultaten visar generellt att mer finkorniga graniter uppvisar bättre tekniska styrkee-genskaper än mera grovkorniga graniter. Medelkornstorleken korrelerar bra med bådeLA-värdena (R2= 0,66) och AIV-värdena (R2= 0,58). Låg medelkornstorlek tenderar attge bättre tekniska egenskaper i form av lägre LA- och AIV-värden. Fördelingen av min-eralkornen visar att hög andel väldigt fint eller fint material i granitproven tenderar attbidra till ett lägre LA-värde. Resultaten visar att bergarter som är väldigt jämnkornigaoch finkorniga generellt bidrar till bra tekniska egenskaper hos ballastmaterialer, men förojämnkorniga bergarter spelar fler faktorer in än kornstorlek för de tekniska egenskaperna.Kornstorleken kan alltså ge en grov uppskattning om bergets tekniska egenskaper ochkan på så vis användas som indikator för att hitta lämpliga platser att bryta berg för bal-last. Det är dock rekommenderat att utföra någon slags mikroskopisk undersökning innanbeslut fattas eftersom endast makroskopisk bedömning är osäker.
IV

WORDLIST10 % FACT Ten percent fines aggregate crushing test.ACV Aggregate crushing value.Aggregates Crushed rock.Inselberg An isolated hill or small mountain that rises abruptly from a gently
sloping or virtually level surrounding plain. Erosion remnant from anearlier mountain-range.
AIV Aggregate impact value .Archean Geologic eon 2500-4000 million years ago.CBI The Swedish Cement and Concrete Research Institute (CBI).DGS Department of Geological Surveys – Republic of Botswana.Equigranular An equigranular rock is mainly composed by mineral of equal size.Felsic A felsic rock is dominated by quartz and feldspar.Fennoscandianshield
The Fennoscandian shield is a stable rock area composed by rocks ofPrecambrian age.
Granophyre Subvolcanic rock type.Hydrothermal Hydrothermal alteration is the result of the interaction of a rock with a
high-temperature fluid.LA Los Angeles value.Matrix The Matrix is a fine grained mass of material which contain
significantly larger embedded grains.MPM MeetingPoints MiningPermian The Permian is a geologic period which extends from 299 to 252
million years ago.Porphyritic A porphyritic rock has a distinct difference in the size of the crystals,
with at least one group of crystals obviously larger than another group,phenocrysts.
Proterozoic Geologic eon 542-2500 million years ago.QAP Quartz, Alkali feldspar, Plagioclase.Sericite Sericite is a fine grained mica of Orthoclase or Plagioclase feldspars.SGU Sveriges Geologiska Undersökning; Swedish geological survey.Syenogranite Granite poor in quartz.Transvaalsupergroup
Sedimentary rocks of an age of 2600 to 2065 million year located innorthern South Africa and southern Botswana.
Waterberg-formation
Red sandstones of an age of 2045 to 1990 million years located innorthern South Africa.
V

Contents
1 INTRODUCTION 3
2 GEOLOGICAL BACKGROUND AND SAMPLING 3
2.1 REGIONAL GEOLOGY . . . . . . . . . . . . . . . . . . . . . . . . . 42.2 GEOLOGY OF THE GABORONE GRANITE . . . . . . . . . . . . 4
2.2.1 Thamaga granite . . . . . . . . . . . . . . . . . . . . . . . . . . 52.2.2 Kgale granite . . . . . . . . . . . . . . . . . . . . . . . . . . . . 62.2.3 Ntlhantlhe Microgranite . . . . . . . . . . . . . . . . . . . . . . 72.2.4 Kanye Volcanics . . . . . . . . . . . . . . . . . . . . . . . . . . 7
3 METHODS 8
3.1 SAMPLING AND MACRO ANALYSIS . . . . . . . . . . . . . . . . . . 83.2 TECHNICAL ANALYSIS . . . . . . . . . . . . . . . . . . . . . . . . . 9
3.2.1 Aggregate impact value test (AIV) . . . . . . . . . . . . . . . . . 103.2.2 Los Angeles value test (LA) . . . . . . . . . . . . . . . . . . . . 103.2.3 Aggregate crushing value test (ACV) . . . . . . . . . . . . . . . 113.2.4 Ten percent fines aggregate crushing test (10 % FACT) . . . . . . 123.2.5 Grain density . . . . . . . . . . . . . . . . . . . . . . . . . . . . 13
3.3 WATER ABSORPTION ANALYSIS . . . . . . . . . . . . . . . . . . . 133.4 MICROSCOPY ANALYSIS . . . . . . . . . . . . . . . . . . . . . . . . 14
3.4.1 Modal analysis and mineralogical composition of rock type de-termination . . . . . . . . . . . . . . . . . . . . . . . . . . . . . 14
3.4.2 Mineral grain size distribution analysis . . . . . . . . . . . . . . 14
4 RESULTS 15
4.1 MACRO ANALYSIS . . . . . . . . . . . . . . . . . . . . . . . . . . . . 154.1.1 Bokaa (BKGR1) . . . . . . . . . . . . . . . . . . . . . . . . . . 154.1.2 Fikeng (FKNGR1) . . . . . . . . . . . . . . . . . . . . . . . . . 164.1.3 Fikeng (FKNGR2) . . . . . . . . . . . . . . . . . . . . . . . . . 164.1.4 Kgomokasitwa (KMSTGR1) . . . . . . . . . . . . . . . . . . . . 164.1.5 Kgomokasitwa (KMSTGR2) . . . . . . . . . . . . . . . . . . . . 164.1.6 Letlhakane (LTKWF1) . . . . . . . . . . . . . . . . . . . . . . . 17
4.2 TECHNICAL ANALYSIS . . . . . . . . . . . . . . . . . . . . . . . . . 174.3 WATER ABSORPTION ANALYSIS . . . . . . . . . . . . . . . . . . . . 204.4 MICROSCOPY ANALYSIS . . . . . . . . . . . . . . . . . . . . . . . . 20
4.4.1 Modal analysis . . . . . . . . . . . . . . . . . . . . . . . . . . . 204.4.1.1 Bokaa (BKGR1) . . . . . . . . . . . . . . . . . . . . 204.4.1.2 Fikeng (FKNGR1) . . . . . . . . . . . . . . . . . . . 214.4.1.3 Fikeng (FKNGR2) . . . . . . . . . . . . . . . . . . . 214.4.1.4 Kgomokasitwa (KMSTGR1) . . . . . . . . . . . . . . 224.4.1.5 Kgomokasitwa (KMSTGR2) . . . . . . . . . . . . . . 224.4.1.6 Letlhakane (LTKWF1) . . . . . . . . . . . . . . . . . 23
4.4.2 Mineralogical composition of rock type determination . . . . . . 234.4.3 Mineral grain size distribution analysis . . . . . . . . . . . . . . 24
5 DISCUSSION AND CONCLUSIONS 29
1

6 REFERENCES 31
7 APPENDIX 33
2

1 INTRODUCTION
Sand and gravel are the basic materials used in most construction projects such as roads.In Botswana the major raw material for road construction is the local river sand. Due topoor, annual inflow of sand and the urban development of the capital Gaborone area hasescalated, the few resources that exist today are decreasing rapidly. Consequently, riversare eroding and may cause significant damage to the environment and delicate ecosys-tems. To supply the society with a proper raw material for building the transport distanceincreases each year with the result of higher costs and higher carbon dioxide releases. Amajor change from the use of river sand to crushed rock (aggregates) is urgently neededin the near future to prevent a halt in development due to lack of material.
MeetingPoints Mining (MPM) has been working together with the Department of Ge-ological Survey of Botswana (DGS) since 2010 in order to find appropriate aggregatesin Botswana for roads and concrete in building structures. The main focus of the MPM-project, of which one is the area of Greater Gaborone, is to put forward suitable quarrylocations. A systematic sampling of dominating rocks of the Gaborone area has beencompleted. According to national requirements of aggregates, a set of different test meth-ods have been established and performed to evaluate the proper use of the sample material.Strength test methods that have been carried out in this project include Los Angeles (LA)value test, aggregate crushing value (ACV) test, aggregate impact value (AIV) test and 10percent fines aggregate crushing value test (10 % FACT). Descriptions for all rock sam-ples are based on field observations, study of rock samples and microscopy analysis. Asstrength properties of aggregates in most cases are crucial requirements for the end use,a proper understanding of the underlying, geological parameters will be very helpful forsocietal planning. The results of the analysis will determine whether granite is suitable asaggregates for road.
The main purpose of this thesis is to determine if the grain size can be used as a pa-rameter to indicate durability and aggregate strength. It was also of interest to investigatehow established technical analysis correlate with each other and quantitative analysis asmineral grain size, mineral distribution and mineral content. This knowledge can be usedas a prospecting tool when searching for new quarry sites, and assess whether the localgranite rock samples in this study are suitable as aggregate for road construction.
As earlier studies have pointed out, the grain size and the grain size distribution are im-portant parameters for explaining the mechanical properties for aggregates derived fromrock material of different status (Åkesson, et al,. 2001). In general a more fine-grainedrock is stronger than a coarse grained one (Lundqvist and Göransson, 2001). Earlier stud-ies are comparing different rock types, but in this thesis a “single-rock type” study hasbeen performed comparing only granites.
2 GEOLOGICAL BACKGROUND AND SAMPLING
The investigation area is located in the greater Gaborone (Fig. 1). The river sand resourcesare decreasing rapidly and every day means longer transport to supply the infrastructuredevelopment in greater Gaborone. Today the sand is collected from the Serowe area, atransport distance of almost 200 km. The price for one tonne sand has doubled due to thetransport distance from Gaborone, and will increase further as the collection of river sandgoes farther and farther up north.
3

Figure 1: Map over Botswana.
2.1 REGIONAL GEOLOGY
Most of the basement rocks in the area of Gaborone belong to the Kaapvaal Craton whichis an ancient stable segment that also is found in the northern parts of South Africaand southern Zimbabwe. The Kaapvaal domain consists of old Archean metamorphicgneisses and felsic volcanic rocks, the Kanye Volcanic both intruded by granites and mi-nor gabbros, the Gaborone complex. The gneisses are suggested to be the country rockto the younger Archean, intrusive igneous rocks, the Gaborone granite complex. TheArchean basement is covered by the Proterozoic, Waterberg- and Vendertorps-formation,and younger non-metamorphic sedimentary and volcanic supracrustal rocks. Locally theolder rocks have been intruded in Perm by ultramafic to felsic igneous complexes, sillsand dykes.
2.2 GEOLOGY OF THE GABORONE GRANITE
A major part of the bedrock in the Gaborone area consists of the Gaborone granite com-plex. This granite pluton of south east Botswana and adjacent parts of South Africa hasa surface area of over 5000 km2 (Key and Wright, 1982). Several varieties, regardinggrain-size, exist within the complex. The whole granitic complex is believed to have beenformed from a single, highly viscous magma emplaced at a high crustal level (Key andWright, 1982) at about 2780 Ma (Moore, et al,. 2002). The central part of the complexconsists of a coarse grained, in some places mantled rapakivi textured granite (Thamagagranite), (Fig. 2). The Thamaga granite is similar to the Fennoscandian rapakivi granites.
The dominating rapakivi textured granite is surrounded by successive shells of morefine-grained rocks of granitic composition. An equigranular, medium-grained granite(Kgale granite) (Fig. 2), a small-porphyritic granophyre (Ntlhantlhe granite) and an
4

aphanitic felsic volcanic rock (Kanye volcanics). The Gaborone granite, especially theKgale and the Ntlhantlhe type, is highly enriched in quartz and microcline. It is quitecommon for semi-arid regions that sole hills, inselberg, that persists the weathering betterthan its surrounding, is highly enriched in microcline. As pointed out by Pye (1986), if“other things being equal, microcline and quartz enriched granitoid rock weather moreslowly than their less microcline counterparts”, for example tonalities. For this reason,rocks like the Gaborone granite most likely will stand out as an alternative material toriver sand as a commodity for road constructions.
Figure 2: Gaborone granite complex. Illustrative image of the magma body. Modifiedfrom Key & Wright (1982).
2.2.1 Thamaga granite
Thamaga granites consist of coarse grained, porphyritic rapakivi textured granites andsubordinate microgranites. The ground mass of the porphyritic granophyres and micro-granite accords mostly with the interior Thamaga granite (Key and Wright, 1982) al-though the latter contain more mafic minerals (Fig. 3a). The petrography of the Thamagagranite is very complex. Feldspar occurs either in the ground mass or as phenocrysts andcontains microcline microperthite and albitic plagioclase (Key and Wright, 1982). Thephenocryst varies considerably in size but rarely exceed 2 cm in length and the shaperange from tabular to ovoidal (Fig. 3b). The Thamaga granite has a similar texture as theKgale granite except for the lack of regular lamellar intergrowths and the occurrence ofzonal plagioclase.
5
(a) (b)
Figure 3: a) Thamaga granite, coarse-grained. b) Mantled phenocryst about 2 cm length.
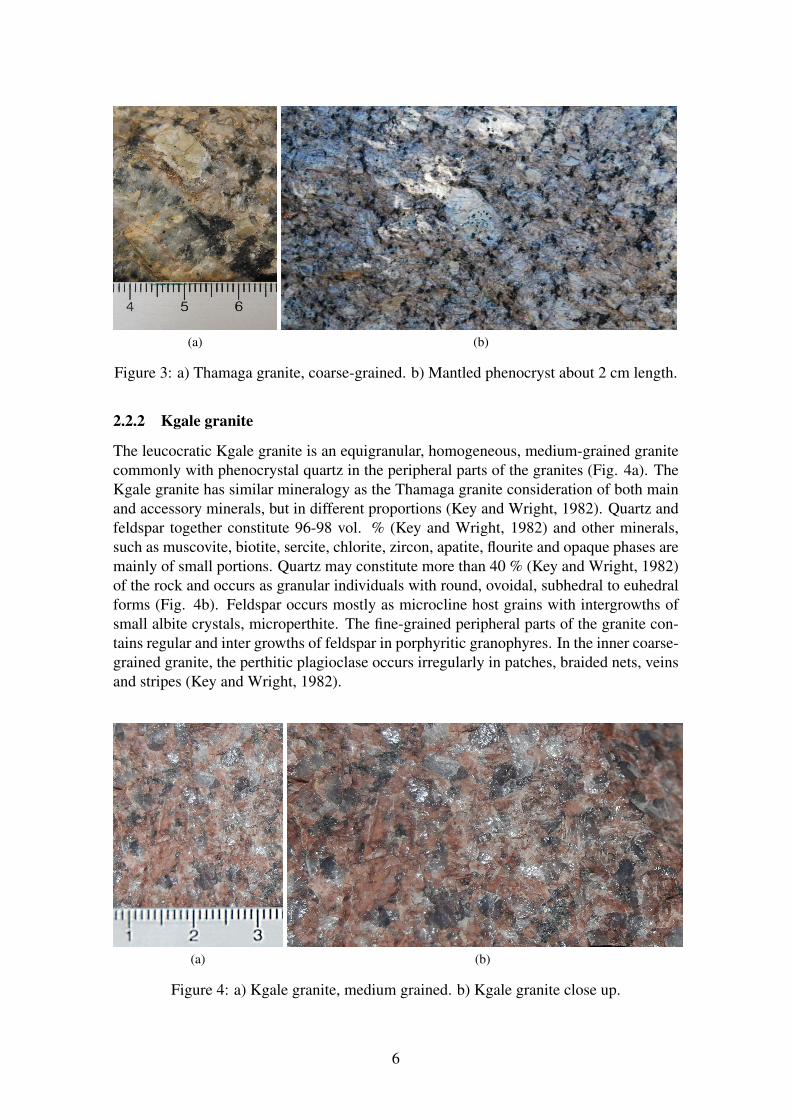
2.2.2 Kgale granite
The leucocratic Kgale granite is an equigranular, homogeneous, medium-grained granitecommonly with phenocrystal quartz in the peripheral parts of the granites (Fig. 4a). TheKgale granite has similar mineralogy as the Thamaga granite consideration of both mainand accessory minerals, but in different proportions (Key and Wright, 1982). Quartz andfeldspar together constitute 96-98 vol. % (Key and Wright, 1982) and other minerals,such as muscovite, biotite, sercite, chlorite, zircon, apatite, flourite and opaque phases aremainly of small portions. Quartz may constitute more than 40 % (Key and Wright, 1982)of the rock and occurs as granular individuals with round, ovoidal, subhedral to euhedralforms (Fig. 4b). Feldspar occurs mostly as microcline host grains with intergrowths ofsmall albite crystals, microperthite. The fine-grained peripheral parts of the granite con-tains regular and inter growths of feldspar in porphyritic granophyres. In the inner coarse-grained granite, the perthitic plagioclase occurs irregularly in patches, braided nets, veinsand stripes (Key and Wright, 1982).
(a) (b)
Figure 4: a) Kgale granite, medium grained. b) Kgale granite close up.
6

2.2.3 Ntlhantlhe Microgranite
The Ntlhantlhe Microgranite represents a border zone between the Kgale granite and theKanye Volcanics, it is rarely very persistent, usually less than 20 meters but can some-times be up to 80 meters wide. Just over a few meters the felsites changes into the Ntl-hantlhe Microgranite (porphyritic granophyre or microgranites) and the texture of therock becomes more granular and often complemented with feldspar phenocrysts. Thephenocrysts are randomly oriented and up to 5 mm in length (Fig. 5a and Fig. 5b) andoccasionally include pyroxene (Key and Wright, 1982).
(a) (b)
Figure 5: a) Microgranite, fine-grained. b) Microgranite close up.
2.2.4 Kanye Volcanics
Kanye Volcanics are rhyolites (felsites) comprising strongly jointed, homogeneous fine-grained to aphanitic rocks with sporadic feldspar phenocrysts (Key and Wright, 1982).The thickness of the Kanye Volcanics is unknown but has an estimated range of between500 and 1300 m (Moore, et al., 2002). The Felsite shows feldspar phenocrysts which areheavily jointed and corroded, and often with a marked elongation (Fig 6). The Felsiticground mass shows bands and streaks of intersected mineral aggregates consisting com-binations of quartz, feldspar, biotite, calcite, opaque phases, leucoxene, titanite, apatiteand zircon (Key and Wright, 1982).
7

Figure 6: Felsite, very fine-grained. Photo Mattias Göransson, SGU.
3 METHODS
3.1 SAMPLING AND MACRO ANALYSIS
Granites were collected from 28 different sites in the Gaborone granite complex by theGeological survey of Botswana (DGS). Approximately 80 kg of fresh, non-weatheredrock boulders were collected from each site using a sledgehammer and an iron-rod. Ev-ery sample is connected to specific gps-coordinates and has been given a name accordingto the nearby local village name. A macro description for every sample site was done byDGS and contain description of the grain size divided into fine-, medium-, and coarse-grained rock (fine grained < 1.0 mm, medium grained = 1.0 - 5.0 mm, coarse grained >5.0 mm), as well as a description of the color, obvious minerals and textures. A macrodescription describes what has been observed in field with no microscopical analysis.The granites were divided into the four Gaborone granite complex varieties of granites,regarding grain-size (Thamaga granites, Kgale granites, Ntlhantlhe Microgranite and fel-sites from Kanye Volcanics).
Six granite samples were selected from the 28 samples for closer examinations re-garding mineral grain size distribution analysis (Fig.7). These samples were chosen dueto already existing thin-section and modal analysis from each sample site. The selectedsamples are located within the Gaborone granite complex, see coordinates in Table. 1.One sample is located in Letlhakane area (LTKWF1), one sample in Bokaa (BKGR1),two samples in Fikeng (FKNGR1 and FKNGR2) and two samples in Kgomokasitwa(KMSTGR1 and KMSTGR2). The samples represent different varieties of felsite, Kgalegranite and Nthantlhe microgranite. Unfortunately no Thamaga granite is within the se-lected sample sites due to too few technical data of AIV, ACV, LA and 10 % FACT.
8

Figure 7: Bedrock map over Gaborone area. The figure show the location of the sixselected granites.
Table 1: Locality name, sample codes and coordinates.
Locality name Sample code Granite type Coordinates
Latitude Longitude
Letlhakane LTKWF 1 Felsite -24.823 25.312Bokaa BKGR 1 Kgale granite -24.432 26.047Fikeng FKNGR 1 Kgale granite -24.758 25.724Fikeng FKNGR 2 Kgale granite -24.776 25.701
Kgomokasitwa KMSTGR 1 Kgale granite -25.066 25.632Kgomokasitwa KMSTGR 2 Microgranite -25.066 25.634
3.2 TECHNICAL ANALYSIS
It is essential to be able to assess the quality of the rock material and thereby its suitabil-ity for use as aggregates for road construction. This is done by examining the technicalproperties of the rock through standard methods. This study is focused on technical anal-ysis which are used for quantitative evaluation of aggregate quality for road construction.The technical methods are described below and all technical analyses except aggregatecrushing value test and 10 percent fines aggregate crushing test have been carried out by
9

DGS in their laboratory. The ACV and 10 % FACT have been carried out in a commer-cial laboratory. All technical analysis described are approved methods and included inthe national transport administrations requirements for aggregates in different parts of theworld. However, only the Los Angeles value test is still being used in Sweden and theEuropean Union.
3.2.1 Aggregate impact value test (AIV)
Aggregate impact value test correspond to the aggregates toughness to resist breakinginto smaller pieces and are carried out according to SANS 6239:2012 (South Africannational standard, 2012b). Aggregate impact values below 10 are regarded as strong, andaggregate impact values above 35 represent poor technical values and too weak for usein road surfaces. The test sample should be crushed into 10-12.5 mm fractions beforethe test begin. The aggregate test sample should be oven-dried at a temperature of 100-1100C for four hours. After the sample has been cooled the measure should be aboutone-third full with the test samples in a cylindrical measure and tamped with 25 strokesof the tamping rod. The tamping rod is a straight metal rod of circular cross section,10 mm in diameter and 230 mm long, rounded at one end. Further quantity of sampleaggregates is then added up to two-third full in the cylinder and further tamping of 25strokes are given. At last the the cylindrical measure is filled to overflow with test sampleand tamped 25 more times with the tamping rod. The tamping rod is used to strike offthe excess aggregates and the net weight of the remaining aggregates is measured as m0.The weight of the aggregates is used to split the aggregates in two identical tests. One ofthese identical tests samples are then placed in a cup at the base of the machine at a fixedposition (Fig. 8a). To complete the tamping procedure the test is tamped with 25 strokesof the tamping rod before a 14 kg hammer is allowed to fall freely on the aggregates for15 times at a hight of 380 mm the upper surface of the aggregates in the cup. Finally thecrushed aggregates are removed and sieved on a 2.36 mm sieve. The aggregates whichpassed the sieve are weighed as m1, and the aggregates still on the sieve are also weighed,m2 . If these two masses together weigh less than the initial weight m0 by more than 1gram, a fresh test should be done and the result discarded.
The aggregate impact value is expressed as a percentage of the original mass (Equation1).
AIV = 100∗m1
m0(1)
3.2.2 Los Angeles value test (LA)
The Los Angeles value reflects the rock’s resistance to fragmentation and were carried outaccording to SANS 5846:2006 (South African national standard, 2006b). Los Angelesvalues below 15 % are regarded as good and values above 25 % are regarded as poorresistance with regard to fragmentation. The aggregates for the Los Angeles test shouldbe crushed into 10-14 mm fractions before the test begin. For the Los Angeles test itis necessary to have approximately 5 kg of this fraction. The sample is weighed and theweight note as m0. The test aggregates are placed in the Los Angeles machine all togetherwith 11 steel spheres (390-445 g). After 500 revelations the sample content should beemptied in a bowl and the steel spheres be put out and laid aside. The sample content
10

is now sieved though a 10.0 mm, 6.7 mm and 1.6 mm sieve in a machine shaker for 10minutes. The content is removed from the sieves, weighed and the weight note as m1.The Los Angeles value is calculated as a percentage of the original mass of the sample(Equation. 2).
LA =m0 −m1
50(2)
3.2.3 Aggregate crushing value test (ACV)
The aggregate crushing value is a relative measure of the resistance of an aggregate tocrushing under a gradually applied compressive load. The ACV tests were carried outaccording to SANS 3001-AG10:2012 (South African national standard, 2012a). ACVdetermines the percent of fines produced under a prescribed load. Low values indicate amore resistant rock and a higher quality of pavement. An aggregates crushing value under29 is regarded adequate for road materials. The aggregates should be crushed and thensieved through 12.5 mm and retained on 10.0 mm sieve, the sample fraction. The sievedrock aggregates should thereafter be oven dried for 3-4 hours at 100 to 1100C. Afterthe sample is cooled the weight of the aggregates is measured as m0. The cylindricalmeasure apparatus is filled with 3 layers, each layer tamped 25 times of a tamping rod.The apparatus is then placed in the compression testing machine (Fig. 8b). The surfaceof the aggregates is leveled and the plunger installed. The compression testing machineis loaded to achieve 400 kN in 10 minutes. When this step is done the load is releasedand the sample is sieved through a 2.36 mm IS Sieve. The aggregates which passed thesieved should be weight and the weight is noted as m1. Two values are produced for eachsample and values should be within a value of 1 (South African national standard, 2012).
The aggregate crushing value is expressed as a percentage of the original mass (Equa-tion 3).
ACV = 100∗m1
m0(3)
To assess the durability of an aggregate the sample is also undertaken an ACV-wettest. The sample undergoes the same procedure as the dry test except that it is immersedin water to make the rock soaked. A wet/dry ratio greater than 75 % indicates satisfactorydurability.
11

(a) (b)
Figure 8: a) Apparatus for the aggregate impact value test, Modified from Millard (1993).b) Apparatus for the ACV and 10 %FACT test. Modified from Millard (1993).
3.2.4 Ten percent fines aggregate crushing test (10 % FACT)
Ten percent fines value is a measure of the resistance of aggregate crushing subject toloading. The 10 % FACT test determines the force necessary to produce 10 % fines andwere performed according to SANS 5842:2006 (South African national standard, 2006a).A 10 %≥110 kN is required for base layer for road, and 10 %≥190 kN i required forsurface layers. The test is applicable to both weak and strong aggregate. The test is verysimilar to the aggregate crushing test when a 400 kN force is used and fine aggregates areexpressed as a percentage of the original mass. In the ten percent fines value test the aimis to look for the force required to produce 10 % of fine values. Aggregate which passesa 2.36 mm sieve are defined as fine aggregates. The aggregates are crushed, sieved, ovendried and tamped exactly like in the test for aggregate crushing value. The aggregates areweighed after oven drying and the mass note as m0. The test sample is placed under thecompression testing machine, the surface leveled and the plunger installed (Fig. 8b). Theload is applied at a uniform rate so as to cause a total penetration of the plunger of about20 mm for normal crushed aggregates in 10 minutes. After maximum force is reached,the load is released and the aggregates sieved through a 2.36 mm IS sieve. The maximumforce in kN are expressed as x. The passing aggregates are weight and the mass note asm1 and the mean percentage fines from two tests at are expressed as y (Equation 4).Toassess the durability of an aggregate the sample is also undertaken a 10 % FACT-wet test.The sample undergoes the same procedure as the dry test except that it is immersed inwater to make the rock soaked. A wet/dry ratio greater than 75 % indicates satisfactorydurability (South African national roads agency Ltd, 2011).
y = 100%∗m1
m0(4)
12

Two values are produced for each test and the mean percentage fines should be used inthe equation to calculate the force required to give 10 % fines (Equation 5).
Forcerequired to produceten percent f ines =14x
(y+4)(5)
x = maximum force used (kN)y = percentage fine aggregates from the test (%)
3.2.5 Grain density
Grain density is a measure of the weight of the aggregates in a unit volume. The graindensity were carried out according to SANS 3001-AG20:2011 (South African nationalstandard, 2011). The density for rocks varies approximately from 2.6 g/cm3 (sandstones,granites) to 3.2 g/cm3(mafic/black rocks). The test method is based on Archimedes princi-ple. Two samples are needed for density analysis. Each dry sample should weight around0,5-1 kg, depending on the rock fraction. Note the dry weigh, md . Each sample is thenplaced in a bucket attached underneath the balance. The bucket is then immersed in wateruntil the whole basket is submerged completely. Weight the sample in the water and notethe wet weight, mw. The density (ρ) is calculated as in (Equation 6).
ρ =md ∗0.998
md −mw
(6)
3.3 WATER ABSORPTION ANALYSIS
This test is done by the SANS 3001-AG20:2011 (South African national standard, 2011),and indicates the water absorption capability of coarse aggregates. The test was carriedout by DGS in their laboratory. For this test a minimum of 2 kg is required, two tests mustbe done and the individual and mean results should be reported. The aggregates have tobe washed to remove fine particles and dust and then drained. The aggregate sample isplaced in a wire basket and immersed in distilled water at a temperature between 22 and32 degrees. The entrapped air in and between the aggregates must be removed and this isdone by lifting the basket and allow it to drop 25 times in 25 seconds. The aggregates inthe basket should remain immersed for a period of 24 + ½ hours afterwards. When thistime range is reached, the basket and aggregates are removed from the water and allowedto drain for a couple of minutes. The aggregates are gently surface-dried by a cloth andthen change to a new cloth when the first one no longer can remove more moisture. Theaggregates should be layed spread on the second cloth in room temperature, away fromdirect sunlight, until it appears to be completely dry on the surface. The aggregates areweighed and the mass noted as m0. To obtain the dry weight of the aggregates, theaggregates are placed in an oven of 100 to 120 degrees for 24 hours. It is then removedfrom the oven, cooled and weighed. The mass is noted as m1. The water absorption iscalculated (Equation 7).
Water absorption =m0 −m1
m1∗100 (7)
13

3.4 MICROSCOPY ANALYSIS
Manufacturing of the thin-sections was made by Minoprep in Hunnebostrand. Thin sec-tion is a polished piece of rock so thin that it allows penetration of light through it, and itmakes it possible to study individual minerals and fragments in a polarization microscope.The rock sample is sawed and prepared to a “match box” sized sample with two parallelsides. One side is attached after polishing to a glass slide. After this the other side of thesample is grind to a thickness of approximately 30µm and then this side is also polished.All rocks in this study are isotropic, so only one thin-section have been prepared fromeach sample (Hirsch, 2012).
3.4.1 Modal analysis and mineralogical composition of rock type determination
The modal analysis and the mineralogical composition of rock type determination wascarried out at the Geological Survey of Sweden by Julio Gonzales. The modal analysisis based on both hand specimen and thin-section examination. The determination of themineralogical composition of a sample is done by counting mineral points of thin sectionimages. At least 500 points were counted. The results are reported as an amount ofpoints for each mineral, as well as a percentage. Secondary phases such as sercitisionof feldspar was reported. If the identification of opaque mineral occurs, it indicates thatsulphide minerals might be present and should be noted. The mineralogical compositioncontributes to a specific rock type, where the rock type naming was done according to EN932-3. Igneous rocks are classified by a QAP diagram, where QAP stands for "Quartz,Alkali feldspar and Plagioclase (Streckeiser, 1972).
3.4.2 Mineral grain size distribution analysis
Six granite samples were selected from the 28 samples for closer examinations regard-ing mineral grain size distribution analysis. These samples were chosen due to alreadyexisting thin-section and modal analysis from each sample site. Cumulative grain sizedistribution curves was made for each sample and mean grain size were calculated foreach sample.The grain size and grain size distribution were determined quantitatively bymeasuring the mineral grains that cut traverse lines (Figure 9) conducted at the SwedishCement and concrete Research Institute (CBI) in Borås. The traverse lines have the samelength in both directions and are perpendicular to each other (Figure 9). The analysis wasdone on printed images taken from thin-sections. The longest diameter of the mineralgrains is measured and the result put in a table of distribution for the desired range. Atleast 200 mineral grains were measured in each thin section sample to obtain a repre-sentative distribution and the length of the traverse lines should be equally long in bothdirections.
14

Figure 9: Grain size measurement from thin-section image. Red lines shows longestdiameter and black lines are the traverse lines. The traverse lines have the same length inboth directions and are perpendicular to each other.
4 RESULTS
4.1 MACRO ANALYSIS
In this section the results from the macro analysis of the six selected samples are pre-sented. The macro descriptions of the 28 sample sites can be seen in Table. 4 in AppendixA.
4.1.1 Bokaa (BKGR1)
The medium grained Kgale granite at Bokaa is composed primarily of K-feldspar, pla-gioclase, blue grey quartz, and minor biotite (Fig. 10a). The quartz appears as roundedphenocrysts in a medium grained matrix (Tlhabiwe, 2012a). The outcrop is located by aroad cut.
(a) (b)
Figure 10: a) Bokaa granite. Photo Mattias Göransson, SGU. b) FKNGR1. Photo MattiasGöransson, SGU.
15

4.1.2 Fikeng (FKNGR1)
This outcrop is slightly weathered and it is difficult to sample a totally fresh rock unlessdrilling or careful blasting technique is used. The brown Kgale granite is medium-grained,equigranular, jointed and weathered to a light brown color. It is composed primarily ofquartz, feldspar, plagioclase and some mafic minerals, Fig 10b (Tlhabiwe, 2012a).
(a) (b)
Figure 11: a) FKNGR2. Photo Mattias Göransson, SGU. b) KMSTGR1. Photo MattiasGöransson, SGU.
4.1.3 Fikeng (FKNGR2)
The outcrop is an extensively jointed and slightly weathered Kgale granite located inthe area of Fikeng. The rock is a dark red brown equiangular, holocrystalline, mediumgrained granite (Fig. 11a). The granite contains primarily of quartz, feldspar, plagioclase,some greenish minerals (very likely hornblende) and some other mafic minerals. Thereare some vertical or sub vertical quartz veins across most of the stacked boulders. Thegranite appears to be very strong and can only be chipped with a very good hammer(Tlhabiwe, 2012a).
4.1.4 Kgomokasitwa (KMSTGR1)
The rock at Kgomokasitwa KMSTGR1 is a pinkish grey Kgale granite with phenocrys-tic blue grey quartz grains and twinning plagioclase. The dominating minerals are K-feldspar, plagioclase, quartz, hornblende and some other mafic minerals. It contains smallgreen minerals which likely are biotite or hornblende. The outcrop is massive with noor few joints (Fig. 11b). There are some dolerite sills of microgranite within the rock(Göransson and Persson, 2013).
4.1.5 Kgomokasitwa (KMSTGR2)
The microgranite at Kgomokasitwa is fine-grained, bluish grey, jointed and appears to bemoderately brittle (Fig. 12a). The outcrop is oriented in a south to north direction andappears to be intrusive in the nearby the Kgale granite, KMSTGR1. The rock containsprimarily of K-feldspar, plagioclase and quartz. The plagioclase tend to be zoned andsericitised. The quartz phenocrysts are similar as the quartz phenocrysts in the Kgale
16

granite and with a bluish color. The rock is weathered to angular boulders and surfaces(Göransson and Persson, 2013).
(a) (b)
Figure 12: a) KMSTGR2. Photo Mattias Göransson, SGU. b) Felsite, very fine-grained.Photo Mattias Göransson, SGU.
4.1.6 Letlhakane (LTKWF1)
The rock of Letlhakane is bluish grey colored (Fig. 12b), fine-grained, porphyritic homo-geneous and highly brittle Felsite. It contains euhedral twinned plagioclase feldspar andsome visible quartz veins (Tlhabiwe, 2012a).
4.2 TECHNICAL ANALYSIS
For an easier overview over the results, the different granite types have been assigned acolor (Thamaga granites = blue, Kgale granites = purple, Ntlhantlhe microgranite = redand Kanye volcanics = green). The sample sites in each category have been assigned acolor in the same tonality but in different color tint and a unique logo. This is shown inFig. 13.
Figure 13: Color representations used in this section.
Result from the microscopy describe how the four groups of Gaborone granites (Tham-aga granites, Kgale granites, Ntlhantlhe Microgranite and Kanye Volcanics) correlatewith the technical analysis. This is done in order to investigate whether any of thefour Gaborone granites generally have better technical properties than the others. Allthe data from the technical analysis were carried out by DGS, can be seen in in Table. 5in Appendix B. There are no significant differences between dry or wet values (aggregatecrushing- and 10 % FACT values) when comparing with other technical properties, henceonly dry values have been compared. Some of the samples have not been analysed by all
17

methods thus affect the reliability of the results and makes it difficult to make a reliableanalyses of some of the diagrams due to too little data. Comparison of the results showa positive correlation between aggregate impact value and Los Angeles value (Fig. 14).Low aggregate impact value gives a low Los Angeles value.
Figure 14: The aggregate impact values and Los Angeles values tend to have a positivecorrelation.
The Aggregate crushing value and Los Angeles value for Thamaga and Kgale granitesare shown in figure 15a. It shows a positive correlation, which also has been shown atthe Road Research Laboratory (1959), who showed a 1:1 correlation between Aggregatecrushing value and Los Angeles value. The 10 % FACT- and Los Angeles values forThamaga and Kgale granites are shown in figure 15b. A negative correlation can beobserved by study the Thamaga granites and Kgale granites separately. The Thamagagranites tend to have lower Los Angeles values than Kgale granites. Numbers for 10 %FACT- and AIV values (Fig. 30a), respectively 10 % FACT values and grain density (Fig.30b), show no, or very weak, correlation (Appendix C).
(a) (b)
Figure 15: a) The aggregate crushing values and Los Angeles values tend to have a pos-itive correlation, similar to[?]. b) Figure shows 10 % FACT and LA value for Thamagaand Kgale granites. No obvious correlation.
Figure 16 show grain density vs Los Angeles values. Higher density generally resultsin lower Los Angeles value. More fine-grained granites tend to have lower Los Angeles
18

value and higher density. However, there are exceptions with three of the Thamaga sam-ples which can be found between the Kanye volcanics and the Kgale samlpes. Figure 17show similar correlation as figure 16. Higher density tend to give lower AIV value. Figure17 contain more data than figure 16 and if the amount data would have been the same inthe two diagram, they probably would look very alike according to the good correlationbetween LA and AIV values. Grain density and ACV show no or weak correlation (Fig.31), and can be seen in Appendix C.
Figure 16: Figure show grain density and LA value for all granite types. Higher densitytend to give lower LA value.
Figure 17: Figure show grain density and AIV value for all granite types. Higher densitytend to give lower AIV value.
The 10 % fines values and aggregate crushing value tend to have a good negativecorrelation and are shown in Fig.18a. The methology of these tests are closely relatedand provides a good indication that the results for these technical properties are correct.A good rock material is characterized by a high 10 % FACT value and a low aggregatecrushing value. The aggregate impact value and the aggregate crushing value show apositive correlation, as can be seen in Fig.18b.
19

(a) (b)
Figure 18: a) The 10 % FACT and ACV values tend to have a significant negative cor-relation, this according to closely related test methods. b) AIV and ACV values tend tohave a weak correlation.
4.3 WATER ABSORPTION ANALYSIS
The data from the water absorption analysis, carried out by DGS, can be seen in Table.2.The felsite from Letlhakane (LTKWF1) shows the lowest water absorption value 0.3 %,table 2, and the Kgale granite from Kgomokasitwa (KMSTGR1) show the highest valueof 0.95 %. The water absorption tend not to correlate with any of the technical properties.All water absorption values are low to moderate except for KMSTGR1 (0.95 %). It cannotbe excluded that a slight weathering of the top surface may effect the water absorptionvalues and increase the analysed Kgomokasitwa granite sample.
Table 2: Locality name, sample ID and water absorption values for each sample. Thewater absorption value Ab is presented in weight percent.
4.4 MICROSCOPY ANALYSIS
4.4.1 Modal analysis
The modal analysis was carried out by Julio Gonzales at SGU. A summary of the resultsis presented below.
4.4.1.1 Bokaa (BKGR1) The red Bokaa granite (sample BKGR1) is a coarse-grained,unequigranular, porphyritic and weakly hydrothermally altered granite. The rock consistsof 38 % K-feldspar as phenocrysts and matrix, 31 % quartz and 25 % granophyric aggre-gates containing K-feldspar and quartz (Gonzalez, 2013). The major constituents of the
20

granite are up to 10 mm crystals of K-feldspar, quartz and minor amounts of hornblendein a matrix (Fig. 19a). The matrix consists of a granophyric aggregate of K-feldspar andquartz. The feldspar phenocrysts also host small amounts of mica, biotite, epidote andcalcite in cracks. Opaque phases do not occur throughout the rock. The greatest concen-trations are limited to aggregates of dark mineral. The grain boundaries are principallylobated and irregular. Some subgrains in quartz is present. The dominating grain sizevaries from 0.01 mm to 3 mm (Gonzalez, 2013).
(a) (b)
Figure 19: a) Microscopic image of thin-section of BKGR1 of a red granite at Bokaa.b) Microscopic image of thin-section of FKNGR1 of a red syenogranite-quartz syenite atFikeng.
4.4.1.2 Fikeng (FKNGR1) Sample FKNGR1 is a red, medium to coarse-grained,hydrothermally altered syenogranite to quartz syenite, that is slightly porphyritic withquartz and K-feldspar phenocrysts in a matrix of the same minerals. The rock containsof 2 % plagioclase, 60 % K-feldspar and 35 % quartz (Gonzalez, 2013). The rock hasbeen subject to a alteration in terms of relatively intense hematitisation (Fig. 19b). Themajority of the K-feldspar crystals are surrounded by quartz or fine-grained K-feldspargrains. The feldspar crystals are sericitised to some extent. The thin-sections shows onesingle muscovite crystal and one big K-feldspar phenocryst, the latter one surroundedby a halo composed by granophyric grains containing quartz and K-feldspar. The grainboundaries are principally lobated and irregular but a minor part of them have a regularcharacter. Some quartz grains have been subjected to ductile strain and contain minoramounts of subgrains. The majority of the quartz grains expose a deformational bandingand an undulose extinction. The dominating grain size varies from 0.25 mm to 2 mm(Gonzalez, 2013).
4.4.1.3 Fikeng (FKNGR2) Sample FKNGR2 is a medium grained hydrothermallyaltered, porphyritic syeno-granite from the Fikeng suite. The rock is pink with a purpuretint, slightly unequigranular, isotropic and leucocratic. The granite has gone through ahematitisation and sericitisation. The mineral composition of the granite is dominatedby 59 % K-feldspar and 38 % quartz (Gonzalez, 2013). The K-feldspar crystals are of-ten surrounded by a fine-grained halo consisting of quartz and small grains of K-feldspar(Fig.20a). Most mafic minerals are altered. In many cases the opaque minerals are sur-rounded solely by epidote grains. Small cracks and grain boundaries in the K-feldspar of-
21

ten contain different amounts of chlorite, sercite, opaque minerals and epidote. The grainboundaries are principally irregular. Lobated boundaries occur but are less common. Avery small part of the grain boundaries have a regular character. Most of the quartz grainsexpose a deformational banding and an undulose extinction. Subgrains in quartz is rathercommon. The dominating grain size varies from 0.1 mm to 1.5 mm (Gonzalez, 2013).
(a) (b)
Figure 20: a) Microscopic image of thin-section of FKNGR2 of a pink porphyritic syeno-granite at Fikeng. b) Microscopic image of thin-section of KMSTGR1 of a veinedsyenogranite- quartz syenite in Kgomokasitwa.
4.4.1.4 Kgomokasitwa (KMSTGR1) Sample KMSTGR1 is a veined syenograniteto quartz-syenite belonging to the Kgomokasitwa suite. It is unequigranular, isotropicand has a weakly developed porphyritic texture. The red colored, medium-grained gran-ite contain of 58 % K-feldspar and 38 % quartz (Gonzalez, 2013). Also some plagioclaseand minor amounts of biotite and opaque minerals are present. The crystals of K-feldsparare surrounded by a fine-grained halo consisting of quartz and small grains of feldspar(Fig.20b). Calcite grains up to 0.1 mm are commonly found inside the K-feldspar grains.The calcite also appears in aggregates along with sericite, epidote, chlorite, titanite andallanite. The grain boundaries are principally irregular. However regular and lobatedboundaries are also common. The majority of the quartz grains expose undulose extinc-tion. Deformational banding is present in some of the quartz grains. Subgrains in quartzis present, but rare. The dominating grain size varies from 0.25 mm to 3 mm (Gonzalez,2013).
4.4.1.5 Kgomokasitwa (KMSTGR2) The major constituents of the granite in Kgomok-asitwa (KMSTGR2) are 59 % K-feldspar and 37 % quartz (Gonzalez, 2013). The rockis also very rich in apatite. The pink, medium-grained rock is described as a fracturedand hydrothermally altered granite. The microscopic analysis shows an unequigranular,isotropic and weakly developed porphyritic texture (Fig.21a). The K-feldspar is oftensercitised and in some extent also kaolinised, often surrounded by a fine-grained halocomposed of small grains of quartz and K-feldspar. No primary mafic minerals havebeen observed. Some small dark mineral aggregates of chlorite, sericite, epidote, titanite,iron-oxides and allanite are though present - all expected to be of a secondary origin.
22

Small amounts of chlorite, sericite, opaque mineral and epidote are present at grainboundaries, in small cracks and cleavage planes in feldspar. The grain boundaries areprincipally irregular. Lobated boundaries occur but are less common. A very small partof the grain boundaries have regular character. Most of the quartz grains have deforma-tional banding and undulose extinction. Some subgrain building of quartz is present. Thedominating grain size varies from 0.5 mm to 2.5 mm (Gonzalez, 2013).
(a) (b)
Figure 21: a) Microscopic image of thin-section of KMSTGR2 of a fractured pink hy-drothermally altered granite in Kgomokasitwa. b) Microscopic image of thin-sectionLTKWF1 of a volcanic rock at Letlhakane.
4.4.1.6 Letlhakane (LTKWF1) The sample LTKWF1 is a hydrothermally alteredvolcanic rock belonging to the Letlhakane suite. It is unequigranular, porphyritic and hasan felsic composition. The rock is feldspar phenocrystic (Fig. 21b). Both K-feldsparcrystals abundant as phenocrysts or in the matrix are altered (sericitised). In the mostsericitised parts of the phenocrysts calcite grains are quite common. Cracks in the K-feldspar phenocrysts holds mica and a smaller amount of kaolinite may also be present.Opaque phases occur throughout the rock and the greatest concentrations are restrictedto the aggregates of the dark minerals. The opaque minerals are often surrounded by atitanite aggregate. The grain boundaries are principally lobated and irregular. A lot of thequartz grains have been subject to subgrain formation. The majority of the quartz grainsexposes an undulose extinction and yields a deformational banding. The dominating grainsize varies from 0.01 mm to 0.1 mm (Gonzalez, 2013).
4.4.2 Mineralogical composition of rock type determination
The purpose of the mineral composition analysis was to examine how the knowledge ofrock type classification can give more explanations of the technical analysis. The felsite(LTKWF1) and the Bokaa granite (BKGR1) contain a matrix and it was not possible todetermine the proportion of quartz, K-feldspar and plagioclase during the modal analy-sis. All four granite samples were classified as alkali feldspar granites according to theStreckeiser diagram Fig. 22.
23

Figure 22: QAP (Quartz, Alkali-feldspar, Plagioclase) classification diagram showsthe normative mineralogy for the samples from Fikeng (FKNGR1 and FKNGR2) andKgomokasitwa (KMSTGR1 and KMSTGR2). Modified from Le Maitre (1989).
4.4.3 Mineral grain size distribution analysis
This section present all the results from macro-, modal and mineral grain size distributionanalysis. The different analyses have been assigned a color (Macro = brown, Modal =orange, mineral grain size distribution = yellow, Table 3). Mineral grain size is a sig-nificant parameter to determine rock strength. According to Lundqvist and Göransson(2001), a more fine-grained rock is stronger than a more coarse-grained one. The meangrain size from the mineral grain size distribution analysis can be assumed to be the mostcorrect mean value due to carefully calculations from thin-sections. Table 3 shows theresults from the macro-, modal and mineral grain size distribution analysis for all theinvestigated samples.
Table 3: The results from the macro-, modal-, and mineral grain size distribution analysis.
The macro and modal analysis are estimated results and presumably contain some
24

measurement uncertainties. The macro description is very uncertain at greater grain sizesbut show better results at smaller grain sizes. Figure 22 shows how the macro- and modalanalysis differ from the mineral grain size distribution calculations. The macro analysisshow too high mean grain size values. The modal analysis shows mean size values similarto the mineral grain size distribution mean grain size.
Figure 23: The diagram show the difference between macro-, modal-, and mineral meangrain size distribution analysis. The macro and modal analysis show estimated grain sizeintervals and mineral grain size distribution show calculated mean grain sizes.
The mean mineral grain size of the mineral grain size distribution analysis were com-pared with the aggregate crushing, 10 % FACT values, Los Angeles and aggregate impactvalues. The results are shown in figure 24a to 25b. Figure 24a tend to have a weaklynegative correlation (R2= 0.18) between the mean grain size and the aggregate crushingvalue. This diagram lacks results from the felsite (LTKWF1) and the microgranite (KM-STGR2) due to no test result of ACV for these samples. For aggregate crushing value therequirement for road material is ACV≤29, which all samples achieve. The mean grainsize correlates weakly with the 10 % FACT value where a low mean grain size give a low10 % FACT value, figure 24b. Requirement for road aggregate is 10 % FACT≥110 forbase layer, and 10 % FACT≥190 for road surface. None of the samples can be used asroad surface aggregates according to 10 % FACT value, but all except FKNGR2 can beused as base layer.
25

(a) (b)
Figure 24: a) The ACV tend to have a weak correlation with the mean grain size. A lowmean grain size seem to give high a ACV. b) The mean grain size tend to have a weakcorrelation with the 10 % FACT value. A low mean grain size seem to give a low 10 %FACT value.
A positive correlation (R2= 0.48) between the mean grain size and the Los Angelesvalues is shown in figure 25a. The same type of correlation has been achieved by Lund-gren (2012). None of the the samples yielded a Los Angeles value≤15 which is regardedas good material for road construction. KMSTGR1 and FKNGR2 holds Los Angeles val-ues over 25 which is considered as poor resistant regarding to fragmentation and henceunusable for roads.
(a) (b)
Figure 25: a) The LA value tend to correlate with mean grain size. Low mean grain sizeseems to give low LA value. b) AIV value tend to correlate with mean grain size. Lowmean grain size seems to give low AIV value.
Figure 25b shows a correlation between mean grain size and aggregate impact valuewith a R2 value of 0.58. Samples with AIV value less than 15 are regarded as being verygood commodity for road aggregates. All of the granites samples are expected to meetthe requirement for roads according to the aggregate impact value, however the felsite(LTKWF1) and the microgranite (KMSTGR2) are preferable.
Figure 26 show the mean grain size from the modal analysis and how it correlateswith the Los Angeles value for all the granites. Due to the very similar results from the
26

mean grain size at the modal analysis and the calculated mineral grain size (Fig. 23), itis interesting to see how the estimated modal analysis correlates with the Los Angeles.The modal analysis contain data from more granites than the calculated mean grain sizeanalysis, and therefore is it interesting to use these mean values and compare with LAvalues. The mean grain size from the modal analysis correlates well with the Los Angelesvalues, with a R2 value of 0.61.
Figure 26: The LA value from the modal analysis tend to correlate well with mean grainsize, R2 = 0.61. Low mean grain size seems to give low LA value.
Figure 27 show how the Los Angeles value correlates with the aggregate impact valueand mean grain size of mineral grain size distribution analysis for respective sample. Themean grain size corresponds to the size of the circles, larger circle diameter correlates tolarger mean grain size. The mean grain size of the macro analysis (Fig. 32b), and modalanalysis (Fig. 32a) corresponds similar to Los Angeles- and aggregate impact value andcan be seen in Appendix D.
Figure 27: The LA value correlates with the AIV and mean grain size of mineral grainsize distribution. The mean grain size corresponds to the size of the circles, larger circlediameter correlates to larger mean grain size.
The grain size distribution curve (Fig.28) show the cumulative distribution for all
27

samples. As expected, the fine-grained (99 % ≤ 1 mm and 79 % ≤ 0.05 mm) felsite(LTKWF1) can be found almost entirely within the fine-grained interval. The micro-granite (KMSTGR2), and the Fikeng granite (FKNGR1) also contain a large portion offine-grained material (88 % and 87 % ≤ 1 mm respectively). The Fikeng (FKNGR1)also contain some of the largest grains in this study, see figure 29. The Bokaa granite(BKGR1) is the most coarse- grained granite (77 % ≤1 mm) followed by KMSTGR1 (76% ≤ 1mm) and FKNGR2 (81 % ≤ 1 mm). A large proportion of very fine-grained orfine-grained material seem to contribute to a lower Los Angeles value.
Figure 28: Grain size distribution curve with LA value in parenthesis next to each sample
Figure 29: Grain size distribution curve which only show the upper limits (95 %-100 %cumulative distribution). The Fikeng FKNGR1 contain the largest grains.
28

5 DISCUSSION AND CONCLUSIONS
Technical properties
The technical data showed correlation between aggregate impact and Los Angeles values.More fine- grained rock types such as Kanye volcanics and Ntlhantlhe Microgranite tendto have both low aggregate impact values and low Los Angeles values. This indicates thatmore fine- grained rock tend to yield better technical properties than more coarse- grainedrock with similar mineralogy. The Thamaga and Kgale granites showed mixed resultswhere some of the Thamaga seemed to be stronger than the more fine-grained Kgalegranite. According to the macro analysis, one of these Thamaga samples contain a finegrained matrix, and according to the modal analysis one sample contain 70 % granophyricaggregates. This can be the explanation to why these Thamaga granites achieve betterresults than Kgale granites. Tests at the Road Research Laboratory (1959) showed thatthere is a 1:1 correlation between the aggregate crushing values and Los Angeles values.Due to too few data it is difficult to see an obvious correlation between aggregate crushingvalues and Los Angeles values in this study. The same problem can be seen with 10 %FACT value and Los Angeles value, due to few data correlation is difficult to decipher.Rocks with a high grain density seem to give low Los Angeles and aggregate impactvalues. The high density can be explained by the fact that they constitute more maficmineral than the low- density rocks. The correlation between the 10 % FACT value andaggregate crushing value is obvious. Higher 10 % FACT values correlate with loweraggregate crushing values. It is also clear that Kgale granites tent to have better 10 %FACT values and better aggregate crushing value than Thamaga granites, although thereare some exceptions. The technical analysis generally show that fine-grained granitestend to have better technical properties than more coarse-grained granites. This is alsoconsistent with previous studies such as Lundqvist and Göransson (2001).
Mineral grain size and the mineral grain size distribution
The mean grain size affects both the aggregate crushing value, 10 % FACT value, LosAngeles value and the aggregate impact value. However, low mean grain size gives highACV which contradicts the theory that granites with lower mean grain size have bettertechnical properties. Unfortunately this diagram lacks aggregate crushing value data fromthe felsite (LTKWF1) and the microgranite (KMSTGR2), which might prove the theorythat more fine grained rock have better technical properties than more coarse grainedrocks. Generally the granites with the greatest mean grain size have a higher Los Angelesvalue and a higher aggregate impact value.
The cumulative grain size distribution curve showed that the rock types with narrowergrain size distribution (LTKWF1, KMSTGR2 and FKNGR1) hold lower Los Angelesvalues (Fig. 28). Even though FKNGR1 is a Kgale type it contains a large portion offine-grained material, but it also contains some of the largest grains in this study, whichprobably is why the Los Angeles value is higher than the Los Angeles value for the felsite-and microgranite (Fig. 29). The more coarse grained rock samples, (BKGR1, KMSTGR1and FKNGR2), are more heterogeneous with a broader grain size distribution spectra andgenerally hold a higher Los Angeles values.
The macro analysis gives very doubtful mean grain sizes due to its large grain sizerange. The macro analysis tend to show too large grain sizes when comparing it with themean grain size from the mineral grain size distribution. The error in the macro estimation
29

depend on the grain size classifications. The modal analysis and the mineral grain sizedistribution analysis tend to give very similar values due to the mean grain sizes. Thesetwo methods used the same thin-section, even though the modal analysis used estimatedgrain sizes and the mineral grain size distribution analysis used calculated grain sizes.
The calculated mean grain size from the mineral grain size distribution tend to bea good prospecting tool, hence it is suggested to use this type of investigations ratherthan to base the prospecting on macro analysis divided into different varieties of granites(Thamaga-, Kgale-, Ntlhantlhe granites or Kanye Volcanics). I would recommend to useboth calculated mean grain sizes together with technical test methods as LA, AIV, ACVand 10 % FACT. The calculated mean grain size would be a good monitoring tool toprobate, or to explain ambiguities, in the technical results. The mean grain size fromthe modal analysis, also tend to be a good prospecting tool, this depends, of course, onhow carefully the modal analysis is performed. Some Thamaga granites have lower meangrain size than some Kgale granites and also show better technical properties. This may bethat these Thamaga granites are actually Kgale granites, incorrectly defined in the macroanalysis in field.
Future studies
It is obvious that the grain size is correlated to strength as well as durability of the studiedgranites. To obtain an even better understanding of how one from thin section specimencan estimate strength and durability of a rock I recommend to measure the total grainshape and perimeter. Even though the granites from Botswana are the perfect study areawith respect to different grain size in rocks generated from the same magma source, Iwould prefer that the 28 granites had data from all technical analyses. This in order toget more reliable and statistically comparable results. It would also be preferable to makeduplicates of all tests so that measurement errors are minimized.
30

6 REFERENCES
Appelquist, K., Eliasson, T. (2011). Karaktärisering av Bohusgranit i samband med
utbyggnad av E6, norra Bohuslän. Borås: CBI Betonginstitutet (CBI uppdragsrapport2011:PX00536).
Gonzalez, J. (2013). Petrografisk beskrivining. Unpublished manuscript. Sverigesgeologiska undersökning.
Göransson, M., Persson, L. (2013). Recommended quarry site. Unpublished manuscript.Sveriges geologiska undersökning.
Hirsch, D. (2012). How to make a thin-section. Bellingham: Western WashingtonUniversity.
Available at: http://geology.wwu.edu/dept/faculty/hirschd/other/thinsections/ (2013-08-23)
Key, R. M., and E. P. Wright. (1982). The Genesis of the Gaborone Rapakivi Granite
Complex in Southern Africa. London: The Geological Society of London (Journal of thegeological society 1982, vol. 139). Available at: http://jgs.lyellcollection.org/ (2013-03-7).
Liu, H., Kou, S., Lindqvist, P.A. (2005). Microscope Rock Texture Characterization
and Simulation of Rock Aggregate Properties. Uppsala: Sveriges geologiska undersökn-ing (SGU Project 2004:60-1362).
Lundgren, L. (2012). Variation in rock quality between metamorphic domains in the
lower levels of the Eastern Segment, Sveconorwegian Province. Lund University. Depart-ment of Geology (Master’s thesis 2010: 324)
Lundqvist, S., Göransson, M. (2001). Evaluation and interpretation of microscopic
parameters vs. mechanical properties of Precambrian rocks from the Stockholm region,
Sweden. Athens: Department de geologie Athens
Maitre, Roger Walter Le. (2002). Igneous Rocks: A Classification and Glossary of
terms. Recommendations of the International Union of Geological Sciences, Subcom-
mission on the Systematics of Igneous Rocks. Cambridge: Cambridge University Press2002.
Millard, R.S. (1993). Road building in the Tropics. London: H.M. Stationery Office(Transport Research Laboratory, series State of the art review ; 9)
Moore, M., Davis, D.W., Robb, L. J., Jackson, M. C., and Grobler, D. F. (1993).Archean Rapakivi Granite-anorthosite-rhyolite Complex in the Witwatersrand Basin Hin-
terland, Southern Africa. Geological Society of America (1993;21;1031-1034).
Pye, K. (1986). Mineralogical and Textural Controls on the Weathering of Granitoid
Rocks. Cambridge: Cambridge University Press 1986.Road Research Laboratory. (1959). Roadstone test data presented in tabular form.
London: H.M. Stationery Office (Road notes;no.24)
31

South African national standard. (2006a). FACT value (10 % fines aggregate crushing
value) of coarse aggregates. Pretoria: SABS Standards Division. (SANS 5842:2006)
South African national standard. (2006b). Abrasion resistance of coarse aggregates
(Los Angeles machine method). Pretoria: SABS Standards Division. (SANS 5846:2006)
South African national standard. (2011). Civil engineering test methods. Part AG20:
Determination of the grain density, apparent density and water absorption of aggregate
particles retained on the 5 mm sieve for road construction materials. Pretoria: SABSStandards Division. (SANS 3001-AG20:2011).
South African national standard. (2012a). Civil engineering test methods Part AG10:
ACV (aggregate crushing value) and 10 % FACT (fines aggregate crushing test) values of
coarse aggregates. Pretoria: SABS Standards Division. (SANS 3001-AG10:2012).
South African national standard. (2012b). Aggregate impact value of coarse aggre-
gate. Pretoria: SABS Standards Division. (SANS 6239:2012).
South African national roads agency Ltd. (2011). South African Pavement Engineer-
ing Manual: Chapter 3 - Material testing. South Africa: South african national roadsagency Ltd. Available at:
http://www.csir.co.za/Built_environment/Transport_Infrastructure/22RPF/05b.%20K-
%20Jenkins.pdf (2012-08-21).
Tlhabiwe, K. (2012a). Macro descriptions. Unpublished manuscript. Geologicalsurvey of Botswana.
Tlhabiwe, K. (2012b). Data from technical analyses. Unpublished manuscript. Geo-logical survey of Botswana.
Åkesson, U., Lindqvist, J.E., Göransson, M., and J. Stigh. (2001). Relationship Be-
tween Texture and Mechanical Properties of Granites, Central Sweden, by Use of Image-
analysing Techniques. Bulletin of Engineering Geology and the Environment.Volume 60,Issue 4. Germany: Springer Berlin Heidelberg, pp. 277-284.
32

7 APPENDIX
Appendix A
Table 4: Macro description of sampling sites (Tlhabiwe, 2012a)
33

Appendix B
Table 5: Results of technical analysis (Tlhabiwe, 2012a).
34

Appendix C
(a) (b)
Figure 30: a) 10 % FACT value and AIV value for Thamaga and Kgale granites. b) 10 %FACT value and grain density for Thamaga and Kgale granites.
Figure 31: Grain density and ACV value for Thamaga and Kgale granites.
35

Appendix D
(a) (b)
Figure 32: a) The LA value correlates with the AIV and mean grain size of the modalanalysis. b) The LA value correlates with the AIV and mean grain size of the macroanalysis. The mean grain size corresponds to the size of the circles, larger circle diametercorrelates to larger mean grain size.
36