comparative study of ground-water quality, 1976 and 1996
TRANSCRIPT

Comparative Study of Ground-Water Quality, 1976 and 1996, and Initial Gain-and-Loss Assessment of Boulder Creek, Boulder County, Colorado
By Breton W. Bruce, U.S. Geological Survey and Christopher O'Riley, City of Boulder, Colorado
U.S. GEOLOGICAL SURVEY
Water-Resources Investigations Report 97-4091
Prepared in cooperation with the
BOULDER COUNTY HEALTH DEPARTMENT, and the CITY OF BOULDER, COLORADO
Denver, Colorado 1997

U.S. DEPARTMENT OF THE INTERIOR
BRUCE BABBITT, Secretary
U.S. GEOLOGICAL SURVEY
Gordon P. Eaton, Director
The use of firm, trade, and brand names in this report is for identification purposes only and does not constitute endorsement by the U.S. Geological Survey.
For additional information write to:
District Chief U.S. Geological Survey Box 25046, Mail Stop 415 Denver Federal Center Denver, CO 80225-0046
Copies of this report can be purchased from:
U.S. Geological Survey Branch of Information Services Box 25286 Denver, CO 80225-0286

CONTENTS
Abstract...........................................................................................-.-.......... 1Introduction ......................................................................................... .................. .......... ..... . ^ 1
Purpose and Scope.......................................................................................................................-..-. ..-...--.--..- ""--- 2Acknowledgments............................................... 2
Study Approach........... ........... ................... .--........-..-. ̂ 2Sampling and Analytical Methods ........................................................................................................................................ 4Comparison of Ground- Water Quality Between the 1976 and 1996 Studies.................................................... .................... 5
Major Ions.................................................................................................................................................." 5Nutrients................................................................................................................................................ 7TraceElements..""..."""."".."""""."........."...".."""."".....". ...... ......... ........ 7Bacteriological Analyses......... .................................................................................................................................... 9Pesticides................................................................................................................................................." 9Volatile Organic Compounds....................................................................................................................................... 9Tritiiim....................................................................................... 13
Boulder Creek Gain-and-Loss Study..................................................................................................................................... 14Summary.... .......................................................... 17References Cited........................................................................................................................................" 17Appendix A: Water-Quality Data.......................................................................................................................................2Q-49
FIGURES
1. Map showing location of study area and wells resampled in Boulder County in 1996 ............................................. 32. Box plots showing dissolved-solids concentrations in ground-water samples collected during the
1976 and 1996 studies in Boulder County.................................................................................................................. 63. Graph showing percent change in median concentration of selected dissolved ions in
Boulder County ground water between 1976 and 1996 ............................................................................................. 64. Scatter diagram showing paired chloride concentrations for wells sampled in 1976 and 1996 in
Boulder County.. .................................................................................................................... ..................................... 65. Box plots showing nitrite plus nitrate, as nitrogen, concentrations for wells sampled in 1976 and 1996 in
Boulder County......"................................................................................................. .................................................. 76. Box plots showing nitrite plus nitrate, as nitrogen, concentrations for wells sampled in 1976 and 1996 in
the A mountain and5. plains settings in Boulder County. ..................................................................................... 87. Graph showing comparison of median concentrations for plumbing-related metals from wells sampled in
1976 and 1996 in Boulder County.............................................................................................................................. 98. Map showing location of Boulder Creek surface-water gain-and-loss study and discharge-measurement sites,
October 24, 1996.. ............................................................................................................. _^ 169. Graph showing residual discharge from a water mass balance on Boulder Creek..................................................... 17
TABLES
1 . Analytical method reporting limits, by year, for determinations of inorganic water-quality constituents ............. 42. Minimum, maximum, and median concentrations of selected constituents for wells sampled in 1976 and 1996
in Boulder County ................................................................................................................................................... 53. Results of coliform bacteria analyses for wells sampled in 1976 and 1996 in Boulder County....................... 104. Pesticide compounds analyzed for wells sampled in 1996 in Boulder County ...................................................... 1 15. Concentrations and maximum contaminant levels for pesticide compounds detected in wells sampled in
1996 in Boulder Coimty.........................................................................................................................................^ 126. Volatile organic compounds (VOC's) analyzed for wells sampled in 1996 in Boulder County ............................. 127. Concentrations and maximum contaminant levels of volatile organic compounds detected in wells
sampled in 1996 in Boulder County........................................................................................................................ 138. Data used to calculate a surface-water flow mass balance for gain-and-loss study performed on
October 24, 1996, for Boulder Creek...................................................................................................................... 15
CONTENTS III

CONVERSION FACTORS AND ABBREVIATIONS
Multiply
cubic foot per second (ft3/s)foot (ft)
micrometer (^m)mile (mi)
picocurie per liter (pCi/L)
By
0.028320.30483.937 x 10'51.6090.3125
To obtain
cubic meter per secondmeterinchkilometertritium units (TU)
Degree Celsius (°C) may be converted to degree Fahrenheit (°F) by using the following equation:°F = 9/5 (°C)+32.
ACRONYMS AND ADDITIONAL ABBREVIATIONS:
maximum contaminant level (MCL)
microgram per liter (ng/L)
milligram per liter (mg/L)
milliliter (mL)
method reporting limit (MRL)
U.S. Geological Survey National Water-Quality Laboratory (NWQL)
secondary maximum contaminant level (SMCL)
Sea level: In this report "sea level" refers to the National Geodetic Vertical Datum of 1929 (NGVD of 1929) a geodetic datum derived from a general adjustment of the first-order level nets of both the United States and Canada, formerly called Sea Level Datum of 1929.
IV CONTENTS

Comparative Study of Ground-Water Quality,1976 and 1996, and Initial Gain-and-Loss Assessmentof Boulder Creek, Boulder County, ColoradoBy Breton W. Bruce and Christopher O'Riley
Abstract
From 1975 through 1977, the U.S. Geolog ical Survey, in cooperation with the Boulder County Health Department and the Colorado Geological Survey, sampled numerous surface- water and ground-water sites throughout Boulder County, Colorado. In 1996, the U.S. Geological Survey, in cooperation with the Boulder County Health Department and the City of Boulder, identified and resampled 30 of the same wells sampled in the earlier study. Data from the two study periods are compared in this report.
The range and median concentrations of dissolved solids in the samples were very similar between the two study periods; however, the median concentration of sulfate decreased significantly in the 1996 study compared to the 1975 77 study, and the median concentration of chloride increased. Overall, nitrate concentrations were less in 1996, though, if considering only wells in the mountainous part of Boulder County, there was an apparent increase in nitrate concen trations in the 1996 study. Nitrate concentrations for wells in the plains part of the study area decreased significantly in the 1996 study.
Comparison of trace-element concentra tions was problematic owing to the limited number of constituents measured in the 1975 77 study, changes in analytical method reporting limits, and possible differences in sampling techniques. Coliform bacteria were detected in 8 of 29 samples collected in 1996 compared to only one detection in the 1975 77 study. Pesticides and
volatile organic compounds were analyzed during the 1996 study but not in the 1975-77 study. Several pesticides and volatile organic compounds were detected; all detections were in samples from the plains part of Boulder County.
A surface-water gain-and-loss study was done on October 24, 1996, to quantify the volume of water exchange between the surface-water and ground-water systems along the urban reach of Boulder Creek. Overall, the stream reach had a net gain in surface-water flow, with the majority of ground-water discharge to the stream occurring in downstream segments.
INTRODUCTION
Rapid growth along the eastern edge of the Rocky Mountains in Colorado has caused concern about the effect on water supply and water quality in the Front Range mountain communities and the Front Range urban corridor on the plains. It is generally accepted that the overlying land use can have direct effects on the quality of ground water and that ground water eventually discharges to surface-water streams and lakes. Consequently, surface-water quality is related to the quality of discharging ground water and overland runoff. Only recently have networks of wells been established to monitor trends in ground-water quality. Very little historical data are available that describe broad-scale ground-water quality in Colorado. Boulder County, Colo., is one exception. From July 1975 through July 1977, the U.S. Geological Survey (USGS), in cooperation with the Boulder County Health Department and the Colorado Geological Survey, performed a comprehensive
Abstract 1

water-resources investigation of Boulder County, which included water-quality sampling of 102 wells, 9 springs, and 34 stream sites (Hall and others, 1979).
In 1996, the USGS, in cooperation with the Boulder County Health Department and the City of Boulder, located and resampled 30 of the same wells sampled in the 1975 77 water-quality study. This was done to compare water quality from the two study periods and to indicate differences between the two water-quality data sets collected about 20 years apart. Most of the wells are within the Boulder Creek drainage basin, which is the primary source of drinking water for the City of Boulder. The wells are a combination of private drinking-water wells and domestic wells primarily used for lawn irrigation.
It was recognized at the outset of the 1996 study that one water sample from a well does not necessarily describe the ambient water quality for that location. Only regular sampling over extended time periods (for example, 1 year or more) can begin to assess the overall trends in ground-water quality. Therefore, it would not be valid to identify trends in water quality on the basis of a comparison of analytical results from two sampling events in a single well. However, a statistically significant change in the median concen tration of a single dissolved constituent for the entire population of 30 wells sampled in the two study periods is a more meaningful indication of a long-term trend in ground-water quality for the study area.
Purpose and Scope
This report presents the water-quality data collected during 1975-77 and 1996 and the statisti cally significant differences between the data sets where appropriate. This report also lists the results of analyses for anthropogenic constituents that were not measured during the 1975 77 study, hereinafter identified by the year 1976. Additionally, this report presents the measured data and calculated results of a streamflow gain-and-loss study in Boulder Creek through the urban corridor of the City of Boulder on October 24, 1996. This part of the study indicates stream segments that were gaining or losing flow volume through a hydrologic connection with the adjacent ground-water system. The gain-and-loss study was undertaken to demonstrate the value of this tool for quantifying ground-water/surface-water interactions.
Acknowledgments
The authors thank the numerous property owners who altered their schedules and made their wells available for sampling. The Boulder County Open Space Department was particularly helpful allowing access to wells on county property and acreage bordering Boulder Creek during the surface- water gain-and-loss study. Special thanks go to Ann Lukens of the Boulder County Health Depart ment for her assistance in the field and with analysis and interpretation of the coliform bacteria samples, and to Brad Austin of the Colorado Department of Public Health and Environment for arranging the collection and analysis of pesticide samples in cooper ation with the Colorado Department of Agriculture.
STUDY APPROACH
Initially, the wells targeted for resampling were chosen from Hall and others (1979) by a committee that included representatives from the USGS, Boulder County Health Department, and the City of Boulder. The wells selected were broadly distributed predomi nantly across the Boulder Creek drainage basin but focused on areas that were densely populated or had undergone substantial land-use changes during the last 20 years. Areas of substantial land-use change were identified by knowledgeable representatives from the cooperating agencies. Some wells initially selected no longer existed, or permission to sample could not be obtained. An iterative process led to the identification of 30 wells that had been sampled previously, and permission was obtained from the owners to resample them. The locations of the 30 wells sampled in 1996 are shown in figure 1. All wells had been sampled previously for a broad range of water-quality constitu ents including major ions, nutrients, trace elements, and coliform bacteria. In addition to these constitu ents, sampling during the 1996 study included pesticides, volatile organic compounds (VOC's, including some gasoline and fuel oil components, industrial solvents, and chlorination by-products), and several analyses for tritium, which can be used as a ground-water age-dating tool. All analyses were performed at the USGS National Water-Quality Laboratory (NWQL) in Arvada, Colo., with the exception of the bacteriological determinations performed by the Boulder County Health Department.
Comparative Study of Ground-Water Quality, 1976 and 1996, and Initial Gain-and-Loss Assessment of Boulder Creek, Boulder County, Colorado

Study Area
COLORADO
0 2 4 KILOMETERS 1 EXPLANATION
/I C24/ Well location \m\\\\ Physiographic divisionIm with identification between mountains andV ^ number plains
Figure 1. Location of study area and wells resampled in Boulder County ir'in 1996.
Additionally, the Colorado Department of Public Health and Environment and the Colorado Department of Agriculture participated in the 1996 study by supplying pesticide analyses on all water samples. The pesticide analyses were done at the Colorado Depart ment of Agriculture's laboratory in Denver, Colo.
A streamflow gain-and-loss study also was performed during the 1996 study period (October 24, 1996). This study focused on Boulder Creek from the mouth of Boulder Canyon (to the west) downstream through the City of Boulder to a point just upstream from the effluent discharge from the 75th Street wastewater-treatment plant (to the east). Discharge measurements were made on the main stem of Boulder Creek, and all major surface-water diversions and
inflows to the creek were quantified. A mass balance of water volume in the stream was calculated, and any missing or excess water in the creek was attributed to a gain from or loss to ground water by the stream.
This report presents the results from the 1976 and the 1996 studies for all 30 wells sampled. Comparisons of the range and median concentrations for several constituents from both data sets are provided. VOC and pesticide detections are listed, and a summary of the tritium analyses is presented. Also presented are the results of the surface-water gain-and- loss study indicating the results of the mass balance calculations for each stream segment evaluated in Boulder Creek.
STUDY APPROACH

SAMPLING AND ANALYTICAL METHODS
Wells were sampled using the existing pumping systems, if possible, or by using a portable peristaltic pump. Where the existing pumping system was used, water was collected from an in-line access point as close to the well head as possible, usually at the drain valve at the base of the pressure tank. Wells initially were purged at the maximum rate possible through a standard garden hose. The flow then was split by diverting a small amount of water through a clean polyethylene tube to an enclosed flow-through chamber where pH, temperature, dissolved oxygen, and specific conductance were monitored. Once these measurements were stable (three similar readings at 5-minute intervals), water was collected for analysis. Filtered samples were passed through a 0.45-jam disposable capsule filter. Samples for nutrient, bacteria, pesticide, and VOC analyses were stored on ice until delivered to the laboratory. Samples for cation and trace-element analyses were preserved with 1 milliliter (mL) concentrated nitric acid (HNO3). Samples for VOC analyses were preserved with 2 3 drops of concentrated hydrochloric acid (HC1).
Samples for coliform bacteria analyses were delivered to the Boulder County Health Department at the end of each sampling day and were immediately processed.
Though most analyses compared in this report were performed at the USGS NWQL, analytical methodology has changed substantially between 1976 and 1996. Consequently, analytical sensitivity and method reporting limits (MRL's) also have changed. The MRL's for the analyzed inorganic constituents common to both studies are listed in table 1. For the purposes of data comparison in this report, nondetections have been set to a value of 0. No data comparisons have been made where results have large differences in MRL's or where a data set has numerous nondetections.
No records exist that detail the sampling technique used in the 1976 study. It was anticipated that different approaches to sample collection might affect analytical results. A listing of the analytical results for inorganic constituents from both studies is provided in Appendix A at the back of this report. The results for analyses of coliform bacteria, pesticides, and VOC's are listed in separate tables within the body of the report.
Table 1. Analytical method reporting limits, by year, for determinations of inorganic water-quality constituents
[Analyses performed at USGS National Water-Quality Laboratory, Arvada, Colorado; , not measured; ?, could not ascertain]
Constituent 1976 1996 Constituent 1976 1996 Constituent 1976 1996
CalciumPotassiumFluoride
Major ions (in milligrams per liter)
0.1* 0.02 Magnesium 0.1* 0.01 0.1* 0.1 Chloride 0.1* 0.1 0.1* 0.1 Silica 0.1* 0.01
Nutrients (in milligrams per liter) (nitrogen species as N; phosphate as PO4 |
Sodium Sulfate
*Method reporting limits from Skougstad and others, 1979.
0.1*
0.5"0.2
0.1
Ammonium
Nitrite plusnitrate
--
0.1*
0.01
0.1
Nitrite
Phosphorus
0.01
-
0.01
0.01
Ammonia plusorganicnitrogen
Orthophosphate
0.2
0.03 0.03
Trace elements (in micrograms per liter)
ArsenicCadmiumCopperManganeseSilverAluminum
122
10----
111111
BariumChromiumIronMolybdenumZincSelenium
100--
101
201
113111
BerylliumCobaltLeadNickelAntimonyUranium
11
2 111
? 1
Comparative Study of Ground-Water Quality, 1976 and 1996, and Initial Gain-and-Loss Assessment of Boulder Creek, Boulder County, Colorado

COMPARISON OF GROUND-WATER QUALITY BETWEEN THE 1976 AND 1996 STUDIES
Major Ions
Major ions in water samples are constituents that generally make up the bulk of the total dissolved species in water and include calcium (Ca), magnesium (Mg), sodium (Na), potassium (K), chloride (Cl), sulfate (SO4), fluoride (F), and bicarbonate (HCO3), which generally is the primary component of alkalinity. Alkalinity is reported as calcium carbonate (CaCO3). Concentrations of major ions dissolved in ground water often result from natural processes such as rock/water interactions; however, human activities also can affect the concentrations of these constituents. An example would be the application of road salt
producing increased chloride concentrations in nearby ground water. The minimum, maximum, and median concentrations for the major ions measured in ground water during the 1976 and 1996 studies are listed in table 2.
The concentration of the sum of dissolved solids in a water sample is a general indicator of water quality. Dissolved-solids concentrations are calculated from the total concentrations of measured major ions. The U.S. Environmental Protection Agency (USEPA) has set a national secondary maximum contaminant level (SMCL) for dissolved solids in drinking water of 500 mg/L (U.S. Environmental Protection Agency, 1996). Median concentrations for dissolved solids during the 1976 and 1996 studies were 486 and 523 mg/L, respectively (fig. 2). When compared statis tically using the Wilcoxon signed-rank test (Helsel and Hirsch, 1995, p. 142-147) at the 95-percent
Table 2. Minimum, maximum, and median concentrations of selected constituents for wells sampled in 1976 and 1996 in Boulder County
[Concentrations in milligrams per liter, except as noted; Min, minimum concentration; Max, maximum concentration; Med, median concentration; <, less than; NA, not available; n/a, not applicable; *SMCL, secondary maximum contaminant level; *MCL, maximum contaminant level]
Constituent
pH-laboratory (standard units)HardnessCalciumMagnesiumSodiumPotassiumChlorideSulfateFluorideSilicaSum of dissolved solidsBromideSpecific conductanceAlkalinity
Sampled 1975-771Min
NA15.2
4.1
1.2
2.5
0.7
0.8
7.1
0.2
9
80
NA
120
32
Max
NA
1,952
560
280
480
15
42
1,700
4331
2,907
NA
3,500
1,030
MedMajor Ions
NA
27065.523.539.5
2.410.392
0.5515
486NA
795248
Nutrients
Sampled 1996Min
6.6
11
2.7
0.91
1.5
0.5
0.4
2.6
0.1
7.3
33
<0.01
52
21
Max
8.4
220
580
360
350
15
150
2,000
437
3,140
4.4
3,400
762
Med
7.2
245
66
19.5
33.5
2.2
15.5
49
0.65
15
523
0.12
870
242
SMCL
6.5-8.5
n/a
n/a
n/a
n/a
n/a
250
250
2.0
n/a
500
n/a
n/a
n/a
[nitrogen species as N; orthophosphate as PO4|NitriteNitrite plus nitrateOrthophosphatePhosphorus
O.01
0.06
0.03
NA
0.05
14
2.27
NA
O.01
0.92
0.03
NA
O.01
0.05
0.03
O.01
0.05
11
0.58
0.49
O.01
0.37
0.05
O.01
1 (MCL)
10(MCL)
n/a
n/a
*From U.S. Environmental Protection Agency (1996). ' From Hall and others (1979).
COMPARISON OF GROUND-WATER QUALITY BETWEEN THE 1976 AND 1996 STUDIES

S 2,500
13DCUJQ.CO
< 2,000
CD_i2 Zto 1-50°QO COQUJ
J 1,000COCO QLJ.O
0 500
pUJoz
-
-
-
-
3
J
0
3
J
0
1EXPLANATIONNumber ofsamples
30- 90%
75%
Median
25%1 10%
SMCL
1976 1996
Figure 2. Dissolved-solids concentrations in ground-water samples collected during the 1976 and 1996 studies in Boulder County.
confidence interval, there was no significant difference (p>0.05) in the median concentrations for dissolved solids between the 1976 and 1996 studies. The median dissolved-solids concentrations calculated for wells in the mountainous part of Boulder County (1976 = 236 mg/L; 1996 = 244 mg/L) were lower than those for wells in the plains (1976 = 623 mg/L; 1996 = 578 mg/L); but, the median concentrations were very similar between the two study periods within each geographic setting.
There were, however, some substantial differ ences between 1976 and 1996 in median concentra tions for individual major ions that comprise the calculated dissolved-solids concentrations. Whereas there was less than a 10-percent difference in median concentrations of most major ions between the two studies, the median concentration of sulfate decreased 47 percent between the 1976 and 1996 study periods (fig. 3). Sulfate concentration decreased in 20 of 30 paired samples from 1976 to 1996, and the Wilcoxon signed-rank test indicated a significant difference (p<0.05) in median concentration between the two sulfate data sets. This significant difference in median sulfate concentration could not be assigned to the mountain or to the plains wells and was only significant when all paired data were considered together.
Chloride also showed a large difference in median concentration, increasing about 50 percent
50
40
30UJO 20
§10 « 0
UJ-10
£-20Q.
-30
-40
-50Hardness Ca Mg Na Cl SO, SI02 Alkalinity
Figure 3. Percent change in median concentration of selected dissolved ions in Boulder County ground water between 1976 and 1996.
from 1976 to 1996. Chloride concentrations for the two study periods, plotted as x-y pairs (x = 1976, y = 1996), are shown on figure 4. Any pair with identical 1976/1996 concentrations would plot on a 1:1 ratio line. Figure 4 shows many points above the 1:1 ratio line, indicating that the chloride concentration measured in 1996 often was greater than that measured in 1976. This difference in chloride concen tration could not be assigned to a statistically signifi cant change in either the mountain or plains wells. Individual wells in both these settings had large increases in chloride concentration.
160
*.O
rj O
oO
g eoCC
o>O
I *.O
ro O
0 10 20 30 40
1976 CHLORIDE CONCENTRATIONS,IN MILLIGRAMS PER LITER
Figure 4. Paired chloride concentrations for wells sampled in 1976 and 1996 in Boulder County.
50
Comparative Study of Ground-Water Quality, 1976 and 1996, and initiai Gain-and-Loss Assessment of Bouider Creek, Boulder County, Coiorado

Nutrients
Nutrients include compounds of nitrogen and phosphorus that are important to biological metabo lism. Of primary interest as pollutants are the compounds nitrate (associated with sewage and animal waste) and phosphate (associated with detergents and similar products). Each of these compounds can have a significant human source and can affect biomass growth in surface water. High concentrations of nitrate (NO3) in drinking water also can result in detrimental human-health effects (U.S. Environmental Protection Agency, 1994). The USEPA has set a national drinking-water maximum contami nant level (MCL) for nitrate at 10 mg/L as nitrogen (U.S. Environmental Protection Agency, 1996).
Nitrite plus nitrate (NO2+NO3), as nitrogen, was measured in ground water during the 1976 and the 1996 studies. In both sets of data, the concentration of nitrite (NO2) was so small (table 2) that the results for this analysis will hereinafter be referred to in this text as a nitrate (NO3) concentration. Box plots of nitrate concentrations for the 1976 and the 1996 studies are shown in figure 5. The median concentration of nitrate decreased significantly (p<0.05) from 0.915 mg/L in 1976 to 0.365 mg/L in 1996. Four samples during the 1976 study had nitrate concentrations exceeding the 1996 MCL of 10 mg/L nitrate as nitrogen (maximum
14 r
12
10
o
^ »fcg§CO ^II
30
MCL = 10 mg/L as N
30 EXPLANATIONNumber of samples
3090%
75%
Median
25% 10%
1976 1996
Figure 5. Nitrite plus nitrate, as nitrogen, concentrations for wells sampled in 1976 and 1996 in Boulder County.
concentration was 14 mg/L). One sample collected during the 1996 study had a nitrate concentration (11 mg/L) larger than the 10-mg/L MCL.
Box plots showing nitrate concentrations for the 1976 and 1996 studies, divided into mountain (10 wells) and plains (20 wells) samples, are shown in figure 6. Though differences in median nitrate concen trations between the two study periods for the mountain wells (fig. 6A) were not statistically signifi cant (p>0.05), a slight increase in concentration is suggested by the difference in the 75th-percentile values. The lack of a significant difference in nitrate concentrations for the mountain wells may be an artifact of the small sample size, which limits the statistical discrimination. There was a significant decrease (p<0.05) in nitrate concentrations from 1976 to 1996 for wells sampled in the plains setting.
Concentrations of dissolved phosphorus and orthophosphate generally are low in ground water that is not contaminated. This low concentration mainly is due to the low solubility of most inorganic phosphorus compounds and their use by biota as a nutrient (Hem, 1989, p. 126). Median concentrations for nutrient species common to the 1976 and the 1996 study periods are listed in table 2. These data indicate that the concentrations of phosphorus species were low as expected. There was no statistical difference (p>0.05) between median concentrations of dissolved orthophosphate (PO4) between the two studies.
Trace Elements
Trace elements are a class of constituents, including metals and other inorganics, that generally occur in natural water at trace concentrations less than 1 mg/L. In 1976, 10 trace elements were analyzed in each water sample. Eighteen trace elements were analyzed in the 1996 samples. Comparison of trace- element results between the two study periods was further limited by differences in analytical MRL's. One example of this difference was for barium. The MRL for barium in 1976 was 100 ug/L; in 1996 the MRL was 1 ug/L. In 1996,23 of 30 water samples had barium concentrations that were less than 100 ug/L. It is not meaningful to compare the median concentration for 1976 (<100 ug/L) to the median concentration for 1996 (44.5 ug/L). The MRL's for all trace elements are listed in table 1.
COMPARISON OF GROUND-WATER QUALITY BETWEEN THE 1976 AND 1996 STUDIES

A.Mountains Plains
15-,
go: 10 +z£ UJ -i
5-
15 -i
10
10
MCL = 10 mg/L10 --
5 -
1976 1996
20
MCL = 10 mg/L
20
EXPLANATION
Number of samples
20 a .
__ 25% 1 10%
1976 1996
Figure 6. Nitrite plus nitrate, as nitrogen, concentrations for wells sampled in 1976 and 1996 in the A. mountain and B. plains settings in Boulder County.
Values reported for other trace-element concen trations may have been affected by sampling technique. No historical description detailing the sampling approach in 1976 is available; however, the few landowners that remembered the 1976 sampling indicated that samples were collected from the inside faucet or outside tap with the easiest access. In 1996, samples were collected as close as possible to the wellhead. Sampling close to the wellhead minimizes the amount of plumbing in contact with the water sample. An example of how the sampling technique might have affected the analytical results of selected constituents is illustrated in figure 7. The median concentrations from the two study periods for several metals commonly used in well and plumbing materials are shown in figure 7. These metals all exhibited a decrease in median concentration from 1976 to 1996. The decrease in plumbing-related metal concentra tions shown in figure 7 was larger than 70 percent with the exception of lead. However, in 1976, 23 of 30 samples had detectable lead (MRL = 2 ug/L); in 1996 only 3 of 30 samples had measurable lead concentrations (MRL = 1 u.g/L). The change in
sampling technique may explain the decrease in plumbing-related metal concentrations.
By contrast, trace elements that had similar MRL's and that were expected to be derived solely from natural sources (for example, arsenic, molybdenum, selenium, and uranium) exhibited very similar concentrations in 1976 and 1996. Of these constituents, only uranium exhibited elevated concen trations and may be a potential water-quality concern. The USEPA has proposed a drinking-water MCL for uranium of 20 ug/L (U.S. Environmental Protection Agency, 1996). In 1976, 8 of 30 wells had reported uranium analyses. Six of 30 wells in the 1996 sampling exceeded the proposed 20-ug/L MCL for uranium. Three of these wells were in the mountain setting, and three were in the plains setting. Uranium concentrations in excess of the proposed drinking- water standard have been measured throughout the South Platte River Basin (Qi and Dennehy, 1997). Should the proposed MCL for uranium be finalized, the use of water with elevated concentrations will be affected.
Comparative Study of Ground-Water Quality, 1976 and1996, and Initial Gain-and-Loss Assessment of Boulder Creek, Boulder County, Colorado

120
ujIOOb
80
QUJ "=
60
g 40
Copper Lead Zinc
Figure 7. Comparison of median concentrations for plumbing-related metals from wells sampled in 1976 and 1996 in Boulder County.
Bacteriological Analyses
Measurements of bacteria in water samples collected in 1996 and analyzed by the Boulder County Health Department indicated the presence or absence of coliform, fecal coliform, and noncoliform bacteria. Coliform bacteria, the common species being Escherichia coli (E. coli), occur in large numbers in the intestines of warmblooded animals, and their presence in water supplies is considered an indication of fecal pollution. Though coliform bacteria are not directly harmful to humans, the presence of coliform bacteria in water suggests the possibility of pathogenic bacteria also being present.
Of 30 wells sampled in Boulder County in the 1976 study, only one sample had detectable coliform bacteria (table 3). In the 1996 study, 8 of 29 wells had detectable coliform bacteria (1 of the 30 wells sampled had an invalid sample with no culture growth). Of these eight wells, five had fecal coliform identified. Again, as with some of the other constitu ents compared after a 20-year time period, it is difficult to make a confident comparison regarding the presence or absence of bacteria in the water samples. The bacteriological analyses for the two study periods were performed by separate laborato ries, and it is possible that the methods for collecting and culturing bacteriological samples have changed over the last 2 decades.
Pesticides
Pesticides were analyzed in ground-water samples collected only in 1996. The presence of pesticides in these water samples is evidence of anthropogenic effects on ground-water quality. All pesticides (46 compounds) analyzed in each sample and the MRL for each compound are listed in table 4. Four of the 30 wells sampled had detectable pesticides. These four wells and the pesticide compounds detected are listed in table 5. Atrazine is a herbicide used to control broad-leaved weeds and grasses. Atrazine most commonly is applied to corn in agricultural settings but may have limited use by licensed applicators in urban settings to control weeds along roadways and around parking lots and other commercial or industrial facilities. Deethylatrazine is a breakdown product of atrazine. Prometon is a nonselective herbicide generally used as a soil sterilant. If properly applied, prometon is advertised to allow no vegetation growth in the application area for more than a year (Ciba-Geigy, 1991). Consequently, prometon is almost exclusively used in urban environ ments. Ciba-Geigy (1991) also indicates that prometon can be incorporated into asphalt pavement to increase the life expectancy of paved surfaces. All water samples with detectable pesticides were collected in the plains part of Boulder County. No pesticide compounds were detected in the wells sampled in the mountainous part of Boulder County.
Volatile Organic Compounds
As with the pesticides, volatile organic compounds (VOC's) were analyzed in water samples collected only in 1996, and the presence of these compounds is evidence of anthropogenic effects on water quality. The common name and MRL's for each VOC analyzed are listed in table 6. Of the 29 VOC's measured, 6 compounds were detected at least once, and 8 of 30 water samples had detectable concentra tions of one or more of these compounds. These eight wells and the VOC's detected are listed in table 7. The drinking-water MCL's for applicable compounds also are listed.
The most frequently detected VOC in samples collected in 1996 was chloroform, which was detected in four wells. Chloroform in water can be the result of the use of chlorine as a drinking-water disinfectant.
COMPARISON OF GROUND-WATER QUALITY BETWEEN THE 1976 AND 1996 STUDIES 9

Table 3. Results of coliform bacteria analyses for wells sampled in 1976 and 1996 in Boulder County
[mL, milliliter; <, less than; >, greater than; **, no analysis; est., estimated]
1976Well number Total coliform Fecal conform
(per 100 mL) (per 100 mL)C01 <1 <1COS <1 <1C07 <1 <1C09 <1 <1C16 <1 <1C24 <1 <1C25 <1 <1C27 <1 <1C31 <1 <1C33 ** **C34 <1 <1C35 <1 <1C41 <1 <1C44 <1 <1C46 <1 <1C52 <1 <1C53 >320 >60C55 <1 <1C58 <1 <1C63 <1 <1C66 <1 <1C69 <1 <1C70 <1 <1C73 <1 <1C75 <1 <1C77 <1 <1C79 1.0 (est.) <1 C86 <1 <1C89 <1 <1C92 <1 <1
1996Total
coliformAbsentPresentAbsent
**
AbsentAbsentAbsentPresentAbsentPresentAbsentAbsentPresentPresentAbsentAbsentAbsentPresentAbsentPresentAbsentAbsentAbsentAbsentAbsentPresentAbsent AbsentAbsentAbsent
Fecal coliform
AbsentAbsentAbsent
**
AbsentAbsentAbsentAbsentAbsentAbsentAbsentAbsentPresentPresentAbsentAbsentAbsentPresentAbsentPresentAbsentAbsentAbsentAbsentAbsentPresentAbsent AbsentAbsentAbsent
10 Comparative Study of Ground-Water Quality, 1976 and1996, and Initial Gain-and-Loss Assessment of Boulder Creek, Boulder County, Colorado

Table 4. Pesticide compounds analyzed for wells sampled in 1996 in Boulder County
[n/a, not applicable; ng/L, micrograms per liter; MRL, method reporting limit; MCL, maximum contaminant level]
Pesticide common name
2,4-DAcetachlorAlachlorAldicarbAldicarb sulfoneAldicarb sulfoxideAtrazineDeethylatrazineDeisopropylatrazineBenfluralinBromacilCaptanCarbarylCarbofuran3-Hydroxy-carbofuranChlorothalonilChlorpyrifosCyanazineDCPADiazinonDicambaDichlobenilDimethoatep,p-DDTEndrinHeptachlorHeptachlor epoxideHexazinoneLindaneMalathionMCPAMCPPMetalaxylMethiocarbMethomylMethoxychlorMetolachlorMetribuzin1-NaphtholOxamylPendimethalinPicloramPrometonPropoxurSimazineTrifluralin
Pesticide use
HerbicideHerbicideHerbicideInsecticiden/an/aHerbiciden/an/aHerbicideHerbicideFungicideInsecticideInsecticiden/aFungicideInsecticideHerbicideHerbicideInsecticideHerbicideHerbicideInsecticideInsecticideInsecticideInsecticideInsecticideHerbicideInsecticideInsecticideHerbicideHerbicideFungicideInsecticideInsecticideInsecticideHerbicideHerbicideInsecticideInsecticideHerbicideHerbicideHerbicideInsecticideHerbicideHerbicide
MRL
0.20.10.11.01.01.00.10.20.20.20.41.41.01.01.00.10.10.20.10.20.10.10.50.40.30.60.80.10.10.12.02.00.21.01.00.90.10.51.01.01.20.350.11.00.20.3
MCL
n/an/a
2.07.07.07.03.0
n/an/an/an/an/an/a
40.0n/an/an/an/an/an/an/an/an/an/a
2.00.40.2
n/a0.2
n/an/an/an/an/an/a
40.0n/an/an/a
200.0n/a
500.0n/an/a
4.0n/a
COMPARISON OF GROUND-WATER QUALITY BETWEEN THE 1976 AND 1996 STUDIES 11

Table 5. Concentrations and maximum contaminant levels for pesticide compounds detected in wells sampled in 1996 in Boulder County
[Concentrations in micrograms per liter; MCL, maximum contaminant level; n/a, not applicable]
Compound name
AtrazineDeethylatrazine*Prometon
Well number
C25C25C27C73
C92
Concentration
0.880.50.30.28
0.25
MCL
3n/a
(listed for regulation)
*Deethylatrazine is a breakdown product of the pesticide atrazine.
Table 6. Volatile organic compounds (VOC's) analyzed for wells sampled in 1996 in Boulder County
[MRL, method reporting limit; MCL, maximum contaminant level; ng/L, micrograms per liter; n/a, not applicable]
Common name
BenzeneBromoformCarbontetrachlorideChlorobenzeneChlorodibromomethaneChloroform1 ,2-Dichlorobenzene1 ,3-Dichlorobenzene1 ,4-DichlorobenzeneDichlorobromomethaneDichlorodifluoromethane1,1-Dichloroethane1 ,2-Dichloroethanecis- 1 ,2-Dichloroethenetrans- 1 ,2-Dichloroethene1 , 1 -Dichloroethene1 , 1 -DichloropropaneEthylbenzeneFreon 113MethylenechlorideMethyl-tert-butyl-etherStyreneTetrachloroetheneToluene1,1,1 -TrichloroethaneTrichloroetheneTrichlorofluoromethaneVinylchlorideXylene
MRL
0.2
0.20.20.20.20.20.20.20.20.20.20.20.20.20.2
0.20.20.20.20.20.2
0.20.20.20.20.20.20.20.2
MCL(ng/L)
5.080.*
5.0n/a80.*80.*
600.n/a75.80.*
n/an/a
5.70.
100.7.
n/a700.n/an/an/a100.
5.1,000.
200.5.
n/a2.
10,000.MCL from U.S. Environmental Protection Agency (1996). *1994 proposed rule for Disinfectants and Disinfection By-products: Total for all trihalomethanes combined
cannot exceed the 80-ng/L level.
12 Comparative Study of Ground-Water Quality, 1976 and 1996, and Initial Gain-and-Loss Assessment of Boulder Creek, Boulder County, Colorado

Table 7. Concentrations and maximum contaminant levels of volatile organic compounds detected in wells sampled in 1996 in Boulder County
, micrograms per liter; n/a, not applicable; MCL, maximum contaminant level]
Compound
Chloroform
1,1,1 -Trichloroethane
Benzene1,1-Dichloroethane1,1-DichloroetheneMethyl-tert-butyl-ether
Well number
C16 C33C75C89C69C73C53C73C69C92
Concentration(ng/L)
0.5 0.051.10.69.50.34.80.23.80.9
MCL(ng/L)
Total trihalomethanes: 80.0
200
5.0n/a
7.0n/a
Widespread use of chlorine for direct disinfection of wells or the application of chlorinated municipal water for lawn irrigation creates multiple pathways for chlorine to enter the ground-water system. The USEPA's 1994 proposed rule for disinfectants and disinfectant by-products in drinking water states that the total concentration for all trihalomethanes (THM's) combined cannot exceed the 80-ug/L level.
The VOC's 1,1,1-trichloroethane, 1,1-dichloro- ethane, and 1,1-dichloroethene are all organic solvents or the degradation products of organic solvents. Two of the 30 wells sampled contained these solvents or degradation products. The concentration of 1,1-dichlo roethene in well C69 was more than one-half of the MCL.
The compound methyl-tert-butyl-ether (MTBE) is used as a gasoline additive in several cities along the Front Range urban corridor in Colorado. MTBE was detected in one well sampled. This compound is added to oxygenate motor fuels and to reduce the carbon monoxide emissions. It also is used in some premium grade gasolines as an octane enhancer. The use of this compound in the area began in the mid-to-late 1970's; however, its use as a fuel oxygenate has greatly decreased in recent years. Bruce and McMahon (1996) reported widespread occurrence of MTBE in ground water of the Denver, Colo., metropolitan area.
Benzene also was detected in one well in Boulder County. Though the concentration of benzene in this sample was close to the drinking-water MCL, it is not believed to be the result of anthropogenic contamination. The well where benzene was detected (C53) was a deep, flowing well originally drilled for
oil and gas exploration. The discharge from the well had a strong hydrocarbon smell, and the water sample was dark in tint. It is believed that the water from this well comes from a deep source (greater than 2,000 ft) and that the water in this part of the aquifer was recharged many years ago. The benzene detected in well C53 is thought to be associated with naturally occurring hydrocarbons.
Tritium
Tritium is an isotope of hydrogen. Tritium atoms are unstable and undergo radioactive decay with a half-life of approximately 12.3 years. Consequently, the occurrence of tritium in ground water has been adapted as an age-dating tool to determine the approx imate time that ground water was recharged to the aquifer and isolated from the atmospheric source of tritium. During the 1950's and early 1960's a substan tial amount of anthropogenic tritium was released to the Earth's atmosphere during above-ground testing of nuclear bombs. This atmospheric "spike" of tritium left its signature on ground water recharged during and after this time. Tritium concentrations in precipitation have varied considerably from place to place during different years and seasons, making the use of tritium as a short-term dating tool problematic. Tritium can, however, be used as a semiquantitative dating tool in the following ways: (1) ground water with little or no tritium [less than 1.5 pCi/L or 0.5 tritium units (TU)] generally is considered to have been recharged to the aquifer prior to 1952 (pre-bomb water); (2) ground
COMPARISON OF GROUND-WATER QUALITY BETWEEN THE 1976 AND 1996 STUDIES 13

water with elevated tritium concentrations (greater than 30 pCi/L or 10 TU) is thought to have been recharged after 1952 (post-bomb water); and (3) ground water with tritium between these concen trations is considered to be a mixture of pre- and post- bomb water. However, it is impossible to determine the percentage of water contributed from each period on the basis of tritium data alone (Mazor, 1991). The value of tritium age dating of ground water in Boulder County is to indicate the validity of nondetections of anthropogenic compounds. If a water sample does not contain anthropogenic constituents, it is important to document that these nondetections are not simply the result of sampling "old" water.
Twenty of 30 wells in the Boulder County study were sampled for tritium in 1996. The results are listed in Appendix A at the back of this report. In general, all but 3 of the 20 wells sampled for tritium indicate recent (post-bomb) recharge dates for the water samples. Wells C44 and C70 have tritium concentra tions that suggest recharge occurred prior to 1952. Well C79 (tritium concentration, 5.4 pCi/L) is slightly above the pre-bomb concentration; however, the sampling point for this water was immediately downgradient from a fairly large holding reservoir. Though water only remained in this holding reservoir for a matter of minutes due to large flow-through volume, it is reasonable to assume that some atmospheric exchange of tritium might take place during residence in this reservoir.
BOULDER CREEK GAIN-AND-LOSS STUDY
On October 24,1996, streamflow measurements were made to determine the amount of water entering or leaving Boulder Creek through interactions with the adjacent ground-water system. The study method used a water mass balance where surface-water flow was measured at various points along Boulder Creek, and all outflows from and inflows to the stream were quantified. The measured discharge and the rates of inflows and outflows for each stream segment are listed in table 8. The accuracy of a discharge measure ment using standard USGS methods is estimated at plus or minus 5 percent. Based on these measure ments, gain or loss of flow in the stream not accounted for in the mass balance is assumed to be the result of interaction with the ground-water system. The reach
of Boulder Creek where the gain-and-loss study was done and the 11 sites where surface-water discharge measurements were made on the main stem of Boulder Creek are shown in figure 8. Discharge measurements were taken in a timed downstream sequence. This allows for changes in discharge to be calculated relative to similar flow conditions as measured at the previous upstream site. Site 1 near the mouth of Boulder Canyon was the first site measured during the October 24,1996, gain-and-loss study (fig. 8). The study ended at site 11, just upstream from the effluent discharge from the 75th Street wastewater-treatment facility.
The result of the mass-balance calculations of surface-water discharge are presented graphically as a residual discharge in figure 9. The residual discharge is calculated in feet cubed per second by using the measured streamflow entering the upstream end of a given stream segment, subtracting the volume of all outflows and adding the volume of all inflows within the stream segment, and comparing the resulting water volume to the amount of streamflow measured leaving the downstream end of the stream segment. A negative value for a stream segment indicates a loss of stream- flow to the ground water. A positive value indicates a gain in streamflow from discharging ground water. Overall, after accounting for the major outflows by irrigation diversions, surface-water flow had a net gain in this reach of Boulder Creek. Most of the gain in flow from ground-water discharge occurred in the downstream segments of the stream reach.
Gain-and-loss studies are highly dependent on the existing hydrologic conditions. The results only represent the ground-water/surface-water relation for hydrologic conditions similar to those at the time of the study. This study was done in late summer when flow in the stream was small, irrigation and agricul tural diversions were greatly reduced, and there had been little precipitation in the preceding week. Other gain-and-loss studies performed under different hydrologic conditions may well indicate different responses for each stream segment. Other similar studies under varied flow regimes would be required to document the complex interactions of ground water and surface water for this stream reach.
14 Comparative Study of Ground-Water Quality, 1976 and1996, and Initial Galn-and-Loss Assessment of Boulder Creek, Boulder County, Colorado

Table 8. Data used to calculate a surface-water flow mass balance for gain-and-loss study performed on October 24,1996, for Boulder Creek
[Discharge, outflow, and inflow, in cubic feet per second (frVs)]
Stream reach
From: Site 1To: Site 2From: Site 2 To: Site 3From: Site 3To: Site 4From: Site 4 To: Site 5From: Site 5To: Site 6From: Site 6 To: Site 7From: Site 7To: Site 8From: Site 8To: Site 9From: Site 9To: Site 10From: Site 10 To: Site 1 1
Site location (on Boulder Creek)
Site 1 , below Anderson DitchSite 2, at 6th StreetSite 2, at 6th Street Site 3, at 12th StreetSite 3, at 12th StreetSite 4, at 19th StreetSite 4, at 19th Street Site 5, at 28th StreetSite 5, at 28th StreetSite 6, above Arapahoe RoadSite 6, above Arapahoe Road Site 7, above Cottonwood GroveSite 7, above Cottonwood GroveSite 8, at 55th StreetSite 8, at 55th StreetSite 9, above South Boulder CreekSite 9, above South Boulder CreekSite 10, near 65th StreetSite 10, near 65th Street Site 1 1 , above 75th Street
Time of measurement
(upstream- downstream)
0949-1042
1042-1130
1130-1238
1238-1307
1307-1415
1415-1510
1510-1640
1640-1750
1750-1730
1730-1850
Stream discharge
at upstream
site41.1
34.3
37.3
36.2
33.6
30.8
29.3
32.3
32.8
33.4
Cumula tive outflow (subtract)
2.42
none
0.63
none
4.74
none
none
none
7.14
none
Cumula tive Inflow
(add)
none
0.01
none
0.17
0.10
0.93
1.36
none
2.81
1.30
Stream discharge at downstream
site
34.3
37.3
36.2
33.6
30.8
29.3
32.3
32.8
33.4
40.2
Residual discharge
-4.38
2.99
-0.47
-2.77
1.84
-2.43
1.64
0.5
4.93
5.5
BOULDER CREEK GAIN-AND-LOSS STUDY 15

If S-o <D
D)
o a
- °-
« o a
»
O o g s 5 O D) i-f a OD
O I
O
R 7
1 W
R
70
W
Bas
e fr
om
City
of
Bould
er
R 7
1W
R
70
W
base
d on
Sta
te P
lane
co
ord
ina
te s
yste
m
2 K
ILO
ME
TE
RS
1 M
ILE
N
EXPL
AN
ATI
ON
DIS
CH
AR
GE
-ME
AS
UR
EM
EN
T S
ITE
A
ND
ID
EN
TIF
ICA
TIO
N N
UM
BE
R
Fig
ure
8.
Loca
tion
of B
ould
er C
reek
sur
face
-wat
er g
ain-
and-
loss
stu
dy a
nd d
isch
arge
-mea
sure
men
t si
tes,
Oct
ober
24
,19
96
.

uuO OO truu
Ql-
toco cUUD otro-3
-5
crcccrcr cr trtrtrtrtrSTREAM SEGMENT BETWEEN
NUMBERED DISCHARGE-MEASUREMENT SITES
Figure 9. Residual discharge from a water mass balance on Boulder Creek.
SUMMARY
From 1975 to 1977 (referred to herein as 1976), the U.S. Geological Survey, in cooperation with the Boulder County Health Department and the Colorado Geological Survey, sampled numerous surface-water and ground-water sites throughout Boulder County. In 1996, the U.S. Geological Survey, in cooperation with the Boulder County Health Department and the City of Boulder, resampled 30 of the same wells from the 1976 study in order to compare water-quality data from the two study periods.
Though the summed concentrations of dissolved solids were nearly identical between the two study periods, the median concentrations of sulfate and chloride exhibited large differences. The median concentration of sulfate was 47 percent less in 1996 than in 1976. The median concentration of chloride was 50 percent greater in 1996. Nitrite plus nitrate concentrations for the two study periods showed a statistically significant decline in concentration over 20 years; however, when comparing mountain wells only, there was an apparent increase in nitrite plus nitrate concentrations; when comparing plains wells only, a significant decrease was observed.
Comparison of trace-element concentrations between the two study periods was problematic. Differences in the elements reported, analytical techniques, and method reporting limits reduced the number of valid comparisons. Sampling technique also may have affected the trace-element results, as represented by large decreases in median concentra
tions of plumbing-related metals from 1976 to 1996. Uranium concentrations in 6 of 30 wells exceeded the proposed 20-ug/L MCL.
Eight of 29 wells had detectable coliform bacteria in samples collected in 1996, an increase from 1 of 30 in 1976. Of these eight wells with coliform bacteria in 1996, five wells had fecal coliform bacteria identified.
Forty-six pesticides and 29 volatile organic compounds were analyzed in samples collected in 1996. These compounds were not analyzed in 1976. Four pesticide compounds (4 of 30 wells) and six volatile organic compounds (8 of 30 wells) were detected in sampled wells. All wells with detections of these anthropogenic compounds were in the plains part of the study area. The compounds detected generally were associated with urban land-use activi ties.
A surface-water gain-and-loss study was performed on October 24, 1996, to quantify the volume of water exchange between the surface-water and adjacent ground-water systems along Boulder Creek through the urban reach of the stream. Though gains and losses generally were small, residual discharge has been calculated for each stream segment. Overall, the stream reach had a net gain in surface-water flow, with the majority of ground-water discharge to the stream occurring in downstream segments. Other gain-and-loss studies are needed to improve understanding of the ground-water/surface- water interactions in this stream reach.
REFERENCES CITED
Bruce, B.W., and McMahon, P.B., 1996, Shallow ground- water quality beneath a major urban center Denver, Colorado, USA: Journal of Hydrology, no. 186, p. 129-151.
Ciba-Geigy, 1991, Label for the herbicide Pramitol 25E (active ingredient: prometon), Product I.D. 06550, Label No. CGA 8L5X, EPA Reg. No. 100-443: in Crop Protection Chemicals Reference, 1993, Chemical and Pharmaceutical Publishing Corp., Paris, France, p. 397.
Hall, D.C., Boyd, E.L., and Cain, D.L., 1979, Hydrologic data for wells, springs, and streams in Boulder County, Colorado: U.S. Geological Survey Open-File Report 79-979,106 p., 1 plate.
SUMMARY 17

Helsel, D.R., and Hirsch, R.M., 1995, Studies in environ mental science 49 Statistical methods in water resources: Amsterdam, The Netherlands, Elsevier Science Publishers, 529 p.
Hem, J.D., 1989, Study and interpretation of the chemical characteristics of natural water: U.S. Geological Survey Water-Supply Paper 2254, 263 p.
Mazor, Emanuel, 1991, Applied chemical and isotopic groundwater hydrology: New York, N.Y., Halsted Press, 274 p.
Qi, S.L., and Dennehy, K.F., 1997, World Wide Web home page for the South Platte NAWQA: U.S. Geological Survey Fact Sheet FS-242-96.
Skougstad, M.W., Fishman, M.J., Friedman, L.C.,Erdmann, D.E., and Duncan, S.S., 1979, Methods for determination of inorganic substances in water and fluvial sediments: U.S. Geological Survey Techniques of Water-Resources Investigations, book 5, chap. Al, 2d edition, 160 p.
U.S. Environmental Protection Agency, 1994, National primary drinking water standards; February 1994: U.S. Environmental Protection Agency, Office of Water, Washington, D.C., EPA 810-^-94-001 A, 5 p.
1996, Drinking water regulations and healthadvisories; October 1996: U.S. Environmental Protec tion Agency, Office of Water, EPA 822-B-96-002, lip.
18 Comparative Study of Ground-Water Quality, 1976 and 19%, and Initial Gain-and-Loss Assessment of Boulder Creek, Boulder County, Colorado

APPENDIX A: Water-Quality Data
Appendix A includes paired water-quality data for all inorganic constituents measured in Boulder County ground-water samples collected in 1975-77 (Hall and others, 1979) and in samples collected in 1996 specifically for this study. The analytical results were retrieved directly form the U.S. Geological Survey's National Water Information System (NWIS) data base. The data tables have been reformatted in a manner that minimizes the number of pages generated.
The following abbreviations are applicable to the appendix tables:
US/CM,PH,DEGC,MG/L,UG/LPCI/L,WH FET,NONCARB
WH WAT TOT FLD, AC-FT U-NAT SR/Y-90, CS-137,
microsiemens per centimeter at 25 degrees CelsiusPHdegrees Celsiusmilligrams per litermicrograms per literpicocuries per literwhole field endpoint titration
noncarbonate whole water total - fieldacre-feeturanium naturalstrontium/yttrium-90cesium-137

Boulder County Water-Quality
395658105321300 - SC00107323BCBC SITE C01
WATER-QUALITY DATA
DATE
JUL 1975 29...
AUG 1996 13...
DATE
JUL 1975 29...
AUG 1996 13.. .
JUL 1975 29. . .
AUG 1996 13...
JUL 1975 29.. .
AUG 1996 13...
JUL 1975 29. ..
AUG 1996 13. ..
JUL 1975 29. . .
AUG 1996 13...
SPE- PH PH ALKA- BICAR- SPE- CIFIC WATER WATER HYDRO- LINITY ALKA- BONATE CIFIC CON- WHOLE WHOLE GEN WAT WH LINITY WATER CON- DUCT- LAB FIELD TEMPER- OXYGEN, SULFIDE TOT FET LAB WH FET DUCT- ANCE (STAND- (STAND- ATURE DIS- TOTAL FIELD (MG/L FIELD
TIME ANCE LAB ARD ARD WATER SOLVED (MG/L MG/L AS AS MG/L AS (US/CM) (US/CM) UNITS) UNITS) (DEG C) (MG/L) AS H2S) CAC03 CAC03) HC03
1200 120 -- -- -- -- -- -- 46 -- 56
1430
HARD NESS TOTAL (MG/L AS
CAC03 )
58
20
FLUO- RIDE, DIS SOLVED (MG/L AS F)
0.20
0.10
SOLIDS, RESIDUE AT 180 DEG. C DIS SOLVED (MG/L)
--
44
CHRO MIUM, DIS SOLVED (UG/L AS CR)
--
<l
SELE NIUM, DIS
SOLVED (UG/L AS SE)
<1
<1
55
HARD NESS
NONCARB WH WAT TOT FLD MG/L AS CAC03
12
--
SILICA, DIS SOLVED (MG/L AS
SI02)
14
7.3
SOLIDS, SUM OF CONSTI TUENTS ,
DIS SOLVED (MG/L)
80
33
COBALT, DIS
SOLVED (UG/L AS CO)
--
<l
ZINC, DIS SOLVED (UG/L AS ZN)
890
2
52 6
CALCIUM DIS SOLVED (MG/L AS CA)
17
6.1
NITRO GEN,
AMMONIA DIS SOLVED (MG/L AS N)
--
0.020
SOLIDS, DIS SOLVED (TONS PER
AC-FT)
0.11
0.06
COPPER, DIS SOLVED (UG/L AS CU)
7
29
URANIUM NATURAL
DIS SOLVED (UG/L AS U)
--
<1.0
.6 7.92 10
MAGNE SIUM, DIS SOLVED (MG/L AS MG)
3.8
1.1
NITRO GEN,
NITRITE DIS SOLVED (MG/L AS N)
0.010
0.010
ALUM INUM, DIS
SOLVED (UG/L AS AL)
--
30
IRON, DIS
SOLVED (UG/L AS FE)
20
61
RADIUM 226, DIS
SOLVED, RADON METHOD (PCI/L)
--
SODIUM, DIS SOLVED (MG/L AS NA)
2.5
1.5
NITRO GEN,
NITRITE DIS SOLVED (MG/L
AS N02)
0.03
0.03
ANTI MONY, DIS
SOLVED (UG/L AS SB)
--
<1
LEAD, DIS
SOLVED (UG/L AS PB)
<2
1
GROSS ALPHA, DIS
SOLVED (UG/L AS
U-NAT)
2.6
.6 0.71
SODIUM AD
SORP TION
RATIO
0.1
0.1
NITRO - GEN, AM MONIA + ORGANIC DIS. (MG/L AS N)
--
<0.20
ARSENIC DIS
SOLVED (UG/L AS AS)
<1
<l
MANGA NESE, DIS
SOLVED (UG/L AS MN)
<10
7
GROSS BETA, DIS
SOLVED (PCI/L AS SR/ Y-90)
1.9
SODIUM PERCENT
8
14
NITRO GEN,
N02+N03 DIS SOLVED (MG/L AS N)
0.550
0.080
BARIUM, DIS
SOLVED (UG/L AS BA)
<100
17
MERCURY DIS
SOLVED (UG/L AS HG)
1.3
--
GROSS BETA, DIS
SOLVED (PCI/L AS
CS-137)
2.4
POTAS - SIUM, DIS SOLVED (MG/L AS K)
1.2
0.50
PHOS PHATE, ORTHO, DIS SOLVED (MG/L
AS P04)
0.0
0.03
BERYL - LIUM, DIS SOLVED (UG/L AS BE)
--
<l
MOLYB DENUM, DIS
SOLVED (UG/L AS MO)
<1
Kl
POTAS - SIUM 40 TOTAL (PCI/L)
0.84
20 21
CHLO RIDE, DIS SOLVED (MG/L AS CD
2.5
0.40
PHOS PHORUS
DIS SOLVED (MG/L AS P)
--
<0.010
BROMIDE DIS SOLVED (MG/L AS BR)
--
<0.010
NICKEL, DIS SOLVED (UG/L AS NI)
<l
TRITIUM TOTAL (PCI/L)
--
38
SULFATE DIS SOLVED (MG/L
AS S04)
8.3
2.6
PHOS PHORUS ORTHO. DIS SOLVED (MG/L AS P)
<0.010
0.010
CADMIUM DIS SOLVED (UG/L AS CD)
ND
<1.0
SILVER, DIS
SOLVED (UG/L AS AG)
<1.0
TRITIUM 2 SIGMA WATER, WHOLE, TOTAL (PCI/L)
--
3.2
20 Comparative Study of Ground-Water Quality, 1976 and 1996, and Initial Gain-and Loss Assessment of Boulder Creek, Boulder County, Colorado

Boulder County Water-Quality
400712105234500 - SB00207224DACA1 SITE COS
WATER-QUALITY DATA
DATE
AUG 1975 01...
AUG 1996 12...
AUG01
AUG12
AUG01
AUG12
AUG01
AUG12
SPE- PH PH ALKA- BICAR- SPE- CIFIC WATER WATER HYDRO- LINITY ALKA- BONATE CIFIC CON- WHOLE WHOLE GEN WAT WH LINITY WATER CON- DUCT- LAB FIELD TEMPER- OXYGEN, SULFIDE TOT FET LAB WH FET DUCT- ANCE (STAND- (STAND- ATURE DIS- TOTAL FIELD (MG/L FIELD
TIME ANCE LAB ARD ARD WATER SOLVED (MG/L MG/L AS AS MG/L AS (US/CM) (US/CM) UNITS) UNITS) (DEC C) (MG/L) AS H2S) CACO3 CAC03) HCO3
1100 1190 -- -- -- -- -- -- 32 -- 39
1330 741 768 6.7 7.24 12.3 3.55 -- 138 117
HARD- HARD- NESS MAGNE- SODIUM POTAS- CHLO- NESS NONCARB CALCIUM SIUM, SODIUM, AD- SIUM, RIDE, SULFATE TOTAL WH WAT DIS- DIS- DIS- SORP- DIS- DIS- DIS-
DATE
1975
1996
DATE
1975
1996
DATE
1975
1996
DATE
AUG01
AUG12
1975. . .1996
DATE
AUG01
AUG12
1975
1996
(MG/LASCACO3 )
530
310
FLUO-RIDE,DISSOLVED(MG/LAS F)
43
2.9
SOLIDS,RESIDUEAT 180DEC. CDISSOLVED(MG/L)
555
CHROMIUM,DISSOLVED(UG/LAS CR)
<1
SELENIUM,DISSOLVED(UG/LAS SE)
<1
2
TOT FLDMG/L ASCACO3
500
"
SILICA,DISSOLVED(MG/LAS
SIO2)
31
29
SOLIDS,SUM OFCONSTITUENTS,
DISSOLVED(MG/L)
740
527
COBALT,DIS
SOLVED(UG/LAS CO)
<1
ZINC,DISSOLVED(UG/LAS ZN)
1500
30
SOLVED(MG/LAS CA)
150
96
NITROGEN,
AMMONIADISSOLVED(MG/LAS N)
0.020
SOLIDS,DISSOLVED(TONSPER
AC -FT)
1.01
0.75
COPPER,DISSOLVED(UG/LAS CU)
29
26
URANIUMNATURAL
DISSOLVED(UG/LAS U)
26
SOLVED(MG/LAS MG)
37
17
NITROGEN,
NITRITEDISSOLVED(MG/LAS N)
0.010
0.010
ALUMINUM,DIS
SOLVED(UG/LAS AL)
7
IRON,DIS
SOLVED(UG/LAS FE)
260
13
RADIUM226,DIS
SOLVED,RADONMETHOD(PCI/L)
4.6
SOLVED(MG/LAS NA)
35
35
NITRO -GEN,
NITRITEDISSOLVED(MG/L
AS NO2)
0.03
0.03
ANTIMONY,DIS
SOLVED(UG/LAS SB)
<1
LEAD,DIS
SOLVED(UG/LAS PB)
<2
<1
GROSSALPHA,DIS
SOLVED(UG/LAS
U-NAT)
120
TIONRATIO
0.7
0.9
NITROGEN, AMMONIA +ORGANICDIS.(MG/LAS N)
<0.20
ARSENICDIS
SOLVED(UG/LAS AS)
<1
<1
MANGANESE,DIS
SOLVED(UG/LAS MN)
2700
1
GROSSBETA,DIS
SOLVED(PCI/LAS SR/Y-90)
27
SODIUMPERCENT
12
20
NITROGEN,
NO2+NO3DISSOLVED(MG/LAS N)
0.110
11.0
BARIUM,DIS
SOLVED(UG/LAS BA)
<100
36
MERCURYDIS
SOLVED(UG/LAS HG)
1.7
" "
GROSSBETA,DIS
SOLVED(PCI/LAS
CS-137)
32
SOLVED(MG/LAS K)
6.0
2.6
PHOSPHATE,ORTHO,DISSOLVED(MG/L
AS PO4)
0.03
0.03
BERYLLIUM,DISSOLVED(UG/LAS BE)
<1
MOLYBDENUM,DIS
SOLVED(UG/LAS MO)
2
28
POTAS -SIUM 40TOTAL(PCI/L)
4.2
SOLVED(MG/LAS CD
3.5
15
PHOSPHORUS
DISSOLVED(MG/LAS P)
0.020
BROMIDEDISSOLVED(MG/LAS BR)
0.33
NICKEL,DISSOLVED(UG/LAS NI)
3
TRITIUMTOTAL(PCI/L)
72
SOLVED(MG/L
AS SO4)
410
210
PHOSPHORUSORTHO,DISSOLVED(MG/LAS P)
0.010
0.010
CADMIUMDISSOLVED(UG/LAS CD)
7.0
<1.0
SILVER,DIS
SOLVED(UG/LAS AG)
<1.0
TRITIUM2 SIGMAWATER,WHOLE,TOTAL(PCI/L)
5.1
APPENDIX A 21

Boulder County Water-Quality
395750105242200 - SC00107213CBBA SITE C07
WATER-QUALITY DATA
DATE
AUG 1975 04...
AUG 1996 13...
DATE
AUG 1975 04...
AUG 1996 13...
DATE
AUG 1975 04...
AUG 1996 13...
DATE
AUG 1975 04...
AUG 1996 13...
DATE
AUG 1975 04...
AUG 1996 13...
DATE
AUG 1975 04...
AUG 1996 13...
SPE- PH PH ALKA- BICAR- SPE- CIFIC WATER WATER HYDRO- LINITY ALKA- BONATE CIFIC CON- WHOLE WHOLE GEN WAT WH LINITY WATER CON- DUCT- LAB FIELD TEMPER- OXYGEN, SULFIDE TOT FET LAB WH FET DUCT- ANCE (STAND- (STAND- ATURE DIS- TOTAL FIELD (MG/L FIELD
TIME ANCE LAB ARD ARD WATER SOLVED (MG/L MG/L AS AS MG/L AS (US/CM) (US/CM) UNITS) UNITS) (DEC C) (MG/L) AS H2S) CAC03 CAC03 ) HC03
1300 280 -- -- -- -- -- -- 129 -- 160
0945 269 265 7.4 8.17 10.0 2
HARD NESS TOTAL (MG/L AS
CAC03 )
120
120
FLUO- RIDE, DIS SOLVED (MG/L AS F)
0.90
0.90
SOLIDS, RESIDUE AT 180 DEG. C DIS SOLVED (MG/L)
--
149
CHRO MIUM, DIS SOLVED (UG/L AS CR)
--
1
SELE NIUM, DIS SOLVED (UG/L AS SE)
<1
<1
HARD NESS
NONCARB WH WAT TOT FLD MG/L AS CAC03
0
--
SILICA, DIS SOLVED (MG/L AS
SI02)
17
17
SOLIDS, SUM OF CONSTI - TUENTS,
DIS SOLVED (MG/L)
164
155
COBALT, DIS
SOLVED (UG/L AS CO)
--
<1
ZINC, DIS SOLVED (UG/L AS ZN)
70
5
CALCIUM DIS SOLVED (MG/L AS CA)
31
30
NITRO GEN,
AMMONIA DIS SOLVED (MG/L AS N)
--
0.020
SOLIDS, DIS SOLVED (TONS PER
AC-FT)
0.22
0.20
COPPER, DIS SOLVED (UG/L AS CU)
8
<1
URANIUM NATURAL
DIS SOLVED (UG/L AS U)
--
3.0
MAGNE SIUM, DIS SOLVED (MG/L AS MG)
11
11
NITRO GEN,
NITRITE DIS SOLVED (MG/L AS N)
<0.010
0.010
ALUM INUM, DIS
SOLVED (UG/L AS AL)
--
3
IRON, DIS SOLVED (UG/L AS FE)
60
<3
RADIUM 226, DIS
SOLVED, RADON METHOD (PCI/L)
0.30
SODIUM, DIS SOLVED (MG/L AS NA)
8.1
6.9
NITRO GEN,
NITRITE DIS SOLVED (MG/L
AS N02)
0.0
0.03
ANTI MONY, DIS
SOLVED (UG/L AS SB)
--
<1
LEAD, DIS
SOLVED (UG/L AS PB)
21
<1
GROSS ALPHA, DIS
SOLVED (UG/L AS
U-NAT)
17
--
SODIUM AD
SORP TION
RATIO
0.3
0.3
NITRO GEN, AM MONIA + ORGANIC DIS. (MG/L AS N)
--
<0.20
ARSENIC DIS SOLVED (UG/L AS AS)
<1
<1
MANGA NESE, DIS
SOLVED (UG/L AS MN)
<10
<1
GROSS BETA, DIS
SOLVED (PCI/L AS SR/ Y-90)
7.0
--
.54
SODIUM PERCENT
12
11
NITRO GEN,
N02+N03 DIS SOLVED (MG/L AS N)
0.710
0.750
BARIUM, DIS SOLVED (UG/L AS BA)
<100
73
MERCURY DIS SOLVED (UG/L AS HG)
<0.5
--
GROSS BETA, DIS SOLVED (PCI/L AS
CS-137)
7.7
--
130 127
POTAS - SIUM, DIS SOLVED (MG/L AS K)
2.8
1.9
PHOS PHATE, ORTHO, DIS SOLVED (MG/L
AS P04)
0.06
0.06
BERYL LIUM, DIS SOLVED (UG/L AS BE)
--
<1
MOLYB DENUM, DIS SOLVED (UG/L AS MO)
<1
<1
POTAS SIUM 40 TOTAL (PCI/L)
2.0
--
CHLO RIDE, DIS SOLVED (MG/L AS CL)
1.9
1.5
PHOS PHORUS
DIS SOLVED (MG/L AS P)
--
<0.010
BROMIDE DIS SOLVED (MG/L AS BR)
--
0.040
NICKEL, DIS SOLVED (UG/L AS NI)
--
1
TRITIUM TOTAL (PCI/L)
--
37
SULFATE DIS SOLVED (MG/L
AS S04)
11
6.0
PHOS PHORUS ORTHO, DIS SOLVED (MG/L AS P)
0.020
0.020
CADMIUM DIS SOLVED (UG/L AS CD)
<2.0
<1.0
SILVER, DIS SOLVED (UG/L AS AG)
--
<1.0
TRITIUM 2 SIGMA WATER, WHOLE, TOTAL (PCI/L)
--
3.2
22 Comparative Study of Ground-Water Quality, 1976 and 1996, and Initial Gain-and Loss Assessment of Boulder Creek, Boulder County, Colorado

Boulder County Water-Quality
395702105343000 - SC00107320ADBB SITE C09
WATER-QUALITY DATA
DATE
AUG 1975 08...
AUG 1996 13...
AUG
SPE- PH PH ALKA- BICAR- SPE- CIFIC WATER WATER HYDRO- LINITY ALKA- BONATE CIFIC CON- WHOLE WHOLE GEN WAT WH LINITY WATER CON- DUCT- LAB FIELD TEMPER- OXYGEN, SULFIDE TOT FET LAB WH FET DUCT- ANCE (STAND- (STAND- ATURE DIS- TOTAL FIELD (MG/L FIELD
TIME ANCE LAB ARD ARD WATER SOLVED (MG/L MG/L AS AS MG/L AS (US/CM) (US/CM) UNITS) UNITS) (DEC C) (MG/L) AS H2S) CAC03 CAC03) HC03
1300 230 -- -- -- 21.5 -- -- 92 -- 110
1230 276 250 7.1 8.38 10.4 3.55 -- 84 102
HARD- HARD- NESS MAGNE- SODIUM POTAS- CHLO- NESS NONCARB CALCIUM SIUM, SODIUM, AD- SIUM, RIDE, SULFATE TOTAL WH WAT DIS- DIS- DIS- SORP- DIS- DIS- DIS-
DATE
197508...
AUG13
AUG08
AUG13
AUG08
AUG13
AUG08
AUG13
AUG08
AUG13
1996
DATE
1975
1996
DATE
1975
1996
DATE
1975
1996
DATE
1975
1996
(MG/LASCAC03 )
98
110
FLUO-RIDE,DISSOLVED(MG/LAS F)
0.30
0.30
SOLIDS,RESIDUEAT 180DEC. CDISSOLVED(MG/L)
150
CHROMIUM,DISSOLVED(UG/LAS CR)
1
SELENIUM,DISSOLVED(UG/LAS SE)
<1
<1
TOT FLDMG/L ASCAC03
6
"
SILICA,DISSOLVED(MG/LAS
SI02)
12
12
SOLIDS,SUM OFCONSTITUENTS,
DISSOLVED(MG/L)
132
147
COBALT,DIS
SOLVED(UG/LAS CO)
<:L
ZINC,DISSOLVED(UG/LAS ZN)
1500
110
SOLVED(MG/LAS CA)
29
36
NITROGEN,
AMMONIADISSOLVED(MG/LAS N)
0.020
SOLIDS,DISSOLVED(TONSPER
AC -FT)
0.18
0.20
COPPER,DISSOLVED(UG/LAS CU)
2
160
URANIUMNATURAL
DISSOLVED(UG/LAS U)
<1.0
SOLVED(MG/LAS MG)
6.1
5.6
NITROGEN,
NITRITEDISSOLVED(MG/LAS N)
<0.010
0.010
ALUMINUM,DIS
SOLVED(UG/LAS AL)
7
IRON,DIS
SOLVED(UG/LAS FE)
20
16
RADIUM226,DIS
SOLVED,RADONMETHOD(PCI/L)
SOLVED(MG/LAS NA)
3.9
4.9
NITROGEN,
NITRITEDISSOLVED(MG/L
AS N02)
0.0
0.03
ANTIMONY,DIS
SOLVED(UG/LAS SB)
<:L
LEAD,DIS
SOLVED(UG/LAS PB)
2
2
GROSSALPHA,DIS
SOLVED(UG/LAS
U-NAT)
6.9
TIONRATIO
0.2
0.2
NITROGEN, AMMONIA +ORGANICDIS.(MG/LAS N)
<0.20
ARSENICDISSOLVED(UG/LAS AS)
<1
<:L
MANGANESE,DIS
SOLVED(UG/LAS MN)
<10
14
GROSSBETA,DISSOLVED(PCI/LAS SR/Y-90)
4.3
SODIUMPERCENT
8
8
NITROGEN,
NO2+NO3DISSOLVED(MG/LAS N)
0.330
0.100
BARIUM,DISSOLVED(UG/LAS BA)
<100
29
MERCURYDIS
SOLVED(UG/LAS HG)
<0.5
"
GROSSBETA,DIS
SOLVED(PCI/LAS
CS-137)
5.2
--
SOLVED(MG/LAS K)
2.2
1.9
PHOSPHATE,ORTHO,DISSOLVED(MG/L
AS PO4)
0.06
0.03
BERYLLIUM,DISSOLVED(UG/LAS BE)
<:L
MOLYBDENUM,DISSOLVED(UG/LAS MO)
<1
<J-
POTAS -SIUM 40TOTAL(PCI/L)
1.5
SOLVED(MG/LAS CL)
1.1
1.0
PHOSPHORUS
DISSOLVED(MG/LAS P)
<0.010
BROMIDEDISSOLVED(MG/LAS BR)
0.020
NICKEL,DISSOLVED(UG/LAS NI)
3
TRITIUMTOTAL(PCI/L)
53
SOLVED(MG/L
AS SO4)
19
23
PHOSPHORUSORTHO,DISSOLVED(MG/LAS P)
0.020
0.010
CADMIUMDISSOLVED(UG/LAS CD)
ND
<1.0
SILVER,DIS
SOLVED(UG/LAS AG)
<1.0
TRITIUM2 SIGMAWATER,WHOLE,TOTAL(PCI/L)
3.8
APPENDIX A 23

Boulder County Water-Quality
400255105165500 - SB00107113DADA SITE C16
WATER-QUALITY DATA
DATE
JUL 197629...
AUG 199614.. .
SPECIFICCONDUCT-
TIME ANCE(US/CM)
0830 600
1105 1001
SPE CIFICCON
DUCTANCELAB
(US/CM)
965
PH WATERWHOLELAB
(STANDARD
UNITS)
7.1
PH WATERWHOLEFIELD(STANDARD
UNITS)
7.83
TEMPERATUREWATER(DEC C)
13.4
OXYGEN,DISSOLVED(MG/L)
3.41
HYDROGEN
SULFIDETOTAL(MG/L
AS H2S)
ALKA LINITYWAT WHTOT FETFIELDMG/L ASCAC03
412
ALKALINITY
LAB(MG/LAS
CAC03 )
416
BICAR BONATEWATER
WH FETFIELD
MG/L ASHC03
340
DATE
JUL 1976 29...
AUG 1996 14. ..
DATE
JUL 1976 29...
AUG 1996 14. ..
DATE
JUL 1976 29...
AUG 1996 14.. .
DATE
JUL 1976 29...
AUG 1996 14.. .
DATE
JUL 1976 29...
AUG 1996 14. ..
HARDNESSTOTAL(MG/LASCAC03 )
290
480
FLUO-RIDE,DISSOLVED(MG/LAS F)
0.40
0.30
SOLIDS,RESIDUEAT 180DEC. CDISSOLVED(MG/L)
--
586
CHROMIUM,DISSOLVED(UG/LAS CR)
--
6
SELENIUM,DISSOLVED(UG/LAS SE)
1
<1
HARDNESS
NONCARBWH WATTOT FLDMG/L ASCAC03
--
--
SILICA,DISSOLVED(MG/LAS
SI02)
14
16
SOLIDS,SUM OFCONSTITUENTS,DISSOLVED(MG/L)
356
584
COBALT,DIS
SOLVED(UG/LAS CO)
--
<1
ZINC,DISSOLVED(UG/LAS ZN)
40
1
CALCIUMDISSOLVED(MG/LAS CA)
86
140
NITROGEN,
AMMONIADISSOLVED(MG/LAS N)
--
0.020
SOLIDS,DISSOLVED(TONSPER
AC- FT)
0.48
0.80
COPPER,DISSOLVED(UG/LAS CU)
4
3
URANIUMNATURAL
DISSOLVED(UG/LAS U)
--
3.0
MAGNESIUM,DISSOLVED(MG/LAS MG)
18
31
NITROGEN,
NITRITEDISSOLVED(MG/LAS N)
0.010
0.010
ALUMINUM,DIS
SOLVED(UG/LAS AL)
--
3
IRON,DIS
SOLVED(UG/LAS FE)
40
<3
RADIUM226,DIS
SOLVED,RADONMETHOD(PCI/L)
--
SODIUM,DISSOLVED(MG/LAS NA)
21
30
NITROGEN,
NITRITEDISSOLVED(MG/L
AS N02)
0.03
0.03
ANTIMONY,DIS
SOLVED(UG/LAS SB)
--
<1
LEAD,DIS
SOLVED(UG/LAS PB)
3
<1
GROSSALPHA,DIS
SOLVED(UG/LAS
U-NAT)
<5.9
SODIUMAD
SORPTION
RATIO
0.5
0.6
NITROGEN, AMMONIA +ORGANICDIS.(MG/LAS N)
--
<0.20
ARSENICDIS
SOLVED(UG/LAS AS)
1
<1
MANGANESE,DIS
SOLVED(UG/LAS MN)
<10
<1
GROSSBETA,DIS
SOLVED(PCI/LAS SR/Y-90)
3.3
SODIUMPERCENT
14
12
NITROGEN,
N02+N03DISSOLVED(MG/LAS N)
3.50
8.90
BARIUM,DISSOLVED(UG/LAS BA)
<100
340
MERCURYDISSOLVED(UG/LAS HG)
<0.5
--
GROSSBETA,DIS
SOLVED(PCI/LAS
CS-137)
3.9
POTAS -SIUM,DISSOLVED(MG/LAS K)
1.5
1.0
PHOSPHATE,ORTHO,DISSOLVED(MG/L
AS P04)
0.0
0.03
BERYLLIUM,DISSOLVED(UG/LAS BE)
--
<1
MOLYBDENUM,DIS
SOLVED(UG/LAS MO)
2
<1
POTASSIUM 40TOTAL(PCI/L)
1.1
CHLORIDE,DISSOLVED(MG/LAS CD
11
34
PHOSPHORUS
DISSOLVED(MG/LAS P)
--
<0.010
BROMIDEDISSOLVED(MG/LAS BR)
--
0.25
NICKEL,DISSOLVED(UG/LAS NI)
--
4
TRITIUMTOTAL(PCI/L)
--
92
SULFATEDISSOLVED(MG/L
AS S04)
21
42
PHOSPHORUSORTHO,DISSOLVED(MG/LAS P)
<0.010
0.010
CADMIUMDISSOLVED(UG/LAS CD)
<2.0
<1.0
SILVER,DIS
SOLVED(UG/LAS AG)
--
<1.0
TRITIUM2 SIGMAWATER,WHOLE,TOTAL(PCI/L)
--
6.4
24 Comparative Study of Ground-Water Quality, 1976 and 1996, and Initial Galn-and Loss Assessment of Boulder Creek, Boulder County, Colorado

Boulder County Water-Quality
400124105232900 - SB00107130BCBC SITE C24
WATER-QUALITY DATA
SPE- PH PH ALKA- BICAR- SPE- CIFIC WATER WATER HYDRO- LINITY ALKA- BONATE CIFIC CON- WHOLE WHOLE GEN WAT WH LINITY WATER CON- DUCT- LAB FIELD TEMPER- OXYGEN, SULFIDE TOT FET LAB WH FET DUCT- ANCE (STAND- (STAND- ATURE DIS- TOTAL FIELD (MG/L FIELD
DATE TIME ANCE LAB ARD ARD WATER SOLVED (MG/L MG/L AS AS MG/L AS (US/CM) (US/CM) UNITS) UNITS) (DEG C) (MG/L) AS H2S) CAC03 CAC03 ) HC03
NOV 1975 12... 1300 800 -- -- -- -- -- -- 251 -- 310
AUG 1996 05... 0930 915 912 7.3 7.8 11.2 2.54 -- -- 272
HARD-
DATE
NOV 197512.. .
AUG 199605...
DATE
NOV 197512...
AUG 199605...
DATE
NOV 197512. ..
AUG 199605...
DATE
NOV 197512...
AUG 199605...
DATE
NOV 197512...
AUG 199605...
HARDNESSTOTAL(MG/LAS
CAC03 )
240
230
FLUO-RIDE,DISSOLVED(MG/LAS F)
1.5
1.9
SOLIDS,RESIDUEAT 180DEG. CDISSOLVED(MG/L)
569
CHROMIUM,DISSOLVED(UG/LAS CR)
3
SELENIUM,DISSOLVED(UG/LAS SE)
<1
<1
NESSNONCARBWH WATTOT FLDMG/L ASCAC03
0
"
SILICA,DISSOLVED(MG/LAS
SI02)
21
20
SOLIDS,SUM OFCONSTI -TUENTS,
DISSOLVED(MG/L)
550
580
COBALT,DIS
SOLVED(UG/LAS CO)
<1
ZINC,DISSOLVED(UG/LAS ZN)
590
47
CALCIUMDISSOLVED(MG/LAS CA)
69
67
NITROGEN,
AMMONIADISSOLVED(MG/LAS N)
0.020
SOLIDS,DISSOLVED(TONSPER
AC -FT)
0.75
0.77
COPPER,DISSOLVED(UG/LAS CU)
65
7
URANIUMNATURALDISSOLVED(UG/LAS U)
25
MAGNESIUM,DISSOLVED(MG/LAS MG)
16
16
NITROGEN,
NITRITEDISSOLVED(MG/LAS N)
<0.010
<0.010
ALUMINUM,DIS
SOLVED(UG/LAS AL)
4
IRON,DIS
SOLVED(UG/LAS FE)
60
24
RADIUM226,DIS
SOLVED,RADONMETHOD(PCI/L)
SODIUM,DISSOLVED(MG/LAS NA)
100
110
NITROGEN,
NITRITEDISSOLVED(MG/L
AS N02)
0.0
ANTIMONY,DIS
SOLVED(UG/LAS SB)
<1
LEAD,DIS
SOLVED(UG/LAS PB)
ND
<1
GROSSALPHA,DIS
SOLVED(UG/LAS
U-NAT)
10
SODIUMAD
SORPTION
RATIO
3
3
NITROGEN, AMMONIA +ORGANICDIS.(MG/LAS N)
<0.20
ARSENICDIS
SOLVED(UG/LAS AS)
2
3
MANGANESE,DIS
SOLVED(UG/LAS MN)
30
7
GROSSBETA,DIS
SOLVED(PCI/LAS SR/Y-90)
6.8
SODIUMPERCENT
47
50
NITROGEN,
N02+N03DISSOLVED(MG/LAS N)
0.470
0.170
BARIUM,DIS
SOLVED(UG/LAS BA)
<100
27
MERCURYDIS
SOLVED(UG/LAS HG)
<0.5
"
GROSSBETA,DIS
SOLVED(PCI/LAS
CS-137)
8.2
POTAS -SIUM,DISSOLVED(MG/LAS K)
4.4
4.5
PHOSPHATE,ORTHO,DISSOLVED(MG/L
AS P04)
0.03
0.03
BERYLLIUM,DISSOLVED(UG/LAS BE)
<1
MOLYBDENUM,DIS
SOLVED(UG/LAS MO)
<1
5
POTASSIUM 40TOTAL(PCI/L)
3.3
CHLORIDE,DISSOLVED(MG/LAS CD
15
16
PHOSPHORUS
DISSOLVED(MG/LAS P)
<0.010
BROMIDEDISSOLVED(MG/LAS BR)
0.12
NICKEL,DISSOLVED(UG/LAS NI)
2
TRITIUMTOTAL(PCI/L)
SULFATEDISSOLVED(MG/L
AS S04)
170
180
PHOSPHORUSORTHO,DISSOLVED(MG/LAS P)
0.010
0.010
CADMIUMDISSOLVED(UG/LAS CD)
ND
<1.0
SILVER,DIS
SOLVED(UG/LAS AG)
<1.0
TRITIUM2 SIGMAWATER,WHOLE,TOTAL(PCI/L)
APPENDIX A 25

Boulder County Water-Quality
400226105080500 - SB00106920AACC SITE C25
WATER-QUALITY DATA
DATE
NOV 1975 24...
AUG 1996 07...
NOV
SPE- PH PH ALKA- BICAR- SPE- CIFIC WATER WATER HYDRO- LINITY ALKA- BONATE CIFIC CON- WHOLE WHOLE GEN WAT WH LINITY WATER CON- DUCT- LAB FIELD TEMPER- OXYGEN, SULFIDE TOT FET LAB WH FET DUCT- ANCE (STAND- (STAND- ATURE DIS- TOTAL FIELD (MG/L FIELD
TIME ANCE LAB ARD ARD WATER SOLVED (MG/L MG/L AS AS MG/L AS (US/CM) (US/CM) UNITS) UNITS) (DEG C) (MG/L) AS H2S) CAC03 CAC03) HC03
1200 1400 -- -- -- -- -- -- 294 -- 360
1315 1288 1250 7.5 7.93 14.0 1.55 -- 272 283
HARD- HARD- NESS MAGNE- SODIUM POTAS- CHLO- NESS NONCARB CALCIUM SIUM, SODIUM, AD- SIUM, RIDE, SULFATE TOTAL WH WAT DIS- DIS- DIS- SORP- DIS- DIS- DIS-
DATE
197524...
AUG07
NOV24
AUG07
NOV24
AUG07
NOV24
AUG07
NOV24
AUG07
1996
DATE
1975
1996
DATE
1975
1996. . .
DATE
1975
1996
DATE
1975
1996
(MG/LASCAC03 )
640
460
FLUO-RIDE,DISSOLVED(MG/LAS F)
0.30
0.30
SOLIDS,RESIDUEAT 180DEG. CDISSOLVED(MG/L)
856
CHROMIUM,DISSOLVED(UG/LAS CR)
5
SELENIUM,DISSOLVED(UG/LAS SE)
2
<1
TOT FLDMG/L ASCAC03
340
"
SILICA,DISSOLVED(MG/LAS
SI02)
15
16
SOLIDS,SUM OFCONSTI -TUENTS,
DISSOLVED(MG/L)
1050
791
COBALT,DIS
SOLVED(UG/LAS CO)
<1
ZINC,DISSOLVED(UG/LAS ZN)
120
4
SOLVED(MG/LAS CA)
190
130
NITROGEN,
AMMONIADISSOLVED(MG/LAS N)
0.020
SOLIDS,DISSOLVED(TONSPER
AC -FT)
1.43
1.16
COPPER,DISSOLVED(UG/LAS CU)
6
2
URANIUMNATURAL
DISSOLVED(UG/LAS U)
6.0
SOLVED(MG/LAS MG)
39
33
NITROGEN,
NITRITEDISSOLVED(MG/LAS N)
0.030
ALUMINUM,DIS
SOLVED(UG/LAS AL)
4
IRON,DIS
SOLVED(UG/LAS FE)
30
8
RADIUM226,DIS
SOLVED,RADONMETHOD(PCI/L)
SOLVED(MG/LAS NA)
100
100
NITROGEN,
NITRITEDISSOLVED(MG/L
AS N02)
0.10
ANTIMONY,DIS
SOLVED(UG/LAS SB)
<1
LEAD,DIS
SOLVED(UG/LAS PB)
2
<1
GROSSALPHA,DIS
SOLVED(UG/LAS
U-NAT)
11
TIONRATIO
2
2
NITROGEN, AMMONIA +ORGANICDIS.(MG/LAS N)
0.30
ARSENICDIS
SOLVED(UG/LAS AS)
<1
<1
MANGANESE,DIS
SOLVED(UG/LAS MN)
<10
1
GROSSBETA,DIS
SOLVED(PCI/LAS SR/Y-90)
6.9
SODIUMPERCENT
25
32
NITROGEN,
N02+N03DISSOLVED(MG/LAS N)
12.0
4.60
BARIUM,DISSOLVED(UG/LAS BA)
<100
23
MERCURYDISSOLVED(UG/LAS HG)
<0.5
GROSSBETA,DIS
SOLVED(PCI/LAS
CS-137)
7.9
SOLVED(MG/LAS K)
1.9
1.5
PHOSPHATE,ORTHO,DISSOLVED(MG/L
AS P04)
0.03
0.06
BERYLLIUM,DISSOLVED(UG/LAS BE)
<1
MOLYBDENUM,DIS
SOLVED(UG/LAS MO)
<1
<1
POTAS -SIUM 40TOTAL(PCI/L)
1.7
SOLVED(MG/LAS CD
21
100
PHOSPHORUS
DISSOLVED(MG/LAS P)
<0.010
BROMIDEDISSOLVED(MG/LAS BR)
0.090
NICKEL,DISSOLVED(UG/LAS NI)
4
TRITIUMTOTAL(PCI/L)
SOLVED(MG/L
AS S04)
450
220
PHOSPHORUSORTHO,DISSOLVED(MG/LAS P)
0.010
0.020
CADMIUMDISSOLVED(UG/LAS CD)
ND
<1.0
SILVER,DISSOLVED(UG/LAS AG)
<1.0
TRITIUM2 SIGMAWATER,WHOLE,TOTAL(PCI/L)
26 Comparative Study of Ground-Water Quality, 1976 and 1996, and Initial Galn-and Loss Assessment of Boulder Creek, Boulder County, Colorado
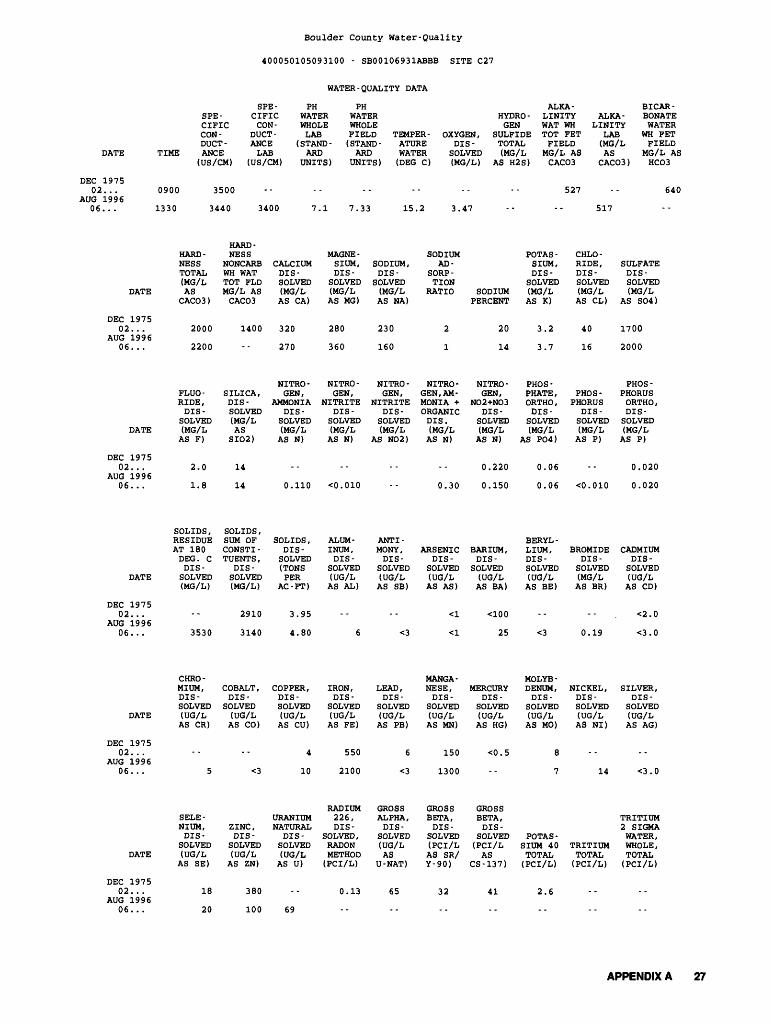
Boulder County Water-Quality
400050105093100 - SB00106931ABBB SITE C27
WATER-QUALITY DATA
SPE- PH PH ALKA- BICAR- SPE- CIFIC WATER WATER HYDRO- LINITY ALKA- BONATE CIFIC CON- WHOLE WHOLE GEN WAT WH LINITY WATER CON- DUCT- LAB FIELD TEMPER- OXYGEN, SULFIDE TOT FET LAB WH FET DUCT- ANCE (STAND- (STAND- ATURE DIS- TOTAL FIELD (MG/L FIELD
DATE TIME ANCE LAB ARD ARD WATER SOLVED (MG/L MG/L AS AS MG/L AS (US/CM) (US/CM) UNITS) UNITS) (DEC C) (MG/L) AS H2S) CAC03 CAC03) HC03
DEC 1975 02... 0900 3500 -- -- -- -- -- -- 527 -- 640
AUG 1996 06... 1330 3440 3400 7.1 7.33 15.2 3.47 -- -- 517
HARD- HARD- NESS MAGNE- SODIUM POTAS- CHLO- NESS NONCARB CALCIUM SIUM, SODIUM, AD- SIUM, RIDE, SULFATE TOTAL WH WAT DIS- DIS- DIS- SORP- DIS- DIS- DIS-
DATE
DEC 197502...
AUG 199606...
DATE
DEC 197502...
AUG 199606...
DATE
DEC 197502...
AUG 199606...
DATE
DEC 197502...
AUG 199606...
DATE
DEC 197502...
AUG 199606...
(MG/LAS
CAC03 )
2000
2200
FLUO-RIDE,DISSOLVED(MG/LAS F)
2.0
1.8
SOLIDS,RESIDUEAT 180DEC. CDISSOLVED(MG/L)
3530
CHROMIUM,DISSOLVED(UG/LAS CR)
5
SELENIUM,DISSOLVED(UG/LAS SE)
18
20
TOT FLDMG/L ASCAC03
1400
"
SILICA,DISSOLVED(MG/LAS
SI02)
14
14
SOLIDS,SUM OFCONST I -TUENTS ,
DISSOLVED(MG/L)
2910
3140
COBALT,DISSOLVED(UG/LAS CO)
<3
ZINC,DISSOLVED(UG/LAS ZN)
380
100
SOLVED(MG/LAS CA)
320
270
NITROGEN,
AMMONIADISSOLVED(MG/LAS N)
0.110
SOLIDS ,DISSOLVED(TONSPER
AC-FT)
3.95
4.80
COPPER,DISSOLVED(UG/LAS CU)
4
10
URANIUMNATURALDISSOLVED(UG/LAS U)
69
SOLVED(MG/LAS MG)
280
360
NITROGEN,
NITRITEDISSOLVED(MG/LAS N)
<0.010
ALUMINUM,DIS
SOLVED(UG/LAS AL)
6
IRON,DIS
SOLVED(UG/LAS FE)
550
2100
RADIUM226,DIS
SOLVED,RADONMETHOD(PCI/L)
0.13
SOLVED(MG/LAS NA)
230
160
NITROGEN,
NITRITEDISSOLVED(MG/L
AS N02)
ANTIMONY,DIS
SOLVED(UG/LAS SB)
<3
LEAD,DIS
SOLVED(UG/LAS PB)
6
<3
GROSSALPHA,DIS
SOLVED(UG/LAS
U-NAT)
65
TIONRATIO
2
1
NITROGEN, AMMONIA +ORGANICDIS.(MG/LAS N)
0.30
ARSENICDISSOLVED(UG/LAS AS)
<1
<1
MANGANESE,DIS
SOLVED(UG/LAS MN)
150
1300
GROSSBETA,DIS
SOLVED(PCI/LAS SR/Y-90)
32
SODIUMPERCENT
20
14
NITROGEN,
N02+N03DISSOLVED(MG/LAS N)
0.220
0.150
BARIUM,DISSOLVED(UG/LAS BA)
<100
25
MERCURYDISSOLVED(UG/LAS HG)
<0.5
"
GROSSBETA,DIS
SOLVED(PCI/LAS
CS-137)
41
SOLVED(MG/LAS K)
3.2
3.7
PHOSPHATE,ORTHO,DISSOLVED(MG/L
AS P04)
0.06
0.06
BERYLLIUM,DISSOLVED(UG/LAS BE)
<3
MOLYBDENUM,DISSOLVED(UG/LAS MO)
8
7
POTAS -SIUM 40TOTAL(PCI/L)
2.6
SOLVED(MG/LAS CL)
40
16
PHOSPHORUS
DISSOLVED(MG/LAS P)
<0.010
BROMIDEDISSOLVED(MG/LAS BR)
0.19
NICKEL,DISSOLVED(UG/LAS NI)
14
TRITIUMTOTAL(PCI/L)
SOLVED(MG/L
AS S04)
1700
2000
PHOSPHORUSORTHO,DISSOLVED(MG/LAS P)
0.020
0.020
CADMIUMDISSOLVED(UG/LAS CD)
<2.0
<3.0
SILVER,DISSOLVED(UG/LAS AG)
<3.0
TRITIUM2 SIGMAWATER,WHOLE,TOTAL(PCI/L)
APPENDIX A 27

Boulder County Water-Quality
400323105132600 - SB00107015BBCB SITE C31
WATER -QUALITY DATA
DATE
DEC 1975 06...
AUG 1996 21. . .
DEC
SPE- PH PH ALKA- BICAR- SPE- CIFIC WATER WATER HYDRO- LINITY ALKA- BONATE CIFIC CON- WHOLE WHOLE GEN WAT WH LINITY WATER CON- DUCT- LAB FIELD TEMPER- OXYGEN, SULFIDE TOT FET LAB WH FET DUCT- ANCE (STAND- (STAND- ATURE DIS- TOTAL FIELD (MG/L FIELD
TIME ANCE LAB ARD ARD WATER SOLVED (MG/L MG/L AS AS MG/L AS (US/CM) (US/CM) UNITS) UNITS) (DEG C) (MG/L) AS H2S) CACO3 CACO3 ) HCO3
1000 800 -- -- -- -- -- -- -- -- 330
0915 698 668 7.1 7.82 14.7 0.23 0.039 244 258
HARD- HARD- NESS MAGNE- SODIUM POTAS- CHLO- NESS NONCARB CALCIUM SIUM, SODIUM, AD- SIUM, RIDE, SULFATE TOTAL WH WAT DIS- DIS- DIS- SORP- DIS- DIS- DIS-
DATE
197506...
AUG 199621...
DEC06
AUG21
DEC06
AUG21
DEC06
AUG21
DATE
1975
1996
DATE
1975...1996
DATE
1975. . .1996
DATE
(MG/LASCACO3 )
330
260
FLUO-RIDE,DISSOLVED(MG/LAS F)
0.50
0.60
SOLIDS,RESIDUEAT 180DEG. CDISSOLVED(MG/L)
391
CHROMIUM,DISSOLVED(UG/LAS CR)
6
SELENIUM,DISSOLVED(UG/LAS SE)
TOT FLDMG/L ASCACO3
"
SILICA,DISSOLVED(MG/LAS
SIO2)
12
10
SOLIDS,SUM OFCONSTI -TUENTS ,
DISSOLVED(MG/L)
470
379
COBALT,DIS
SOLVED(UG/LAS CO)
<:L
ZINC,DISSOLVED(UG/LAS ZN)
SOLVED(MG/LAS CA)
89
70
NITROGEN,
AMMONIADISSOLVED(MG/LAS N)
0.030
SOLIDS,DISSOLVED(TONSPER
AC-FT)
0.64
0.53
COPPER,DISSOLVED(UG/LAS CU)
50
1
URANIUMNATURAL
DISSOLVED(UG/LAS U)
SOLVED(MG/LAS MG)
27
21
NITROGEN,
NITRITEDISSOLVED(MG/LAS N)
0.030
ALUMINUM,DIS
SOLVED(UG/LAS AL)
4
IRON,DISSOLVED(UG/LAS FE)
<10
110
RADIUM226,DIS
SOLVED,RADONMETHOD(PCI/L)
SOLVED(MG/LAS NA)
38
32
NITROGEN,
NITRITEDISSOLVED(MG/L
AS NO2)
0.10
ANTIMONY,DIS
SOLVED(UG/LAS SB)
*i
LEAD,DIS
SOLVED(UG/LAS PB)
3
<]-
GROSSALPHA,DIS
SOLVED(UG/LAS
U-NAT)
TIONRATIO
0.9
0.9
NITROGEN, AMMONIA +ORGANICDIS.(MG/LAS N)
<0.20
ARSENICDIS
SOLVED(UG/LAS AS)
1
<:L
MANGANESE,DIS
SOLVED(UG/LAS MN)
<10
21
GROSSBETA,DISSOLVED(PCI/LAS SR/Y-90)
SODIUMPERCENT
20
21
NITROGEN,
NO2+NO3DISSOLVED(MG/LAS N)
8.40
0.080
BARIUM,DISSOLVED(UG/LAS BA)
50
100
MERCURYDISSOLVED(UG/LAS HG)
<0.5
~ "
GROSSBETA,DISSOLVED(PCI/LAS
CS-137)
SOLVED(MG/LAS K)
1.4
1.1
PHOSPHATE,ORTHO,DISSOLVED(MG/L
AS P04)
0.0
BERYLLIUM,DISSOLVED(UG/LAS BE)
<l
MOLYBDENUM,DIS
SOLVED(UG/LAS MO)
2
<l
POTAS -SIUM 40TOTAL(PCI/L)
SOLVED(MG/LAS CD
19
22
PHOSPHORUS
DISSOLVED(MG/LAS P)
<0.010
BROMIDEDISSOLVED(MG/LAS BR)
0.11
NICKEL,DISSOLVED(UG/LAS NI)
3
TRITIUMTOTAL(PCI/L)
SOLVED(MG/L
AS SO4)
84
67
PHOSPHORUSORTHO,DISSOLVED(MG/LAS P)
<0.010
<0.010
CADMIUMDISSOLVED(UG/LAS CD)
<2.0
<1.0
SILVER,DISSOLVED(UG/LAS AG)
<1.0
TRITIUM2 SIGMAWATER,WHOLE,TOTAL(PCI/L)
DEC 1975 06...
AUG 1996 21...
30 10 5.9 7.2 1.3
2.0 48 3.8
28 Comparative Study of Ground-Water Quality, 1976 and 1996, and Initial Gain-and Loss Assessment of Boulder Creek, Boulder County, Colorado

Boulder County Water-Quality
400316105053100 - SB00106914BCBB SITE C33
WATER-QUALITY DATA
SPE- PH PH ALKA- BICAR- SPE- CIFIC WATER WATER HYDRO- LINITY ALKA- BONATE CIFIC CON- WHOLE WHOLE GEN WAT WH LINITY WATER CON- DUCT- LAB FIELD TEMPER- OXYGEN, SULFIDE TOT FET LAB WH FET DUCT- ANCE (STAND- (STAND- ATURE DIS- TOTAL FIELD (MG/L FIELD
DATE TIME ANCE LAB ARD ARD WATER SOLVED (MG/L MG/L AS AS MG/L AS (US/CM) (US/CM) UNITS) UNITS) (DEG C) (MG/L) AS H2S) CAC03 CAC03) HC03
DEC 1975 06... 1150 1550 -- -- -- -- -- -- -- -- 500
SEP 1996 03... 1000 1347 1330 7.5 7.52 14.6 0.34 <0.002 466 418
HARD-
DATE
DEC 197506...
SEP 199603...
DATE
DEC 197506...
SEP 199603...
DATE
DEC 197506...
SEP 199603...
DATE
DEC 197506...
SEP 199603...
DATE
DEC 197506...
SEP 199603...
HARDNESSTOTAL(MG/LAS
CAC03 )
610
470
FLUO-RIDE,DISSOLVED(MG/LAS F)
1.5
1.5
SOLIDS,RESIDUEAT 180DEG. CDISSOLVED(MG/L)
861
CHROMIUM,DISSOLVED(UG/LAS CR)
6
SELENIUM,DIS
SOLVED(UG/LAS SE)
4
1
NESSNONCARBWH WATTOT FLDMG/L ASCAC03
"
SILICA,DISSOLVED(MG/LAS
SI02)
17
15
SOLIDS,SUM OFCONSTI -TUENTS ,
DISSOLVED(MG/L)
1090
858
COBALT,DIS
SOLVED(UG/LAS CO)
<1
ZINC,DISSOLVED(UG/LAS ZN)
150
27
CALCIUMDISSOLVED(MG/LAS CA)
120
77
NITROGEN,
AMMONIADISSOLVED(MG/LAS N)
0.060
SOLIDS,DISSOLVED(TONSPER
AC -FT)
1.48
1.17
COPPER,DISSOLVED(UG/LAS CU)
19
1
URANIUMNATURALDISSOLVED(UG/LAS U)
21
MAGNESIUM,DISSOLVED(MG/LAS MG)
75
67
NITROGEN,
NITRITEDISSOLVED(MG/LAS N)
0.020
0.050
ALUMINUM,DIS
SOLVED(UG/LAS AL)
3
IRON,DIS
SOLVED(UG/LAS FE)
90
180
RADIUM226,DIS
SOLVED,RADONMETHOD(PCI/L)
--
SODIUM,DISSOLVED(MG/LAS NA)
150
120
NITROGEN,
NITRITEDISSOLVED(MG/L
AS N02)
0.07
0.16
ANTIMONY,DIS
SOLVED(UG/LAS SB)
<1
LEAD,DIS
SOLVED(UG/LAS PB)
10
<1
GROSSALPHA,DIS
SOLVED(UG/LAS
U-NAT)
--
SODIUMAD
SORPTION
RATIO
3
2
NITROGEN, AMMONIA +ORGANICDIS.(MG/LAS N)
<0.20
ARSENICDIS
SOLVED(UG/LAS AS)
<1
<1
MANGANESE,DIS
SOLVED(UG/LAS MN)
30
69
GROSSBETA,DIS
SOLVED(PCI/LAS SR/Y-90)
SODIUMPERCENT
35
36
NITROGEN,
N02+N03DIS
SOLVED(MG/LAS N)
3.10
2.50
BARIUM,DIS
SOLVED(UG/LAS BA)
<100
32
MERCURYDIS
SOLVED(UG/LAS HG)
<0.5
" "
GROSSBETA,DIS
SOLVED(PCI/LAS
CS-137)
POTAS -SIUM,DISSOLVED(MG/LAS K)
3.9
2.9
PHOSPHATE,ORTHO,DISSOLVED(MG/L
AS P04)
0.12
0.15
BERYLLIUM,DISSOLVED(UG/LAS BE)
<1
MOLYBDENUM,DIS
SOLVED(UG/LAS MO)
8
9
POTASSIUM 40TOTAL(PCI/L)
2.7
CHLORIDE,DISSOLVED(MG/LAS CD
11
21
PHOSPHORUS
DISSOLVED(MG/LAS P)
0.030
BROMIDEDISSOLVED(MG/LAS BR)
0.95
NICKEL,DISSOLVED(UG/LAS NI)
3
TRITIUMTOTAL(PCI/L)
87
SULFATEDISSOLVED(MG/L
AS S04)
450
290
PHOSPHORUSORTHO,DISSOLVED(MG/LAS P)
0.040
0.050
CADMIUMDISSOLVED(UG/LAS CD)
3.0
<1.0
SILVER,DIS
SOLVED(UG/LAS AG)
<1.0
TRITIUM2 SIGMAWATER,WHOLE,TOTAL(PCI/L)
5.8
APPENDIX A 29

Boulder County Water-Quality
400024105123500 - SB00107034DABC SITE C34
WATER-QUALITY DATA
SPE- PH PH ALKA- BICAR- SPE- CIFIC WATER WATER HYDRO- LINITY ALKA- BONATE CIFIC CON- WHOLE WHOLE GEN WAT WH LINITY WATER CON- DUCT- LAB FIELD TEMPER- OXYGEN, SULFIDE TOT FET LAB WH FET DUCT- ANCE (STAND- (STAND- ATURE DIS- TOTAL FIELD (MG/L FIELD
DATE TIME ANCE LAB ARD ARD WATER SOLVED (MG/L MG/L AS AS MG/L AS (US /CM) (US/CM) UNITS) UNITS) (DEC C) (MG/L) AS H2S) CAC03 CAC03) HC03
DEC 1975 06... 1200 1000 -- -- -- -- -- -- 239 -- 290
AUG 1996 06... 0920 912 886 7.4 7.39 13.7 3.83 -- 200 213
HARD- HARD- NESS MAGNE- SODIUM POTAS- CHLO- NESS NONCARB CALCIUM SIUM, SODIUM, AD- SIUM, RIDE, SULFATE TOTAL WH WAT DIS- DIS- DIS- SORP- DIS- DIS- DIS- (MG/L TOT FLD SOLVED SOLVED SOLVED TION SOLVED SOLVED SOLVED
DATE AS MG/L AS (MG/L (MG/L (MG/L RATIO SODIUM (MG/L (MG/L (MG/L CAC03) CAC03 AS CA) AS MG) AS NA) PERCENT AS K) AS CD AS S04)
DEC06
AUG06
1975
1996
DATE
DEC06
AUG06
1975
1996
DATE
DEC06
AUG06
1975...
1996
DATE
DEC06
AUG06
1975...
1996
DATE
DEC06
AUG06
1975
1996
410
290
FLUO-RIDE,DISSOLVED(MG/LAS F)
0.60
0.60
SOLIDS,RESIDUEAT 180DEG. CDISSOLVED(MG/L)
575
CHROMIUM,DISSOLVED(UG/LAS CR)
2
SELENIUM,DISSOLVED(UG/LAS SE)
9
3
170
"
SILICA,DISSOLVED(MG/LAS
SI02)
14
12
SOLIDS,SUM OFCONSTI -TUENTS,
DISSOLVED(MG/L)
652
573
COBALT,DIS
SOLVED(UG/LAS CO)
<1
ZINC,DISSOLVED(UG/LAS ZN)
80
2
94
67
NITROGEN,
AMMONIADISSOLVED(MG/LAS N)
0.050
SOLIDS,DISSOLVED(TONSPER
AC -FT)
0.89
0.78
COPPER,DISSOLVED(UG/LAS CU)
60
4
URANIUMNATURALDISSOLVED(UG/LAS U)
8.0
43
30
NITROGEN,
NITRITEDISSOLVED(MG/LAS N)
<0.010
<0.010
ALUMINUM,DIS
SOLVED(UG/LAS AL)
5
IRON,DIS
SOLVED(UG/LAS FE)
<10
6
RADIUM226,DIS
SOLVED,RADONMETHOD(PCI/L)
0.21
64
83
NITROGEN,
NITRITEDISSOLVED(MG/L
AS N02)
0.0
ANTIMONY,DIS
SOLVED(UG/LAS SB)
<1
LEAD,DIS
SOLVED(UG/LAS PB)
4
<1
GROSSALPHA,DIS
SOLVED(UG/LAS
U-NAT)
15
1
2
NITROGEN, AMMONIA +ORGANICDIS.(MG/LAS N)
<0.20
ARSENICDIS
SOLVED(UG/LAS AS)
<1
<1
MANGANESE,DIS
SOLVED(UG/LAS MN)
<10
2
GROSSBETA,DIS
SOLVED(PCI/LAS SR/Y-90)
10
25
38
NITROGEN,
N02+N03DISSOLVED(MG/LAS N)
6.30
2.60
BARIUM,DIS
SOLVED(UG/LAS BA)
<100
42
MERCURYDIS
SOLVED(UG/LAS HG)
<0.5
"
GROSSBETA,DIS
SOLVED(PCI/LAS
CS-137)
12
2.1
1.9
PHOSPHATE,ORTHO,DISSOLVED(MG/L
AS P04)
0.15
0.06
BERYLLIUM,DISSOLVED(UG/LAS BE)
<1
MOLYBDENUM,DISSOLVED(UG/LAS MO)
4
2
POTAS -SIUM 40TOTAL(PCI/L)
1.9
13
19
PHOSPHORUS
DISSOLVED(MG/LAS P)
<0.010
BROMIDEDISSOLVED(MG/LAS BR)
0.12
NICKEL,DISSOLVED(UG/LAS NI)
1
TRITIUMTOTAL(PCI/L)
250
220
PHOSPHORUSORTHO,DISSOLVED(MG/LAS P)
0.050
0.020
CADMIUMDISSOLVED(UG/LAS CD)
<2.0
<1.0
SILVER,DISSOLVED(UG/LAS AG)
<1.0
TRITIUM2 SIGMAWATER,WHOLE,TOTAL(PCI/L)
30 Comparative Study of Ground-Water Quality, 1976 and 1996, and Initial Galn-and Loss Assessment of Boulder Creek, Boulder County, Colorado

Boulder County Water-Quality
395818105124200 - SC00107010DCCC1 SITE C35
WATER-QUALITY DATA
SPE- PH PH ALKA- BICAR- SPE- CIFIC WATER WATER HYDRO- LINITY ALKA- BONATE CIFIC CON- WHOLE WHOLE GEN WAT WH LINITY WATER CON- DUCT- LAB FIELD TEMPER- OXYGEN, SULFIDE TOT FET LAB WH FET DUCT- ANCE (STAND- (STAND- ATURE DIS- TOTAL FIELD (MG/L FIELD
DATE TIME ANCE LAB ARD ARD WATER SOLVED (MG/L MG/L AS AS MG/L AS (US/CM) (US/CM) UNITS) UNITS) (DEC C) (MG/L) AS H2S) CACO3 CACO3) HCO3
DEC 1975 06... 1250 1400 -- -- -- -- -- -- 221 -- 270
AUG 1996 19... 0910 1573 1580 7.2 7.51 12.9 0.64 <0.002 216 216
HARD- HARD- NESS MAGNE- SODIUM POTAS- CHLO- NESS NONCARB CALCIUM SIUM, SODIUM, AD- SIUM, RIDE, SULFATE TOTAL WH WAT DIS- DIS- DIS- SORP- DIS- DIS- DIS- (MG/L TOT FLD SOLVED SOLVED SOLVED TION SOLVED SOLVED SOLVED
DATE AS MG/L AS (MG/L (MG/L (MG/L RATIO SODIUM (MG/L (MG/L (MG/L CACO3) CAC03 AS CA) AS MG) AS NA) PERCENT AS K) AS CD AS SO4)
DEC 197506...
AUG 199619...
DATE
DEC 197506. ..
AUG 199619...
DATE
DEC 197506...
AUG 199619...
DATE
DEC 197506...
AUG 199619...
DATE
DEC 197506...
AUG 199619...
880
800
FLUO-RIDE,DISSOLVED(MG/LAS F)
1.4
1.5
SOLIDS,RESIDUEAT 180DEC. CDISSOLVED(MG/L)
1250
CHROMIUM,DISSOLVED(UG/LAS CR)
5
SELENIUM,DISSOLVED(UG/LAS SE)
<1
<1
660
"
SILICA,DISSOLVED(MG/LAS
SI02)
22
19
SOLIDS,SUM OFCONSTITUENTS ,
DISSOLVED(MG/L)
1120
1160
COBALT,DIS
SOLVED(UG/LAS CO)
<1
ZINC,DISSOLVED(UG/LAS ZN)
130
5
220
180
NITROGEN,
AMMONIADISSOLVED(MG/LAS N)
0.060
SOLIDS,DISSOLVED(TONSPER
AC-FT)
1.52
1.70
COPPER,DISSOLVED(UG/LAS CU)
42
7
URANIUMNATURALDISSOLVED(UG/LAS U)
11
81
86
NITROGEN,
NITRITEDISSOLVED(MG/LAS N)
<0.010
<0.010
ALUMINUM,DIS
SOLVED(UG/LAS AL)
3
IRON,DIS
SOLVED(UG/LAS FE)
<10
77
RADIUM226,DIS
SOLVED,RADONMETHOD(PCI/L)
0.14
34
37
NITROGEN,
NITRITEDISSOLVED(MG/L
AS NO2)
0.0
ANTIMONY,DIS
SOLVED(UG/LAS SB)
<1
LEAD,DIS
SOLVED(UG/LAS PB)
3
<1
GROSSALPHA,DIS
SOLVED(UG/LAS
U-NAT)
21
0.5
0.6
NITROGEN, AMMONIA +ORGANICDIS.(MG/LAS N)
<0.20
ARSENICDIS
SOLVED(UG/LAS AS)
<1
<1
MANGANESE,DIS
SOLVED(UG/LAS MN)
90
65
GROSSBETA,DISSOLVED(PCI/LAS SR/Y-90)
8.9
8
9
NITROGEN,
NO2+N03DISSOLVED(MG/LAS N)
0.320
0.190
BARIUM,DIS
SOLVED(UG/LAS BA)
50
21
MERCURYDIS
SOLVED(UG/LAS HG)
<0.5
"
GROSSBETA,DIS
SOLVED(PCI/LAS
CS-137)
11
2.3
2.5
PHOSPHATE,ORTHO,DISSOLVED(MG/L
AS PO4)
0.0
0.06
BERYLLIUM,DISSOLVED(UG/LAS BE)
<1
MOLYBDENUM,DIS
SOLVED(UG/LAS MO)
3
2
POTAS -SIUM 40TOTAL(PCI/L)
2.0
5.3
11
PHOSPHORUS
DISSOLVED(MG/LAS P)
<0.010
BROMIDEDISSOLVED(MG/LAS BR)
0.13
NICKEL,DISSOLVED(UG/LAS NI)
8
TRITIUMTOTAL(PCI/L)
53
620
690
PHOSPHORUSORTHO,DISSOLVED(MG/LAS P)
<0.010
0.020
CADMIUMDISSOLVED(UG/LAS CD)
<2.0
<1.0
SILVER,DIS
SOLVED(UG/LAS AG)
<1.0
TRITIUM2 SIGMAWATER,WHOLE,TOTAL(PCI/L)
3.8
APPENDIX A 31

Boulder County Water-Quality
400658105151200 - SB00207020DCCC SITE C41
WATER-QUALITY DATA
DATE
JAN 1976 21...
AUG 1996 08...
JAN21
AUG08
JAN21
AUG08
JAN21
AUG08
SPE- PH PH ALKA- BICAR- SPE- CIFIC WATER WATER HYDRO- LINITY ALKA- BONATE CIFIC CON- WHOLE WHOLE GEN WAT WH LINITY WATER CON- DUCT- LAB FIELD TEMPER- OXYGEN, SULFIDE TOT FET LAB WH FET DUCT- ANCE (STAND- (STAND- ATURE DIS- TOTAL FIELD (MG/L FIELD
TIME ANCE LAB ARD ARD WATER SOLVED (MG/L MG/L AS AS MG/L AS (US/CM) (US/CM) UNITS) UNITS) (DEG C) (MG/L) AS H2S) CAC03 CAC03) HC03
1030 600 -- -- -- 6.0 -- -- -- -- 350
1400 638 627 7.3 7.71 15.2 3.43 -- 344 298
HARD- HARD- NESS MAGNE- SODIUM POTAS- CHLO- NESS NONCARB CALCIUM SIUM, SODIUM, AD- SIUM, RIDE, SULFATE TOTAL WH WAT DIS- DIS- DIS- SORP- DIS- DIS- DIS-
DATE
1976
1996
DATE
1976
1996
DATE
1976
1996
DATE
JAN21
AUG08
JAN21
AUG08
1976
1996
DATE
1976
1996
(MG/LAS
CAC03 )
280
300
FLUO-RIDE,DIS
SOLVED(MG/LAS F)
0.90
0.90
SOLIDS,RESIDUEAT 180DEG. CDISSOLVED(MG/L)
367
CHROMIUM,DISSOLVED(UG/LAS CR)
5
SELENIUM,DISSOLVED(UG/LAS SE)
1
<1
TOT FLDMG/L ASCAC03
"
SILICA,DISSOLVED(MG/LAS
SI02)
9.6
12
SOLIDS,SUM OFCONSTI -TUENTS ,
DISSOLVED(MG/L)
356
361
COBALT,DIS
SOLVED(UG/LAS CO)
<1
ZINC,DISSOLVED(UG/LAS ZN)
90
1
SOLVED(MG/LAS CA)
62
66
NITROGEN,
AMMONIADIS
SOLVED(MG/LAS N)
0.030
SOLIDS,DISSOLVED(TONSPER
AC -FT)
0.48
0.50
COPPER,DISSOLVED(UG/LAS CU)
14
2
URANIUMNATURAL
DISSOLVED(UG/LAS U)
4.0
SOLVED(MG/LAS MG)
30
32
NITROGEN,
NITRITEDIS
SOLVED(MG/LAS N)
<0.010
ALUMINUM,DIS
SOLVED(UG/LAS AL)
4
IRON,DIS
SOLVED(UG/LAS FE)
60
<3
RADIUM226,DIS
SOLVED,RADONMETHOD(PCI/L)
SOLVED(MG/LAS NA)
24
17
NITROGEN,
NITRITEDISSOLVED(MG/L
AS N02)
ANTIMONY,DIS
SOLVED(UG/LAS SB)
<1
LEAD,DIS
SOLVED(UG/LAS PB)
9
<1
GROSSALPHA,DIS
SOLVED(UG/LAS
U-NAT)
12
TIONRATIO
0.6
0.4
NITROGEN, AMMONIA +ORGANICDIS.(MG/LAS N)
<0.20
ARSENICDISSOLVED(UG/LAS AS)
<1
<1
MANGANESE,DIS
SOLVED(UG/LAS MN)
<10
<1
GROSSBETA,DISSOLVED(PCI/LAS SR/Y-90)
3.7
SODIUMPERCENT
16
11
NITROGEN,
N02+N03DIS
SOLVED(MG/LAS N)
0.700
0.240
BARIUM,DIS
SOLVED(UG/LAS BA)
<100
55
MERCURYDIS
SOLVED(UG/LAS HG)
<0.5
"
GROSSBETA,DISSOLVED(PCI/LAS
CS-137)
4.5
SOLVED(MG/LAS K)
1.8
1.5
PHOSPHATE,ORTHO,DISSOLVED(MG/L
AS P04)
0.03
0.03
BERYLLIUM,DISSOLVED(UG/LAS BE)
<1
MOLYBDENUM,DIS
SOLVED(UG/LAS MO)
2
2
POTASSIUM 40TOTAL(PCI/L)
1.3
SOLVED(MG/LAS CD
2.2
1.4
PHOSPHORUS
DISSOLVED(MG/LAS P)
<0.010
BROMIDEDISSOLVED(MG/LAS BR)
0.040
NICKEL,DISSOLVED(UG/LAS NI)
2
TRITIUMTOTAL(PCI/L)
50
SOLVED(MG/L
AS S04)
52
50
PHOSPHORUSORTHO,DISSOLVED(MG/LAS P)
0.010
0.010
CADMIUMDISSOLVED(UG/LAS CD)
2.0
<1.0
SILVER,DIS
SOLVED(UG/LAS AG)
<1.0
TRITIUM2 SIGMAWATER,WHOLE,TOTAL(PCI/L)
3.8
32 Comparative Study of Ground-Water Quality, 1976 and 1996, and Initial Gain-and Loss Assessment of Boulder Creek, Boulder County, Colorado

Boulder County Water-Quality
400419105085900 - SB00106907AAAA SITE C44
WATER-QUALITY DATA
DATE
FEB 197605...
AUG 199621...
SPECIFICCONDUCT-
TIME ANCE(US/CM)
1350 1300
1335 1342
SPE CIFICCON
DUCTANCELAB
(US/CM)
1270
PH WATERWHOLELAB
(STANDARD
UNITS)
7.2
PH WATERWHOLEFIELD(STANDARD
UNITS)
7.29
TEMPERATUREWATER(DEC C)
16.7
OXYGEN,DISSOLVED(MG/L)
0.89
HYDROGEN
SULFIDETOTAL(MG/L
AS H2S)
0.002
ALKA LINITYWAT WHTOT FETFIELDMG/L ASCACO3
383
468
ALKALINITYLAB(MG/LASCAC03 )
404
BICAR BONATEWATER
WH FETFIELDMG/L ASHC03
440
DATE
FEB 1976 05...
AUG 1996 21...
DATE
FEB 1976 05...
AUG 1996 21...
DATE
FEB 1976 05...
AUG 1996 21...
DATE
FEB 1976 05...
AUG 1996 21...
DATE
FEB 1976 05...
AUG 1996 21...
HARDNESSTOTAL(MG/LAS
CAC03)(00900)
630
640
FLUO-RIDE,DISSOLVED(MG/LAS F)
2.4
2.3
SOLIDS,RESIDUEAT 180DEC. CDISSOLVED(MG/L)
--
910
CHROMIUM,DISSOLVED(UG/LAS CR)
--
8
SELENIUM,DISSOLVED(UG/LAS SE)
<1
<1
HARDNESS
NONCARBWH WATTOT FLDMG/L ASCAC03(00902)
250
SILICA,DISSOLVED(MG/LAS
SI02)
19
21
SOLIDS,SUM OFCONSTI -TUENTS,
DISSOLVED(MG/L)
836
860
COBALT,DIS
SOLVED(UG/LAS CO)
--
<1
ZINC,DISSOLVED(UG/LAS ZN)
2700
6
CALCIUMDISSOLVED(MG/LAS CA)(00915)
100
100
NITROGEN,
AMMONIADISSOLVED(MG/LAS N)
--
0.120
SOLIDS,DISSOLVED(TONSPER
AC -FT)
1.14
1.24
COPPER,DISSOLVED(UG/LAS CU)
3
1
URANIUMNATURALDISSOLVED(UG/LAS U)
--
5.0
MAGNESIUM,DISSOLVED(MG/LAS MG)(00925)
93
94
NITROGEN,
NITRITEDISSOLVED(MG/LAS N)
<0.010
<0.010
ALUMINUM,DIS
SOLVED(UG/LAS AL)
--
3
IRON,DIS
SOLVED(UG/LAS FE)
<10
230
RADIUM226,DIS
SOLVED,RADONMETHOD(PCI/L)
--
SODIUM,DISSOLVED(MG/LAS NA)(00930)
47
45
NITROGEN,
NITRITEDISSOLVED(MG/L
AS NO2)
0.0
--
ANTIMONY,DIS
SOLVED(UG/LAS SB)
--
<1
LEAD,DIS
SOLVED(UG/LAS PB)
2
<1
GROSSALPHA,DIS
SOLVED(UG/LAS
U-NAT)
36
SODIUMAD
SORPTION
RATIO
(00931)
0.8
0.8
NITROGEN, AMMONIA +ORGANICDIS.(MG/LAS N)
--
<0.20
ARSENICDIS
SOLVED(UG/LAS AS)
<1
<1
MANGANESE,DIS
SOLVED(UG/LAS MN)
50
45
GROSSBETA,DIS
SOLVED(PCI/LAS SR/Y-90)
14
SODIUMPERCENT(00932)
14
13
NITROGEN,
NO2+NO3DISSOLVED(MG/LAS N)
0.150
0.050
BARIUM,DIS
SOLVED(UG/LAS BA)
<100
45
MERCURYDIS
SOLVED(UG/LAS HG)
<0.5
--
GROSSBETA,DIS
SOLVED(PCI/LAS
CS-137)
18
POTAS -SIUM,DISSOLVED(MG/LAS K)(00935)
3.3
2.5
PHOSPHATE,ORTHO,DISSOLVED(MG/L
AS P04)
0.03
0.03
BERYLLIUM,DISSOLVED(UG/LAS BE)
..
<1
MOLYBDENUM,DIS
SOLVED(UG/LAS MO)
5
5
POTAS -SIUM 40TOTAL(PCI/L)
2.3
CHLORIDE,DISSOLVED(MG/LAS CD(00940)
8.2
2.3
PHOSPHORUS
DISSOLVED(MG/LAS P)
--
<0.010
BROMIDEDISSOLVED(MG/LAS BR)
--
0.14
NICKEL,DISSOLVED(UG/LAS NI)
--
4
TRITIUMTOTAL(PCI/L)
--
<2.5
SULFATEDISSOLVED(MG/L
AS S04)(00945)
330
350
PHOSPHORUSORTHO,DISSOLVED(MG/LAS P)
0.010
0.010
CADMIUMDISSOLVED(UG/LAS CD)
<2.0
<1.0
SILVER,DIS
SOLVED(UG/LAS AG)
--
<1.0
TRITIUM2 SIGMAWATER,WHOLE,TOTAL(PCI/L)
--
1.9
APPENDIX A 33

Boulder County Water-Quality
395738105103200 - SC00107013CDAA SITE C46
WATER-QUALITY DATA
DATE
FEE 1976 04...
AUG 1996 05...
FEE04
AUG05
FEE04
AUG05
SPE- PH PH ALKA- BICAR- SPE- CIFIC WATER WATER HYDRO- LINITY ALKA- BONATE CIFIC CON- WHOLE WHOLE GEN WAT WH LINITY WATER CON- DUCT- LAB FIELD TEMPER- OXYGEN, SULFIDE TOT FET LAB WH FET DUCT- ANCE (STAND- (STAND- ATURE DIS- TOTAL FIELD (MG/L FIELD
TIME ANCE LAB ARD ARD WATER SOLVED (MG/L MG/L AS AS MG/L AS (US/CM) (US/CM) UNITS) UNITS) (DEC C) (MG/L) AS H2S) CACO3 CACO3) HCO3
0900 270 -- -- -- -- -- -- 117 -- 140
1300 305 305 7.3 7.18 15.1 7.02 -- -- 134
HARD- HARD- NESS MAGNE- SODIUM POTAS- CHLO- NESS NONCARB CALCIUM SIUM, SODIUM, AD- SIUM, RIDE, SULFATE TOTAL WH WAT DIS- DIS- DIS- SORP- DIS- DIS- DIS-
DATE
1976
1996
DATE
1976
1996
DATE
FEE04
AUG05
FEB04
AUG05
FEB04
AUG05
1976...1996
DATE
1976
1996
DATE
1976. . .1996
(MG/LASCACO3 )
140
130
FLUO-RIDE,DISSOLVED(MG/LAS F)
0.40
0.50
SOLIDS,RESIDUEAT 180DEC. CDISSOLVED(MG/L)
175
CHROMIUM,DISSOLVED(UG/LAS CR)
2
SELENIUM,DISSOLVED(UG/LAS SE)
<1
<1
TOT FLDMG/L ASCACO3
24
"
SILICA,DISSOLVED(MG/LAS
SIO2)
13
15
SOLIDS,SUM OFCONST I -TUENTS,
DISSOLVED(MG/L)
171
176
COBALT,DIS
SOLVED(UG/LAS CO)
<1
ZINC,DISSOLVED(UG/LAS ZN)
210
11
SOLVED(MG/LAS CA)
45
39
NITROGEN,
AMMONIADISSOLVED(MG/LAS N)
0.020
SOLIDS,DISSOLVED(TONSPER
AC -FT)
0.23
0.24
COPPER,DISSOLVED(UG/LAS CU)
33
10
URANIUMNATURAL
DISSOLVED(UG/LAS U)
2.0
SOLVED(MG/LAS MG)
7.0
7.5
NITROGEN,
NITRITEDISSOLVED(MG/LAS N)
<0.010
<0.010
ALUMINUM,DIS
SOLVED(UG/LAS AL)
4
IRON,DISSOLVED(UG/LAS FE)
<10
<3
RADIUM226,DIS
SOLVED,RADONMETHOD(PCI/L)
SOLVED(MG/LAS NA)
7.7
12
NITROGEN,
NITRITEDISSOLVED(MG/L
AS N02)
0.0
ANTIMONY,DIS
SOLVED(UG/LAS SB)
<1
LEAD,DIS
SOLVED(UG/LAS PB)
2
2
GROSSALPHA,DIS
SOLVED(UG/LAS
U-NAT)
<3.1
TIONRATIO
0.3
0.5
NITROGEN, AMMONIA +ORGANICDIS.(MG/LAS N)
<0.20
ARSENICDIS
SOLVED(UG/LAS AS)
<1
<1
MANGANESE,DIS
SOLVED(UG/LAS MN)
<10
<1
GROSSBETA,DIS
SOLVED(PCI/LAS SR/Y-90)
1.6
SODIUMPERCENT
11
17
NITROGEN,
NO2+NO3DISSOLVED(MG/LAS N)
0.740
0.450
BARIUM,DIS
SOLVED(UG/LAS BA)
<100
73
MERCURYDIS
SOLVED(UG/LAS HG)
<0.5
GROSSBETA,DIS
SOLVED(PCI/LAS
CS-137)
1.8
SOLVED(MG/LAS K)
0.70
0.60
PHOSPHATE,ORTHO,DISSOLVED(MG/L
AS PO4)
0.0
0.12
BERYLLIUM,DISSOLVED(UG/LAS BE)
<1
MOLYBDENUM,DIS
SOLVED(UG/LAS MO)
1
<1
POTAS -SIUM 40TOTAL(PCI/L)
0.49
SOLVED(MG/LAS CL)
3.6
3.2
PHOSPHORUSDISSOLVED(MG/LAS P)
<0.010
BROMIDEDISSOLVED(MG/LAS BR)
0.050
NICKEL,DISSOLVED(UG/LAS NI)
1
TRITIUMTOTAL(PCI/L)
SOLVED(MG/L
AS SO4)
20
16
PHOSPHORUSORTHO,DISSOLVED(MG/LAS P)
<0.010
0.040
CADMIUMDISSOLVED(UG/LAS CD)
<2.0
<1.0
SILVER,DIS
SOLVED(UG/LAS AG)
<1.0
TRITIUM2 SIGMAWATER,WHOLE,TOTAL(PCI/L)
34 Comparative Study of Ground-Water Quality, 1976 and 1996, and Initial Gain-and Loss Assessment of Boulder Creek, Boulder County, Colorado

Boulder County Water-Quality
400519105194200 - SB00207134DCCC SITE C52
WATER-QUALITY DATA
DATE
FEE 1976 11. . .
AUG 1996 14. ..
FEE11
AUG14
FEB11
AUG14
FEB11
AUG14
FEB11
AUG14
FEB11
AUG14
SPE- PH PH ALKA- BICAR- SPE- CIFIC WATER WATER HYDRO- LINITY ALKA- BONATE CIFIC CON- WHOLE WHOLE GEN WAT WH LINITY WATER CON- DUCT- LAB FIELD TEMPER- OXYGEN, SULFIDE TOT FET LAB WH FET DUCT- ANCE (STAND- (STAND- ATURE DIS- TOTAL FIELD (MG/L FIELD
TIME ANCE LAB ARD ARD WATER SOLVED (MG/L MG/L AS AS MG/L AS (US/CM) (US/CM) UNITS) UNITS) (DEG C) (MG/L) AS H2S) CAC03 CAC03) HC03
1250 375 -- -- -- 13.0 -- -- -- -- 170
1320 499 493 7.3 7.66 12.1 1.64 -- -- 135
HARD- HARD- NESS MAGNE- SODIUM POTAS- CHLO- NESS NONCARB CALCIUM SIUM, SODIUM, AD- SIUM, RIDE, SULFATE TOTAL WH WAT DIS- DIS- DIS- SORP- DIS- DIS- DIS-
DATE
1976...
1996
DATE
1976...1996
DATE
1976
1996. . .
DATE
1976
1996
DATE
1976
1996
(MG/LAS
CAC03 )
170
210
FLUO-RIDE,DISSOLVED(MG/LAS F)
1.3
0.90
SOLIDS,RESIDUEAT 180DEG. CDISSOLVED(MG/L)
302
CHROMIUM,DISSOLVED(UG/LAS CR)
2
SELENIUM,DISSOLVED(UG/LAS SE)
<1
<1
TOT FLDMG/L ASCAC03
SILICA,DISSOLVED(MG/LAS
SI02)
9.3
11
SOLIDS,SUM OFCONSTI -TUENTS,
DISSOLVED(MG/L)
229
264
COBALT,DIS
SOLVED(UG/LAS CO)
<1
ZINC,DISSOLVED(UG/LAS ZN)
240
9
SOLVED(MG/LAS CA)
50
61
NITROGEN,
AMMONIADISSOLVED(MG/LAS N)
0.020
SOLIDS,DISSOLVED(TONSPER
AC -FT)
0.31
0.41
COPPER,DISSOLVED(UG/LAS CU)
25
9
URANIUMNATURAL
DISSOLVED(UG/LAS U)
62
SOLVED(MG/LAS MG)
11
14
NITROGEN,
NITRITEDISSOLVED(MG/LAS N)
<0.010
0.010
ALUMINUM,DIS
SOLVED(UG/LAS AL)
3
IRON,DIS
SOLVED(UG/LAS FE)
<10
<3
RADIUM226,DIS
SOLVED,RADONMETHOD(PCI/L)
SOLVED(MG/LAS NA)
8.9
8.0
NITROGEN,
NITRITEDISSOLVED(MG/L
AS N02)
0.0
0.03
ANTIMONY,DIS
SOLVED(UG/LAS SB)
<1
LEAD,DIS
SOLVED(UG/LAS PB)
5
<1
GROSSALPHA,DIS
SOLVED(UG/LAS
U-NAT)
71
TIONRATIO
0.3
0.2
NITROGEN, AMMONIA +ORGANICDIS.(MG/LAS N)
<0.20
ARSENICDISSOLVED(UG/LAS AS)
1
<1
MANGANESE,DISSOLVED(UG/LAS MN)
<10
<1
GROSSBETA,DISSOLVED(PCI/LAS SR/Y-90)
36
SODIUMPERCENT
10
7
NITROGEN,
N02+N03DISSOLVED(MG/LAS N)
2.10
2.20
BARIUM,DISSOLVED(UG/LAS BA)
<100
4
MERCURYDISSOLVED(UG/LAS HG)
<0.5
~ ~
GROSSBETA,DIS
SOLVED(PCI/LAS
CS-137)
43
SOLVED(MG/LAS K)
5.8
5.5
PHOSPHATE,ORTHO,DISSOLVED(MG/L
AS P04)
0.03
0.03
BERYLLIUM,DISSOLVED(UG/LAS BE)
<1
MOLYBDENUM,DIS
SOLVED(UG/LAS MO)
1
<1
POTAS -SIUM 40TOTAL(PCI/L)
4.1
SOLVED(MG/LAS CD
3.6
55
PHOSPHORUS
DISSOLVED(MG/LAS P)
<0.010
BROMIDEDISSOLVED(MG/LAS BR)
0.080
NICKEL,DISSOLVED(UG/LAS NI)
2
TRITIUMTOTAL(PCI/L)
78
SOLVED(MG/L
AS S04)
45
18
PHOSPHORUSORTHO,DISSOLVED(MG/LAS P)
0.010
0.010
CADMIUMDISSOLVED(UG/LAS CD)
<2.0
<1.0
SILVER,DIS
SOLVED(UG/LAS AG)
<1.0
TRITIUM2 SIGMAWATER,WHOLE,TOTAL(PCI/L)
5.1
APPENDIX A 35

Boulder County Water-Quality
400603105141900 - SB00207033BABB SITE C53
WATER-QUALITY DATA
SPE- PH PH ALKA- BICAR- SPE- CIFIC WATER WATER HYDRO- LINITY ALKA- BONATE CIFIC CON- WHOLE WHOLE GEN WAT WH LINITY WATER CON- DUCT- LAB FIELD TEMPER- OXYGEN, SULFIDE TOT FET LAB WH FET DUCT- ANCE (STAND- (STAND- ATURE DIS- TOTAL FIELD (MG/L FIELD
DATE TIME ANCE LAB ARD ARD WATER SOLVED (MG/L MG/L AS AS MG/L AS (US/CM) (US/CM) UNITS) UNITS) (DEC C) (MG/L) AS H2S) CAC03 CAC03) HC03
FEE 1976 11... 1300 1800 -- -- -- 26.0 -- -- 1030 -- 1260
AUG 1996 08... 1120 1436 1450 8.4 8.72 20.5 0.1 0.026 800 762
HARD-
DATE
FEE 197611...
AUG 199608...
DATE
FEE 197611.. .
AUG 199608...
DATE
FEE 197611...
AUG 199608...
DATE
FEE 197611. ..
AUG 199608...
DATE
HARDNESSTOTAL(MG/LAS
CAC03)
15
11
FLUO-RIDE,DISSOLVED(MG/LAS F)
4.7
2.8
SOLIDS,RESIDUEAT 180DEC. CDISSOLVED(MG/L)
932
CHROMIUM,DISSOLVED(UG/LAS CR)
10
SELENIUM,DISSOLVED(UG/LAS SE)
NESSNONCARBWH WATTOT FLDMG/L ASCAC03
0
SILICA,DISSOLVED(MG/LAS
SI02)
28
37
SOLIDS,SUM OFCONSTI -TUENTS,
DISSOLVED(MG/L)
1180
891
COBALT,DIS
SOLVED(UG/LAS CO)
<:L
ZINC,DISSOLVED(UG/LAS ZN)
CALCIUMDISSOLVED(MG/LAS CA)
4.1
2.7
NITROGEN,
AMMONIADISSOLVED(MG/LAS N)
0.440
SOLIDS,DISSOLVED(TONSPER
AC -FT)
1.60
1.27
COPPER,DISSOLVED(UG/LAS CU)
<2
<:L
URANIUMNATURAL
DISSOLVED(UG/LAS U)
MAGNESIUM,DISSOLVED(MG/LAS MG)
1.2
0.91
NITROGEN,
NITRITEDISSOLVED(MG/LAS N)
<0.010
<0.010
ALUMINUM,DIS
SOLVED(UG/LAS AL)
3
IRON,DIS
SOLVED(UG/LAS FE)
720
140
RADIUM226,DIS
SOLVED,RADONMETHOD(PCI/L)
SODIUM,DISSOLVED(MG/LAS NA)
480
350
NITROGEN,
NITRITEDISSOLVED(MG/L
AS N02)
0.0
"
ANTIMONY,DIS
SOLVED(UG/LAS SB)
<l
LEAD,DIS
SOLVED(UG/LAS PB)
3
<:L
GROSSALPHA,DIS
SOLVED(UG/LAS
U-NAT)
SODIUMAD
SORPTION
RATIO
54
47
NITROGEN, AMMONIA +ORGANICDIS.(MG/LAS N)
0.50
ARSENICDIS
SOLVED(UG/LAS AS)
2
1
MANGANESE,DIS
SOLVED(UG/LAS MN)
20
28
GROSSBETA,DIS
SOLVED(PCI/LAS SR/Y-90)
SODIUMPERCENT
98
98
NITROGEN,
N02+N03DISSOLVED(MG/LAS N)
0.060
0.070
BARIUM,DISSOLVED(UG/LAS BA)
<100
330
MERCURYDISSOLVED(UG/LAS HG)
<0.5
GROSSBETA,DISSOLVED(PCI/LAS
CS-137)
POTASSIUM,DISSOLVED(MG/LAS K)
1.7
1.5
PHOSPHATE,ORTHO,DISSOLVED(MG/L
AS P04)
0.03
0.06
BERYLLIUM,DISSOLVED(UG/LAS BE)
<l
MOLYBDENUM,DISSOLVED(UG/LAS MO)
<1
<:L
POTASSIUM 40TOTAL(PCI/L)
CHLORIDE,DISSOLVED(MG/LAS CD
30
20
PHOSPHORUS
DISSOLVED(MG/LAS P)
<0.010
BROMIDEDISSOLVED(MG/LAS BR)
0.17
NICKEL,DISSOLVED(UG/LAS NI)
<:L
TRITIUMTOTAL(PCI/L)
SULFATEDISSOLVED(MG/L
AS S04)
7.1
18
PHOSPHORUSORTHO,DISSOLVED(MG/LAS P)
0.010
0.020
CADMIUMDISSOLVED(UG/LAS CD)
<2.0
<1.0
SILVER,DISSOLVED(UG/LAS AG)
<1.0
TRITIUM2 SIGMAWATER,WHOLE,TOTAL(PCI/L)
FEE 1976 11. . .
AUG 1996 08...
<26 13 16 1.2
36 Comparative Study of Ground-Water Quality, 1976 and 1996, and Initial Galn-and Loss Assessment of Boulder Creek, Boulder County, Colorado

Boulder County Water-Quality
400109105193400 - SB00107127DBCD SITE C55
WATER-QUALITY DATA
FEB 1976 12. . .
AUG 1996 21. . .
1250
1115
SPECIFICCONDUCTANCE(US/CM)
569
401
SPECIFICCON
DUCTANCELAB
(US/CM)
--
395
PHWATERWHOLELAB
(STANDARD
UNITS)
6.8
PHWATERWHOLEFIELD(STANDARD
UNITS)
--
6.78
TEMPERATUREWATER(DEG C)
9.0
12.8
OXYGEN,DISSOLVED(MG/L)
--
4.44
HYDROGEN
SULFIDETOTAL(MG/L
AS H2S)
--
ALKALINITYWAT WHTOT FETFIELD
MG/L ASCAC03
--
100
ALKALINITYLAB(MG/LAS
CAC03 )
--
115
BICARBONATEWATER
WH FETFIELD
MG/L ASHC03
110
FEB 1976 12...
AUG 1996 21...
FEB 1976 12...
AUG 1996 21. . .
DATE
FEB 1976 12...
AUG 1996 21...
DATE
FEB 1976 12...
AUG 1996 21...
DATE
FEB 1976 12...
AUG 1996 21...
HARDNESSTOTAL(MG/LASCAC03 )
200
140
FLUO-RIDE,DISSOLVED(MG/LAS F)
0.40
0.30
SOLIDS,RESIDUEAT 180DEG. CDISSOLVED(MG/L)
--
238
CHROMIUM,DISSOLVED(UG/LAS CR)
--
3
SELENIUM,DISSOLVED(UG/LAS SE)
HARDNESS
NONCARBWH WATTOT FLDMG/L ASCAC03
--
--
SILICA,DISSOLVED(MG/LAS
SI02)
16
17
SOLIDS,SUM OFCONSTI -TUENTS,
DISSOLVED(MG/L)
366
237
COBALT,DIS
SOLVED(UG/LAS CO)
--
<l
ZINC,DISSOLVED(UG/LAS ZN)
CALCIUMDISSOLVED(MG/LAS CA)
51
35
NITROGEN,
AMMONIADISSOLVED(MG/LAS N)
--
0.020
SOLIDS,DISSOLVED(TONSPER
AC -FT)
0.50
0.32
COPPER,DISSOLVED(UG/LAS CU)
70
1
URANIUMNATURALDISSOLVED(UG/LAS U)
MAGNESIUM,DISSOLVED(MG/LAS MG)
17
13
NITROGEN,
NITRITEDISSOLVED(MG/LAS N)
0.010
<0.010
ALUMINUM,DIS
SOLVED(UG/LAS AL)
--
4
IRON,DIS
SOLVED(UG/LAS FE)
<10
<3
RADIUM226,DIS
SOLVED,RADONMETHOD(PCI/L)
SODIUM,DISSOLVED(MG/LAS NA)
28
18
NITROGEN,
NITRITEDISSOLVED(MG/L
AS N02)
0.03
--
ANTIMONY,DIS
SOLVED(UG/LAS SB)
--
<:L
LEAD,DIS
SOLVED(UG/LAS PB)
3
<l
GROSSALPHA,DIS
SOLVED(UG/LAS
U-NAT)
SODIUMAD
SORPTION
RATIO
0.9
0.7
NITROGEN, AMMONIA +ORGANICDIS.(MG/LAS N)
--
<0.20
ARSENICDISSOLVED(UG/LAS AS)
2
<:L
MANGANESE,DISSOLVED(UG/LAS MM)
<10
<l
GROSSBETA,DISSOLVED(PCI/LAS SR/Y-90)
SODIUMPERCENT
23
21
NITROGEN,
N02+N03DISSOLVED(MG/LAS N)
14.0
6.20
BARIUM,DISSOLVED(UG/LAS BA)
<100
98
MERCURYDISSOLVED(UG/LAS HG)
<0.5
--
GROSSBETA,DISSOLVED(PCI/LAS
CS-137)
POTAS -SIUM,DISSOLVED(MG/LAS K)
4.2
3.5
PHOSPHATE,ORTHO,DISSOLVED(MG/L
AS P04)
2.3
1.8
BERYLLIUM,DISSOLVED(UG/LAS BE)
--
<l
MOLYBDENUM,DIS
SOLVED(UG/LAS MO)
1
<l
POTAS -SIUM 40TOTAL(PCI/L)
CHLORIDE,DISSOLVED(MG/LAS CD
21
12
PHOSPHORUS
DISSOLVED(MG/LAS P)
--
0.490
BROMIDEDISSOLVED(MG/LAS BR)
--
0.090
NICKEL,DISSOLVED(UG/LAS NI)
--
2
TRITIUMTOTAL(PCI/L)
SULFATEDISSOLVED(MG/L
AS S04)
110
40
PHOSPHORUSORTHO,DISSOLVED(MG/LAS P)
0.740
0.580
CADMIUMDISSOLVED(UG/LAS CD)
<2.0
<1.0
SILVER,DISSOLVED(UG/LAS AG)
--
<1.0
TRITIUM2 SIGMAWATER,WHOLE,TOTAL(PCI/L)
180 <6.7 9.8 12 2.9
1.0
APPENDIX A 37

Boulder County Water-Quality
400414105180500 - SB00107111AADA SITE C58
WATER-QUALITY DATA
DATE
MAR 1976 02...
SEP 1996 03...
MAR
SPE- PH PH ALKA- BICAR- SPE- CIFIC WATER WATER HYDRO- LINITY ALKA- BONATE CIFIC CON- WHOLE WHOLE GEN WAT WH LINITY WATER CON- DUCT- LAB FIELD TEMPER- OXYGEN, SULFIDE TOT FET LAB WH FET DUCT- ANCE (STAND- (STAND- ATURE DIS- TOTAL FIELD (MG/L FIELD
TIME ANCE LAB ARD ARD WATER SOLVED (MG/L MG/L AS AS MG/L AS (US/CM) (US/CM) UNITS) UNITS) (DEC C) (MG/L) AS H2S) CACO3 CACO3) HCO3
1300 440 -- -- -- -- -- -- 226 -- 280
1130 336 415 6.7 7.15 14.0 0.52 0.029 154 103
HARD- HARD- NESS MAGNE- SODIUM POTAS- CHLO- NESS NONCARB CALCIUM SIUM, SODIUM, AD- SIUM, RIDE, SULFATE TOTAL WH WAT DIS- DIS- DIS- SORP- DIS- DIS- DIS-
DATE
197602...
SEP 199603...
MAR
DATE
197602...
SEP03
MAR02
SEP03
MAR02
SEP03
MAR02
SEP03
1996
DATE
1976. . .1996
DATE
1976
1996
DATE
1976
1996
(MG/LASCAC03 )
230
140
FLUO-RIDE,DISSOLVED(MG/LAS F)
0.20
0.20
SOLIDS,RESIDUEAT 180DEC. CDISSOLVED(MG/L)
275
CHROMIUM,DISSOLVED(UG/LAS CR)
1
SELENIUM,DISSOLVED(UG/LAS SE)
1
2
TOT FLDMG/L ASCACO3
2
"
SILICA,DISSOLVED(MG/LAS
SI02)
9.6
28
SOLIDS,SUM OFCONSTI -TUENTS ,
DISSOLVED(MG/L)
244
252
COBALT,DIS
SOLVED(UG/LAS CO)
<1
ZINC,DISSOLVED(UG/LAS ZN)
120
34
SOLVED(MG/LAS CA)
50
41
NITROGEN,
AMMONIADISSOLVED(MG/LAS N)
<0.015
SOLIDS,DISSOLVED(TONSPER
AC -FT)
0.33
0.37
COPPER,DISSOLVED(UG/LAS CU)
39
<1
URANIUMNATURAL
DISSOLVED(UG/LAS U)
<1.0
SOLVED(MG/LAS MG)
25
10
NITROGEN,
NITRITEDISSOLVED(MG/LAS N)
<0.010
<0.010
ALUMINUM,DIS
SOLVED(UG/LAS AL)
3
IRON,DIS
SOLVED(UG/LAS FE)
90
5
RADIUM226,DIS
SOLVED,RADONMETHOD(PCI/L)
SOLVED(MG/LAS NA)
2.7
23
NITROGEN,
NITRITEDISSOLVED(MG/L
AS NO2)
0.0
"
ANTIMONY,DIS
SOLVED(UG/LAS SB)
<1
LEAD,DIS
SOLVED(UG/LAS PB)
6
<1
GROSSALPHA,DIS
SOLVED(UG/LAS
U-NAT)
<4.0
TIONRATIO
0.1
0.8
NITROGEN, AMMONIA +ORGANICDIS.(MG/LAS N)
<0.20
ARSENICDIS
SOLVED(UG/LAS AS)
<1
<1
MANGANESE,DIS
SOLVED(UG/LAS MN)
<10
2
GROSSBETA,DISSOLVED(PCI/LAS SR/Y-90)
<1.5
SODIUMPERCENT
2
26
NITROGEN,
N02+NO3DISSOLVED(MG/LAS N)
1.70
5.10
BARIUM,DIS
SOLVED(UG/LAS BA)
200
40
MERCURYDIS
SOLVED(UG/LAS HG)
<0.5
"
GROSSBETA,DISSOLVED(PCI/LAS
CS-137)
<1.9
SOLVED(MG/LAS K)
1.2
1.1
PHOSPHATE,ORTHO,DISSOLVED(MG/L
AS PO4)
0.0
0.09
BERYLLIUM,DISSOLVED(UG/LAS BE)
<1
MOLYBDENUM,DIS
SOLVED(UG/LAS MO)
<1
<1
POTAS -SIUM 40TOTAL(PCI/L)
1.3
SOLVED(MG/LAS CD
2.4
18
PHOSPHORUS
DISSOLVED(MG/LAS P)
0.030
BROMIDEDISSOLVED(MG/LAS BR)
0.090
NICKEL,DISSOLVED(UG/LAS NI)
2
TRITIUMTOTAL(PCI/L)
69
SOLVED(MG/L
AS S04)
8.9
46
PHOSPHORUSORTHO,DISSOLVED(MG/LAS P)
<0.010
0.030
CADMIUMDISSOLVED(UG/LAS CD)
2.0
<1.0
SILVER,DIS
SOLVED(UG/LAS AG)
<1.0
TRITIUM2 SIGMAWATER,WHOLE,TOTAL(PCI/L)
4.5
38 Comparative Study of Ground-Water Quality, 1976 and 1996, and Initial Galn-and Loss Assessment of Boulder Creek, Boulder County, Colorado

Boulder County Water-Quality
400555105170000 - SB00207136AADC SITE C63
WATER-QUALITY DATA
DATE
MAR 1976 10. . .
AUG 1996 12...
MAR10
AUG12
MAR10
AUG12
MAR10
AUG12
SPE- PH PH ALKA- BICAR- SPE- CIFIC WATER WATER HYDRO- LINITY ALKA- BONATE CIFIC CON- WHOLE WHOLE GEN WAT WH LINITY WATER CON- DUCT- LAB FIELD TEMPER- OXYGEN, SULFIDE TOT FET LAB WH FET DUCT- ANCE (STAND- (STAND- ATURE DIS- TOTAL FIELD (MG/L FIELD
TIME ANCE LAB ARD ARD WATER SOLVED (MG/L MG/L AS AS MG/L AS (US/CM) (US/CM) UNITS) UNITS) (DEG C) (MG/L) AS H2S) CAC03 CAC03) HC03
1100 1530 -- -- -- -- -- -- 697 -- 850
0935 1411 1410 8.1 8.41 14.6 0.31 5.38 706 755
HARD- HARD- NESS MAGNE- SODIUM POTAS- CHLO- NESS NONCARB CALCIUM SIUM, SODIUM, AD- SIUM, RIDE, SULFATE TOTAL WH WAT DIS- DIS- DIS- SORP- DIS- DIS- DIS-
DATE
1976...1996
DATE
1976. . .1996
DATE
1976. . .1996
DATE
MAR10
AUG12
1976
1996
DATE
(MG/LAS
CAC03 )
57
11
FLUO-RIDE,DISSOLVED(MG/LAS F)
2.4
2.7
SOLIDS,RESIDUEAT 180DEG. CDISSOLVED(MG/L)
860
CHROMIUM,DISSOLVED(UG/LAS CR)
3
SELENIUM,DISSOLVED(UG/LAS SE)
TOT FLDMG/L ASCAC03
0
"
SILICA,DISSOLVED(MG/LAS
SI02)
18
8.9
SOLIDS,SUM OFCONSTI -TUENTS,
DISSOLVED(MG/L)
939
845
COBALT,DIS
SOLVED(UG/LAS CO)
<:L
ZINC,DISSOLVED(UG/LAS ZN)
SOLVED(MG/LAS CA)
15
2.9
NITROGEN,
AMMONIADISSOLVED(MG/LAS N)
0.650
SOLIDS,DISSOLVED(TONSPER
AC -FT)
1.28
1.17
COPPER,DISSOLVED(UG/LAS CU)
12
<:L
URANIUMNATURAL
DISSOLVED(UG/LAS U)
SOLVED(MG/LAS MG)
4.7
0.93
NITROGEN,
NITRITEDISSOLVED(MG/LAS N)
0.030
0.010
ALUMINUM,DIS
SOLVED(UG/LAS AL)
6
IRON,DIS
SOLVED(UG/LAS FE)
110
<3
RADIUM226,DIS
SOLVED,RADONMETHOD(PCI/L)
SOLVED(MG/LAS NA)
360
340
NITROGEN,
NITRITEDISSOLVED(MG/L
AS N02)
0.10
0.03
ANTIMONY,DIS
SOLVED(UG/LAS SB)
<:L
LEAD,DIS
SOLVED(UG/LAS PB)
4
<:L
GROSSALPHA,DIS
SOLVED(UG/LAS
U-NAT)
TIONRATIO
21
44
NITROGEN, AMMONIA +ORGANICDIS.(MG/LAS N)
0.60
ARSENICDISSOLVED(UG/LAS AS)
<1
<:L
MANGANESE,DIS
SOLVED(UG/LAS MN)
<10
<:L
GROSSBETA,DISSOLVED(PCI/LAS SR/Y-90)
SODIUMPERCENT
93
98
NITROGEN,
N02+N03DISSOLVED(MG/LAS N)
0.180
<0.050
BARIUM,DIS
SOLVED(UG/LAS BA)
200
150
MERCURYDIS
SOLVED(UG/LAS HG)
<0.5
GROSSBETA,DIS
SOLVED(PCI/LAS
CS-137)
SOLVED(MG/LAS K)
2.1
1.1
PHOSPHATE,ORTHO,DISSOLVED(MG/L
AS P04)
0.03
0.09
BERYLLIUM,DISSOLVED(UG/LAS BE)
<:L
MOLYBDENUM,DIS
SOLVED(UG/LAS MO)
27
<:L
POTAS -SIUM 40TOTAL(PCI/L)
SOLVED(MG/LAS CL)
17
13
PHOSPHORUS
DISSOLVED(MG/LAS P)
0.010
BROMIDEDISSOLVED(MG/LAS BR)
0.15
NICKEL,DISSOLVED(UG/LAS NI)
<:L
TRITIUMTOTAL(PCI/L)
SOLVED(MG/L
AS S04)
100
21
PHOSPHORUSORTHO,DISSOLVED(MG/LAS P)
0.010
0.030
CADMIUMDISSOLVED(UG/LAS CD)
<2.0
<1.0
SILVER,DIS
SOLVED(UG/LAS AG)
TRITIUM2 SIGMAWATER,WHOLE,TOTAL(PCI/L)
MAR 1976 10...
AUG 1996 12...
<20 <3.0 <3.7 15
45 3.2
APPENDIX A 39

Boulder County Water-Quality
400458105140700 - SB00107004BDAD SITE C66
WATER-QUALITY DATA
DATE
MAR 1976 20...
AUG 1996 08...
MAR20
AUG
SPE- PH PH ALKA- BICAR- SPE- CIFIC WATER WATER HYDRO- LINITY ALKA- BONATE CIFIC CON-. WHOLE WHOLE GEN WAT WH LINITY WATER CON- DUCT- LAB FIELD TEMPER- OXYGEN, SULFIDE TOT FET LAB WH FET DUCT- ANCE (STAND- (STAND- ATURE DIS- TOTAL FIELD (MG/L FIELD
TIME ANCE LAB ARD ARD WATER SOLVED (MG/L MG/L AS AS MG/L AS (US/CM) (US/CM) UNITS) UNITS) (DEG C) (MG/L) AS H2S) CAC03 CAC03) HC03
1100 2800 -- -- -- -- -- -- -- -- 340
0940 1814 2380 7.1 7.05 13.1 0.51 <0.002 240 239
HARD- HARD- NESS MAGNE- SODIUM POTAS- CHLO- NESS NONCARB CALCIUM SIUM, SODIUM, AD- SIUM, RIDE, SULFATE TOTAL WH WAT DIS- DIS- DIS- SORP- DIS- DIS- DIS-
DATE
1976...1996
08...
MAR20
AUG08
MAR20
AUG08
MAR20
AUG08
MAR20
AUG08
DATE
1976...
1996
DATE
1976...
1996
DATE
1976
1996
DATE
1976
1996
(MG/LASCAC03 )
1800
1700
FLUO-RIDE,DISSOLVED(MG/LAS F)
0.40
0.50
SOLIDS,RESIDUEAT 180DEG. CDISSOLVED(MG/L)
2400
CHROMIUM,DISSOLVED(UG/LAS CR)
3
SELENIUM,DISSOLVED(UG/LAS SE)
<1
8
TOT FLDMG/L ASCAC03
"
SILICA,DISSOLVED(MG/LAS
SI02)
9.4
11
SOLIDS,SUM OFCONSTI -TUENTS,DISSOLVED(MG/L)
2400
2230
COBALT,DIS
SOLVED(UG/LAS CO)
2
ZINC,DISSOLVED(UG/LAS ZN)
410
4
SOLVED(MG/LAS CA)
560
550
NITROGEN,
AMMONIADISSOLVED(MG/LAS N)
0.190
SOLIDS,DISSOLVED(TONSPER
AC -FT)
3.26
3.26
COPPER,DISSOLVED(UG/LAS CU)
4
6
URANIUMNATURAL
DISSOLVED(UG/LAS U)
12
SOLVED(MG/LAS MG)
100
80
NITROGEN,
NITRITEDISSOLVED(MG/LAS N)
0.010
0.010
ALUMINUM,DIS
SOLVED(UG/LAS AL)
3
IRON,DIS
SOLVED(UG/LAS FE)
2200
1200
RADIUM226,DIS
SOLVED,RADONMETHOD(PCI/L)
0.12
SOLVED(MG/LAS NA)
47
32
NITROGEN,
NITRITEDISSOLVED(MG/L
AS N02)
0.03
0.03
ANTIMONY,DIS
SOLVED(UG/LAS SB)
<1
LEAD,DIS
SOLVED(UG/LAS PB)
7
<1
GROSSALPHA,DIS
SOLVED(UG/LAS
U-NAT)
<35
TIONRATIO
0.5
0.3
NITROGEN, AMMONIA +ORGANICDIS.(MG/LAS N)
<0.20
ARSENICDISSOLVED(UG/LAS AS)
<1
<1
MANGANESE,DIS
SOLVED(UG/LAS MM)
40
42
GROSSBETA,DIS
SOLVED(PCI/LAS SR/Y-90)
10
SODIUMPERCENT
5
4
NITROGEN,
N02+N03DISSOLVED(MG/LAS N)
0.390
0.240
BARIUM,DIS
SOLVED(UG/LAS BA)
<100
7
MERCURYDISSOLVED(UG/LAS HG)
<0.5
GROSSBETA,DIS
SOLVED(PCI/LAS
CS-137)
12
SOLVED(MG/LAS K)
6.0
4.3
PHOSPHATE,ORTHO,DISSOLVED(MG/L
AS P04)
0.0
BERYLLIUM,DISSOLVED(UG/LAS BE)
<1
MOLYBDENUM,DIS
SOLVED(UG/LAS MO)
2
2
POTAS -SIUM 40TOTAL(PCI/L)
5.0
SOLVED(MG/LAS CD
2.6
3.3
PHOSPHORUS
DISSOLVED(MG/LAS P)
<0.010
BROMIDEDISSOLVED(MG/LAS BR)
0.050
NICKEL,DISSOLVED(UG/LAS NI)
18
TRITIUMTOTAL(PCI/L)
55
SOLVED(MG/L
AS S04)
1500
1400
PHOSPHORUSORTHO,DISSOLVED(MG/LAS P)
<0.010
<0.010
CADMIUMDISSOLVED(UG/LAS CD)
2.0
<1.0
SILVER,DIS
SOLVED(UG/LAS AG)
<1.0
TRITIUM2 SIGMAWATER,WHOLE,TOTAL(PCI/L)
3.8
40 Comparative Study of Ground-Water Quality, 1976 and 1996, and Initial Galn-and Loss Assessment of Boulder Creek, Boulder County, Colorado

Boulder County Water-Quality
395959105100700 - SC00107001AABD SITE C69
WATER-QUALITY DATA
SPE- PH PH ALKA- BICAR- SPE- CIFIC WATER WATER HYDRO- LINITY ALKA- BONATE CIFIC CON- WHOLE WHOLE GEN WAT WH LINITY WATER CON- DUCT- LAB FIELD TEMPER- OXYGEN, SULFIDE TOT FET LAB WH FET DUCT- ANCE (STAND- (STAND- ATURE DIS- TOTAL FIELD (MG/L FIELD
DATE TIME ANCE LAB ARD ARD WATER SOLVED (MG/L MG/L AS AS MG/L AS (US/CM) (US/CM) UNITS) UNITS) (DEG C) (MG/L) AS H2S) CAC03 CAC03) HC03
MAR 1976 23... 1600 1050 -- -- -- 14.0 -- -- 284 -- 350
AUG 1996 06... 1130 1630 1500 7.2 7.51 14.1 2.43 -- 276 298
HARD-
DATE
MAR 197623...
AUG 199606...
DATE
MAR 197623.. .
AUG 199606...
DATE
MAR 197623...
AUG 199606...
DATE
MAR 197623...
AUG 199606...
DATE
MAR 197623...
AUG 199606...
HARDNESSTOTAL(MG/LASCAC03 )
460
680
FLUO-RIDE,DISSOLVED(MG/LAS F)
0.50
0.60
SOLIDS,RESIDUEAT 180DEG. CDISSOLVED(MG/L)
1070
CHROMIUM,DISSOLVED(UG/LAS CR)
3
SELENIUM,DISSOLVED(UG/LAS SE)
15
16
NESSNONCARBWH WATTOT FLDMG/L ASCAC03
180
"
SILICA,DISSOLVED(MG/LAS
SI02)
15
15
SOLIDS,SUM OFCONSTI -TUENTS,
DISSOLVED(MG/L)
663
1010
COBALT,DIS
SOLVED(UG/LAS CO)
<1
ZINC,DISSOLVED(UG/LAS ZN)
90
4
CALCIUMDISSOLVED(MG/LAS CA)
98
140
NITROGEN,
AMMONIADISSOLVED(MG/LAS N)
0.030
SOLIDS,DISSOLVED(TONSPER
AC -FT)
0.90
1.46
COPPER,DISSOLVED(UG/LAS CU)
120
7
URANIUMNATURALDISSOLVED(UG/LAS U)
25
MAGNESIUM,DISSOLVED(MG/LAS MG)
52
79
NITROGEN,
NITRITEDISSOLVED(MG/LAS N)
0.050
0.020
ALUMINUM,DIS
SOLVED(UG/LAS AL)
10
IRON,DIS
SOLVED(UG/LAS FE)
20
<3
RADIUM226,DIS
SOLVED,RADONMETHOD(PCI/L)
<0.01
SODIUM,DISSOLVED(MG/LAS NA)
49
72
NITROGEN,
NITRITEDISSOLVED(MG/L
AS N02)
0.16
0.07
ANTIMONY,DIS
SOLVED(UG/LAS SB)
<1
LEAD,DIS
SOLVED(UG/LAS PB)
14
<1
GROSSALPHA,DIS
SOLVED(UG/LAS
U-NAT)
16
SODIUMAD
SORPTION
RATIO
1
1
NITROGEN, AMMONIA +ORGANICDIS.(MG/LAS N)
<0.20
ARSENICDIS
SOLVED(UG/LAS AS)
1
<1
MANGANESE,DIS
SOLVED(UG/LAS MN)
40
87
GROSSBETA,DIS
SOLVED(PCI/LAS SR/Y-90)
2.9
SODIUMPERCENT
19
19
NITROGEN,
N02+N03DISSOLVED(MG/LAS N)
9.50
3.60
BARIUM,DIS
SOLVED(UG/LAS BA)
<100
59
MERCURYDISSOLVED(UG/LAS HG)
<0.5
~ "
GROSSBETA,DIS
SOLVED(PCI/LAS
CS-137)
3.4
POTAS -SIUM,DISSOLVED(MG/LAS K)
2.7
2.5
PHOSPHATE,ORTHO,DISSOLVED(MG/L
AS P04)
0.0
0.18
BERYLLIUM,DISSOLVED(UG/LAS BE)
<1
MOLYBDENUM,DIS
SOLVED(UG/LAS MO)
2
1
POTAS -SIUM 40TOTAL(PCI/L)
2.4
CHLORIDE,DISSOLVED(MG/LAS CL)
33
74
PHOSPHORUS
DISSOLVED(MG/LAS P)
0.030
BROMIDEDISSOLVED(MG/LAS BR)
0.13
NICKEL,DISSOLVED(UG/LAS NI)
4
TRITIUMTOTAL(PCI/L)
SULFATEDISSOLVED(MG/L
AS S04)
200
430
PHOSPHORUSORTHO,DISSOLVED(MG/LAS P)
<0.010
0.060
CADMIUMDISSOLVED(UG/LAS CD)
3.0
<1.0
SILVER,DIS
SOLVED(UG/LAS AG)
<1.0
TRITIUM2 SIGMAWATER,WHOLE,TOTAL(PCI/L)
APPENDIX A 41

Boulder County Water-Quality
395850105102900 - SC00107012ACCC SITE C70
WATER-QUALITY DATA
DATE
MAR 1976 26...
AUG 1996 19...
MAR26
AUG19
MAR26
AUG19
SPE- PH PH ALKA- BICAR- SPE- CIFIC WATER WATER HYDRO- LINITY ALKA- BONATE CIFIC CON- WHOLE WHOLE GEN WAT WH LINITY WATER CON- DUCT- LAB FIELD TEMPER- OXYGEN, SULFIDE TOT FET LAB WH FET DUCT- ANCE (STAND- (STAND- ATURE DIS- TOTAL FIELD (MG/L FIELD
TIME ANCE LAB ARC ARC WATER SOLVED (MG/L MG/L AS AS MG/L AS (US/CM) (US/CM) UNITS) UNITS) (DEC C) (MG/L) AS H2S) CAC03 CAC03) HC03
1200 500 -- -- -- -- -- -- 224 -- 270
1050 463 460 7.6 7.71 16.9 0.36 <0.002 252 209
HARD-
DATE
1976
1996
DATE
1976...1996. . .
DATE
MAR26
AUG19
1976
1996
DATE
MAR26
AUG19
1976
1996
DATE
MAR26
AUG19
1976
1996
HARDNESSTOTAL(MG/LASCAC03 )
220
190
FLUO-RIDE,DIS
SOLVED(MG/LAS F)
0.50
0.60
SOLIDS,RESIDUEAT 180DEC. CDISSOLVED(MG/L)
273
CHROMIUM,DISSOLVED(UG/LAS CR)
4
SELENIUM,DISSOLVED(UG/LAS SE)
<1
<1
NESSNONCARBWH WATTOT FLDMG/L ASCAC03
0
SILICA,DISSOLVED(MG/LAS
SI02)
21
20
SOLIDS,SUM OFCONSTI -TUENTS,
DISSOLVED(MG/L)
302
269
COBALT,DIS
SOLVED(UG/LAS CO)
<1
ZINC,DISSOLVED(UG/LAS ZN)
20
4
CALCIUMDISSOLVED(MG/LAS CA)
54
48
NITROGEN,
AMMONIADIS
SOLVED(MG/LAS N)
0.080
SOLIDS,DISSOLVED(TONSPER
AC -FT)
0.41
0.37
COPPER,DISSOLVED(UG/LAS CU)
2
3
URANIUMNATURAL
DISSOLVED(UG/LAS U)
<1.0
MAGNESIUM,DISSOLVED(MG/LAS MG)
20
18
NITROGEN,
NITRITEDISSOLVED(MG/LAS N)
0.010
<0.010
ALUMINUM,DIS
SOLVED(UG/LAS AL)
4
IRON,DIS
SOLVED(UG/LAS FE)
30
75
RADIUM226,DIS
SOLVED,RADONMETHOD(PCI/L)
SODIUM,DISSOLVED(MG/LAS NA)
21
18
NITROGEN,
NITRITEDISSOLVED(MG/L
AS N02)
0.03
ANTIMONY,DIS
SOLVED(UG/LAS SB)
<1
LEAD,DIS
SOLVED(UG/LAS PB)
2
<1
GROSSALPHA,DIS
SOLVED(UG/LAS
U-NAT)
12
SODIUMAD
SORPTION
RATIO
0.6
0.6
NITROGEN, AMMONIA +ORGANICDIS.(MG/LAS N)
<0.20
ARSENICDIS
SOLVED(UG/LAS AS)
<1
<1
MANGANESE,DIS
SOLVED(UG/LAS MN)
110
91
GROSSBETA,DISSOLVED(PCI/LAS SR/Y-90)
2.8
SODIUMPERCENT
17
17
NITROGEN,
N02+N03DISSOLVED(MG/LAS N)
0.090
0.070
BARIUM,DIS
SOLVED(UG/LAS BA)
200
85
MERCURYDIS
SOLVED(UG/LAS HG)
<0.5
"
GROSSBETA,DIS
SOLVED(PCI/LAS
CS-137)
3.1
POT AS -SIUM,DISSOLVED(MG/LAS K)
1.6
1.3
PHOSPHATE,ORTHO,DISSOLVED(MG/L
AS P04)
0.0
0.03
BERYLLIUM,DISSOLVED(UG/LAS BE)
<1
MOLYBDENUM,DISSOLVED(UG/LAS MO)
3
1
POTAS -SIUM 40TOTAL(PCI/L)
1.1
CHLORIDE,DISSOLVED(MG/LAS CL)
3.5
3.0
PHOSPHORUS
DISSOLVED(MG/LAS P)
0.010
BROMIDEDISSOLVED(MG/LAS BR)
0.070
NICKEL,DISSOLVED(UG/LAS NI)
2
TRITIUMTOTAL(PCI/L)
<2.5
SULFATEDISSOLVED(MG/L
AS S04)
45
34
PHOSPHORUSORTHO,DISSOLVED(MG/LAS P)
<0.010
0.010
CADMIUMDISSOLVED(UG/LAS CD)
<2.0
<1.0
SILVER,DIS
SOLVED(UG/LAS AG)
<1.0
TRITIUM2 SIGMAWATER,WHOLE,TOTAL(PCI/L)
1.9
42 Comparative Study of Ground-Water Quality, 1976 and 1996, and Initial Galn-and Loss Assessment of Boulder Creek, Boulder County, Colorado

Boulder County Water-Quality
400259105160700 - SB00107018DBAD SITE C73
WATER-QUALITY DATA
DATE
MAR 1976 26...
AUG 1996 14. ..
MAR
SPE- PH PH ALKA- BICAR- SPE- CIFIC WATER WATER HYDRO- LINITY ALKA- BONATE CIFIC CON- WHOLE WHOLE GEN WAT WH LINITY WATER CON- DUCT- LAB FIELD TEMPER- OXYGEN, SULFIDE TOT FET LAB WH FET DUCT- ANCE (STAND- (STAND- ATURE DIS- TOTAL FIELD (MG/L FIELD
TIME ANCE LAB ARD ARD WATER SOLVED (MG/L MG/L AS AS MG/L AS (US/CM) (US/CM) UNITS) UNITS) (DEC C) (MG/L) AS H2S) CAC03 CAC03) HC03 (00095) (90095) (00403) (00400) (00010) (00300) (71875) (00410) (90410) (00440)
1400 779 -- -- -- -- -- -- -- -- 270
0920 872 868 7.0 7.65 13.0 1.53 -- 232 243
HARD-
DATE
197626...
AUG 199614...
MAR
DATE
197626...
AUG14
MAR26
AUG14
MAR26
AUG14
MAR26
AUG14
1996
DATE
1976
1996
DATE
1976...1996
DATE
1976. . .1996
HARDNESSTOTAL(MG/LAS
CAC03)(00900)
360
300
FLUO-RIDE,DISSOLVED(MG/LAS F)(00950)
0.30
0.40
SOLIDS,RESIDUEAT 180DEC. CDISSOLVED(MG/L)
(70300)
523
CHROMIUM,DISSOLVED(UG/LAS CR)(01030)
2
SELENIUM,DISSOLVED(UG/LAS SE)(01145)
<1
<1
NESSNONCARBWH WATTOT FLDMG/L ASCAC03(00902)
"
SILICA,DISSOLVED(MG/LAS
SI02)(00955)
15
14
SOLIDS,SUM OFCONSTI -TUENTS,
DISSOLVED(MG/L)
(70301)
476
512
COBALT,DIS
SOLVED(UG/LAS CO)(01035)
<1
ZINC,DISSOLVED(UG/LAS ZN)(01090)
50
2
CALCIUMDISSOLVED(MG/LAS CA)(00915)
99
75
NITROGEN,
AMMONIADISSOLVED(MG/LAS N)(00608)
0.070
SOLIDS,DISSOLVED(TONSPER
AC- FT)(70303)
0.65
0.71
COPPER,DISSOLVED(UG/LAS CU)(01040)
29
<1
URANIUMNATURAL
DISSOLVED(UG/LAS U)(22703)
5.0
MAGNESIUM,DIS
SOLVED(MG/LAS MG)(00925)
28
27
NITROGEN,
NITRITEDISSOLVED(MG/LAS N)(00613)
0.010
0.040
ALUMINUM,DIS
SOLVED(UG/LAS AL)(01106)
4
IRON,DIS
SOLVED(UG/LAS FE)(01046)
30
890
RADIUM226,DIS
SOLVED,RADONMETHOD(PCI/L)(09511)
0.22
--
SODIUM,DISSOLVED(MG/LAS NA)(00930)
23
68
NITROGEN,
NITRITEDISSOLVED(MG/L
AS N02)(71856)
0.03
0.13
ANTIMONY,DIS
SOLVED(UG/LAS SB)(01095)
<1
LEAD,DIS
SOLVED(UG/LAS PB)(01049)
2
<1
GROSSALPHA,DIS
SOLVED(UG/LAS
U-NAT)(80030)
21
SODIUMAD
SORPTION
RATIO
(00931)
0.5
2
NITROGEN, AMMONIA +ORGANICDIS.(MG/LAS N)(00623)
<0.20
ARSENICDISSOLVED(UG/LAS AS)(01000)
<1
<1
MANGANESE,DIS
SOLVED(UG/LAS MN)(01056)
20
44
GROSSBETA,DISSOLVED(PCI/LAS SR/Y-90)(80050)
86
--
SODIUMPERCENT(00932)
12
33
NITROGEN,
N02+N03DISSOLVED(MG/LAS N)(00631)
1.60
0.280
BARIUM,DISSOLVED(UG/LAS BA)(01005)
300
95
MERCURYDIS
SOLVED(UG/LAS HG)(71890)
<0.5
GROSSBETA,DIS
SOLVED(PCI/LAS
CS-137)(03515)
100
POTAS -SIUM,DIS
SOLVED(MG/LAS K)(00935)
4.6
3.2
PHOSPHATE,ORTHO,DISSOLVED(MG/L
AS P04)(00660)
0.03
0.03
BERYLLIUM,DISSOLVED(UG/LAS BE)(01010)
<1
MOLYBDENUM,DIS
SOLVED(UG/LAS MO)(01060)
<1
<1
POTAS -SIUM 40TOTAL(PCI/L)(75038)
3.5
CHLORIDE,DISSOLVED(MG/LAS CL)(00940)
25
83
PHOSPHORUS
DISSOLVED(MG/LAS P)(00666)
<0.010
BROMIDEDISSOLVED(MG/LAS BR)(71870)
0.29
NICKEL,DISSOLVED(UG/LAS NI)(01065)
3
TRITIUMTOTAL(PCI/L)(07000)
46
SULFATEDISSOLVED(MG/L
AS S04)(00945)
140
93
PHOSPHORUSORTHO,DISSOLVED(MG/LAS P)(00671)
0.010
0.010
CADMIUMDISSOLVED(UG/LAS CD)(01025)
<2.0
<1.0
SILVER,DIS
SOLVED(UG/LAS AG)(01075)
<1.0
TRITIUM2 SIGMAWATER,WHOLE,TOTAL(PCI/L)(75985)
3.2
APPENDIX A 43
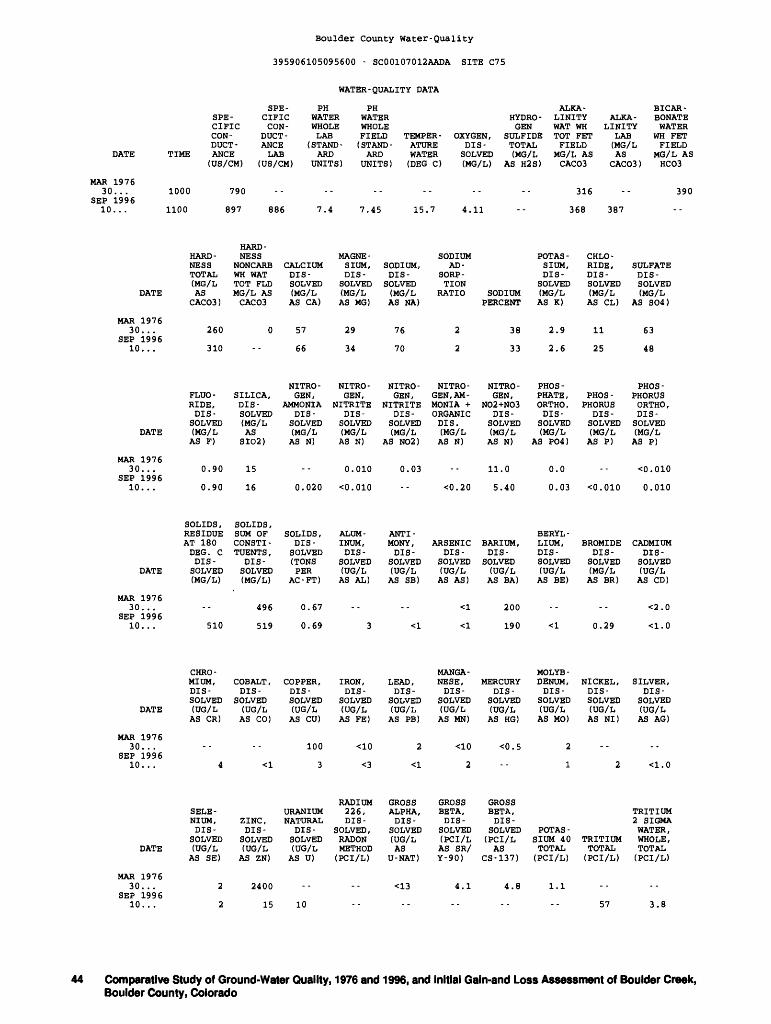
Boulder County Water-Quality
395906105095600 - SC00107012AADA SITE C75
WATER-QUALITY DATA
DATE
MAR 1976 30...
SEP 1996 10.. .
MAR30
SEP10
MAR30
SEP10
MAR30
SEP10
MAR30
SEP10
MAR30
SEP
SPE- PH PH ALKA- BICAR- SPE- CIFIC WATER WATER HYDRO- LINITY ALKA- BONATE CIFIC CON- WHOLE WHOLE GEN WAT WH LINITY WATER CON- DUCT- LAB FIELD TEMPER- OXYGEN, SULFIDE TOT FET LAB WH FET DUCT- ANCE (STAND- (STAND- ATURE DIS- TOTAL FIELD (MG/L FIELD
TIME ANCE LAB ARD ARD WATER SOLVED (MG/L MG/L AS AS MG/L AS (US/CM) (US/CM) UNITS) UNITS) (DEC C) (MG/L) AS H2S) CACO3 CACO3 ) HCO3
1000 790 -- -- -- -- -- -- 316 -- 390
1100 897 886 7.4 7.45 15.7 4.11 -- 368 387
HARD- HARD- NESS MAGNE- SODIUM POTAS- CHLO- NESS NONCARB CALCIUM SIUM, SODIUM, AD- SIUM, RIDE, SULFATE TOTAL WH WAT DIS- DIS- DIS- SORP- DIS- DIS- DIS-
DATE
1976
1996
DATE
1976
1996
DATE
1976
1996
DATE
1976
1996
DATE
1976
199610...
(MG/LASCACO3 )
260
310
FLUO-RIDE,DISSOLVED(MG/LAS F)
0.90
0.90
SOLIDS ,RESIDUEAT 180DEG. CDISSOLVED(MG/L)
510
CHROMIUM,DISSOLVED(UG/LAS CR)
4
SELENIUM,DISSOLVED(UG/LAS SE)
2
2
TOT FLDMG/L ASCACO3
0
"
SILICA,DISSOLVED(MG/LAS
SI02)
15
16
SOLIDS,SUM OFCONSTI -TUENTS,
DISSOLVED(MG/L)
496
519
COBALT,DIS
SOLVED(UG/LAS CO)
<1
ZINC,DISSOLVED(UG/LAS ZN)
2400
15
SOLVED(MG/LAS CA)
57
66
NITROGEN,
AMMONIADISSOLVED(MG/LAS N)
0.020
SOLIDS ,DISSOLVED(TONSPER
AC -FT)
0.67
0.69
COPPER,DISSOLVED(UG/LAS CU)
100
3
URANIUMNATURAL
DISSOLVED(UG/LAS U)
10
SOLVED(MG/LAS MG)
29
34
NITROGEN,
NITRITEDISSOLVED(MG/LAS N)
0.010
<0.010
ALUMINUM,DIS
SOLVED(UG/LAS AL)
3
IRON,DIS
SOLVED(UG/LAS FE)
<10
<3
RADIUM226,DIS
SOLVED,RADONMETHOD(PCI/L)
SOLVED(MG/LAS NA)
76
70
NITROGEN,
NITRITEDISSOLVED(MG/L
AS NO2)
0.03
- -
ANTIMONY,DIS
SOLVED(UG/LAS SB)
<1
LEAD,DIS
SOLVED(UG/LAS PB)
2
<1
GROSSALPHA,DISSOLVED(UG/LAS
U-NAT)
<13
TIONRATIO
2
2
NITROGEN, AMMONIA +ORGANICDIS.(MG/LAS N)
<0.20
ARSENICDIS
SOLVED(UG/LAS AS)
<1
<1
MANGANESE,DIS
SOLVED(UG/LAS MN)
<10
2
GROSSBETA,DISSOLVED(PCI/LAS SR/Y-90)
4.1
SODIUMPERCENT
38
33
NITROGEN,
NO2+NO3DISSOLVED(MG/LAS N)
11.0
5.40
BARIUM,DISSOLVED(UG/LAS BA)
200
190
MERCURYDIS
SOLVED(UG/LAS HG)
<0.5
"
GROSSBETA,DISSOLVED(PCI/LAS
CS-137)
4.8
SOLVED(MG/LAS K)
2.9
2.6
PHOSPHATE,ORTHO,DISSOLVED(MG/L
AS PO4)
0.0
0.03
BERYLLIUM,DISSOLVED(UG/LAS BE)
<1
MOLYBDENUM,DIS
SOLVED(UG/LAS MO)
2
1
POTAS -SIUM 40TOTAL(PCI/L)
1.1
SOLVED(MG/LAS CD
11
25
PHOSPHORUS
DISSOLVED(MG/LAS P)
<0.010
BROMIDEDISSOLVED(MG/LAS BR)
0.29
NICKEL,DISSOLVED(UG/LAS NI)
2
TRITIUMTOTAL(PCI/L)
57
SOLVED(MG/L
AS SO4)
63
48
PHOSPHORUSORTHO,DISSOLVED(MG/LAS P)
<0.010
0.010
CADMIUMDISSOLVED(UG/LAS CD)
<2.0
<1.0
SILVER,DISSOLVED(UG/LAS AG)
<1.0
TRITIUM2 SIGMAWATER,WHOLE,TOTAL(PCI/L)
3.8
44 Comparative Study of Ground-Water Quality, 1976 and 1996, and Initial Gain-and Loss Assessment of Bouider Creek, Boulder County, Colorado

Boulder County Water-Quality
400313105075000 - SB00106916BCBC SITE C77
WATER-QUALITY DATA
SPE- PH PH ALKA- BICAR- SPE- CIFIC WATER WATER HYDRO- LINITY ALKA- BONATE CIFIC CON- WHOLE WHOLE GEN WAT WH LINITY WATER CON- DUCT- LAB FIELD TEMPER- OXYGEN, SULFIDE TOT FET LAB WH FET DUCT- ANCE (STAND- (STAND- ATURE DIS- TOTAL FIELD (MG/L FIELD
DATE TIME ANCE LAB ARD ARD WATER SOLVED (MG/L MG/L AS AS MG/L AS (US/CM) (US/CM) UNITS) UNITS) (DEG C) (MG/L) AS H2S) CAC03 CAC03) HC03
APR 1976 26... 0830 460 -- -- -- -- -- -- -- -- 230
AUG 1996 07... 1115 380 381 7.3 7.64 17.5 1.47 -- 94 108
HARD-
HARD- NESS MAGNE- SODIUM POTAS- CHLO- NESS NONCARB CALCIUM SIUM, SODIUM, AD- SIUM, RIDE, SULFATE TOTAL WH WAT DIS- DIS- DIS- SORP- DIS- DIS- DIS-
DATE
APR 197626...
AUG 199607...
DATE
APR 197626...
AUG 199607...
DATE
APR 197626...
AUG 199607...
DATE
APR 197626...
AUG 199607...
DATE
(MG/LAS
CAC03 )
36
130
FLUO-RIDE,DIS
SOLVED(MG/LAS F)
0.50
0.70
SOLIDS,RESIDUEAT 180DEG. CDIS
SOLVED(MG/L)
220
CHROMIUM,DIS
SOLVED(UG/LAS CR)
2
SELENIUM,DIS
SOLVED(UG/LAS SE)
TOT FLDMG/L ASCAC03
SILICA,DIS
SOLVED(MG/LAS
SI02)
10
9.2
SOLIDS,SUM OFCONSTI -TUENTS ,
DIS
SOLVED(MG/L)
348
209
COBALT,DIS
SOLVED(UG/LAS CO)
<1
ZINC,DIS
SOLVED(UG/LAS ZN)
SOLVED(MG/LAS CA)
5.1
36
NITROGEN,
AMMONIADIS
SOLVED(MG/LAS N)
0.040
SOLIDS,DIS
SOLVED(TONSPER
AC -FT)
0.47
0.30
COPPER,DIS
SOLVED(UG/LAS CU)
7
3
URANIUMNATURAL
DIS
SOLVED(UG/LAS U)
SOLVED(MG/LAS MG)
5.6
8.6
NITROGEN,
NITRITEDIS
SOLVED(MG/LAS N)
<0.010
<0.010
ALUMINUM,DIS
SOLVED(UG/LAS AL)
4
IRON,DIS
SOLVED(UG/LAS FE)
<10
<3
RADIUM226,DIS
SOLVED,RADONMETHOD(PCI/L)
SOLVED(MG/LAS NA)
120
15
NITROGEN,
NITRITEDIS
SOLVED(MG/L
AS N02)
0.0
ANTIMONY,DIS
SOLVED(UG/LAS SB)
<:L
LEAD,DIS
SOLVED(UG/LAS PB)
4
<:L
GROSSALPHA,DIS
SOLVED(UG/LAS
U-NAT)
TIONRATIO
9
0.6
NITROGEN, AMMONIA +ORGANICDIS.(MG/LAS N)
<0.20
ARSENICDIS
SOLVED(UG/LAS AS)
<1
<:L
MANGANESE,DIS
SOLVED(UG/LAS MN)
<10
<1
GROSSBETA,DIS
SOLVED(PCI/LAS SR/Y-90)
SODIUMPERCENT
87
19
NITROGEN,
N02+N03DIS
SOLVED(MG/LAS N)
1.00
1.20
BARIUM,DIS
SOLVED(UG/LAS BA)
<100
44
MERCURYDIS
SOLVED(UG/LAS HG)
<0.5
- -
GROSSBETA,DIS
SOLVED(PCI/LAS
CS-137)
SOLVED(MG/LAS K)
2.1
8.3
PHOSPHATE,ORTHO,DIS
SOLVED(MG/L
AS P04)
0.09
0.31
BERYLLIUM,DIS
SOLVED(UG/LAS BE)
<X
MOLYBDENUM,DIS
SOLVED(UG/LAS MO)
2
6
POTAS -SIUM 40TOTAL(PCI/L)
SOLVED(MG/LAS CL)
9.6
17
PHOSPHORUS
DIS
SOLVED(MG/LAS P)
0.090
BROMIDEDIS
SOLVED(MG/LAS BR)
4.4
NICKEL,DIS
SOLVED(UG/LAS NI)
1
TRITIUMTOTAL(PCI/L)
SOLVED(MG/L
AS S04)
79
39
PHOSPHORUSORTHO,DIS
SOLVED(MG/LAS P)
0.030
0.100
CADMIUMDIS
SOLVED(UG/LAS CD)
2.0
<1.0
SILVER,DIS
SOLVED(UG/LAS AG)
<1.0
TRITIUM2 SIGMAWATER,WHOLE,TOTAL(PCI/L)
APR 1976 26...
AUG 1996 07...
ND 0.03 32 8.5 10 1.9
1.0
APPENDIX A 45

Boulder County Water-Quality
395559105164300 - SC00107125DACAU SITE C79
WATER-QUALITY DATA
DATE
APR 1976 26...
AUG 1996 15...
APR 1976 26...
AUG 1996 15. . .
APR 1976 26...
AUG 1996 15. ..
DATE
APR 1976 26...
AUG 1996 15...
DATE
APR 1976 26...
AUG 1996 15.. .
DATE
APR 1976 26...
AUG 1996 15. . .
SPE- PH PH ALKA- BICAR- SPE- CIFIC WATER WATER HYDRO- LINITY ALKA- BONATE CIFIC CON- WHOLE WHOLE GEN WAT WH LINITY WATER CON- DUCT- LAB FIELD TEMPER- OXYGEN, SULFIDE TOT FET LAB WH FET DUCT- ANCE (STAND- (STAND- ATURE DIS- TOTAL FIELD (MG/L FIELD
TIME ANCE LAB ARD ARD WATER SOLVED (MG/L MG/L AS AS MG/L AS (US/CM) (US/CM) UNITS) UNITS) (DEG C) (MG/L) AS H2S) CAC03 CAC03 ) HC03
1300 130 -- -- -- 25.0 -- -- 34 -- 41
1330
HARD NESS TOTAL (MG/L AS CAC03 )
40
36
FLUO- RIDE, DIS SOLVED (MG/L AS F)
0.30
0.30
SOLIDS, RESIDUE AT 180 DEG. C DIS SOLVED (MG/L)
--
90
CHRO MIUM, DIS SOLVED (UG/L AS CR)
--
<1
SELE NIUM, DIS SOLVED (UG/L AS SE)
1
1
137 136 6.
HARD NESS
NONCARB WH WAT TOT FLD MG/L AS CAC03
6
--
SILICA, DIS SOLVED (MG/L AS
SI02)
15
16
SOLIDS, SUM OF CONSTI - TUENTS,
DIS SOLVED (MG/L)
83
89
COBALT, DIS
SOLVED (UG/L AS CO)
--
<1
ZINC, DIS SOLVED (UG/L AS ZN)
<20
2
CALCIUM DIS SOLVED (MG/L AS CA)
11
10
NITRO GEN,
AMMONIA DIS SOLVED (MG/L AS N)
--
0.020
SOLIDS, DIS SOLVED (TONS PER
AC -FT)
0.11
0.12
COPPER, DIS SOLVED (UG/L AS CU)
5
1
URANIUM NATURAL
DIS SOLVED (UG/L AS U)
--
<1.0
.9 7.2 23.4 6.
MAGNE SIUM, DIS SOLVED (MG/L AS MG)
2.9
2.7
NITRO GEN,
NITRITE DIS SOLVED (MG/L AS N)
<0.010
0.010
ALUM INUM, DIS
SOLVED (UG/L AS AL)
--
5
IRON, DIS
SOLVED (UG/L AS FE)
40
<3
RADIUM 226, DIS
SOLVED, RADON METHOD (PCI/L)
--
SODIUM, DIS SOLVED (MG/L AS NA)
7.1
9.5
NITRO GEN,
NITRITE DIS SOLVED (MG/L
AS N02)
0.0
0.03
ANTI MONY, DIS
SOLVED (UG/L AS SB)
--
<1
LEAD, DIS
SOLVED (UG/L AS PB)
9
<1
GROSS ALPHA, DIS
SOLVED (UG/L AS
U-NAT)
4.7
SODIUM AD
SORP TION
RATIO
0.5
0.7
NITRO GEN, AM MONIA + ORGANIC DIS. (MG/L AS N)
--
<0.20
ARSENIC DIS SOLVED (UG/L AS AS)
6
5
MANGA NESE, DIS
SOLVED (UG/L AS MN)
<10
<1
GROSS BETA, DIS SOLVED (PCI/L AS SR/ Y-90)
3.6
01
SODIUM PERCENT
26
34
NITRO GEN,
N02+N03 DIS SOLVED (MG/L AS N)
0.830
0.760
BARIUM, DIS SOLVED (UG/L AS BA)
200
170
MERCURY DIS
SOLVED (UG/L AS HG)
<0.5
--
GROSS BETA, DIS
SOLVED (PCI/L AS
CS-137)
4.3
--
37 36
POTAS SIUM, DIS SOLVED (MG/L AS K)
3.1
2.9
PHOS PHATE, ORTHO, DIS SOLVED (MG/L
AS P04)
0.18
0.28
BERYL LIUM, DIS SOLVED (UG/L AS BE)
--
<1
MOLYB DENUM, DIS SOLVED (UG/L AS MO)
<1
2
POTAS SIUM 40 TOTAL (PCI/L)
1.2
--
CHLO RIDE, DIS SOLVED (MG/L AS CL)
0.80
1.1
PHOS PHORUS DIS SOLVED (MG/L AS P)
--
0.060
BROMIDE DIS SOLVED (MG/L AS BR)
--
0.020
NICKEL, DIS SOLVED (UG/L AS NI)
--
<1
TRITIUM TOTAL (PCI/L)
--
5.4
SULFATE DIS SOLVED (MG/L
AS S04)
19
21
PHOS PHORUS ORTHO, DIS SOLVED (MG/L AS P)
0.060
0.090
CADMIUM DIS SOLVED (UG/L AS CD)
2.0
<1.0
SILVER, DIS
SOLVED (UG/L AS AG)
--
<1.0
TRITIUM 2 SI6MA WATER, WHOLE, TOTAL (PCI/L)
--
1.9
46 Comparative Study of Ground-Water Quality, 1976 and 1996, and initial Gain-and Loss Assessment of Bouider Creek, Boulder County, Colorado

Boulder County Water-Quality
400345105184500 - SB00107111CADB SITE C86
WATER-QUALITY DATA
DATE
NOV 1976 20...
AUG 1996 22...
NOV 1976 20...
AUG 1996 22...
DATE
NOV 1976 20...
AUG 1996 22...
DATE
NOV 1976 20...
AUG 1996 22...
DATE
NOV 1976 20...
AUG 1996 22...
DATE
NOV 1976 20...
AUG 1996 22...
SPE- PH PH ALKA- BICAR- SPE- CIFIC WATER WATER HYDRO- LINITY ALKA- BONATE CIFIC CON- WHOLE WHOLE GEN WAT WH LINITY WATER CON- DUCT- LAB FIELD TEMPER- OXYGEN, SULFIDE TOT FET LAB WH FET DUCT- ANCE (STAND- (STAND- ATURE DIS- TOTAL FIELD (MG/L FIELD
4E ANCE LAB ARD ARD WATER SOLVED (MG/L MG/L AS AS MG/L AS (US/CM) (US/CM) UNITS) UNITS) (DEG C) (MG/L) AS H2S) CAC03 CAC03) HC03
30 1290 -- -- -- 12.0 -- -- -- -- 480
10 1497 1460 7.
HARD NESS TOTAL (MG/L AS
CAC03 )
190
230
FLUO- RIDE, DIS SOLVED (MG/L AS F)
3.5
4.0
SOLIDS, RESIDUE AT 180 DEG. C DIS SOLVED (MG/L)
--
904
CHRO MIUM, DIS SOLVED (UG/L AS CR)
--
10
SELE NIUM, DIS SOLVED (UG/L AS SE)
<1
<1
HARD NESS
NONCARB WH WAT TOT FLD MG/L AS CAC03
--
--
SILICA, DIS SOLVED (MG/L AS
SI02)
19
19
SOLIDS, SUM OF CONST I - TUENTS,
DIS SOLVED (MG/L)
789
860
COBALT, DIS
SOLVED (UG/L AS CO)
--
<1
ZINC, DIS SOLVED (UG/L AS ZN)
80
8
CALCIUM DIS SOLVED (MG/L AS CA)
50
52
NITRO GEN,
AMMONIA DIS SOLVED (MG/L AS N)
--
0.020
SOLIDS, DIS SOLVED (TONS PER
AC-FT)
1.07
1.23
COPPER, DIS SOLVED (UG/L AS CU)
28
8
URANIUM NATURAL DIS SOLVED (UG/L AS U)
--
11
,1 6.95 12.7 4.71
MAGNE SIUM, DIS SOLVED (MG/L AS MG)
17
25
NITRO GEN,
NITRITE DIS SOLVED (MG/L AS N)
0.010
<0.010
ALUM INUM, DIS
SOLVED (UG/L AS AL)
--
5
IRON, DIS
SOLVED (UG/L AS FE)
500
430
RADIUM 226, DIS
SOLVED, RADON METHOD (PCI/L)
--
--
SODIUM, DIS SOLVED (MG/L AS NA)
210
210
NITRO GEN,
NITRITE DIS SOLVED (MG/L
AS N02)
0.03
--
ANTI MONY, DIS
SOLVED (UG/L AS SB)
--
<1
LEAD, DIS
SOLVED (UG/L AS PB)
6
<1
GROSS ALPHA, DIS
SOLVED (UG/L AS
U-NAT)
--
--
SODIUM AD
SORP TION
RATIO
7
6
NITRO GEN, AM MONIA + ORGANIC DIS. (MG/L AS N)
--
<0.20
ARSENIC DIS
SOLVED (UG/L AS AS)
32
30
MANGA NESE, DIS SOLVED (UG/L AS MN)
160
170
GROSS BETA, DIS SOLVED (PCI/L AS SR/ Y-90)
--
SODIUM PERCENT
68
64
NITRO GEN,
N02+N03 DIS SOLVED (MG/L AS N)
1.70
0.230
BARIUM, DIS
SOLVED (UG/L AS BA)
<100
23
MERCURY DIS
SOLVED (UG/L AS HG)
<0.5
--
GROSS BETA, DIS
SOLVED (PCI/L AS
CS-137)
--
394 406
POTAS - SIUM, DIS SOLVED (MG/L AS K)
15
15
PHOS PHATE, ORTHO, DIS SOLVED (MG/L
AS P04)
0.06
--
BERYL LIUM, DIS SOLVED (UG/L AS BE)
--
<1
MOLYB - DENUM, DIS
SOLVED (UG/L AS MO)
--
7
POTAS SIUM 40 TOTAL (PCI/L)
10
CHLO RIDE, DIS SOLVED (MG/L AS CL)
42
150
PHOS PHORUS DIS SOLVED (MG/L AS P)
--
<0.010
BROMIDE DIS SOLVED (MG/L AS BR)
--
0.24
NICKEL, DIS SOLVED (UG/L AS NI)
--
3
TRITIUM TOTAL (PCI/L)
--
66
SULFATE DIS SOLVED (MG/L
AS S04)
190
140
PHOS PHORUS ORTHO, DIS SOLVED (MG/L AS P)
0.020
<0.010
CADMIUM DIS SOLVED (UG/L AS CD)
<2.0
<1.0
SILVER, DIS
SOLVED (UG/L AS AG)
--
<1.0
TRITIUM 2 SIGMA WATER, WHOLE, TOTAL (PCI/L)
--
4.5
APPENDIX A 47

Boulder County Water-Quality
395712105135800 - SC00107021BDAB SITE C89
WATER-QUALITY DATA
DATE
JUL 1976 21. . .
SEP 1996 03.. .
JUL21
SEP03
JUL21
SEP03
JUL21
SEP03
JUL21
SEP03
JUL21
SEP03
SPE- PH PH ALKA- BICAR- SPE- CIFIC WATER WATER HYDRO- LINITY ALKA- BONATE CIFIC CON- WHOLE WHOLE GEN WAT WH LINITY WATER CON- DUCT- LAB FIELD TEMPER- OXYGEN, SULFIDE TOT FET LAB WH FET DUCT- ANCE (STAND- (STAND- ATURE DIS- TOTAL FIELD (MG/L FIELD
TIME ANCE LAB ARD ARD WATER SOLVED (MG/L MG/L AS AS MG/L AS (US/CM) (US/CM) UNITS) UNITS) (DEC C) (MG/L) AS H2S) CAC03 CAC03) HC03
0900 690 -- -- -- -- -- -- 246 -- 300
1330 387 316 6.9 6.54 17.1 6.13 -- 148 139
HARD- HARD- NESS MAGNE- SODIUM POTAS- CHLO- NESS NONCARB CALCIUM SIUM, SODIUM, AD- SIUM, RIDE, SULFATE TOTAL WH WAT DIS- DIS- DIS- SORP- DIS- DIS- DIS-
DATE
1976. . .1996
DATE
1976. . .1996
DATE
1976
1996
DATE
1976. . .1996
DATE
1976
1996
(MG/LAS
CAC03 )
300
150
FLUO-RIDE,DISSOLVED(MG/LAS F)
0.30
0.20
SOLIDS,RESIDUEAT 180DEC. CDISSOLVED(MG/L)
178
CHROMIUM,DISSOLVED(UG/LAS CR)
2
SELENIUM,DISSOLVED(UG/LAS SE)
4
<1
TOT FLDMG/L ASCAC03
57
"
SILICA,DISSOLVED(MG/LAS
SI02)
26
14
SOLIDS,SUM OFCONSTI -TUENTS,
DISSOLVED(MG/L)
457
179
COBALT,DIS
SOLVED(UG/LAS CO)
<1
ZINC,DISSOLVED(UG/LAS ZN)
30
32
SOLVED(MG/LAS CA)
85
35
NITROGEN,
AMMONIADISSOLVED(MG/LAS N)
0.060
SOLIDS,DISSOLVED(TONSPER
AC- FT)
0.62
0.24
COPPER,DISSOLVED(UG/LAS CU)
13
<1
URANIUMNATURAL
DISSOLVED(UG/LAS U)
<1.0
SOLVED(MG/LAS MG)
22
15
NITROGEN,
NITRITEDISSOLVED(MG/LAS N)
<0.010
0.010
ALUMINUM,DIS
SOLVED(UG/LAS AL)
3
IRON,DIS
SOLVED(UG/LAS FE)
40
5400
RADIUM226,DIS
SOLVED,RADONMETHOD(PCI/L)
SOLVED(MG/LAS NA)
41
4.2
NITROGEN,
NITRITEDISSOLVED(MG/L
AS N02)
0.0
0.03
ANTIMONY,DIS
SOLVED(UG/LAS SB)
<1
LEAD,DIS
SOLVED(UG/LAS PB)
2
<1
GROSSALPHA,DIS
SOLVED(UG/LAS
U-NAT)
3.6
TIONRATIO
1
0.1
NITROGEN, AMMONIA +ORGANICDIS.(MG/LAS N)
<0.20
ARSENICDIS
SOLVED(UG/LAS AS)
1
2
MANGANESE,DIS
SOLVED(UG/LAS MN)
<10
250
GROSSBETA,DISSOLVED(PCI/LAS SR/Y-90)
<12
SODIUMPERCENT
23
6
NITROGEN,
N02+N03DISSOLVED(MG/LAS N)
11.0
0.080
BARIUM,DISSOLVED(UG/LAS BA)
<100
280
MERCURYDIS
SOLVED(UG/LAS HG)
<0.5
GROSSBETA,DIS
SOLVED(PCI/LAS
CS-137)
4.3
SOLVED(MG/LAS K)
2.2
0.70
PHOSPHATE,ORTHO,DISSOLVED(MG/L
AS P04)
0.12
0.03
BERYLLIUM,DISSOLVED(UG/LAS BE)
<1
MOLYBDENUM,DIS
SOLVED(UG/LAS MO)
1
<1
POTAS -SIUM 40TOTAL(PCI/L)
1.6
SOLVED(MG/LAS CD
38
8.4
PHOSPHORUS
DISSOLVED(MG/LAS P)
<0.010
BROMIDEDISSOLVED(MG/LAS BR)
0.060
NICKEL,DISSOLVED(UG/LAS NI)
1
TRITIUMTOTAL(PCI/L)
86
SOLVED(MG/L
AS S04)
46
12
PHOSPHORUSORTHO,DISSOLVED(MG/LAS P)
0.040
0.010
CADMIUMDISSOLVED(UG/LAS CD)
2.0
<1.0
SILVER,DIS
SOLVED(UG/LAS AG)
<1.0
TRITIUM2 SIGMAWATER,WHOLE,TOTAL(PCI/L)
5.8
48 Comparative Study of Ground-Water Quality, 1976 and 1996, and Initial Gain-and Loss Assessment of Boulder Creek, Boulder County, Colorado
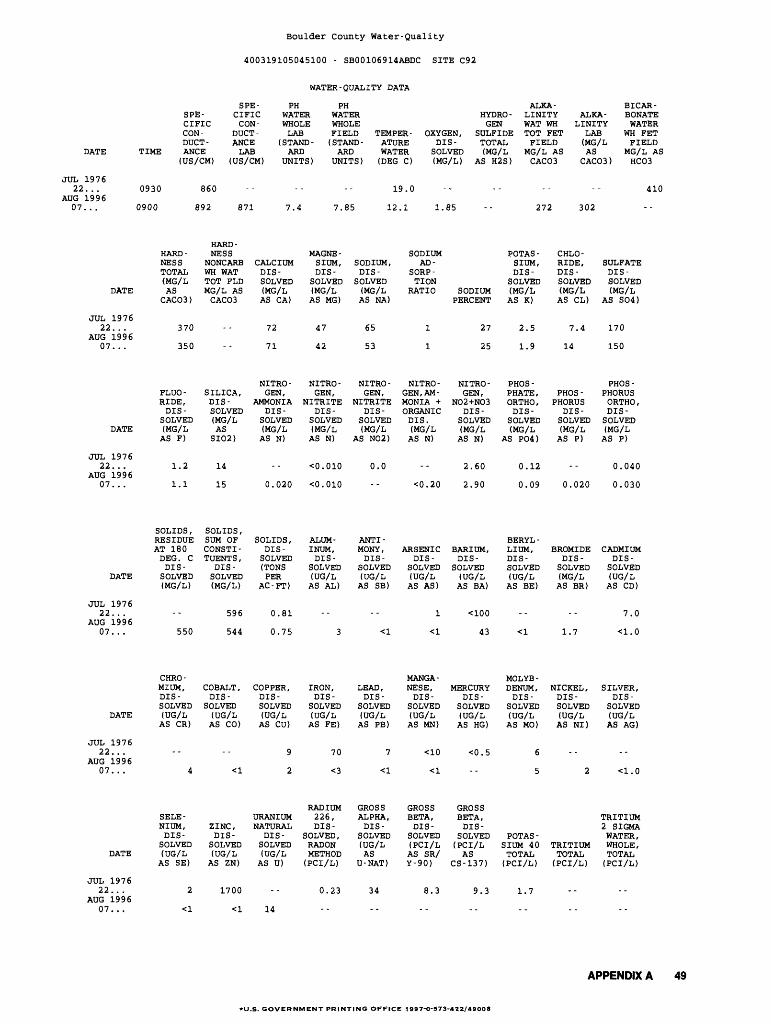
Boulder County Water-Quality
400319105045100 - SB00106914ABDC SITE C92
WATER-QUALITY DATA
DATE
JUL 1976 22...
AUG 1996 07.. .
JUL22
AUG07
JUL22
AUG07
SPE- PH PH ALKA- BICAR- SPE- CIFIC WATER WATER HYDRO- LINITY ALKA- BONATE CIFIC CON- WHOLE WHOLE GEN WAT WH LINITY WATER CON- DUCT- LAB FIELD TEMPER- OXYGEN, SULFIDE TOT FET LAB WH FET DUCT- ANCE (STAND- (STAND- ATURE DIS- TOTAL FIELD (MG/L FIELD
TIME ANCE LAB ARD ARD WATER SOLVED (MG/L MG/L AS AS MG/L AS (US/CM) (US/CM) UNITS) UNITS) (DEC C) (MG/L) AS H2S) CAC03 CAC03) HC03
0930 860 -- -- -- 19.0 -- -- -- -- 410
0900 892 871 7.4 7.85 12.1 1.85 -- 272 302
HARD- HARD- NESS MAGNE- SODIUM POTAS- CHLO- NESS NONCARB CALCIUM SIUM, SODIUM, AD- SIUM, RIDE, SULFATE TOTAL WH WAT DIS- DIS- DIS- SORP- DIS- DIS- DIS-
DATE
1976
1996
DATE
1976
1996
DATE
JUL22
AUG07
1976
1996
DATE
JUL22
AUG07
1976
1996
DATE
(MG/LASCAC03 )
370
350
FLUO-RIDE,DISSOLVED(MG/LAS F)
1.2
1.1
SOLIDS,RESIDUEAT 180DEC. CDISSOLVED(MG/L)
550
CHROMIUM,DISSOLVED(UG/LAS CR)
4
SELENIUM,DISSOLVED(UG/LAS SE)
TOT FLDMG/L ASCAC03
"
SILICA,DISSOLVED(MG/LAS
SI02)
14
15
SOLIDS,SUM OFCONSTITUENTS,
DISSOLVED(MG/L)
596
544
COBALT,DIS
SOLVED(UG/LAS CO)
<l
ZINC,DISSOLVED(UG/LAS ZN)
SOLVED(MG/LAS CA)
72
71
NITROGEN,
AMMONIADISSOLVED(MG/LAS N)
0.020
SOLIDS,DISSOLVED(TONSPER
AC-FT)
0.81
0.75
COPPER,DISSOLVED(UG/LAS CU)
9
2
URANIUMNATURAL
DISSOLVED(UG/LAS U)
SOLVED(MG/LAS MG)
47
42
NITROGEN,
NITRITEDISSOLVED(MG/LAS N)
<0.010
<0.010
ALUMINUM,DIS
SOLVED(UG/LAS AL)
3
IRON,DISSOLVED(UG/LAS FE)
70
<3
RADIUM226,DIS
SOLVED,RADONMETHOD(PCI/L)
SOLVED(MG/LAS NA)
65
53
NITRO -GEN,
NITRITEDISSOLVED(MG/L
AS N02)
0.0
ANTIMONY,DIS
SOLVED(UG/LAS SB)
<:L
LEAD,DIS
SOLVED(UG/LAS PB)
7
<l
GROSSALPHA,DIS
SOLVED(UG/LAS
U-NAT)
TIONRATIO
1
1
NITROGEN, AMMONIA +ORGANICDIS.(MG/LAS N)
<0.20
ARSENICDIS
SOLVED(UG/LAS AS)
1
<l
MANGANESE,DIS
SOLVED(UG/LAS MN)
<10
<l
GROSSBETA,DISSOLVED(PCI/LAS SR/Y-90)
SODIUMPERCENT
27
25
NITROGEN,
N02+N03DISSOLVED(MG/LAS N)
2.60
2.90
BARIUM,DIS
SOLVED(UG/LAS BA)
<100
43
MERCURYDISSOLVED(UG/LAS HG)
<0.5
" "
GROSSBETA,DISSOLVED(PCI/LAS
CS-137)
SOLVED(MG/LAS K)
2.5
1.9
PHOSPHATE,ORTHO,DISSOLVED(MG/L
AS P04)
0.12
0.09
BERYLLIUM,DISSOLVED(UG/LAS BE)
<l
MOLYBDENUM,DIS
SOLVED(UG/LAS MO)
6
5
POTAS -SIUM 40TOTAL(PCI/L)
SOLVED(MG/LAS CD
7.4
14
PHOSPHORUS
DISSOLVED(MG/LAS P)
0.020
BROMIDEDISSOLVED(MG/LAS BR)
1.7
NICKEL,DISSOLVED(UG/LAS NI)
2
TRITIUMTOTAL(PCI/L)
SOLVED(MG/L
AS S04)
170
150
PHOSPHORUSORTHO ,DISSOLVED(MG/LAS P)
0.040
0.030
CADMIUMDISSOLVED(UG/LAS CD)
7.0
<1.0
SILVER,DISSOLVED(UG/LAS AG)
<1.0
TRITIUM2 SIGMAWATER,WHOLE,TOTAL(PCI/L)
JUL 1976 22.. .
AUG 1996 07...
1700 0.23 34 8.3 9.3 1.7
14
U.S. GOVERNMENT PRINTING OFFICE 1997-0-573-422/49008
APPENDIX A 49