comparative study of load and resistance factor design vs
TRANSCRIPT

Missouri University of Science and Technology Missouri University of Science and Technology
Scholars' Mine Scholars' Mine
International Specialty Conference on Cold-Formed Steel Structures
(1984) - 7th International Specialty Conference on Cold-Formed Steel Structures
Nov 13th, 12:00 AM
Comparative Study of Load and Resistance Factor Design vs. Comparative Study of Load and Resistance Factor Design vs.
Allowable Stress Design Allowable Stress Design
Brian K. Snyder
Lan-Cheng Pan
Wei-wen Yu Missouri University of Science and Technology, [email protected]
Follow this and additional works at: https://scholarsmine.mst.edu/isccss
Part of the Structural Engineering Commons
Recommended Citation Recommended Citation Snyder, Brian K.; Pan, Lan-Cheng; and Yu, Wei-wen, "Comparative Study of Load and Resistance Factor Design vs. Allowable Stress Design" (1984). International Specialty Conference on Cold-Formed Steel Structures. 3. https://scholarsmine.mst.edu/isccss/7iccfss/7iccfss-session10/3
This Article - Conference proceedings is brought to you for free and open access by Scholars' Mine. It has been accepted for inclusion in International Specialty Conference on Cold-Formed Steel Structures by an authorized administrator of Scholars' Mine. This work is protected by U. S. Copyright Law. Unauthorized use including reproduction for redistribution requires the permission of the copyright holder. For more information, please contact [email protected].

Seventh International Specialty Conference on Cold-Formed Steel Structures St. Louis, Missouri, U.S.A., November 13-14, 1984
COMPARATIVE STUDY OF LOAD AND RESISTANCE FACTOR
DESIGN VERSUS AlLOWABLE STRESS DESIGN
by
Brian K. Snyderl , Lan-Cheng Pan2
and Wei-Wen Yu3
INTRODUCTION
The 1980 Edition of the American Iron and Steel Institute (AISI) Specification for the Design of Cold-Formed Steel Structural Members (Ref. 1) provides design formulas for determining allowable stresses or allowable loads for structural members and connections. In allowable stress design, the actual stresses are computed from service loads that include dead, live, snow, wind, and/or earthquake loads. The allowable stresses or allowable loads are based on appropriate factors of safety recommended by AISI for different types of structural members.
Recently, the proposed load and resistance factor design (LRFD) criteria for hot-rolled steel members and connections (Ref. 2) have been developed using probabilistic and statistical techniques to account for the uncertainties in design, fabrication, material properties, and applied loads. For cold-formed steel structural members, the load and resistance factor design method has been studied under a joint research project entitled "Load and Resistance Factor Design of Cold-Formed Steel" conducted at the University of Missouri-Rolla and Washington University (Refs. 3-10). Subsequently, the tentative recommendation on the LRFD criteria were recommended in Ref. 9. In this method, load factors are applied to the external load and resistance factors are applied to the internal resistance capacities of the structure.
lStructural Engineer, Burns & McDonnell, Kansas City, Missouri; formerly Research Assistant, Department of Civil Engineering, University of Missouri-Rolla, Rolla, Missouri.
2 Research Assistant. Department of Civil Engineering, University of Missouri-Rolla, Rolla, Missouri.
3 Curators' Professor, Department of Civil Engineering, University of Missouri-Rolla, Rolla, Missouri.
543

544 SEVENTH SPECIALTY CONFERENCE
The primary purpose of this investigation was to study and compare the proposed tentative recommendations on the load and resistance factor design criteria for cold-formed steel (Ref. 9) with the existing allowable stress design (ASD) criteria which are included in the 1980 Edition of the AISI Specification for the Design of Cold-Formed Steel Structural Members (Ref. 1).
LOAD AND RESISTANCE FACTOR DESIGN
The proposed recommendations on the load and resistance factor design criteria for cold-·formed steel (Ref. 9) are based on the first-order principles of probabilistic theory. The general format for the LRFD criteria is as follows:
j
cP Ru > L Yk Qkn (1) k;l
where .¢ resistance factor
R n nominal resistance
Yk load factor
Qkn nominal load effect
On the left side of Eq. (1). the resistance factor. CP. is a nondimensional factor less than or equal to 1.0 that accounts for the uncertainties in calculating the nominal resistance. The nominal resistance of the structure is the predicted ultimate resistance or load determined from design formulas using specified mechanical properties of material and section properties.
On the right side of the equation, factor Y is a nondimensional load factor used to reflect the possibility of overloads and uncertainties in computing the load effects. Each load factor applies to a nominal load effect Q and the subscript k corresponds to different types of loads. Only d~ad and live load effects were used to develop the LRFD criteria for cold-formed steel and to compare these two design methods.
COMPARISON
The design equation for the LRFD crtieria based on dead and live loads is as follows:
(2)
where Dn nominal dead load
L nominal live load n
COMPARATIVE STUDY OF DESIGN METHODS
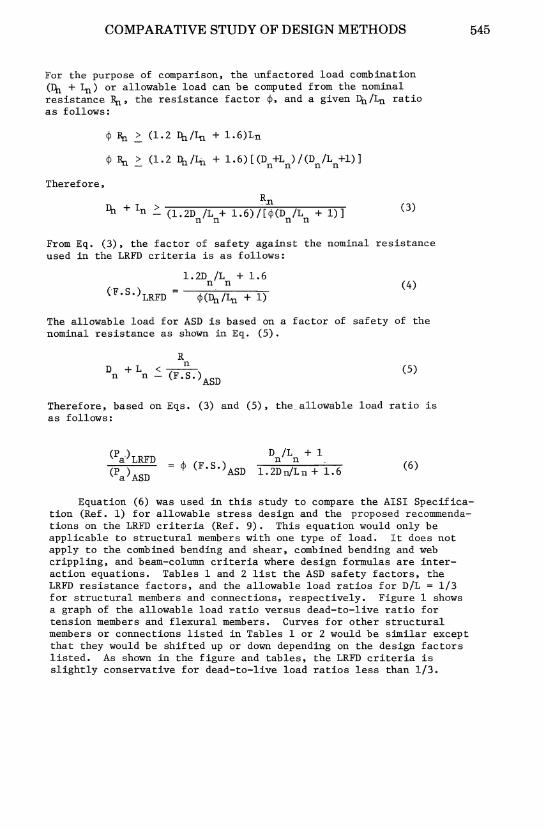
For the purpose of comparison, the unfactored load combination (Du + In) or allowable load can be computed from the nominal resistance BU, the resistance factor ¢, and a given Dn/Lu ratio as follows:
¢ BU > (1.2 Du/Lu + 1.6)Ln
¢ Rn > (1.2 Du/ln + 1.6) [(Dn+Ln)/(Dn/Ln+l)]
Therefore,
Du + In'::' (1.2D /L + 1.6)/[¢(D /L + 1)] n n n n
(3)
From Eq. (3), the factor of safety against the nominal resistance used in the LRFD criteria is as follows:
1.2D /L + 1.6 n n (4)
(F. S. )LRFD ¢(Du /Lu + 1)
The allowable load for ASD is based on a factor of safety of the nominal resistance as shown in Eq. (5).
D n
+L n
R n <---
- (F.S.) ASD (5)
Therefore, based on Eqs. (3) and (5), the .. allowable load ratio is as follows:
(Pa)LRFD
(Pa ) ASD ¢ (F. S.) ASD
D /L + 1 n n
(6) 1. 2D niL n + 1. 6
545
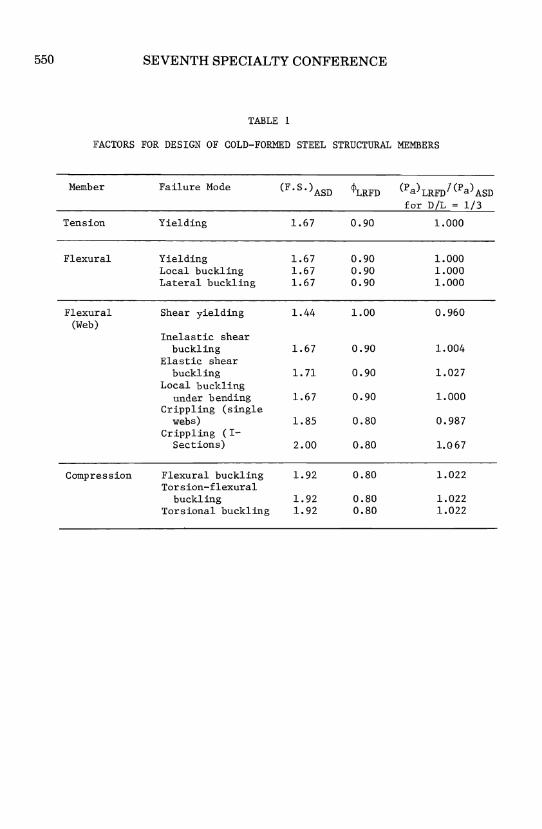
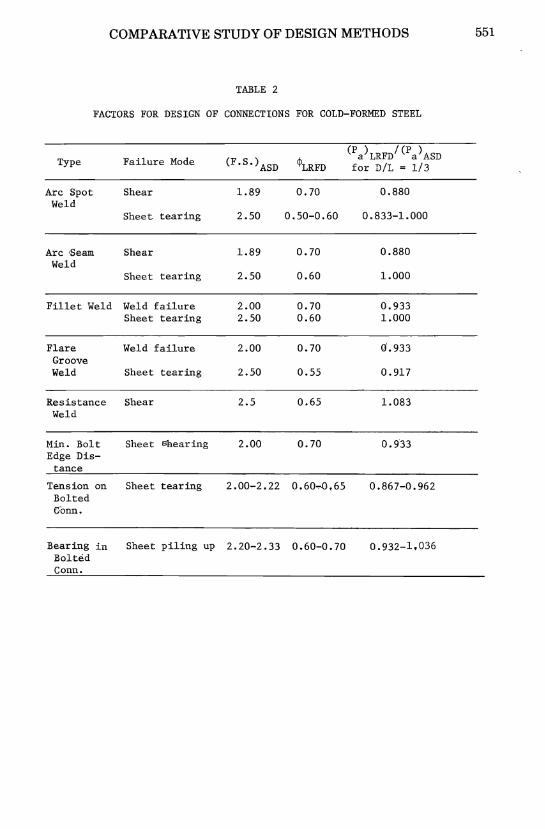
Equation (6) was used in this study to compare the AISI Specification (Ref. 1) for allowable stress design and the proposed recommendations on the LRFD criteria (Ref. 9). This equation would only be applicable to structural members with one type of load. It does not apply to the combined bending and shear, combined bending and web crippling, and beam-column criteria where design formulas are interaction equations. Tables 1 and 2 list the ASD safety factors, the LRFD resistance factors, and the allowable load ratios for D/L = 1/3 for structural members and connections, respectively. Figure 1 shows a graph of the allowable load ratio versus dead-to-live ratio for tension members and flexural members. Curves for other structural members or connections listed in Tables 1 or 2 would be similar except that they would be shifted up or down depending on the design factors listed. As shown in the figure and tables, the LRFD criteria is slightly conservative for dead-to-live load ratios less than 1/3.

546 SEVENTH SPECIALTY CONFERENCE
COMBINED LOADS
When a structural members has to be designed for a combination of loads or load effects, an interaction equation is used in both the AISI Specification (Ref. 1) and the Tentative Recommendations for LRFD (Ref. 9). Due to the complexity of the design equations for combined loads, specific examples were chosen for comparison.
For combined bending and shear design of webs, different examples were investigated varying the thickness, yield strength, and depth of the beams. The load case chosen was a uniformly loaded three span continuous beam. The allowable load ratio versus deadto-live load ratio curves were all within 2% of the curve shown in Figure 1.
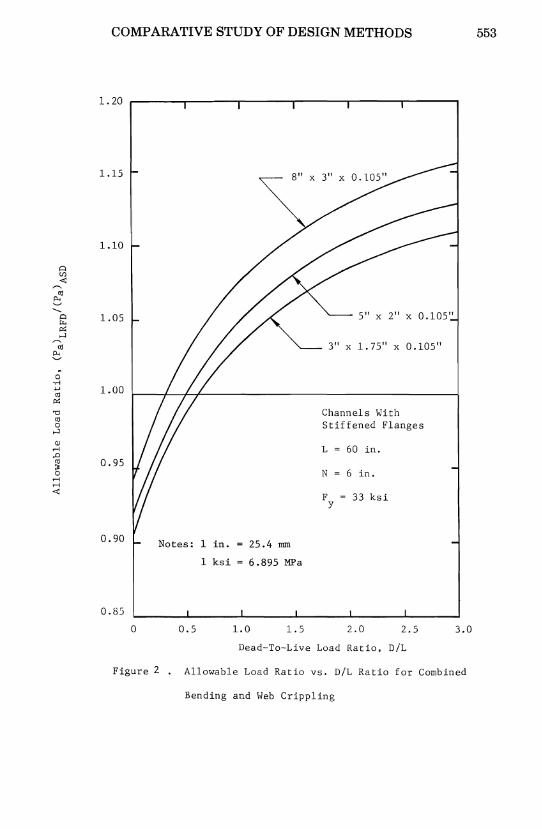
For combined bending and web crippling design, the same procedure was used but only a simple beam with a concentrated load at midspan was investigated. Figures 2 through 5 show typical allowable load ratio curves for specific examples. Unlike combined bending and shear, bending and web crippling results in a wide range of allowable load ratios for a given dead-to-live load ratio. Figures 3 and 5 show a decrease in allowable load ratio with increasing span length for this example.
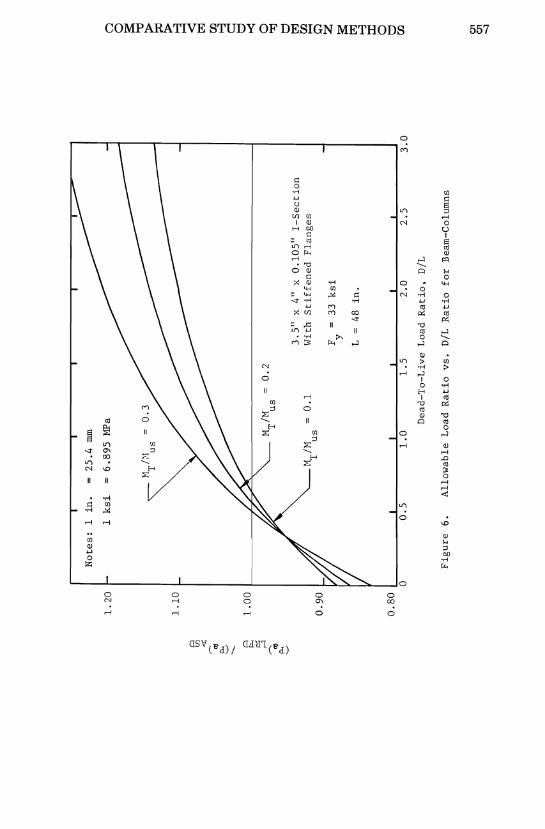
For comparison of doubly-symmetric beam-columns, only bending about the y-axis was considered. A typical design example was a beam-column with equal moments applied to each end so that the member was bent in single curvature. Since the end moments are independent of the axial load, the ratio of the unfactored applied moment to the ultimate moment capacity based on section strength, MT/Mus ' was considered to be a parameter. The solution of the interaction equations for flexural failure at midlength which includes the effects of secondary moments required a computer program to calculate allowable axial loads for various lengths, end moment ratios, and dead-to-live load ratios. The interaction design equations based on failure at braced points in the beam-column yielded similar results as the equations based on failure at midspan which would be the governing equations for this example.
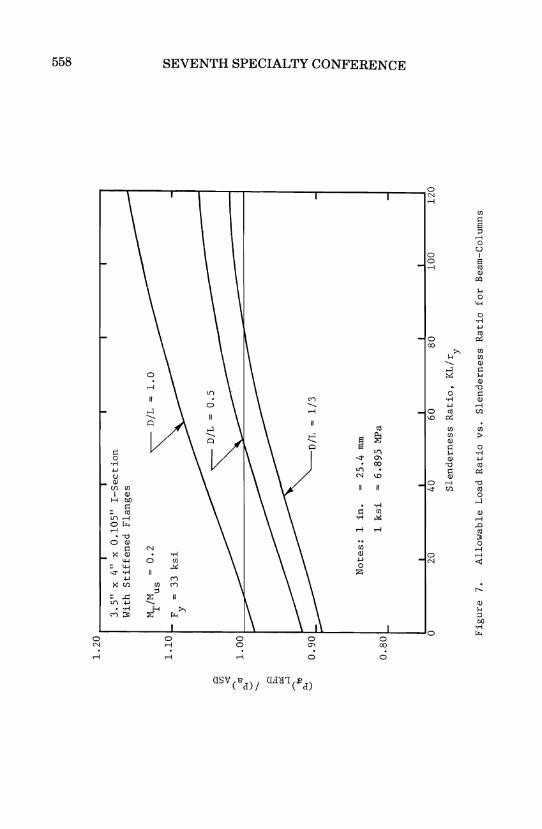
Figures 6 through 9 illustrate the results of typical doublysymmetric beam-columns. Figures 6, 8, and 9 show similar shaped curves as shown in previous examples except that the slope of the curves increase with increasing end moment ratios. The relationship between allowable load ratio and slenderness ratio is shown in Figure 7. As shown in the figure, allowable load ratio increases with increasing slenderness ratio of the beam-column.
The dashed line curves shown in Figure 8 represent the beamcolumn subject to joint translation or transverse loading between its supports where Cm = 0.85. As shown in the figure, the effect of

COMPARATIVE STUDY OF DESIGN METHODS
the coefficient, C , on the allowable load ratio is. related to the end moment ratio. mIn Figure 9, the dashed line curves represent the beam-column fabricated with a steel possessing a higher yield point. The influence of the yield point on the allowable load ratio versus dead-to-1ive load ratio curves for various end moment ratios is similar but opposite to that of the effect of the coefficient, C , shown in Figure 8. These effects are negligible for small end m moment ratios.
For singly-symmetric beam-columns, the direction of the moment
547
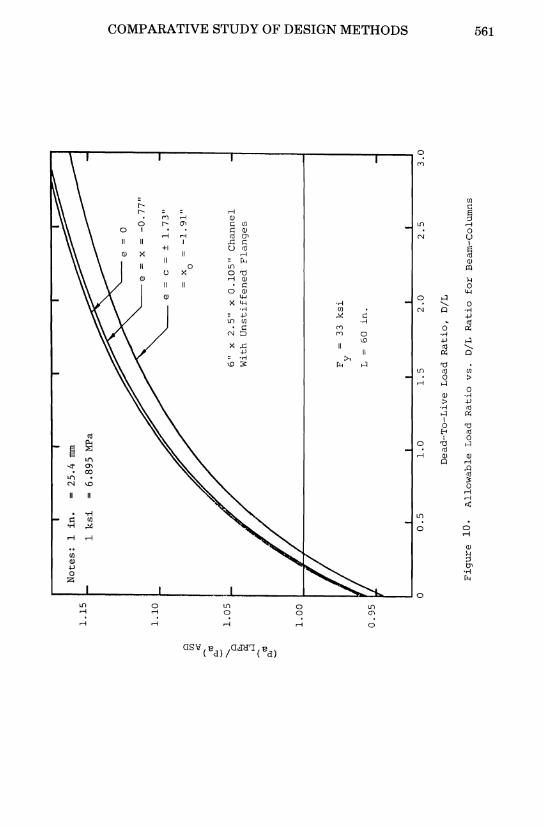
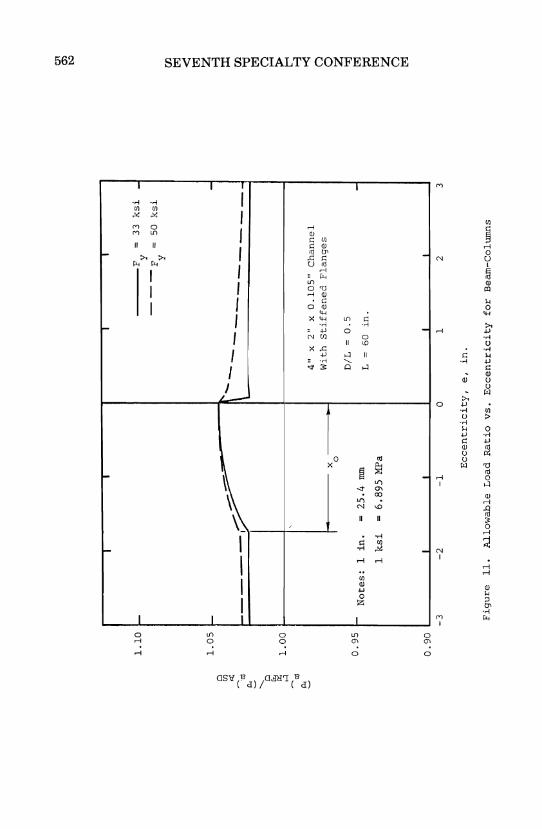
or location of the eccentric axial load can be important so eccentricity was used as a parameter instead of end moment ratio and the allowable eccentric axial loads were solved for with a similar computer program. Since the moment is now directly proportional to the axial load, the eccentricity or end moment did not affect the slope of the allowable load ratio curves as shown in Figure 10. Figure 11 shows the a110wab~e 10ad,ratio versus eccentricity for two different yield point materia1s~ Figures 10 and 11 both show an increase in allowable load ratio with a decrease in eccentricity. Higher yield point materials will also result in a slight increase in allowable load ratio.
The relationship between allowable load ratio and slenderness ratio at a given dead-to-1ive load ratio is illustrated in Figure 12 for two different yield point materials. The figure shows an increase in allowable load ratio as the slenderness ratio increases.
CONCLUSIONS
This investigation compares the AlSI Specification which is based on allowable stress design with the pt6posed recommendations on the load and resistance factor design for co1d~formed steel structures. It was found that the dead-to-1ive load ratio had a significant effect on the degree of conservatism of the LRFD criteria. In general, the allowable load ratio, (Pa)LRFD!(Pa)ASD' increases as the dead-to-1ive load ratio increases. Because co1d~formed steel members are usually thin, the dead-to-live load ratios of such light weight members are expected to be lower than the ratios used for other building materials. In view of this and the fact that the load factor used for live load is larger than the load factor for dead load, the LRFD criteria were found to be conservative in most cases,
ACKNOWLEDGMENTS
This project was sponsored by the American Iron and Steel Institute. The technical guidance provided by the AISI Task Group on Load and Resistance Factor Design under the chairmanship of Mr. Karl H. Klippstein and the AISI Staff. Dr. Albert L. Johnson. is gratefully acknowledged.

548 SEVENTH SPECIALTY CONFERENCE
APPENDIX I - REFERENCES
1. American Iron and Steel Institute, "Specification for the Design of Cold-Formed Steel Structural Members," 1980.
2. American Institute of Steel Construction, "Proposed Load & Resistance Factor Design Specification for Structural Steel Buildings," September 1, 1983.
3. Rang, T. N., Galambos, T. V., and Yu, W. W., "Load and Resistance Factor Design of Cold-Formed Steel," First Progress Report, submitted to American Iron and Steel Institute, January 1979.
4. Rang, T.N., Galambos, T.V., and Yu, W. W., "Load and Resistance Factor Design of Cold-Formed Steel," Second Progress Report, submitted to American Iron and Steel Institute, January 1979.
5. Rang, T.N., Galambos, T.V., and Yu, W. W., "Load and Resistance Factor Design of Cold-Formed Steel," Third Progress Report, submitted to American Iron and Steel Institute, January 1979.
6. Rang, T.N., Galambos, T. V ., and Yu, W. W., "Load and Resistance Factor Design :of Cold-Formed Steel," Fourth Progress Report, submitted to American Iron and Steel Institute, January 1979.
7. Supornsilaphachia, B., Galambos, T.V., and Yu, W. W., "Load and Resistance Factor Design of Cold-Formed Steel," Fifth Progress Report, submitted to American Iron and Steel Institute, September 1979.
8. Galambos, T.V., and. Yu, W. W., "Load. and Resistance Factor Design of Cold-Formed Steel," Sixth Progress Report, submitted to American Iron and Steel Institute, March 1980.
9. Galambos, T.V., and Yu, W. W., "Load and Resistance Factor Design of Cold-Formed Steel," Seventh Progress Report, submitted to American Iron and Steel Institute, September 1983.
10. Snyder, B.K., Pan, L.C., and Yu, W. W., "Load and Resistance Factor Design of Cold-Formed Steel," Eighth Progress Report, submitted to American Iron and Steel Institute, September 1983.

C m
c
D n
D/L
e
(F.S·)ASD
(F.S·\RFD
F Y
K
L
M us
N
(P a> ASD
r y
x
x a
COMPARATIVE STUDY OF DESIGN METHODS
APPENDIX II - NOTATION
bending coefficient used in beam-columns
distance from the centroidal axis to the fiber with maximum compression stress, negative when the fiber is on the shear center side of the centroid
nominal dead load
dead-to-live load ratio
eccentricity of the axial load with respect to the centroidal axis, negative when on the shear center side of the centroid
549
factor of safety against failure based on allowable stress design
factor of safety against failure based on load and resistance factor design
yield point
effective length factor
= member length
nominal live load
total unfactored applied moment
beam strength as determined from section strength
actual length of bearing
allowable unfactored load based on allowable stress design
allowable unfactored load based on load and resistance factor design
nominal load effect
nominal resistance
radius of gyration of cross-section about centroidal principal axis
distance from shear center to web face
distance from shear center to centroid along the principal x-axis
load factor
resistance factor
550 SEVENTH SPECIALTY CONFERENCE
TABLE 1
FACTORS FOR DESIGN OF COLD-FORMED STEEL STRUCTURAL MEMBERS
Member Failure Mode (F .S.) ASD <PLRFD (Pa)LRFD!(Pa)ASD for D/L = 1/3
Tension Yielding 1.67 0.90 1.000
Flexural Yielding 1.67 0.90 1.000 Local buckling 1.67 0.90 1.000 Lateral buckling 1.67 0.90 1.000
Flexural Shear yielding 1.44 1.00 0.960 (Web)
Inelastic shear buckling 1.67 0.90 1.004
Elastic shear buckling 1.71 0.90 1.027
Local buckling under bending 1.67 0.90 1.000
Crippling (single webs) 1.85 0.80 0.987
Crippling ( 1-Sections) 2.00 0.80 1.Q67
Compression Flexural buckling 1.92 0.80 1.022 Torsion-flexural
buckling 1.92 0.80 1.022 Torsional buckling 1.92 0.80 1.022
COMPARATIVE STUDY OF DESIGN METHODS
TABLE 2
FACTORS FOR DESIGN OF CONNECTIONS FOR COLD-FORMED STEEL
Type Failure Mode (F .S.) ASD ¢LRFD
Arc Spot Shear 1.89 0.70 Weld
Sheet tearing 2.50 0.50-0.60
Arc <Seam Shear 1.89 0.70 Weld
Sheet tearing 2.50 0.60
Fillet Weld Weld failure 2.00 0.70 Sheet tearing 2.50 0.60
Flare Weld failure 2.00 0.70 Groove Weld Sheet tearing 2.50 0.55
Resistance Shear 2.5 0.65 Weld
Min. Bolt Sheet Shearing 2.00 0.70 Edge Dis-
tance
Tension on Sheet tearing 2.00-2.22 0.60.,.0.65 Bolted C:onn.
Bearing in Sheet piling up 2.20-2.33 0.60-0.70 Bolted Conn.
(Pa)LRFD/(Pa)ASD for D/L = 1/3
0.880
0.833-1.000
0.880
1.000
0.933 1.000
0'.933
0.917
1.083
0.933
0.867-0.962
0.932-1,036
551

552
Q UJ <:
'""'<\I
t-'-
Q
'" pO ....l
'""'<\I
t-,;
'''; .., <\I
pO
"0 <\I 0
....l
<J) r-l .0 <\I ~ 0
r-l r-l <:
SEVENTH SPECIALTY CONFERENCE
1.15
1.10
1.05
1.00
0.95
0.90
0.85
o 1.5 3.0
Dead-To-Live Load Ratio, D/L
Figure 1. Allowable Load Ratio vs. D/L Ratio for Tension and Flexural Members
COMPARATIVE STUDY OF DESIGN METHODS
o 'M
1. 20
1.15
1.10
1.05
~ 1.00 ..:
x 0.105"
3" x 1. 75" x 0.105"
"Cl Channels With ~ Stiffened Flanges
....:I
OJ ......
1 ...... ...... «
0.95
0.90
0.85
o
Notes: 1 in. 25.4 mm
1 ksi 6.895 MPa
0.5 1.0 1.5
L 60 in •
N 6 in •
F = 33 ksi y
2.0 2.5
Dead-To-Live Load Ratio, D/L
3.0
Figure 2 . Allowable Load Ratio vs. D/L Ratio for Combined
Bending and Web Crippling
553

554 SEVENTH SPECIALTY CONFERENCE
1.15~--------~--------~--------'----------r--~
1.10
1.05
5" x 2" x 0.105" Channel With Stiffened Flanges
D/L 1/3
N ~ 6 in.
33 ksi
Notes: 1 in 25.4 mm 0.95
1 ksi 6.895 MFa
o 25 50 75 100
Length of Span, L, in.
Figure 3. Allowable Load Ratio vs. Span Length for .Combined
Bending and Web Crippling

COMPARATIVE STUDY OF DESIGN METHODS
1.15r------r------r------.------.------.----~
1.1
1.0
l.0r-______ ~------~----~~----------------~
0.9
0.8 Notes: 1 in.
1 ksi
25.4 mm
6.895 MFa
5"x2.5" x 0.105"
3" x 2.25" x 0.105"
I-Sections With Unstiffened Flanges
L 60 in.
N 6 in.
F = 33 ksi y
0.8~----~~--~~--~~----~~--~~--~~ o 0.5 1.0 1.5 2.0 2.5 3.0
Dead-To-Live Load Ratio, D/L
Figure 4. Allowable Load Ratio vs. D/L Ratio for Combined
Bending and Web Crippling
555

556
q til ..,;
1.30
1.20
SEVENTH SPECIALTY CONFERENCE
Notes: 1 in.
1 ksi
5" x 2.5" x 0.105" I-Section With Unstiffened Flanges
D/L = 1/3
N = 6 in.
25.4 rom
6.895 MPa
F 50 ksi y
= 33 ksi 1.00~ ____ ~~-.r-______ ~ __________________ ~
0.90L-______ ~L-______ ~ ________ ~ ________ ~ __ ~
o 25 50 75 100
Length of Span, L. in.
Figure 5. Allowable Load Ratio vs. Span Length for
Combined Bending and lVeb Crippling
p '" <I; ~
C --- p ~ ~
r-'1
~
P-< ~
No
tes:
1
in.
25
.4 m
m
1.
20
1 k
si
6.8
95
MPa
M
tel
T
us
1.1
0
1.0
0
0.9
0
N
1M
T
us
0.2
0.1
3
.5"
x 4"
x
0.1
05
" I-
Secti
on
W
ith
S
tiff
en
ed
F
lan
ges
F =
33
k
si
y
L =
48
in
.
0.8
0 I
I
I I
I
o 0
.5
1.0
1
.5
2.0
2
.5
3.0
Dead
-To
-Liv
e L
oad
R
ati
o,
D/L
Fig
ure
6
. A
llo
wab
le
Lo
ad R
ati
o v
s.
D/L
R
ati
o fo
r B
eam
-Co
lum
ns
(") o a:: ~ j <:
t:'j r:n 6 t::J
><: o >%
j
t::J
t:'j r:n
...... o z a:: t:
'j >-3
::t:
o t::J
r:n
01
0
1
-l
~
CI)
<>:
~ It" t- .....
. ~ ~
.,::
....:I
~iII
t-
1.2
0 I
I 3
.5" x
4
" x
0.1
05
" I-
Secti
on
W
ith
Sti
ffen
ed
F
lan
ges
~/M
=
0.2
u
s ~
niL
1
.0
1.1
0 L
F
=
33
k
si
y
0.9
0L
----N
ote
s:
1 in
.
0.8
0'
1 k
si
o 20
"'--
-niL
1
/3
25
.4 m
m
6.8
95
MPa
Sle
nd
ern
ess
Rati
o,
KL
/r y
Fig
ure
7
. A
llo
wab
le L
oad
Rati
o v
s.
Sle
nd
ern
ess
R
atio
fo
r B
eam
-Col
umns
12
0
01
0
1
00
r:n
t.:I:j ;3 ~ r:n ~ ~ ~ ~ o ~ ~ Z ~
t.:I:j

P til «:
~'" ~
-... o ~
<>:
,...l
~
~t\j
1.3
0
1.2
0
1.1
0
1.0
01
JT
1 in
.
0.9
0 It
1 k
si
0 0
.5
25
.4 m
m
6.8
95
MPa
1.0
N /
H
=
0.1
~
us
C
1.0
m
-
__
C
0.8
5
m
6"
x 5
" x
0.1
05
" I-
Secti
on
W
ith
Sti
ffen
ed
F
lan
ges
F 3
3-5
0 k
si
y L
60
in.
I I
1.5
2
.0
2.5
Dea
d-T
o-L
ive
Loa
d R
ati
o,
D/4
.
Fig
ure
8
. A
llo
wab
le L
oad
Rat
io v
s.
D/L
R
atio
fo
r B
eam
-Col
umns
I 3
.0
a o i rn d t::j t-<: o I'%j
t::j
t:oJ ~ ~ a:::
t:oJ ~ o t::j
rn 81 to

~
Vl
.,,;
ro 2:;
, --- ~
~
~
....:l
~
2:;,
1.2
0
1.1
0
1.0
0
~MT/M
'0.3
0
.90
u
s
No
tes:
1
in
= 2
5.4
nnn
1 k
si
= 6
.89
5
MPa
0.8
0
0 0
.5
1.0
1
.5
~I.r
/Hus
0.2
_
__
Fy
---F
y
~~~
0.1
33
k
si
50
k
si
6"
x 3
" x
0.1
05
" I-
Secti
on
W
ith
U
nsti
ffen
ed
F
lan
ges
L 60
in
.
2.0
2
.5
Dead
-To
-Liv
e
Lo
ad R
ati
o,
D/L
Fig
ure
9
. A
llo
wab
le
Lo
ad
Rati
o
vs.
D/L
R
ati
o
for
Bea
m-C
olu
mn
s
3.0
01
~
o w
tz:j -< tz:j Z
>-3 ::r: w
"t!
tz:j
(1
..... ~ ...::
(1
o Z
"".:I
tz:j ~ Z
(1
tz:j
No
tes:
1
in.
1.1
5 L
1 k
si
6.8
95
M
Pa
~-----
(")
e =
0
0 is:
e =
x
-0.7
7"
"'d
1.1
0
I ~ ./
"->
e
= c
=
±
1.7
3"
~ x
= -
1.9
1"
Cl
0 >-
< U
l -<:
~
t':j
;., p.
. 00
"-
LOl
6"
x 2
.5"
x 0
.10
5"
Ch
an
nel
~
Cl
c:::
~ W
ith
U
nsti
ffen
ed
F
lan
ges
t:1
...:I
><:
ttl
0 ::0
I-.
:j t:1
1.0
0
I 1
/
t':j
00
>-< 0 Z
F =
33
k
si
is:
y t':
j L
=
60
in
. ~
0.9
5 1
/ ::t:
0 t:1
00
0 0
.5
1.0
1
.5
2.0
2
.5
3.0
Dead
··T
o-L
ive
Lo
ad R
ati
o,
D/L
Fig
ure
1
0.
All
ow
ab
le
Lo
ad R
ati
o v
s.
D/L
R
ati
o fo
r B
eam
-Co
lum
ns
en
en
I-'
1.1
0
1.0
5
Q
(fl
..;
~·tII
~
"-Q
~ 1
.00
H
til
~
0.9
5
0.9
0
I I
I I
F =
33
k
si
-f-
y ---F
=
50
ksi
y
f--
---~
"'---
---
:: \
---------
-------1
4"
X
2"
x 0
.10
5"
Ch
an
nel
Wit
h S
tiff
en
ed
Fla
ng
es
I x
! 0
D/L
=
0
.5
J -
No
tes:
1
in.
= 2
5.4
mm
L
=
6
0
in.
1 k
si
= 6
.89
5 M
Pa
I I
I I
-3
-2
-1
o 1
2 3
Eccen
tric
ity
, e,
in.
Fig
ure
1
1.
All
ow
ab
le
Lo
ad
Rati
o v
s.
Eccen
tric
ity
fo
r B
eam
-Co
lum
ns
01
~ ~
rn.
tr:l <:
tr:l Z ~
::I:
rn.
"d
tr:l o ~ ~ ~ o o Z
"':l
tr:l
::0
tr:l Z o tr:l

Cl
Ul
.0:
a..'"
"-C
l ~ H
C1l
t:!
1.1
0
1.0
5
1.0
0
0.9
5
4"
x 2
" x
0.1
05
" C
han
nel
Wit
h S
tiff
en
ed
Fla
ng
es
No
tes:
1
in.
1 k
si
25.4
mm
6.8
95
M
Pa
F 33
k
si
y
e =
~
1.2
9
in.
D/L
1
/3
0.901~ _
__
__
_ ~~ _
__
__
_ ~ _
__
__
__
_ ~ _
__
__
__
_ ~ _
__
__
__
_ ~ _
__
__
_ ~
o 25
50
7
5
10
0
12
5
Sle
nd
ern
ess
R
ati
o,
KL
/r y
Fig
ure
1
2.
All
ow
ab
le
Lo
ad R
ati
o v
s.
Sle
nd
ern
ess
Rati
o fo
r B
eam
-Co
lum
ns
15
0
(1
o is: ~ ~ <
trJ
r:n d t;j t-<: o "l
:j t;j
trJ
r:n
...... ~ is:
trJ ~
::t:
o t;j r:n
01
m
c.
:l
