comparative study of the conventional diamond and ... · a comparative study of the conventional...
TRANSCRIPT

A COMPARATIVE STUDY OF THE CONVENTIONAL DIAMOND AND CLOVERLEAF INTERCHANGES WITH RESPECT TO RAMP CAPACI1Y
AND VEHICULAR DELAY
by
James D. Barnett Graduate Research Assistant
Cooperative Research with the Texas Highway Department and the
Department of Commerce 1 Bureau of Public Roads
Research Project 2-9-58-6
Ramps and Interchanges
Nove~ber I 1963
TEXAS TRANSPORTATION INSTITUTE Texas A&M University
College Station 1 Texas

A COMPARATIVE STUDY OF THE CONVENTIONAL DIAMOND AND CLOVERLEAF INTERCHANGES WITH RESPECT TO RAMP CAPACITY
AND VEHICULAR DELAY
INTRODUCTION
With the passing of the Interstate Highway Act by Congress in 1956 and with the growth of metropolitan centers 1 the construction of multilane freeways in this country has been greatly accelerated in the past few years. These freeways have made possible the provision of safe and efficient speeds to high volumes of traffic. As a result, a great amount of research has either been completed or is currently in progress concerning freeway operations.
A freeway may be divided into two sections. These two sections are the areas where access arid egress is permitted and areas where this access and egress is prohibited. Where there are no interchanges I traffic flow is subject tocnormal disruptions only. However, in areas where traffic is moving onto a·nd off the freeway, the traffic flow may be seriously impaired. As a result, it may be said that the interchange area is the critical area of any freeway a,nd that the level of service provided depends to a great extent on the design of the interchange.
Currently, three basic types of interchanges are in use. These are as follows:
1. Directional, 2. Cloverleaf, and ./ 3. Diamond.
Due to high cost of construction, use of the directional type interchange is restricted to the intersection of two multilane, high volume freeways and is considered the ultimate in interchange. type. The cloverleaf and diamond are used at the intersec~ion of freeways and arterials and/or minor streets. As a result 1 extensive··use has been made of both the cloverleaf and diamond interchanges at intersections with similar characteristics.
Since the diamond and cloverleaf interchanges appear to be interchangeable, a library research was conducted to determine what specific warrants were currently being used in the selection of one type over the other. In addition, a questionnaire was issued to various design agencies (the results of which are discussed previously) to gain additional infor- · mation concerning the basis on which the selection is made.
The library research revealed that Leisch (l) has made specific recommendations concerning the use of each type. -However, his recommendations are based primarily on the area in which the fn:tenmange is to be located and on the type of roadway intersecting the freeway.

Leisch (l) and others have stated that as the left turn volume from the arterial to the freeway becomes large, a loop ramp should be used in order that the conflict of left turns being made across an opposing stream of traffic might be eliminated. However, a signal phasing system for a diamond interchange has been developed by the Te~as Transportation Institute (~) which greatly increases the efficiency of a diamond interchange through the use of phase overlap.
Another area of consideration appears to be the entrance ramp capac-ity. It is recognized that the capacity of an entrance ramp is dependent to s orne extent on the volume of traffic in the outside lane of the freeway. However, the capacity of an entrance ramp is. also affected by the design of the ramp. As a result, much work has been done in the area of ramp design. For example, Pinnell and Keese (3) have found that as the angle of mergence of the entrance ramp is decreased the efficiency of the ramp is increased,, This is due to a reduction in the difference between freeway and ramp speed.
QUESTIONNAIRE SURVEY
At the outset of this research project, lt was apparent that it would be essential to determine how the selection between the diamond and cloverleaf interchange was currently being made by design agencies in the field. Mter a preliminary investigation, it was decided to conduct a questionnaire survey for this purpose.
In the development of the questionnaire, it appeared that two types of information should be secured. Those were, (1) what specific warrants are presently being used? and (2) If no specific warrants are being used, on what general criteria is the selection based? In addition, it was decided to determine how extensively each type is presently being used. As a result, a two-page questionnaire, as shown in Figures 1-A and 1-B was developed.
In the fall of 1962, the Texas Transportation Institute mailed 27 questionnaires to 12 state highway departments, 10 regional offices of the Bureau of Public Roads, and 5 consulting engineering firms. The selection of the 27 agencies to receive the questionnaire was made with respect to the amount of work they were doing in the field of freeway construction. Appendix A contains a listing of those agencies receiving the questionnaire. Also listed are the 23 agencies who responded.
Table 1 is a summary of the findings of the questionnaire survey. It may be observed that of the 23 agencies responding, 12 indicated that specific warrants such as traffic volumes and the intersection of two hightype roadways are presently being used. Of the 12 agencies which listed traffic volumes as a specific warrant, only two defined a specific volume at which one type interchange would be selected over the other. These
2

FIGURE·l-A
QUESTIONNAIRE FOR INTERCHANGE RESEARCH TEXAS TRANSPORTATION INSTITUTE
Is the diamond interchange used extensively in your state or district?
Is the· cloverleaf interchange used extensively in youn;state or district? ";~;
Do you have specific warrants for the use of the diamond interchange? If so, please list below. Attach additional sheets if desired. ·
Do you have specific warrants for the· use of the cloverleaf interchange:? If so, please list below.

FIGURE 1-B ·
QUESTIONNAIRE (continued)
If you do not have specific warrants, what criteria are used in the selection of a cloverleaf or diamond interchange for a given location?
Please list any other information which you feel pertinent to this study.
4

TABLE 1
RESULTS OF QUESTIONNAIRE SURVEY
I. States
A. Type Use
1. Number using diamonds extensively 2. Number using cloverleafs extensively 3. Number using both extensively
B. Specific Warrants
1. Number with specific warrants 2. Warrants
a. A specific traffic volume as a warrant b. Intersection of two high type roadways
C. General Criteria
1. Traffic volume and patterns 2. Costs 3. Topography. 4. Consistency of type 5. Land use on eros sroad in vicinity of intersection
II. Bureau of Public Rroads
A. Type Use
1. Number regions using diamonds extensively 2. Number regions using cloverleafs extensively 3. Number using both extensively
B. Specific Warrants
1. Number regions indicating specific warrants 2. Warrants ·
a. A certain traffic volume b. Intersection of two high type roadways c. AU urban street connections (diamond) d. Cross road with less than 3000 vpd (diamond) e. Cross road must have high speed operation and be
relatively free flowing
5
10
10 2 2
6
2 5
2 5 5 1 3
9
7 3 3
6
0 6 1 1
1

TABLE 1 (continued)
C. General Criteria
1. Traffic volumes and patterns 2. Costs 3. Topography 4. Consistency of type 5. Lane use in vi:cinity of intersection 6. Ramp grades
III.Consulting Firms
A. Type Use
1. Number of firms using diamonds extensively 2. Number of firms using cloverleafs extensively 3. Number of firms using both extensively
B. Specific Warrants
1. Number of firms indicating specific warrants
C. General Criteria
1. Those developed by Jack E.· Leisch 2. Traffic volume and patterns 3. Costs 4. Topography 5. Land use in vicinity of intersection 6. Consistency of type
6
. -· ~- .. '
7 :,6 2 0 3 1
4
3 2 2
0
1 2 2 2 1 1

two agencies indicated that this selection was on a loop versus ramp basis for each of the four quadrants. The other 10 agencies made reference only to high or heavy volumes. In mentioning the intersection of two high type roadways as a specific warrant, it was noted that the choice would be between the cloverleaf and directional types only.
A general policy of design was indicated by so'me of the agencies. They indicated that the diamond is first assumed for anyintersection. Then the factors listed under general criteria are studied. For example, most of the agencies indicate that as traffic volumes become high other interchange types are given consideration. As stated previously, however, these socalled high volumes were not defined. Mter analysis of the general criteria, a final selection is made.
From this questionnaire survey, it is concluded that practically no specific warrants, by which a selection of either the diamond or cloverleaf can be made, are presently being used by design agencies. Rather it appears that the selection is based for the most part ·on past experience with such factors as those listed in Table 1 under general criteria being given consideration.
OBJECTIVES OF STUDY- DISCUSSION OF PROBLEM
Discussion of Problem
The basic designs of the conventional diamond and cloverleaf interchanges and the cloverleaf interchange with collector-distributor roads are shown in Figures 2, 3, and 4 respectively. It may be observed that there are three basic traffic movements from an arterial approach at each interchange. These are:
1. The straight through arterial movement (movement 2 in Figures 2, 3, and 4).
2 ~ The right turn movement from the arterial to the freeway (movement 1 in Figures 2, 3, and 4).
3. The left turn movement from. the arterial to the freeway (movement 3inFigures2, 3, and4).
Straight through movement -- The diamond interchange requires the straight through movement on the arterial street to pass through two signalized intersections. Since the cloverleaf interchange requires no signalization, it may be stated thatthe cloverleaf affords better operation to this movement. It should be noted, however, that in the design of an interchange the primary consideration is the provision of efficient operation to vehicles entering or leaving the freeway with a minimum of disruption to freeway traffic. As a result, the provision of efficient operation to the straight through movement on the arterial- shotild not be a critical factor in
7

w <.!> z <(' :c (.) a:: w I-z N
r.LI 0 p:; z p 0 0 ::!E 1-t
<( J:!... 0
....J s a. >-I-

~: g -0
LLJ (!) z <{ :c (.) 0:: LLJ I-z
lL (V) <{ LLJ !:4· _J p::; 0:: ·::> LLJ 0 g t-1
J:!..
(.)
_J
~ a.. >-I-

TYPICAL CLOVERLEAF INTERCHANGE WITH COLLECTOR - DISTRIBUTOR ROADS
FIGURE 4
•zf'!!b, ~ n '""''= ~

i '
the selection of interchange type.
Right turn movement -- A review of Figures 3 and 4 reveals that cloverleaf interchanges provide a separate turning lane for the right turn movement (movement 1 in Figures 2 1 3, and 4). The diamond interchange shown in Figure 2 requires the right turn movement to pass through one signalized intersection. It should be noted, howev9J;,.-, that a separate turn lane could easily be added and would be much shorter in length due to its ability to be built much closer to the interchange. The right turn lane provided by the cloverleaf must begin at a greater distance from the intersection due to the loop. This is shlZ!wn in Figures 3 and 4. However, it appears that the service provided to this turning movement by the three interchange types is essentially the same.
Left turn movement -- It may be observed in Figure 2 that the diamond interchange requires the arterial left turn movement to pass through two signalized interseqtions and to cross the qpposing traffic stream on the arterial before being merged with the freeway traffic stream. The cloverleaf interchanges (Figures 3 and 4) eliminate the need for signals and the necessity of crossing the opposing traffic stream on the arterial throughc the use of loop ramps. However/ the left turn movement is required to turn right off the arterial. It may also be observed in Figures 2 and 3 that the geometries of the ramps 1 employed by the diamond and cloverleaf interchanges I are quite different.
The basic difference of the three interchange types then is in the provision for the left turn maneuver .from the arterial to the freeway. As a reeult, the problem became one of comparison of the service provided to the left turn vehicles by each of the interchange types.
'Previous discus sian has dealt with the l!raffic movements onto the freeway from the arterial only. It should be noted that there are two:jpasic movements from the freeway to the arterial. These are vehicles leaving the freeway and desiring to turn either right or left on the arterial. The cloverleaf and diamond interchanges may provide a separate turning lane for the right turn maneuver. The Ieit turn movement i-s requj,red by the dfamond interchange to pass through two signalized intersections. The cloverl"&;a·f:L in.terohamw:?2 requires the left turn movement to exit "from the freeway on a loop ramp4 As a result, a comparison of the off-movements with the onmovements previously discussed indicated that the respective movements are essentially the same.
There appeared to be two areas for comparison of the operational features of each typ-~. These were the travel time and capacity of each type. A preliminary investigation revealed that the capacity of each movement would be restricted by the capacity of the ramp. Travel time would be influenced by the amount of left turning vehicles, the ability of the ramps to provide good mergence and the delay encountered at the at-grade intersections on the arterial street.
ll

-----------------------
In comparing the conventional diamond and cloverleaf interchanges with the cloverleaf interchange employing collector-distributor roads (Figure 4), it may be -observed that mergence with the freeway is made in the same manner as that of the diamond. Also, the left turn capacity of the cloverleaf with collector-distributor roads is restricted to the capacity of the loop ramp. 'l!her.efore, it appeared that the study could be restricted to the conventional diamond and cloverleaf interchanges (Figures 2 and 3) only.
Statement of Objectives
Previous discussion has indicated that a need exists for a study which would compare the operational features of the conventional diamond and cloverleaf interchanges. It has been noted that the basic difference between the two types is the manner in which provision is made for the left turn movement from the arterial to the freeway. As a result, the specific objectives were as follows:
l. To investigate the total time required to make the left turn maneuver from a point outside the interchange on the arterial to a point where mergence had been made with the freeway traffic, for both the conventional diamond and cloverleaf interchange.
2. To investigate the capacit¥1: of the on-ramp used by the conventional diamond interchange and the capacity of the on-ramp used by the conventional cloverleaf interchange.
It is recognized that many variations o'f the lbcisic type of the cloverleaf and diamond interchanges have been developed. Among these variations are the split-diamond, three-level diamond, and partial cloverleaf. However, it appears that a comparison should first be made of the basic or conventional types.
It should also be noted that the scope of this study was restricted to the intersection of a high-volume arterial street and a freeway where signalization of the diamond interchange was a necessity.
DESCRIPTION OF STUDY SITES
Diamond ·limterchange
After preliminary investigation the Berry Street Interchange in Ft. Worth, Texas was selected as a study site. This conventional diamond interchange, as shown in Figure 5, had several features which rendered it desirable for study.
First, the concept of phase overlap (1_} was being utilized in the signalization of the two at-grade intersections. This was being accomplished through the use of a volume-density controller and tw0 minor movement

18' R.
- ------0 <D
ncfT.',EJ---4 ~- -~J
18 R. I I
I I I I
0 I I
I I I I
1
: 20' I I
~ Io.s· i
I I I ~ I
~ I 10 I leo I I II\ ~=t I
I~ 18'R. I
I~ ~ 10' R.
1-~ \d . I ' I ' ' r-j -.:~·®.J I I I I I ' ' I
"' I I I ' ' I I
I C\1 I I I I
I I I ' I I I I I I
I I I I ' I
I I I I ' I
I I -., I I I I
I I C\1 I I ' I I I : ' ' ' ' I , T r::;_----------- ---
~R. ,/?' ® ,. .• 32'
! ~ -10
!?; co
w w N 0::: u.. (fj ==
I
z I I I I
! BERRY STREET INTERCHANGE
FORT WORTH, TEXAS FIGURE 5

controllers. As a result, the interchange appeared to be signalized for maxi mum efficiency ,of operation.
Se.cond,,_previous studies had been conducted at the Berry Street Interchange by the Texas Transportation Institute (.£). As a result, fairly complete traffic volume data concerning the interchange were available. A review of the previously collected data indicated that the left turn movement for vehicles traveling east on Berry Street and turning north on t:o the freeway was heavy during the P. M. peak. Also, heavy flow existed on the other three approaches to the Berry Street Interchange during the period.
Since the northbound on-ramp at the Berry Street Interchange is in need of redesign and the freeway traffic is only moderate during the P. M. peak, it became necessary to study a ramp at a different location. A review of the Texas Transportation Institute film library revealed that the P. M. peak movement at the Griggs Road ramp on the Gulf Freeway in Houston, Texas had been recorded on film in June, 1960. This ramp is shown in Figure 6. A review of the films indicated that sufficient data could be obtained concerning ramp travel time. How ever 1 the films did not offer a wide range in freeway and ramp volumes. Therefore, it became necessary to investigate another diamond ramp. In June, 1961 the Texas Transportation Institute filmed the P. M. peak movemenLaf the Marshall Street on-ramp in San. Antonio, Texas. An analysis of this film revealed that sufficient data concerning the freeway and ramp volume~ could be secured. However, the placement of the movie camera prevented the use of the ramp for the ramp delay section of the study. This ramp is shown in Figure 7.
Cloverleaf Interchange
In December, 1962 and March, 1963 the Texas Transportation Institute filmed the A. M. peak vehicular movement on the northwest loop of the Northcentral Expressway - Loop 12 conventional cloverleaf in Dallas, Texas. This loop is used by west bound vehicles desiring to travel south on the freeway and is shown in Figure 8. Analysis of the data revealed that sufficient data could be obtained concerning loop travel time. In addition, a wide range in loop and freeway volumes was recorded. As a result, no further field studies were required in connection with the cloverleaf interchange.
STUDY PROCEDURE
As stated previously 1 the left turn movement through a cloverleaf interchange and the flow of vehicles from a diamond ramp onto a freeway had been recorded on film prior to this study. Therefore, the only additional field study required was for the left turn movement through; the two at..: grade intersections of a diamond interchange. After a review of different
14

~------------
• -- --.-- ---- -- ---- --• TO HOUS'i'ON U~ FREEWAY -- ----- --.-- -- --- --- --- -- -- --- --- -
-- ~--l - -~ -- 36'~- -__ , -- -- ~-
-- -- - --- -- ~~- _-- -~-~ - -- ----~ --i~~--------.- -=--=-_ r FREEWAY : ---- . -- ---- -- --- -
CAMERA USED IN FILMING VEI-IICL E MANEUVERS
t--------------------- 650'
--- ---33'-- -- -----t FRONTAGE ROAD , ~~-- ----- ' (
DETAIL LAYOUT OF HOUSTON STUDY LOCATION
FIGURE 6

------------------_/ l FRONTAGE ROAD ------
.. -.. ----
-
FREEWAY
-1\ m
~
-- - - - -
• • ___ , lL-------------------------- -~---- ---
--DRAINAGE CREEK 115'
;-rr----- --------------------- _/ __ --- ----------
---l!dl
t f ' t 24 - - -
FREEWAY ~ - - -•
t 36'
= ~ .. .. . . . FRONTAGE ROAD
MARSHALL STREET ENTRANCE RAMP
FIGURE 7
~ • --- - -- --

LOOP 12-NORTH CENTRAL EXPRESSWAY INTERCHANGE DALLAS,TEXAS
FIGURE 8

methods for data collection, the motion picture technique was adopted.
An on-site inspection of the Berry Street Interchange revealed that it is surrounded by commercial development. After a preliminary investigation in which test shots were made at several possible camera locations, a site one block from the interchange was selected. A 42-foot portable aluminum tower was then erected at this location. By mounting a 16-mm camera at the top of the tower, as shown in Figure 9, a clear view of the two at-grade intersections could be obtained.
On Aprill8, 1963 the P. M. peak movement from 4:30 to 5:30 was recorded on film. In addition, the off-peak movement from 4:10 to 4:2 5 P. M. was recorded. Due to a stalled vehicle in the interchange, however, a large portion of this film was unusable. As a result, on May 2 8, 1963 the P. M. peak movement from 4:30 to 5:34 was refilmed.
FILM ANALYSIS
Extraction of the data from the films was made possible through~ the use of a Bell & Howell projector. This projector was equipped with a frame counter, forward and reverse speeds 1 and controls for manual operation.
Two types of data were extracted from the films. Those were the travel time for each left-turning vehicle through the cloverleaf and diamond interchanges and volume measurements. This section of the paper then is a description of the methods used in securing the necessary data for each segment of the study.
Travel Time Through the TWo Diamond At-Grade Intersections
The procedure for determining the length of time required for each leftturning vehicle was as follows:
1. The frame at which the vehicle came to a stop outside the first intersection/ or when it crossed the stop line if no stop was required, was recorded as the initial frame':oaunt.
2. The frame at which the vehicle passed a point just outside the second intersection was recorded as the final frame count.
Since the film had been exposed at a rate of 10 frames per second, equation 1 was used to determine the travel time for each left turning vehicle. In addition, the queue position of each vehicle was recorded.
Final Frame Count - Initial Frame Count (1) Travel Time = 10 Frames/Sec.
: .. .
18

PORTABLE TOWER USED IN FILMING TRAFFIC
FIGURE 9

Travel Time on the Diamond Ramp
The procedure for determining the length of the time required for each vehicle using the ramp was as follows:
1. The frame at which a vehicle passed a point at the ramp entrance was recorded as the initial fram:e count.
2. The fu'ame at which a vehicle pas sed a point at the end of the acceleration lane was recorded as the final frame count.
Usfng:eguation 1 the travel time for each vehicle could then be determined.
'!'ravel Time on the Cloverleaf Loop
The procedure for determining the length of time required for each leftt\.lrning vehicle was as follows:
1. The frame at which the vehicle entered the loop was recorded as the initial frame count.
2. The frame at which the vehicle passed point 2 in Figure 8 was recorded as the final frame count.
Using equation 1 the travel time for each vehicle could then be determined.
- Ramp and Loop Capacities
In determining when the loop and ramp were operating at or near capacity for a time interval of one minute, the following criteria were used:
1. If stack-up was occurring on the loop or ramp throughout the time interv<;1l, the loop or ramp was considered to be operating at or near capacity.
2. If little or no stack-up was occurring on the loop or ramp but headways were at a minimum throughout the time interval, the loop or ramp was considered to be operating at or near capacity.
Using the above-mentioned criteria the number of vehicles in the outside lane of the freeway and the number of vehicles exiting from the ramp or loop were recorded in one minute intervals.
Cycle Lengths
Because of the camera position, it was impossible to see clearly any signal face at either of the two diamond at-grade intersections. As a result the frame, in which the first vehicle in the queue on the southbound off-ramp began to move, was recorded as the beginning of a new cycle.
20
Volume Measurements at the Two At-Grade Intersections of the Diamond
Volumes on each of the four approaches were recorded both as vehicles per minute and ve.hicles per cycle.
ANALYSIS OF DATA
Ramp Capacity
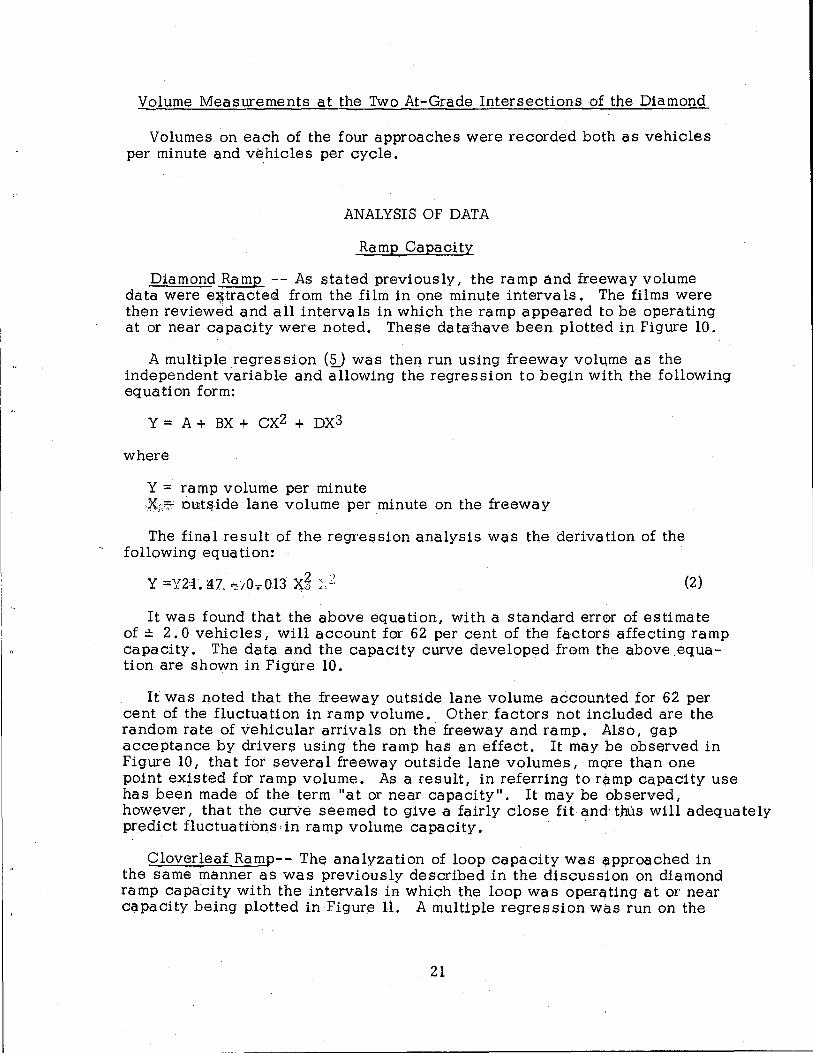
Diamond Ramp --As stated previously/ the ramp and freeway volume data were e~tracteO. from the film in one minute intervals. The films were then reviewed and all intervals in which the ramp appeared to be operating at or near capacity were noted. These dataillave been plotted in Figure 10.
A multiple regression (§_) was the:n. run using freeway volqme as the independent variable and allowing the regression to begin with the following equation form:
Y = A + BX + cx2 + DX3
where
Y = ramp volume per minute ~;;"F out~ide lane volume per minute on the freeway
The final result of the regression analysis was the derivation of the following equation:
v· · ·. . ·. 2 ,.) Y ""J.2:.:!.47."7:t0.013 X";:·· (2)
It was found that the above equation/ with a standard error of estimate of ± 2. 0 vehicles I will account for 62 per cent of the factors affecting ramp capacity. The data and the capacity curve developed from the above equation are shown in Figure 10.
It was noted that the freeway outside lane volume accounted for 62 per cent of the fluctuation in ramp volume. Other factors not included are the random rate of vehicular arrivals on the freeway and ramp. Also 1 gap acceptance by drivers using the ramp has an effect. It may be observed in Figure 10, that for several freeway outside lane volumes I more than one point existed for ramp volume. As a result/ in referring to ramp capacity use has been made of the term "at or near capacity". It may be observed/ however I that the curve seemed to give a fairly close fit and· tluis will adequately predict fluctuati'ons ·in ramp volume capacity.
Cloverleaf Ramp-- The analyzation of loop capacity was approached in the same manner as was previously described in the discussion on diamond ramp capacity with the intervals in which the loop was operqting at or near capacity being plotted in Figure 11. A multiple regression was run on the
21

i (~
i I
30~----------------------------------------~
25
20
~ 0.. ~ w ~ 15 ...J 0 > 0.. :: <t 0:::
10
5
0
• • • •
5 10 15 20 25
FREEWAY VOLUME (VPM)
PLOT OF OUTSIDE FREEWAY LANE VOLUME VERSUS DIAMOND ON-RAMP
VOLUME AT OR NEAR CAPACITY FIGURE 10
30

----------
25
20
-~ 0.. 15 > -
5
0
•
•
5 10 15 20
FREEWAY LANE VOLUME (VPM)
PLOT OF OUTSIDE FREEWAY LANE VOLUME VERSUS CLOVERLEAF LOOP
VOLUME AT OR NEAR CAPACITY FIGURE 11·
25

data with the following equation being derived:
Y == 16. as - o. 012 x2
where
X::: !freeway volume in the outside lane of the freeway Y == loop volume at or near capacity.
(3)
The above equation, with a standard error of estimate of ±1. 62 vehicles, accounted for 60 per cent of the factors influencing the fluctuations in loop capacity.
Using equation 3 the loop ramp capacity curve, sh'OWn in Figure 11, was plotted.
Again the factors, discussed in the section on diamond ramps conc.erning fluctuations in-ramp volume for a certain freeway volume 1 hold for the cloverleaf loop.
Diamond Interchange Travel Time
'Time Required !.Q_ Travel Through the At-Grade Intersections -- Since one of the study objectives was the determination of the total time required to travel throught the diamond interchange, it was necessary to determine the amount of time required for each left-turning vehicle to travel through the two at-grade intersections. After completing the data extraction, the left-turning vehicles were grouped into consecutive five minute intervals. The total intersection volume was then recorded for each five minute interval.
An attempt was then made to establish correlation between the average travel time for the left-turning vehicles in each interval and the total intersection volume for each interval. With the intersection volume being used as the independent variable a multiple regressi-on was run on the data. However, the resulting equation indicated that only 1~' per cent of the factors affecting travel time could be accounted for.
It was then decided to give consideration to queue position and to relate each queue to its respective signal cycle,. Acc·ordingly, the films were reviewed and the queue position of each l:e{t:.-tmning vehicle was noted. Also the length of each signal cycle was tietermined. (A new cycle was considered to have begun at the beginning of each adjacent frontage road movement. Thus the left-turn movement studied recieved the last phase of each cycle.)
Using cycle length as the independent variable, a multiple regression was run on each queue position. The results of the regressions are listed in Table 2 in equation form and by queue position.

The resulting curves for each queue position as related to cycle length are shown in Figure 12. It may be noted that no curves are shown for:aD¥r"-' queue position higher than 10. This was due to insufficient data.
Queue Position
1 2 3 4 s 6 7 8 9
10
TABLE 2 Standard Error
Q~:· :&~lti!P!:'tt~; Equation (Sec.) .R;z
Y = 9 • 4 8 + 0 • 9 0 9 5 (X) ± 9 • 7 4 Y = 24.75 + o. 0051 (x)2 ± 9. 95 Y = 41.55 + 1.1364 (X)
2 ±14.35
Y = 9.16 + 0.0056 (X) ±15. 74 Y = 63.13 + 1. 2047 (X)
2 #8. 78
Y = 14.48 + 0. 0060 (X) 2
:±:20.10 Y = 12 • 91 + 0 • 0 0 6 0 (X) ±21. 59 Y= 123.36 + 0.0386 (X)2- 0.0002::(¥}3 ±21.47 Y = 9. 4 6 ..,. 0. 0 0 4 6 (X) 2 . =J:2 2 • 17 y;;;; 10.90 .f. 0.00002 (X)3 . ±23.30
where X.= cycle length
.fi£ ,;. trave 1 time
0.64 0.69 0.63 0.49 0.45 0.50 0.42 0.31 0.22 0.21
(4) (5) (6) (7) (8) (9) (10) (ll) (12) (13)
Observation of the curves reveals that travel time was highest for queue position one and then decreases for each queue position. Since the measurement of total travel time began when a vehicle came to a stop outside the intersection, it was e,?Cpected that the amount of time spent waiting at the firJSt intersection would decrease with queue position due to the first arriving vehicle having to w~it a longer time before receiving the green phase. Once the queue began moving the difference in travel times between the individual queue positions was small.
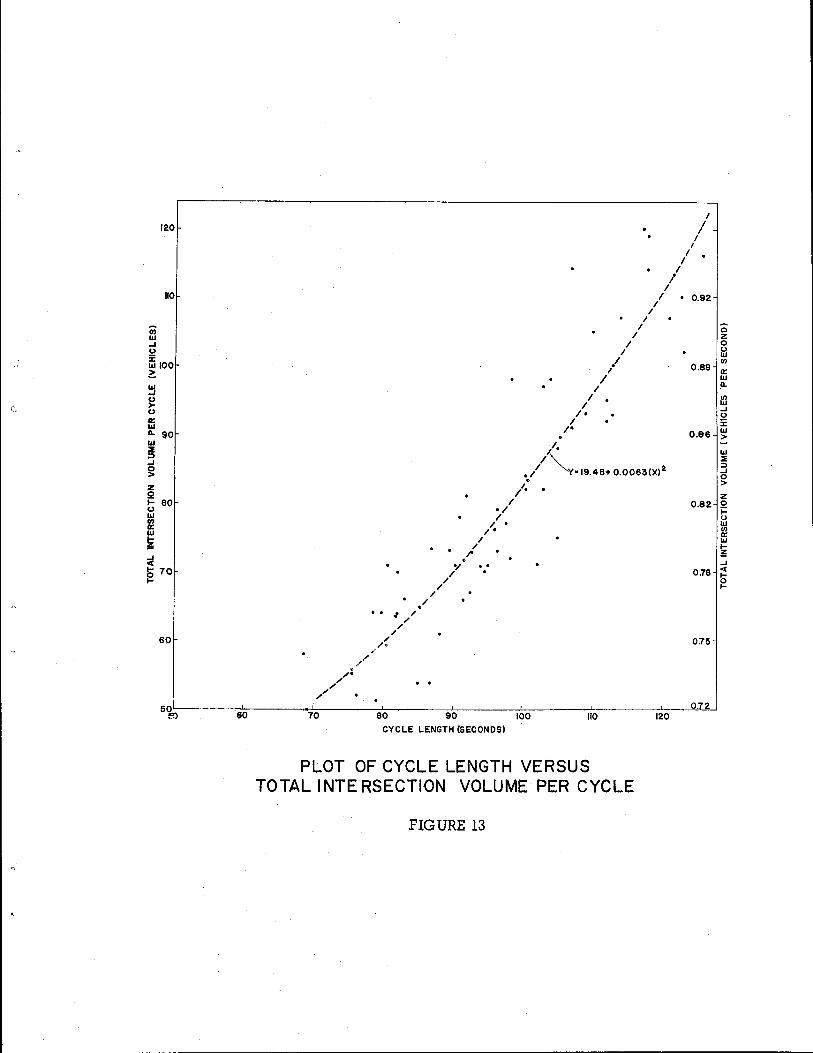
The cycle length of a volume-density controller is to a great extent determined by the. total intersection volume demand. Since the travel time curves shown in Figure 12 are related to cycle length, it was necessary to develop a relationship between total intersection volume per cycle and cycle length. Using the cycle length as the independent variable, the following equation was derived.
y = 19. 48 + 0. 0063 x2
where
Y = total intersection volume per cycle X ::::: cycle length
(14)

~u J~J.J ~ 1 \ \ ', \ " \ \ \ \ \\ \ \\ \ ,, \ ,, \ \ .,, \ ,, \ ,,, \ \. ,, \
\\ \ \ \ \ \ ,, \ \ \ . \ \
\. \ \ . \ \ ,, . . \. \ \ \ \ ,, \ \ \ ·, \. ', \ \\ \
\ \ \ \ \ \ \ ,, \
''·' \ \'.\ ,, \ \ \ \ \ \ \ ,, \ \ \ \ \ \ \ \ ,, \ \ \ \ \ \ \ \ ,, \ \ \ \ \ \ \ \ ,, .
\ \ \ \ \ ,, \ \ \ \ \ \ \ \ ,, \ \ \ \ \ ' \ \\ \ \ \ ' \ \ \\ \\\ \ ' ' \ \ \ \ \\ \
\ . \ \ ' \ \ ' \ \ \ \ \\ \ \ \ \ ·• \ . ,, \ . . \ \ \ \ \ ,, .
\ \ \ \ \ \ \ \\ \ \ \ \ \ \ \\ ,,, \ \ \ \ \ ''"' \ \ \ \ \ . '"' \ \ \ \ \ \ '"' . \ \ \ \ \ ,, ,, ''''I \ \ \\ \ 't , ' . '- \ '-v' \ \ \ . ... \
\\ ,, \ •\ ,, ,, \ ,, \ \ \ \ \ \ \ \ \ \ \ \ \ \ \\ \ . . .. . .
\ \ \ \ \ \
0 ..,
0
"'
...... Cl)
0
0:
0~ :;l~ o en · -o o en ~ ~ frl 2 en :J: I UJ
:J: > 1- I
0~ Ol ~ Ol UJ 1'-: :::::1
...1 0...1 UJ 0 ...1 >
0 Cl)
0 ......
~ g ~ i= 0
<OUJ ,.._en .0:
OUJ .... ~
~J_--------~--------~--------~--------~L-------~~ 0 0 0 0 0 Q Cl) <0 "" "'
(SON0:>3S) 3Wil 13Ait~l
g
<0 Ol
0: I')UJ CI)D..
en UJ ...1 2 :J: UJ > .1
;:::~ ...1
~ z Q .... 0
~ -0: <OUJ .... ~ -
- _____________________________________________ ___J

The -above equation with a standard error of estimate of :1: 7. 79 vehicles per cycle accounted for 86 per cent of the factors influencing intersection volume per cycle.
Using equation 14, a curve for cycle length versus intersection volume was determined and is shawn in Figure 13 along with the actual data. Also shown is the intersection volume in vehicles per second.
Use of the curves shown in Figures 12 and 13 may be as follows:
1. Given a total intersection volume for a time interval, use the curve in Figure 13 to determine cycle length.
2. Given the total left turn movement for a time interval and knowing the cycle length, determine the number of left turning vehicles per cycle.
3. Knowing the number of left turning vehicles per cycle, use the queue position curves in Figure 12 to determine the travel time for each queue position.
4. An ·average travel time may then be determined by summing the individual travel times and dividing by the total number of individual travel times.
An analysis of the curve i;rillfigure 13 revealed that as the· cycle length became longer, the intersection volume in vehicles per second became higher. Thu.s, the signal system at the study site was not operating at maxl.ml!ltm efficiency as suggested by Pinnell (4J. According to Pinnell, (!_) maximum e,fficiency should be developed at a short (approximately 50 to 80 seconds)' cycle length~ This was the only indication that the signal system was operating at less than maximum efficiency. The overlapping of signal phases ,j.. e., the movement of traffic from two approaches through the intersection at the same time, requires a set amount of time regardless of cycle length. Since the flow of vehicles through the intersection is at a maximum during the phase overlap sequences, maximum capacity of the diamond at-grade intersections is attained when the highest ratio of phase overlap time,{to cycle length has been attained.
It was desirable to develop an equation for a weighted average travel time based on cycle length and expected queue length to replace the family of curves .shown in Figure 12 for each queue position, since the use of these curves is quite time consuming. To do this, it was first necessary to determine the probabilities of various queue lengths in the instde lane of the arterial. Since queue length depended to some extent on ·cycle length, the cy,o.les observed were grouped as follows:
Group A -- 7 0 to 90 second cycle lengths Group B -- 90 tp llO second cycle lengths Group C -- llO to 13 0+ second cycle lengths
Queue lengths for the 66 cycles observed were counted and placed into one of the three groups ao~ording to their respective pycle lengths.
(,
120
110
(ij 11.1 ...J 0
ffi1oo ~ ... ..J 0 >-0 a: ... 11. 90 ... ::IE ;:) ..J 0 > z Q 1- eo 0 ... &! ... ~ ...J <[
b 70 ....
60 / /•
"
I// /
"
. / /
/
•/ /
/ . t•
I I ,. .
y ·: //
/
. / I"
I
ll I
II • I•
I I
I I
I
I I
I /
I
I I
I
/
/ • 0.92 I
Q z 0 0 11.1 VI
0.89 a: 11.1 11.
13 ...J 0 :I:
0.86 ~ 1.1.
•• /1
""-Y•I9.48+ 0.0063(X) 2
I'· .
11.1 ::E
3 0 > z
0.82 ~ 0 11.1
&! 11.1
i ...J
0.78 g 1-
0.75
50L__------c-:f::-----&-----::'::------='=-------:-'':-:--------:"::--------:~--"'-0.,__72"-' m ~ ro ~ oo ~ oo ~
CYCLE LENGTH (SECONDS)
PLOT OF CYCLE LENGTH VERSUS TOTAL INTERSECTION VOLUME PER CYCLE
FIGURE 13

The probabilities of various queue lengths occurring in each cycle group were then determined. Since the travel time data was insufficient for queue positions greater than 10, it was necessary to group all queues of 10 vehicles or more into one probability. A summation of the probabilities resulted in the expected length of queue for each of the three groups.
To obtain a Weighted average travel time for any cycle observed, use was made of the following procedure:
1. For the cycle length under consideration, determine the average travel time for each queue position through the use of Figure 12.
2. Multiply the average travel time for each queue position by the probability of having a vehicle in that queue position and sum as follows:
10 l. p (>i) (Travel Time) (15)
i=:l
3. The weighted average travel time for each cycle is determined by using 1
10 L P~'ti) (Travel Time)
Weighted average travel time= _1::,..==-.,.:1;:.;.. _________ _
10 (16)
I P(>i)
i=l
Weighted average travel times were detGmmined for each cycle and have been plotted in Figure 14. A multiple regression was then run with the following equation being derived.
Y = - 3 2 • 3 0 + 0 • 9 31 (X)
where
Y = weighted average travel time X = cycle length
(17)
Using equation 17 I the curve shown in Figure 14 was plotted. Equation 18, with a multiple correlation coefficient ·of 0. 99 1 had a standard error of estimate of 1. 39 seconds.
Diamond Ramp Travel Time
It has been noted in the section on ramp capacity that the ramp capacity fluctuates with a change in freeway lane volume. As a result, when the
?.9

LIJ z 1-..J
80
70
LIJ 60 ~ a: 1-
~ a: ~ C( 50 0 LIJ 1-:x: !,2 LIJ 31:
40
30~------~------~--------~------~--------~------~--~ 60 70
0.73
51
80 90 100 110 (CYCLE LENGTH- SECONDS)
0.76 0.79 0.83 0.87 (INTERSECTION VOLUME-VEHICLES PER SECOND)
61 71 83 96 (INTERSECTION VOLUME- VEHICLES PER CYCLE)
PLOT OF WEIGHTED AVERAGE TRAVEL TIME FOR INSIDE LANE OR LEFT TURN LANE QUEUES
FIGURE 14
120
0.92
110

traffic demand approaches or exceeds this capacity a certain amount of delay may be expected for ramp traffic.
Data were taken from the Griggs Road :Ramp films in one minute intervals with an average delay for each.ramp vehicle being determined for each minute interval. The results are shown in Figure 15.
Due to a limited amount of data a multiple regression approach proved futile. As a result, the curves showh in Figure 15 are at best estimates of delay. However, it is felt that these ranges are fairly accurate as may be observed by the plotted points.
Also, it should be noted that these curves represent delay only, and not total travel time. To use these curves in the determination of total travel time it would first be necessary to determine the average travel time for ramp vehicles under free flow conditions. Total travel time could then be determined for a specific ramp and freeway volume by adding the delay derived_- from Figure 15 to the average travel time. To insure coverage of all ramp vehicles the average travel time should be determined over the entire ramp length. In the analysis of the Griggs Road Ramp P'ata, the average travel time with no delay was found to be 13. 4 seconds.
Cloverleaf Loop Travel Time
In order to evaluate the time required for a vehicle to make the turning maneuver from the arterial street to the freeway via a loop ramp, it was necessary to identify those factors which exerted some amount of influence on the required travel time. These three factors are as follows:
1. Rate of flow of traffic in the outside lane of the freeway, 2. Rate of flow of traffic entering the loop, 3. Loop radius.
Since the vehicles using the loop must merge with the outside lane of the freeway, the capacity of the weaving section becomes very important in any analysis. Since the freeway vehicles have the right of way in the merging area, it maybe expected that travel time on the loop increases with an increase in the outside freeway lane volume. This is due to a reduction of acceptable gaps in which to merge and a reduction in the loop capacity. This has been sh'own in Figure 11.
When the rate of flow into the loop exceeds the loop capacity, stack-up occurs. Therefore, stack-up, or the vehicles already in the loop, exerts some influence on travel time. The radius of the loop studied W<;iS 100 feet. Under free flow conditions, travel time on the loop was found td be an average of approximately 22 seconds.
As a result, the outside freeway lane volumes, the corresponding loop volumes, individual travel times for loop vehicles, and accumulation of

15, ' ' 5.2 ........ . ........
'
' 13.2
'
'
. '
'
' '
' '
' ' 8
05 '
' ' ' ' ' ' ' ' '
' '
10 )-
' '
1.9
' 1.5 '
. "
e '
• ' ' '
! '
'\
'-!~·8
w
' ' 4.5
\
~
'\ '
::::>
. \
..J
'\
\
0
\
>
' 4.9\
Q.
" . \
\
~
' 1.6
1.8 \
<1:
. 1.3 \
.
a:
\
\
. \ 2.4
11.6
" ,.
\
'
\
51-
\
\ \
\
\ \
\ \
\ 12.8 \
~~9
\ . \
\
\
\
\
\
\
\
\
\
\
\ 6 10 \'2. 5e.coNos
\ 0 10 6 se.coNtiS \
t>.'IE~j>.GE oE\.t>.'l I
~>.'IE~~>.GE oE\.t>.'l
I
\ I
\
\ \
I
\
I I
0o 5 10 15 20
FREEWAY VOLUME (vpm)
AVERAGE DELAY ON DIAMOND RAMP
FIGURE 15

stack-up were removed from the film on a per minute basis.
A multiple regression was then run on the collected data. This regression produced the following equation:
Y = 26.68- 0. 8758(Vl) + 0. 079(V1)2 + 2. 448(s) (18)
where
Y = average travel time (sec.) V1= freeway outside lane volume (vpm) s = accumulation of vehicles on the loop at the end of the previous
i:ninute
The regression indicated that the above equation would account for approximately 67 per cent of the factors influencing loop travel time. It should be noted that loop volume affects loop travel time through the accumulation. of vehicles on the loop. ·
Using the above equation, a family of ·curves to determine loop travel time was developed and is shown in Figure 16. Use of these curves I by necessity (because of stack-up accumulations) 1 becomes an interative procedure. This procedure is as follows:
1. Determine rate of flow in outside freeway lane (vpm). 2. Determine rate of flow into loop (vpm). 3. Consult Figure ll to determine if the loop capacity has been exceeded. 4. The number of vehicles by which the loop capacity has been exceeded
plus any stack-up not cleared from previous minutes is the amount of stack-up at the end of each minute.
5. Using the appropriate stack-up CC!Urve the average travel time is de-termined for that minute. ·
6. The procedure is then repeated for the length of the study period.
DISCUSSION OF RESULTS
As stated previously in the Introduction, the two objectives were a comparison of the conventional diamond and cloverleaf interchanges with respect to the travel time required for the left turn movement from the arterial to the freeway and ramp capacity. This chapter is a discussion of the results obtained in the two areas.
Ramp Capacity
It was found pneyiliou's:.:hystpact ramp and loop capacity is a function of the
33 ..._, ~·

0 LIJ !!!.
160
140
120
0.100 0 0 ..J
I.L <1: LIJ ..J ffi eo > 0 ..J (.)
z 0
~ 60 j:::
40
20
PROCEDURE FOR USING CURVES!
KNOWING LOOP 8 FREEWAY OUTSIDE LANE VOLUMES, CONSULT FIG. TO DETERMINE IF RAMP CAPACITY HAS BEEN EXCEEDED. IF SO STACKUP EQUALS NUMBER ABOVE CAPACITY. USING THE APPROIATE STACKUP CURVE THE AVERAGE TRAVEL TIME FOR THE NEXT LOOP VOLUME CAN BE DETERMINED.
TRAVEL TIME• 26.167- 0.7218 (FREEWAY LANE VOLUME)+ 0.07304 (FREEWAY LANE VOLUME)+ 2.271 (STACKUP)
0 o 10 20 30 40 RATE OF FLOW IN OUTSIDE LANE OF FREEWAY (vpm)
PLOT OF FREEWAY RATE OF FLOW IN OUTSIDE LANE VERSUS LOOP
TRAVEL TIME
FIGURE 16

rate of flow of vehicles in the outside or merge lane of the freeway and ramp design. Since the freeway traffic has the right of way, the capacities of the loop and ramp were found 3:o decrease as the freeway traffic in the outside lane increased. Using a multiple regres.sion analysis, equations were derived for the fluctuation in ramp capacity. The resultant curves are shown in Figure 17.
An analysiS of the tWio 'curves shown in Figure 17 revealed that the diamond ramp had a capacity of approximately five more vehicles per minute throughout the range of freeway lane volumes observed. Expansion of this value to one hour revealed that the diamond ramp could accommodate approximately 300 more vehicles per hour when both the ramp and loop were operating at or near their respective capacities. '_['he higher capacity may be attributed to several factors.
It may be observed in Figure 8 that a portion of the acceleration lane for the cloverleaf loop also. serves as a deceleration lane for vehicles leaving the freeway. Thus, a good type acceleration lane as recommended in previous studies, (~) and (§_), was not provided. Since the effective acceleration lane was shortened, a more direct entry into the freeway traffic stream was required. This caused the difference in speed between freeway and loop traffic to be higher and thus led to stop and go operation on the loop at a lower freeway rate of flow of vehicles in the outside lane.
Due to the loop radius being only 100 feet, the angle of mergence between loop and freeway was higher than that of the diamond ramp. This also caused the difference in speed between loop and freeway traffic to be higher. ·
Interchange Travel Time
ItJwas found pu.eXi'liousi1ystpat,ltravrel. time foritlne::JefL:tiJ.Jlrn~mov.emenbth throught the two at-grade intersections of the diamond interchange is a function of the total intersection volume and the queue length probabilities for the inside lane/ i.e. , the lane from which the left turn movement was made. Once the vehicles had passed through the at-grade intersections, delay on the ramp was a function of the freeway rate of flow of vehicles in the outside lane.
A multiple regression analysis was made on the left turn movement by queue position with the resultant curves being shown in Figure 12. The queue length _;probabilities for various cycle lengths were de,termined, which resulted in the weighted average travel time curve sh1Z:mn in Figure 14. Since this curve is a function of the inside lane queue lengths and the total intersection volume at the Berry Street Interchange, direct application should be restricted to this interchange.
A comparison of the cycle length curve shown in Figure 13 with that shown in Pinnell and Capelle~s study (~) revealed that the cycle lengths were too long due to not obtaining good phase overlap operation. As a result, the signal system at the Berry Street Interchange was operating at less than maximum efficiency at the time of the study .
. 35J

30
25
20
10
5
0
--\:
5
------........ ........ CLOVERLEAF RAMP ......... ,,
DIAMOND RAMP
...... ............
...... , ..... , ',
..... ,
10 15 20
FREEWAY OUTSIDE LANE VOLUME (VPM)
25
COMPARISON OF RAMP CAPACITIES FOR DIAMOND AND CLOVERLEAF INTERCHANGES
FIGURE 17
30

~----------------------------
Travel time on the cloverleaf for the left turn movement was found to be a function of the outside freeway lane rate of flow and the rate of flow of left turning vehicles, l• .§.., vehicles entering the loop. bue to its design, travel time on the cloverleaf is not a function of total intersection volume.
A multiple regression analysis yielded an equation which resulted in the family of curves shown in Figure 16. It is felt that these curves may be applied to other cloverleaf interchanges with similar characteristics.
Following are two examples of the use of the travel time curves, with the respective left turn movement for the diamond and cloverleaf interchanges being shown in Figure 18. A length of 100 feet with a speed of 20 miles per hour was assumed for the distance from the second at-grade intersection to the ramp entrance for the diamond. A speed of 30 miles per hour was assumed on the cloverleaf from the point of mergence with the freeway traffic to a point downstream which would be commensurate with the end of the diamond ramp acceleration lane. This· distance was estimated to be 600 feet. Total intersection volume used in the following examples is the sum of the volumes on the four approaches as shown in the following sketch.
II It I Example No. 1
Given: Total intersection volume -- 270 veh. per 5 min. Total Arterial left turn volume from one approach -- 50 veh. per min. Rate .of flow in outside freeway lane -- 20 veh. per min.
Travel time computations for each type interchange.
{1) Diamond:
(a) At-grade intersections: Total intersection volume= 270 = 0. 9 veh./sec.
300 . Weighted average travel time = 76 sec. (Figure 14)
37

ARTERIAL
I
t1 I I I
ii I I
, I I I
m I I
'· I i' I !. I , I ,, I =· I f.. I ::- I
I I
r I I I I
I I I I I I I I
~ I\\ ~- ~~\ w I ' If I \
600'
\ \...l\f--1 +-----J-
1 I I I
' I I I~ I I I
100'
DIAMOND AND CLOVERLEAF LEFT-TURN MOVEMENTS
FIGURE 18
STREET

(b) Ramp: Delay= 12 sec. (Figure 15) Total ramp travel time = 13. 4 + 12 = 2 5. 4 sec.
(c) Travel time from at-grade inten;;ection to ramp entrance= 100/29.4 = 3. 4 sec.
Total t'ravel time = 76 + 25.4 + 3. 4 = 105 sec.
(2) Cloverleaf: Travel time from 250 feet back of loop entrance to loop entrance -(2 50/29. 4) = 8. 5 sec. Loop travel time -- 41 sec. (Figure 16) Freeway travel time to a point comparable in distance to end of diamond acceleration lane (600/ 44) = 13. 6 sec.
Total travel time on loop= 8. 5 + 41 + 13. 6 "" 63 sec.
Example No. 2
Given: Total intersection volume -- 220 veh. per 5 min. Total left turn volume -- 50 veh. per 5 min. Rate of flow in outside freeway lane -- 20 veh. per min.
Travel time computations for each type interchange
(1) Diamond:
(a) At-grade intersections: Total intersection volume= 220 = 0. 734 veh./sec.
300 Weighted average travel time = 34 sec. (Figure 14)
(b) Ramp: Delay= 12 sec. (Figure 15) Total ramp travel time= 13.4 + 12 = 25.4 sec,
(c) Travel time from at-grade intersection to ramp entrance= 100/29.4 = 3.4 sec.
Total travel time= 34 + 25.4 + 3.4 = 63 sec.
(2) Cloverleaf:
Same travel time as in example no. 1 (63 sec.) since travel time on the clover leaf is not affected by a change in intersection volume.
39

An analysis of the two examples revealed that when the total intersection volume exceeded approximately 220 vehicles during a five -minute interval, the cloverleaf loop provided the shorter travel time. While both examples used a rate of flow of 20 vehicles per minute in the outside lane of the freeway, a review of the curves indica ted a change in the freeway rate of flow would have about the same effect on both the diamond and cloverleaf. Therefore, it was concluded that the figure of 220 vehicles per fiveminute interval would hold true for a left turn movement of 50 vehicles or less during a five-minute interval.
Left turn volume data collected at the Berry Street and Loop 12 interchanges have been grouped in 5-minute intervals and are listed in Tables 5 and 6 respectively. A review of the data listed in Table 5 indicated that travel time curves for left turn volumes in excess of 10 vehicles per minute could not be derived from the collectecl ~ata, The capacity curve for the cloverleaf loop ramp (Figure 11) indicates that the loop was capable of handling a ramp volume of 10 vehicles per minute throughout the range of freeway volumes observed. As a result, no example could be given for a :left turn volume which would exceed the loop ramp capacity.
CONOLUS1CONS ANI!XRD.(:;.OMtMEND..ATIONS.. l' !_ • ·
Conclusions
The conclusions, reached as a result of a comparative study of a conventional diamond interchange and a conventional cloverleaf interchange, were as follows:
1. The diamond and cloverleaf ramp capacities were a function of the rate of flow of vehicles in the outside lane of the freeway. Thus the ramp capacities could be predicted through the use of derived equations which utilized the rate of flow in the outside lane of the freeway as the independent variable.
2. The average amount of time required for vehicles to complete the left turn movement using a cloverleaf loop ramp was a function of the left turn vehicular demand and rate of flow in the outside lane of the freeway. Thus vehicular tr9vel time on the loop ramp could be predicted by an equation utilizing these variables.
3. The average amount of time required for vehicles to complete the left turn movement through the diamond at-grade intersections was a function of the total intersection volume 1 spacing of the two atgrade intersections I and cycle length.
4. The capacity of the diamond ramp was approximately 5 vehicles per minute higher than that of the cloverleaf ramp throughout the observed range of rates of flow on the outside lane of the freeway.

5. For a total intersection volume of 220 vehicles or less per 5 minutes and a total left turn volume, from one arterial approach, of 50 vehicles or less per 5 minutes, the average travel time for the arterial left turn movement was shorter on the diamond interchange.
6. For a total intersection volume greater than 220 vehicles per 5 minutes and a total left turn volume, from one .arterial approach, of 50 vehicles or less per 5 minutes, the average travel time for the arterial left turn movement was shorter on the cloverleilf interchange.
7. A theoretical study concerning the use of phase overlap signal operation to maximize at-grade intersection capacity (f) stated that maximum capacity efficiency should be obtained when using a cycle length in the range of 50-80 seconds duration. The cycle lengths observed at the at-grade intersection studied, however, were longer than 80 seconds. As a result, it may be (concludeGLthlat Jhe s;ign system at the study site was not operating at maximum efficiency.
It may also be concluded that the weighted average travel times L ,ofythe left turn arterial movements (Figure 15) are higher than might
be expected at at-grade intersections where maximum capacity was being obtained.
It should be noted that the foregoing conclusions are the res,ult of a comparative study of specific sites only. As a result, general conclusions based on the conclusions reached in this study are as follows:
1. The cloverleaf interchange studied appeared to be operating at or near maximum efficiency. Therefore, the travel time curves (Figure 16) derived from the collected data should be a good indication of travel time for cloverleaf interchanges with similar characteristics.
2. The capacity curves derived for the diamond and cloverleaf ramps studied should be a good indication of the capacity limitations of ramps with similar geometries.
Recommendations
Since the signal system of the diamond interchange studied was operating at less than maximum efficiency r it is recommended that further study is needed at a diamond interchange which is making maximum use of the phase overlap technique. The study procedure used in this study may be used. However, it is recommended that an inter:sive preliminary investigation be made of the interchange to ascertain the following:
1. Good phase overlap operation, as suggested by Pinnell <V, is being employed.
2. The peak left turn movement is greater than 50 vehicles per 5 minutes.
It is recommended that further research be initiated for cloverleaf interchanges with a loop radiuSi: in excess of 100 feet to determine what effect loop radius has on loop travel time and capacity. The study procedure used in this study may be used.
41

,.:
This study was concerned with the operational aspects of the conventional diamond and cloverleaf interchanges only. There appears to be two other important areas of consideration. They are as follows:
1. The construction and maintenance costs of each type. 2., The ability to modify each type to increase capacity after the inter
change has been constructed.
It is recommended that research be completed in these areas before specific warrants are developed for th~ use of each type 9f interchange.
42·

AP.:PEjN DIX

TABLE 3
A UST OF AGENCIES RECEIVING AND COMIPLETIN<S QUESTfONNAIRER :,
Agency
1. States
California Florida Georgia Illinois Kansas Michigan Missouri New York North Carolina Ohio Oregon Washington
2. Bureau of Public Roads
Region 1 Region 2 Region 3 · Region 4 Region 5 Region 6 Region 7 Region 8 Region 9 Washington Office
3. Consulting Firms
,_; DeLLe,uw,. :mather\& .Co. Wilbur Smith & Associates Howard, Needles, Tammen & Bergendoff E. A. Barton & Associates Harland Bartholomew & Associates
4.4
\Completed
c
X
X X
X
X X
X X
X X
X
X
X
X
~ X X X X
X X X

TABLE 4
RECORDED VOLUMES BY APPROACH AT BERRY STREET INTERCHANGE I FT I WORTH I TEXAS
5-MINUTE INTERVALS
April18 1 1963 k\pproach
Time 1 2 3 4
4:10-4:15 p. M I 39 68 70 68 4:15-4:20 27 83 58 83 4:20-4:25 14 79 66 79 4:30-4:35 31 47 53 72 4:35-4:40 33 80 86 76 4:40-4:45 35 97 72 71
.. 4:45-4:50 25 64 72 89
May 28, 1963 Approach
Time 1 2 3 4
4:30-4:35 P.M. 37 63 64 80 4:35-4:40 31 63 87 62 4:40-4:45 40 66 100 76 4:45-4:50 25 76 87 68 4:50-4:55 22 54 96 81 4:55-5:00 22 67 71 61 5:00-5:05 25 57 49 86 5:05-5:10 24 78 94 79 5:10-5:15 25 82 68 104 5:15-5:20 33 87 .111 . 69 5:20-5:25 26 77 99 87 5:25-5:30 24 90 74 85
45

TABLE 5
RECORDED LEFT TURN VOLUMES ON STUDY APPROACH AT BERRY STREET INTERCHANGE, FT. WORTH, TEXAS
5- MINUTE INTERVALS
Interval No. No. Left Turning Vehicles Per 5-Minute Interval ••• • ......... 0
1* 2 3 4 5 6 7 8 9
1** 2 3 4 5 6 7 8 9
10 11 12
*First Study ** ~ec·:ond Study
20 . 23
20 22 27 ~5 l2 19 18
24 29 31 39 30 24 16 25 20 32 22 16

TABLE 6
RECORDED VOLUMES OF NORTHWEST LOOP AND OUTSIDE FREEWAY LANE -- NORTH CENTRAL EXPRESSWAY
LOOP 12 INTERCHANGE, DALLAS, TEXAS
Time
7:01-7:05 A.M.* 7:05-7:10 7:10-7:15 7:15-7:20 7:20-7:25 7:25-7:30 7:30-7:34*
Time
6:51-6:55 A.M.* 6:55-7:00 7:00-7:05 7:05-7:10 7:10-7:15 7:15-7:20 7:20-7:25 7:25-7:30 7:30-7:35 7:35-7:40 7:40-7:45 7:45-7:50
* 4-minute interval
5 ~MINUTE INTERVALS
December, 1962 Loop,
35 56 74 73 73 68 58
March, 1963
Loop.
28 39 31 52 73 66 66. 78 63 70 56 49
47
Freeway Outside Lane
32 52 56 61 90 96 77
Freeway Outside Lane
25 35 3.4 47 46 53 59 66 89 95
109 88

. c
A USTING OF QUEUE LENGTHS OBSERVED IN THE IN SIDE LANE FOR THE THREE CYCLE LENGTH GROUPS AT
THE BERRY STREET INTERCHANGE
Group A 70-90 Sec.
a 11 a 6 6 5 3
10 8 5·
10 6
10 9 9 8 6
.5
Cycle Length Groups
Group B 90-110 Sec.
8 12 10 13 10 10· 10 10 9 9
11 11 10 10 9 7 9 9
10 10 lOJ 11 4 9 8 6 9
12 7
Total Number of Cycles Observed= 66
Group C 110-130+ Sec.
12 7
14 17 i9 13 17 9
15 12 16 17 10 15 19 9
13 15 15

<-:
:-,
BIBLIOGRAPHY
1. Leisch, J. E., "Adaptability of Interchange Types on Interstate System/'; ASCE- Proceedin,gs v84 {J Highway Division) n HW1! January,· 1958, paper n 1525, 32·p ..
2. Pinnell, Charles and Capelle, Donald G., "Operational Study of Signalized Diamond Interchanges", Highway Research Board, Bulletin 324, January, 1962, pp. 38-73.
3.
4.
5.
6.
7.
Pinnell, Charles and Keese, Charles J., "Freeway Ramps", Texas Transportation Institute Publication, 1960, pp. 1-11.
Pinnell, Charles, "The Value of Signal Phase Overlap in Signalized Intersection Capacity", Traffic Engineering , Vol. 33, No. 3, December, 1962, pp. 17-20.
Duncan, A. J., Quality Control and Industrial Statistics, Richard D. Irwin, Inc. 1959, Homewood, Illinois.
Fukutone, I., and Moskowitz, K., "Traffic Behavior and On-Ramp Design", HighwayResearchBoard, Bulletin235, 1960, pp. 38-72.
McGregor, Franklin T. , "An Analysis of DiamondVs. Cloverleaf Interchange Design", Graduate Report, The Institute of Transportation and Traffic Engineering, University of California, May 1961, 26 p.
8. Lautzenheiser, Donald W., "'New Concepts for Urban Freeway Interchanges", ASCE - Proceedings v88 {J Highway Division) n HWl, May, 1962, pp. 29-41.
9. A Policy ...QI1 Geometric Design of Rura1Highways ,l:'First Edition,, American Association of State Highway Officials, 1954, pp. 365-4201
•
49