comparative study of the effective parameters on residual
TRANSCRIPT

Mechanics & Industry 21, 505 (2020)© AFM, EDP Sciences 2020https://doi.org/10.1051/meca/2020061
Mechanics&IndustryAvailable online at:
www.mechanics-industry.org
REGULAR ARTICLE
Comparative study of the effective parameters on residual stressrelaxation in welded aluminum plates under cyclic loadingYousef Ghaderi Dehkordi1, Ali Pourkamali Anaraki1,*, and Amir Reza Shahani2
1 Department of Mechanical Engineering, Shahid Rajaee Teacher Training University, 16758-136 Tehran, Iran2 Faculty of Mechanical Engineering, K.N. Toosi University of Technology, 16765-3381 Tehran, Iran
* e-mail:
Received: 27 March 2019 / Accepted: 23 June 2020
Abstract. The prediction of residual stress relaxation is essential to assess the safety of welded components.This paper aims to study the influence of various effective parameters on residual stress relaxation under cyclicloading. In this regard, a 3D finite element modeling is performed to determine the residual stress in weldedaluminum plates. The accuracy of this analysis is verified through experiment. To study the plasticity effect onstress relaxation, two plasticity models are implemented: perfect plasticity and combined isotropic-kinematichardening. Hence, cyclic plasticity characterization of the material is specified by low cycle fatigue tests. It isfound that the perfect plasticity leads to greater stress relaxation. In order to propose an accurate model tocompute the residual stress relaxation, the Taguchi L18 array with four 3-level factors and one 6-level isemployed. Using statistical analysis, the order of factors based on their effect on stress relaxation is determinedas mean stress, stress amplitude, initial residual stress, and number of cycles. In addition, the stress relaxationincreases with an increase in mean stress and stress amplitude.
Keywords: Taguchi / stress relaxation / plasticity / cyclic load / aluminum
1 Introduction
Welding has been widely used in production and repair ofcomponents. Due to high-localized temperature duringwelding and subsequent rapid cooling, the tensile residualstress is developed in and near to the weld area, which cansignificantly reduces the life expectancy of structures [1–3].To extend the service life of engineering structures, thereare different methods to reduce the harmful tensile residualstress, such as the heat treatment [4,5], shot peening [6–8],and mechanical loading [9–23]. However, the weldedstructures tolerate the residual stress as well as the stressresulted by in-service mechanical loads. Therefore, toassess the safety of structures, it is necessary to take intoaccount the residual stress redistribution. It is understoodthat when the total stress exceeds than the local yield stressof material, the residual stress relaxation occurs as a resultof plastic deformation. To predict the plasticity, differentconstitutive models from simple elastic-perfectly plastic tomore complicated rules have been developed. Some studiesused the analytical method for modeling the residual stressrelaxation [9–11]. Such methods typically make somesimplifying assumptions and, as a result, were unable to
accurately model the complexities involved with the 3Dwelding residual stress. Therefore, numerical method basedon the finite element (FE) analysis has been developed.Yi and Lee [12] carried out the FE analysis to evaluate theresidual stress relaxation in the steel welded plates undercyclic load. They considered the stress relaxation only onthe axial direction. Moreover, they did not taken intoaccount the material hardening. Barsoum [13], andKatsuyama and Onizawa [14] also studied the weldingresidual stress relaxation without cyclic plasticity model-ing. They performed FE analysis based on the elastic-perfectly plastic behavior. Since these studies did notconsider the cyclic plasticity hardening, the residual stressstate was not accurately predicted. Katsuyama et al. [15]considered a bilinear stress–strain equation with linearkinematic hardening to study the welding residual stressrelaxation under repeated loading. They observed that thehigher loading caused the greater relaxation. Dattomaet al. [16] assumed the isotropic hardening behavior topredict the stress relaxation. They concluded that thestress relaxation occurs only in the first cycle. Their resultsrevealed that the stress relaxation depends not only on theload amplitude but also on the load direction. Qian et al.[17] showed that the different types of steel exhibited verydifferent residual stress relaxation behavior. Gannon et al.[18] used the constitutive model combined of perfectly

Table 1. Parameters of the welding process.
Current-AC(A)
Voltage(V)
Speed(mms−1)
Shieldedgas
170 10 1.6 Argon
Fig. 1. Temperature-dependent properties of material.
Fig. 2. Specimen geometry of high temperature tensile test [25].
2 Y. Ghaderi Dehkordi et al.: Mechanics & Industry 21, 505 (2020)
plastic behavior and the kinematic hardening model.They concluded that for shipbuilding steel, the kinematichardening has a little influence on stress relaxation.They also showed that the residual stress reduction occursentirely during the first cycle if the magnitude of the cyclicload is not subsequently exceeded. Cho and Lee [19] studiedthe interaction between the residual stress and cyclicloading in a welded steel pipe. They proposed a kinematichardening model [20] to take into account the cyclic plasticstrain. Their simulation indicated that the stress relaxationdepends on the direction and magnitude of external load.Xie et al. [21] proposed a model to predict the residualstress relaxation in the welded plates based on theexperimental and FE results. They used the combinedisotropic and kinematic hardening in the constitutivemodel. Farajian et al. [22,23] measured the initial andrelaxed residual stresses in the welded plates under cyclicload by means of X-ray method. They concluded that thestress relaxation occurs at the first loading cycle when thevon Mises stress exceeds than the monotonic yieldstrength.
It is clear that the welding residual stress relaxation isa complex phenomenon, which depends upon a wide rangeof variables. Further, experimental design is a usefulmethod to identify the effective parameters and theirimpacts on response variable. In this study, experimentaldesign is done to study the characteristics of weldingresidual stress relaxation under cyclic load. First, a 3D FEmodel is developed to predict the initial residual stress.Moreover, to validate the model, the predicted residualstress was compared with the experimental result.Subsequently, the analysis is developed to apply the cyclicload, with various amplitudes and cycle numbers. Thestress relaxation is highly dependent on the plasticity,particularly inmetals that show strain hardening. To studythe plasticity behavior on stress relaxation, two differentmodels are used: (1) perfect plasticity, and (2) combinednonlinear isotropic-kinematic hardening. Hence, cyclicplasticity characterization of the material is specified bylow cycle fatigue tests. In order to provide a simpleanalytical model for prediction the stress relaxation, theTaguchi L18 array with one 6-level factor and four 3-levelfactors is used. The specification of cyclic load and theinitial welding residual stress were chosen as the designfactors. Variance analysis is also performed to determinethe impact and contribution of each factor on the residualstress relaxation.
2 Experimental procedure
The experimental procedure consists of two steps: materialproperties and specimen production, and residual stressmeasurement, as described below.
2.1 Material properties and specimen production
The experimental specimen was prepared through single-pass butt-welding of the 5000-series aluminum plates withlength 350mm, width 250mm, and thickness 2mm.The GTAW process was done with welding parameters
given in Table 1. The thermal specifications [24] andthe mechanical properties of the material versus to thetemperature are plotted in Figure 1. Due to the high impactof yield strength on the welding residual stress, themechanical properties were determined by high-tempera-ture tensile test, based on the ASTM E 21 standard [25].The specimen geometry, which was used in this test, isshown in Figure 2.
2.2 Residual stress measurement
During the past years, various techniques have beendeveloped to measure the residual stress in weldedstructures. Among these methods, the hole-drilling isa widely used technique. It offers advantages of goodaccuracy and reliability, standardized test procedure, andnon-significant damage [26]. In this study, in order to verifythe FE analysis, the welding residual stresses weremeasured through the incremental hole-drilling method.In this method, a small hole is drilled in an incrementalnumber of steps and the corresponding strains aremeasured on the surface. The residual stresses arecalculated with these measured strains. Hence, five straingages of type rosette were bonded to the specimen surfaceas shown in Figure 3. The blind-holes with depth 1mmwere drilled precisely at the center of the rosette using

Fig. 3. Residual stress measurement (a) strain gauge position(b) drilling process.
Table 2. Stages of the welding simulation.
Stage number Stage time (s) Stage specification
Stage 1 219 Heating (welding time)Stage 2 2500 CoolingStage 3 1 Releasing the clamps
Fig. 4. FE model of the welding simulation.
Fig. 5. Double-ellipsoidal heat source model [27].
Y. Ghaderi Dehkordi et al.: Mechanics & Industry 21, 505 (2020) 3
an air-turbine at rotation speed 300,000 rpm, feed rate0.2mm/min, depth increment 0.05mm, and delay time 5seconds. The cutting tool was a tungsten carbide invertedcone end mill with 1.6mm in diameter and six cuttingedges.
The depth of each hole was 1mm, being drilled in 20steps 2.3 of 50mm each.
3 Welding simulation of the butt-jointedplates
3.1 General consideration
The thermo-elasto-plastic analysis was performed based onthe couple method between the thermal and mechanicalsolutions. The analysis was done in three stages as seen inTable 2. The 3D FE model was constructed and meshedusing ABAQUS software, as shown in Figure 4. For theboundary condition, the nodes at distance 16mm from theweld centerline were fixed due to the clamps of weldingmachine, and then released due to removing the clamps.The thermal gradient is highest at the welded zone, so thefiner mesh size was used near the weld. The identicalgeometry and mesh configurations were utilized in thethermal and mechanical analyses. Whereas, the elementtypes DC3D20 and C3D20R were used in the thermal andmechanical analyses, respectively.
3.2 Thermal analysis
For the heat source simulation, the most popular model,proposed by Goldak et al. [27] was used. In this model,
the heat distribution for the front and rear ellipsoids(Fig. 5) were calculated separately as follows [27]:
qf x; y; zð Þ ¼ 6ffiffiffi3
phQff
pffiffiffip
pafbc
exp � 3x2
b2� 3y2
c2� 3z2
af2
� �ð1Þ
qr x; y; zð Þ ¼ 6ffiffiffi3
phQfr
pffiffiffip
parbc
exp � 3x2
b2� 3y2
c2� 3z2
ar2
� �ð2Þ
where, af, ar, b, and c are the dimensional constants ofthe Goldak’s model, Q=VI is the total heat input, h is thethermal efficiency which is assumed to be 60% for theGTAW process [28], and ff and fr are the heat fractioncoefficients in the front and rear ellipsoids, respectively,ff+ fr=2 [27]. In this study, af, ar, b, and c are considered 4,12, 4, and 2mm, respectively and ff and fr are 1.5 and 0.5.
3.3 Mechanical analysis
Total strain rate during welding is decomposed into thefour components [29]:
_et ¼ _ee þ _ep þ _eth þ _ept ð3Þwhere _ee, _ep, _eth, and _ept are the elastic, plastic, thermal, andsolid-state phase transformation strain rates, respectively.
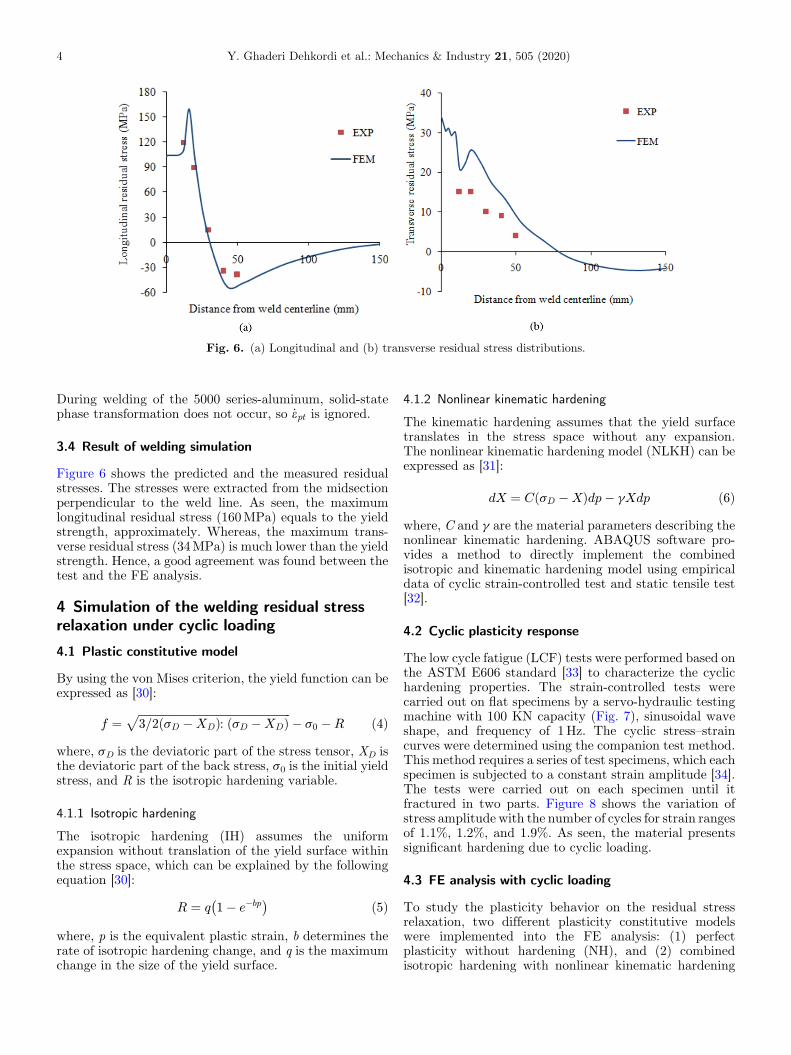
Fig. 6. (a) Longitudinal and (b) transverse residual stress distributions.
4 Y. Ghaderi Dehkordi et al.: Mechanics & Industry 21, 505 (2020)
During welding of the 5000 series-aluminum, solid-statephase transformation does not occur, so _ept is ignored.
3.4 Result of welding simulation
Figure 6 shows the predicted and the measured residualstresses. The stresses were extracted from the midsectionperpendicular to the weld line. As seen, the maximumlongitudinal residual stress (160MPa) equals to the yieldstrength, approximately. Whereas, the maximum trans-verse residual stress (34MPa) is much lower than the yieldstrength. Hence, a good agreement was found between thetest and the FE analysis.
4 Simulation of the welding residual stressrelaxation under cyclic loading
4.1 Plastic constitutive model
By using the von Mises criterion, the yield function can beexpressed as [30]:
f ¼ffiffiffiffiffiffiffiffiffiffiffiffiffiffiffiffiffiffiffiffiffiffiffiffiffiffiffiffiffiffiffiffiffiffiffiffiffiffiffiffiffiffiffiffiffiffiffiffiffiffiffiffiffiffiffi3=2 sD �XDð Þ: sD �XDð Þ
p� s0 �R ð4Þ
where, sD is the deviatoric part of the stress tensor, XD isthe deviatoric part of the back stress, s0 is the initial yieldstress, and R is the isotropic hardening variable.
4.1.1 Isotropic hardening
The isotropic hardening (IH) assumes the uniformexpansion without translation of the yield surface withinthe stress space, which can be explained by the followingequation [30]:
R ¼ q 1� e�bp� � ð5Þ
where, p is the equivalent plastic strain, b determines therate of isotropic hardening change, and q is the maximumchange in the size of the yield surface.
4.1.2 Nonlinear kinematic hardening
The kinematic hardening assumes that the yield surfacetranslates in the stress space without any expansion.The nonlinear kinematic hardening model (NLKH) can beexpressed as [31]:
dX ¼ C sD �Xð Þdp� gXdp ð6Þwhere, C and g are the material parameters describing thenonlinear kinematic hardening. ABAQUS software pro-vides a method to directly implement the combinedisotropic and kinematic hardening model using empiricaldata of cyclic strain-controlled test and static tensile test[32].
4.2 Cyclic plasticity response
The low cycle fatigue (LCF) tests were performed based onthe ASTM E606 standard [33] to characterize the cyclichardening properties. The strain-controlled tests werecarried out on flat specimens by a servo-hydraulic testingmachine with 100 KN capacity (Fig. 7), sinusoidal waveshape, and frequency of 1Hz. The cyclic stress–straincurves were determined using the companion test method.This method requires a series of test specimens, which eachspecimen is subjected to a constant strain amplitude [34].The tests were carried out on each specimen until itfractured in two parts. Figure 8 shows the variation ofstress amplitude with the number of cycles for strain rangesof 1.1%, 1.2%, and 1.9%. As seen, the material presentssignificant hardening due to cyclic loading.
4.3 FE analysis with cyclic loading
To study the plasticity behavior on the residual stressrelaxation, two different plasticity constitutive modelswere implemented into the FE analysis: (1) perfectplasticity without hardening (NH), and (2) combinedisotropic hardening with nonlinear kinematic hardening
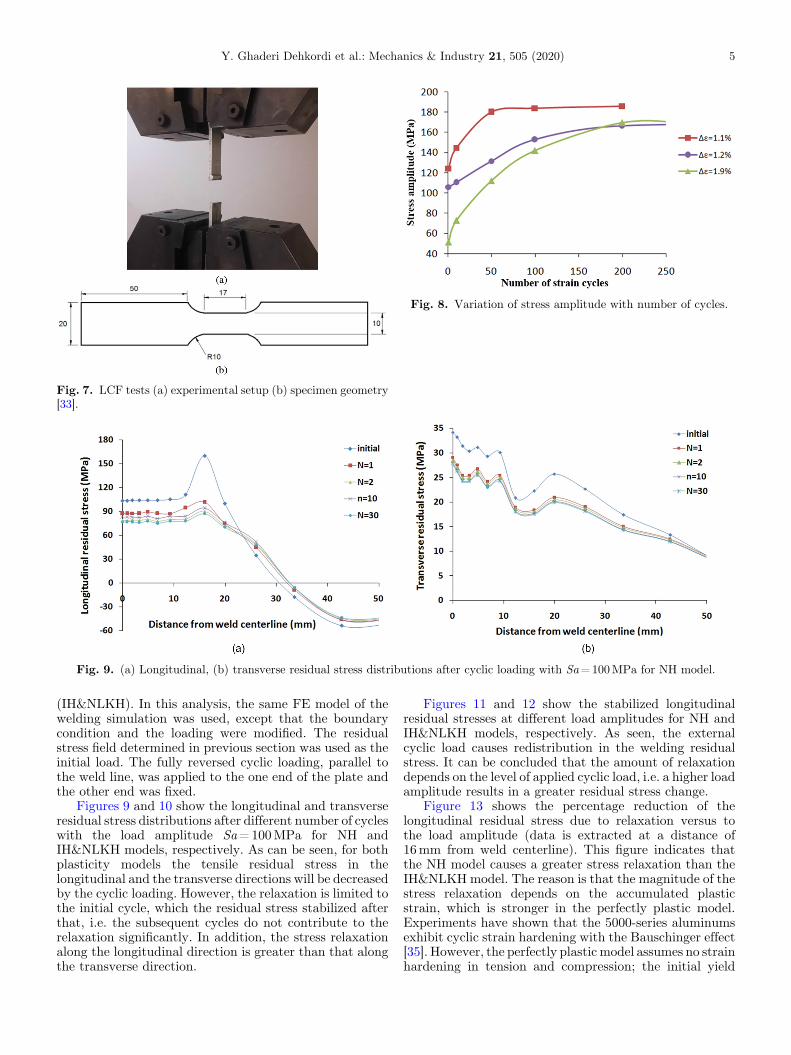
Fig. 7. LCF tests (a) experimental setup (b) specimen geometry[33].
Fig. 8. Variation of stress amplitude with number of cycles.
Fig. 9. (a) Longitudinal, (b) transverse residual stress distributions after cyclic loading with Sa=100MPa for NH model.
Y. Ghaderi Dehkordi et al.: Mechanics & Industry 21, 505 (2020) 5
(IH&NLKH). In this analysis, the same FE model of thewelding simulation was used, except that the boundarycondition and the loading were modified. The residualstress field determined in previous section was used as theinitial load. The fully reversed cyclic loading, parallel tothe weld line, was applied to the one end of the plate andthe other end was fixed.
Figures 9 and 10 show the longitudinal and transverseresidual stress distributions after different number of cycleswith the load amplitude Sa=100MPa for NH andIH&NLKH models, respectively. As can be seen, for bothplasticity models the tensile residual stress in thelongitudinal and the transverse directions will be decreasedby the cyclic loading. However, the relaxation is limited tothe initial cycle, which the residual stress stabilized afterthat, i.e. the subsequent cycles do not contribute to therelaxation significantly. In addition, the stress relaxationalong the longitudinal direction is greater than that alongthe transverse direction.
Figures 11 and 12 show the stabilized longitudinalresidual stresses at different load amplitudes for NH andIH&NLKH models, respectively. As seen, the externalcyclic load causes redistribution in the welding residualstress. It can be concluded that the amount of relaxationdepends on the level of applied cyclic load, i.e. a higher loadamplitude results in a greater residual stress change.
Figure 13 shows the percentage reduction of thelongitudinal residual stress due to relaxation versus tothe load amplitude (data is extracted at a distance of16mm from weld centerline). This figure indicates thatthe NH model causes a greater stress relaxation than theIH&NLKH model. The reason is that the magnitude of thestress relaxation depends on the accumulated plasticstrain, which is stronger in the perfectly plastic model.Experiments have shown that the 5000-series aluminumsexhibit cyclic strain hardening with the Bauschinger effect[35]. However, the perfectly plastic model assumes no strainhardening in tension and compression; the initial yield

Fig. 10. (a) Longitudinal, (b) transverse residual stress distributions after cyclic loading with Sa=100MPa for IH&NLKH model.
Fig. 11. Stabilized longitudinal residual stress at different loadamplitude for NH model.
Fig. 12. Stabilized longitudinal residual stress at different loadamplitude for IH&NLKH model.
Fig. 13. Percentage reduction of longitudinal residual stressversus to load amplitude.
6 Y. Ghaderi Dehkordi et al.: Mechanics & Industry 21, 505 (2020)
function is unchanged in the stress space during plasticdeformation. Therefore, to more accurate assessment of thewelding residual stress relaxation in aluminum-weldedplates, the IH&NLKH model should be used, which will beutilized in the subsequent section.
5 Design of experiments
Since there are many effective parameters on the weldingresidual stress relaxation, design of experiments based onthe Taguchi method [36] was done to study the impact ofmain parameters. The characteristics of the cyclic loadconsist of stress amplitude (Sa), mean stress (Sm), andnumber of cycles (N) were selected as the loadingparameters, and the maximum von Mises of the initialwelding residual stress (sIrs) was selected as the techno-logical parameter. Based on the number of design factorsand their levels, the Taguchi L18 array was used in theexperimental design, as shown in Table 3. The maximumvon Mises of the residual stresses after applying the cyclic

Table 3. Design factors and their levels.
Experimentno.
N Sm
(MPa)Sa
(MPa)sIrs
(MPa)
1 1 30 20 1102 1 60 40 1353 1 90 60 1504 2 30 20 1355 2 60 40 1506 2 90 60 1107 4 30 40 1108 4 60 60 1359 4 90 20 15010 8 30 60 15011 8 60 20 11012 8 90 40 13513 16 30 40 15014 16 60 60 11015 16 90 20 13516 32 30 60 13517 32 60 20 15018 32 90 40 110
Fig. 14. Relaxed residual stresses for all experiments (MPa).
Table 4. Average values of relaxed residual stresses inevery level of each factor (MPa).
Level N Sm Sa sIrs
1 74.1 94.6 86.4 78.82 73.5 73.8 73.2 69.13 73.3 49.4 58.2 70.54 73.1 – – –
5 73.3 – – –
6 73.2 – – –
Delta 1.1 45.1 28.1 9.1Rank 4 1 2 3
Fig. 15. Design factor effects on the relaxed residual stress.
Y. Ghaderi Dehkordi et al.: Mechanics & Industry 21, 505 (2020) 7
loading, namely relaxed residual stress, (sRrs) was selectedas the response variable. Using the FE analysis, theresponse variable values were determined for all experi-ments, as plotted in Figure 14.
5.1 Taguchi analysis
The results of the Taguchi analysis are given in Table 4.This table presents the averages of the relaxed residualstresses for every level of design factors. Delta is themaximum difference of response variable between thelevels of each factor, and Rank specifies the rank of eachfactor based on the Delta values. As seen, the order offactors based on their effects on the relaxed residual stressis determined as follows: mean stress, stress amplitude,initial residual stress, and finally number of cycle. This canbe also observed in the plot of design factor impacts shownin Figure 15. As seen, the mean stress and the stressamplitude affect the relaxed residual stress significantly;an increase in the mean stress and the stress amplitude
causes the relaxed residual stress to reduce, while the effectof the number of cycles is rather insignificant.
5.2 Regression analysis
The regression analysis was performed to derive therelationship between the design factors and the responsevariable. By this analysis, the relaxed residual stress wasestimated through the following first order equation,
sRrs ¼ 172:7� 0:0153N � 0:7522Sm � 0:7031Sa
�0:2083sIrs; R2 ¼ 97:5%: ð7ÞIn equation (7), each numerical coefficient reveals the
importance of the corresponding parameter. In addition,the negative sign of coefficients declares reduction of therelaxed residual stress. In this study, the high value of R2
(variation percentage of the response) indicates that the fitof the experimental data to the model is satisfactory.
5.3 Analysis of variance
Analysis of variance (ANOVA) was then carried out tointerpret the results of the experiments and detect

8 Y. Ghaderi Dehkordi et al.: Mechanics & Industry 21, 505 (2020)
the amount of contribution of each variable. The ANOVAresult for the first order regression is shown in Table 5.The sum of squares indicates the relative importance ofeach factor; the factor with the biggest sum of squares hasthe greatest impact. The p-value also shows the significancelevel of each factor; a smaller p-value corresponds toa greater significance. Table 5 indicates that mean stress(p=0), stress amplitude (p=0), initial residual stress(p=0.004), and number of cycles (p=0.56) in this orderare the most significant factors affecting the relaxedresidual stress. Moreover, mean stress with 68.5%contribution has the most impact on the relaxed residualstress. Notice that these conclusions are consistent with theTaguchi analysis results.
Figure 16 shows the residual plots for the proposed firstorder equation. This figure can be used to asses if the modelsatisfies the assumptions of the analysis. A residual is thedifference between an observed value and its correspondingfitted value. The normal probability plot approximatelyfollows a straight line. This means that the data arenormally distributed. Histogram of the residuals also
Table 5. ANOVA results for the first order regression.
Source Sum of squares p-value Contribution
N 6 0.56 0.07%Sm 6110 0 68.5%Sa 2373 0 26.6%sIrs 213 0.004 2.4%Error – – 2.4%
Fig. 16. Residual plots for
indicates that the data is not skewed and normallydisturbed. In addition, the residual versus order plotdisplays no pattern in distribution of data, which indicatesthat the residual values are independent of each other.
In order to verify the regression analysis, the results ofthe FE method were compared with the values derivedfrom equation (7) as shown in Table 6. As seen, themaximum relative difference is 12%. This is compatiblewith the residual plots.
6 Conclusions
This paper studied the influence of the main parameters onthe residual stress relaxation of aluminum welded-platesunder cyclic loading. The induced residual stress for thewelded plates was predicted using FE analysis.The experimental residual stress measurements are ingood agreement with the predicted stresses. To study theplasticity effect on the stress relaxation, two differentmodels were considered: perfect plasticity, and combinednonlinear isotropic-kinematic hardening. In addition, theeffect of various loading and technological parameters onthe stress relaxation was studied through the Taguchimethod. In summary, the following conclusions can bedrawn from this research:
–th
The residual stress relaxation is highly dependent on theplasticity behavior. The NH causes to a greaterrelaxation compared to IH&NLKH.
–
The IH&NLKH model successfully predicts the redistri-bution of welding residual stress in a strain hardeningaluminum due to its ability to precisely determine theaccumulated plastic strain.e first order regression.

Table 6. Comparison between the results of the FEM andthe model (MPa).
Experimentno.
FEM Equation (7) Difference(%)
1 106 113 62 72 71 −13 32 32 −14 110 108 −25 70 68 −36 43 40 −87 101 99 −28 53 57 89 60 60 −110 79 77 −211 96 90 −612 44 49 1213 95 91 −414 65 62 −515 59 63 716 77 79 317 86 82 −518 58 53 −8
Y. Ghaderi Dehkordi et al.: Mechanics & Industry 21, 505 (2020) 9
–
The residual stress is stabilized after the first cycle andthe amount of stress relaxation occurred in subsequentcycles is insignificant.–
Increase in the mean stress and the stress amplitudecause the stress relaxation to increase, while the effect ofnumber of cycles is rather insignificant–
The most significant factors on welding residual stressrelaxation in the order of significance are the following:the mean stress, the stress amplitude, the initial residualstress, and the number of cycles.Nomenclature
af, ar, b, c
Dimensional constants of the Goldak’smodel (mm)b
Rapidity of isotropic hardening change C Nonlinear kinematic hardening parameter(MPa)
f Von Mises yield function (MPa) ff, fr Heat fraction in front and rear ellipsoids ofthe Goldak’s model
N Number of cycles p Equivalent plastic strain p-value Probability value q Saturated value of isotropic hardening(MPa)
Q Total heat power of welding source (W) R Isotropic hardening value (MPa) Sa,Sm Stress amplitude and mean stress (MPa) XD Deviatoric part of back stress tensor (MPa) g Nonlinear kinematic hardening parameter_ee, _ep, _eth; _ept
Elastic, plastic, thermal, and phase trans-formation strain ratesh
Thermal efficiency of welding heat source s0 Initial yield stress (MPa) sD Deviatoric part of the stress tensor (MPa) sIrs, sRrs Von Mises values of initial and relaxedwelding residual stresses (MPa)
Conflict of interest
The authors declare that they have no conflict of interest.
Funding
This research did not receive any specific grant.
References
[1] J. Klassen, N. Friedrich, W. Fricke, T. Nitschke-Pagel, K.Dilger, Influence of residual stresses on fatigue strength oflarge-scale welded assembly joints,Weld.World 61, 361–374(2017)
[2] I. Vysotskiy, S. Malopheyev, S. Rahimi, S. Mironov, R.Kaibyshev, Unusual fatigue behavior of friction-stir weldedAl–Mg–Si alloy, Mater. Sci. Eng. A 760, 277–276 (2019)
[3] D.Wang, H. Zhang, B. Gong, C. Deng, Residual stress effectson fatigue behavior of welded T-joint: a finite fracturemechanics approach, Mater. Des. 91, 211–217 (2016)
[4] Y. Javadi, K. Azari, S.M. Ghalehbandi, M.J. Roy,Comparison between using longitudinal and shear wavesin ultrasonic stress measurement to investigate the effect ofpost-weld heat-treatment on welding residual stresses, Res.Nondestruct. Eval. 28, 101–122 (2015)
[5] Z. Zhang, P. Ge, G.Z. Zhao, Numerical studies of post weldheat treatment on residual stresses in welded impeller, Int. J.Pres. Ves. Pip. 153, 1–14 (2017)
[6] C. Bianchetti, D. Delbergue, P. Bocher, M. Lévesque, M.Brochu, Analytical fatigue life prediction of shot peened AA7050-T7451, Int. J. Fatigue 118, 271–281 (2019)
[7] Y. Gao, Improvement of fatigue property in 7050-T7451aluminum alloy by laser peening and shot peening, Mater.Sci. Eng. A 528, 3823–3828 (2011)
[8] J. Liu, H. Yuanb, Prediction of residual stress relaxations inshot-peened specimen sand its application for the rotor discassessment, Mater. Sci. Eng. A 527, 6690–6698 (2010)
[9] V.I. Trufyakov, Y.F. Kudyavtsev, Calculation of the effect ofexternal loading on the relaxation of residual weldingstresses, Weld. Int. 3, 22–24 (2010)
[10] O.S. Zaroog, A. Ali, B.B. Sahari, R. Zahari, Modeling ofresidual stress relaxation of fatigue in 2024-T351 aluminumalloy, Int. J. Fatigue 33, 279–285 (2011)
[11] J. Katsuyama, K. Onizawa, Analytical study of therelaxation of welding residual stress by excessive loadingfor austenitic stainless steel piping welds, J. Pressure VesselTechnol. 133, 417–424 (2011)
[12] H. Yi, Y. Lee, Numerical analysis of welding residual stressrelaxation in high-strength multilayer weldment underfatigue loads, Metall. Mater. Trans. B 48, 2167–2175 (2017)

10 Y. Ghaderi Dehkordi et al.: Mechanics & Industry 21, 505 (2020)
[13] Z. Barsoum, I. Barsoum, Residual stress effects on fatiguelife of welded structures using LEFM, Eng. Fail. Anal. 16,449–467 (2009)
[14] J. Katsuyama, K. Onizawa, Analytical study of therelaxation of welding residual stress by excessive loadingfor austenitic stainless steel piping welds, J. Pressure VesselTechnol. 133, 031402 (2011)
[15] J. Katsuyama, Y. Yamaguchi, Y. Li, K. Onizawa, Effect ofcyclic loading on the relaxation of residual stress in the butt-weld joints of nuclear reactor piping, Nucle. Eng. Des. 278,222–228 (2014)
[16] V. Dattoma, M. De Giorgi, R. Nobile, Numerical evaluationof residual stress relaxation by cyclic load, J. Strain Anal.Eng. 39, 663–672 (2004)
[17] Z. Qian, S. Chumbley, T. Karakulak, E. Johnson, Theresidual stress relaxation behavior of weldments duringcyclic loading, Metall. Mater. Trans. A 44A, 3147–3156(2013)
[18] L.G. Gannon, N.G. Pegg, M.J. Smith, Y. Liu, Effect ofresidual stress shakedown on stiffened plate strength andbehaviour, Ships Offshore Struct. 8, 638–652 (2013)
[19] J. Cho, C.H. Lee, FE analysis of residual stress relaxation in agirth-welded duplex stainless steel pipe under cyclic loading,Int. J. Fatigue 82, 462–473 (2016)
[20] C.H. Lee, N.V. Van Do, K.H. Chang, Analysis of uniaxialratcheting behavior and cyclic mean stress relaxation of aduplex stainless steel, Int. J. Plast. 62, 17–33 (2014)
[21] X.F. Xie, W. Jiang, Y. Luo, S. Xu, J.M. Gong, S.T. Tu, Amodel to predict the relaxation of weld residual stress bycyclic load: Experimental and finite element modeling, Int. J.Fatigue 95, 293–301 (2017)
[22] M. Farajian-Sohi, T. Nitsckhe-Pagel, K. Dilger, Mechanismsof residual rtress relaxation and redistribution in weldedhigh-strength steel specimens under mechanical loading,Weld. Word 54, R366–R374 (2010)
[23] M. Farajian-Sohi, T. Nitsckhe-Pagel, K. Dilger, Residualstress relaxation of quasi-statically and cyclically loadedsteel welds Doc. IIW-1980-08 (ex-doc. XIII-2219-08), Weld.World 54, R49–R60 (2010)
[24] ASME Boiler and pressure vessel code: section II- part Dproperties (ASME, New York, 2015)
[25] ASTM E 21–09: Standard test methods for elevatedtemperature tension tests of metallic materials (ASTMInternational, New York, 2009)
[26] Y. Javadi, M.C. Smith, K. Abburi Venkata et al., Residualstress measurement round robin on an electron beamwelded joint between austenitic stainless steel 316L(N)and ferritic steel P91, Int. J. Pres. Ves. Pip. 154, 41–57 (2017)
[27] Y. Javadi, J.A. GoldakA, K. Imani Fooladi, M. Nimrouzi,Using ultrasonic and finite element for residual stressevaluation of a gas transmission pipeline, Mater. Eval. 76,192–202 (2018)
[28] N. Stenbacka, I. Choquet, K. Hurtig, Review of arc efficiencyvalues for gas tungsten arc welding, IIWCommission IV-XII-SG212, Berlin, Germany, 2012, pp. 1–21
[29] G. Fu,M.I. Lourenço,M. Duan, S.F. Estefen, Influence of thewelding sequence on residual stress and distortion of filletwelded structures, Mar. Struct. 46, 30–55 (2016)
[30] A. Nath, K.K. Ray, S. Barai, Evaluation of ratchetingbehaviour in cyclically stable steels through use of acombined kinematic-isotropic hardening rule and a geneticalgorithm optimization technique, Int. J. Mech. Sci. 152,138–150 (2019)
[31] S. Yun, A. Palazotto, Damage mechanics incorporating twoback stress kinematic hardening constitutive models, Eng.Fract. Mech. 74, 2844–2863 (2007)
[32] ABAQUS analysis user’s manual, version 6.12[33] ASTM E606/E606M: Standard test method for strain-
controlled fatigue testing (ASTM, New York, 2012)[34] R.I. Stephens, A. Fatemi, R.R. Stephens, H.O. Fuchs, Metal
Fatigue in Engineering, 2nd edn. (John Wiley & Sons, NewYork, 2000)
[35] F. Lu, G. Kang, Y. Liu, K. Shi, Experimental study onuniaxial cycle deformation of rolled 5083AL alloy plate. 7thICLCF 87–93, Aachen, Germany, 2013
[36] R.K. Roy, Design of Experiments Using the TaguchiApproach: 16 Steps to Product and Process IMPROVE-MENT (John Wiley & Sons, New York, 2001)
Cite this article as: Y. Ghaderi Dehkordi, A. Pourkamali Anaraki, A.R. Shahani, Comparative study of the effective parameterson residual stress relaxation in welded aluminum plates under cyclic loading, Mechanics & Industry 21, 505 (2020)