comparative transcriptome analysis of four prymnesiophyte ... · comparative transcriptome analysis...
TRANSCRIPT

Comparative Transcriptome Analysis of FourPrymnesiophyte AlgaeAmy E. Koid, Zhenfeng Liu, Ramon Terrado, Adriane C. Jones, David A. Caron, Karla B. Heidelberg*
Department of Biological Sciences, University of Southern California Los Angeles, Los Angeles, California, United States of America
Abstract
Genomic studies of bacteria, archaea and viruses have provided insights into the microbial world by unveiling potentialfunctional capabilities and molecular pathways. However, the rate of discovery has been slower among microbialeukaryotes, whose genomes are larger and more complex. Transcriptomic approaches provide a cost-effective alternativefor examining genetic potential and physiological responses of microbial eukaryotes to environmental stimuli. In this study,we generated and compared the transcriptomes of four globally-distributed, bloom-forming prymnesiophyte algae:Prymnesium parvum, Chrysochromulina brevifilum, Chrysochromulina ericina and Phaeocystis antarctica. Our results revealedthat the four transcriptomes possess a set of core genes that are similar in number and shared across all four organisms. Thefunctional classifications of these core genes using the euKaryotic Orthologous Genes (KOG) database were also similaramong the four study organisms. More broadly, when the frequencies of different cellular and physiological functions werecompared with other protists, the species clustered by both phylogeny and nutritional modes. Thus, these clusteringpatterns provide insight into genomic factors relating to both evolutionary relationships as well as trophic ecology. Thispaper provides a novel comparative analysis of the transcriptomes of ecologically important and closely relatedprymnesiophyte protists and advances an emerging field of study that uses transcriptomics to reveal ecology and functionin protists.
Citation: Koid AE, Liu Z, Terrado R, Jones AC, Caron DA, et al. (2014) Comparative Transcriptome Analysis of Four Prymnesiophyte Algae. PLoS ONE 9(6): e97801.doi:10.1371/journal.pone.0097801
Editor: Jingfa Xiao, Beijing Institute of Genomics, China
Received November 13, 2013; Accepted April 23, 2014; Published June 13, 2014
Copyright: � 2014 Koid et al. This is an open-access article distributed under the terms of the Creative Commons Attribution License, which permits unrestricteduse, distribution, and reproduction in any medium, provided the original author and source are credited.
Funding: This research was funded in part by the Gordon and Betty Moore Foundation through Grant #3299 to D.A. Caron and K.B. Heidelberg. The sequencingwas funded by the Gordon and Betty Moore Foundation through Grant #2637 to the National Center for Genome Resources. The funders had no role in studydesign, data collection and analysis, decision to publish, or preparation of the manuscript.
Competing Interests: The authors have declared that no competing interests exist.
* E-mail: [email protected]
Introduction
Genome sequencing of microorganisms has unveiled a wealth of
new information regarding the ecology, physiology and interac-
tions of organisms in the environment. In contrast to most
bacteria, archaea and viruses, protistan genomes tend to be large
(10–200 Mb compared to 1–10 Mb in bacteria) and more
complex, factors that obfuscate bioinformatic analyses, and make
for a slower rate of assembly, annotation and gene discovery [1].
The lack of well annotated reference genomes also make de novo
sequence analysis extremely challenging. Consequently, the
current repository of sequenced and annotated eukaryotic
genomes covers a small portion of microbial eukaryotic diversity,
and is biased toward model organisms and parasitic species that
cause human diseases [2,3].
Transcriptomes contain only the transcribed portions of
genomes, which simplifies genetic analyses of eukaryotes by
removing complex genetic elements of large intergenic regions,
introns and repetitive DNA. In protists, the poly-A+ tail of mRNA
transcripts can be selected for sequencing, enriching eukaryotic
sequences even in a bacterialized, uni-protistan culture. As such,
transcriptomes can be used for the molecular study of protists of
interest, circumventing difficult issues such as complicated
sequence assembly procedures, to interrogate metabolic and
cellular processes.
A mixotrophic nutritional mode among some photosynthetic
flagellates (defined here as chloroplast-containing protistan species
that also possess the ability for phagotrophy) is a geographically
and phylogenetically widespread phenomenon among aquatic
protists. A growing body of literature indicates that mixotrophy,
especially the consumption of bacteria by phototrophic plankton,
is a significant ecological strategy in global marine systems [4–7].
Mixotrophy may confer a variety of ecological advantages
including carbon, macro- or micronutrient acquisition, and/or
supplementation of energy generation [8,9].
Within the broad spectrum of taxa and nutritional strategies
that have been reported, the mixotrophic capabilities of prymne-
siophyte (haptophyte) algae have been well documented. Molec-
ular surveys and pigment composition analyses have indicated that
prymnesiophytes are globally distributed and abundant in both
marine and freshwater ecosystems [10–14] where they play key
roles in nutrient and organic carbon cycling [15,16]. Among
mixotrophic flagellates studied year-round off the coast of Catalan
(Mediterranean), for example, prymnesiophytes were found to be
the most important phylogenetic group, accounting for on average
40% of total bacterivory by mixotrophs and 9–27% of total
bacterivory [12,17].
The transcriptomes of four prymnesiophyte algae were com-
pared in this study: Prymnesium parvum, Chrysochromulina brevifilum,
Chrysochromulina ericina and Phaeocystis antarctica. P. parvum is a toxin
producer that is capable of developing large, monospecific blooms
PLOS ONE | www.plosone.org 1 June 2014 | Volume 9 | Issue 6 | e97801

that cause massive fish kills, ecosystem disruption, and significant
economic losses [18]. Chrysochromulina spp. are also found globally
[19], with some species capable of forming blooms and mass
mortality events [20]. P. antarctica forms colonies of cells that are
embedded in a polysaccharide gel matrix. It is a key species in the
Southern Ocean, and is capable of forming blooms of up to 107
cells L21 [21]. P. antarctica may also play a significant role in global
carbon and sulfur cycles [22,23]. Three of the four species in this
study have also been reported to exhibit mixotrophic nutrition. P.
parvum can ingest bacteria and other protists, and is capable of
taking up organic nutrients [24–26]. Members of the diverse genus
Chrysochromulina, including C. brevifilum and C. ericina have also been
reported to ingest prey [27,28].
The purpose of this study was to compare the transcripts of
closely related prymnesiophytes in order to understand common-
alities and differences attributable to both taxonomic relatedness
and trophic mode. Our analysis revealed a set of core genes that
were shared among all four targeted organisms. The frequencies of
functional gene categories in these prymnesiophytes were com-
pared to other protistan organisms in publicly available databases,
and indicated that species clustered by genomic information based
on both phylogeny and nutritional mode.
Methods
Culture conditionsPrymnesium parvum (clone Texoma1) was isolated from Lake
Texoma, Oklahoma, USA, and made clonal and axenic by
micropipetting single cells through rinses of sterile medium.
Chrysochromulina brevifilum (clone UTEX LB985) and Chrysochromu-
lina ericina (clone CCMP281) were obtained from UTEX The
Culture Collection of Algae and the National Center for Marine
Algae and Microbiota, respectively. Phaeocystis antarctica was
isolated from the Ross Sea, Antarctica by Robert Sanders. P.
antarctica was collected under permits issued by the US Antarctic
Program through the US Department of State for work in
Antarctica. P. parvum was collected at the University of Oklahoma
Biological Station, Lake Texoma. No collection permits were
required.The four study organisms were grown in optimal replete
medium for each species (Table 1) in 1–2 L volumes in 2800 ml
Pyrex glass Fernbach flasks. Irradiance was measured using a
QSL-100 sensor with QSP-170 deckbox (Biospherical Instruments
Inc.) and was approximately 300 mE?m22 s21. Cultures were
grown in a 12:12 hour light:dark cycle with illumination provided
by Philips F20T12CW bulbs. P. parvum was grown axenically while
the other three species were uniprotistan but non-axenic
(bacterized) cultures.
RNA IsolationAll cultures were harvested during mid-exponential growth
phase by centrifugation in an Eppendorf 5810R centrifuge using
the A-4-62 rotor at 3200 rcf for 15 min at 15uC. The supernatant
was carefully decanted, and 1–2 ml of TRI reagent (Ambion) was
added to the pellet and vortexed until the pellet fully dissolved.
Homogenates were then either processed immediately using
Ribopure kit (Ambion), or stored at 280uC for later processing.
The eluted RNA was treated with DNase (Sigma) to remove DNA
contamination. Samples were cleaned and concentrated using
RNA Clean and Concentrator-25 (Zymo Research). The RNA
was quantified using a Qubit 2.0 Fluorometer (Invitrogen) and
nucleic acid quality was checked using an E-gel Gel EX 1%
(Invitrogen).
Library Preparation and SequencingAll samples were quantified again at the sequencing center using
Invitrogen Qubit Q32855 and RNA quality was assessed using the
Agilent 2100 Bioanalyzer. Libraries were made from 2 mg RNA
using Illumina’s TruSeq RNA Sample Preparation Kit. The
average insert size of each library ranged from 250 to 350 bp.
Libraries were sequenced on an Illumina HiSeq 2000 to obtain
2650 bp (paired-end) reads. Over 2 Gbp of sequence was
generated per library. Library preparation and sequencing were
performed as part of the Marine Microbial Eukaryote Transcrip-
tome Sequencing Project (MMETSP) supported by the Gordon
and Betty Moore Foundation (http://marinemicroeukaryotes.
org/).
Transcriptome AssemblyTranscriptome assemblies for P. parvum, C. ericina and P.
antarctica were obtained using the National Center for Genome
Research’s (NCGR) internal pipeline BPA1.0 (Batch Parallel
Assembly version 1.0). Sequence reads were preprocessed using
SGA preprocess [29] for quality trimming (swinging average) at
Q15. Reads less than 25 nt after trimming were discarded.
Preprocessed sequence reads were assembled into contigs with
ABySS v.1.3.0 [30], using 20 unique kmers between k = 26 and
k = 50. ABySS was run requiring a minimum kmer coverage of 5,
bubble popping at .0.9 branch identity with the scaffolding flag
enabled to maintain contiguity for divergent branching. Paired-
end scaffolding was performed on each kmer. Sequence read
pairing information was used in GapCloser v.1.10 [31] (part of
SOAP de novo package) to walk in on gaps created during
scaffolding in each individual kmer assembly. Contigs from all
gap-closed kmer assemblies were combined. The OLC (overlap
layout consensus) assembler miraEST [32] was used to identify
minimum 100 bp overlaps between the contigs and to assemble
larger contigs, while collapsing redundancies. The Burrows-
Table 1. Culture conditions for the four prymnesiophyte species in this study.
Species Media Temp L:D cycle Irradiance
Prymnesium parvum L1 –silica, 18 ppta 18uC 12:12 300 mE?m22 s21
Chrysochromulina brevifilum Modified F/2b, 30 ppt 18uC 12:12 300 mE?m22 s21
Chrysochromulina ericina LKSc –silica, 36 ppt 18uC 12:12 300 mE?m22 s21
Phaeocystis antarctica LKSc –silica, 36 ppt 1uC 12:12 300 mE?m22 s21
aSalinity is indicated as parts per thousand (ppt).bModified F/2 contains the following: NaNO3 2.33 mM; Na2HPO4 0.067 mM; No silica; Soil extract; L1 Trace Metals; F/2 vitamins.cLKS media is a combination of L1 and K media and soil extract (https://ncma.bigelow.org/algal-recipes).doi:10.1371/journal.pone.0097801.t001
Transcriptomes of Prymnesiophyte Algae
PLOS ONE | www.plosone.org 2 June 2014 | Volume 9 | Issue 6 | e97801

Wheeler Alignment (BWA) [33] was used to align sequence reads
back to the contigs. Alignments were processed by SAMtools
mpileup (http://samtools.sourceforge.net) to generate consensus
nucleotide calls at positions where IUPAC bases were introduced
by miraEST [32], and read composition showed a predominance
of a single base. The consensus contigs were filtered at a minimum
length of 150 nt to produce the final set of contigs.
Transcriptome assembly for C. brevifilum was obtained using
NCGR’s internal pipeline BPA2.0 (Batch Parallel Assembly v.2.0).
The differences between BPA1.0 and BPA2.0 are as follows:
preprocessed sequence reads were assembled into contigs with a
newer version of ABySS [30] v.1.3.3, with the scaffolding flag
disabled to avoid over-reduction of divergent regions. Unitigs from
all kmer assemblies were combined and redundancies were
removed using CD-HIT-EST [34] with a clustering threshold of
0.98 identity. The OLC assembler CAP3 [35] was then used to
identify minimum 100 bp overlaps between the resultant contigs
and assemble larger sequence. The resulting contigs were paired-
end scaffolded using ABySS [30]. Sequence read pairing
information was used in GapCloser [31] (part of SOAP de novo
package) v. 1.10 to walk in on gaps created during scaffolding.
Redundant sequences were again removed using CD-HIT-EST
[34] at a clustering threshold of 0.98 identity. The consensus
contigs were filtered at a minimum length of 150 nt to produce the
final set of contigs.
The sequences for the four transcriptomes used in this study
have been deposited in CAMERA (Community Cyberinfrastruc-
ture for Advanced Microbial Ecology Research and Analysis) with
the following accession numbers: CAM_ASM_000151 (P. parvum),
CAM_ASM_000808 (C. brevifilum), CAM_ASM_000453 (C. eri-
cina), CAM_ASM_000460 (P. antarctica).
Transcriptome Annotation and ComparisonNon-coding ribosomal RNAs and transfer RNAs were detected
using RNAmmer [36] and tRNAscan [37], respectively. Coding
nucleotide sequences and corresponding translated peptide
sequences were predicted using ESTScan [38,39] with a
Bacillariophyta scoring matrix. Sequence reads were aligned back
to the nucleotide motifs of the predicted coding sequences using
BWA [33]. Peptide predictions over 30 amino acids in length were
annotated. Blastp [40] was used to generate hits against the
UniProtKB/Swiss-Prot database. Protein sequences were also func-
tionally characterized using HMMER3 [41] against Pfam-A [42],
TIGRFAM [43], and SUPERFAMILY [44] databases. Only
predicted protein sequences longer than 70 amino acids were used
in subsequent analyses. These sequences constitute expressed
genes or portions of expressed genes, hereafter referred to as
‘‘genes’’. Genes were also grouped into gene clusters using
orthomcl [45]. The resulting data were used in a comparative
analysis of predicted gene clusters that were shared and unique
among the four transcriptomes.
Polyketide synthase analysisProteins coding for putative polyketide synthase genes were
initially identified by a local BLAST against Emiliania huxleyi
polyketide synthase sequences obtained from GenBank. Sequences
with HMM annotations to polyketide synthases were further
identified using the NRPS-PKS tool [46] to identify the PKS
domains present. Sequences that contained the ketosynthase (KS)
domain were used to construct a maximum likelihood tree with
100 bootstraps using the software MEGA5 [47].
KOG analysisPutative protein sequences were functionally annotated using
KOG categories by blasting all the sequences against the KOG
database [48,49]. The E-value cutoff for a positive hit was 10210.
In addition, we used a bit score ratio cut-off, which was derived by
dividing the bit score for a hit by the bit score from a self-self hit. A
ratio of 0.2 was determined to be a good cut-off after manually
evaluating the quality of a number of representative hits.
Predicted protein sequences of 37 other protistan genomes and
transcriptomes were downloaded from the JGI website [50] and
the CAMERA website [51], respectively. The distribution of these
sequences among KOG categories were obtained, as above, by
performing a BLAST search against the KOG database and
accepting hits that met the E-value and bit score ratio cut-offs of
10210 and 0.2. The KOG category distribution of each species was
obtained by dividing the number of hits in each category by the
total number of hits to the KOG database. The relative
frequencies of each KOG functional category were used to
generate a non-metric multidimensional scaling (NMDS) plot
using the statistical package R [52] to compare the overall
similarity of the organisms to each other.
A subsequent principal components analysis was performed on
the relative frequencies of KOG categories across the 41 protistan
datasets to confirm the results from the NMDS analysis and to
elucidate how much of the KOG frequency pattern could be
explained by the principal axes. Additional statistical analyses were
done to investigate the influence of trophic mode versus phylogeny
on the observed KOG frequencies. Since data were not normally
distributed, the influence of phylogeny and trophic mode was
tested independently with a non-parametric Krustal-Wallis test,
followed by a Steel-Fligner test if significant differences were
observed. All statistical analyses and plots were calculated or
generated using XLSTAT (v.2013.06.04, Adinsoft TM).
Statistical analysis were used with two datasets: (1) the original
dataset of 41 species, with the exception of the mycetozoan,
Dictyostelium purpureum, the choanoflagellate Monosiga brevicollis and
the rhodophyte Cyanidioschyzon merolae, which were excluded for
statistical reasons (no replicates within the phylogenetic group);
and (2) a reduced dataset that included only the stramenopiles and
prymnesiophytes. The reduced dataset was used to prevent the
strong phylogenetic signal present within the alveolates and
chlorophytes from masking a signal based on trophic mode.
Results
Overview of the transcriptomeSequencing of the transcriptomes of the four target prymnesio-
phyte species generated datasets ranging in size from 35.6 million
to 61.0 million reads, resulting in 36.4 to 52.0 Mbp of assembled
sequence data (Table 2). The number of assembled contigs for P.
parvum, C. brevifilum, C. ericina and P. antarctica ranged from 30,986 to
56,193. Approximately 72% to 83% of these contigs were
predicted to be protein-coding sequences. Non-coding RNAs such
as rRNAs and tRNAs formed a small number of the total contigs
(Table S1 in File S1). The transcriptome sizes in our study were
comparable to other publicly available transcriptomes sequenced
by the Gordon and Betty Moore Foundation MMETSP. The
complete pathways for essential metabolic and cellular processes
were present in each transcriptome, indicating that the sequencing
depth provided good coverage. In addition, the number of
ribosomal protein genes present in our datasets (94–101) was
similar to the number in E. huxleyi (99), another prymnesiophyte
alga [53].
Transcriptomes of Prymnesiophyte Algae
PLOS ONE | www.plosone.org 3 June 2014 | Volume 9 | Issue 6 | e97801

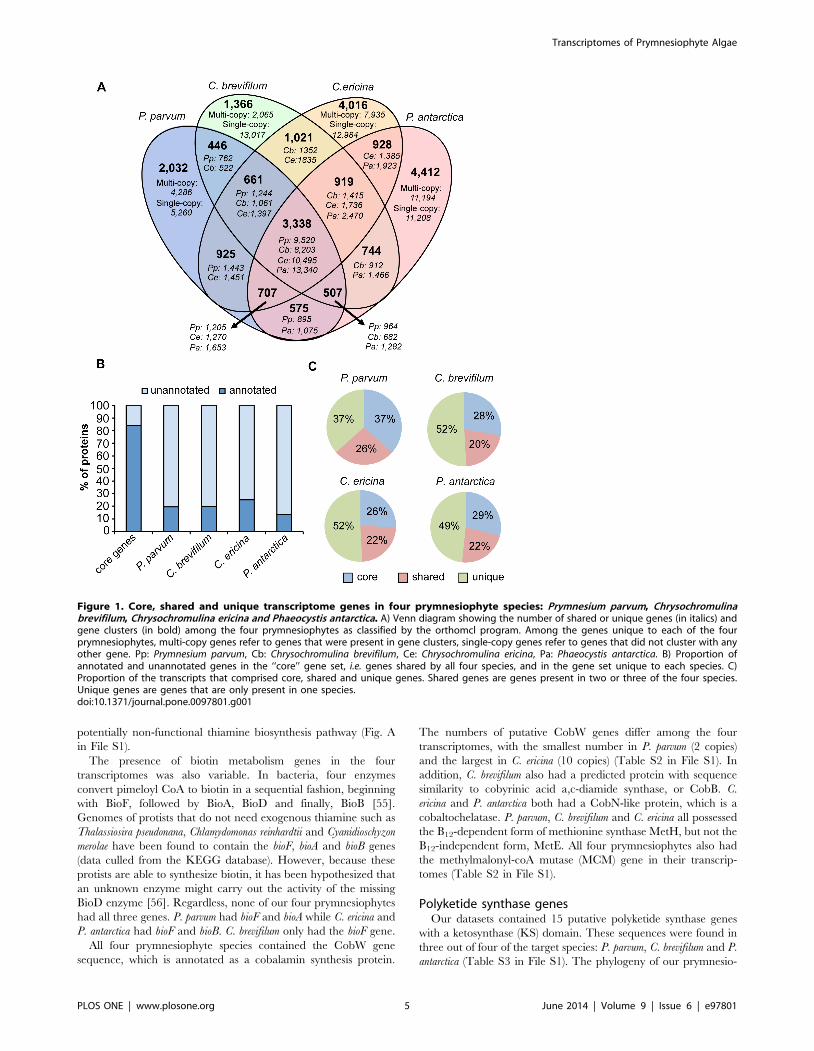
Core prymnesiophyte genesWe found a set of gene clusters that were common to all four
prymnesiophyte species (‘‘core transcriptome’’). This core set of
proteins consisted of 3,338 gene clusters (Fig. 1A), which
comprised 37%, 28%, 26% and 29% of the total predicted
proteins in P. parvum, C. brevifilum, C. ericina and P. antarctica,
respectively (Fig. 1C). C. brevifilum and C. ericina shared the most
gene clusters (1,021) followed by P. parvum and C. ericina (925) and
then P. antarctica and C. ericina (928) (Fig. 1A). Each transcriptome
contained unique gene clusters (each gene cluster was comprised of
multi-copy genes) not found in the other three transcriptomes; the
number of gene clusters that were unique to each species were
2,032 (P. parvum), 1,366 (C. brevifilum), 4,016 (C. ericina) and 4,412
(P. antarctica). In addition to the unique gene clusters, each species
also had unique single-copy genes (Fig. 1A). The unique gene
clusters and single-copy genes together comprised 37–52% of the
transcriptomes (Fig. 1C). C. brevifilum and C. ericina had the highest
proportions of unique genes (each with 52%), while P. antarctica
had 49% and P. parvum had 37% (Fig. 1C). Approximately 20–
26% of the transcriptomes was comprised of proteins that were
shared between at least two of the four prymnesiophyte species. Of
the 3,338 gene clusters shared among all four species, 2,752 (82%)
were annotated by KEGG or orthomcl. In contrast, the number of
annotated unique genes in each species was much smaller: P.
parvum: 1,398 (20%); C. brevifilum 2,828 (20%); C. ericina: 4,205
(25%); P. antarctica: 2,057 (13%) (Fig. 1B).
The majority of core prymnesiophyte proteins were mapped by
KEGG to essential metabolic pathways such as the biosynthesis of
amino acids, carbon metabolism, fatty acid metabolism and purine
and pyrimidine metabolism. All or nearly all the genes necessary
for these pathways were present. For instance, all of the TCA cycle
genes were found in C. brevifilum, C. ericina and P. antarctica, but in P.
parvum, one enzyme, fumarate dehydratase, was either not
recovered or annotated. All of the genes for glycolysis/gluconeo-
genesis were present in the four transcriptomes. The pathways for
the biosynthesis of some amino acids, such as methionine and
proline, were missing one or two genes in each transcriptome. The
non-mevalonate pathway or 2-C-methyl-D-erythritol 4-phos-
phate/1-deoxy-D-xylulose 5-phosphate pathway (MEP/DOXP
pathway) that is part of the terpenoid backbone biosynthesis
pathway was also nearly complete. The core transcriptome also
included genes for the synthesis of ribosomal proteins, proteasomes
and spliceosomes. Pathways with only some of the necessary genes
include the biosynthesis of other secondary metabolites, starch and
sucrose metabolism, and the urea cycle. Some genes involved in
the metabolism of cofactors and vitamins were present in all four
species, however, the core transcriptome did not contain the full
pathway for the metabolism of any of the cofactors and vitamins.
We also compared the core transcriptome of our four
prymnesiophyte species with the predicted proteins from the E.
huxleyi genome. Of the 1,433 proteins with KEGG annotations
that were in our shared core transcriptome, 1,303 (91%) were also
present in E. huxleyi. There were 130 predicted proteins that were
present in P. parvum, C. brevifilum, C. ericina and P. antarctica but not
in E. huxleyi. They consisted of a few enzymes in various pathways,
such as nitrogen metabolism (1), cysteine and methionine
metabolism (1), and TCA cycle (3), among others. They also
included alternative enzymes for the same pathway, or alternative
pathways for the same substrate/product conversion. In some
cases, a protein that was unique to the four target species might be
involved in a different intermediate pathway that feeds into the
same main pathway, with no resulting change in the final product.
For example, isocitrate dehydrogenase, which is present in the
core transcriptome of the four target prymnesiophyte species but
not in E. huxleyi, can convert isocitrate to oxalosuccinate to 2-
oxoglutarate whereas the gene that is present in E. huxleyi converts
isocitrate directly to 2-oxoglutarate. In both cases, isocitrate is
converted to 2-oxoglutarate, which are two major compounds in
the TCA cycle.
B-vitamin biosynthesis pathwaysA majority of the predicted proteins unique to each species were
not annotated, making it more challenging at this time to
understand the differences among the different species. Nonethe-
less, some of the differences in the proteins were present in three
vitamin biosynthesis pathways, specifically thiamine, biotin and
cobalamin.
The number of predicted proteins involved in thiamine
biosynthesis was variable among the four target species. The P.
parvum and P. antarctica transcriptomes contained only the IscS
gene, which is a cysteine desulfurase (Fig. A in File S1). Although
this enzyme is part of the thiamine metabolic pathway, it also
functions in the sulfur relay system, which may explain its presence
in the two species that did not otherwise have other key thiamine
synthesis enzymes. In contrast, the two Chrysochromulina species,
and C. ericina especially, possessed an interesting composition of
genes that belong to this pathway. The synthesis of thiamine
pyrophosphate (TPP)—the biologically active form of thiamine—
begins with the formation of a pyrimidine moiety (HMP-PP) and a
thiazole moiety (HET-P). The former is formed by THIC and
THID from 5-aminoimidazole ribonucleotide (AIR), while the
latter is catalyzed by THI4 and THIM from NAD+, glycine and
an unknown sulfur-containing compound. In bacteria, HET-P is
synthesized de novo from 1-deoxy-D-xylulose 5-phosphate (DXP) by
a suite of different enzymes [54]. The ThiE enzyme catalyzes the
condensation of HMP-PP and HET-P to form thiamine mono-
phosphate. In some organisms, the function of THID and ThiE
are combined into one enzyme. Thiamine monophosphate is
dephosphorylated by an unknown phosphatase to form thiamine
that is then pyrophosphorylated by TPK into thiamine pyrophos-
phate. C. ericina has ThiE and TPK, and as such, given both the
pyrimidine moiety and the thiazole moiety, might be able to
synthesize TPP. However, C. brevifilum had the ThiDE and the
ThiE gene but not TPK, and might have a reduced and
Table 2. Basic statistics for the four transcriptomes sequenced in this study.
Species Transcriptome size (Mbp) No. of reads (million) No. of contigs No. of peptides N50
P. parvum 36.4 42.9 30,986 25,579 1612
C. brevifilum 35.3 35.6 40,494 29,229 1397
C. ericina 52.0 61.0 50,899 40,488 1297
P. antarctica 50.6 46.6 56,193 45,611 1384
doi:10.1371/journal.pone.0097801.t002
Transcriptomes of Prymnesiophyte Algae
PLOS ONE | www.plosone.org 4 June 2014 | Volume 9 | Issue 6 | e97801
potentially non-functional thiamine biosynthesis pathway (Fig. A
in File S1).
The presence of biotin metabolism genes in the four
transcriptomes was also variable. In bacteria, four enzymes
convert pimeloyl CoA to biotin in a sequential fashion, beginning
with BioF, followed by BioA, BioD and finally, BioB [55].
Genomes of protists that do not need exogenous thiamine such as
Thalassiosira pseudonana, Chlamydomonas reinhardtii and Cyanidioschyzon
merolae have been found to contain the bioF, bioA and bioB genes
(data culled from the KEGG database). However, because these
protists are able to synthesize biotin, it has been hypothesized that
an unknown enzyme might carry out the activity of the missing
BioD enzyme [56]. Regardless, none of our four prymnesiophytes
had all three genes. P. parvum had bioF and bioA while C. ericina and
P. antarctica had bioF and bioB. C. brevifilum only had the bioF gene.
All four prymnesiophyte species contained the CobW gene
sequence, which is annotated as a cobalamin synthesis protein.
The numbers of putative CobW genes differ among the four
transcriptomes, with the smallest number in P. parvum (2 copies)
and the largest in C. ericina (10 copies) (Table S2 in File S1). In
addition, C. brevifilum also had a predicted protein with sequence
similarity to cobyrinic acid a,c-diamide synthase, or CobB. C.
ericina and P. antarctica both had a CobN-like protein, which is a
cobaltochelatase. P. parvum, C. brevifilum and C. ericina all possessed
the B12-dependent form of methionine synthase MetH, but not the
B12-independent form, MetE. All four prymnesiophytes also had
the methylmalonyl-coA mutase (MCM) gene in their transcrip-
tomes (Table S2 in File S1).
Polyketide synthase genesOur datasets contained 15 putative polyketide synthase genes
with a ketosynthase (KS) domain. These sequences were found in
three out of four of the target species: P. parvum, C. brevifilum and P.
antarctica (Table S3 in File S1). The phylogeny of our prymnesio-
Figure 1. Core, shared and unique transcriptome genes in four prymnesiophyte species: Prymnesium parvum, Chrysochromulinabrevifilum, Chrysochromulina ericina and Phaeocystis antarctica. A) Venn diagram showing the number of shared or unique genes (in italics) andgene clusters (in bold) among the four prymnesiophytes as classified by the orthomcl program. Among the genes unique to each of the fourprymnesiophytes, multi-copy genes refer to genes that were present in gene clusters, single-copy genes refer to genes that did not cluster with anyother gene. Pp: Prymnesium parvum, Cb: Chrysochromulina brevifilum, Ce: Chrysochromulina ericina, Pa: Phaeocystis antarctica. B) Proportion ofannotated and unannotated genes in the ‘‘core’’ gene set, i.e. genes shared by all four species, and in the gene set unique to each species. C)Proportion of the transcripts that comprised core, shared and unique genes. Shared genes are genes present in two or three of the four species.Unique genes are genes that are only present in one species.doi:10.1371/journal.pone.0097801.g001
Transcriptomes of Prymnesiophyte Algae
PLOS ONE | www.plosone.org 5 June 2014 | Volume 9 | Issue 6 | e97801

phyte KS sequences was analyzed by generating a maximum
likelihood tree. This analysis showed that our prymnesiophyte KS
sequences fell into two distinct clusters (Fig. 2). All the sequences
from C. brevifilum and one sequence from P. antarctica (ORF4093)
clustered with E. huxleyi KS sequences in a prymnesiophyte-specific
PKS clade. Meanwhile, all the sequences from P. parvum and five
sequences from P. antarctica were dispersed among sequences from
a diverse group of species, including E. huxleyi, Karenia brevis and
various bacteria. All the sequences that fell into the prymnesio-
phyte-specific PKS clade contained multiple PKS domains (Table
S3 in File S1) with variable organizations. The longest PKS
sequence, ORF106225, contained two ketoreductase (KR), three
ketosynthase (KS) and five acyl-carrier protein (ACP) domains
(Fig. 3). Another sequence contained the KR, KS and ACP
domains as well as a leading dehydratase (DH) domain. A domain
that carries out adenylation (A domain) was found at the start of
ORF107078, followed by ACP, KS and KR domains (Fig. 3). In P.
antarctica, ORF4093 contained one ACP domain and one KS
domain. In contrast, sequences that clustered with the mixed
bacterial/protistan PKS clade only contained the KS domain.
KOG patternsEuKaryotic Orthologous Groups (KOGs) is a tool used to
identify orthologous and paralogous proteins in eukaryotes, and
assigns a functional category [48]. The overall distribution of
KOG functions of the four prymnesiophytes in this study was very
similar (Fig. 4). Generally, the KOG category with the greatest
number of peptides was O (posttranslational modification, protein
turnover, and chaperones). This was closely followed by R (general
function prediction only). The greatest difference between any two
species was observed for KOG function T, signal transduction
mechanisms. C. brevifilum had the greatest number of peptides
belonging to this category relative to the other species, followed by
C. ericina (2.1% less than C. brevifilum).
Comparing the KOG distribution of our four species to that of
other protists in an NMDS analysis resulted in distinct groupings
that appeared to reflect both phylogenetic relationships and
nutritional mode (Fig. 5). The stress value of the NMDS was 0.12,
indicating that the 2D plot was a good depiction of the separation
among the data. We found that heterotrophic species such as the
choanoflagellate, Monosiga brevicollis, the stramenopile, Paraphyso-
monas imperforata, the slime mold, Dictyostelium purpureaum and water
molds, Phytophthora capsici and P. ramorum, occupied a wide area of
the plot, but occupied a space separate from species that are
autotrophic or mixotrophic (Fig. 5). The autotrophs formed a
group that overlapped somewhat with species that are known to be
photosynthetic species capable of phagotrophy (i.e. mixotrophic).
The latter group had a large spread, mostly due to the position of
the dinoflagellates, which occupied an area distinct from other
groups. The prymnesiophytes and chrysophytes clustered together
in a region of overlap between non-phagotrophic autotrophic and
mixotrophic protists. Some phylogenetic groups formed distinct
clusters, such as the diatoms Pseudo-nitzschia arenysensi, Pseudo-
nitzschia delicatissima, Phaeodactylum tricornutum, Fragilariopsis cylindrus
and Leptocylindrus danicus. Additionally, the prasinophytes, Ostreo-
coccus and Micromonas, clustered together. In contrast, the other two
chlorophytes, Chlamydomonas reinhardtii and Chlamydomonas sp.
CCMP681 did not cluster with each other, and the chrysophyte
congeners, Ochromonas sp. CCMP1899 and Ochromonas sp. BG-1
also did not group together.
We undertook a more detailed principle components analysis
(PCA) to confirm and elucidate the NMDS results. The spatial
distribution of the PCA plot was in concordance with that of the
NMDS (Fig. 6), but the two principle axes accounted for only 54%
of the variability, indicating that 46% was not explained by this
representation. The top five variables that explained up to 40% of
the variability in the first axis were: C (energy production and
conversion), D (cell cycle and division), G (carbohydrate transport
and metabolism), R (general function prediction only) and J
(translation and ribosomal structure). Along the second axis, up to
55% of the variability could be accounted for by the following five
variables: A (RNA processing), T (signal transduction mecha-
nisms), L (replication, recombination and repair), Z (cytoskeleton)
and Y (nuclear structure).
Statistical analyses performed on each of the KOG functions
were able to tease out specific functions that were different based
on either phylogeny or trophic mode. In the original large dataset,
phylogenetic grouping had a statistically significant effect in ten
KOG categories (Table S4 in File S1), while trophic mode was
significant for six KOG categories. After removing the alveolates
and the chlorophytes, assuming that their strong phylogenetic
signal might bias the results, four KOG categories retained
significant differences based on trophic mode, namely: D (cell
cycle control, cell division and chromosome partitioning), G
(carbohydrate transport and metabolism), H (coenzyme transport
and metabolism) and K (transcription).
Box plots of the frequencies of the different KOG categories
showed interesting patterns (Fig. 7). Grouped by phylogenetic
relatedness, alveolates generally had KOG functions that differed
from chlorophytes, prymnesiophytes and stramenopiles (Fig. 7:
column of panels on left). These patterns were different for taxa
grouped by nutritional modes (), once the alveolates were removed
to reduce their strong effect (Fig. 7: column of panels on right). For
example, the frequency of KOG function D (cell cycle control, cell
division and chromosome partitioning, top row of panels) was
significantly different for mixotrophic species compared to
heterotrophs and autotrophs, which were similar to each other
(Fig. 7: top right panel). For KOG category G (carbohydrate
transport and metabolism, right hand column, panel second from
top), all three trophic modes had frequencies that were statistically
significant from each other. In category H (coenzyme transport
and metabolism, right hand column, panel third from top), the
heterotrophic group was significantly different from the mixo-
trophic and photosynthetic groups. The frequency of KOG
function K (Transcription, bottom right panels) was significantly
different in the mixotrophs compared to the phototrophs, but not
significantly different compared to the heterotrophs. There was no
significant difference between the heterotrophs and the photo-
trophs for this KOG category.
Discussion
The numbers of predicted peptides for the four species in this
study varied greatly, but were within the range of other MMETSP
dataset transcriptomes and the number of predicted protein
coding genes in E. huxleyi (30,569) [53]. The high number of
peptides was not due to bacterial contamination because
preparation of the cDNA biased against bacterial mRNA, and
we observed negligible numbers of bacterial genes in the
transcriptomes. It is possible that the large number of peptides
in part reflects the existence of fragments of the same gene called
as two different genes in cases where the sequence that joins the
two fragments was not sequenced. However, the N50 for these
four datasets were between 1,297 and 1,612 aa (Table 2), which is
close to the average gene length for eukaryotes [57].
Transcriptomes of Prymnesiophyte Algae
PLOS ONE | www.plosone.org 6 June 2014 | Volume 9 | Issue 6 | e97801

Transcriptomes of Prymnesiophyte Algae
PLOS ONE | www.plosone.org 7 June 2014 | Volume 9 | Issue 6 | e97801

Core, shared and unique genesOur results indicate that the four prymnesiophytes in our study
share a core set of genes that may also be more broadly shared
among other prymnesiophytes. These genes code for essential
cellular and metabolic functions such as carbon metabolism,
amino acid synthesis, DNA synthesis and fatty acid metabolism.
The transcriptomes also contained ‘‘shared’’ genes, that were
observed in two or three of the four target species. There is limited
data on how much physiological diversity might be present among
congeneric protistan species because these taxa have been
traditionally defined based on morphological features. Therefore,
we were interested in what our data might reveal about relatively
closely related taxa. The congeners C. brevifilum and C. ericina
shared more gene clusters with each other than either did with P.
parvum or P. antarctica. The proportion of genes shared between
these two species (5%) was greater than the proportion of genes
Thalassiosira pseudonanna (a centric diatom) shared with Fragilariopsis
cylindrus (3%) and Pseudo-nitzschia multiseries (2%) (pennate diatoms),
but much lower than the proportion of genes shared between F.
cylindrus and P. multiseries (26–28%) [58].
The remainder of the genes in each of our four prymnesiophyte
transcriptomes were only found in a single species (Fig. 1A, C).
Approximately half of the transcriptome of C. brevifilum, the species
with the largest transcriptome in our study, consisted of genes
unique to that species. However, this percentage is within the
range of other studies. The proportion of unique genes in our four
transcriptomes (37–52%) was similar to the results of a study that
compared three diatom transcriptomes: Thalassiosira pseudonana,
Fragilariopsis cylindrus and Pseudo-nitzschia multiseries (39–43%) [58]. A
majority of our unique proteins were not annotated due to the
limited genomic databases for free-living, environmentally relevant
microeukaryotes. Consequently, the proportion of peptides that
were annotated in this study (33% to 47%) was similar to recent
results that have been obtained for other sequenced protistan
transcriptomes. For example, 41% and 31% of the transcriptomic
sequences obtained from two dinoflagellates within the genus
Symbiodinium were annotated [59], while 33% of the contigs from
another dinoflagellate transcriptome, Heterocapsa circularisquama
were annotated [60]. Only 23% of the transcriptome of the
heterotrophic dinoflagellate, Oxyrrhis marina, could be annotated
using a variety of databases, including Genbank’s nr database [61].
The same pattern of a highly annotated core genome compared to
poorly annotated unique genes has also been reported previously
[62].
B-vitamin biosynthesis genesEach of our four prymnesiophytes showed slightly different
abilities to synthesize vitamins. This result was not surprising as
such differences have been observed within genera and even
among different strains of the same species of algae [63].
Thiamine is a cofactor for enzymes involved in many different
metabolic pathways, including carbohydrate and amino acid
metabolism. Thiamine auxotrophy is widespread among protistan
species, with 20% of eukaryotic phytoplankton surveyed requiring
exogenous thiamine [56]. The proportion of thiamine auxotrophs
was found to be even higher among harmful algal bloom species,
at almost 74% (n = 27) [63]. Hence, the ability to synthesize this
vital molecule might confer an ecological advantage to marine
protists, rather than scavenging exogenous thiamine. Previous
studies have indicated that P. parvum is a thiamine auxotroph [64]
and that prymnesiophytes in general tend to require thiamine for
growth [56,63]. Our dataset indicates a difference between the two
Chrysochromulina species and P. parvum and P. antarctica in the
number of enzymes for thiamine synthesis present in their
transcriptome, implying that these species may also differ in their
ability to make thiamine. Based on the genes that are present in
the transcriptomes, it would seem that P. parvum and P. antarctica
are least likely to be able to synthesize thiamine while C. brevifilum
and C. ericina may be able to synthesize the vitamin, either de novo,
or from an intermediate in the pathway. Past studies have shown
that in some species, the need for exogenous thiamine was
alleviated when either the thiazole or pyrimidine moiety was
added to the growth medium [65]. This might provide a species
with some flexibility competing against other organisms that
specifically require thiamine for growth. It is also possible that the
ThiD, ThiE, ThiDE, ThiF and TPK enzymes that are present in
the two Chrysochromulina spp. are remnants of the thiamine pathway
and do not represent a functional thiamine biosynthesis pathway.
Some of these genes have also been found in Ostreococcus tauri and
Micromonas pusilla CCMP1545, both of which are thiamine
auxotrophs [62,66].
Biotin is a cofactor for carboxylase enzymes that are used in
fatty acid synthesis, and thus is required across all domains of life.
All the haptophytes surveyed in a previous study did not require
Figure 2. Polyketide synthase maximum likelihood tree with 100 iterated bootstraps using only the keto-synthase (KS) domain. Thetree was inferred using MEGA5 (Tamura et al. 2011) with maximum likelihood method based on Jones-Taylor-Thornton model. The analysis involved78 amino acid sequences. All positions with less than 95% site coverage were eliminated. There were 181 total sites in the final dataset. Bootstrapsupport values, if greater than 50%, are shown as the percentages of 100 trees inferred in the analysis. The scale bar represents the number ofsubstitutions per site. The tree is rooted with Aspergillus nidulans polyketide synthase. Sequences from our dataset are shown in bold. Multiplebranches have the same identifying ORFs,GI or accession numbers due to multiple KS domains on the same gene.doi:10.1371/journal.pone.0097801.g002
Figure 3. Putative domain organization and length of polyke-tide synthase sequences in genes containing more than onedomain, as annotated by the NRPS-PKS tool. KR: ketoreductase,ACP: acyl carrier protein, KS: keto-synthase, DH: dehydratase, A:adenylation.doi:10.1371/journal.pone.0097801.g003
Transcriptomes of Prymnesiophyte Algae
PLOS ONE | www.plosone.org 8 June 2014 | Volume 9 | Issue 6 | e97801

biotin [56] but it was not an exhaustive survey. None of our four
target species contained all three biotin synthesis genes found in C.
reinhardtii, T. pseudonanna and C. merolae, three species capable of
biotin synthesis. It is, of course, still possible that a functional
biosynthetic pathway is present in our target prymnesiophytes due
to the presence of yet-unidentified enzymes.
So far, only prokaryotes have been shown to synthesize
cobalamin, but many protists require cobalamin for the synthesis
of amino acids and deoxyriboses, and for C1 metabolism.
Examples of enzymes that require cobalamin include methionine
synthase (METH) and methylmalonyl coA mutase (MCM).
Previous studies have shown P. parvum to have a specific and
non-replaceable requirement for cobalamin in its growth media
[67,68], and P. globosa, which is a congener of P. antarctica, also
requires exogenous cobalamin [63]. The lack of all but one or two
genes in the cobalamin biosynthetic pathway and the necessity of
exogenous cobalamin in the growth media of most microalgae
strongly indicate that all four of our study species are unable to
synthesize cobalamin and are dependent on external cobalamin.
Additionally, only METH was present in our datasets, and not
METE, the cobalamin-independent form of methionine synthase.
The latter is strongly correlated with cobalamin independence
[69]. We also found putative MCM genes in all four transcrip-
tomes, further evidence for cobalamin dependence among our
four target organisms.
Macronutrients such as nitrogen and phosphorus have long
been known to be important factors structuring species compo-
sition and distribution in the ocean, but in recent years
micronutrients such as vitamins have been found to also play an
important role [56,63,66]. Our comparative transcriptome anal-
ysis of four prymnesiophytes has revealed potential differences in
the ability of these closely related species to synthesize some B-
vitamins, perhaps indicating unique metabolic abilities or depen-
dences that might explain differences in their autecologies.
Polyketide synthasePolyketide synthase genes are thought to be involved in the
synthesis of at least some of the toxins that have been found in P.
parvum and C. polylepsis [70,71]. Two of the toxins produced by P.
parvum that have been isolated to date, prym1 and prym2
[70,72,73] are ladder-like polycyclic ethers that resemble other
algal toxins produced by Type I PKS genes such as brevitoxin and
okadaic acid, the latter compounds produced by marine dinofla-
gellates [74,75].
Type I PKS are modular, multi-domain proteins that are
similar to proteins involved in fatty acid synthesis (FAS). These
proteins sequentially add acyl units onto a growing carbon chain
via a condensation reaction. The following three domains are
required for the synthesis of polyketide molecules: ketosynthase
(KS), acyltransferase (AT) and acyl-carrier protein (ACP). Addi-
tional domains encode ketoreductase (KR), dehydratase (DH) and
enoyl reductase (ER) proteins, which catalyze the reduction of the
initial 2-, 3- and 4-carbon skeletons. The thioesterase (TE) domain
releases the polyketide molecule from its attachment site when the
final chain length has been achieved [70].
In general, these domains are organized into modules, with each
module containing the domains that are required for one round of
chain elongation and modification [70]. However, PKS sequences
have been found in K. brevis that contain only one or two catalytic
domains [75], similar to some of the sequences in our dataset. A
previous study in C. polylepsis found KS, KR and AT domains in
their EST dataset, but no information was provided on how these
domains were organized, likely due to the short average sequence
length (,600 bp) [72]. As such, there is insufficient information to
Figure 4. KOG function distribution of the peptides for the four target species in this study. The KOG functions are as follows: A: RNAprocessing and modification; B: chromatin structure and dynamics; C: Energy production and conversion; D: Cell cycle control, cell division,chromosome partitioning; E: Amino acid transport and metabolism; F: Nucleotide transport and metabolism; G: Carbohydrate transport andmetabolism; H: Coenzyme transport and metabolism; I: Lipid transport and metabolism; J: Translation, ribosomal structure and biogenesis; K:Transcription; L: Replication, recombination and repair; M: Cell wall/membrane/envelope biogenesis; N: Cell motility; O: Posttranslationalmodification, protein turnover, chaperones; P: Inorganic ion transport and metabolism; Q: Secondary metabolites biosynthesis, transport andcatabolism; R: General function prediction only; S: Function unknown; T: Signal transduction mechanisms; U: Intracellular trafficking, secretion andvesicular transport; V: Defense mechanisms; W: Extracellular structures; Y: Nuclear structure; Z: Cytoskeleton.doi:10.1371/journal.pone.0097801.g004
Transcriptomes of Prymnesiophyte Algae
PLOS ONE | www.plosone.org 9 June 2014 | Volume 9 | Issue 6 | e97801

ascertain what a ‘typical’ PKS gene might look like in a
prymnesiophyte. Even within the transcriptome of a single species,
i.e. C. brevifilum, the putative PKS sequences were of different
lengths and had different numbers and organization of domains
(Fig. 3). Thus, they may be responsible for synthesizing polyketide
molecules of different lengths and configurations.
Our results also indicated the existence of two different KS gene
families within our prymnesiophyte datasets, one comprising
prymnesiophyte-specific sequences and one containing sequences
from diverse bacterial and protistan species (Fig. 2). All of the P.
parvum KS sequences clustered with the latter clade. P. parvum was
grown axenically in our study, thus the sequences could not have
been derived from a bacterium. While the mixed bacterial/
protistan clade itself is not well-supported, the subclade containing
the P. parvum, P. antarctica (except one) and E. huxleyi sequences was
a well-supported clade in our dataset. A previously sequenced P.
parvum PKS sequence from an EST library [76] was also found
within this mixed bacterial/protistan PKS cluster. It is unknown if
the toxigenic C. polylepsis KS sequences would group with the P.
parvum and P. antarctica sequences or with the C. brevifilum
sequences, but to our knowledge the C. polylepsis sequences are
not in public databases.
The prymnesiophyte-specific clade was more closely related to
the Ostreococcus sequences than to the dinoflagellate-specific clade, a
finding similar to a previous study [77], and may suggest a
common origin for green algal and prymnesiophyte PKS distinct
from that of the dinoflagellates. It may be significant that all of the
PKS sequences that clustered with the haptophyte-specific clade
contained multiple domains whereas the sequences in the mixed
bacterial/protistan clade only contained the KS domain. Howev-
Figure 5. Nonmetric multidimensional scaling (NMDS) plot of the KOG distributions of the four prymnesiophytes in this study andof other protistan genomes and transcriptomes. The genomes were obtained from the Joint Genome Institute database, and thetranscriptomes were obtained from the Marine Microbial Environmental Transcriptome Sequencing Project (MMETSP) database. The stress value forthis plot was 0.12, which indicates that the two-dimensional plot is a good representation of the data. The four target species in this study arehighlighted in boxes. The trophic modes of each organism are denoted in green (phototrophs), black (heterotrophs) and red (mixotrophs).doi:10.1371/journal.pone.0097801.g005
Transcriptomes of Prymnesiophyte Algae
PLOS ONE | www.plosone.org 10 June 2014 | Volume 9 | Issue 6 | e97801

er, it is important to be cautious when interpreting these results
because this and other PKS trees tend to have large sequence
divergences and lack a suitable outgroup, which results in poorly
supported branching order.
Analysis of KOG relative abundances reveals interestingclustering patterns
The functional annotations of the four prymnesiophytes using
the KOG database did not differ markedly, presumably because
they share similar core functions (Fig. 4). This similarity may be a
consequence of the close phylogenetic relationship among these
four species, or because they share similar physiologies or
nutritional modes, factors which are not mutually exclusive. Three
of the four prymnesiophytes examined in this study exhibit
phagotrophic behavior but one, P. antarctica, is so far not known to
be mixotrophic [78]. Nonetheless, there were no clear differences
in the KOG functions between the three known mixotrophs and
the non-mixotrophic P. antarctica in our study (Fig. 4). However,
when we included KOG data from other protistan species in a
non-metric multidimensional scaling (NMDS) analysis and a
principal components analysis (PCA), some interesting patterns
emerged (Figs. 5, 6). Our subsequent statistical analysis therefore
took into account the effects of both trophic mode and
phylogenetic grouping.
Phylogenetic identity appeared to be a significant determinant
of the species clusters on the NMDS plot (Fig. 5). For example,
alveolate taxa (dinoflagellates and a ciliate) clustered separately
from all other species, presumably indicating a strong phylogenetic
signal in their transcriptomes. Dinoflagellates generally have large
genomes, and a lot of genes appear to be constitutively expressed
and modified post-translationally [79]. This tendency might result
in a greater variety of transcribed genes and hence, larger
variations in their transcriptomes and in their KOG distribution
patterns, and explain why these organisms occupy a location far
away from other species on the NMDS plot, as well as being
relatively spread out from each other compared to other
phylogenetic groups.
Other apparently phylogenetic-based groupings on the NMDS
plot included the diatoms which all clustered close to on another,
and the chlorophytes with one notable exception. The outlier from
this cluster,C. reinhardtii, showed greater similarity to heterotrophic
species than to its congener, Chlamydomonas sp. CCMP681.
Chlamydomonas sp. CCMP681 [80] was isolated from the Southern
Ocean near Antarctica while C. reinhardtii is usually found in
freshwater ecosystems and in soil [81]. We speculate that the
substantial distance between these congeners on the NMDS plot
could be due to differences in physiological adaptations to very
different habitats. Interestingly, the two Ochromonas species were
also situated some distance from each other on the NMDS plot.
Ochromonas clone CCMP1899 was isolated from the Ross Sea,
Antarctica, while clone BG-1 is a freshwater isolate from a
botanical garden in Malaysia.
Another interesting pattern observed in the NMDS analysis was
the tendency for organisms to cluster based on similar nutritional
modes but distant phylogenetic relationships. Heterotrophic taxa,
including the water molds (oomycetes), a slime mold (mycetozoa),
a choanoflagellate and a heterotrophic chrysomonad all clustered
away from those taxa possessing phototrophic ability (including the
kleptoplastidic ciliate, Mesodinium pulex). This pattern is perhaps not
unexpected because these heterotrophic taxa would presumably
lack the photosynthetic machinery possessed by phototrophic
protists, but it is interesting that the broad grouping of the
Figure 6. Principal component analysis (PCA) plot of the KOG distributions of the four prymnesiophytes in this study and of otherprotistan genomes and transcriptomes. The same dataset from Fig. 5 was used to generate this figure. The color scheme and speciesidentification by numbering also correspond to Fig. 5. Explained cumulative variability for this plot was 54.2%, with eigenvalues of 8.5 (F1) and 4.5(F2). Only top variables for F1 and F2 are plotted in the graph.doi:10.1371/journal.pone.0097801.g006
Transcriptomes of Prymnesiophyte Algae
PLOS ONE | www.plosone.org 11 June 2014 | Volume 9 | Issue 6 | e97801

transcriptomes of these heterotrophs appear to reflect their
nutritional mode.
Aureococcus anophagefferens and Chlamydomonas reinhardtii are labeled
as phototrophs in the NMDS plot, yet these taxa occurred
relatively close to the heterotrophic protists. As noted above, the
habitat for C. reinhardtii is quite different than for most of the
photrophic protists examined in this study. A. anophagefferens has
strong osmotrophic capabilities [82,83], which may explain its
Figure 7. Box plots of the proportion of genes assigned to KOG functions that had a statistically significant difference amongphylogenetic and trophic modes (see Table S4). A) The full dataset of 41 species (excluding the mycetozoan Dictyostelium purpureum, thechoanoflagellate Monosiga brevicollis and the rhodophyte Cyanidioschyon merolae) showing the proportion of genes annotated with a particular KOGfunction and grouped by higher-level taxonomic affiliation; B) A reduced dataset of the proportion of genes assigned to particular KOG function inthe prymnesiophytes and stramenopiles, grouped by trophic modes. The alveolates and chlorophytes were excluded to reduce phylogenetically-based bias in the dataset. Small case letters over each bar summarize the different statistical groups found by multiple pairwise comparisons. Redcrosses indicate the mean for each group and black dots represent the outliers.doi:10.1371/journal.pone.0097801.g007
Transcriptomes of Prymnesiophyte Algae
PLOS ONE | www.plosone.org 12 June 2014 | Volume 9 | Issue 6 | e97801

proximity to the other heterotrophs on the NMDS plot, albeit at
lesser proximity than C. reinhardtii to the heterotrophs.
The non-alveolate mixotrophs in our dataset (chrysophytes and
prymnesiophytes, including three of the four species examined in
this study) formed a cluster on the NMDS plot that occupied a
central space between the alveolates on the left side of the plot,
chlorophytes and diatoms above, and heterotrophs to the right
(Fig. 5A). Our fourth prymnesiophyte, P. antarctica, also clustered
with these species. Their intermediate position on the plot between
purely (or predominantly) photosynthetic organisms and exclu-
sively heterotrophic species may reflect the mixed nutritional
mode that is characteristic of these organisms. Phagotrophic algae
possess the cellular machinery that allows them to carry out
photosynthesis, therefore their KOG distribution might be
expected to exhibit a fair amount of similarity with phototrophic
protists. It is interesting that while a comparison of four closely
related species did not reveal large differences in KOG functions,
comparing these four species with a larger set of protistan taxa
resulted in distinct clusters based on phylogeny, or nutritional
mode, or both, despite the fact that only a small fraction of the
transcriptomes of these organisms could be assigned KOG
annotations at this time. One might expect that physiological
differences between heterotrophs, phototrophs and mixotrophs
could be explained by the presence or absence of particular
pathways (e.g. photosynthetic pathways), but the distribution of
annotated genes within certain KOG functions were also different.
Our data provide some good starting points for probing more in-
depth differences among protists with different nutritional modes.
For instance, it might be expected that an in-depth analysis of
KOG category G (carbohydrate transport and metabolism) might
unveil a greater diversity of isoenzymes to process and digest
different sugars synthesized by prey. In this regard, we also
observed differences in the KOG category H (coenzyme transport
and metabolism), which is not that surprising as phototrophs and
heterotrophs would likely have differences in this category because
prey biomass might be able to supply some of these necessary
molecules for enzymatic reactions.
Our data and analysis have demonstrated the utility of
transcriptomic data for analyzing functional and physiological
capabilities of closely-related or nutritionally similar protists.
Despite the present paucity of reference databases that presently
allow only a small fraction of the peptides in this study to be
annotated, we were nonetheless able to gain insight by comparing
the four transcriptomes to each other, and to other transcriptomes
that were available in public databases. The ability to more fully
annotate these datasets will add significantly to the depth of future
analyses, by enabling a fuller elucidation of pathways and
functions that are shared or novel among the species. In this
study, we were able to show that four prymnesiophytes share a set
of core genes that mostly comprise the essential metabolic and
cellular pathways in the cell. We also found evidence to suggest
that investigations into functional and perhaps, by extension,
ecological differences between closely related species should be
focused on ‘‘secondary’’ pathways such as vitamin biosynthesis or
secondary metabolic pathways. Finally, our data indicated that the
nutritional mode of a species, as well as its phylogeny, can
influence the proportion of its genome that is devoted to specific
KOG functions.
Supporting Information
File S1 Contains Tables S1–S4 and Figure A. Table S1.
Number of contigs containing rRNAs and tRNAs in each
transcriptome. Table S2. Predicted proteins related tocobalamin biosynthesis. METH: B12-dependent methionine
synthase; MCM: methylmalonyl-CoA mutase; CobB: cobyrinic
acid a,c-diamine synthase; CobNST: CobN subunit of cobalto-
chelatase; CobW: protein putatively involved in cobalamin
biosynthesis but its specific catalytic role is unclear. Table S3.Proteins containing polyketide synthase ketosynthase(KS) domains. Table S4. Results of the non-parametricKrustal-Wallis tests for each KOG function. The influence
of phylogeny and trophic mode was tested independently with a
non-parametric Krustal-Walis test followed by a Steel-Fligner test
if significant differences were observed. All calculations done with
XLSTAT (v.2013.06.04, Adinsoft TM) with an alpha of 0.01. Two
data sets were used in this statistical analysis: (1) a dataset with
most of the species present in Figure 4 but for the Mycetozoa D.
purpureaum, the Choanoflagellate M. brevicollis and the Rhodophyte
C. merolae due to statistical reasons; and (2) a reduced dataset
considering only the Stramenopiles and Prymnesiophyta. Abrevia-
tions as follows: NS, not significant; YES, significant difference
detected. Figure A. Key components of the thiaminebiosynthesis pathway. Colored squares represent presence in
Prymnesium parvum (brown), Chrysochromulina brevifilum (red), Chryso-
chromulina ericina (blue), and Phaeocystis antarctica (green). In some
organisms, the functionalities of THID and ThiE are combined
into a single enzyme, such as ThiDE. Abbreviations: HMP-P, 4-
amino-2-methyl-5-hydroxymethylpyrimidine phosphate; HMP-
PP, 4-amino-2-methyl-5-hydroxymethylpyrimidine pyrophos-
phate; HET-P, hydroxyethylthiazole phosphate; DXP, 1-deoxy-
D-xylulose 5-phosphate.
(DOCX)
Acknowledgments
We would like to thank K. David Hambright (University of Oklahoma) for
making the culture of Prymnesium parvum available, Victoria Campbell for
harvesting the RNA, and John Heidelberg for his discussions on
bioinformatics analysis procedures. We would also like to acknowledge
the two anonymous reviewers whose comments and suggestions greatly
improved this manuscript.
Author Contributions
Conceived and designed the experiments: AK ACJ DAC KBH. Performed
the experiments: AK ACJ. Analyzed the data: AK ZL RT DAC KBH.
Contributed reagents/materials/analysis tools: AK ZL RT DAC KBH.
Wrote the paper: AK RT DAC KBH.
References
1. Caron DA, Worden AZ, Countway PD, Demir E, Heidelberg KB (2009) Protists
are microbes too: a perspective. ISME J 3: 4–12. doi:10.1038/ismej.2008.101.
2. Pagani I, Liolios K, Jansson J, Chen IMA, Smirnova T, et al. (2012) The
Genomes OnLine Database (GOLD) v.4: status of genomic and metagenomic
projects and their associated metadata. Nucleic Acids Res 40: D571–D579.
3. Anantharaman V, Iyer L, Aravind L (2007) Comparative Genomics of Protists:
New Insights into the Evolution of Eukaryotic Signal Transduction and Gene
Regulation. Annu Rev Microbiol 61: 453–475.
4. Unrein F, Massana R, Alonso-Saez L, Gasol JM (2007) Significant year-round
effect of small mixotrophic flagellates on bacterioplankton in an oligotrophic
coastal system. Limnol Oceanogr 52: 456–469.
5. Hartmann M, Grob C, Tarran GA, Martin AP, Burkill PH, et al. (2012)
Mixotrophic basis of Atlantic oligotrophic ecosystems. Proc Natl Acad Sci USA
109: 5756–5760. doi:10.1073/pnas.1118179109.
6. Zubkov MV, Tarran GA (2008) High bacterivory by the smallest phytoplankton
in the North Atlantic Ocean. Nature 455: 224–226.
Transcriptomes of Prymnesiophyte Algae
PLOS ONE | www.plosone.org 13 June 2014 | Volume 9 | Issue 6 | e97801

7. Jeong HJ, Yoo YD, Kim JS, Seong KA, Kang NS, et al. (2010) Growth, feedingand ecological roles of the mixotrophic and heterotrophic dinoflagellates in
marine planktonic food webs. Ocean Sci J 45: 65–91.
8. Sanders RW (1991) Mixotrophic protists in marine and freshwater ecosystems.
J Protozool 38: 76–81. doi:10.1111/j.1550-7408.1991.tb04805.x.
9. Sanders RW (2011) Alternative nutritional strategies in protists: symposium
introduction and a review of freshwater protists that combine photosynthesis and
heterotrophy. J Eukaryot Microbiol 58: 181–184. doi:10.1111/j.1550-7408.2011.00543.x.
10. Liu H, Probert I, Uitz J, Claustre H, Aris-Brosou S, et al. (2009) Extreme
diversity in noncalcifying haptophytes explains a major pigment paradox in openoceans. Proc Natl Acad Sci USA 106: 12803–12808.
11. Cuvelier ML, Allen AE, Monier A, McCrow JP, Messie M, et al. (2010)
Targeted metagenomics and ecology of globally important unculturedeukaryotic phytoplankton. Proc Natl Acad Sci USA 107: 14679–14684.
12. Unrein F, Gasol JM, Not F, Forn I, Massana R (2014) Mixotrophic haptophytes
are key bacterial grazers in oligotrophic coastal waters. ISME J 8: 164–176.doi:10.1038/ismej.2013.132.
13. Bielewicz S, Bell E, Kong W, Friedberg I, Priscu JC, et al. (2011) Protist diversity
in a permanently ice-covered Antarctic lake during the polar night transition.ISME J 5: 1559–1564. doi:10.1038/ismej.2011.23.
14. Kong W, Ream DC, Priscu JC, Morgan-Kiss RM (2012) Diversity and
expression of RubisCO genes in a perennially ice-covered Antarctic lake during
the polar night transition. Appl Environ Microbiol 78: 4358–4366. doi:10.1128/AEM.00029-12.
15. Chavez FP, Buck KR, Barber RT (1990) Phytoplankton taxa in relation to
primary production in the equatorial Pacific. Deep Sea Res 37: 1733–1752.doi:10.1016/0198-0149(90)90074-6.
16. Green J (1991) Phagotrophy in prymnesiophyte flagellates. In: Patterson DJ,
Larsen J, editors. Systematics Association Special Volume Series; The BiologyOf Free-Living Heterotrophic Flagellates. Oxford: Clarendon Press. pp. 401–
414.
17. Jones AC, Liao TSV, Najar FZ, Roe BA, Hambright KD, et al. (2013)Seasonality and disturbance: annual pattern and response of the bacterial and
microbial eukaryotic assemblages in a freshwater ecosystem. Environ Microbiol15: 2557–2572. doi:10.1111/1462-2920.12151.
18. Moestrup Ø (1994) Economic aspects: blooms, nuisance species, and toxins. In:
Green J, Leadbeater BSC, editors. The Haptophyte Algae. Systematics
Association Special Vol. 51. Oxford: Clarendon Press. pp. 265–285.
19. Thomsen HA, Buck KR, Chavez FP (1994) Haptophytes as components of
marine phytoplankton. Green J, Leadbeater B, editors Oxford: Clarendon Press.
pp 187–208.
20. Hansen PJ, Nielsen TG, Kaas H (1995) Distribution and growth of protists andmesozooplankton during a bloom of Chrysochromulina spp. (Prymnesiophyceae,
Prymnesiales). Phycologia 34: 409–416.
21. Edvardsen B, Imai I (2006) The ecology of harmful flagellates withinPrymnesiophyceae and Raphidophyceae. In: Graneli E, Turner J, editors.
Ecology of Harmful Algae. Berlin: Springer. pp. 67–79.
22. Smith WO, Codispoti LA, Nelson DM, Manley T, Buskey EJ, et al. (1991)Importance of Phaeocystis blooms in the high-latitude ocean carbon cycle. Nature
352: 514–516. doi:10.1038/352514a0.
23. DiTullio GR, Grebmeier JM, Arrigo KR, Lizotte MP, Robinson DH, et al.(2000) Rapid and early export of Phaeocystis antarctica blooms in the Ross Sea,
Antarctica. Nature 404: 595–598. doi:10.1038/35007061.
24. Nygaard K, Tobiesen A (1993) Bacterivory in algae: a survival strategy duringnutrient limitation. Limnol Oceanogr 38: 273–279.
25. Carvalho WF, Graneli E (2010) Contribution of phagotrophy versus autotrophy
to Prymnesium parvum growth under nitrogen and phosphorus sufficiency anddeficiency. Harmful Algae 9: 105–115.
26. Tillmann U, Hesse KJ, Tillmann A (1999) Large-scale parasitic infection of
diatoms in the North Frisian Wadden Sea. J Sea Res 42: 255–261.
27. Hansen PJ, Hjorth M (2002) Growth and grazing responses of Chrysochromulina
ericina (Prymnesiophyceae): the role of irradiance, prey concentration and pH.
Mar Biol 141: 975–983.
28. Jones HLJ, Leadbeater BSC, Green JC (1993) Mixotrophy in marine species ofChrysochromulina (Prymnesiophyceae): ingestion and digestion of a small green
f lagel la te . J Mar Biol Assoc UK 73: 283–296. doi:10.1017/
S0025315400032859.
29. Simpson JT, Durbin R (2012) Efficient de novo assembly of large genomes usingcompressed data structures. Genome Res 22: 549–556. doi:10.1101/
gr.126953.111.
30. Simpson JT, Wong K, Jackman SD, Schein JE, Jones SJM, et al. (2009) ABySS:a parallel assembler for short read sequence data. Genome Res 19: 1117–1123.
doi:10.1101/gr.089532.108.
31. Li R, Li Y, Kristiansen K, Wang J (2008) SOAP: short oligonucleotidealignment program. Bioinformatics 24: 713–714. doi:10.1093/bioinformatics/
btn025.
32. Chevreux B, Pfisterer T, Drescher B, Driesel AJ, Muller WEG, et al. (2004)Using the miraEST assembler for reliable and automated mRNA transcript
assembly and SNP detection in sequenced ESTs. Genome Res 14: 1147–1159.doi:10.1101/gr.1917404.
33. Li H, Durbin R (2009) Fast and accurate short read alignment with Burrows-
Wheeler transform. Bioinformatics 25: 1754–1760. doi:10.1093/bioinformatics/
btp324.
34. Li W, Godzik A (2006) Cd-hit: a fast program for clustering and comparing large
sets of protein or nucleotide sequences. Bioinformatics 22: 1658–1659.
doi:10.1093/bioinformatics/btl158.
35. Huang X, Madan A (1999) CAP3: A DNA sequence assembly program.
Genome Res 9: 868–877.
36. Lagesen K, Hallin P, Rødland EA, Staerfeldt H-H, Rognes T, et al. (2007)
RNAmmer: consistent and rapid annotation of ribosomal RNA genes. Nucleic
Acids Res 35: 3100–3108. doi:10.1093/nar/gkm160.
37. Lowe TM, Eddy SR (1997) tRNAscan-SE: a program for improved detection of
transfer RNA genes in genomic sequence. Nucleic Acids Res 25: 955–964.
38. Iseli C, Jongeneel CV, Bucher P (1999) ESTScan: a program for detecting,
evaluating, and reconstructing potential coding regions in EST sequences. Proc
Int Conf Intell Syst Mol Biol: 138–148.
39. Lottaz C, Iseli C, Jongeneel CV, Bucher P (2003) Modeling sequencing errors by
combining Hidden Markov models. Bioinformatics 19: Suppl 2 ii103–ii112.
doi:10.1093/bioinformatics/btg1067.
40. Altschul SF, Gish W, Miller W, Myers EW, Lipman DJ (1990) Basic local
alignment search tool. J Mol Biol 215: 403–410. doi:10.1016/S0022-
2836(05)80360-2.
41. Zhang Z, Wood WI (2003) A profile hidden Markov model for signal peptides
generated by HMMER. Bioinformatics 19: 307–308.
42. Finn RD, Mistry J, Tate J, Coggill P, Heger A, et al. (2010) The Pfam protein
families database. Nucleic Acids Res 38: D211–22. doi:10.1093/nar/gkp985.
43. Haft DH, Loftus BJ, Richardson DL, Yang F, Eisen JA, et al. (2001)
TIGRFAMs: a protein family resource for the functional identification of
proteins. Nucleic Acids Res 29: 41–43.
44. Gough J, Karplus K, Hughey R, Chothia C (2001) Assignment of homology to
genome sequences using a library of hidden Markov models that represent all
proteins of known structure. J Mol Biol 313: 903–919. doi:10.1006/
jmbi.2001.5080.
45. Chen F, Mackey AJ, Stoeckert CJ, Roos DS (2006) OrthoMCL-DB: querying a
comprehensive multi-species collection of ortholog groups. Nucleic Acids Res 34:
D363–8. doi:10.1093/nar/gkj123.
46. Bachmann BO, Ravel J (2009) Chapter 8 Methods for in silico prediction of
microbial polyketide and nonribosomal peptide biosynthetic pathways from
DNA sequence data. Methods Enzymol 458: 181–217. doi:10.1016/S0076-
6879(09)04808-3.
47. Tamura K, Peterson D, Peterson N, Stecher G, Nei M, et al. (2011) MEGA5:
molecular evolutionary genetics analysis using maximum likelihood, evolution-
ary distance, and maximum parsimony methods. Mol Biol Evol 28: 2731–2739.
doi:10.1093/molbev/msr121.
48. Tatusov RL, Fedorova ND, Jackson JD, Jacobs AR, Kiryutin B, et al. (2003)
The COG database: an updated version includes eukaryotes. BMC Bioinfor-
matics 4: 41.
49. Koonin EV, Fedorova ND, Jackson JD, Jacobs AR, Krylov DM, et al. (2004) A
comprehensive evolutionary classification of proteins encoded in complete
eukaryotic genomes. Genome Biol 5: R7. doi:10.1186/gb-2004-5-2-r7.
50. Grigoriev IV, Nordberg H, Shabalov I, Aerts A, Cantor M, et al. (2012) The
genome portal of the Department of Energy Joint Genome Institute. Nucleic
Acids Res 40: D26–32. doi:10.1093/nar/gkr947.
51. Sun S, Chen J, Li W, Altintas I, Lin A, et al. (2011) Community
cyberinfrastructure for Advanced Microbial Ecology Research and Analysis:
the CAMERA resource. Nucleic Acids Res 39: D546–51. doi:10.1093/nar/
gkq1102.
52. R Core Team (2012). R: A language and environment for statistical computing.
R Foundation for Statistical Computing, Vienna, Austria. ISBN 3-900051-07-0,
URL http://www.R-project.org/.
53. Read BA, Kegel J, Klute MJ, Kuo A, Lefebvre SC, et al. (2013) Pan genome of
the phytoplankton Emiliania underpins its global distribution. Nature 499: 209–
213. doi:10.1038/nature12221.
54. Jurgenson CT, Begley TP, Ealick SE (2009) The structural and biochemical
foundations of thiamin biosynthesis. Annu Rev Biochem 78: 569–603.
doi:10.1146/annurev.biochem.78.072407.102340.
55. Entcheva P, Phillips DA, Streit WR (2002) Functional analysis of Sinorhizobium
meliloti genes involved in biotin synthesis and transport. Appl Environ Microbiol
68: 2843–2848.
56. Croft MT, Warren MJ, Smith AG (2006) Algae need their vitamins. Eukaryot
Cell 5: 1175–1183. doi:10.1128/EC.00097-06.
57. Xu L, Chen H, Hu X, Zhang R, Zhang Z, et al. (2006) Average gene length is
highly conserved in prokaryotes and eukaryotes and diverges only between the
two kingdoms. Mol Biol Evol 23: 1107–1108.
58. Bender SJ, Durkin CA, Berthiaume CT, Morales R, Armbrust EV (2014)
Transcriptional responses of three model diatoms to nitrate limitation of growth.
Front Mar Sci. 1: 1–15. doi: 10.3389/fmars.2014.00003.
59. Bayer T, Aranda M, Sunagawa S, Yum LK, Desalvo MK, et al. (2012)
Symbiodinium transcriptomes: genome insights into the dinoflagellate symbionts of
reef-building corals. PLoS One 7: e35269.
60. Salcedo T, Upadhyay RJ, Nagasaki K, Bhattacharya D (2012) Dozens of Toxin-
Related Genes Are Expressed in a Nontoxic Strain of the Dinoflagellate
Heterocapsa circularisquama. Mol Biol Evol 29: 1503–1506. doi: 10.1093/molbev/
mss007.
61. Lowe CD, Mello LV, Samatar N, Martin LE, Montagnes DJS, et al. (2011) The
transcriptome of the novel dinoflagellate Oxyrrhis marina (Alveolata: Dinophy-
Transcriptomes of Prymnesiophyte Algae
PLOS ONE | www.plosone.org 14 June 2014 | Volume 9 | Issue 6 | e97801

ceae): response to salinity examined by 454 sequencing. BMC Genomics 12:
519. doi:10.1186/1471-2164-12-51962. Worden AZ, Lee JH, Mock T, Rouze P, Simmons MP, et al. (2009) Green
Evolution and Dynamic Adaptations Revealed by Genomes of the Marine
Picoeukaryotes Micromonas. Science. 324: 268–272. doi: 10.1126/sci-ence.1167222
63. Tang YZ, Koch F, Gobler CJ (2010) Most harmful algal bloom species arevitamin B1 and B12 auxotrophs. Proc Natl Acad Sci USA 107: 20756–20761.
doi:10.1073/pnas.1009566107.
64. McLaughlin JJA (1958) Euryhaline chrysomonads: nutrition and toxigenesis inPrymnesium parvum, with notes on Isochrysis galbana and Monochrysis lutheri.
J Protozool 5: 75–81. doi:10.1111/j.1550-7408.1958.tb02529.x.65. Provasoli L, Carlucci A (1974) Vitamins and growth regulators. In: Stewart W,
Abbot M, editors. Algal Physiology and Biochemistry. Massachusetts: BlackwellScience, Vol. 10. pp. 741–787.
66. Bertrand EM, Allen AE (2012) Influence of vitamin B auxotrophy on nitrogen
metabolism in eukaryotic phytoplankton. Front Microbiol 3: 375. doi:10.3389/fmicb.2012.00375.
67. Droop MR (1954) Cobalamin Requirement in Chrysophyceae. Nature 174:520–521. doi:10.1038/174520b0.
68. Rahat M, Reich K (1963) The B12 vitamins and methionine in the metabolism
of Prymnesium parvum. J Gen Microbiol 31: 203–209. doi: 10.1099/00221287-31-2-203.
69. Helliwell KE, Wheeler GL, Leptos KC, Goldstein RE, Smith AG (2011) Insightsinto the evolution of vitamin B12 auxotrophy from sequenced algal genomes.
Mol Biol Evol 28: 2921–2933. doi:10.1093/molbev/msr124.70. Manning SR, La Claire JW (2010) Prymnesins: toxic metabolites of the golden
alga, Prymnesium parvum Carter (Haptophyta). Mar Drugs 8: 678–704. doi:
10.3390/md8030678.71. Manning SR, La Claire JW II (2013) Isolation of polyketides from Prymnesium
parvum (Haptophyta) and their detection by liquid chromatography/massspectrometry metabolic fingerprint analysis. Anal Biochem 442: 189–195.
http://dx.doi.org/10.1016/j.ab.2013.07.034.
72. John U, Beszteri S, Glockner G, Singh R, Medlin L, et al. (2010) Genomiccharacterisation of the ichthyotoxic prymnesiophyte Chrysochromulina polylepis, and
the expression of polyketide synthase genes in synchronized cultures. Eur J Phycol45: 215–229. doi: 10.1080/09670261003746193.
73. Igarashi T, Satake M, Yasumoto T (1999) Structures and partial stereochemical
assignments for Prymnesin-1 and Prymnesin-2: Potent hemolytic and ichthyo-
toxic glycosides isolated from the red tide alga Prymnesium parvum. J Am Chem
Soc 121: 8499–8511. doi: 10.1021/ja991740e.
74. Perez R, Liu L, Lopez J, An T, Rein KS (2008) Diverse bacterial PKS sequences
derived from okadaic acid-producing dinoflagellates. Mar Drugs 6: 164–179.
doi:10.3390/md20080009.
75. Monroe EA, Van Dolah FM (2008) The toxic dinoflagellate Karenia brevis
encodes novel type I-like polyketide synthases containing discrete catalytic
domains. Protist 159: 471–482. doi: 10.1016/j.protis.2008.02.004.
76. La Claire JW (2006) Analysis of expressed sequence tags from the harmful alga,
Prymnesium parvum (Prymnesiophyceae, Haptophyta). Mar Biotechnol (NY) 8:
534–546.
77. John U, Beszteri B, Derelle E, Van de Peer Y, Read B, et al. (2008) Novel
insights into evolution of protistan polyketide synthases through phylogenomic
analysis. Protist 159: 21–30.
78. Moorthi SD, Caron DA, Gast RJ, Sanders RW (2009) Mixotrophy: a
widespread and important ecological strategy for planktonic and sea-ice
nanoflagellates in the Ross Sea, Antarctica. Aquat Microb Ecol 54: 269–277.
doi:10.3354/ame01276.
79. Van Dolah FM, Lidie KB, Monroe EA, Bhattacharya D, Campbell L, et al.
(2009) The Florida red tide dinoflagellate Karenia brevis: new insights into cellular
and molecular processes underlying bloom dynamics. Harmful Algae 8: 562–
572. doi 10.1016/j.hal.2008.11.004.
80. Raymond JA, Janech MG, Fritsen CH (2009) Novel ice-binding proteins from a
psychrophilic Antarctic alga (Chlamydomonadaceae, Chlorophyceae). J Phycol
45: 130–136. doi:10.1111/j.1529-8817.2008.00623.x.
81. Guiry M, Guiry G (2007) AlgaeBase version 4.2. Electron Publ Natl Univ Irel.
Available: www.algaebase.org. Accessed 17 October 2013.
82. Berg GM, Glibert PM, Lomas MW, Burford MA (1997) Organic nitrogen
uptake and growth by the chrysophyte Aureococcus anophagefferens during a brown
tide event. Mar Biol 129: 377–387. doi:10.1007/s002270050178.
83. Gobler C, Sanudo-Wilhelmy S (2001) Effects of organic carbon, organic
nitrogen, inorganic nutrients, and iron additions on the growth of phytoplankton
and bacteria during a brown tide bloom. Mar Ecol Prog Ser 209: 19–34.
doi:10.3354/meps209019.
Transcriptomes of Prymnesiophyte Algae
PLOS ONE | www.plosone.org 15 June 2014 | Volume 9 | Issue 6 | e97801