comparing data from md simulations and x-ray crystallography what can we compare? 3d shapes (rmsd)...
TRANSCRIPT

Comparing Data from MD simulations and X-ray Crystallography
• What can we compare?• 3D shapes (RMSD)• Atomic motions (B-value, RMSF)• Solvent accessibilities (SASA)
AMIGOS - Reads an RNA PDB file and outputs a complete table of torsion angle calculations.APBS - Software for evaluating the electrostatic properties of nanoscale biomolecular systems.Atlas of Protein Side-Chain Interactions - depicts how amino acid side-chains pack.Bioinformatics Toolkit - a platform that integrates a great variety of tools for protein sequenceanalysis - Max-Planck Institute for Developmental Biology.CATH - Hierarchical classification of protein domain structures.CAVENV - Designed to help visualise cavities in a protein structure.CAVER - Automated calculation of pathways leading from buried cavities to outside solvent in static and dynamic protein structures.CaPTURE - Identify energetically significant cation-pi interactions within proteins.CASTp - Computed atlas of surface topography of proteins.ConSurf - Identification of Functional Regions in Proteins.COPS -(Classification Of Protein Structures) web server which is a next-generation web application that provides fast and intuitive access to the entire set of currently available protein structures. COPS organizes structural domains by quantified structural similarities which can be visualized immediately with Jmol. Additionally, structural biologists can employ iCOPS to classify their own structures.DDMP -- Differences Distance Matrix Program.Dynamite - Makes predictions about the way a protein moves given only a PDB file.Dynapocket - Prediction of likely configurations of the atoms of binding pocket.DynDom - Determine domains, hinge axes and hinge bending residues in proteins.dssp2pdb - Converts dssp output to pdb.eF-site - Electrostatic surface of functional site.elNemo - Compute the low frequency normal modes of a protein.Entangle - Creates a listing of interactions that occur at the interface between the nucleic-acid/protein complex. These interactions are then classified into hydrogen bonds, electrostatic, hydrophobic, and Van der Waals.ESCET - Analyse and compare three-dimensional protein structures.extpdb - If you cut up pdb files, this is the utility for you.FISH - Domain identification server.GETAREA - Calculation of solvent accessible surface areas, atomic solvation energies and theirgradients for macromolecules.HBexplore - Geometrical analysis of hydrogen bonds in biological macromolecules.InterPro - Database of protein families, domains, repeats and sites.iMolTalk - Structural Bioinformatics Toolkit; an interactive, Internet-based service for computational analyses in Structural Biology.MACiE - contains 223 fully annotated enzyme reaction mechanisms (Janet Thornton)MOLEOline - Web-based tool to find/analyze molecular channels, tunnels and pores.MolProbity - An expert-system consultation about the accuracy of a macromolecular structure.MOTIF - Sequence motif search from GenomeNet. MSDMotif - Provides information about ligands, sequence and structure motifs.NACCESS - Calculates the accessible area of a molecule from a PDB format file.NCBI BLAST - Finds regions of similarity between biological sequences.
NQ-Flipper - Validates and corrects asparagine and glutamine side-chain amide rotamers in protein structures. An interactive Jmol applet highlights the most offending interactions between atom pairs.OCA - A browser-database for protein structure/function.OnD-CRF - Order and Disorder in proteins prediction server.Parvati - Protein Anisotropic Refinement Validation and Analysis ToolPDBsum - At-a-glance overview of every macromolecular structure deposited in the PDB.PDB Report Database - Reports describing structural problems in PDB entries.PDB Structure Quality - Determine if your structure is on-par with others in the PDB.PDB2PQR Server - Enables a user to convert PDB files into PQR files.Pfam - Large collection of protein families.PIqsI - investigation and curation of quaternary structures.PISA - An interactive tool for the exploration of protein Interfaces, Surfaces and Assemblies.Pre-BI - Prediction of biological interfaces.PredictProtein - A service for sequence analysis, structure and function prediction.Probe - Evaluate atomic packing, either within or between molecules. It generates “contact dots” where atoms are in close contact.ProDom - Protein domain families.PRODRG-2 Server - Convert small molecules in PDB format to various topology formats.ProFunc - Prediction of protein function from 3D structure; EBI services.ProMate - Predicts the location of potential protein-protein binding sites.PROPKA - Empirical Prediction and Interpretation of Protein pKa Values.Protein Calculator - Protein properties calculator.Protein Structure Prediction - Molecular modelling site.Proteopedia - The collaborative, 3D encyclopedia of proteins and other molecules. ArticleProtSkin - Converts a protein sequence alignment to a property file used to map thesequence conservation onto the structure of a protein.PROTORP - A tool to analyse the properties of interfaces of protein-protein associations.PSAIA - Software tool that integrates several algorithms for protein interactions and structure geometry analysis of protein complexes into a single application.RAPPER - An ab initio conformational search algorithm for restraint-based protein modelling.ROBETTA - Full-chain protein structure prediction server.SCOP - Structural classification of proteins.SFCheck - Assessment of X-ray data and/or agreement between atomic model and X-ray data.SPASM Server - Recognition of spatial motifs in protein structures.SSBOND - predicts sites where disulphide bonds can be introduced.STAN - Structure analysis server.StrucTools - Common structural biology calculations with PDB coordinates.SURFNET - Generates surfaces and void regions between surfaces.TLSMD - Inference of TLS motion from single crystal structures.TOPS - Compare a structure (PDB Format) to a database of structures.Web-Tools - Web-Accessible Scientific Applications (scientific supercomputing at NIH).WHAT IF - Homology modelling, drug docking, electrostatics, validation and visualisation.3Dee - Database of Protein Domain Definitions.3DNA - Analysis, rebuilding, and visualization of three-dimensional nucleic acid structures.
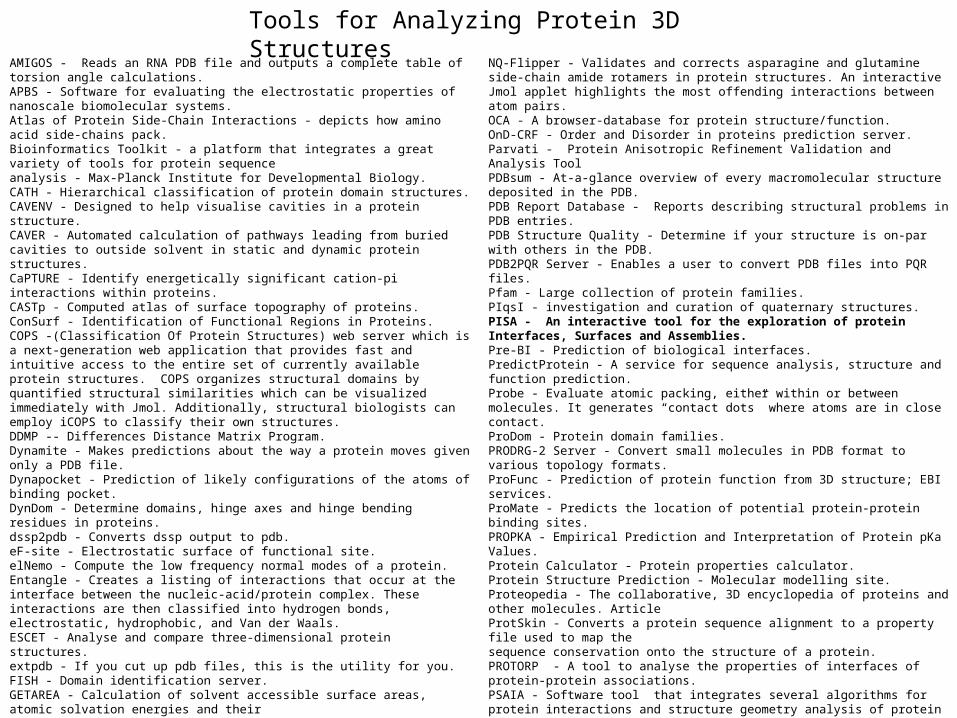
Tools for Analyzing Protein 3D Structures


What is the difference between RMSF? RMSD? B-Factor?
Read the book!

To monitor changes in 3D structure, RMSD is often plotted as a function of MD simulation time
When does the simulation become stable?
How big a difference is there between the stable structure and the reference structure?
How can RMSD be used to tell when a simulation has reached structural equilibration?
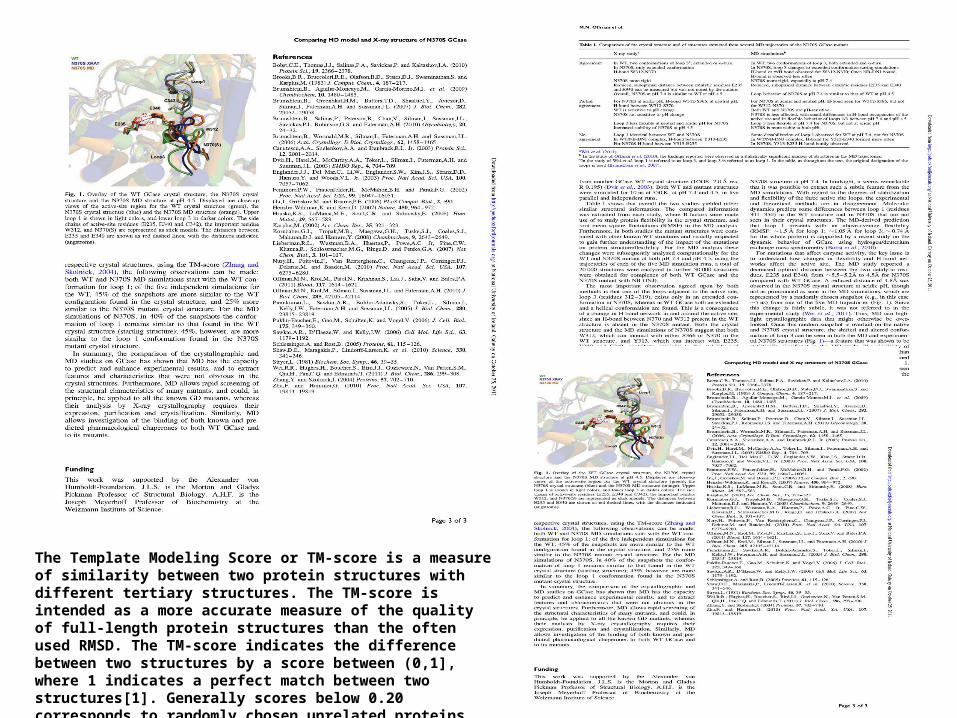
The Template Modeling Score or TM-score is a measure of similarity between two protein structures with different tertiary structures. The TM-score is intended as a more accurate measure of the quality of full-length protein structures than the often used RMSD. The TM-score indicates the difference between two structures by a score between (0,1], where 1 indicates a perfect match between two structures[1]. Generally scores below 0.20 corresponds to randomly chosen unrelated proteins whereas structures with a score higher than 0.5 assume roughly the same fold
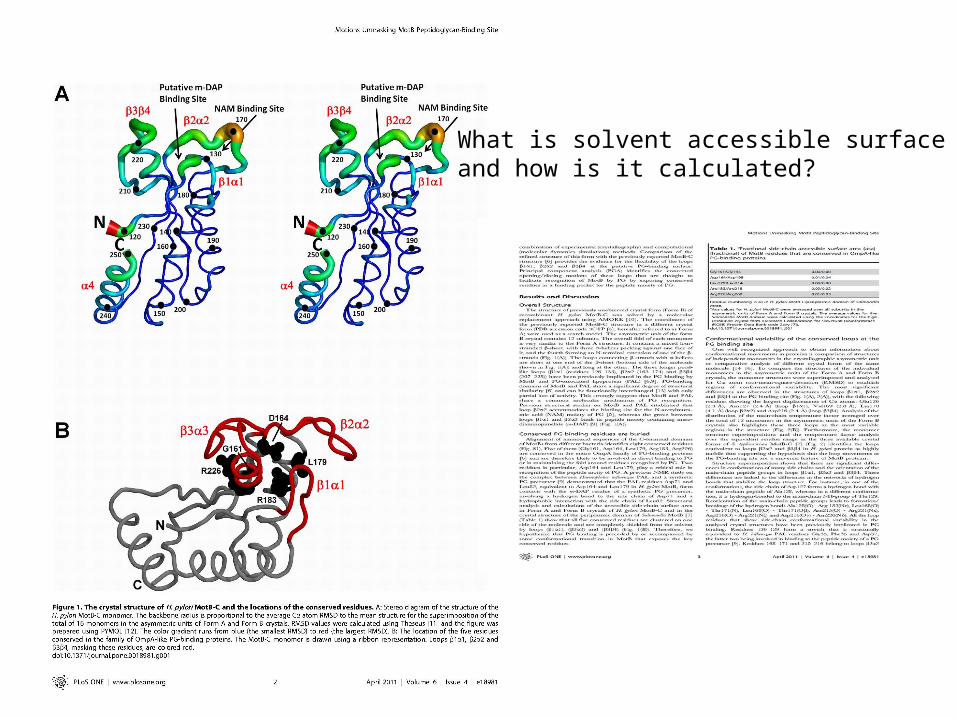
What is solvent accessible surface areaand how is it calculated?
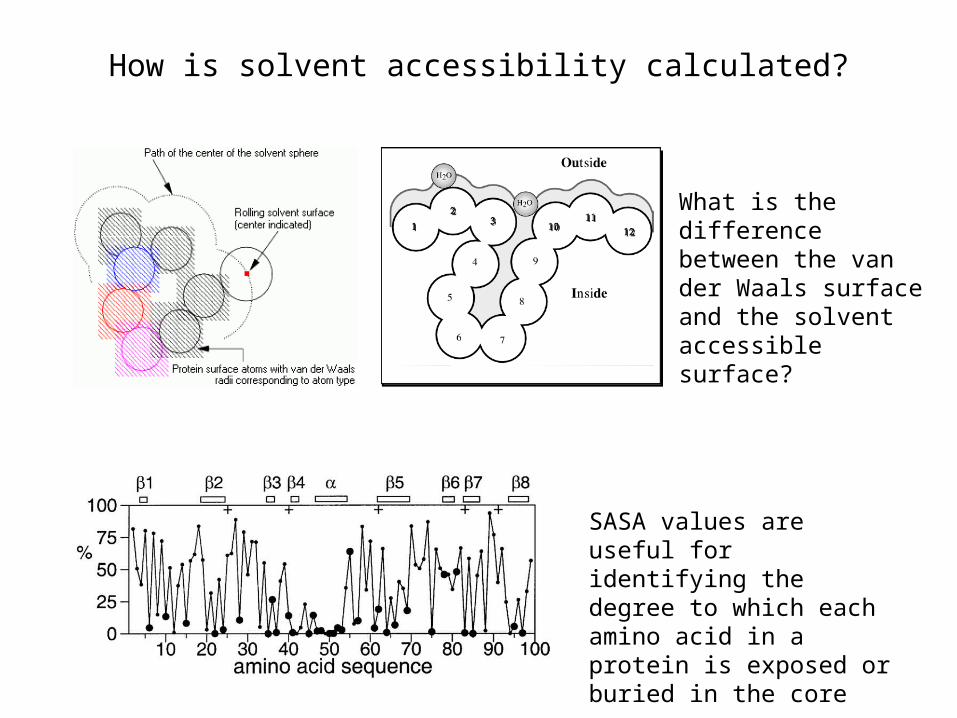
How is solvent accessibility calculated?
What is the difference between the van der Waals surface and the solvent accessible surface?
SASA values are useful for identifying the degree to which each amino acid in a protein is exposed or buried in the core

Comparing different structures of the same protein helps identify regions that are more flexible – they will be a little different in each structure

Comparison between multiple crystal structures identifies flexible regions
Comparison between crystal structures and MD data confirms flexible regions
Why does the MD data show larger fluctuations (B-factors)?
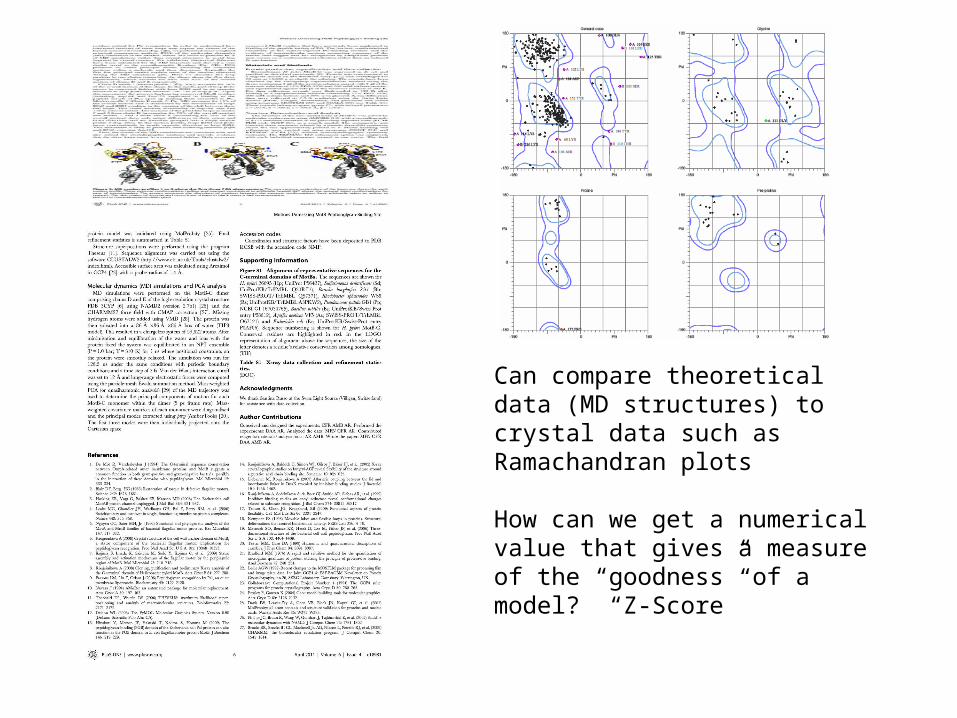
Can compare theoretical data (MD structures) to crystal data such as Ramachandran plots
How can we get a numerical value that gives a measure of the “goodness” of a model? “Z-Score”

Z-scores
For any data set that can be described by a normal distribution, the distribution is perfectly symmetric about 0.
A Z-score compares a single data point to the normal distribution. The Z-score for a value is the number of standard deviations that value is away from the mean of the distribution
Z-score = (x – mean)/stdev
Example: Find the z-score corresponding to a raw score of 132 from a normal distribution with mean 100 and standard deviation 15.
Solution
Z-score = (x – mean)/stdev = (132 – 100)/15 = 2.13
A Z-score can be positive or negative and gives a quantitative idea of how far a given value is from the average for similar data.
Nucleic Acids Res. 2007 Jul;35(Web Server issue):W375-83. 2007 Apr 22.
MolProbity: all-atom contacts and structure validation for proteins and nucleic acids.
Davis IW, Leaver-Fay A, Chen VB, Block JN, Kapral GJ, Wang X, Murray LW, Arendall WB 3rd, Snoeyink J, Richardson JS, Richardson DC