comparing data mining classification algorithms in
TRANSCRIPT
St. Cloud State UniversitytheRepository at St. Cloud State
Culminating Projects in Information Assurance Department of Information Systems
12-2016
Comparing Data Mining Classification Algorithmsin Detection of Simbox FraudMhd Redwan AlBoughaSt. Cloud State University, [email protected]
Follow this and additional works at: https://repository.stcloudstate.edu/msia_etds
This Thesis is brought to you for free and open access by the Department of Information Systems at theRepository at St. Cloud State. It has beenaccepted for inclusion in Culminating Projects in Information Assurance by an authorized administrator of theRepository at St. Cloud State. For moreinformation, please contact [email protected].
Recommended CitationAlBougha, Mhd Redwan, "Comparing Data Mining Classification Algorithms in Detection of Simbox Fraud" (2016). CulminatingProjects in Information Assurance. 17.https://repository.stcloudstate.edu/msia_etds/17
Comparing Data Mining Classification Algorithms
in Detection of Simbox Fraud
by
Mhd Redwan AlBougha
A Thesis
Submitted to the Graduate Faculty of
St. Cloud State University
in Partial Fulfillment of the Requirements
for the Degree of
Master of Science in Information Assurance
December, 2016
Thesis Committee: Dr. Jim Chen, Chairperson
Dr. Susantha Herath Dr. Balasubramanian Kasi
1
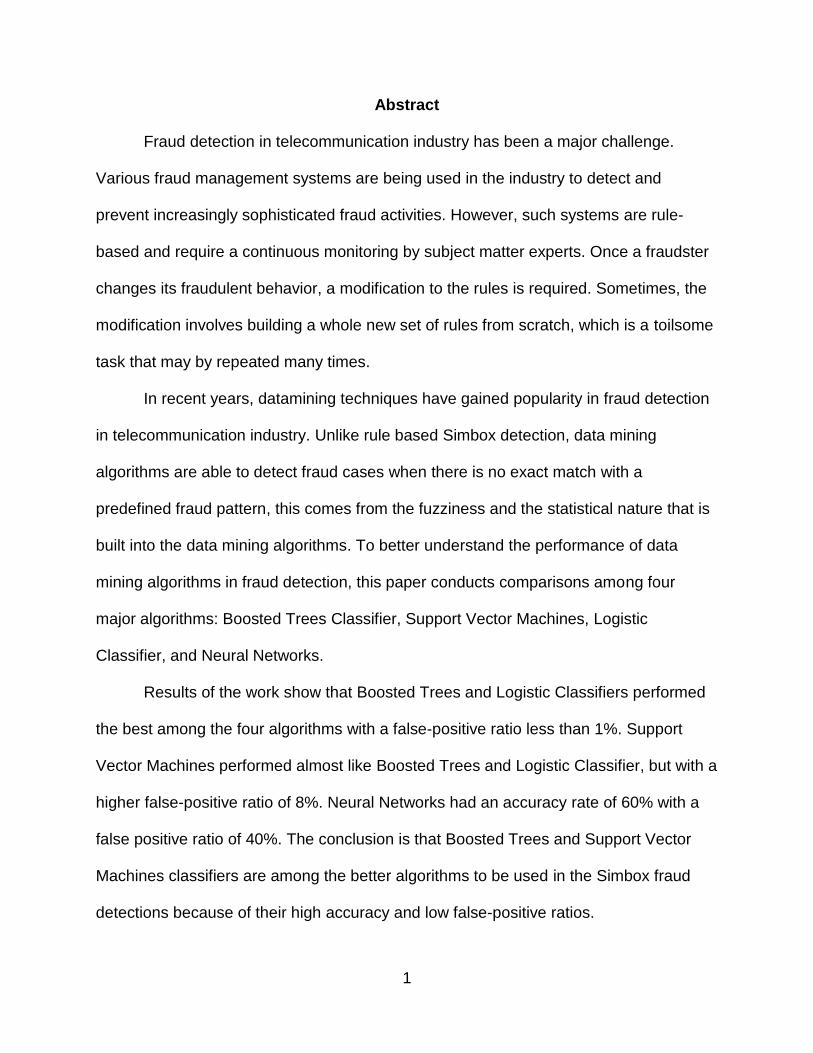
Abstract
Fraud detection in telecommunication industry has been a major challenge.
Various fraud management systems are being used in the industry to detect and
prevent increasingly sophisticated fraud activities. However, such systems are rule-
based and require a continuous monitoring by subject matter experts. Once a fraudster
changes its fraudulent behavior, a modification to the rules is required. Sometimes, the
modification involves building a whole new set of rules from scratch, which is a toilsome
task that may by repeated many times.
In recent years, datamining techniques have gained popularity in fraud detection
in telecommunication industry. Unlike rule based Simbox detection, data mining
algorithms are able to detect fraud cases when there is no exact match with a
predefined fraud pattern, this comes from the fuzziness and the statistical nature that is
built into the data mining algorithms. To better understand the performance of data
mining algorithms in fraud detection, this paper conducts comparisons among four
major algorithms: Boosted Trees Classifier, Support Vector Machines, Logistic
Classifier, and Neural Networks.
Results of the work show that Boosted Trees and Logistic Classifiers performed
the best among the four algorithms with a false-positive ratio less than 1%. Support
Vector Machines performed almost like Boosted Trees and Logistic Classifier, but with a
higher false-positive ratio of 8%. Neural Networks had an accuracy rate of 60% with a
false positive ratio of 40%. The conclusion is that Boosted Trees and Support Vector
Machines classifiers are among the better algorithms to be used in the Simbox fraud
detections because of their high accuracy and low false-positive ratios.

2
Acknowledgements
I would like to express my gratitude and appreciation to my advisor, Dr. Jim
Chen, who supported me throughout the work on my thesis with his patience,
motivation, and immense knowledge.
Besides my advisor, I would also like to thank the rest of my thesis committee:
Dr. Susantha Herath, who supported me throughout my Master’s program with support
and understanding, and Dr. Balasubramanian Kasi, for using his valuable time to review
my thesis paper.
I would also like to express my very profound gratitude to my parents, my sisters,
Bilal and Wael, and all of my friends for providing me with unfailing support and
continuous encouragement throughout my years of study and through the process of
writing this thesis. This accomplishment would not have been possible without them.
3
Table of Contents
Page
List of Tables ...........................................................................................................5
List of Figures ..........................................................................................................6
Chapter I: Introduction .............................................................................................8
Problem Statement .......................................................................................10
Nature and Significance of the Problem .......................................................10
Objective of The Study .................................................................................11
Definition of Terms .......................................................................................11
Summary ......................................................................................................12
II. Fraud in Telecommunication Industry .................................................................13
Types of Fraud .............................................................................................13
Methods of Fraud .........................................................................................17
Cost of Fraud ................................................................................................20
III. Simbox Fraud .....................................................................................................22
Detection Methods ........................................................................................26
Literature Related to The Problem ................................................................29
Literature Related to The Methodology .......................................................30
Summary .....................................................................................................30
IV. Data Mining Applications in Detection of Fraud .................................................31
Data Mining, An Overview ............................................................................31
Data Mining Applications in Detection of Fraud ............................................32
V. Design and Methodology ....................................................................................36
4
Techniques Used ..........................................................................................36
Datasets .......................................................................................................37
Algorithms Input ............................................................................................40
VI. Results and Data Analysis .................................................................................44
Measures Used for Results Assessment ......................................................44
Results Analysis ...........................................................................................45
VII. Conclusion and Recommendations ..................................................................48
References ..............................................................................................................50
5
List of Tables
Table Page
1. Datasets used to test CCF Detection Model .................................................33
2. Customer insolvency prediction results ........................................................35
3. Summary of classification results of Simbox fraud .......................................45
4. Confusion matrix for Logistic classifier .........................................................45
5. Confusion matrix for Boosted Trees classifier ..............................................46
6. Confusion matrix for SVM classifier ..............................................................46
7. Confusion matrix for Neural Network ............................................................47
6
List of Figures Figure Page
1. Call lifecycle inside a telecommunication operator .......................................10
2. PRS fraud overview ......................................................................................15
3. An examples of SMS spam ..........................................................................16
4. Sample Identification Document ...................................................................19
5. Fake ID after changes has been made to the sample ID ..............................20
6. Two models of actual Simbox devices ..........................................................22
7. Simbox equipment is legitimately available online ........................................24
8. International call in the legit scenario ............................................................25
9. International call routing in Simbox scenario ................................................26
10. Rule-based methods have multiple rules ......................................................27
11. Comparison of the results between SVM and QS-SVM ...............................29
12. The basic vector for the weekly user behavior..............................................30
13. The basic vector for the daily user behavior ................................................30
14. A Four-Stage Credit Card Fraud Detection Model .......................................32
15. Financial statement fraud detection model ...................................................33
16. Diagram of insolvency prediction model .......................................................34
17. Sample of customers’ profile dump ..............................................................38
18. One subscriber for a contract scenario .........................................................39
19. Multiple subscribers for a contract scenario .................................................39
20. Sample of datasets (CDRs) ..........................................................................40
21. Same ID, different contract scenario illustrated ............................................41

7
22. Sample datasets that had been used for classification algorithms ...............42
23. Datasets serving as an input for Neural Network classifier ...........................43
24. Conceptual image of a confusion matrix .......................................................44
8
Chapter I: Introduction
Each year, fraud is costing telecommunication operators around the world billions
of dollars (CFCA, 2015). Also, the difficulty of detecting fraud is increasing day by day
due to the growing complexity of techniques used to commit fraud. Monetary loss is not
the only cost that a telecommunication operator pays when fraud is committed. In most
cases, the liability and the reputation of the telecom operator will also be jeopardized.
Telecom operators are fighting the fraud by having a separate business unit,
which is usually known as Revenue Assurance and Fraud Management (RAFM). RAFM
usually is part of a finance department and typically reports to the chief finance officer
(CFO) of the telecom operator (KPMG, 2012). Fraud management units fight frauds
through the telecom operator by deploying fraud management systems and by hiring
fraud detection field experts. Revenue assurance and fraud management team
members have full access to most of the systems inside the telecom operator. Those
systems vary by their function.
A summarized list of the systems a fraud management specialist would have
access to (Kalladan, 2010) include:
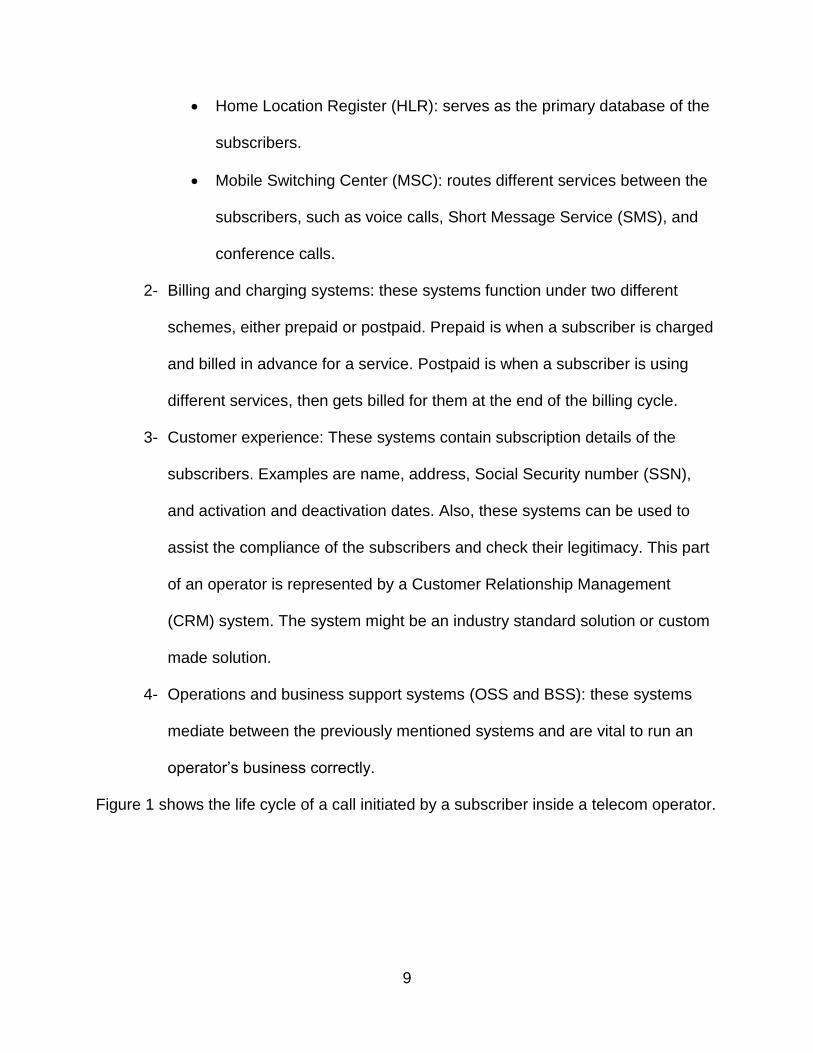
1- Core (Backbone) network: this network represents the technical core of a
telecom operator. It is a composite of systems that provide wireless access to
different network services. They perform the authentication of their
subscribers, call switching, and interact with international gateways and
similar elements. Examples of the systems that are part of the core network
include:
9
Home Location Register (HLR): serves as the primary database of the
subscribers.
Mobile Switching Center (MSC): routes different services between the
subscribers, such as voice calls, Short Message Service (SMS), and
conference calls.
2- Billing and charging systems: these systems function under two different
schemes, either prepaid or postpaid. Prepaid is when a subscriber is charged
and billed in advance for a service. Postpaid is when a subscriber is using
different services, then gets billed for them at the end of the billing cycle.
3- Customer experience: These systems contain subscription details of the
subscribers. Examples are name, address, Social Security number (SSN),
and activation and deactivation dates. Also, these systems can be used to
assist the compliance of the subscribers and check their legitimacy. This part
of an operator is represented by a Customer Relationship Management
(CRM) system. The system might be an industry standard solution or custom
made solution.
4- Operations and business support systems (OSS and BSS): these systems
mediate between the previously mentioned systems and are vital to run an
operator’s business correctly.
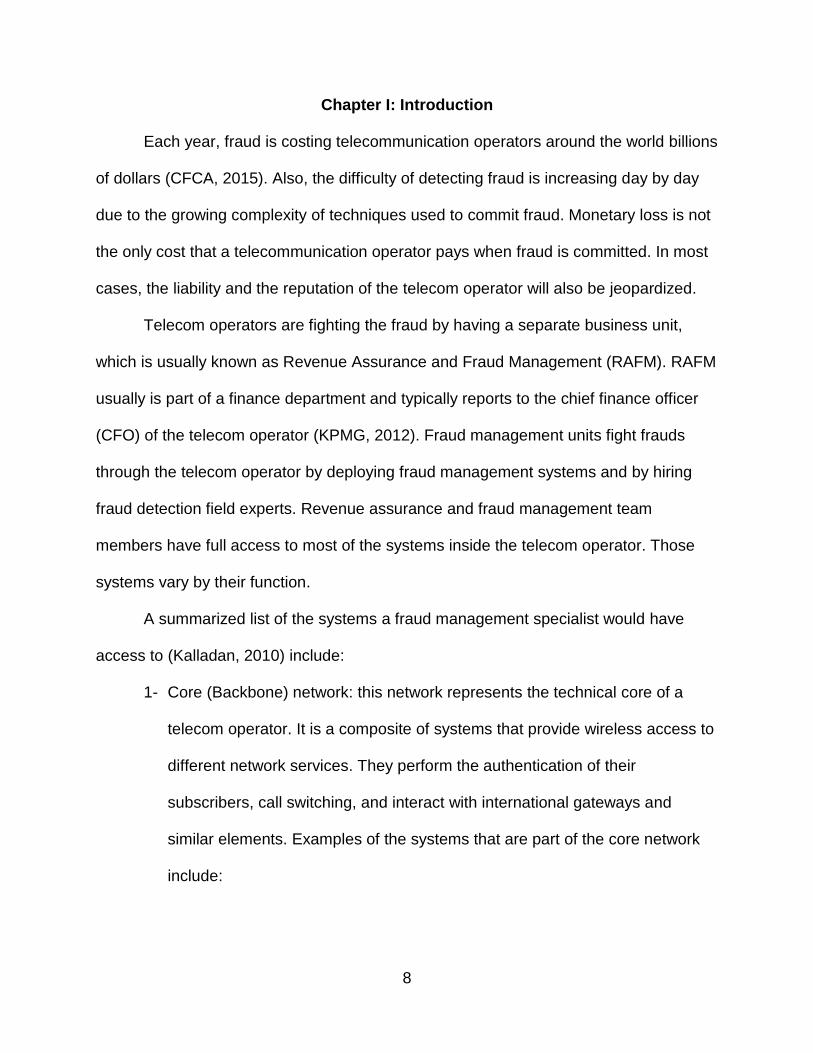
Figure 1 shows the life cycle of a call initiated by a subscriber inside a telecom operator.
10
Figure 1. The life cycle of a call initiated by a subscriber inside a telecom
operator.
In most cases, committing fraud is feasible even when all mentioned systems are
working and communicating with each other in the intended way. Actually, fraud
happens in the form of abuse of the system as a whole. More discussion about fraud
and its types and methods are covered in Chapter II.
By the end of this paper, the reader will understand the risks imposed from
Simbox fraud, how it is being fought traditionally, why to use data mining in detection of
Simbox fraud, and the comparison results among four different data mining classifiers.
Problem Statement
To understand data mining algorithms and to evaluate the different models
created by the algorithms for the task of Simbox fraud detection. Additionally, to
evaluate the efficiency of models’ detection rates over traditional methods.
Nature and Significance of the Problem
According to Navruzyan (2015), the Vice President of Product Management at
Argyle Data, when talking about using data mining to detect telecom fraud, “The
11
telecom industry faces a massive challenge: $38 billion is lost each year to
sophisticated attacks including call-back, international revenue sharing scams,
subscription fraud and more.”
The Communications Fraud Control Association (CFCA) estimated 2015 fraud
losses at $38.1 billion. The worldwide telecommunication industry is worth $2.2 trillion.
That is 1.7% of total the net worth of the worldwide telecommunication industry (Sugo,
2016). The percentage is relatively low, but the amount is definitely high and that is why
fighting fraud inside an operator has priority for a mature telecom operator.
Objective of the Study
The objective of this study is to compare the results of different data mining
algorithms in detecting Simbox fraud in the telecom environment.
Definition of Terms
AUC: Area Under Curve.
CLI: Caller Line Identification.
CCF: Credit Card Fraud.
CDR: Call Details Record. The record that contains information related to
calls made by the subscriber.
CFCA: Communications Fraud Control Association. A non-profit global
educational association formed to help find more effective ways to combat the
problem of communications fraud.
FMS: Fraud Management Software.
FTC: Federal Trade Commission.
HLR: Home Location Register.
12
IoT: Internet of Things.
IRSF: International Revenue Share Fraud.
KDD: Knowledge Discovery in Databases.
MSC: Mobile Switching Center.
NN: Neural Network.
PBX: Private branch exchange.
PRS: Premium Rate Service.
Revenue Assurance and Fraud Management (RAFM). According to Gartner (2016), “Revenue assurance is the application of a process or software solution that enables a communications service provider (CSP) to accurately capture revenue for all services rendered. Instead of correcting errors after they occur, or not detecting and correcting them at all, revenue assurance enables the CSP to examine and plug dozens of actual or potential leakage points throughout the network and customer-facing systems, and to correct data before it reaches the billing system. The distinctions between revenue assurance and other disciplines are often blurred. Revenue assurance sometimes extends into areas such as network assurance, service assurance, business assurance, risk management and fraud management.”
SMS: Short Message Service.
SSN: Social Security number.
TCG: Test Calls Generator.
VoIP: Voice Over IP.
Summary
In this chapter, the reader was introduced to the scope of the work and its
objectives. In the next chapter, fraud in the telecommunication environment will be
discussed.
13
Chapter II: Fraud in Telecommunication Industry
In this chapter, an overview about fraud in telecom is delivered. By the end of the
chapter, it is hoped that the reader understands the types of fraud and different methods
that can be used to commit fraud. PwC (2007) defines fraud as “the deception
deliberately practiced in order to secure unfair or unlawful gain.” The source of a fraud
can be from inside or outside an operator. Examples of internal fraud include
employees, number porting, vanity number resale, "Goodwill" credits, passing on of
customer details, and slamming. Examples of external fraud include theft of SIMs, theft
of handsets, Simbox fraud, roaming fraud, and bad debt.
Types of Fraud
Different types of fraud exist based on the nature of the fraud committed. Fraud
might involve bypassing fees, as in the case of Simbox fraud. The description of Simbox
fraud will be handled in the next chapter. There are also call and SMS spamming,
premium rate service (PRS) fraud, phishing, arbitrage, and stolen goods.
Call and SMS Spamming
Call and SMS spamming is like email spam. Subscribers receive unwanted calls
and SMSs about a deal. In the case of SMS spam, the message will have a text to call a
specific number or visit a website, which will promote the subscriber to redeem the offer.
After that, the subscriber presses or calls the provided link, which will result in premium
charges. What distinguishes call and SMS spamming from email spam is that a
subscriber might be charged for receiving a spam SMS. Also, once the subscriber
replies to the spam number, he or she will be charged regardless of the subscribed
plan. Thus, SMS spam numbers are not included in unlimited plans. Contrary to email,
14
there is no filtration on call and SMS replies, unlike the case of junk email. Some
operators created a mechanism to fight SMS spam. The subscriber can report the spam
SMS by forwarding it to specific numbers, but still, there is no built-in mechanism to
separate spam SMS on an industry level.
Premium Rate Service (PRS)
Premium Rate Service (PRS) is a regular part of the telecom industry. The
service charges a higher rate than normal. Typically, these numbers can be
distinguished from a non-premium numbers by the first three digits (e.g. 900 numbers).
The typical scenario in a premium rate service is as follows:
1- Service provider rents a premium rate number.
2- Subscriber calls the rented number in exchange for a service, like advising,
horoscope reading, or adult and psychic chat lines.
3- Subscriber pays for the billed charges.
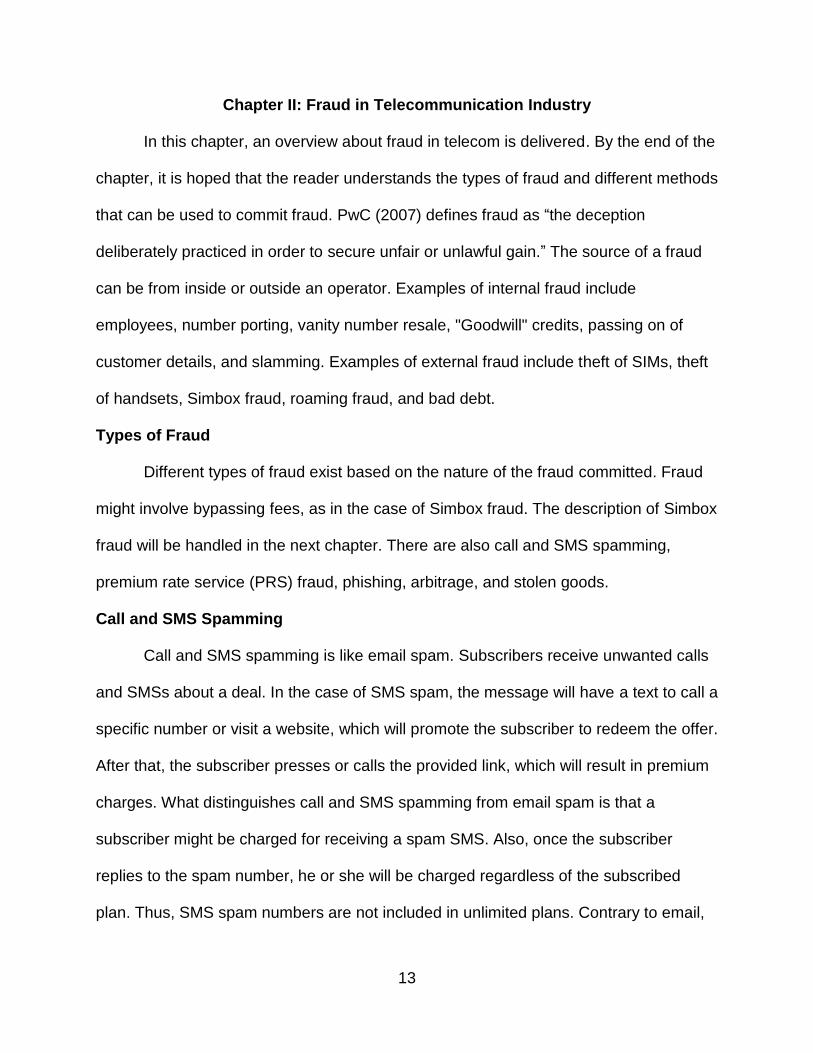
In the case of PRS fraud, shown in Figure 2, the following steps will be followed:
1- Fraudsters rent a lot of premium rate service numbers.
2- Fraudsters open new subscriptions providing fake or stolen identities
(subscription fraud).
3- Using the subscriptions they created, fraudsters dial (PRS) numbers they own,
leaving those numbers with an outstanding balance.
15
Figure 2: PRS fraud overview
In another scenario, fraudsters hijack local phones of a company and use them
to call to the rented premium numbers, leaving the hacked company with a massive
outstanding amount to be paid. In the case of PRS fraud, numbers rented do not always
follow the regular (900) range and they might also be international numbers. This is
what makes detecting such fraud a complex task.
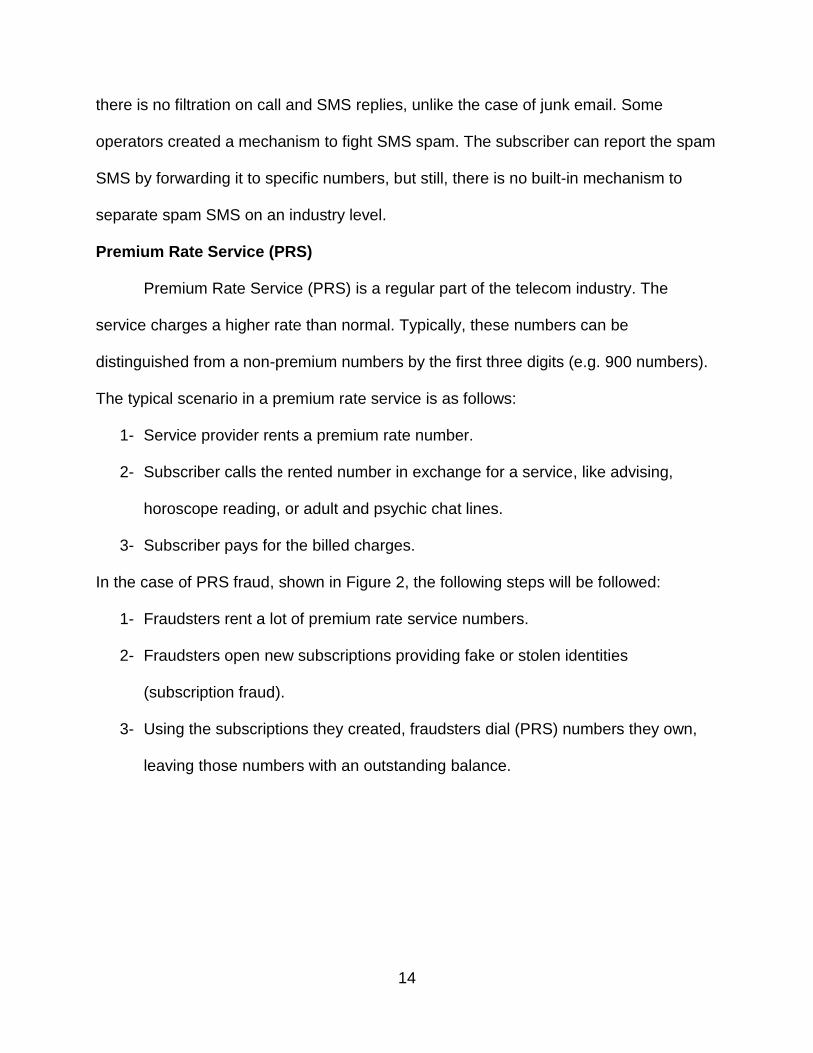
Phishing Fraud
Phishing fraud in telecom (Howells, Stapleton, & Scharf-Katz, 2013) is the same
as email phishing. Its target is to steal user information. Stolen information varies from
usernames, passwords, credit card accounts, and social security numbers. Once the
fraudster steals the information, phishing victims can have their subscription information
at the operator manipulated at any time. Also, fraudsters use stolen information to make
purchases online or through mobile phone orders. Figure 3 shows an example of SMS
spam.
16
Figure 3: Examples of SMS spam (Broida, 2011; Grianna, 2016)
International Revenue Share Fraud (IRSF)
One of the most recent frauds in telecom is IRSF. What distinguishes IRSF over
other frauds in the telecom industry is that it costs more and it is relatively shorter in
duration, usually a couple of hours. International revenue share fraud maintains the
same concept as PRS fraud, but the fraudster calls the rented premium numbers while
roaming outside the country. Roaming gives the fraudster the capability to make the
adjustment more easily. In some cases, it takes up to 48 hours until the generated traffic
(CDRs) arrive at the company.
Below is shown the steps followed to perform IRSF (Datanomers, 2016):
1- The fraudster obtains IRSF numbers from a premium numbers provider.
17
2- The fraudster accesses the network, either by obtaining numbers using
subscription fraud, SIM cloning, or by the theft of SIM cards.
3- Before starting to generate the traffic, the fraudster enables conference call
services to maximize the effect of the fraud. Enabling conference call services
will allow the fraudster to call multiple destinations at the same time.
4- Traffic will be generated and the targeted operator will receive CDRs for the
generated calls in a period of three days.
Methods of Fraud
In order to achieve one of the mentioned fraud types, different methods can be
used. Some of these methods can be combined, however one of them is enough. Fraud
methods vary based on their nature or their type of exploitation. Examples include,
cramming, private branch exchange (PBX) hacking, short message service (SMS)
phishing, subscription fraud, and wangiri fraud.
Cramming Fraud
Not all frauds come from outside of an operator. In cramming fraud (Howells,
Stapleton, & Scharf-Katz, 2013), telecom operators push (cram) services the subscriber
did not request. The fraud is used to boost the revenues or when sales employees want
to reach their sales targets (albeit fraudulently). The subscriber will be surprised once
they see their bill; they will notice a service that was installed without their consent. At
that time, the subscriber will complain to customer service, but they will reply that a
technical error has occurred. Once this fraud is spread among a significant number of
subscribers, the company’s quality will be questioned. The reputation of the operator is
the true cost of this fraud and it would take considerable time to restore it.
18
Private Branch Exchange (PBX) Fraud
Private branch exchange (PBX) fraud happens when the fraudster takes over the
private switching network and uses linked external phone lines to make calls to
premium numbers owned by the fraudster. Private branch exchange fraud occurs when
the internal network of an organization is not secure enough from outside attacks. A lot
of ways are used to take control of a PBX. Companies might leave default passwords
unchanged or they could be corrupted through social engineering, another option might
be the attack comes from an internal employee or a vendor.
Subscription Fraud
Subscription fraud is defined as obtaining a subscription to a service with the
intention of not paying for it (FML, 2003; Hoath, 1998). Most of the operators in
developing countries rely only on photo identification documents in the process of
setting up an account for a new subscriber. In most of the cases, no verification is being
done to validate the authenticity of the provided documents. To make things worse,
fraudsters started to use legitimate documents to impersonate another individual. As an
example, this can be done by showing a valid ID which has the picture of the fraudster;
this is known as Identity theft. Once the fraudster becomes a subscriber and has access
to the network, there are multiple implications. Besides the financial side of this
dilemma, the fraudster is breaking the compliance rule of representing his or her actual
identity, which is a concern from security and legal point of view.
Subscription fraud occurs in the phase of signup. The fraudster uses stolen
information (SSN, address, or credit card account) to login to services provided by an
19
operator. After signup is complete, the fraudster will commit the fraud and will be billed
for general usage. Once the fraudster does not pay the outstanding amount, the amount
will be sent to collection agencies, which will rely on the account information that was
fake or stolen. In this case, the account was opened using stolen information and now
the original owner of the information will be required to pay the outstanding amount.
Since the information was fake, no one can be required to pay the outstanding amount,
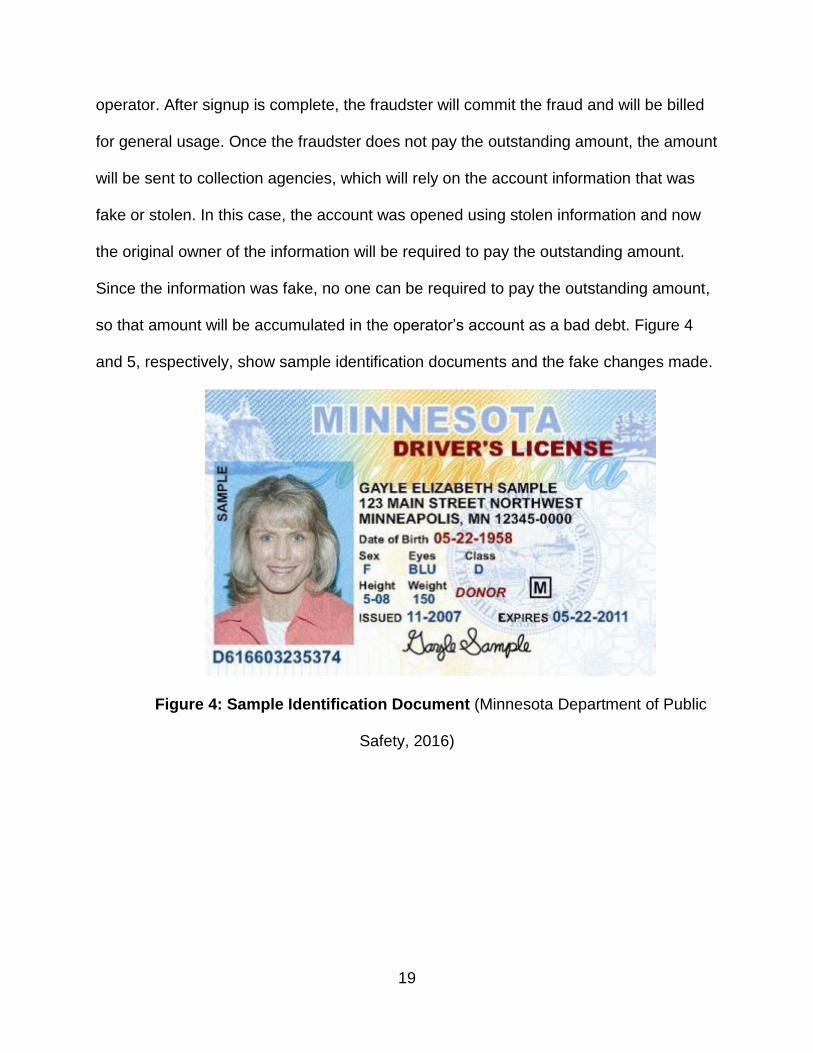
so that amount will be accumulated in the operator’s account as a bad debt. Figure 4
and 5, respectively, show sample identification documents and the fake changes made.
Figure 4: Sample Identification Document (Minnesota Department of Public
Safety, 2016)
20
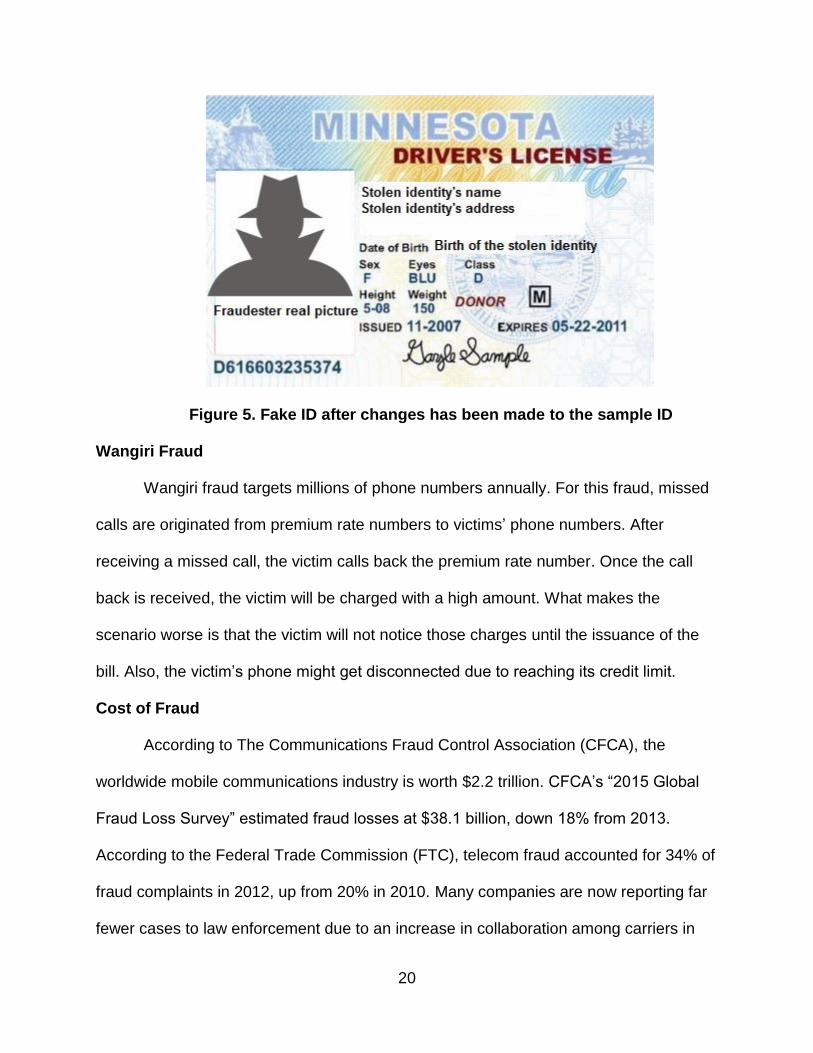
Figure 5. Fake ID after changes has been made to the sample ID
Wangiri Fraud
Wangiri fraud targets millions of phone numbers annually. For this fraud, missed
calls are originated from premium rate numbers to victims’ phone numbers. After
receiving a missed call, the victim calls back the premium rate number. Once the call
back is received, the victim will be charged with a high amount. What makes the
scenario worse is that the victim will not notice those charges until the issuance of the
bill. Also, the victim’s phone might get disconnected due to reaching its credit limit.
Cost of Fraud
According to The Communications Fraud Control Association (CFCA), the
worldwide mobile communications industry is worth $2.2 trillion. CFCA’s “2015 Global
Fraud Loss Survey” estimated fraud losses at $38.1 billion, down 18% from 2013.
According to the Federal Trade Commission (FTC), telecom fraud accounted for 34% of
fraud complaints in 2012, up from 20% in 2010. Many companies are now reporting far
fewer cases to law enforcement due to an increase in collaboration among carriers in
21
stopping fraudulent activity. The top five countries where this is occurring are Cuba,
Somalia, Bosnia/Herzegovina, Estonia, and Latvia.
The following list shows the top five types of fraud by their cost (CFCA, 2015):
1- International Revenue Share Fraud (IRSF): $10.76 B (USD).
2- Interconnect Bypass (e.g. Simbox): $5.97 B (USD).
3- Premium Rate Service: $3.77 B (USD).
4- Arbitrage: $2.94 B (USD).
5- Theft of SIMs, theft of handsets: $2.84 B (USD).
The top five methods for committing fraud by their cost are (CFCA, 2015):
1- PBX Hacking: $3.93 B (USD).
2- IP PBX Hacking: $3.53 B (USD).
3- Subscription Fraud (Generated by applications): $3.53 B (USD).
4- Dealer Fraud: $3.14 B (USD).
5- Subscription Fraud (Identity theft): $2.55 B (USD).
22
Chapter III: Simbox Fraud
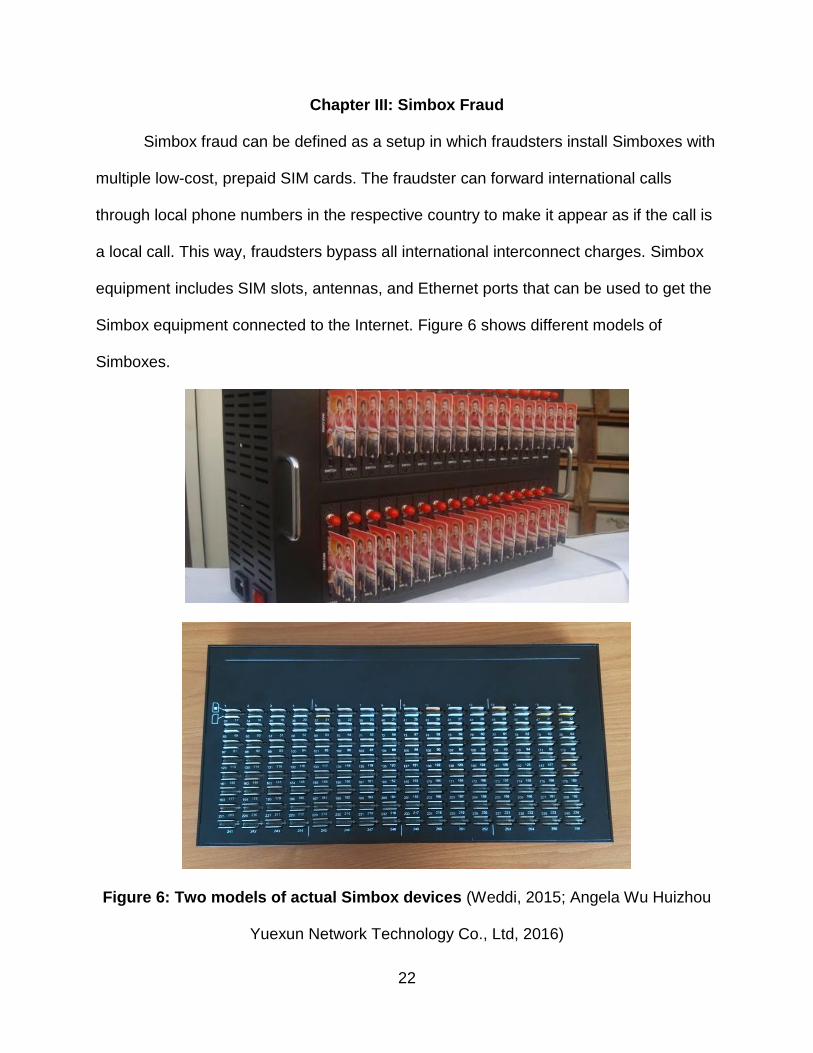
Simbox fraud can be defined as a setup in which fraudsters install Simboxes with
multiple low-cost, prepaid SIM cards. The fraudster can forward international calls
through local phone numbers in the respective country to make it appear as if the call is
a local call. This way, fraudsters bypass all international interconnect charges. Simbox
equipment includes SIM slots, antennas, and Ethernet ports that can be used to get the
Simbox equipment connected to the Internet. Figure 6 shows different models of
Simboxes.
Figure 6: Two models of actual Simbox devices (Weddi, 2015; Angela Wu Huizhou
Yuexun Network Technology Co., Ltd, 2016)
23
Simbox equipment can be found using different names (e.g. GSM VOIP gateway;
GSM Simbox gateway). Nowadays, most Simbox equipment has advanced features
that help fraudsters while forwarding the calls. For example, SIM automatic rotation,
behavior pattern setup, call forwarding, and changeable International Mobile Station
Equipment Identity (IMEI). In SIM automatic rotation, another SIM will be used and the
fully-consumed SIM will be marked as “unusable.” In behavior pattern setup, a set of
rules can be added to make generated fraudulent calls appear legitimate. For example,
the typical Simbox fraud behavior is making local and net calls without any other kind of
usage, such as internet, SMS, international destinations, or even off-net phone calls.
Having such a mechanism helps a fraudster to avoid being detected by typical detection
means, such as rule-based methods. The call-forwarding feature provides a centralized
way to forward a received call to a human operator. If a callback to a Simbox number is
made, the human operator will answer the call. This helps validate the call’s legitimacy.
The changeable International Mobile Station Equipment Identity (IMEI) feature provides
the ability to change the IMEI associated with any inserted SIM inside the Simbox.
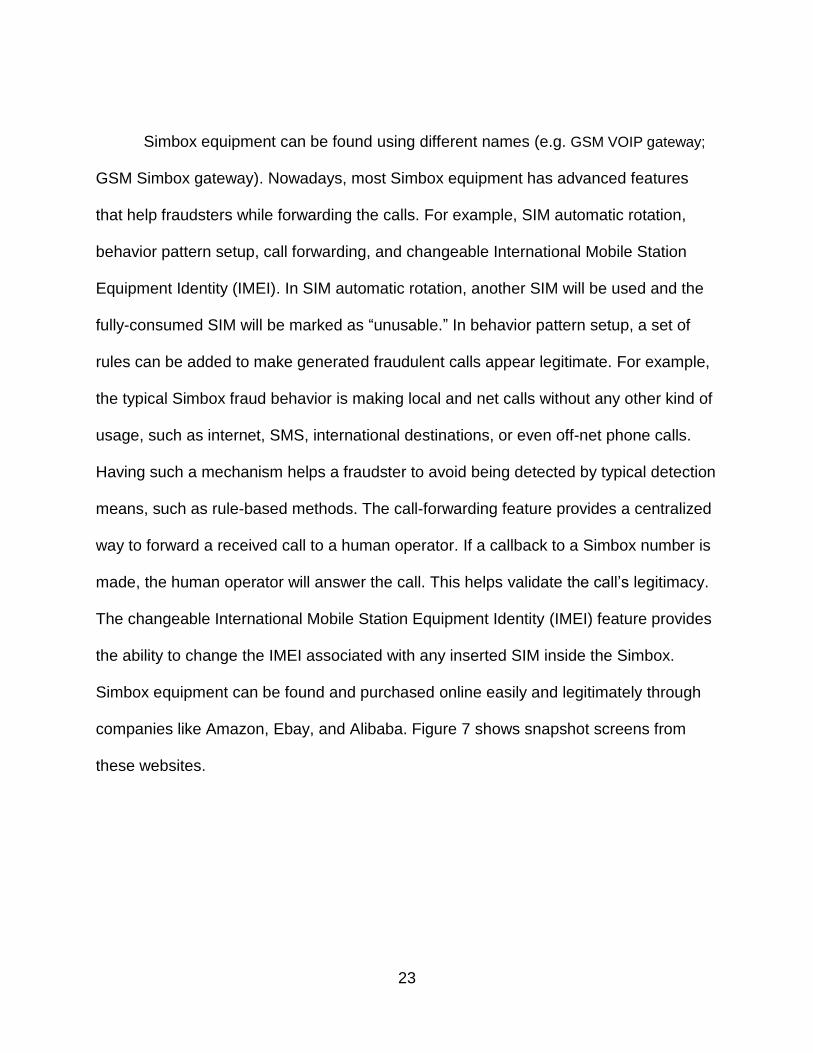
Simbox equipment can be found and purchased online easily and legitimately through
companies like Amazon, Ebay, and Alibaba. Figure 7 shows snapshot screens from
these websites.
24
Figure 7: Simbox equipment is legitimately available online
When a subscriber places a call to an international destination in a normal
scenario, the call bounces between different entities. First, the call is received by a
home international gateway. Second, the home international gateway routes the call to
a green market wholesale provider. Third, the green market wholesale provider will
route the call to a destination international gateway and pay a toll to the destination
international operator. After that, the destination international operator will forward the
call to the destination number. Figure 8 shows how an international call is forwarded in
this case.
25
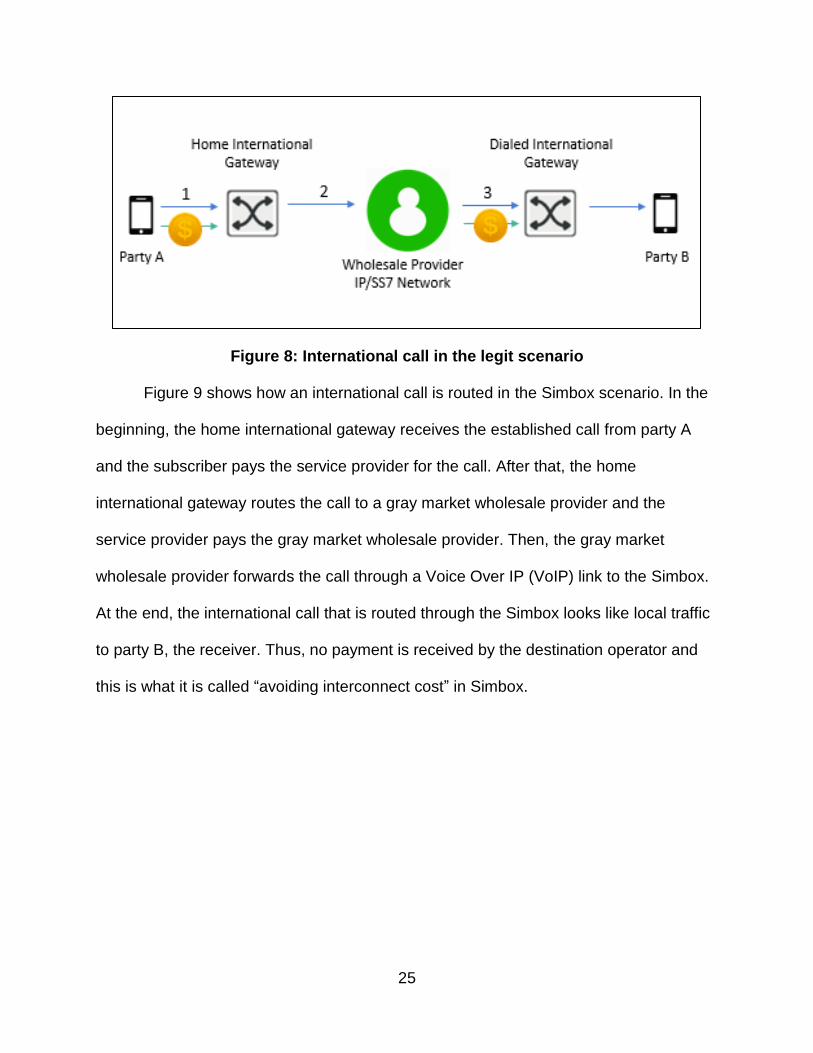
Figure 8: International call in the legit scenario
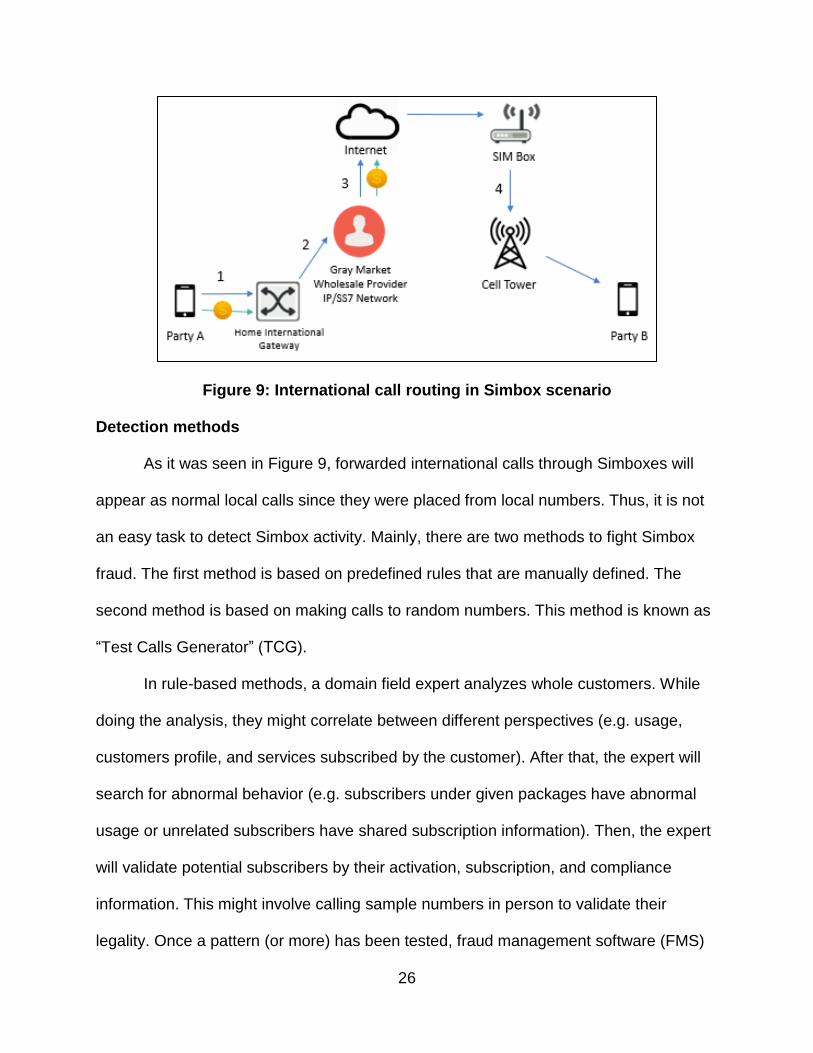
Figure 9 shows how an international call is routed in the Simbox scenario. In the
beginning, the home international gateway receives the established call from party A
and the subscriber pays the service provider for the call. After that, the home
international gateway routes the call to a gray market wholesale provider and the
service provider pays the gray market wholesale provider. Then, the gray market
wholesale provider forwards the call through a Voice Over IP (VoIP) link to the Simbox.
At the end, the international call that is routed through the Simbox looks like local traffic
to party B, the receiver. Thus, no payment is received by the destination operator and
this is what it is called “avoiding interconnect cost” in Simbox.
26
Figure 9: International call routing in Simbox scenario
Detection methods
As it was seen in Figure 9, forwarded international calls through Simboxes will
appear as normal local calls since they were placed from local numbers. Thus, it is not
an easy task to detect Simbox activity. Mainly, there are two methods to fight Simbox
fraud. The first method is based on predefined rules that are manually defined. The
second method is based on making calls to random numbers. This method is known as
“Test Calls Generator” (TCG).
In rule-based methods, a domain field expert analyzes whole customers. While
doing the analysis, they might correlate between different perspectives (e.g. usage,
customers profile, and services subscribed by the customer). After that, the expert will
search for abnormal behavior (e.g. subscribers under given packages have abnormal
usage or unrelated subscribers have shared subscription information). Then, the expert
will validate potential subscribers by their activation, subscription, and compliance
information. This might involve calling sample numbers in person to validate their
legality. Once a pattern (or more) has been tested, fraud management software (FMS)
27
will be supplied through found patterns in the shape of rules. These rules will be used
later to detect any potential fraudster in the future. Compared to the test call generators
method, rule-based methods are relatively less expensive. In the case that data
analysis is conducted in an accurate way, a wide range of subscribers will be covered,
which provides better awareness of a fraudster’s behavior. On the other hand, there are
cons to rule-based methods. Rule-based methods require continuous monitoring and
field expert intervention. Also, they are difficult to maintain since they require intensive
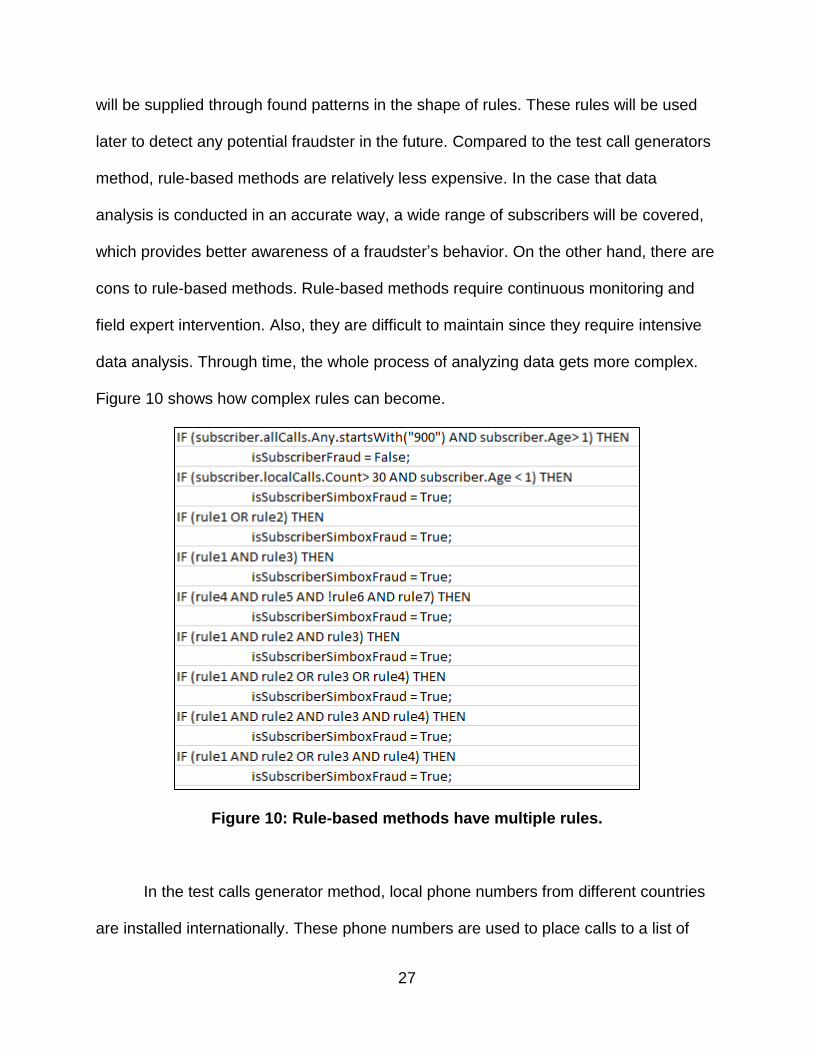
data analysis. Through time, the whole process of analyzing data gets more complex.
Figure 10 shows how complex rules can become.
Figure 10: Rule-based methods have multiple rules.
In the test calls generator method, local phone numbers from different countries
are installed internationally. These phone numbers are used to place calls to a list of
28
predefined numbers that are available in a home country. Once the predefined numbers
receive the call, caller line identification (CLI) is tested. Unless CLI matches the
international number that placed the call, no issue is detected since the call was
forwarded in a legitimate way. Thus, no change in CLI has been detected, but if CLI
does not match the international number that placed the call and a local number
appears instead, this means that the call has been forwarded using the Internet and
Simbox fraud has been detected. What distinguishes the TCG method over rule-based
method is that once a case is detected using the TCG method, it will be a confirmed
Simbox case. Hence, there is no error possibility while using the TCG method. This
error-free method, unfortunately, has many downsides:
1- In order to cover the same base of subscribers covered in rules-based methods,
the TCG-based method will cost more.
2- It requires heavy maintenance and recycling of placed international SIMs.
Otherwise, fraudsters will be aware of numbers that are doing test calls and will
allow reached calls from them to be forwarded normally.
3- Contrary to rule-based methods, while using TCG methods, it is impossible to
cover the whole base of target subscribers.
4- Calls are placed randomly. Thus, there is a possibility that a call will be placed to
a subscriber out of the targeted base (e.g. corporate or postpaid numbers).
29
Literature Related to the Problem
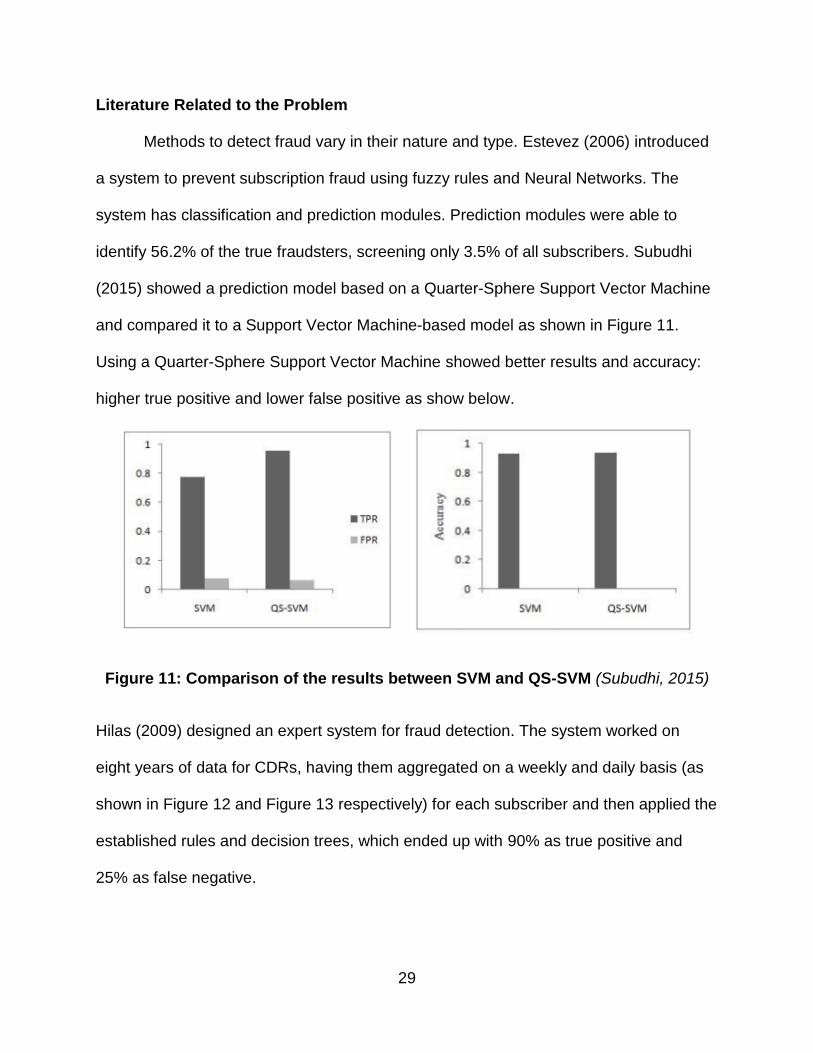
Methods to detect fraud vary in their nature and type. Estevez (2006) introduced
a system to prevent subscription fraud using fuzzy rules and Neural Networks. The
system has classification and prediction modules. Prediction modules were able to
identify 56.2% of the true fraudsters, screening only 3.5% of all subscribers. Subudhi
(2015) showed a prediction model based on a Quarter-Sphere Support Vector Machine
and compared it to a Support Vector Machine-based model as shown in Figure 11.
Using a Quarter-Sphere Support Vector Machine showed better results and accuracy:
higher true positive and lower false positive as show below.
Figure 11: Comparison of the results between SVM and QS-SVM (Subudhi, 2015)
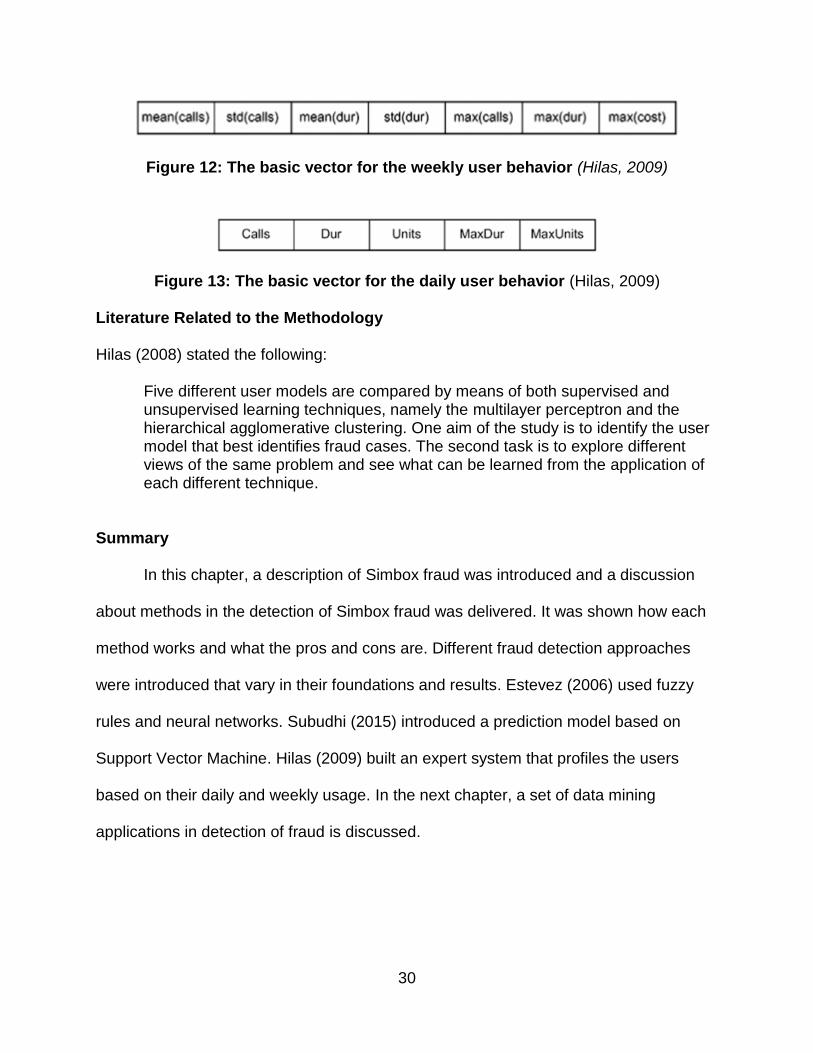
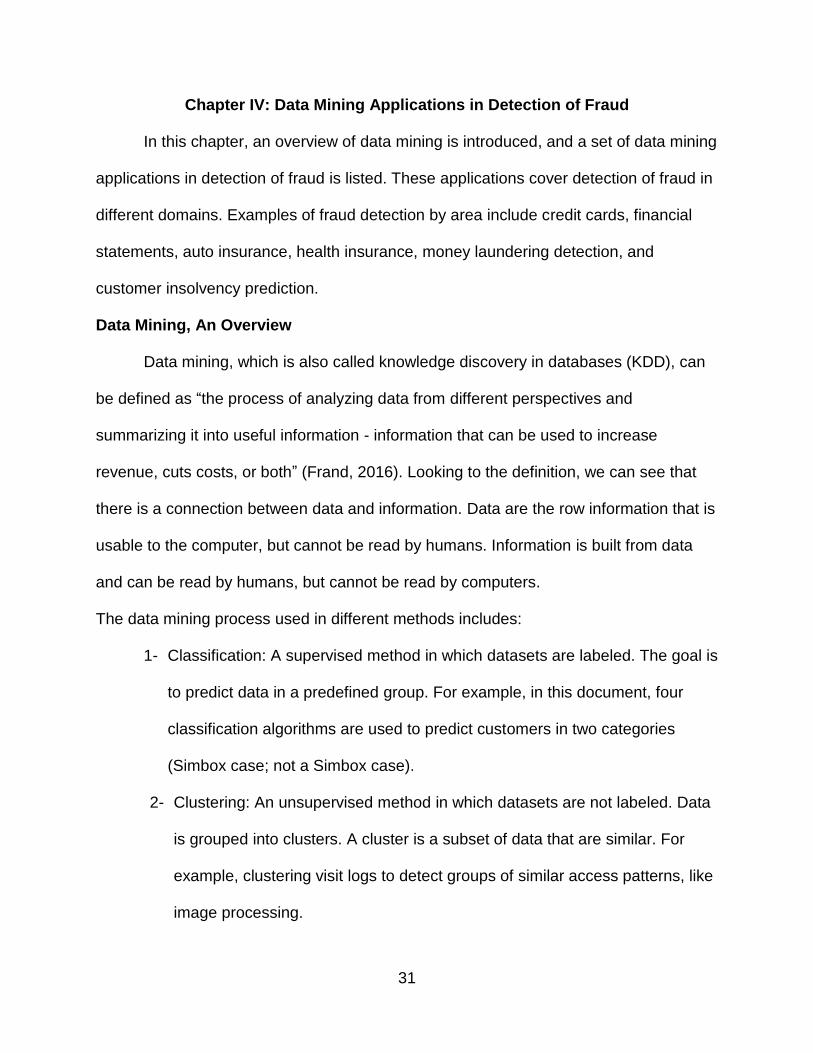
Hilas (2009) designed an expert system for fraud detection. The system worked on
eight years of data for CDRs, having them aggregated on a weekly and daily basis (as
shown in Figure 12 and Figure 13 respectively) for each subscriber and then applied the
established rules and decision trees, which ended up with 90% as true positive and
25% as false negative.
30
Figure 12: The basic vector for the weekly user behavior (Hilas, 2009)
Figure 13: The basic vector for the daily user behavior (Hilas, 2009)
Literature Related to the Methodology
Hilas (2008) stated the following:
Five different user models are compared by means of both supervised and unsupervised learning techniques, namely the multilayer perceptron and the hierarchical agglomerative clustering. One aim of the study is to identify the user model that best identifies fraud cases. The second task is to explore different views of the same problem and see what can be learned from the application of each different technique.
Summary
In this chapter, a description of Simbox fraud was introduced and a discussion
about methods in the detection of Simbox fraud was delivered. It was shown how each
method works and what the pros and cons are. Different fraud detection approaches
were introduced that vary in their foundations and results. Estevez (2006) used fuzzy
rules and neural networks. Subudhi (2015) introduced a prediction model based on
Support Vector Machine. Hilas (2009) built an expert system that profiles the users
based on their daily and weekly usage. In the next chapter, a set of data mining
applications in detection of fraud is discussed.
31
Chapter IV: Data Mining Applications in Detection of Fraud
In this chapter, an overview of data mining is introduced, and a set of data mining
applications in detection of fraud is listed. These applications cover detection of fraud in
different domains. Examples of fraud detection by area include credit cards, financial
statements, auto insurance, health insurance, money laundering detection, and
customer insolvency prediction.
Data Mining, An Overview
Data mining, which is also called knowledge discovery in databases (KDD), can
be defined as “the process of analyzing data from different perspectives and
summarizing it into useful information - information that can be used to increase
revenue, cuts costs, or both” (Frand, 2016). Looking to the definition, we can see that
there is a connection between data and information. Data are the row information that is
usable to the computer, but cannot be read by humans. Information is built from data
and can be read by humans, but cannot be read by computers.
The data mining process used in different methods includes:
1- Classification: A supervised method in which datasets are labeled. The goal is
to predict data in a predefined group. For example, in this document, four
classification algorithms are used to predict customers in two categories
(Simbox case; not a Simbox case).
2- Clustering: An unsupervised method in which datasets are not labeled. Data
is grouped into clusters. A cluster is a subset of data that are similar. For
example, clustering visit logs to detect groups of similar access patterns, like
image processing.
32
3- Associations: An unsupervised method in which the goal is to discover the
probability of the co-occurrence of items in a collection (Oracle, 2016).
Data Mining Applications in Detection of Fraud
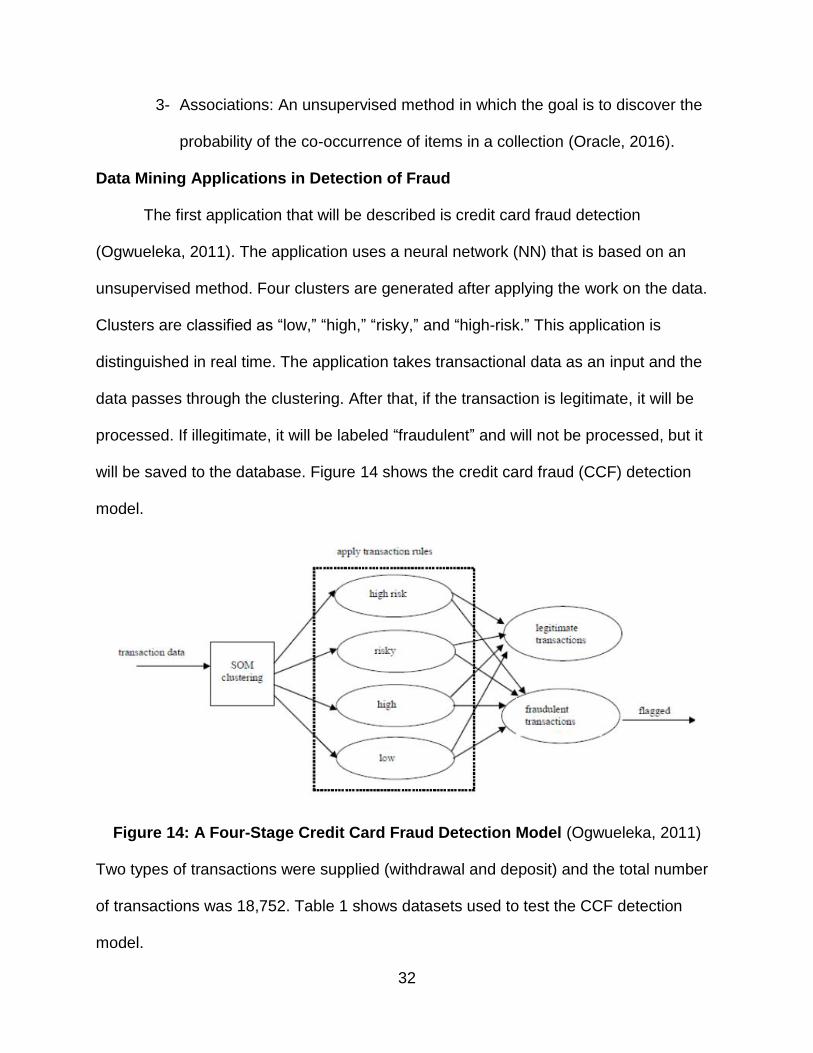
The first application that will be described is credit card fraud detection
(Ogwueleka, 2011). The application uses a neural network (NN) that is based on an
unsupervised method. Four clusters are generated after applying the work on the data.
Clusters are classified as “low,” “high,” “risky,” and “high-risk.” This application is
distinguished in real time. The application takes transactional data as an input and the
data passes through the clustering. After that, if the transaction is legitimate, it will be
processed. If illegitimate, it will be labeled “fraudulent” and will not be processed, but it
will be saved to the database. Figure 14 shows the credit card fraud (CCF) detection
model.
Figure 14: A Four-Stage Credit Card Fraud Detection Model (Ogwueleka, 2011)
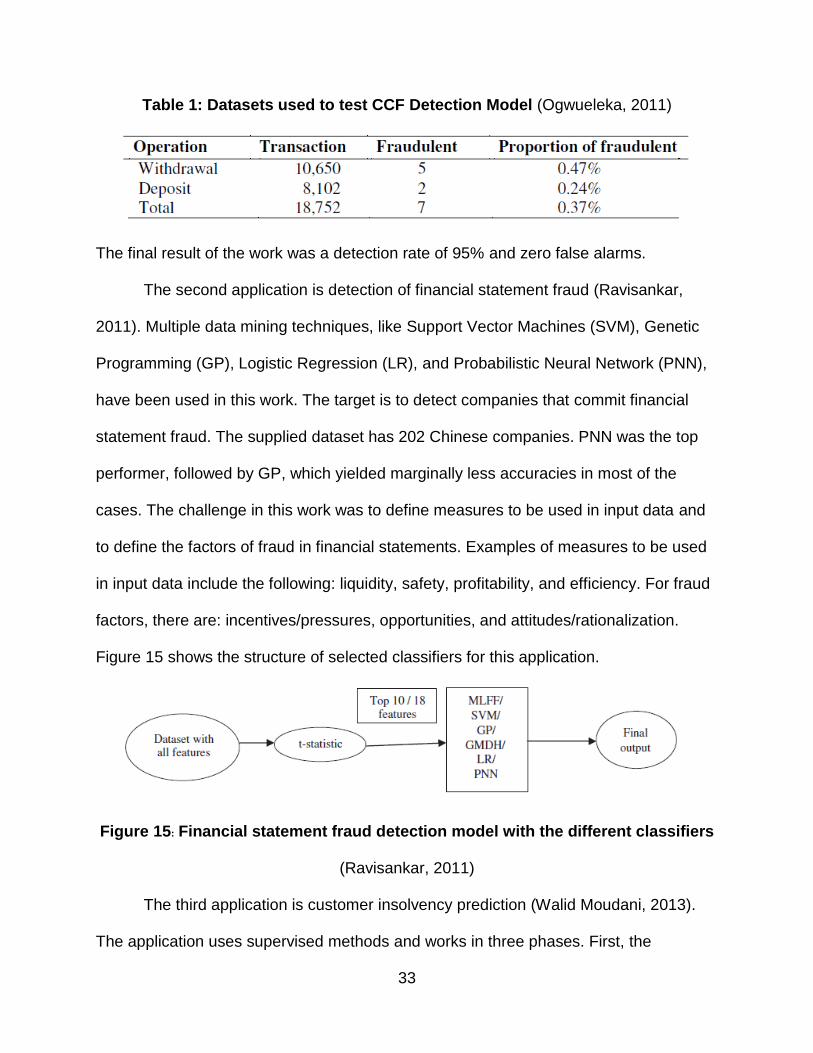
Two types of transactions were supplied (withdrawal and deposit) and the total number
of transactions was 18,752. Table 1 shows datasets used to test the CCF detection
model.
33
Table 1: Datasets used to test CCF Detection Model (Ogwueleka, 2011)
The final result of the work was a detection rate of 95% and zero false alarms.
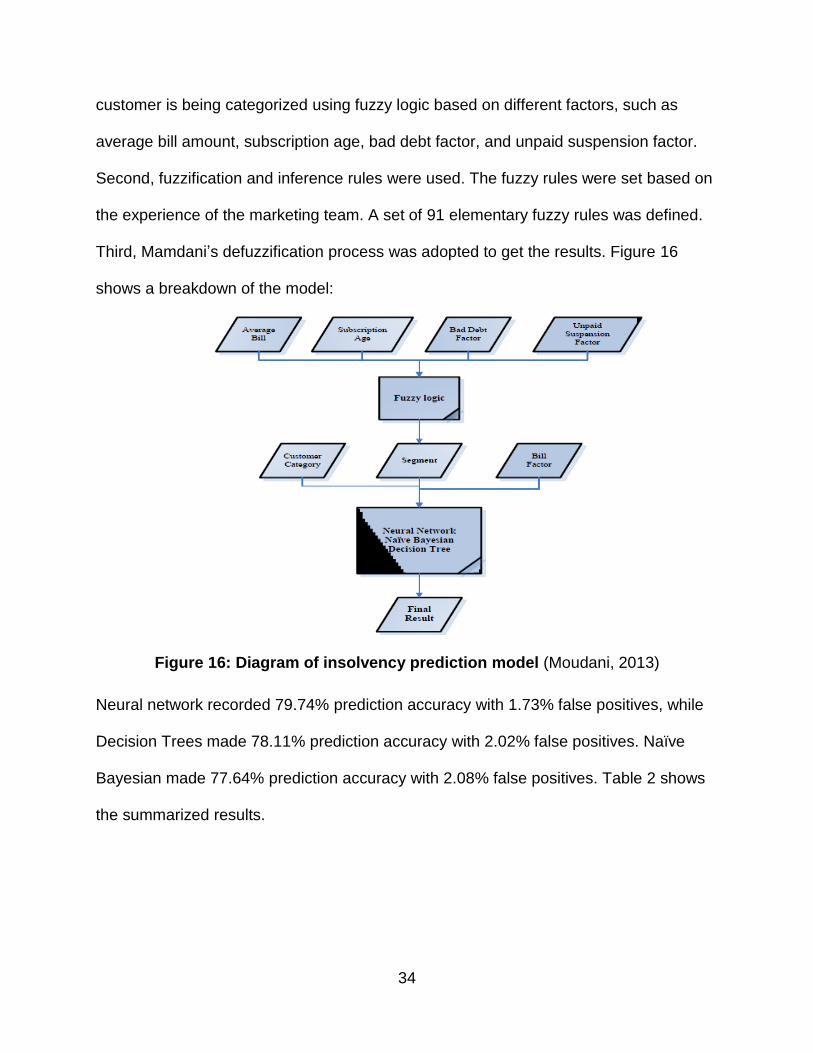
The second application is detection of financial statement fraud (Ravisankar,
2011). Multiple data mining techniques, like Support Vector Machines (SVM), Genetic
Programming (GP), Logistic Regression (LR), and Probabilistic Neural Network (PNN),
have been used in this work. The target is to detect companies that commit financial
statement fraud. The supplied dataset has 202 Chinese companies. PNN was the top
performer, followed by GP, which yielded marginally less accuracies in most of the
cases. The challenge in this work was to define measures to be used in input data and
to define the factors of fraud in financial statements. Examples of measures to be used
in input data include the following: liquidity, safety, profitability, and efficiency. For fraud
factors, there are: incentives/pressures, opportunities, and attitudes/rationalization.
Figure 15 shows the structure of selected classifiers for this application.
Figure 15: Financial statement fraud detection model with the different classifiers
(Ravisankar, 2011)
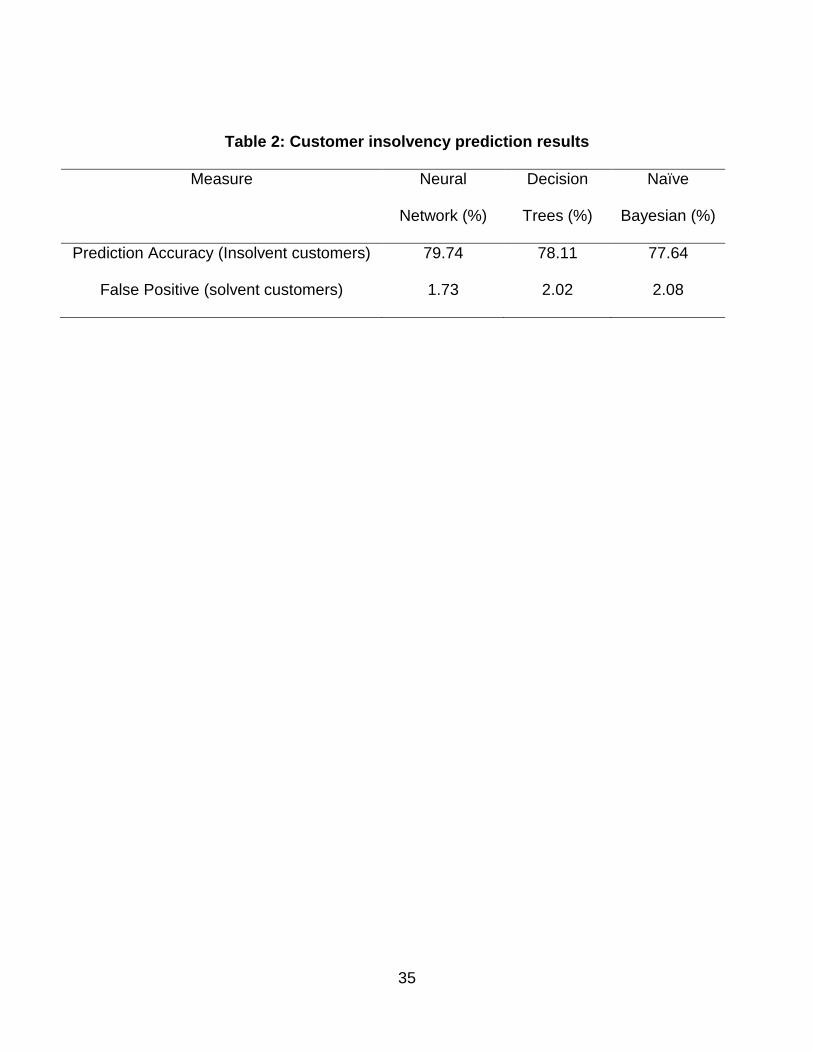
The third application is customer insolvency prediction (Walid Moudani, 2013).
The application uses supervised methods and works in three phases. First, the
34
customer is being categorized using fuzzy logic based on different factors, such as
average bill amount, subscription age, bad debt factor, and unpaid suspension factor.
Second, fuzzification and inference rules were used. The fuzzy rules were set based on
the experience of the marketing team. A set of 91 elementary fuzzy rules was defined.
Third, Mamdani’s defuzzification process was adopted to get the results. Figure 16
shows a breakdown of the model:
Figure 16: Diagram of insolvency prediction model (Moudani, 2013)
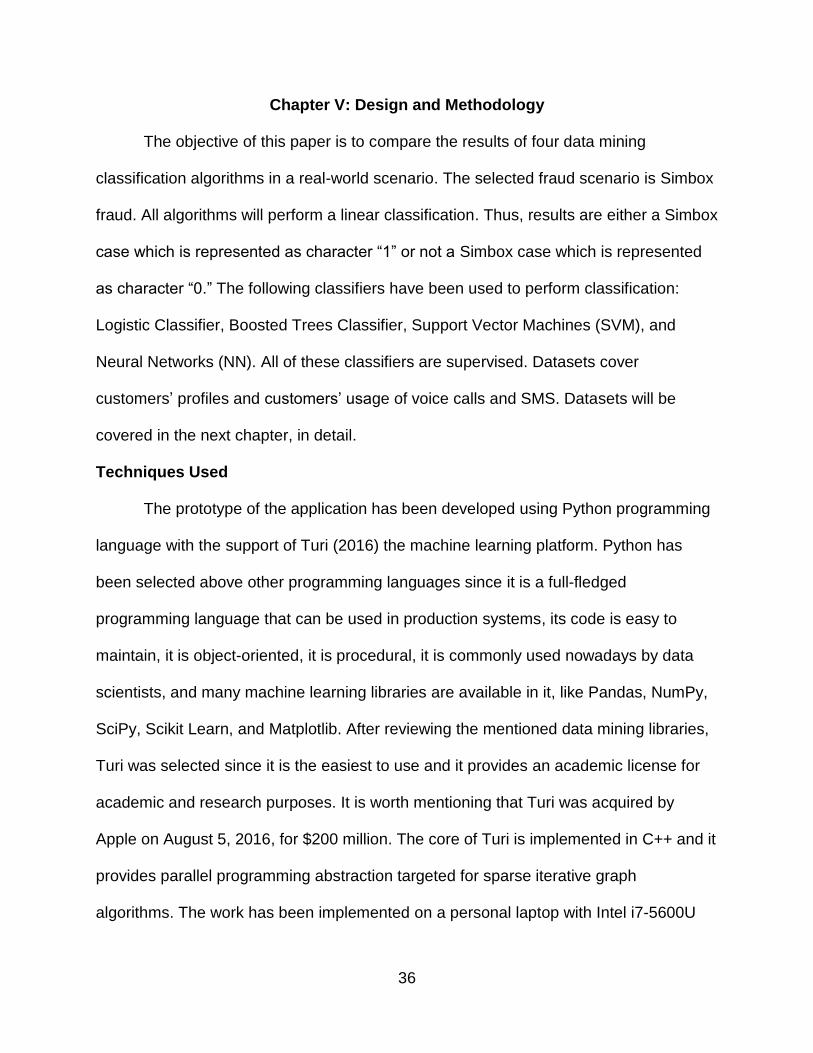
Neural network recorded 79.74% prediction accuracy with 1.73% false positives, while
Decision Trees made 78.11% prediction accuracy with 2.02% false positives. Naïve
Bayesian made 77.64% prediction accuracy with 2.08% false positives. Table 2 shows
the summarized results.
35
Table 2: Customer insolvency prediction results
Measure Neural
Network (%)
Decision
Trees (%)
Naïve
Bayesian (%)
Prediction Accuracy (Insolvent customers) 79.74 78.11 77.64
False Positive (solvent customers) 1.73 2.02 2.08
36
Chapter V: Design and Methodology
The objective of this paper is to compare the results of four data mining
classification algorithms in a real-world scenario. The selected fraud scenario is Simbox
fraud. All algorithms will perform a linear classification. Thus, results are either a Simbox
case which is represented as character “1” or not a Simbox case which is represented
as character “0.” The following classifiers have been used to perform classification:
Logistic Classifier, Boosted Trees Classifier, Support Vector Machines (SVM), and
Neural Networks (NN). All of these classifiers are supervised. Datasets cover
customers’ profiles and customers’ usage of voice calls and SMS. Datasets will be
covered in the next chapter, in detail.
Techniques Used
The prototype of the application has been developed using Python programming
language with the support of Turi (2016) the machine learning platform. Python has
been selected above other programming languages since it is a full-fledged
programming language that can be used in production systems, its code is easy to
maintain, it is object-oriented, it is procedural, it is commonly used nowadays by data
scientists, and many machine learning libraries are available in it, like Pandas, NumPy,
SciPy, Scikit Learn, and Matplotlib. After reviewing the mentioned data mining libraries,
Turi was selected since it is the easiest to use and it provides an academic license for
academic and research purposes. It is worth mentioning that Turi was acquired by
Apple on August 5, 2016, for $200 million. The core of Turi is implemented in C++ and it
provides parallel programming abstraction targeted for sparse iterative graph
algorithms. The work has been implemented on a personal laptop with Intel i7-5600U
37
CPU, 2.6GHz speed, 16 GB RAM, and a SSD hard disk. In normal cases, memory
consumption is 25%, at most, and hard disk utilization is almost 0%. Thus, the laptop is
adequate for this study.
Datasets
Acquired datasets represent real-world customers from a telecom operator.
Datasets consist of customers’ profiles and customers’ usage for a week. Simbox cases
represent 60% of the supplied data. Fraud detection experts did fraud case labeling. All
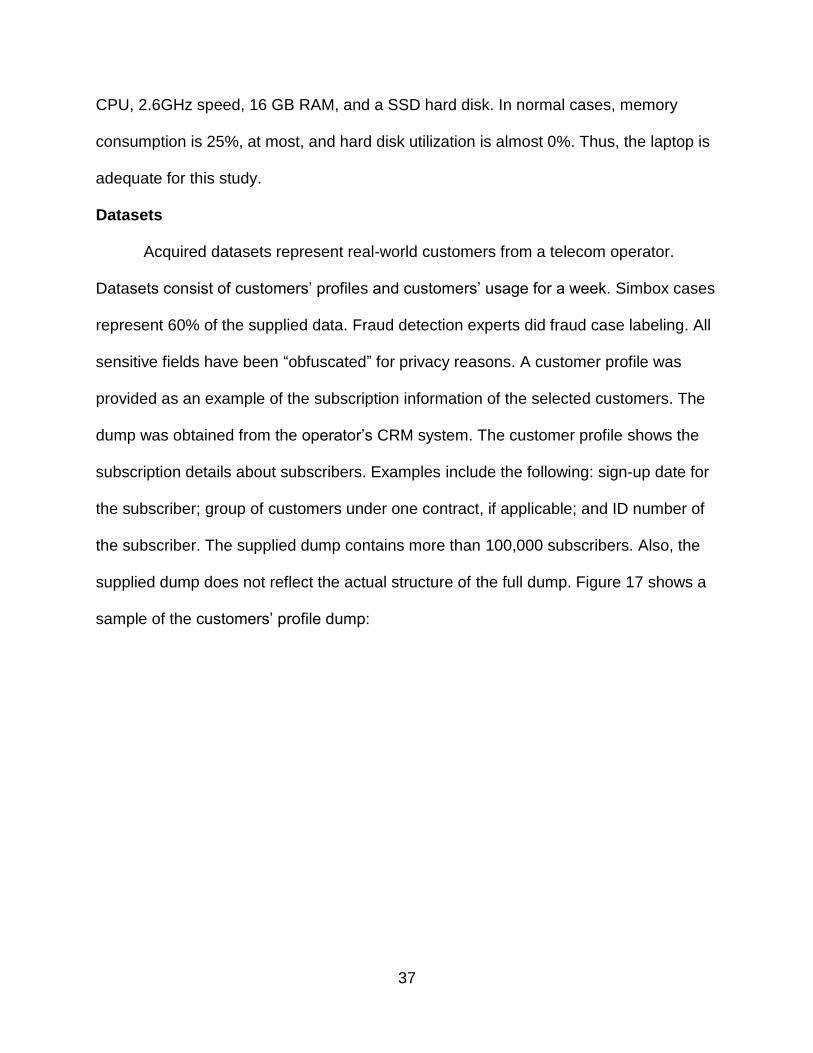
sensitive fields have been “obfuscated” for privacy reasons. A customer profile was
provided as an example of the subscription information of the selected customers. The
dump was obtained from the operator’s CRM system. The customer profile shows the
subscription details about subscribers. Examples include the following: sign-up date for
the subscriber; group of customers under one contract, if applicable; and ID number of
the subscriber. The supplied dump contains more than 100,000 subscribers. Also, the
supplied dump does not reflect the actual structure of the full dump. Figure 17 shows a
sample of the customers’ profile dump:
38
Figure 17: Sample of customers’ profile dump
The following provides a description of the fields inside the provided customers’
profiles. The Subscriber Contract ID represents the number of the contract. It is a
system-generated value and is not unique in the customers’ profiles. Subscriber Phone
Number is the phone number assigned to the customer and it is unique. Subscriber ID is
the national identifier number of a subscriber and is not unique. The “Is fraud” field is the
label used to flag whether it is a confirmed Simbox fraud case or not. One means “Yes.”
Zero means “No.” Obfuscated fields in the dump are subscriber contract ID, subscriber
phone number, current subscriber ID. Given the mentioned structure, there are two
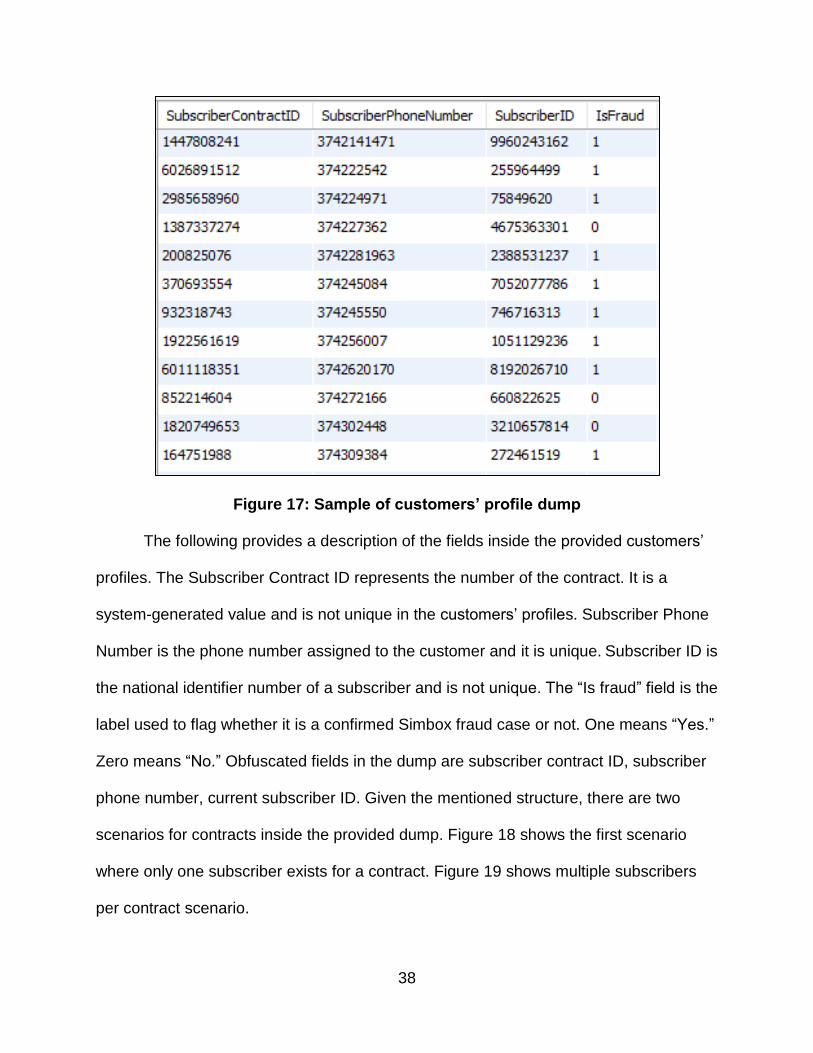
scenarios for contracts inside the provided dump. Figure 18 shows the first scenario
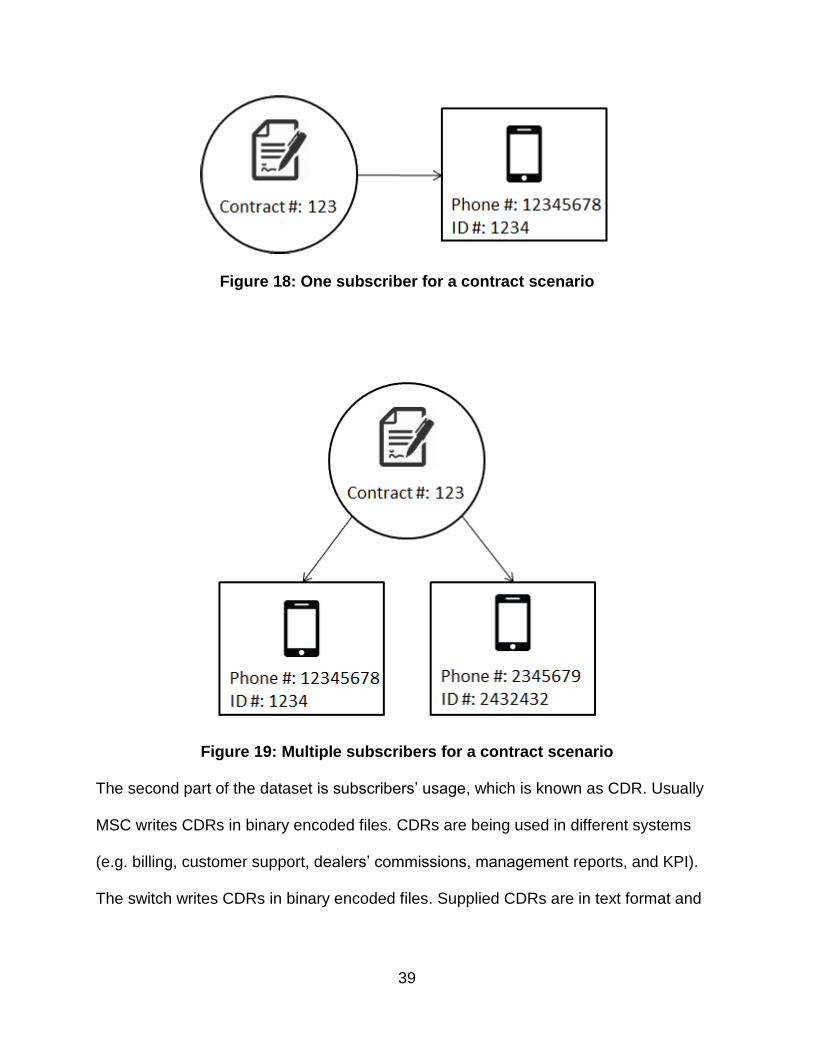
where only one subscriber exists for a contract. Figure 19 shows multiple subscribers
per contract scenario.
39
Figure 18: One subscriber for a contract scenario
Figure 19: Multiple subscribers for a contract scenario
The second part of the dataset is subscribers’ usage, which is known as CDR. Usually
MSC writes CDRs in binary encoded files. CDRs are being used in different systems
(e.g. billing, customer support, dealers’ commissions, management reports, and KPI).
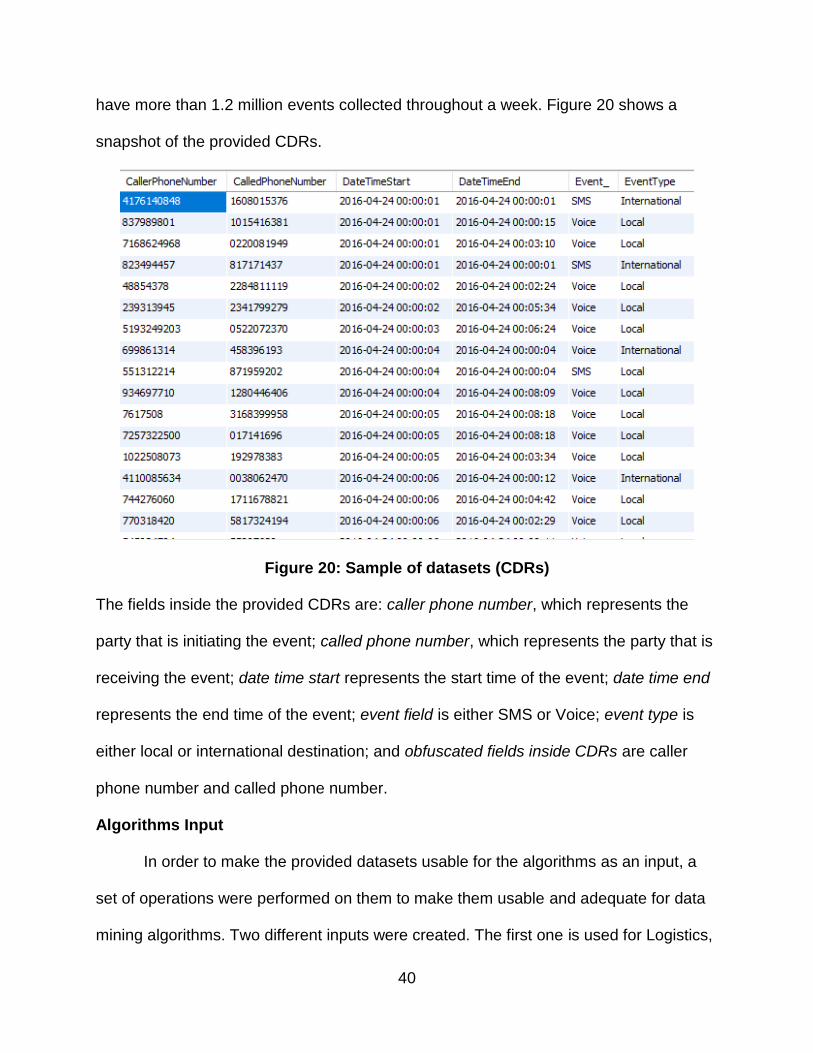
The switch writes CDRs in binary encoded files. Supplied CDRs are in text format and
40
have more than 1.2 million events collected throughout a week. Figure 20 shows a
snapshot of the provided CDRs.
Figure 20: Sample of datasets (CDRs)
The fields inside the provided CDRs are: caller phone number, which represents the
party that is initiating the event; called phone number, which represents the party that is
receiving the event; date time start represents the start time of the event; date time end
represents the end time of the event; event field is either SMS or Voice; event type is
either local or international destination; and obfuscated fields inside CDRs are caller
phone number and called phone number.
Algorithms Input
In order to make the provided datasets usable for the algorithms as an input, a
set of operations were performed on them to make them usable and adequate for data
mining algorithms. Two different inputs were created. The first one is used for Logistics,
41
Boosted Trees, and SVM classifiers. The other one is used for a Neural Network
classifier. In order to prepare the input data, the following steps have been taken:
1. Aggregated CDRs by caller phone number for each day.
2. Joined the aggregated result with customer profile.
3. Added “same ID, different contract” field that would be usable in model
training.
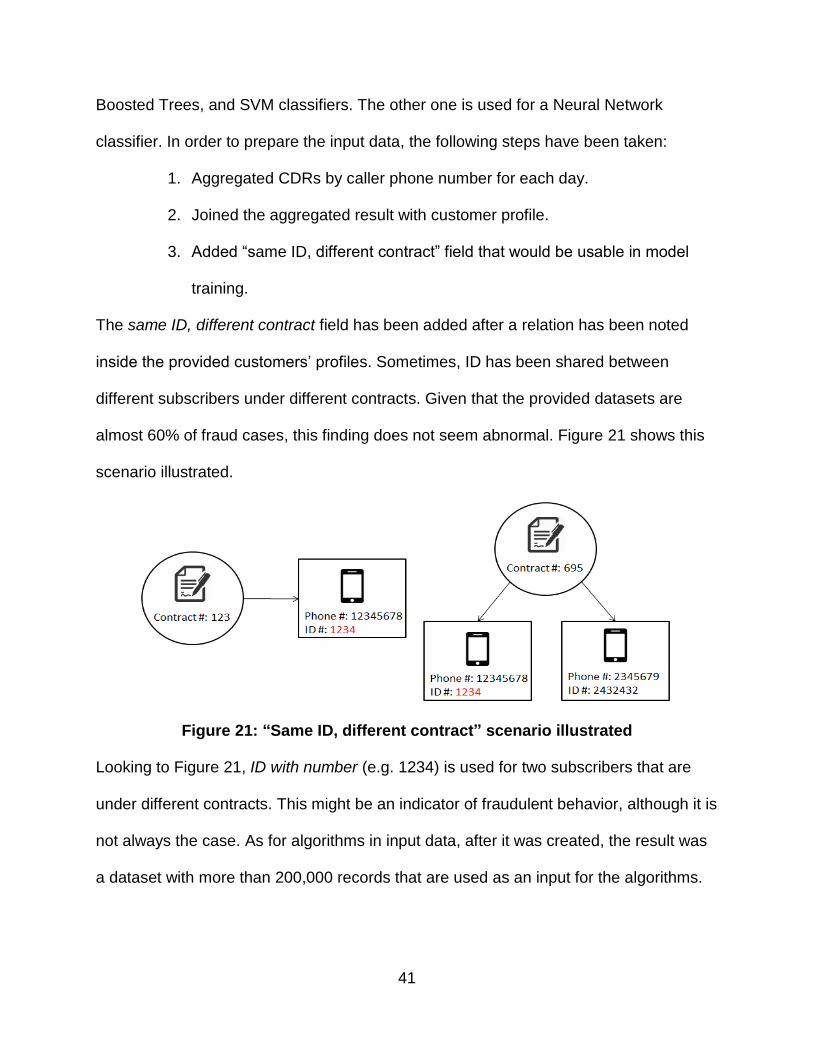
The same ID, different contract field has been added after a relation has been noted
inside the provided customers’ profiles. Sometimes, ID has been shared between
different subscribers under different contracts. Given that the provided datasets are
almost 60% of fraud cases, this finding does not seem abnormal. Figure 21 shows this
scenario illustrated.
Figure 21: “Same ID, different contract” scenario illustrated
Looking to Figure 21, ID with number (e.g. 1234) is used for two subscribers that are
under different contracts. This might be an indicator of fraudulent behavior, although it is
not always the case. As for algorithms in input data, after it was created, the result was
a dataset with more than 200,000 records that are used as an input for the algorithms.
42
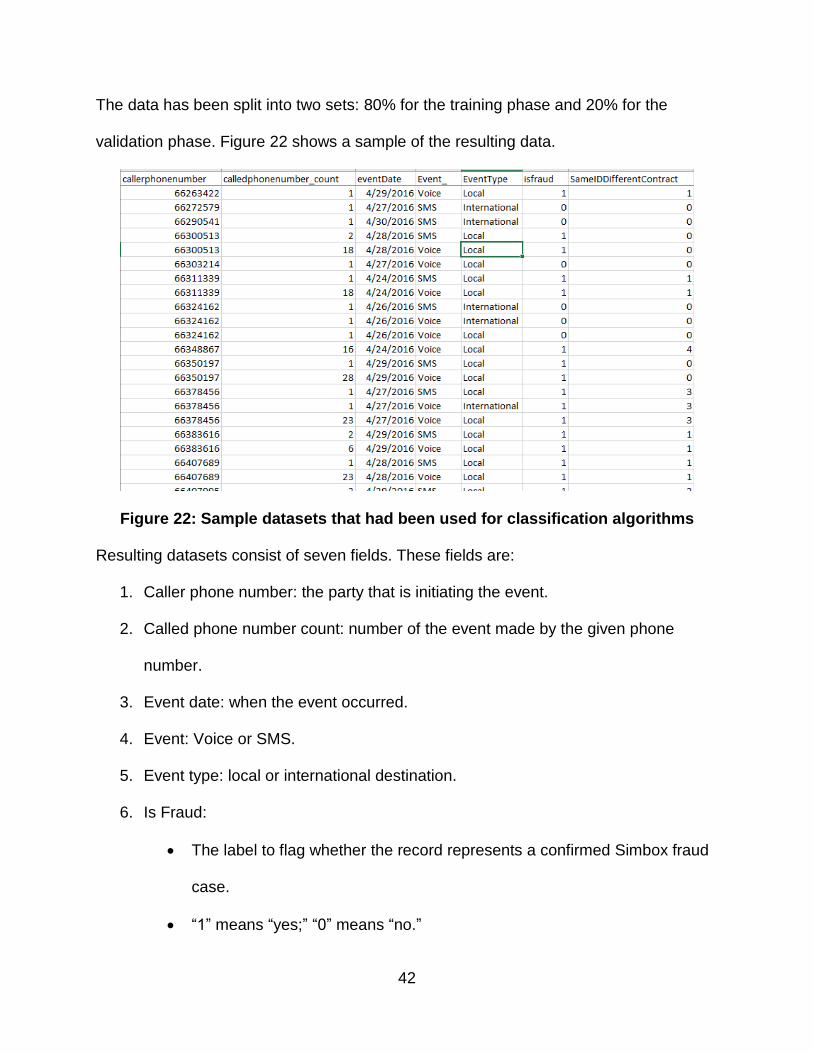
The data has been split into two sets: 80% for the training phase and 20% for the
validation phase. Figure 22 shows a sample of the resulting data.
Figure 22: Sample datasets that had been used for classification algorithms
Resulting datasets consist of seven fields. These fields are:
1. Caller phone number: the party that is initiating the event.
2. Called phone number count: number of the event made by the given phone
number.
3. Event date: when the event occurred.
4. Event: Voice or SMS.
5. Event type: local or international destination.
6. Is Fraud:
The label to flag whether the record represents a confirmed Simbox fraud
case.
“1” means “yes;” “0” means “no.”
43
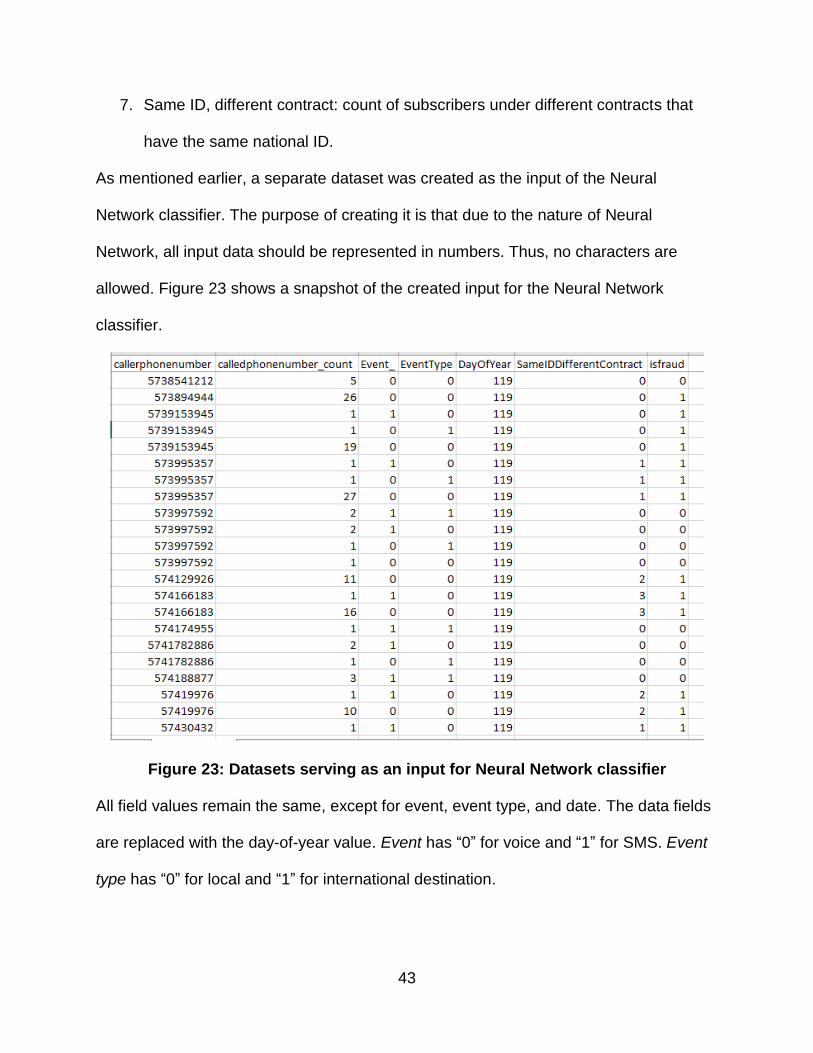
7. Same ID, different contract: count of subscribers under different contracts that
have the same national ID.
As mentioned earlier, a separate dataset was created as the input of the Neural
Network classifier. The purpose of creating it is that due to the nature of Neural
Network, all input data should be represented in numbers. Thus, no characters are
allowed. Figure 23 shows a snapshot of the created input for the Neural Network
classifier.
Figure 23: Datasets serving as an input for Neural Network classifier
All field values remain the same, except for event, event type, and date. The data fields
are replaced with the day-of-year value. Event has “0” for voice and “1” for SMS. Event
type has “0” for local and “1” for international destination.
44
Chapter VI: Results and Data Analysis
Measures used for results assessment
Five common machine learning measures have been adopted to read and
analyze the results of the work; confusion matrix, accuracy, Area Under Curve (AUC),
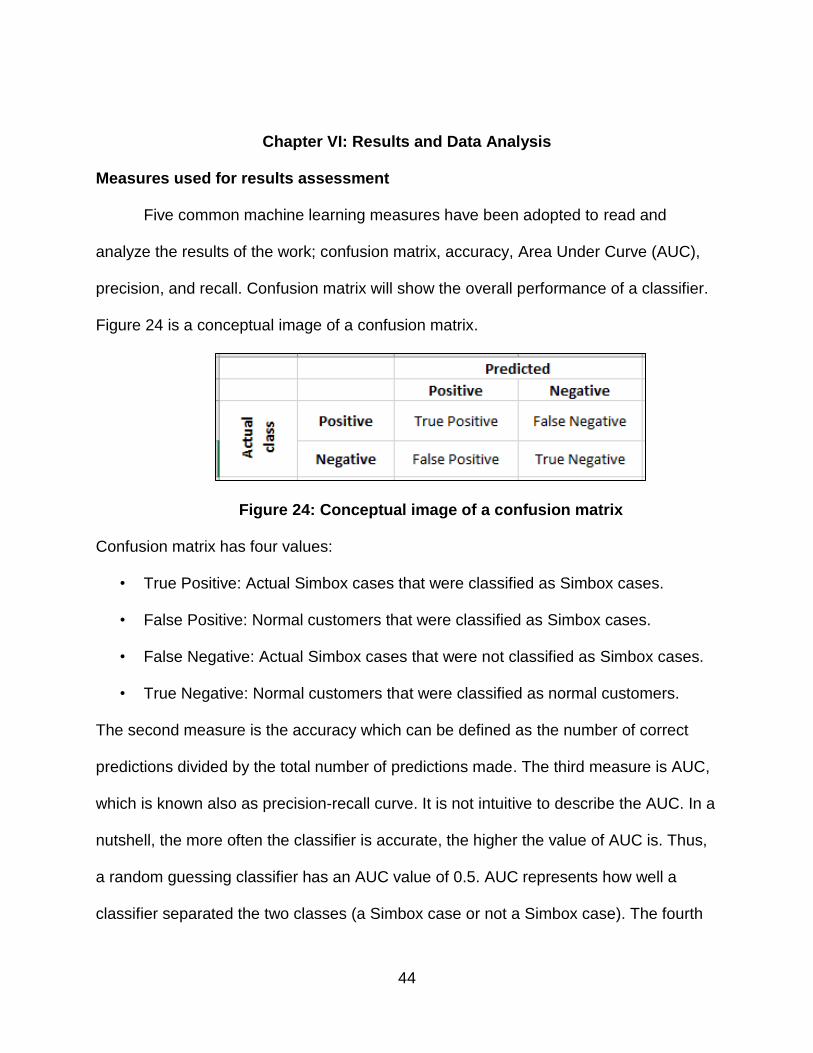
precision, and recall. Confusion matrix will show the overall performance of a classifier.
Figure 24 is a conceptual image of a confusion matrix.
Figure 24: Conceptual image of a confusion matrix
Confusion matrix has four values:
• True Positive: Actual Simbox cases that were classified as Simbox cases.
• False Positive: Normal customers that were classified as Simbox cases.
• False Negative: Actual Simbox cases that were not classified as Simbox cases.
• True Negative: Normal customers that were classified as normal customers.
The second measure is the accuracy which can be defined as the number of correct
predictions divided by the total number of predictions made. The third measure is AUC,
which is known also as precision-recall curve. It is not intuitive to describe the AUC. In a
nutshell, the more often the classifier is accurate, the higher the value of AUC is. Thus,
a random guessing classifier has an AUC value of 0.5. AUC represents how well a
classifier separated the two classes (a Simbox case or not a Simbox case). The fourth
45
measure is precision, which measures the ratio of true positive over true and false
positives, thus, how many selected items are relevant. The fifth measure is recall, which
is known also as sensitivity. Recall can be defined as how many relevant items are
selected. Mathematically, it is the ratio of true positive over true positive and false
negative.
Results analysis
The datasets analyzed in this paper comprised six features for more than 120
subscribers. Almost 72,000 subscribers are Simbox fraud cases. Table 3 shows
classification results ordered by AUC.
Table 3: Summary of classification results of Simbox fraud
Classifier Accuracy (%) Precision Recall AUC Average Time Per
Iteration (Sec)
Boosted Trees 91.12 0.9981 0.8545 0.9692 0.13
SVM 90.76 1 0.8470 0.96 0.1 Logistic 91.13 0.9984 0.8544 0.92 0.31
Neural Networks 60.37 N/A N/A N/A 0.15
Referring to Table 3, it is evident that Boosted Trees classifiers had the best
classification results and Neural Networks performed the worst. For the Logistic
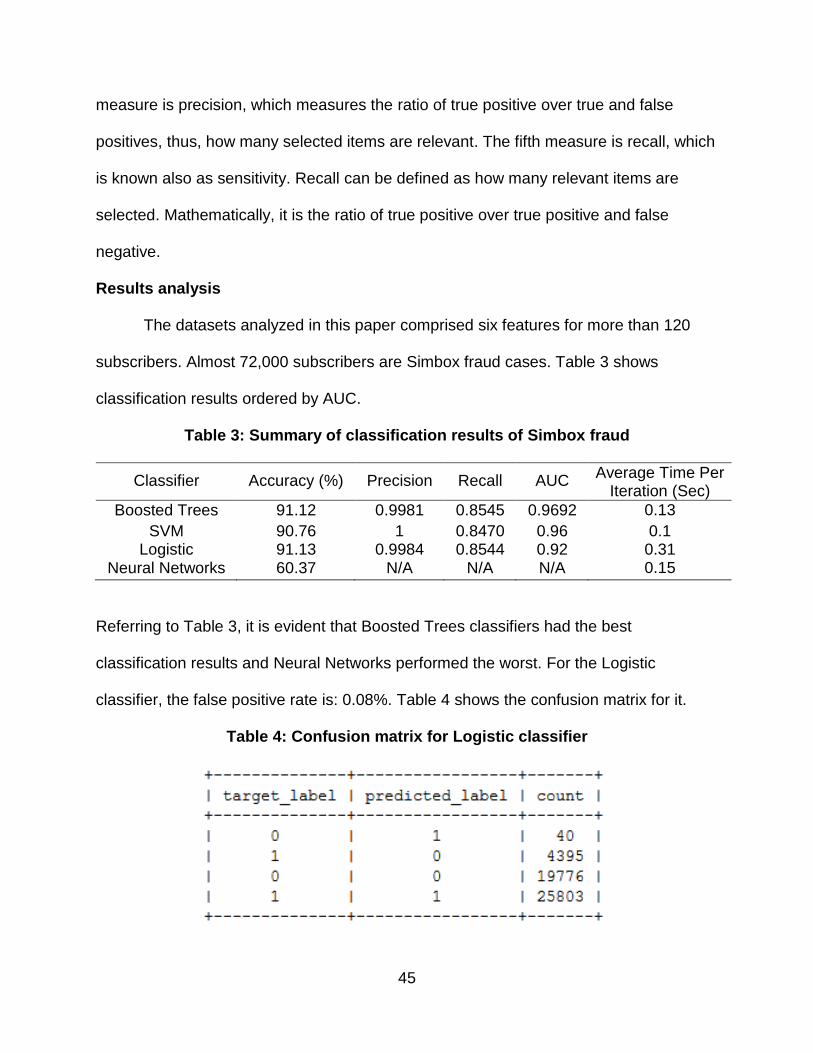
classifier, the false positive rate is: 0.08%. Table 4 shows the confusion matrix for it.
Table 4: Confusion matrix for Logistic classifier
46
In the Confusion Tree, the value of 1 means it is a Simbox fraud case, while 0 means it
is not. Training time is 3.5 seconds for a total of 11 iterations. In the Boosted Trees
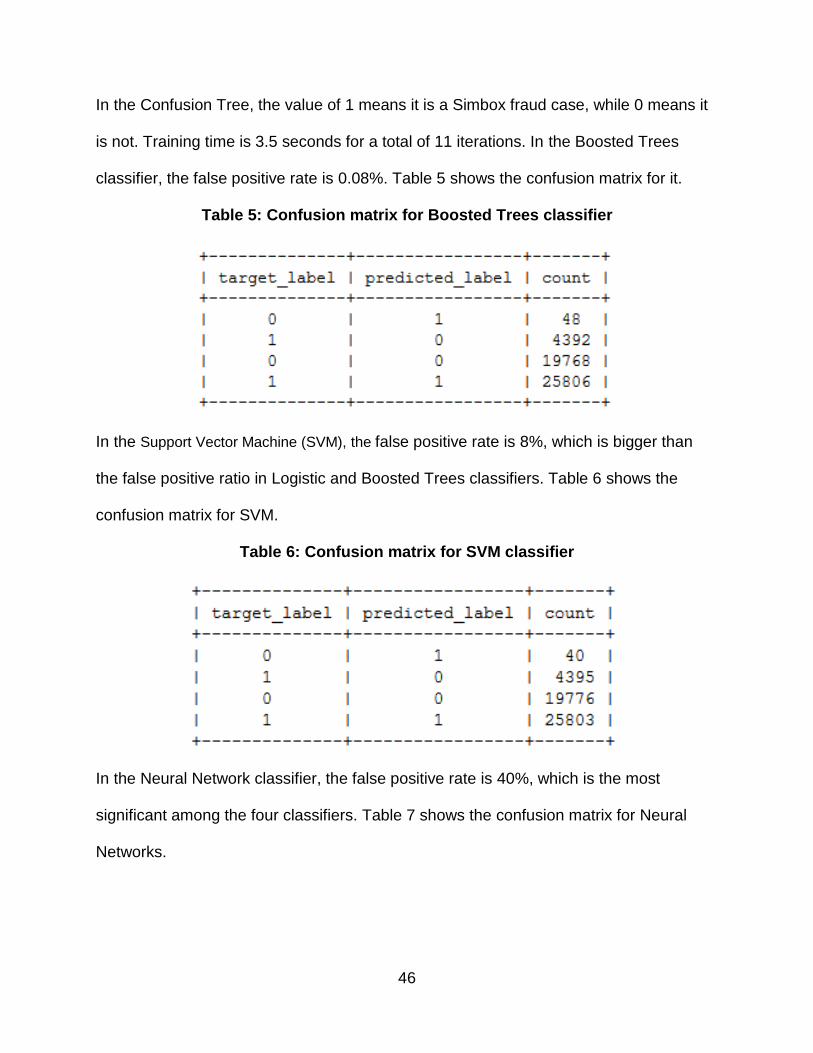
classifier, the false positive rate is 0.08%. Table 5 shows the confusion matrix for it.
Table 5: Confusion matrix for Boosted Trees classifier
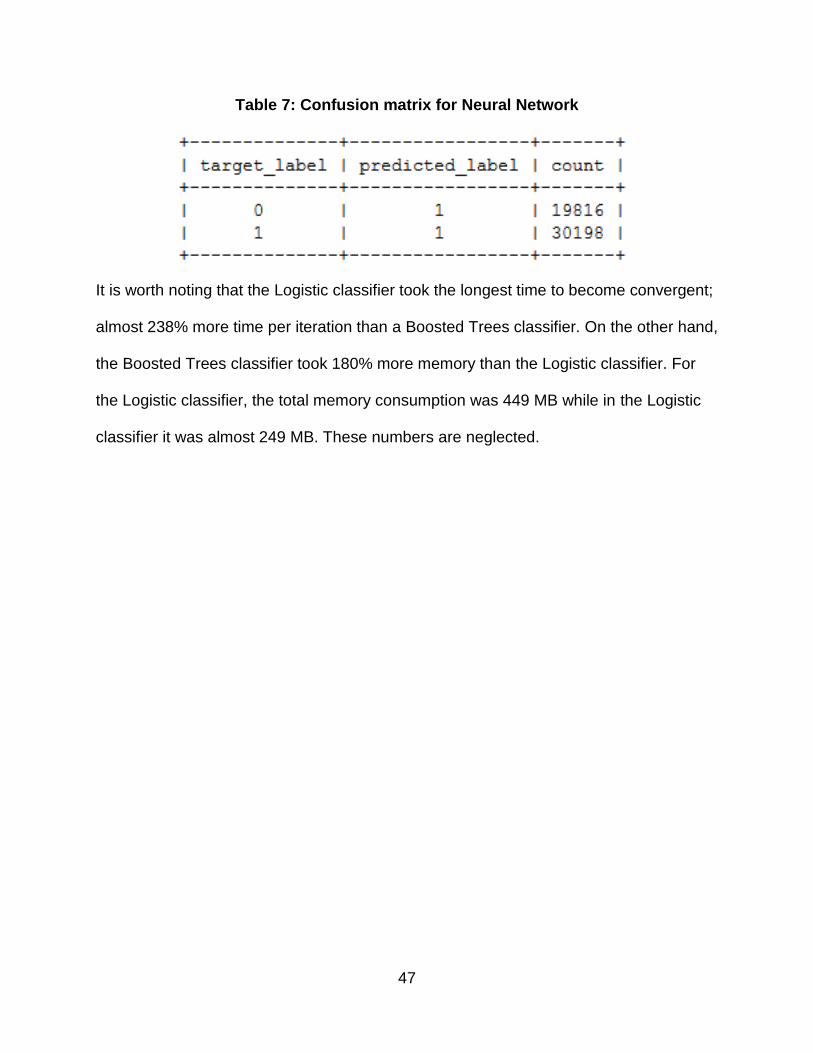
In the Support Vector Machine (SVM), the false positive rate is 8%, which is bigger than
the false positive ratio in Logistic and Boosted Trees classifiers. Table 6 shows the
confusion matrix for SVM.
Table 6: Confusion matrix for SVM classifier
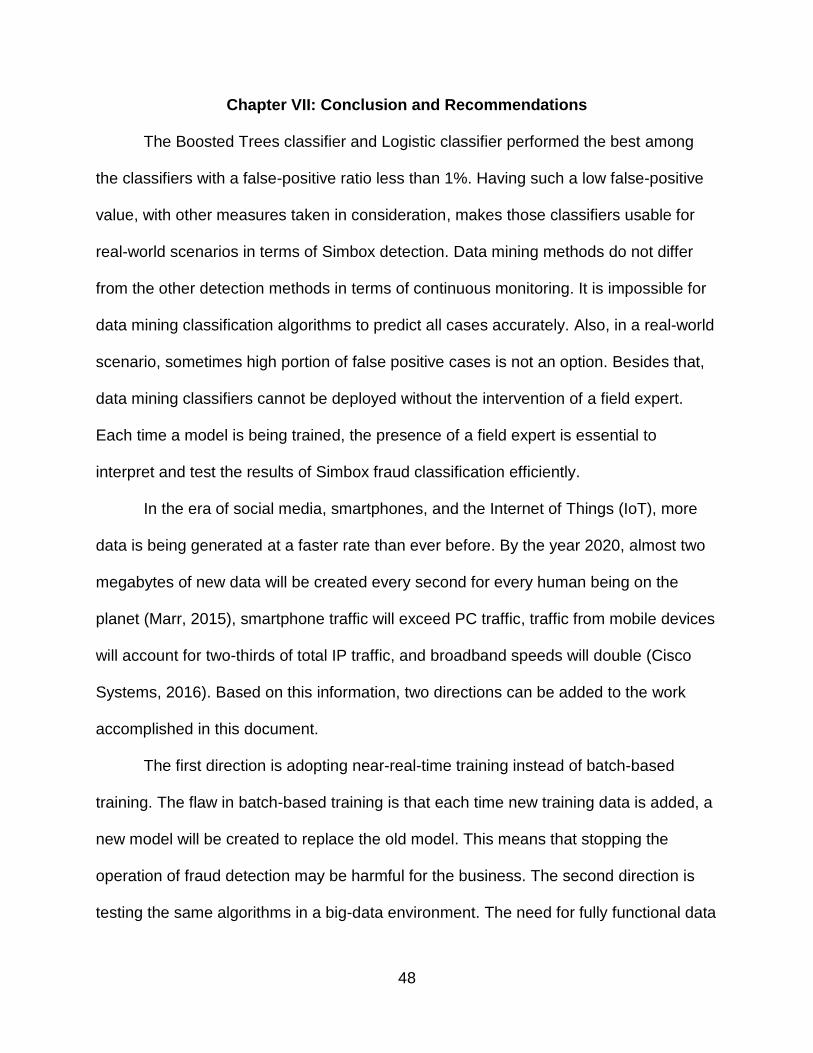
In the Neural Network classifier, the false positive rate is 40%, which is the most
significant among the four classifiers. Table 7 shows the confusion matrix for Neural
Networks.
47
Table 7: Confusion matrix for Neural Network
It is worth noting that the Logistic classifier took the longest time to become convergent;
almost 238% more time per iteration than a Boosted Trees classifier. On the other hand,
the Boosted Trees classifier took 180% more memory than the Logistic classifier. For
the Logistic classifier, the total memory consumption was 449 MB while in the Logistic
classifier it was almost 249 MB. These numbers are neglected.
48
Chapter VII: Conclusion and Recommendations
The Boosted Trees classifier and Logistic classifier performed the best among
the classifiers with a false-positive ratio less than 1%. Having such a low false-positive
value, with other measures taken in consideration, makes those classifiers usable for
real-world scenarios in terms of Simbox detection. Data mining methods do not differ
from the other detection methods in terms of continuous monitoring. It is impossible for
data mining classification algorithms to predict all cases accurately. Also, in a real-world
scenario, sometimes high portion of false positive cases is not an option. Besides that,
data mining classifiers cannot be deployed without the intervention of a field expert.
Each time a model is being trained, the presence of a field expert is essential to
interpret and test the results of Simbox fraud classification efficiently.
In the era of social media, smartphones, and the Internet of Things (IoT), more
data is being generated at a faster rate than ever before. By the year 2020, almost two
megabytes of new data will be created every second for every human being on the
planet (Marr, 2015), smartphone traffic will exceed PC traffic, traffic from mobile devices
will account for two-thirds of total IP traffic, and broadband speeds will double (Cisco
Systems, 2016). Based on this information, two directions can be added to the work
accomplished in this document.
The first direction is adopting near-real-time training instead of batch-based
training. The flaw in batch-based training is that each time new training data is added, a
new model will be created to replace the old model. This means that stopping the
operation of fraud detection may be harmful for the business. The second direction is
testing the same algorithms in a big-data environment. The need for fully functional data
49
mining in a big data environment is needed more than ever. Apache Spark can be used
to cover this operation (direction). Apache Spark offers in-memory storage capability
and can run on top of Apache Hadoop (Apache Spark, 2016), which makes it an ideal
option to run data mining algorithms in a big-data environment.
In the end, given contemporary technical capabilities, data mining classifiers can
be used commercially to predict and help detect fraud cases. However, data mining
algorithms are not enough on their own for these purposes. It is advisable to use other
methods that are not based on data analysis (e.g. test call generator) in conjunction with
data mining algorithms, especially when data mining models are being deployed for the
first time. Additionally, it is recommended that data mining classifiers be adopted over
manual investigation-based models. Data mining classifiers can detect patterns that are
not intuitive to field experts.
50
References
Angela Wu Huizhou Yuexun Network Technology Co., Ltd. (2016, November). GSM
Gateway Sim Box + Goip Sim Bank 256 Ports Remote Sim Card Emulator.
Retrieved from Alibaba.com: https://www.alibaba.com/product-detail/gsm-
gateway-SIM-box-GOIP-SIM_60271171996.html
Apache Spark. (2016, November 16). Apache Spark™ - Lightning-Fast Cluster
Computing. Retrieved from Apache Spark: http://spark.apache.org/
Broida, R. (2011, September 7). How to block text-message spam on your iPhone
(AT&T). Retrieved from CNET Magazine: https://www.cnet.com/how-to/how-to-
block-text-message-spam-on-your-iphone-at-t/
CFCA. (2015). CFCA's global fraud loss survey. Retrieved from cfca.org:
http://www.cfca.org/pdf/survey/2015_CFCA_Global_Fraud_Loss_Survey_Press_
Release.pdf
Cisco Systems. (2016, June 02). The Zettabyte Era: Trends and Analysis. Retrieved
from Cisco Systems, Inc:
http://www.cisco.com/c/en/us/solutions/collateral/service-provider/visual-
networking-index-vni/vni-hyperconnectivity-wp.html
Datanomers. (2016). Big Data Solution: International Revenue Share Fraud. Retrieved
from Datanomers Corporate Website:
http://datanomers.com/whitepapers/International_Revenue_Share_Fraud.pdf
Este´vez, P. (2006). Subscription fraud prevention in telecommunications. Expert
Systems with Applications 31, 337-344.
51
FML. (2003). FML revenue assurance and fraud management yearbook. Retrieved from
FML, FML revenue assurance and fraud management yearbook.
Frand, J. (2016). Data Mining: What is Data Mining? Retrieved from UCLA:
http://www.anderson.ucla.edu/faculty/jason.frand/teacher/technologies/palace/dat
amining.htm
Gartner. (2016, 10 26). IT Glossary. Retrieved from Gartner, Inc:
http://www.gartner.com/it-glossary/revenue-assurance/
Grianna, S. (2016, May 17). Craigslist SMS Phishing. Retrieved from The
AdaptiveMobile Blog: https://www.adaptivemobile.com/blog/craigslist-sms-
phishing
Hilas, C. (2008, October). An application of supervised and unsupervised learning
approaches to telecommunications fraud detection. Knowledge-Based Systems,
pp. 721-726.
Hilas, C. (2009). Designing an expert system for fraud detection in private
telecommunications networks. Expert Systems with Applications 36, 11559–
11569.
Hoath, P. (1998). Telecoms fraud, the gory details. Computer Fraud & Security, 10–14.
Howells, I., Stapleton, P., & Scharf-Katz, V. (2013). Telecom Fraud 101. Retrieved from
Argyle Data, INC: http://www.argyledata.com/files/Telecom-Fraud-101-eBook.pdf
Kalladan, D. (2010). Why setting right controls & KPIs is even more important with 3G?
Retrieved from Subex Corportation Webs site: http://www.subex.com/pdf/Why-
setting-right-controls-KPIs-is-even-more-important-with-3G.pdf
52
KPMG. (2012). Global Revenue Assurance Survey. Retrieved from KPMG LLP:
https://www.kpmg.com/Global/en/IssuesAndInsights/ArticlesPublications/global-
revenue-assurance-survey/Documents/global-revenue-assurance-survey.pdf
Marr, B. (2015, September 30). Big Data: 20 Mind-Boggling Facts Everyone Must Read.
Retrieved from Forbes Magazine Web site:
http://www.forbes.com/sites/bernardmarr/2015/09/30/big-data-20-mind-boggling-
facts-everyone-must-read/#3e3d190f6c1d
Minnesota Department of Public Safety. (2016). Driver's License Information. Retrieved
from Minnesota Department of Public Safety:
https://dps.mn.gov/divisions/dvs/Pages/drivers-license-information.aspx
Navruzyan, A. (2015). Using Machine Learning to Detect Telco Fraud. Strata + Hadoop
World Conference. Singapore: Marketwired.
Ogwueleka, F. N. (2011). Data Mining Application in Credit Card Fraud Detection
System. Journal of Engineering Science and Technology, Vol. 6, Issue 3, p.311.
Oracle. (2016). Association. Retrieved from Oracle.com:
https://docs.oracle.com/cd/B28359_01/datamine.111/b28129/market_basket.htm
PwC. (2007). Economic crime: people, culture and controls. The 4th Biennial Global
Economic Crime Survey.
Ravisankar, P. R. (2011). Detection of financial statement fraud and feature selection
using data mining techniques. Decision Support Systems, 50491-500.
Subudhi, S. (2015). Quarter-Sphere Support Vector Machine for Fraud Detection in.
International Conference on Intelligent Computing, Communication &
Convergence (ICCC-2015), (pp. 353-359). Odisha, India.
53
Sugo, R. (2016). Toll fraudsters get away with tapping into telcos. Australian Financial
Review.
Turi. (2016, 9). Fast, Scalable Machine Learning Platform - Turi. Retrieved from
turi.com: turi.com
Walid Moudani, F. C. (2013). Fraud Detection in Mobile Telecommunication. Lecture
Notes on Software Engineering, Vol. 1, Issue 1, p.75.
Weddi, D. (2015, November 30). Kenya's first SIM BOX culprit netted in raid. Retrieved
from CIO East Africa: http://www.cio.co.ke/news/main-stories/kenya's-first-SIM-
box-culprit-netted-in-raid