comparing electricity distribution network costs and
TRANSCRIPT

www.eprg.group.cam.ac.uk
EP
RG
WO
RK
ING
PA
PE
R
Abstract
Comparing electricity distribution network costs and revenues in New South Wales and Great Britain
EPRG Working Paper 0930
Bruce Mountain and Stephen Littlechild
This paper compares the costs and allowed revenues of electricity distribution networks in New South Wales (NSW) and Great Britain (GB). In 2000, allowed distribution business revenues per customer in NSW were twice those in GB. Recently set price controls imply that by 2014 they will be four times as high. This reflects operating and capital costs per customer that are projected to grow in NSW but to remain relatively stable in GB. Smaller distribution companies in NSW may have some effect, but physical and industry differences are unlikely to be significant explanatory factors. Differences in the regulatory framework and in the conduct of regulation, and in ownership, are potentially significant. A shorter comparison with costs and revenues in Victoria, where regulation and ownership have been more similar to GB, and where costs and allowed revenues have decreased rather than increased, is consistent with this hypothesis.
Keywords electricity, markets, pricing, regulation
Contact [email protected] Publication December 2009

Comparing electricity distribution network costs and revenues in New South Wales and Great Britain
Bruce Mountain∗
Stephen Littlechild•
18 December 2009
1. Introduction Policy on electricity networks – and indeed on utilities generally – continues to evolve. In Britain, Ofgem is presently reviewing the RPI-X regulatory framework that was introduced when all the networks were privatised twenty years ago. In Australia, regulation is being transferred from state to federal entities, and some states are considering the possibility of further privatisation. Analysis of the effects of different arrangements should be of assistance in evaluating policy.1 To that end, we have compared the costs and allowed revenues of electricity distribution networks in New South Wales (NSW) and Great Britain (GB). It appears that costs and allowed revenues in NSW are higher than in GB and are growing much faster over time. Our analysis suggests that physical differences are unlikely to be significant explanatory factors, but that differences in both regulation and ownership are potentially significant. A shorter comparison with costs and revenues in Victoria is consistent with this hypothesis. Further and more rigorous analysis seems worthwhile in order to shed more light on these important issues.
2. Background In GB, 14 licensed distribution networks deliver electricity to about 26 million customers in England, Wales and Scotland. They were privatised in 1990, and several now have common owners. They have been regulated by the Office of Electricity Regulation (Offer) and its successor the Office of Gas and Electricity Markets (Ofgem). The distributors are currently nearing the end of their fourth price control period (April 2005 to March 2010) and are engaged in the fifth Distribution Price Control Review (DPCR5) to set prices for the period due to begin in April 2010. Ofgem has recently published its final proposals. In NSW three electricity distributors deliver electricity to about 3.5 million customers. Energy Australia and Integral Energy are mainly urban distributors. Country Energy
∗ Director, Carbon Market Economics Pty Ltd, Melbourne • Emeritus Professor, University of Birmingham, and Fellow, Judge Business School, University of Cambridge 1 For earlier discussion of ownership and regulation, see Newbery (1999, chs 5,6) and references therein. For recent analyses, see for example Jamasb and Pollitt (2007a,b), Jamasb and Soderberg (2009) and Haney and Pollitt (2009) on regulatory approaches; Jamasb et al (2008) on regulation, productivity and efficiency (in the gas sector); Wolf (2008) and Wolf and Pollitt (2008) on ownership (in the oil sector); Nielsen and Pollitt (2008) on ownership unbundling; and Kwoka et al (2008) on divestiture policy of electricity distribution companies.
1

serves a dispersed customer base throughout NSW (outside of the areas served by the other two networks). The distributors are corporatised government-owned businesses. They were regulated by the Independent Pricing and Regulatory Tribunal of New South Wales (IPART) for the first two regulatory control periods (from July 1999 to June 2009). Regulation was then transferred to the federal Australian Energy Regulator (AER), which has recently completed its review for the third NSW distribution price control period (from July 2009 to June 2014).
3. Initial comparison of costs and revenues For simplicity, we focus attention on costs and revenues in three representative years or periods, broadly corresponding to the past, the present and the future. We also aggregate over all distribution companies in each market, and normalise by dividing total costs by number of customers2. Revenues and costs are adjusted for inflation using published prices indices in Australia and Britain and converted to 2008 Australian dollars (AUD) at the rate of 56 pence to the Australian dollar (the rate at the time this paper was finalised).3 We have calculated the (pre-tax) regulated revenues per customer that distributors were or will be allowed (by the price control) to collect in New South Wales in financial years ending 1999, 2009 and 2014, and in GB in 2000, 2010 and in 2015.4 Figure 1 shows that in 2000, allowed distribution business revenues per customer in NSW were twice those in GB. Since then, NSW allowed revenues have increased markedly, and are projected to continue to do so, whereas the GB revenues have shown little if any increase. By 2014, the NSW/GB revenue per customer multiple will be more than four.
2 Customer number data for Australia are from ESAA 2008, and are projected into the future based on the trend rate of growth over the period 2001 to 2007. Customer number data for GB are from Metering Point Administration Number statistics provide by DTI Energy, and the base data were adjusted in accordance with the advice provided in the guidance note “Regional and local electricity consumption statistics 2005 for 2005”, available from www.berr.gov.uk. 3 This exchange rate is higher than historic averages, which if anything reduces the extent of the difference between previous GB and Australian costs and revenues. 4 Sources for Fig 1: IPART 1999 (pp. 150 to 154), ACCC 1999 (Table 9.4, p. 146), AER 2009a (Tables 16.20, 16.23 and 16.27), Ofgem 1999 (Annex 2, Tables 2 to 14), Ofgem 2004 (unnumbered tables on pp. 124 to 138), Ofgem 2009c (Tables 6.1 to 6.14). The year ends are 30 June in NSW and 31 March in GB.
2

Figure 1 Annual revenue per customer (2008AUD)
Which components of cost seem to be driving these differences? Compare the assumptions about operating cost (opex) and capital expenditure (capex) that were used in setting the price controls in the two markets. (Of course, assumed or allowed expenditure is not generally the same as subsequent actual expenditure, as discussed later. Furthermore, the definitions of operating and capital are not necessarily consistent as between GB and NSW, and regulators have not insisted on a uniform definition even within Australia, as discussed below.) Figure 2 shows that the allowed opex picture broadly matches the total allowed revenue picture. That is, in GB allowed opex per customer (aggregated over each five-year period) has remained more-or-less constant over time and is assumed to continue to do so, whereas in NSW it is higher and projected to increase in the future. On this basis, opex in NSW was about double the GB level in the period 2000-05, and is projected to be about 3.5 times the GB level in the period 2010 - 15. Figure 2 Allowed operating expenditure per customer (2008 AUD)5
Figure 3 shows the assumptions on allowed new capex per customer used in setting the price controls. The contrast here is more striking. Allowed capex per customer in 5 Sources for Fig. 2 ACCC 1999 (Table 9.4, p. 146), Meritec 2003 (p. 30); AER 2009a (Tables 8.22 to 8.26), IPART 2004 (p. 55), Ofgem 2004 (unnumbered tables on p. 124 to 138), Ofgem 2009d Table 5.
3

GB is again broadly constant over time.6 In contrast, allowed capex per customer in NSW is higher than in GB and projected to increase substantially. In 2000-05 it was about twice as high as it was in GB, and in 2010-15 it is projected to be about six times higher than it is in GB. Figure 3 Allowed capital expenditure of NSW and GB distributors per customer (2008AUD)7
$-$500
$1,000$1,500$2,000$2,500$3,000$3,500$4,000$4,500
NSW 1999
to2004
GB2000
to2005
NSW2004
to2009
GB2005
to2010
NSW2009
to2014
GB2010
to2015
The allowed rate of return is applied not to new capex in any year or period but to the cumulative and depreciated regulatory asset base (RAB). This is projected to increase slightly in GB, and to increase significantly in NSW, albeit not as significantly as new capex. Even so, RAB per customer in NSW was around 2.3 times the GB level in 2000, and is projected to be 4.5 times in 2010 and about 5.4 times in 2015 (as shown in a graph later in the paper).8 And, as we shall see, the regulators allowed significantly higher rates of return on the RAB in NSW than in GB. The three NSW distributors have also shown similar relative changes in capital expenditure, operating expenditure, regulated asset base and allowed revenues. As such, the relative changes for the sum of the three businesses is typical of each of the businesses. To summarise, allowed distribution revenue per customer in NSW was about double the GB level in 2000, and is projected to be over four times the GB level in five years’ time. The regulatory projections upon which the allowed revenue is based assume that NSW opex in the forthcoming period will be about 3.5 times the GB level, and the future capital expenditure programme will be about six times as high.
4. Industry structure 6 This may seem surprising. Projected capex in 2010-15 is indeed higher than actual capex in 2005-10, but lower than the capex that was projected for 2005-10 when that control was set. 7 Sources for Fig. 3. ACCC 1999 (Table 9.2, p. 138), Meritec 2003 (p. 21), IPART 2004 (p. 55), AER 2009a (Tables 7.16 to 7.19), Ofgem 2004 (unnumbered tables on pp. 124 to 138), Ofgem personal correspondence 30 October 2009. 8 There may have been some difference in the regulatory treatment of initial (pre-Vesting) assets in GB compared to NSW. However, only a very small proportion of the GB RAB now comprises pre-Vesting assets. It is now dominated by post-Vesting capex, which at some $40bn comfortably exceeds the 2008 total value of the RAB itself.
4

To what extent might differences in the structure, geography and operating environment of the electricity distribution sectors in NSW and GB explain these differences in allowed opex, capex and revenues? Certain factors seem relatively similar as between the two markets. For example, most capital items employed by distributors (transformers, switchgear, lines and cables) are internationally traded and therefore, if effectively procured, should cost much the same in NSW and GB. GNP per capita and wage rates are approximately comparable in GB and NSW, so differences in labour costs and labour productivity should be minimal (though there may be greater labour rigidity in NSW). The vast majority of electricity customers in NSW are located in gently undulating land east of the Great Dividing Range. In England, the topology is likely to be generally comparable to NSW, although probably more challenging in the Borders, Lake District, North of Scotland, Yorkshire Moors and Wales. So differences in topology should, if anything, favour NSW. Network planning and operating standards seem to be similar in the two markets. Measures of service quality (such as the duration and frequency of interruptions) are approximately comparable. However, service quality has continually improved in GB9, but remained roughly constant in NSW. Again, if anything, quality of service considerations should favour NSW rather than provide an explanation for higher costs in NSW. At first sight, the much lower average population density in NSW (around 9 people per square kilometer in NSW versus 256 per square kilometer in GB) might explain higher costs per customer in NSW. However, approximately two-thirds of the NSW population reside in the greater Sydney area, and much of the remainder are located in a narrow band of land close to the coast. The population density of Sydney (around 2100 people per square kilometer) is about eight times the average population density of Great Britain. This means that the customer densities of Integral Energy and Energy Australia (whose main customer bases are predominantly the greater Sydney area) are not so different from the average of GB distributors.10 Country Energy covers about 95% of the land area of NSW, and its customer density is correspondingly much lower than that of Integral Energy or Energy Australia. However, Country Energy’s asset base per customer served is actually 8% lower than the average of the two urban distributors. This suggests that differences in customer density between NSW and GB are likely to play only a limited role in explaining cost and revenue differences.
9 See for example Ofgem 2009e p.18 10 That is, they are within a threefold difference rather than a thirty-fold difference. Energy Australia 1.5m customers/22,275sq km = 68 customers/sq km, Integral Energy 0.85m customers/24,500 sq km = 37 customers/sq km, GB approximately 26.5m customers/245,000sq km = 108 customers/sq km. NSW supply area data from AER 2008b, customer number data from ESAA 2008 and AER 2008b, British customer data from Digest of UK Energy Statistics from BERR.
5

Size of network or network company is a possible explanatory factor, although one study has suggested that this may not be critical in NSW.11 In its regression analyses of distributor costs in GB, Ofgem has found that the primary driver of network costs is the size of the network, and that this is most appropriately measured by a Composite Scale Variable (CSV) comprising network length (with a 50% weighting), customer numbers and units distributed (with a 25% weighting each).12 The 14 GB distribution networks have CSV scores in the range 10.8 to 32.0, with a mean and median of about 19.0. The three NSW networks have CSV scores of 11.5, 18.1 and 24.9.13 These are within the GB network range, and the mean and median of about 18.1 are barely lower than in GB. On this basis, the differences in these size variables should not significantly increase costs in NSW compared to GB. Admittedly GB companies are larger if defined by ownership. In April 2002 (Ofgem’s base year for the 2004 price control analysis) there were 9 separately owned companies with CSV scores ranging from about 18 to 48, with a median of about 27. On this basis, the CSV of the median GB company was about 50% larger than that of the median NSW company. Ofgem’s regression analyses suggest a slight scale effect. The precise extent of this depends on the particular regression. On the basis of Ofgem’s total cost graph, a company with a CSV of 27 would have a cost per customer about 10% higher than a company with a CSV of 18. 14 Of course, the appropriate definition of a CSV variable might be different in NSW compared to GB. Nevertheless, in the absence of such analysis, the implication of Ofgem’s work is that network size factors could account for part of the higher cost in NSW, but only a relatively small part. The AER and the NSW distribution businesses have identified rising peak demand as the dominant driver of capital expenditure. NSW peak demand has grown by 2.9% per annum compound for the last 10 years. This compares to about 1.6% in GB in the period to 2007, with a reduction since then, so that GB peak demand has remained about level over the decade as a whole. Energy Australia and Country Energy project average annual demand increases of 2.7% and 1.7% respectively for the next five years.15 This compares to National Grid’s base case scenario of approximately constant demand, and compound annual demand growth of around 1.6% for the next five years based on customer expectations.16 Actual and projected demand growth is thus higher in NSW than in GB, and this no doubt helps to explain a larger capex 11 Pierce et al (1995 p. 195) noted that the minimum efficient size of distributors in NSW was between 0.5 million and 1.25 million customers, although the range for constant returns to scale was as low as 94,000 customers. 12 In its current distribution control review, Ofgem (2009a p 43) adopted a more granular analysis using a variety of cost drivers for different costs, but the results seem to be close to those derived from the use of the composite scale variable (see Ofgem 2009a p. 49). 13 Integral Energy: 33.3 (‘000 km) length, 0.85 (m) customers, 18.3 (‘000 GWh) units, CSV = 11.5; Energy Australia 49 (‘000 km) length, 1.5 (m) customers, 30 (‘000 GWh) units, CSV = 18.1; Country Energy 200 (‘000 km) length, 0.8 (m) customers, 12 (‘000 GWh) units, CSV = 24.9; where CSV = length 0.5 x customers 0.25 x units 0.25. Source: company websites. 14 Ofgem (2004, Figure 7.3) shows that total cost for CSV = 27 is about £150m and for CSV = 18 is about £110m. Assuming that number of customers is proportional to CSV, if number of customers in the larger company is n then number in smaller company is n x 18/27, so total cost per customer is £150/n in the larger company and £110/(n x 18/27) = £165/n, hence cost per customer is 10% higher. 15 Transgrid (2009). In the context of the recent price control review, Integral Energy provided some projections to AER of around 3.5% annual demand growth, but then withdrew them. 16 National Grid (2009).
6

programme in total. However, insofar as demand growth is associated with growth in number of customers, it is not clear how far this would explain higher growth in capex per customer. Moreover, actual capex expenditure increases in NSW have not been strongly correlated to demand increases over the last decade or so. For example, the two urban distributors have had lower demand growth, but higher expenditure growth, than the rural distributor. To summarise, in several respects NSW and GB markets have similar characteristics, while in other respects, notably demand growth, they are rather different. But it is not clear how far these differences could be expected to explain per customer differences in opex or even capex of the magnitudes observed. Other factors seem likely to be more important.
5. Regulatory framework In principle we may distinguish between the regulatory framework and the way in which particular regulators implement that framework – though in practice it may not always be easy to make the distinction. We shall consider the following three factors: discretion, the onus of proof, and the nature of appeal. The regulatory framework within which IPART operated (in setting the first two NSW price controls) does not seem significantly different from Ofgem’s regulatory framework with respect to the first two factors. As regards the third factor, there was no provision for regulated companies to appeal IPART decisions on merit, whereas companies in GB had this option. But this would if anything have strengthened IPART’s hand relative to Ofgem’s (unless it were argued that IPART was obliged to set less aggressive targets precisely because the companies could not appeal). The more striking differences are between the regulatory frameworks for IPART and Ofgem, and that under which the AER has set the latest NSW price control.
a) discretion Ofgem has to follow certain principles of Better Regulation - for example, with respect to consultation and explaining its decisions. Nonetheless, it has a great deal of discretion as to how it carries out a price control review. This includes discretion as to the process followed, the level and structure of the price control, and the weighting of the various considerations involved. It extends even to the strategic aims that Ofgem will pursue in setting the control. For example Ofgem explains that:
“Our objective in this review is to put in place a price control that encourages DNOs to: play a much larger role in helping to tackle climate change, improve all aspects of customer service, and continue innovating to find ways of reducing the costs of providing secure and reliable electricity networks.” (Ofgem 2009a, page 1)
In contrast, the AER does not have such discretion. The Australian Energy Markets Commission (AEMC) is responsible for setting the National Electricity Rules (NER) for the regulation of distributors, and the AER has to implement those Rules. The Rules prescribe the submission of evidence and argument; their consideration by the
7
AER, with set time-frames for each step in the process; and the issues to which the AER is required to have regard in reaching its decision. The AER’s failure to follow the defined process and to have regard to the defined factors could be grounds for a merits review of the AER’s decision to the Australian Competition Tribunal, or judicial review by the High Court or Federal Court. Ofgem has consistently used its discretion to develop enhanced efficiency incentives through each price control.17 In contrast, the AER has limited discretion to develop incentives. Its assigned task is to set the parameters of the various price control determinants (operating expenditure, return on assets and depreciation) defined in the NER. Although the NER allows the AER to develop demand management, service target and opex efficiency benefit-sharing schemes, the design of these incentives largely lies beyond the AER. The AER in fact expressed concern about some of the restrictions proposed in the development of the provisions of the NER applicable to transmission network service providers.18 It has to be acknowledged, however, that in the event the AER did not use all this discretion.19
b) onus of proof In setting price controls, a regulator has to make assumptions about future parameters such as the level of demand, opex, capex, cost of capital, etc. In GB the onus of proof with respect to the reasonableness of these assumptions rests with the distributors to justify their proposals. For example, Ofgem said it would use the forecast expenditure from its own modelling unless the distributor provided satisfactory evidence to the contrary:
“Where a DNO [distribution network operator] is unable to provide robust supporting evidence or their forecast is inconsistent with the other evidence, the (Ofgem) modelled output will be the backstop position for setting Ofgem's baseline level of investment”. (Ofgem, 2009a, p. 64)
In contrast, the NER requires the AER to accept distributors’ cost proposals if it considers the costs are “efficient, prudent and reasonable”. During a price control review, distributors produce an expenditure proposal for the AER’s consideration. If the AER decides to adopt the values of input variables in any calculations proposed by that distributor, it has no obligation to justify its use of such variables. If, on the 17 It has also used various distribution price control reviews to introduce incentives to improve outcomes for the worst served customers, to manage taxation risks, to reduce distribution losses, and to promote distributed generation. 18 “The AER does not support the dilution of incentives proposed by the AEMC. The package is a significant step back towards a cost of service model. The risk is a gradual move towards the inefficiencies, along with the associated high costs and prices that characterised the electricity sector in the 1980s and prompted energy reform in the 1990s.” AER (2006 p. 10) A sample restriction was to lock-in capped service standards incentives at +/-1% of the Maximum Allowable Revenue. The AEMC finally decided that the AER could decide the revenue at risk under the service target improvement scheme at between 1% and 5% per annum. 19 Despite its protest to the AEMC that +/-1% of revenue at risk would provide inadequate service standard incentives, the AER in its most recent transmission decision developed an incentive scheme which set targets for five different components of transmission service such that at the very worst (assuming none of the targets are met) the revenue at risk would only be 0.8% of the annual maximum allowed revenue. Furthermore the targets for the incentive scheme were largely as proposed by the regulated business rather than by the AER. (see AER 2009c, p. 113)
8
other hand, the AER takes its own view on the values of input variables, it is required to justify the values it uses. (NER Clause 6.12.2 ii) Effectively the burden of proof shifts to the AER to justify its decision if it chooses different parameters to those proposed by the distributor.
c) nature of appeal In both markets there is provision for appeal against the regulator’s price control proposals or decisions. In GB, Ofgem proposes price caps (and associated incentive schemes) that distributors are able to accept or reject. Ofgem will expect to refer any rejected proposal to the Competition Commission. The Competition Commission is required to re-open the whole matter and make its own decision on all aspects of the price control proposal. Its decision may be more or less advantageous than Ofgem’s proposal in some or all respects. In some cases it has indeed been more onerous on the appealing company. This mechanism prevents a distributor from “cherry picking” those aspects of a decision that it likes and appealing the less attractive aspects. It also obliges the distributor to consider very carefully whether it has a strong case before rejecting Ofgem’s proposal. In fact, only one electricity distribution price control proposal has been appealed to the Competition Commission out of some 42 such proposals made to date. Both considerations can be expected to give Ofgem confidence in making price control proposals, although it will also be aware that if the Competition Commission sets its decision aside on the basis of poor analysis or lack of evidence this is likely to reflect poorly on Ofgem and its management. In Australia, price control decisions by the AER may be appealed to the Australian Competition Tribunal (ACT) on their merits, or to the Federal Court for judicial review. In contrast to GB, individual elements of a price control decision may be appealed, without affecting other elements of the decision. This encourages “cherry picking” (only appealing decisions that are likely to benefit the business). Moreover, if the Tribunal finds against the applicant, the AER’s decision would stand, which means that it is highly unlikely that appeals would result in a less favourable outcome for the distributor. Appeals to the ACT must satisfy a “serious issue” test and are subject to the resulting detriment exceeding a financial threshold (the lesser of $5m over five years, or 2% of annual allowed revenues). However, this is a relatively low hurdle. The ACT has recently heard appeals from all three NSW distributors (plus two from transmission businesses) on elements of recent AER decisions. The ACT accepted one of the appeals (related to the choice of the averaging period for the risk free rate). The effect of its decision was to increase the weighted average cost of capital by around 180 basis points, and as a result allowed revenues rose by around 8% over the regulatory period. In summary, the regulatory framework in GB gives Ofgem considerable discretion, puts the onus on the distribution companies to prove that the regulator’s assumptions are unreasonable, and does not allow the distributors to ‘cherry pick’ in appealing Ofgem’s proposals. In contrast, the present regulatory framework in Australia gives the AER very limited discretion, puts the onus of proof on the regulator to prove that
9

the distributors’ assumptions are unreasonable, and allows the distribution companies to ‘cherry pick’ in appealing the AER’s decisions. The GB framework seems more conducive to the regulator making tough but realistic assumptions in setting price controls, than does the more constrained regulatory framework under which the AER has to operate. Insofar as IPART’s regulatory framework was similar to Ofgem’s in the three respects identified (and actually more supportive of the regulator with respect to appeal), it suggests that differences in these two regulatory frameworks did not contribute to explaining the different allowed revenues in the first two regulatory periods. However, the more restrictive regulatory framework under which the AER operates could contribute to explaining the significantly more rapid growth in allowed opex and capex for the third regulatory period now underway.
6. Conduct of regulation How has each regulator operated within its own framework? We examine two main aspects of their work: the use of benchmarking to enhance incentives (including the collection of information, the development of regulatory accounts, the use of benchmarks, and the involvement of expert advisers) and the choice of the allowed return on capital (WACC).
a) benchmarking Ofgem has consistently employed benchmarking to compare companies and thereby set challenging price control targets as a means to encourage greater efficiency and distribute the benefits to customers.20 It sets the prices for all 14 distributors in GB during a single review, which facilitates comparison between the companies. It also exercises a high degree of control over the information that distributors provide. For example, Ofgem does not leave it to the distributors to provide the data that they see fit to justify their expenditure applications. Rather, after a period of discussion, it sends out Business Plan Questionnaires and similar pro-forma information requests to ensure that the content and presentation of the data provided by the distributors meet Ofgem’s requirements. Ofgem has made considerable progress in developing consistent and comprehensive regulatory accounts that provide data needed for benchmark comparisons. It has invested significantly over several years to establish consistent data-sets to facilitate time-series analyses of distributors’ costs and revenues. Ofgem (2009b) has recently described in some detail the operating expenditure allowances that will be established for the coming distribution price control review through the use of benchmarks. Benchmarking has had a large role in establishing operating expenditure allowances in all the GB distribution price control reviews. Relatively simple comparisons were the basis of the 1994 price control proposals. A corrected ordinary least squares regression was developed in the 1999 price control review to establish opex
20 For international evidence on the effectiveness of benchmarking (yardstick regulation) in improving cost efficiency, see Mizutani et al (2009) and references therein.
10
allowances. This was refined and developed further in the 2004 price control review. In the price control review currently underway, Ofgem (2009a) noted that
“Our benchmarking results form an important input into our assessment of the DNOs' efficiency and highlight where there are potential issues in the DNO (distribution network operator) forecasts …”.
Ofgem has retained an academic advisor to assist in the development of benchmarking methodologies, and has commissioned a variety of benchmarking studies. The process for the regulatory review involves extensive interaction in the development of incentives, sharing of information and modelling, with both consumer representatives and the industry. For example, Ofgem (2008) described the involvement of a group of consumer experts and representatives whose role it is to act as a 'critical friend' throughout the review. By contrast, benchmarking in Australia has been supported in principle but has become somewhat inconsequential in practice. It was raised in the initial discussions of the regulation of distributors in NSW, and in the mid-1990s benchmarking studies of NSW distributors suggested underperformance by these distributors21. In the context of the first distribution price control review London Economics undertook a benchmarking study for IPART, which concluded that NSW distributors were inefficient compared to the 200 other distributors in the dataset (IPART 1999). However, the methodology and the conclusions of the analysis were criticised by the regulated businesses, and it is not clear how much weight IPART actually placed upon the benchmarks. Following this, IPART did not use benchmarks in its 2004 distribution price control review. Regulated network businesses argued against benchmarking in the debate that preceded the finalisation of the relevant chapters of the National Electricity Rules (see ENA 2005, page 7).The National Electricity Rules nevertheless require that the AER have regard to benchmarks of the operating and capital expenditure of an efficient distributor. However, the AER has said that its only uses benchmarking to “test its bottom up detailed conclusions” and not to set (expenditure) allowances, and that while the AER is researching this area, it sees benchmarking only as a “longer term proposition”.22 A recent survey found relatively little regulatory interest in benchmarking in Australia generally.23
21 Pierce et al (1995, p.194) noted that the NSW distribution sector had consistently performed below the total factor productivity levels of other States. The Government Pricing Tribunal considered that NSW distributors could achieve 20 to 30 per cent reductions in their operating costs through efficiency gains (Government Pricing Tribunal 1994, cited in Pierce et al. 1995). The NSW urban electricity distributors were benchmarked against a sample of distribution utilities in the United Kingdom and United States over 1990/91 to 1992/93. The study estimated that the distributors could achieve another 20 to 60 per cent reduction in inputs, delivering significant cost savings (London Economics 1994b, cited in Pierce et al. 1995). 22 Minutes of the Queensland Public Forum on Energex’s and Ergon Energy’s regulatory proposals (1 July 2010 to 30 June 2015), Brisbane, 3 August 2009, p. 1. 23 “In the case of Western Australia, one of the primary reasons given for not using benchmarking is that other Australian regulators have not commonly used these techniques.” (Haney and Pollitt 2009, p. 16)
11

In the absence of systematic benchmarking to establish efficient levels of expenditure, the Australian Energy Regulator, and the ACCC before it, relied heavily on “bottom-up” reviews of distribution business expenditure proposals by consulting engineers. In their advice to the AER, these consultants have often recommended the distributors’ expenditure proposals, often with only minor variation. Price controls are generally undertaken sequentially for distributors in different States. In some cases distributors in different states might by chance be reviewed at the same time, but such reviews are undertaken largely independently of one another by different teams in the AER. Distributors have the freedom to formulate their own proposals. The AER seems to have made little progress in developing consistent and comprehensive regulatory accounts. Admittedly it has formally had regulatory jurisdiction over electricity distribution only since 2006, but it is not evident that greater progress has been made in electricity transmission which the AER has regulated since 1999.
b) allowed rate of return Comparing allowed rates of return is not straightforward because regulators have used different concepts, both one from another and over time. Nowadays regulators often use the concept of a ‘vanilla’ WACC (weighted average cost of capital), but they have not always restated previous decisions in this way. 24 Figure 4 shows our estimates of the equivalent real vanilla WACC used in the price control calculations.25 In round terms, allowed cost of capital has been higher in NSW than in GB by about 2 percentage points in 2000, one and a half percentage points in 2005 and nearly 3 percentage points in 2010.
24 For example, Ofgem changed from 6.5% pre-tax WACC in its 1999 decision to 5.545 % real vanilla WACC in 2004 and 5.5% (Initial Proposals) in 2009 but did not restate the 1999 figure as a real vanilla WACC. IPART used 7% pre-tax real WACC for its 1999 and 2004 decisions. AER used 8.13% vanilla WACC in the decision for the NSW distributors 2009, which is stated as a nominal figure. Based on the AER’s expectation of future inflation (2.47%) this is equivalent to about 5.66% real vanilla WACC. On appeal by the regulated businesses, the ACT raised the nominal risk free rate by around 189 basis points, so that real vanilla WACC is now around 7.55%. 25 Our estimates are that Ofgem’s 6.5% pre-tax WACC in 1999 is equivalent to about 5.22% real vanilla WACC, and that IPART’s 7% pre-tax real WACC in 1999 and 2004 is equivalent to about 7% real vanilla WACC.
12

Figure 4 Weighted average cost of capital (real vanilla WACC)26
Both regulators take advice from consultants. However, in the latest control, the AER decided on a level of WACC above the upper end of the range recommended by its staff and consultants. It justified this on the basis of “regulatory stability and other factors” (AER 2009b p. iv). The resulting real vanilla WACC was around 6.35% but on appeal to the ACT it was increased to over 7.5%. (The actual rates will depend on the actual level of inflation.) In contrast, Ofgem has just proposed a real vanilla WACC of 4.75%. It is not clear why there should be such a difference between NSW and GB in the cost of capital. Parameters such as risk-free rates (adjusted for differences in inflation), equity betas and debt premia should be much the same in the two countries. It might be argued that the market risk premium is higher in Australia because it is a smaller and less liquid market, or that electricity price cap regulation is less established there. However, Ofgem considers the WACC in the context of the regulatory design, and the higher level of pass-through in NSW would seem to imply lower rather than higher risk there. Most of the difference is explained by differences in the assumed cost of equity and debt. Ofgem assumed the cost of equity was 6.7% (real), while the AER used 9.3% (real). Much of the difference here is attributable to the AER’s much higher equity beta (1.0) compared to Ofgem’s (0.24 to 0.34). With respect to the cost of debt, Ofgem used a value of 3.6% (real) based on trailing yields on A and BBB-rated bonds. The AER used a value of 6.3% (real) based on a margin on top of the risk free rate, nearly twice as high as Ofgem’s assumption To summarise, NSW regulators have made relatively little use of benchmarking and associated techniques, whereas GB regulation has emphasised this. NSW regulators have systematically allowed a higher rate of return than the GB regulator. It thus seems that the conduct of regulation has contributed to the higher allowed charges in NSW.
26 Sources for Figure 4. IPART 1999, Ofgem 1999 p. 109 (adjusted), IPART 2004 p. 57 (adjusted), Ofgem 2004. Ofgem 2009f, Australian Competition Tribunal 2009.
13
7. Ownership
The GB electricity sector was privatised in 1990. Some Australian electricity companies have been privatised, but the NSW distributors are still government-owned. Ownership might be expected to impact on the incentives to efficiency with respect to opex and capex, on the cost of capital, and on a company’s incentive to underspend or overspend against regulatory targets. It might also impact on the regulatory attitude to overspending, and on the regulatory framework itself.
a) efficiency There is an extensive economic literature on the effects of private versus public ownership. Privately-owned companies can be expected to be more interested in maximising profit, and therefore more responsive to regulatory incentives that reward reductions in opex and capex. Indeed, the aim of improved efficiency has been a major reason for privatisation in the UK and elsewhere.27 Government-owned companies, while not indifferent to profit, can be expected to place greater weight on non-pecuniary pressures (including from consumers, employees, politicians, government and the media). This is likely to make them more cautious about cutting costs, and more sympathetic to increasing capital expenditure.
b) cost of capital In assessing capital expenditure, companies need to consider the alternative use of their funds. Private companies typically have many alternative profitable uses, their opportunity cost of capital is relatively high, and this gives them the incentive to minimise the extent of capital investment in electricity distribution (subject to maintaining adequate quality of service). In contrast, government-owned companies may have fewer alternative uses – indeed, if a government-owned distribution company does not reinvest its funds in its distribution system it may have them taken away. The target rate of return in the public sector is typically less than in the private sector. In the case of the NSW distributors, the target rate of return on assets, as set by the State Government, is 6.8% nominal28. However, the AER is required to calculate the allowed rate of return on the assumption that all businesses are privately owned. Its vanilla rate of about 7.5% real is presently around 10% nominal, more than 50 per cent higher than the hurdle rate the Government has set for these businesses. In addition, the AER is required to set the rate of return after accounting for tax at the corporate rate. In fact the NSW Government (rather than the Commonwealth Government) receives the income tax from the distributors it owns. This effectively lowers the cost of capital to those businesses even further – or, put another way, it 27 For examples of economic analysis of the impact of ownership on efficiency, with empirical evidence to substantiate this from before, during and after the privatisation phase of the last two decades, see De Alessi (1974, 1980), Beesley and Littlechild (1983) and Pollitt (1997). 28 The Statements of Corporate Intent for the distributors establish the financial and other targets of the NSW Government for their distributors. They are available from the websites of the NSW distributors.
14

makes capital expenditure in the NSW distribution network extremely attractive to its owner.
c) Underspending and overspending against allowances In light of the above, it would be expected that private companies would wish to beat the opex and capex allowances set by the regulator, and would be averse to exceeding them, whereas publicly owned companies would be tempted to exceed them. Experience is consistent with this. The privately owned companies in GB have generally beaten their opex and capex allowances, despite the relatively tough levels at which the allowances are set. In contrast, actual capital expenditure in NSW, and to a lesser extent opex, has exceeded the regulatory allowances in both the first two regulatory control periods. The actual amount of underspend or overspend is not straightforward to calculate in the absence of explicit comparisons by the regulatory bodies. There are also recent complications associated with capitalised pension contributions in the UK and overlapping decisions in NSW. Regulatory treatments have perhaps not focused on this issue.29 We have not been able to find adequate data on opex. Figures 5a and 5b reflect our best estimates with respect to capex, reflecting helpful correspondence with Ofgem in Britain and the AER in Australia. In GB, in the period 2000 to 2005, actual capex (in 2008 GBP) was £4414m against an allowance of £6661m, underspending the regulatory allowance by 34%30. The allowance for 2005-2010 in 2008 prices was £7253m.31 At the time of writing, Ofgem’s estimate is that actual capex for 2005-2010 will be about £6093m, about 5% below the allowance.32 In NSW, by the end of the first price control period (1999-2004), actual capex amounted to $4.3 bn (2008$), which was some $1.4bn (2008 $) or 50% above the amount of $2.9bn (2008$) that IPART allowed in setting the price control.33 IPART accepted this overspend into the regulated asset base - plus unrecovered depreciation and return on assets on the overspend.
29 Regulatory accountability – the explanation and appraisal of regulatory performance – has developed considerably over time. Nonetheless, there would seem to be scope for more explicit and published reconciliations of actual spending against the allowances assumed in setting the price control, identifying and explaining any differences, and noting any potentially distorting elements. 30 Ofgem, 2004 p. 84 adjusted to 2008 prices, Ofgem 1999 p. 29 Table 3.1, restated in 2008 prices. 31 Ofgem 2004, Appendix Table A10, capitalised expenditure excluding pensions, restated in 2008 prices. Note that figures are not comparable across price controls due to different capitalisation policies and categorisations of costs. 32 Ofgem, personal correspondence, 30 October 2009. This estimate is based on four years’ actual spend and one year’s forecast, excluding any allowance or adjustment for pensions. 33 Meritec 2003 (p. 30). Energy Australia’s asset base includes certain assets that were classified as transmission in IPART’s 1999 and 2004 reviews but were subsequently classified as distribution in the AER’s latest (2009) review. To ensure comparability with the AER’s decision, the present calculation compares it against IPART’s decision on Energy Australia’s distribution assets plus the AER’s previous decision on its transmission assets. The Figures in this paper also include this adjustment. All data have been restated in 2008$.
15
The calculation for the second period (2004-2009) is more complicated. Shortly after it had set the second price control, IPART allowed an additional capex ‘pass-through’ on the basis that the NSW Government had subsequently determined more onerous planning standards than were assumed in setting the control. We have not yet been able to reconcile the data published in the course of setting the controls with the data underlying the AER’s subsequent calculation of the overspend, so we give two calculations. The first column refers to data published in various price control documents, the second column refers to data that the AER is understood to have used in its subsequent calculation of the overspend: $200834 $200835 i) Capex allowed in setting 2004-2009 price controls $5.30 bn $5.47bn ii) Additional pass-through capex allowed by IPART $1.47 bn $1.41bn iii) Total allowed capex $6.77 bn $6.89bn iv) Actual capex $8.54 bn $8.18 v) Overspend $1.77 bn $1.28bn IPART’s additional pass-through thus amounted to about 28% or 26% of the initially allowed capex. The subsequent overspend amounted to a further 33% or 23% of the initially allowed capex, or 26% or 19% of the initial allowance plus the pass-through. On either basis, it is another significant overspend. The AER (2006 p. 7) enunciated as follows the philosophy underlying incentive price controls in its Statement of Regulatory Principles (SRP, which preceded the National Electricity Rules) “The SRP established a straight-forward ex-ante incentive regime. The AER set a revenue target and the TNSPs were rewarded for beating the target and penalised for exceeding it.” The GB distribution companies have consistently beaten the capex targets and benefited from the reduced cash outflow. The NSW distribution companies have consistently exceeded the capex targets but in the first regulatory period suffered no regulatory penalty, and in the second suffered only the lack of return on the overspend during the same period. NSW regulators thus seem to have been accommodating in allowing overspend plus depreciation and return (at the end of the first period), the very substantial pass-through element at the beginning of the second period, and the substantial overspend by the end of the second period.
34 Sources: i) ACCC 2005 (Table 3.10, p. 69), IPART 2004 (Table 4.10); ii) IPART 2006, Table 1; iii) is the sum of i) and ii); iv) AER 2009a (Tables 5.5, 5.6, 5.7 and 5.8, which is the amount the AER allowed into the RAB including recovery of half year WACC and CPI adjustment); v) is iv) minus iii). 35 Source: AER 2008b and AER personal correspondence 18 September 2009
16

Figure 5a Allowed and actual capital expenditure by NSW distributors (2008$million)36
$-$1,000$2,000$3,000$4,000$5,000$6,000$7,000$8,000$9,000
NSWAllowance
1999 to 2004
NSW Actual1999 to 2004
NSWAllowance
2004 to 2009
NSW Actual2004 to 2009
Figure 5b Allowed and actual capital expenditure by GB distributors (2008$million)37
$-
$2,000
$4,000
$6,000
$8,000
$10,000
$12,000
$14,000
GBAllowance
2000 to 2005
GB Actual2000 to 2005
GBAllowance
2005 to 2010
GB Actual2005 to 2010
The contrast between distribution network experience in NSW and GB is actually consistent with a larger picture. While the capex overspends of NSW distributors may have been extreme, other Government-owned distributors and transmission service providers in Australia have consistently overspent their regulatory allowances. In contrast, privately owned distributors and transmission businesses in Australia have consistently spent less than their regulatory allowances.38
36 Sources for Fig. 5a: ACCC 1999 (Table 9.2, p. 138), ACCC 2005 (Table 3.10, p. 69), IPART 2004 (Table 4.10), AER 2009 (Tables 5.5, 5.6, 5.7 and 5.8), Meritec 2003 (p. 21), IPART 2004 (p. 55). 37 Sources for Fig. 5b: Ofgem 2004 (unnumbered tables on pp. 124 to 138), Ofgem 2009c (Tables 6.1 to 6.14). Ofgem, personal correspondence, 30 October 2009. Note for the purpose of this calculation both the allowed and actual capex excludes adjustment for pensions. 38 Perhaps significantly, in the development of the National Electricity Rules applicable to transmission service providers (which preceded and formed the basis for the economic regulation arrangements applicable to distributors) the only distributor that expressed disappointment with the low-powered efficiency incentives that the AEMC had proposed was the privately owned South Australian distributor, ETSA (AEMC 2006 p. 72).
17

d) regulation and regulatory framework In designing a regulatory framework, a government has to balance (among many other things) the interests of customers and investors. A government that is also an investor, as the owner of a regulated company, and as the recipient of its tax revenues, has an additional financial interest in the profitability of that company. It thereby has a financial interest in the extent of regulatory power and discretion and how this is exercised, especially with respect to the severity of the price control. This might be expected to manifest itself in the design of the regulatory framework. Arguably this is indeed the case as between GB and Australia, as illustrated by the process of making the most senior appointments. In GB the Secretary of State for Energy appoints the members of Ofgem, but (with the sometime exception of the nuclear generating company) has no interest as owner. In contrast, the Australian Competition and Consumers Commission (ACCC) appoints the three members of the AER, but appointments of the chairman and one other member require the agreement of the Ministerial Council on Energy, which represents the Commonwealth Government and Energy Ministers of the State and Territory governments. These Energy Ministers are typically the Ministers responsible for the state-owned distributors. In addition, the Australian Energy Markets Commission (AEMC), which sets the National Electricity Rules that the AER has to enforce, is responsible to the Council of Australia Governments through the same Ministerial Council on Energy. The impact of this process has been marked: it is understood that the strict limits on the AER’s discretion, and other distinctive aspects of the regulatory framework noted above, were helpful in persuading some States, particularly those that owned electricity distributors, to transfer regulatory authority from the State commission to the AER. To summarise this section, private ownership may be expected to have increased the incentive to efficiency and to underspend against regulatory targets in GB. Government ownership, and the consequent lower cost of capital relative to the allowed return on capital, may be expected to have encouraged NSW distributors to plan for larger capital expenditure programmes, and to overspend rather than underspend relative to regulatory assumptions about future opex and capex. Consequently, public ownership seems a likely contributory factor to the higher distribution costs and allowed revenues in NSW. Public ownership may well also have operated indirectly, by imposing greater restrictions on the new regulatory framework in NSW than that applying in GB.
8. Comparison of NSW and Victoria The analysis in the previous sections suggests that the higher and increasing per customer costs and allowed revenues in NSW compared to GB predominantly reflect factors associated with ownership and regulation, rather than with the physical structure of the industry. A cross-check on this hypothesis is provided by Victoria, which is characterised by private ownership as in GB, and by regulation that was not dissimilar to that in GB during the last two price control periods. If our hypothesis is correct, the pattern of costs and revenues in Victoria should be more comparable to what is observed in GB than in NSW.
18
There are five distributors in Victoria, which have all been privately owned since 1997. Together they serve around 2.6 million electricity consumers. They were regulated initially by the Office of the Regulator-General and subsequently by the Essential Services Commission of Victoria, which set the price control for the regulatory period currently under way. The regulatory framework in Victoria was in principle similar to that in NSW and GB during this period, although there is a perception that Victorian regulators took a tougher line with the (private) companies than IPART did with the (state-owned) companies in NSW. Regulation has since been transferred to the AER, which has begun the price control review for the forthcoming period beginning 2011, but has not yet indicated its thinking on the relevant parameters. Potentially the most significant differences in the physical networks of NSW and GB seemed to be customer density, company size, growth in demand, and quality of service. Victoria’s three urban distributors (Citipower, Jemena and United Energy Distribution) have similar customer density to NSW’s two urban distributors Energy Australia and Integral Energy. Victoria’s two (mainly) rural distributors (SP Ausnet and Powercor) have an average customer density around half that of NSW’s rural distributor, Country Energy. The Victorian distribution businesses are smaller than in NSW.39 The Composite Scale Variable of the five distributors ranges between 4 and 44 with a median of 8 – less than a third of the median size of the GB and NSW distributors, Peak demand in the Victorian power system has grown at a compound annual rate of 4.5% between 2002 and 200840 compared to 3.0% growth in NSW. Distributor customer numbers in Victoria have been growing at an annual average rate of 1.9%, roughly twice the rate in NSW41. Quality of supply as measured by the frequency and duration of outages has consistently been better in Victoria than in NSW.42 These data suggest that, in terms of customer density, size of company and growth in demand, Victoria is faced with more demanding conditions as NSW, and has delivered better quality of service. If these factors are significant, this should lead to higher previous and projected costs and revenues in Victoria than in GB and also higher than in NSW. The evidence suggests that the first proposition is true but the second is not. Figure 6 shows that allowed annual revenue per customer in Victoria was indeed the highest of all three markets in 2000, and remained consistently higher than in GB. But over the decade from about 2000 to about 2010 it decreased by about 20% in Victoria whereas it increased by about 70% in NSW. By 2010 allowed annual revenue per customer in Victoria was around half the level in NSW.
39 Average distribution network size is about 1.89m customers in GB, 1.1m in NSW and 0.4m in Victoria. In addition, as noted, some GB companies own two or three networks though other GB companies own a single network. 40 Based on data in VENCorp (2008, 2009) 41 Based on data in ESAA 2008, for the period 2000 to 2006. 42 See ESAA (2008) and AER (2008a).
19

Figure 6 Annual revenue per customer in NSW, Victoria and GB (2008 AUD)43
The same picture is reflected in the main components of allowed revenue. Figure 7 shows that, in the first regulatory period, allowed opex per customer was slightly higher in Victoria than in NSW, but from the first to the second period it fell in Victoria and rose in NSW, so that it was now about 25% lower in Victoria. Figure 8 shows that, in the first regulatory period, allowed capex per customer was about 60% higher in Victoria than in NSW, but then remained about constant whereas it increased sharply in NSW, so that in the second period it was about 10% lower in Victoria. Figure 7 Allowed opex per customer in NSW, Victoria and GB (2008AUD)44
43 Sources for Fig. 6: All sources noted in Fig 1, and also ORG 2000, Table 6 p. XX. 44 Sources for Fig 7: All sources noted in Fig 2, and also ORG 2000, Table 6 p. XX.
20
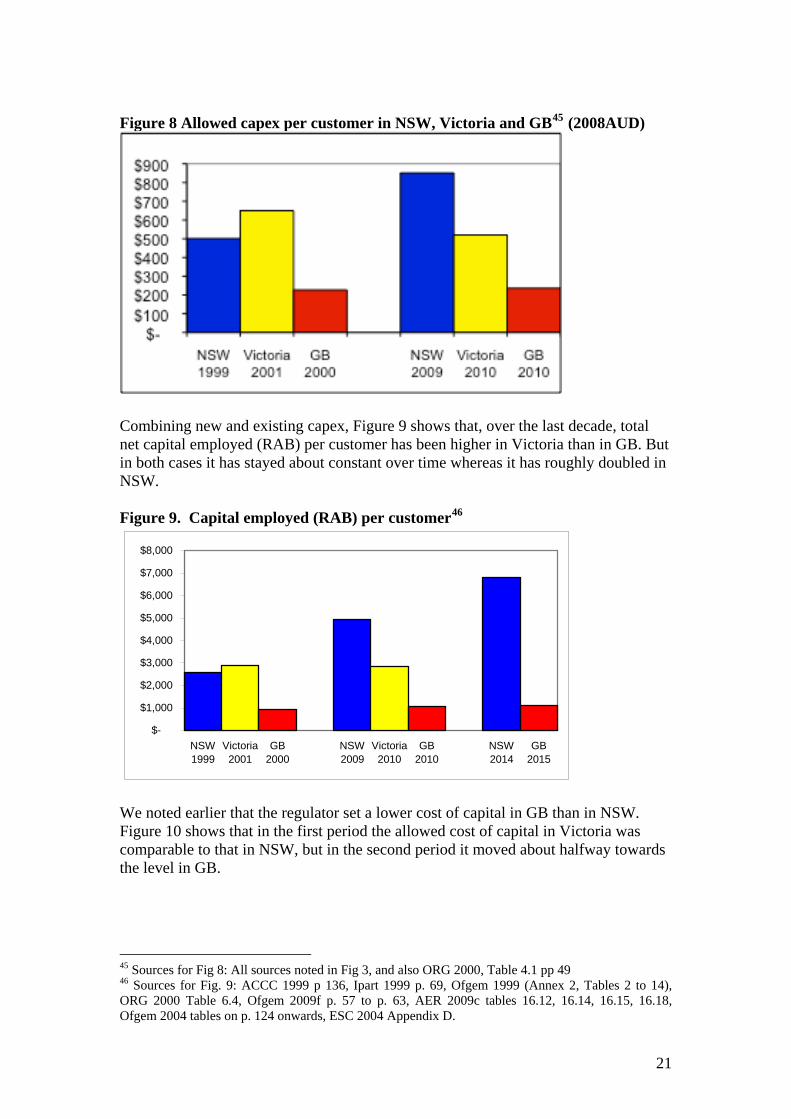
Figure 8 Allowed capex per customer in NSW, Victoria and GB45 (2008AUD)
Combining new and existing capex, Figure 9 shows that, over the last decade, total net capital employed (RAB) per customer has been higher in Victoria than in GB. But in both cases it has stayed about constant over time whereas it has roughly doubled in NSW. Figure 9. Capital employed (RAB) per customer46
$-
$1,000
$2,000
$3,000
$4,000
$5,000
$6,000
$7,000
$8,000
NSW1999
Victoria2001
GB2000
NSW2009
Victoria2010
GB2010
NSW2014
GB2015
We noted earlier that the regulator set a lower cost of capital in GB than in NSW. Figure 10 shows that in the first period the allowed cost of capital in Victoria was comparable to that in NSW, but in the second period it moved about halfway towards the level in GB.
45 Sources for Fig 8: All sources noted in Fig 3, and also ORG 2000, Table 4.1 pp 49 46 Sources for Fig. 9: ACCC 1999 p 136, Ipart 1999 p. 69, Ofgem 1999 (Annex 2, Tables 2 to 14), ORG 2000 Table 6.4, Ofgem 2009f p. 57 to p. 63, AER 2009c tables 16.12, 16.14, 16.15, 16.18, Ofgem 2004 tables on p. 124 onwards, ESC 2004 Appendix D.
21

Fig 10 Estimated cost of capital (real vanilla WACC)47
0.00%1.00%2.00%3.00%4.00%5.00%6.00%7.00%8.00%
NSW1999
Vic 2000 GB 2000 NSW2005
Vic 2006 GB2005
We also noted that GB companies under-spent against targets while NSW companies overspent. Experience in Victoria parallels that in GB. For example, in the period 2001- 06, distribution companies in Victoria recorded actual opex about 21% below allowed opex48, and actual capex about 11% below allowed capex49. Data for the period 2006-2011 are not yet available, but it is understood that there is likely to be an underspend rather than overspend on capex. To summarise, costs and prices are generally higher in Victoria than in GB. But in terms of broadly constant new capex and RAB per customer, non-increasing opex and average revenue per customer, and distributors meeting their capex targets, the picture in Victoria is similar to that in GB, and in contrast to the situation in NSW. The falling rather than constant opex and total revenue per customer may seem different in Victoria compared to GB, but in earlier periods that was actually the case in GB too.50 These results support the hypothesis that private ownership and/or effective regulation are likely to be important determinants of allowed costs and revenues. A final question is why, if the Victoria companies are privately owned and subject to similar regulation as in GB, their allowed revenues were so much higher? We have already noted the conditions related to the structure of the industry, and the higher allowed cost of capital in Victoria. Certain other factors may relate to particular conditions in Victoria:
47 Sources for Fig 10. IPART 1999, Ofgem 1999 p. 109 (adjusted), Org 2000, IPART 2004 p. 57 (adjusted), OFGEM 2004. 48 ESC 2006, Figure 6.1, p. 197 49 ESC 2006, Table 7.9, p. 267 50 The price control set by the GB Government provided for real increases in distribution prices of up to 2.5% per year for the first five years after privatisation (from 1990 to 1995). Thereafter, the regulatory price controls provided for one-off price decreases of 10-17% between 1995 and 1997, an average decrease of 3% per annum between 1997 and 2000, a further one-off decrease of 23.4% in 2001, and a further 3% per annum reduction between 2002 and 2005. Ofgem (2006, p. 10) calculated that distribution prices had halved between 1990 and 2006.
22

1) Labour rigidities – these are understood to be more serious in Victoria, which is still heavily unionised, than in GB where the distribution labour force is now about one-third of its pre-privatisation level.
2) Initial asset valuation – in setting the initial price control prior to flotation in 1995, the Victorian Government chose high values for the initial assets and prevented the regulator from changing them for ten years.51 Since there has been less capex in Victoria since 2000, the RAB is still influenced by the valuation of assets at privatisation.
Other factors may relate to the shorter length of time since privatisation:
3) Cost reduction – by the period beginning 2000 the GB companies had been taking out excess costs for a decade, during which costs and allowed revenues decreased rather than remained constant. In Victoria this process had only just started, under the new private owners.
4) Development of regulation – by the same token, GB regulators had a decade to develop and apply benchmarking and incentive regulation, whereas in Victoria this was only just starting.
5) Cost allocation – ten years after privatisation Ofgem reallocated significant costs from distribution to supply, which may not yet have happened in Victoria.
9. Conclusions
We have compared the allowed revenues per customer in electricity distribution networks in GB, NSW and Victoria over the last three price control periods. We have also looked at the associated allowed and actual operating and capital costs and allowed return on capital. We have explored possible reasons for the different pictures that are observed. Briefly, it seems that costs and allowed revenues in NSW are now higher than in GB and Victoria, and increasing at a significantly faster rate. The reason for this does not seem to be primarily associated with the nature of the terrain or the physical electricity networks. Admittedly GB has a slightly higher customer density, greater company size and lower growth rate than NSW, but Victoria has a lower customer density, smaller firm size and higher growth rate than NSW. Both GB and Victoria have managed to accommodate increasing demand and improved quality of service at broadly constant or even declining costs while delivering higher quality of service, while NSW has not. An important part of the explanation seems to be private ownership in GB and Victoria compared to state ownership in NSW. Another part seems to be associated with regulation, both the regulatory framework and the practice of the regulatory body within that framework. These results suggest that the issue deserves further and more rigorous examination by interested government agencies and regulatory bodies, and by independent 51 The Government also increased the RAB of the urban distributors relative to the rural distributors in order to achieve tariff parity. These and other transitional arrangements were incorporated into the Victorian Tariff Order. Booth (2003) pp. 64-7.
23

academics. Are the calculations presented here a fair reflection of the differences between the three markets? Do they make adequate allowance for (eg) accounting differences and pension costs, which are not easily identifiable in present regulatory publications? If there are indeed significantly different costs and allowed revenues, how far can the different outcomes be attributed to the factors identified here, or perhaps to other factors? To help answer these questions, it would seem helpful to cast the net wider, for example to include other states in Australia. Econometric analyses using network or company-specific data rather than state-wide aggregates may be able to quantify the explanatory factors. There are potentially important implications for public policy. Government, regulators and energy users in GB can perhaps take some comfort in the results. However, questions have been raised (not least by Ofgem itself) as to whether the approach taken in the past is sustainable and appropriate in the future. In Australia, there is already some concern about the contribution that increased distribution charges are making to inflation.52 Particular businesses, such as generators and retailers who rely on the distribution network to transport electricity to their customers, might be vulnerable.53 As, indeed, might the distribution businesses themselves if networks are bypassed. Obvious questions therefore arise. Are the present restrictions on the AER appropriate? Could the AER do more to encourage efficiency even within its present regulatory framework? Is it time to consider privatisation of electricity and other businesses where this has not yet taken place? Acknowledgement We are grateful to a referee for comments and questions on an earlier draft of this paper.
52 In the most recent quarter (July to September 2009), 21 basis points of the 100 basis point national increase in the All Groups Consumer Price Index for the quarter were attributed to electricity price increases. In NSW the proportion was 37 basis points out of 110. (Australian Bureau of Statistics, 28 October 2009) Since the average wholesale price of electricity in the National Electricity Market has been falling over this period, the price increases principally reflect transmission and distribution network price increases, particularly by government-owned companies in NSW, Tasmania and Queensland. In Victoria and South Australia, where electricity networks are privately owned, electricity prices respectively decreased and increased only slightly. 53 For example, at average wholesale prices over the last four years ($46.47/MWh in NSW compared to $90.34/MWh in GB, in A$2008), and with the allowed increases in distribution revenues, distribution charges would be less than one quarter of average generation price in GB and 40% higher than average generation price in NSW.
24

References Australian Competition and Consumer Commission (ACCC),1999. NSW and ACT Transmission network revenue caps 1999/00 to 2003/4. Available from www.aer.gov.au Australian Competition and Consumer Commission (ACCC),2005. NSW and ACT Transmission network revenue caps 2004-05 to 2008-09. Available from www.aer.gov.au Australian Competition Tribunal, 2009. Application by EnergyAustralia and Others (No 2) [2009] ACompT 9 (25 November 2009). Available from www.competitiontribunal.gov.au Australian Energy Markets Commission (AEMC), 26 July 2006. Draft Rule Determination, Draft National Electricity Amendment (Economic Regulation of Transmission Service) Rule 2006. Australian Energy Regulator (AER), 30 November 2005. Review of Electricity Transmission Revenue and Pricing Rules: Response to AEMC’s Revenue Requirements Issues Paper. Available from www. aemc.gov.au Australian Energy Regulator (AER), March 2006. Draft National Electricity Amendment (Economic Regulation of Transmission Services) Rule 2006, Submission by the AER. Available from www.aemc.gov.au Australian Energy Regulator (AER), 20 November 2008a. The state of the energy market. Available from www.aer.gov.au Australian Energy Regulator (AER), 21 November 2008b. Draft Decision, New South Wales Distribution Determination 2009-10 to 2013-14. Available from www.aer.gov.au Australian Energy Regulator (AER), 28 April 2009a. Final Decision, New South Wales Distribution Determination 2009-10 to 2013-14. Available from www.aer.gov.au Australian Energy Regulator (AER), May 2009b. Final Decision: Electricity Transmission and Distribution Network Service Providers, Review of the weighted average cost of capital parameters. Available from www.aer.gov.au Australian Energy Regulator (AER), April 2009c. Final Decision: TransGrid Transmission Determination 2009-10 to 2013-14. Available from www.aer.gov.au Australian Federal Treasury, December 2008. Australia’s Low Pollution Future, The Economics of Climate Change Mitigation. Averch, H., Johnson, L., 1962. “Behaviour of the firm under regulatory constraint”, American Economic Review, Vol 52, Issue 5, p1052.
25
Beesley, M.E., Littlechild, S.C., July 1983. “Privatization: Principles, Problems and Priorities”, Lloyds Bank Review, No 149, 1-20. Booth, Robert, 2003. Warring Tribes – the story of power development in Australia. Revised edition, Bardak Group, Perth. Cornwallenergy, 28 September 2009. energyspectrum issue 202, at [email protected] De Alessi, L., 1974. “An economic analysis of government ownership and regulation”, Public Choice, XIX. De Alessi, L., 1980. “The economics of property rights: a review of the evidence”, Research in Law and Economics, Vol 2. Department for Innovation and Skills, 2009. Digest of UK Energy Statistics,, at http://stats.berr.gov.uk/energystats/dukes5_5.xls) Department for Trade and Industry, 2005. Regional and local electricity consumption statistics for 2005, at http://stats.berr.gov.uk Electricity Supply Association of Australia (ESAA), 2008. Electricity Gas Australia. Energy Networks Association (ENA) 2005. Review of Electricity Transmission Revenue and Pricing Rules Response to Revenue Requirements Issues Paper, Canberra ETSA Utilities, 20 March 2006. Letter to AEMC on Draft Rule Determination. Firecone Ventures, March 2006. Providing certainty through codification: Comments on the AEMC Rule Proposal, A report by Firecone Ventures to the Australian Energy Regulator. Government Pricing Tribunal, October 1994. Paying for Electricity An Interim Report, Vols 1 and 2, Sydney. Haney, Aoife Brophy and Pollitt, Michael G, 2009, “Efficiency analysis of energy networks: an international survey of regulators”, EPRG Working Paper 0915, Cambridge Working Paper in Economics 0926, Energy Policy Research Group, University of Cambridge. Independent Pricing and Regulatory Tribunal (IPART), June 1999. Pricing for electricity networks and retail supply, Report, Volume 1. Independent Pricing and Regulatory Tribunal (IPART), June 2004. NSW Electricity Distribution Pricing 2004/5 to 2008/9 Final Report. Available from www.ipart.gov.nsw.au
26
Jamasb, T., Pollitt, M., 2007a. “Incentive Regulation of Electricity Distribution Networks: Lessons of experience from Britain”. Working Paper EPRG0701, Cambridge Electricity Policy Research Group, University of Cambridge. Jamasb, T., Pollitt, M., 2007b. “Reference models and incentive regulation of electricity distribution networks: an evaluation of Sweden’s Network Performance Assessment Model (NPAM)”. Working Paper EPRG0718, Cambridge Electricity Policy Research Group, University of Cambridge Jamasb, Tooraj, Michael G Pollitt and Thomas Triebs, 2008. “Productivity and efficiency of US gas transmission companies: a European regulatory perspective, Working Paper EPRG0806, Electricity Policy Research Group, University of Cambridge.
Jamasb, Tooraj and Magnus Söderberg, 2009, “Yardstick and Ex-Post Utility Regulation by Norm Model: Empirical Equivalence, Pricing Effect, and Performance in Sweden”, Working Paper EPRG0906, Electricity Policy Research Group, University of Cambridge.
Kwoka, John, Sanem Ozturk and Michael G Pollitt, 2008. “Divestiture policy and operating efficiency in US electric power distribution”, Working Paper EPRG0819, Electricity Policy Research Group, University of Cambridge. London Economics Limited and ESAA, 1994a. Comparative Efficiency of NSW Metropolitan Electricity Distributors. London Economics Limited and ESAA, 1994b. International Performance Measurement for the Australian Electricity Supply Industry Meritec, 2003. Review of capital and operating expenditures of NSW DNSPs . Available from www.ipart.nsw.gov.au Mitzutani, Fumitoshi, Hideo Kozumi and Noriaki Matsushima, 2009. “Does yardstick regulation really work? Empirical evidence from Japan’s rail industry”. Journal of Regulatory Economics, 36 (3), December: 308-323 National Audit Office., April 2002. Pipes and Wires, Report by the Comptroller and Auditor General, HM Government. National Electricity Rules, Version 29, available from www.aemc.gov.au National Grid Transco, 2009. Seven Year Statement. Available from www.nationalgrid.com Newbery, David M, 1999. Privatization, Restructuring, and Regulation of Network Utilities, MIT Press, Cambridge, Massachusetts & London, England. Nillesen, Paul and Michael G Pollitt, 2008. “Ownership unbundling in electricity distribution: empirical evidence from New Zealand”, Working Paper EPRG 0820, Electricity Policy Research Group, University of Cambridge.
27
Office of Gas and Electricity Markets (Ofgem), December 1999. Review of public electricity suppliers 1998 to 2000, Distribution Price Control Review, Final Proposals. Available from www.ofgem.gov.uk Office of Gas and Electricity Markets (Ofgem), November 2004. Electricity Distribution Price Control Review, Final Proposals. Available from www.ofgem.gov.uk Office of Gas and Electricity Markets (Ofgem), May 2006. Our energy challenge: Ofgem’s response. Available from www.ofgem.gov.uk Office of Gas and Electricity Markets (Ofgem), December 2008. Electricity Distribution Price Control Review Policy Paper. Available from www.ofgem.gov.uk Office of Gas and Electricity Markets (Ofgem), 8 May 2009a. Electricity Distribution Price Control Review, Methodology and Initial Results Paper. Available from www.ofgem.gov.uk Office of Gas and Electricity Markets (Ofgem), 3 August 2009b. Electricity Distribution Price Control Review, Initial Proposals. Ref 92/09. Available from www.ofgem.gov.uk Office of Gas and Electricity Markets (Ofgem), 3 August 2009c. Electricity Distribution Price Control Review, Initial Proposals – Allowed Revenues and Financial Issues. Ref 95/09. Available from www.ofgem.gov.uk Office of Gas and Electricity Markets (Ofgem) 23 October 2009d. Further update to the cost assessment. Available from www.ofgem.gov.uk. Office of Gas and Electricity Markets (Ofgem) February 2009e. Regulating Energy Networks for the Future RPI-x@20, Performance of the Energy Networks under RPI-X. Available from www.ofgem.gov.uk Office of Gas and Electricity Markets (Ofgem) 7 December 2009f. Electricity Distribution Price Control Review Final Proposals - Allowed Revenues and Financial Issues. Office of the Regulator-General Victoria, September 2000. Electricity distribution price determination 2001-2005 Volume 1 Statement of Purpose and Reasons. Pierce, J., Price, D., Rose, D., 1995. “The Performance of the NSW Electricity Supply Industry”, Proceedings of the Reserve Bank Conference, Sydney. TransGrid, 2009. Annual Planning Report. July Available from www.transgrid.com.au VENCorp, 2008. Annual Planning Report 2008. Available from www.aemo.com.au VENCorp, 2009. Annual Planning Report 2009. Available from www.aemo.com.au
28

29
Wolf, Christian, 2008. “Does ownership matter? The performance and efficiency of state oil vs private oil (1987-2006)”, EPRG0813, Electricity Policy Research Group, University of Cambridge. Wolf, Christian and Michael Pollitt, 2008. “Privatising national oil companies: assessing the impact on firm performance”, Working Paper EPRG0805, Electricity Policy Research Group, University of Cambridge.