comparing five bilateral development finance institutions ... · cgd policy paper 116 january 2018...
TRANSCRIPT

CGD Policy Paper 116January 2018
Comparing Five Bilateral Development Finance Institutions and the IFC
Development Finance Institutions (DFIs)—which provide financing to private investors in developing economies—have seen rapid expansion over the past few years. A recent estimate is that annual commitments from DFIs as a whole grew from $10 to $70 billion between 2002-2014. Many DFIs have ambitions to play an even greater role going forward, continuing expansion and working more in fragile states. DFIs remain a comparatively under-studied set of development institutions in terms of their activities and impacts. Much of the information about DFIs is presented in forms that make aggregation and comparison difficult and time-consuming. This paper describes and analyses a new dataset covering the five largest bilateral DFIs alongside the IFC which includes project amounts, standardized sectors, instruments, and countries. The aim is to establish the size and scope of DFIs and to compare and contrast them with the IFC.
www.cgdev.org
Center for Global Development2055 L Street NWFifth FloorWashington DC 20036202-416-4000 www.cgdev.org
This work is made available under the terms of the Creative Commons Attribution-NonCommercial 4.0 license.
Abstract
Charles Kenny, Jared Kalow, Ben Leo, and Vijaya Ramachandran. 2018. “Comparing Five Bilateral Development Finance Institutions and the IFC.” CGD Policy Paper. Washington, DC: Center for Global Development. https://www.cgdev.org/publication/comparing-five-bilateral-development-finance-institutions-and-ifc
CGD is grateful for contributions from the Bill & Melinda Gates Foundation, Ford Foundation, and Omidyar Network in support of this work.
Charles Kenny, Jared Kalow, Ben Leo, and Vijaya
Ramachandran

Contents
1. Introduction .................................................................................................................................. 1
2. Data and Methodology ................................................................................................................ 2
3. DFI Portfolios in Review ........................................................................................................... 4
3.1 Major DFI Commitments between 2012 and 2016 ......................................................... 4
3.2 DFI Commitments by Instrument ..................................................................................... 5
3.3 DFI Commitments by Sector .............................................................................................. 7
3.4 Co-financing among DFIs ................................................................................................... 9
3.5 DFI Commitments by Country ........................................................................................ 12
3.6 DFI Commitments by Country Income Status and Risk Measures............................ 15
4. Policy Implications ..................................................................................................................... 19
Appendix 1: Comparison between Project-level Data and Reported Data .......................... 20
Appendix 2: A Note on Methodology ........................................................................................ 22
References........................................................................................................................................ 27

1
1. Introduction
Development Finance Institutions (DFIs)—which provide financing to private investors in developing economies—have seen rapid expansion over the past few years. A recent estimate is that annual commitments from DFIs as a whole grew from $10 to $70 billion between 2002-2014.1 Many DFIs have ambitions to play an even greater role going forward, continuing expansion and working more in fragile states.
DFIs remain a comparatively under-studied set of development institutions in terms of their activities and impacts. One reason for this will be the paucity of data around their activities. Only in the last few years have many DFIs started publishing summary information on investment projects. Much of this information is presented in forms that make aggregation and comparison across DFIs difficult and time consuming (although the Association of European Development Finance Institutions (EDFI) has begun some important work in that area).2 This paper describes and analyses a new dataset covering the five largest bilateral DFIs alongside the IFC which includes project amounts, standardized sectors, instruments, and countries.
The dataset covers a considerable proportion of total bilateral DFI flows. But it does not cover a number of significant multilateral institutions engaged in development finance including the European Bank for Reconstruction and Development, the Asian, African and Inter-American Development Banks and the European Investment Bank. The database covers $20.4 billion of DFI investments in 2014 compared to the estimated $70 billion of total DFI investments in developing countries in that year.
1 Conor M. Savoy, Paddy Carter, and Alberto Lemma, “Development Finance Institutions Come of Age: Development Finance Institutions Come of Age Policy Engagement, Impact, and New Directions” (Center for Strategic and International Studies, October 2016), https://www.csis.org/analysis/development-finance-institutions-come-age. 2 EDFI, “EDFI Flagship Report 2016” (European Development Finance Institutions, July 7, 2016), http://www.edfi.be/publications/all.html.

2
2. Data and Methodology
For each of the six DFIs in this report, we assembled a dataset of projects between 2012 and 2016 using all publicly available data. For convenience we label aggregate commitments 2012-16 a DFI’s ‘portfolio,’ although this is a loose definition.3 Primary sources are listed in Table 1. We followed a similar process for building each dataset:
1) We first attempted to create a definitive base list of projects covering every project that the DFI committed financing over 2012-16 by year.
2) For each project, we then looked for information on the amount of financing committed by the DFI (converted to USD and adjusted for inflation using the Consumer Price Index), the financing instrument (debt, equity, insurance, or technical assistance), a project description, the sector according to the North American Industry Classification System (NAICS), the year of commitment, and the country and region of commitment.
3) We manually assigned categories if the data was not available based on project descriptions. In particularly, we had to assign the NAICS sector for most of the DFIs (except IFC and some OPIC projects) and the instrument.
Given the different reporting procedures across the DFIs, we used a range of sources to build the dataset. In some project cases, we could not find identify project-level information, particularly for the financing instrument and the NAICS sector. If possible, we manually assigned the information based on existing data. In these cases, there is some room for error or subjective interpretation.
Unfortunately, there are still some gaps in the data that limit the analysis. In particular, instrument data for FMO and project-level data between 2012-2014 for DEG is missing. Additionally, as described in Appendix 1, the dataset may be missing projects or capturing projects in the wrong year. There is also a possibility that project sizes change between project approval and implementation.
3 The true portfolio is made up of a stock of outstanding loans and equity, our measure is of five years of summed pre-obligated future loan and equity investments.

3
Table 1: Data Sources
DFI Years Amount Instrument Description NAICS Sector
CDC Group
2012-2016 IATI IATI CDC Group Annual Reports
Manually assigned
DEG 2015-20164 DEG Website PDFs
Manually assigned DEG Website PDFs Manually assigned
FMO 2012-2016 FMO Worldmap n/a FMO Worldmap Manually assigned
IFC 2012-2016 IFC Project information Portal
IFC Project Information Portfolio
IFC Project Information Portfolio
IFC Project Information Portfolio5
OPIC 2012-2016 OPIC Annual Reports
OPIC Portfolio/Manually assigned
OPIC Annual Reports/OPIC Project PDFs
OPIC Portfolio/Manually assigned6
Proparco 2012-20157 Proparco Annual Reports
Manually assigned Proparco Annual Reports/
Assigned
Appendix 2 provides a full explanation of how we collected the data from each DFI, including data on the “Other EDFI members” referenced in Figure 1.
We complemented the project-level data with historical country-level data. Income categories are by World Bank classification. The fragility determination comes from the Fund for Peace’s Fragile State Index (FSI), and all countries with a score above 90 (categorized as Alert, High Alert, and Very High Alert) are considered fragile. Data on the domestic credit depth to the private sector comes from the World Bank; to categorize countries, we divided all countries in a given year into four credit depth quartiles.
4 Country-level topline data (i.e. the total number of commitments by country) is available for DEG between 2012 and 2016. 5 IFC provided the authors with a spreadsheet that crosswalks between IFC sectors and the NAICS sectors. 6 NAICS sector data is available for active projects in OPIC’s 2016 portfolio. NAICS sectors were assigned for the remaining projects. 7 Additional project-level data is available for Proparco projects in an online map, but the data does not seem to be a definitive list of projects in 2016.
4
3. DFI Portfolios in Review
3.1 Major DFI Commitments between 2012 and 2016
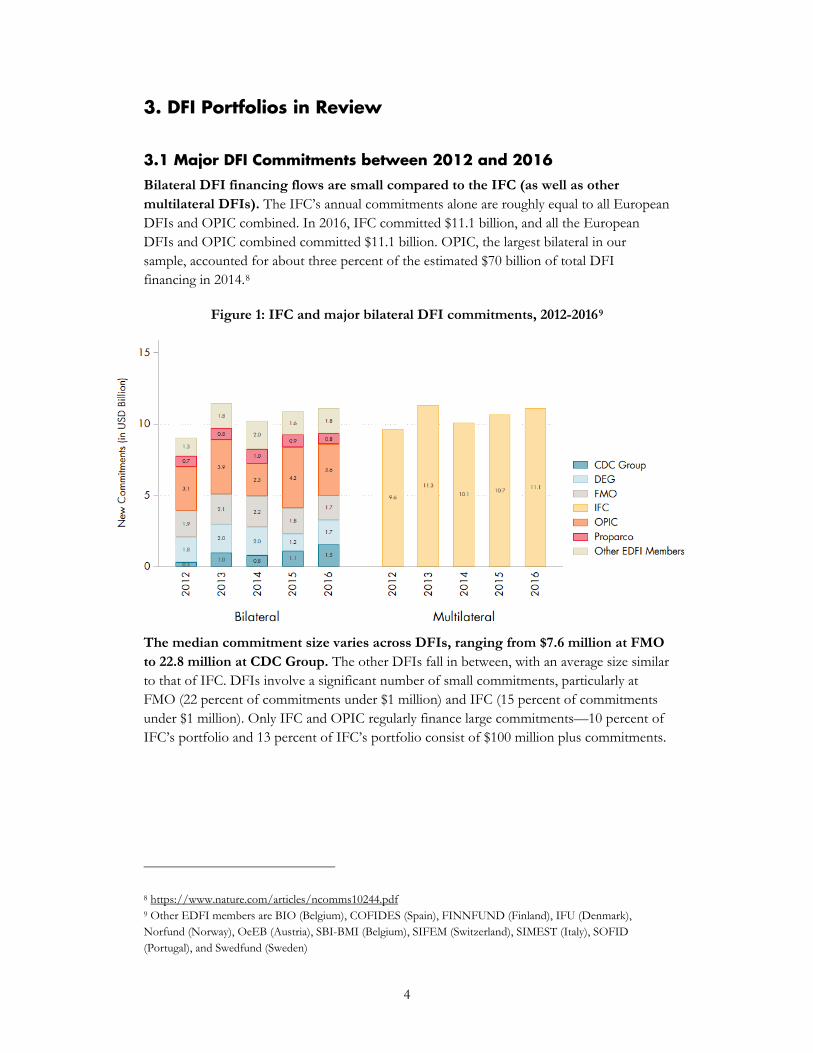
Bilateral DFI financing flows are small compared to the IFC (as well as other multilateral DFIs). The IFC’s annual commitments alone are roughly equal to all European DFIs and OPIC combined. In 2016, IFC committed $11.1 billion, and all the European DFIs and OPIC combined committed $11.1 billion. OPIC, the largest bilateral in our sample, accounted for about three percent of the estimated $70 billion of total DFI financing in 2014.8
Figure 1: IFC and major bilateral DFI commitments, 2012-20169
The median commitment size varies across DFIs, ranging from $7.6 million at FMO to 22.8 million at CDC Group. The other DFIs fall in between, with an average size similar to that of IFC. DFIs involve a significant number of small commitments, particularly at FMO (22 percent of commitments under $1 million) and IFC (15 percent of commitments under $1 million). Only IFC and OPIC regularly finance large commitments—10 percent of IFC’s portfolio and 13 percent of IFC’s portfolio consist of $100 million plus commitments.
8 https://www.nature.com/articles/ncomms10244.pdf 9 Other EDFI members are BIO (Belgium), COFIDES (Spain), FINNFUND (Finland), IFU (Denmark), Norfund (Norway), OeEB (Austria), SBI-BMI (Belgium), SIFEM (Switzerland), SIMEST (Italy), SOFID (Portugal), and Swedfund (Sweden)

5
Table 2: DFI portfolios in brief
DFI Commitments, 2012-2016 (USD
Million)
Total Number of
Investments
Mean Project Size (USD Million)
Median Project Size (USD Million)
Bilateral CDC Group $4,447 136 $32.70 $22.78 DEG $2,307 120 $19.89 $16.70 FMO $8,115 711 $11.41 $7.59 OPIC $18,254 431 $42.35 $12.63 Proparco $5,629 305 $18.46 $15.18
Multilateral IFC $50,084 1,344 $39.94 $25.15
3.2 DFI Commitments by Instrument
With the exception of the CDC Group, the majority of DFIs’ commitments is in the form of loans. Each DFI has a range of instruments at its disposal. For example, OPIC is the only DFI offering political risk insurance, while other DFIs have corresponding institutions to provide political risk insurance (e.g. in the case of the World Bank Group, MIGA offers political risk insurance rather than the IFC). Additionally, OPIC is one of the few DFIs to not offer equity.10 Despite this, the portfolio of each DFI is generally dominated by debt. The exception is the CDC Group; 70 percent of CDC Group’s commitments have been in equity.
10 Savoy, Carter, and Lemma, “Development Finance Institutions Come of Age: Development Finance Institutions Come of Age Policy Engagement, Impact, and New Directions”; Benjamin Leo, Todd Moss, and Beth Schwanke, “OPIC Unleashed: Strengthening US Tools to Promote Private-Sector Development Overseas,” Rethinking US Development Policy (Center for Global Development, August 2013), https://www.cgdev.org/sites/default/files/OPIC-Unleashed-final.pdf.
6
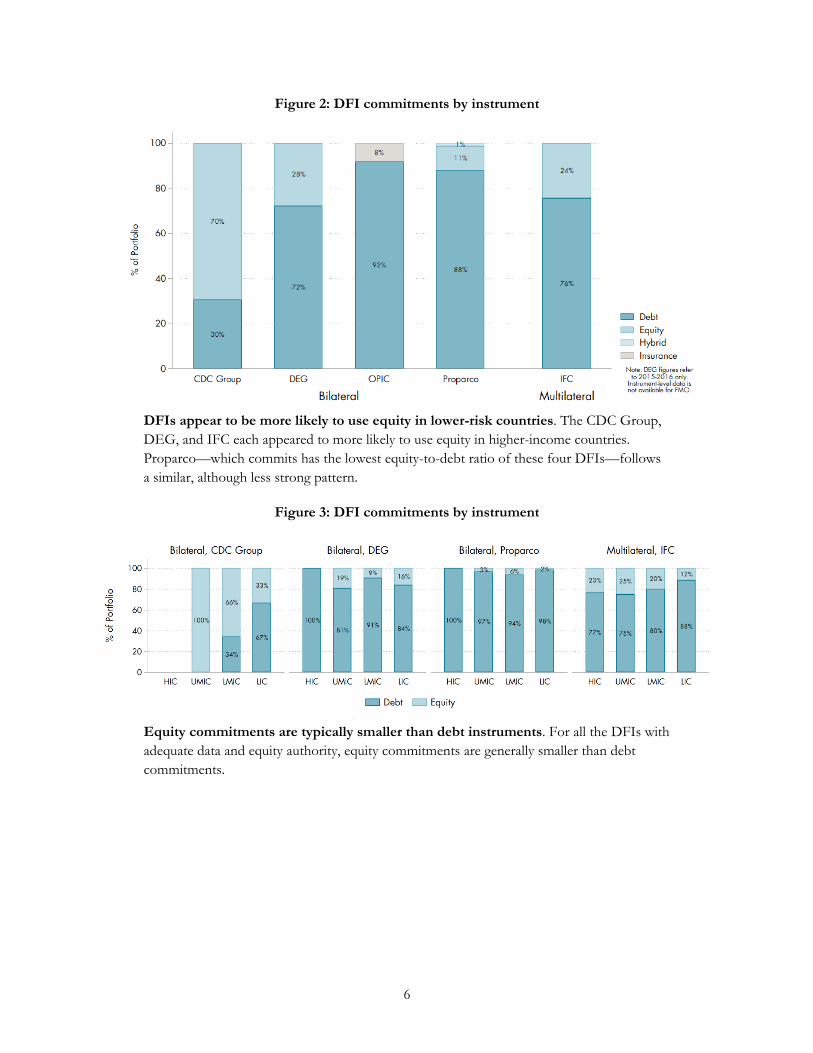
Figure 2: DFI commitments by instrument
DFIs appear to be more likely to use equity in lower-risk countries. The CDC Group, DEG, and IFC each appeared to more likely to use equity in higher-income countries. Proparco—which commits has the lowest equity-to-debt ratio of these four DFIs—follows a similar, although less strong pattern.
Figure 3: DFI commitments by instrument
Equity commitments are typically smaller than debt instruments. For all the DFIs with adequate data and equity authority, equity commitments are generally smaller than debt commitments.

7
Table 3: Median size of DFI commitments by instrument
DFI Debt Equity Total Portfolio
Bilateral CDC Group $25.90 $20.60 $22.78
DEG $20.00 $12.00 $16.70 OPIC $15.70 $12.63
Proparco $20.20 $7.10 $15.18 Multilateral
IFC $30.80 $19.90 $25.15
3.3 DFI Commitments by Sector
DFI commitments are heavily concentrated in the finance, and to a lesser extent infrastructure, sectors. For each of the five bilateral DFIs in or database, finance and insurance (including SME, MFI and private equity funds investments) is the largest sector of projects by volume (although note that investments in private equity funds fall into this category and some part of those resources will be passed on to sectoral investments). The same is true of the IFC. Utilities (i.e. power) and manufacturing are the next largest sectors by volume. OPIC provides the most financing for utilities. Much of this financing for utilities can be explained by OPIC’s contributions to Power Africa; roughly half ($3.0 billion) of this OPIC’s utilities financing has gone to sub-Saharan Africa. The IFC is arguably more diversified by sector than the bilateral DFIs. Over three quarters of each of the portfolios of the CDC Group, FMO, OPIC, and Proparco is devoted to either finance or utilities.

8
Figure 4: DFI commitments by sector11
Table 4: Commitments by sector, 2012-2016 (USD million)
11 Sector names have been shortened in the tables and figures. Transportation refers to Transportation and Warehousing. Agriculture refers to Agriculture, Forestry, Fishing, and Hunting. Oil, Gas, and Mining refers to Mining, Quarrying, and Oil and Gas Extraction. Health Care refers to Health Care and Social Assistance. Real Estate refers to Real Estate and Rental and Leasing. See the methodology section for an explanation of the sectors. 12 DEG projects refer to 2015 and 2016 only
NAICS Sector
Bilateral Multilateral
CDC Group
DEG12 FMO OPIC Proparco Bilateral
Percent of Total
IFC Percent of Total
Finance and Insurance 3,017 1,332 4,353 7,740 3,157 51% 47% Utilities 517 242 1,790 6,260 1,253 26% 11% Manufacturing 322 369 700 1,022 245 7% 13% Transportation 126 60 233 102 195 2% 6% Agriculture 40 24 133 385 172 47% 6% Mining, Oil, and Gas - 25 116 242 8 1% 5% Health Care 131 63 34 1,087 249 4% 2% Information 66 15 168 474 125 2% 3% Construction 112 91 409 353 29 3% 2% Educational Services 62 - 4 141 123 1% 2% Real Estate 31 8 90 59 27 1% 2% Accommodation/Food Services 23 58 34 220 - 1% 1% Other - 20 49 167 46 1% 0%

9
DFI support for traditional development sectors like agriculture, healthcare, and educational services is modest. Commitments to each of those sectors is under 7 percent of each portfolio. Other sectors, including information (i.e. ICT excluding building cell towers), construction, and mining, oil, and gas each make up under 5 percent of each portfolio.
The average commitment size varies more by DFI than by sector. Each of the major sectors has a median commitment between $10.4 and $16.0 million. However, within the sectors, the median project size varies significantly. For example, the median OPIC utility commitment is $44.5 million, while the median FMO utility commitment is $11 million.
Table 5: Median size of DFI commitments for selected sectors
3.4 Co-financing among DFIs
Co-financing of projects between the six DFIs profiled in this paper only represent a small slice of total investment. That said, a larger proportion of the portfolios of some European DFIs—the CDC Group, DEG, and FMO—is co-financed with other DFIs in our dataset.14 Note the co-financing figures here do not include investments co-financed by other bilateral or multilateral DFIs or other multilateral institutions.
Most investments are only co-financed among two DFIs. In only three cases, three DFIs in our database co-financed one investment, including Adenia IV (a private equity fund focused in sub-Saharan African co-financed by the CDC Group, IFC, and Proparco) and Bridge International Academics in Kenya (an investment to build and operate schools; this deal was co-financed by the CDC Group, IFC, and OPIC).
The high level of co-financing at some institutions implies that smaller, European DFIs are moving in tandem. The amount of co-financing between the CDC Group and FMO is the largest among all DFI dyads. While the CDC Group, DEG, and FMO are all
13 Includes other sectors not included in this table. 14 Co-financing with other DFIs allows the institutions with overlapping missions to share risk. The methodology of how we authors identified co-financed projects is available in Appendix 2.
DFI Agriculture Finance and
Insurance Manufacturing Transportation Utilities
Total Portfolio13
Bilateral CDC
Group $ 20.1 $ 25.3 $ 14.6 $ 7.0 $ 24.5 $22.78
DEG $ 12.1 $ 16.2 $ 17.5 $ 16.7 $ 22.3 $16.70 FMO $ 12.6 $ 7.5 $ 17.2 $ 5.6 $ 10.9 $7.59 OPIC $ 8.6 $ 10.1 $ 8.8 $ 10.4 $ 44.5 $12.63
Proparco $ 25.8 $ 13.4 $ 15.6 $ 15.6 $ 20.4 $15.18 Multilateral
IFC $ 31.3 $ 24.7 $ 15.9 $ 24.2 $ 39.8 $25.15

10
smaller in volume than the IFC or OPIC, co-financing allows these institutions to de-risk larger investments and reduce portfolio risk.
Figure 5: Co-financing as a portion of DFI portfolios
Co-financed projects are less likely to be in upper-middle or wealthy countries and more likely to be regional investments. 45 percent of co-financed projects are regional investments, compared to 21 percent of all investments across DFIs. On the other hand, only 10 percent of co-financed investments are in upper-middle income countries (compared to 35 percent in the full portfolio) and there were no co-financed investments in high-income countries (compared to 5 percent of the full portfolio).

11
Figure 6: Diagram of DFI co-financing
Co-financed deals are also more likely to be investments in sub-Saharan Africa, in the finance sector, and/or equity deals. 35 percent of co-financed deals are in sub-Saharan Africa (compared with 22 percent of the full portfolio). 66 percent of co-financed deals are in the Finance and Insurance sector (compared to 48 percent of the full portfolio). Almost half (45 percent) of co-financed investment is in the form of equity (compared with 20 percent of the full portfolio).15
These trends are largely driven by equity projects in sub-Saharan Africa in the finance sector, which comprised 30 percent of co-financing (excluding FMO). This suggests that co-financing allows DFIs to invest in potentially riskier contexts (sub-Saharan Africa) with different tools (equity rather than debt, which makes up the lion’s share of DFI investments).
15 These numbers exclude FMO. The instrument of FMO projects could not be systematically identified.

12
3.5 DFI Commitments by Country
Larger DFIs including OPI, and DEG operate in a range of countries. By comparison CDC Group only operates in a small set of countries. The CDC Group only operates in between one to eight countries, entirely in sub-Saharan Africa and South Asia. All six DFIs also contribute significant amounts to regional projects; notably, the 58 percent of the CDC Group’s commitments have been to regional projects.
Table 6: Number of countries with DFI activity16
DFI 2012 2013 2014 2015 2016
Bilateral CDC Group 1 7 7 7 8
DEG 39 43 44 33 40 FMO 24 44 52 49 48 OPIC 41 43 40 35 27
Proparco 32 29 27 35 29
Among bilateral DFIs, sub-Saharan Africa ($14.2 billion) received the most commitments, followed by East & South Asia ($10.5 billion) and Latin America ($10.2 billion) between 2012 and 2016. In every major region, OPIC committed the most of the bilateral DFIs, save global projects.17 Most notably, OPIC dominates financing to the Middle East and North Africa, accounting for $2.5 billion of the nearly $3 billion committed to the region by bilateral DFIs. By contrast, IFC is most heavily concentrated in East and South Asia, having committed $14.4 billion.
16 The country of investment is determined by the DFI. In some cases, a DFI may support will support a funds or companies that are incorporated in one country but with a portfolio in another group of countries. For example, the IFC has offered technical assistance to the SME Finance Forum, which is managed by the Washington, DC-based IFC, and thus the IFC considers the project to be in the United States. We have attempted to exclude these projects in this analysis. 17 Global projects refer to cross-regional projects that cannot be classified into one region.

13
Figure 7: DFI commitments by regions
The countries receiving the most financing are mostly large, middle-income economies. The largest recipients for each DFI are either India (CDC Group, DEG, and FMO) or Turkey (IFC, OPIC, and Proparco). Other large recipients of financing from bilateral DFIs are South Africa ($17.8 billion), Ghana ($15.3 billion), Nigeria ($14.5 billion) and Brazil ($14.0 billion).

14
Figure 8: Map of bilateral DFI (CDC Group, DEG, FMO, OPIC, and Proparco) financing
Figure 9: Map of multilateral (IFC) financing

15
Despite its far larger scale, bilateral DFIs have larger portfolios than the IFC in some countries. OPIC is the most active DFI in several countries in Southern Africa, as well as in Jordan, Chile, Peru, and several other countries. Proparco is the most active actor in several former colonies in West Africa. The CDC Group, FMO, and DEG are also the most active institution in other countries. This suggest that while the IFC may be the most dominant player on a global and regional stage, individual DFIs may be more active in individual economies.
Figure 10: Map of the largest DFI actor in quantity of financing
3.6 DFI Commitments by Country Income Status and Risk Measures
Broadly speaking, the vast majority of DFI financing goes towards lower-middle and upper-middle income countries. By design, DFIs are intended to provide finance is emerging and developing markets, where DFIs can de-risk investments to crowd in private sector engagement. However, prior work has found that OPIC’s portfolio has become increasingly focused on upper-middle income countries with significant amounts of financing going towards high-income countries.18 Since 2012, OPIC has committed nearly $1 billion to Chile and almost $300 million to Israel. (IFC has a similar record and has also committed almost $1 billion to Chile and Russia each over the same period). Significant low-income recipients of bilateral DFI financing including Kenya ($873 million), Bangladesh ($632 million), Tanzania ($529 million), and Senegal ($529 million; of which $449 million is
18 Benjamin Leo and Todd Moss, “Inside the Portfolio of the Overseas Private Investment Corporation,” Policy Paper (Center for Global Development, April 2016), https://www.cgdev.org/sites/default/files/CGD-Policy-Paper-81-Leo-Moss-Inside-the-OPIC-Portfolio.pdf.

16
OPIC commitments to power projects in Senegal). Kenya, Bangladesh, and Senegal have all since graduated out of income status.19
Other DFIs contribute a larger percentage of their portfolio to poorer countries fragile states and countries with low domestic credit depth to the private sector than OPIC or the IFC.20 The largest fragileDFI recipients of DFI financing are Nigeria and Kenya. (Note because of its larger size, IFC has still committed more to fragile states than all four European DFIs combined --$5.1 billion)..
19 In this database, projects are assigned World Bank country income status based on the year of commitment. For example, Kenya graduated out of low-income country status in 2014, so projects prior to 2014 are considered low-income country projects whereas projects 2014 and later are considered lower middle-income country projects. 20 We divide countries into four credit depth categories, which are determined for that particular year in the universe of all countries. As such, the top 25 percent of all countries ranked are classified as having “high” private domestic credit depth. Since the quartiles are determined on an annual basis, the makeup of each quartile changes. This approach controls for broader credit depth increases within most developing countries over time.

17
Figure 11: DFI commitments by country income status
Figure 12: DFI commitments by fragility

18
Figure 11: DFI commitments by domestic credit depth quartile

19
4. Policy Implications
It is important to repeat that we report data on trends and distributions of DFI finance for a subset of total DFI finance, focused on only one multilateral and DFIs that are all based in Europe or the US. These trends and distributions might look markedly different with a full set of DFIs. The following policy conclusions look likely to hold even with those caveats.
Bilateral DFIs are comparatively small—both compared to multilateral DFIs and to the size of their potential markets. This suggests, if they are looking for more observable impact they should find niches where they have a comparative advantage to serve a particular sector or client base and/or pool resources. CDC’s focus on fragile states is a particular example of this, although excluding OPIC, all of the bilateral DFIs in our sample are already outperforming the IFC in terms of the percentage of their commitments directed towards low income countries and fragile states. This is where private finance is most needed and likely to be most in need of the financing terms and political risk comfort provided by DFIs. Analysis of the IFC portfolio suggests that financial returns are as high in low income countries and fragile states as elsewhere. Perhaps this would change were the IFC or other DFIs to invest more heavily in those states (with the marginal project seeing lower returns), but there is not (yet) evidence of this problem suggesting the IFC could be more aggressive in these priority countries perhaps with the greater co-financing support of bilateral DFIs.
Bilateral DFIs might also want to focus on sectors where multilateral development banks face a comparative disadvantage—large hydro and fossil power might be examples in the energy sector.
Their focus on finance and power suggest that the DFIs are investing in the private sector’s biggest constraints according to the World Bank’s Enterprise Surveys: unreliable electricity and inadequate access to capital.21 At the same time, the comparative advantage that DFIs bring in terms of implicit guarantee and global technical knowledge may be less relevant for on-lending services to SMEs than large infrastructure, mining or manufacturing and services export projects, for example. DFIs as a whole might want to examine the extent to which this sector dominates because it is comparatively straightforward to put together deals rather than because it is where development impact of DFI involvement is likely to be greatest
21 In an ideal world, development finance institutions (DFIs) should focus on the biggest constraints for businesses in developing countries. This helps to expand their impact beyond a single project or investment, thereby producing more systemic benefits. However, this is a particularly challenging issue for many DFIs given their operating models, which are typically driven by investor priorities. Benjamin Leo, “Is OPIC Focused on the Private Sector’s Biggest Constraints?,” Center For Global Development, US Development Policy, (May 12, 2016), https://www.cgdev.org/blog/opic-focused-private-sectors-biggest-constraints.

20
Appendices
Appendix 1: Comparison between Project-level Data and Reported Data
Several of the datasets are incomplete because of significant mismatches between our dataset and topline numbers of annual commitments provided by the DFI. While some mismatch is to be expected due to differences in currency conversion and adjusting for inflation, the datasets are clearly not capturing some projects.
Figure 12 compares the project-level data with reported commitment levels. The former refers to commitments for which we have project-level data. The latter refers to reported annual commitment levels, taken from annual reports and other topline reports.
Figure 12: Commitments with Project-Level Data versus Reported Commitment Levels
CDC Group: The data in from the CDC Group’s IATI submission seems to be complete. Matched up data to with CDC Group’s annual reports and found that year-end numbers in the reports generally matched up with aggregates of project-level data. The average

21
difference between annual commitments in our dataset and reported from CDC’s annual reports annual commitments is 55 million per year.
DEG: There is a significant mismatch between the project-level data and the country-level data. The project-level data is not complete; there is $837 million in DEG commitments more included in the topline numbers for 2015 and 2016 than in the project-level data.
FMO: The scraped list of commitments relatively closely matches to FMO’s topline numbers of annual commitments provided in annual report, particularly from 2013 to 2016. In 2016, we identified $1.6 billion in new commitments, and the annual report claimed $1.7 billion in new commitments. The average difference between annual commitments in our dataset and the reported topline numbers between 2013 and 2016 is $57 million.
IFC: The majority of IFC financing is accounted for in the dataset. We compared the list of projects to topline numbers of IFC commitments from the annual report [rephrase], and we found that our dataset underestimates IFC commitments by an average of 367 million per year.
OPIC: The projects listed in the annual report data sum to the topline annual commitment numbers from OPIC. There are several projects without corresponding PDF project summaries.
Proparco: The dataset consistently overestimates the reported commitment levels provided in Proparco’s annual reports and financial reports.

22
Appendix 2: A Note on Methodology
The disclosure policy, methodology for collecting data, and additional notes for each DFI are below, along with additional methodological notes:
CDC Group
• Policy: Under CDC’s 2015 Disclosure and Access to Information Policy, the CDC Group publishes and regularly updates information on direct investment information, including the name of the investment, the location of the investment, the sector of the investment, the description of the investment, and CDC’s commitment to the investment.
• Data sources: The base list of data comes from CDC Group’s submission to the International Aid Transparency Initiative (IATI). The CDC Group’s submission provides project-level data for 2012-2016 on the financing instrument, amount of financing, and the country. Additional data to identify the NAICS sector come from annual reports and an online database of projects. We manually assigned NAICS sectors based on project descriptions from annual reports and an online database of projects.
• Additional notes:
o Downstream investment data: CDC Group’s list of online investments also provides data on downstream investment funds. In this analysis, we chose to focus only on direct investments
DEG
• Policy: Beginning in January 2015, DEG began releasing project-level data (referred to as “investment-related information” in their policy), including the name of the client, the sector, the volume of financing, and the environmental and social category. DEG also provides annual commitments by region and country for the past five years.22 CDC Group also uploads project-level data to IATI.
• Data sources: The DEG data is unique because it consists of two separate datasets: (1) a country-level dataset from 2012 to 2016 and (2) a project-level dataset with data from 2015 and 2016. Country-level data is taken directly from DEG’s website, which details the total annual commitments by country and year. A separate page offers PDFs with project-level data for 2015-onward: Provides project-level data on client, funding objective, rationale for financing, total financing, sector, and environmental & social category. We manually assigned the NAICS sector and the instrument based on the project descriptions and which projects are included in DEG annual reports as investment holdings.
22 DEG, “Guide for DEG Customers about DEG’s Disclosure Policy,” KfW, December 2014, https://www.deginvest.de/International-financing/DEG/%C3%9Cber-uns/Verantwortung/Disclosure-policy/.

23
FMO
• Policy: Under FMO’s Disclosure Policy, FMO posts project-level data (referred to as investment level information) on the client, the sector, the amount of financing, the fund, the environmental and social category, and a project description. This policy went into effect in January 2013 and was partially revised in January 2016. FMO also provides early disclosure to all projects with an Environmental and Social risk category of A or B+.23 FMO is an IATI signatory and intends to report all projects to IATI as of January 2016. FMO’s IATI disclosure only consists of 85 projects from quarter 2 of 2017.
• Data sources: To build the dataset, we used a web scraping tool to extract information from FMO’s World Map (previously a Project List). The World Map contains webpages for each project with information on the client, funding objective, rationale for financing, FMO financing, sector, and environmental & social category. We manually assigned NAICS sectors based on the project description. Unlike some of the other DFIs, FMO does not provide a list of projects in its annual reports.
• Additional notes:
o No instrument data: FMO’s project-level information does not provide data on instrument. We attempted to identify the instrument based on the project description, but there was insufficient data to consistently identify instrument, so we omit FMO from analysis on instruments.
IFC
• Policy: Under the IFC’s 2012 Access to Information Policy, IFC is responsible for making available project-level data on direct investments and advisory services projects.24
• Data sources: IFC currently uploads project documentation onto IFC’s Disclosure Portal. We assembled a dataset of IFC projects by downloading all Summaries of Investment Information and Summaries of Advisory Services Project Information documents from the Portal, along with supplemental data from the World Bank’s database of Advisory Services projects. This database includes project-level data on project name, project status, project country, company, environmental status, a project description, intended impact, reported results, IFC commitment by instrument, approval date, and sector. IFC provides a crosswalk between its internal sector classification and the NAICS sector classification. We used this crosswalk to
23 FMO, “Disclosure” (FMO, February 10, 2017), https://www.fmo.nl/l/library/download/urn:uuid:f75e4ebb-f48f-41a4-a779-c0c7f63a3a17/disclosure.pdf?format=save_to_disk&ext=.pdf. 24 IFC, “IFC Access to Information Policy” (IFC, January 1, 2012), http://www.ifc.org/wps/wcm/connect/98d8ae004997936f9b7bffb2b4b33c15/IFCPolicyDisclosureInformation.pdf?MOD=AJPERES.

24
assign NAICS sectors for IFC projects. We limited the projects in the dataset to only active or completed projects.
OPIC
• Policy: OPIC is required to publish multiple reports for Congress, but there does not seem to be a publicly available disclosure policy. OPIC began posting summaries of all OPIC-supported projects in the agency website in April 2009. OPIC also uploaded a downloadable excel file on OPIC’s portfolio in September 2016.
• Data sources: CGD built the OPIC Scraped Portfolio dataset in April 2016 to collect all publicly available OPIC project-level data. The methodology to build the dataset is available in the methodological note.25 To harmonize the dataset with the other DFI datasets, we assigned a NAICS sector. For projects in the OPIC portfolio as of September 2016, the NAICS sector is assigned by OPIC. For other projects, we manually assigned based on the project description and how OPIC had previously categorized projects.
• Additional notes:
o Guarantee projects: The OPIC annual reports, which serve as the base list of projects, specify whether the project is insurance, investment funds, or finance and does not specify whether finance projects are loan or guarantee financing. We surmised whether the financing was a loan or a guarantee based on the project description. In some cases, the PDF project summary explicitly specifies whether the project. In other cases, the project was part of a framework guarantee agreement. In cases where the financing instrument was not apparent, we assumed that the instrument was a loan, given that loans make up the majority of DFI commitments.
Proparco
• Policy: Proparco follows the Agence française de développement (AFD) Group’s transparency policy, which calls for project-level information to be published on the website by project, where acceptable. AFD Group’s transparency policy falls under the Social and Environmental Resonsibility (SER) policy adopted in January 2007.26
• Data sources: The base list of projects comes from Proparco’s annual reports, which provide lists of projects with a short description, Proparco commitment,
25 Ben Leo and Jared Kalow, “There Wasn’t a Decent OPIC Database, So We Spent Months Making One,” Center For Global Development, US Development Policy, (April 26, 2016), https://www.cgdev.org/blog/there-wasnt-decent-opic-database-so-we-spent-months-making-one; Ben Leo and Jared Kalow, “OPIC Scraped Portfolio Database: Methodological Note” (Center for Global Development, April 26, 2016), https://www.cgdev.org/sites/default/files/OPIC-Data-Methodological-Note_CGD.pdf. 26 AFD, “Information and Transparency,” AFD, accessed August 18, 2017, http://www.afd.fr/lang/en/home/AFD/redevabilite-dialogues/politique-transparence; Proparco, “Transparency,” Proparco, May 2016, http://www.proparco.fr/lang/en/Accueil_PROPARCO/financement-responsable/transparence-proparco.

25
sector, and country. However, the annual reports do not provide project or client names. Additional data comes from an interactive Cartographie des Projets (Carte), which offers in depth project-level data (including client information, the type of Proparco financing, funding objective, and rationale for financing). The Carte includes all projects from January 2014-present, as well as some projects between 2005 and 2013. We matched up projects from 2012 to 2016 between the Annual Report and the Carte to create the fullest dataset available with publicly available data. We manually assigned NAICS sectors based on the project description.
• Additional notes:
o Room for error in matching projects: Matching the Carte and the annual reports required some guesswork, leaving room for error. We the project location, the sector, project description, and amount of Proparco financing to match the projects, but there were some cases where there were not clear matches. There are some projects where we could not identify a corresponding project from the Carte.
o Difficulties in identifying financing instrument: Until 2014, the project description in the annual report clearly identifies the financing instrument. For 2015 and 2016 projects, we identified the instrument using the Carte. If we could not identify a matching project from the Carte, we assumed that the instrument was a loan, given that loans make up the majority of DFI commitments.
o 2016 commitments: Proparco has yet to release its annual report for 2016, so the list of Proparco projects is entirely based of projects in the Carte.
Other European Development Finance Institutions (EDFI) Members
EDFI is an association of 15 European bilateral DFIs, based in Brussels. In addition to the CDC Group, DEG, FMO, and Proparco, the EDFIs include BIO (Belgium), COFIDES (Spain), FINNFUND (Finland), IFU (Denmark), Norfund (Norway), OeEB (Austria), SBI-BMI (Belgium), SIFEM (Switzerland), SIMEST (Italy), SOFID (Portugal), and Swedfund (Sweden). Data on commitments levels for other EDFIs come from the 2016 EDFI Flagship Report, which provides annual commitments for 2012-2015, and annual reports of the other DFIs, which provide commitment levels for 2016. We were unable to find 2016 commitments levels for BIO, BMI-SBI, SOFID, and Swedfund, so we used the 2015 commitment level as a proxy.
Supplemental Country-level Data
In addition to the project-level DFI data, we supplemented the project-level DFI data with country-level data on World Bank income category, World Bank lending category, fragility, and domestic credit depth. The historical income category and lending category classifications, as well as the data on domestic credit depth are sourced from the World

26
Bank.27 The country classifications based on fragility is sourced from the OECD, which harmonizes several separate fragility databases.28
Identifying Co-financed Deals
To identify co-financed deals, we matched projects across DFIs using a simplified project name string, the year of financing, and the country and region of financing. To create a simplified project name, we stripped the project name string of all non-alphabetical characters and restricted the project name to the first twelve characters.
To check the results, we identified all of IFC’s co-financed projects by identifying all mentions of other DFIs in the IFC dataset’s “cost nature” column, which describes commitments by other parties, including DFIs. All manually identified co-financed projects were identified using the string-matching method described above.
27 World Bank, “World Development Indicators 2016” (World Bank, 2016), https://openknowledge.worldbank.org/handle/10986/23969; World Bank, “How Does the World Bank Classify Countries?,” World Bank Group, 2017, https://datahelpdesk.worldbank.org/knowledgebase/articles/378834-how-does-the-world-bank-classify-countries. 28 OECD iLibrary, States of Fragility 2016: Understanding Violence., 2016, http://dx.doi.org/10.1787/9789264267213-en; John Norris, Casey Dunning, and Annie Malknecht, “Fragile Progress: The Record of the Millennium Development Goals in States Affected by Conflict, Fragility, and Crisis” (Center for American Progress, June 8, 2015), https://www.americanprogress.org/issues/security/reports/2015/06/08/114296/fragile-progress/.

27
References
AFD. “Information and Transparency.” AFD. Accessed August 18, 2017. http://www.afd.fr/lang/en/home/AFD/redevabilite-dialogues/politique-transparence.
DEG. “Guide for DEG Customers about DEG’s Disclosure Policy.” KfW, December 2014. https://www.deginvest.de/International-financing/DEG/%C3%9Cber-uns/Verantwortung/Disclosure-policy/.
EDFI. “EDFI Flagship Report 2016.” European Development Finance Institutions, July 7, 2016. http://www.edfi.be/publications/all.html.
FMO. “Disclosure.” FMO, February 10, 2017. https://www.fmo.nl/l/library/download/urn:uuid:f75e4ebb-f48f-41a4-a779-c0c7f63a3a17/disclosure.pdf?format=save_to_disk&ext=.pdf.
IFC. “IFC Access to Information Policy.” IFC, January 1, 2012. http://www.ifc.org/wps/wcm/connect/98d8ae004997936f9b7bffb2b4b33c15/IFCPolicyDisclosureInformation.pdf?MOD=AJPERES.
Leo, Ben, and Jared Kalow. “OPIC Scraped Portfolio Database: Methodological Note.” Center for Global Development, April 26, 2016. https://www.cgdev.org/sites/default/files/OPIC-Data-Methodological-Note_CGD.pdf.
———. “There Wasn’t a Decent OPIC Database, So We Spent Months Making One.” Center For Global Development. US Development Policy, April 26, 2016. https://www.cgdev.org/blog/there-wasnt-decent-opic-database-so-we-spent-months-making-one.
Leo, Benjamin. “Is OPIC Focused on the Private Sector’s Biggest Constraints?” Center For Global Development. US Development Policy, May 12, 2016. https://www.cgdev.org/blog/opic-focused-private-sectors-biggest-constraints.
Leo, Benjamin, and Todd Moss. “Inside the Portfolio of the Overseas Private Investment Corporation.” Policy Paper. Center for Global Development, April 2016. https://www.cgdev.org/sites/default/files/CGD-Policy-Paper-81-Leo-Moss-Inside-the-OPIC-Portfolio.pdf.
Leo, Benjamin, Todd Moss, and Beth Schwanke. “OPIC Unleashed: Strengthening US Tools to Promote Private-Sector Development Overseas.” Rethinking US Development Policy. Center for Global Development, August 2013. https://www.cgdev.org/sites/default/files/OPIC-Unleashed-final.pdf.
Norris, John, Casey Dunning, and Annie Malknecht. “Fragile Progress: The Record of the Millennium Development Goals in States Affected by Conflict, Fragility, and Crisis.” Center for American Progress, June 8, 2015. https://www.americanprogress.org/issues/security/reports/2015/06/08/114296/fragile-progress/.
OECD iLibrary. States of Fragility 2016: Understanding Violence., 2016. http://dx.doi.org/10.1787/9789264267213-en.
Proparco. “Transparency.” Proparco, May 2016. http://www.proparco.fr/lang/en/Accueil_PROPARCO/financement-responsable/transparence-proparco.

28
Savoy, Conor M., Paddy Carter, and Alberto Lemma. “Development Finance Institutions Come of Age: Development Finance Institutions Come of Age Policy Engagement, Impact, and New Directions.” Center for Strategic and International Studies, October 2016. https://www.csis.org/analysis/development-finance-institutions-come-age.
World Bank. “How Does the World Bank Classify Countries?” World Bank Group, 2017. https://datahelpdesk.worldbank.org/knowledgebase/articles/378834-how-does-the-world-bank-classify-countries.
———. “World Development Indicators 2016.” World Bank, 2016. https://openknowledge.worldbank.org/handle/10986/23969.