comparing international financial reporting standards ... · comparing international financial...
TRANSCRIPT
Comparing International Financial Reporting Standards (IFRSs)
and Greek GAAP: financial statements effects
I. Tsalavoutas1
Abstract Greek GAAP differ substantially from IFRSs and on the basis of recent accounting developments, the present study considers both quantitative and qualitative approaches for analysing the reconciliation statements provided by the Greek listed companies on transition to IFRSs. Qualitative analysis includes description of the differences between Greek GAAP and IFRSs. Quantitative approaches include the use of Gray’s conservatism index (1980) for examining the impact caused on companies’ financial position and financial performance. The findings suggest that the implementation of IFRSs did indeed have a significant impact on the financial position of Greek listed companies with reference to shareholders’ equity, as well as gearing and liquidity ratios. Seven standards, appearing in more than 50% of the companies examined, have significant contribution on these effects. However, in relation to impact on performance, with reference to net income and Return on Equity, the results are inconclusive. The findings of this study suggest that the subject requires further investigation especially in respect of compliance with IFRSs disclosure requirements. It is apparent that many companies provide inadequate disclosures in respect of the transition to IFRSs. This issue appears to be significantly related to the auditing firms have reviewed companies’ accounts.
Draft paper – Please do not quote without author’s permission
1 The author is PhD candidate at the University of Edinburgh. He is grateful to the Institute of Chartered Accounts of Scotland (ICAS) for funding the present study, to Lisa Evans, David Hatherly, Paul Andre and Mike Smith for helpful comments and to two interviewees for key background information. Correspondence or enquiries should be addressed to Mr Ioannis Tsalavoutas, University of Edinburgh, 16 Buccleuch Place, EH8 9JS, Telephone 0131 650 4606, e-mail [email protected]
1

1. Introduction In accordance with Regulation (EC) No 1606/2002 of the European Parliament and of the Council of 19 July 2002 all publicly traded companies have to prepare their consolidated accounts on the basis of International Accounting Standards (IASs)/ International Financial Reporting Standards (IFRSs)2. This regulation applies from the financial year commencing 1st of January 2005. In Greece, Law 3301/2004 introduced this Regulation to all Greek listed companies’ accounts, including individual company accounts3.
In accordance with IFRS 1 “First time adoption of International Financial Reporting Standards”, first IFRS financial statements should provide at least one year comparatives under IFRSs (para 36). Moreover, they should explain how the transition from previous GAAP to IFRSs affected companies’ reported financial position, financial performance and cash flows by providing reconciliation statements (paras 38-43).
Drawing on the comparative figures and reconciliation statements for the financial year ended 31st December 2004, the present study aims to identify and evaluate the materiality of the impact of IFRSs adoption on companies’ financial position and performance for the financial year 2004, and to examine individual standards’ effects on shareholders’ equity. Given the differences between Greek GAAP and IFRSs (see below), I assumed that the Greek companies’ financial position and results would have been affected considerably.
This study makes the following contributions: It provides a review of the current Greek accounting rules and regulations and in-depth comparison of the de jure differences between the two GAAPs. Secondly, it provides a methodological contribution by employing Gray’s comparability index not only on shareholder’s equity and earnings, but also on key financial indicators: Return on Equity (ROE); gearing and liquidity. Thirdly, it provides a benchmark for comparison with companies from other countries, especially those with stakeholder accounting regimes such as Germany and France, which are also facing the transition to IFRSs under a mandatory environment. Finally, investors and analysts will benefit from the findings since I examine and explain which accounting standards affect companies’ financial position most.
The remainder of the paper is organised as follows. Section 2 provides an overview of the background to the Greek accounting environment. In section 3 earlier literature pertinent to my study is reviewed. Section 4 discusses the de jure differences between IFRSs and Greek GAAP and introduces my research hypotheses. Section 5 describes the data and research methods employed, and section 6 summarises the findings. In section 7 I discuss the limitations of the study and section 8 forms the concluding remarks.
2 IASs were issued by the International Accounting Standards Committee (IASC). Since 2001 the International Accounting Standards Board (IASB) has been issuing IFRSs. Many IASs are still in place. 3 This also applies in Italy, the Czech Republic, Estonia, Lithuania, Malta, Slovakia and Slovenia (Bertoni and De Rosa, 2006). For Greece, my interviewees (see below) suggested that this was the case because IFRSs are considered to be higher quality standards and thus would improve comparability of information provided by companies.
2
2. The Greek Accounting Environment Background Greek culture, politics and economics remain affected by a duality of Eastern and Western influences (Caramanis, 2005; Ballas, 1998); in particular, the contrast between ‘a ‘modernising’ reform-minded, Westward-looking, pro-liberal culture and an ‘underdog’, Eastward-looking, anti-reform and pro-statist culture’ with ‘nationalist and xenophobic overtones’ (Caramanis, 2005:202-34). During the last two decades the traditional state corporatism has been modified by modernisation and neo-liberal, free market influences (Caramanis, 2005). Ballas et al. (1998, with reference to Doukas, 1993) stress the political significance of EC membership in 1981 in the transition to democracy in that harmonisation of legislation and institutions limits opportunities for diversion from Western norms. However the ‘underdog’ influence has by no means disappeared (Caramanis, 2005).
Historically, Greek accounting and commercial law have been strongly influenced by French precedents and developments (Ballas, 1994; Ballas et al., 1998). In 1980, in order to facilitate ascension to EU membership Greece adopted a General Accounting Plan closely based on the French Plan Comptable; this was amended in 1987 in accordance with the 4th and 7th EU directives5 (Ballas, 1994; see also Venieris, 1999).6 Ballas et al. (1998:278) suggest that ‘the Greek Accounting Plan was addressed to an international audience while domestic affairs of taxation and its related bookkeeping remained an exclusively Greek domain’. In fact, with regard to accounting regulation, ‘the Greek state has demonstrated a remarkable degree of autonomy from societal interests’ (Ballas et al., 1998:274). Interest groups are weak, and professional bodies’ interest is indirect, through members with government responsibility (ibid.; see also Venieris, 19997).
Patronage has been a feature of the Greek state, bringing with it a lack of trust and a perception that it is not pursuing the public, but rather sectional interests. This leads to ambivalent behaviour by its citizens: a pursuit of state favour as well as attempts to cheat the system (Ballas et al., 1998, with reference to Charalambis, 1996 and Tsoukalas, 1993), which in turn leads to increased regulation (Ballas et al., 1998). Thus Greece represents a low trust society, which is detrimental to self-regulation of accounting, or trust in the ‘true and fair view’ of financial statements, but requires state regulation and extensive rules, which however increase monitoring costs and distrust (Ballas et al., 1998). This leads to ‘formalism’, which is ‘defined as an excessive adherence to prescribed forms and the use of forms without regard to inner significance’ (Ballas et al., 1998:279). Further:
‘… formalism in Greek accounting is a defining characteristic. It provides reporting entities with ground rules on what is ‘acceptable’ in a manner which can be communicated easily without having to document why a
4 With reference to prior literature: Diamantouros, 1993; Faubion, 1993; Herzfeld, 1987, 1993; Mouzelis, 1978, 1986, 1995. 5 The implementation of the 7th Directive came into force in 1990. There was no previous legal requirement for group accounts (Papas, 1993). 6 Significant differences between Greek and French accounting plans exist in particular in the objectives: in France these are still largely the collection of macro-economic data, in Greece fiscal objectives (Ballas et al., 1998). 7 Venieris (1999) provides an overview of the accounting rule-making process and the agencies involved in accounting rule-making in Greece.
3
specific alternative (disclosure, valuation rules, etc.) is preferred. The existence of a thick rule book allow preparers to claim that ‘rules are rules’ and close the discussion’ (Ballas et al., 1998:279).
The taxation system is ‘a nebulous system of conflicting laws, court decisions
and ministerial decisions, which clearly panders to special interests’ (Ballas, 1994:110). The close link between accounting and taxation and the fact that taxes are perceived to be unfairly high, results in tax avoidance and evasion as well as creative accounting (Baralexis, 2004:442). Tax adjustments (such as accelerated depreciation) in financial statements (Venieris, 1999) further distort companies’ results. The Profession The accounting/audit profession is relatively young and weak (Baralexis, 2004). Ballas et al. (1998) suggest that capital was not involved in the decision to create the initially ‘quasi-civil service’ (Ballas, 1994:116-7) auditing profession,8 but rather that the state was the main constituency for audit services, which were perceived as ‘a technology that could help the state root out dishonest business practices and increase tax revenues’ (Ballas, 1998:716) and as ‘an instrument of social control’ (ibid.:733). Auditing was, until reformed in 1992, not effective, with auditors subjected to management pressure (Baralexis, 2004), auditor liability (until 2000) very limited (Baralexis, 2004) and qualified audit reports disregarded (Ballas, 1994:117). Since 1992, the jurisdiction of the statutory audit has been opened to private auditing firms, including international firms (see Ballas, 1994, 1998; Caramanis, 2002). Since then the audit market has grown considerably and is subject to fierce competition (Leventis and Caramanis, 2005; Leventis et al., 2005), however, the effectiveness of auditing has recently been questioned, leading the profession to take new regulatory measures (see Leventis and Caramanis, 2005). In 2003 (Law 3148/03) the Accounting Standardisation and Auditing Committee (ELTE) was established. This Committee reports to the Minister of Finance and National Economy and deals inter alia with professional ethics, audit quality and accounting regulation implementation guidance. Its activities are carried out by the Board of Accounting Standardisation and the Board of Audit Quality (Art. 1-5). Companies, corporate governance and the stock exchange Greek company law recognized two main types of company: the Anonymi Etaira (AE, approximately comparable to the French Société Anonyme) and the Etairia Periorismenis Efthynis (EPE - approximately comparable to the UK Limited Liability Company) (Ballas, 1994). Management performance is poor with losses common, leading to a need ‘to raise funds (especially working capital) from the debt-orientated capital market’ (Baralexis, 2004:443, with reference to the Federation of Greek Manufacturing, 1999). Banks are the main capital provider for Greek companies (Venieris, 1999). Features of bank lending are the importance of collateral, personal relationships, political intervention and social criteria9 as well as special rules/advantages for SMEs (see e.g. Ballas, 1994; Ballas et al. 1998; Baralexis, 2004). Debt financing leads to conservatism and an emphasis on historical costs: ‘This has torpedoed many attempts to modernize accounting policies, especially in the area of disclosure’ (Ballas, 1994:114). 8 In fact, when a statutory audit requirement was introduced for listed companies in 1959, 40 out of 76 companies delisted (Ballas, 1998). 9 Such as number of employees (ibid.).
4
However, Greek legislation on corporate governance has been updated to cover many aspects of corporate governance rules applied in other European countries. Specifically, the board of directors must be made up of at least 1/3 non-executive members of which at least two must be independent. Legislation also covers mandatory related parties’ disclosures and specific requirements in respect of formalizing companies’ internal procedures (investors’ relations, procedures of employing managerial staff and the organisation and establishment of internal auditing committees (Iliokaftos, 2005).
The Athens Stock Exchange (ASE) was founded in 1876 and since 2000 has been considered a developed market (Mandikidis, 2000), in spite of a collapse in 2000-2003. In September 2006 FTSE classified Greece in the ‘watch list’, meaning it may change status to ‘Advanced Emerging Market’ (no earlier than March 2008). At the end of 2006, 317 companies were listed with a total market capitalisation of €158 billion of which 46% belonged to foreign investors (Central Security Depository, 2006). ASE’s major indices are: Main index, FTSE 20, FTSE Mid 40 and Small Cap 80. In November 2005, ASE was aligned with the International Classification Benchmark (ICB10) and since 2 January 2006 Greek listed companies are disaggregated across 17 ‘super-sectors’ (henceforth: sectors). This fact allows comparison of the Greek sectors with the corresponding ones in international stock exchanges such as NYSE, NASDAQ, Euronext and LSE.
The capital market is regulated and supervised by the Hellenic Capital Market Commission (HCMC). HCMC is also authorised to provide accreditation and professional qualifications to fund managers, investment analysts, investment consultants and share traders (Law 2836/00). HCMC’s operations are regulated by PD 25/03 and Law 3152/03. The latter transferred the supervisory responsibilities of the Ministry of National Economy to the HCMC. It now officially operates as an independent body although the influence and the supervision of the Ministry of National Economy have been maintained. HCMC was one of the founding members of Forum of European Securities Commissions (FESCO) which preceded the Committee of European Securities Regulators (CESR). Additionally, it is member of the International Organisation of Securities Commissions (IOSCO).
Financial reporting and Transition to IFRSs Financial Reporting in Greece is traditionally closely linked to taxation (Michalatos, 2001).11 According to the Tax Law (PD 186/9212), companies’ fiscal year should be of 12 months ending either on 30 June or 31 December (Art. 26). Legislation (Law 2190/20 and PD 360/85) also contains detailed regulation on the publication of full and summarised financial statements. Law 3229/04 (amending Law 2190/20), introduced the mandatory implementation of IFRSs by all Greek listed companies from 1 January 2005.13 In February 2006 the HCMC, following auditors’ and companies’ requests in relation to the difficulties of providing financial statements under IFRSs, abolished the early publication date for summarised financial statements (two months after the year end) but effectively brought forward the required
10 ICB breaks into four levels of classification consisting of 10 Industries, 18 Super-sectors, 39 sectors and 104 sub-sectors. The Greek sectors are comparable to 17 of the ICB Sectors (ASE, 2005). 11 See Ballas et al. (1998) for a critical interpretation of the Greek state’s utilisation of accounting books for tax collection purposes. 12 Also known as Code of Books and Records. 13 An earlier (2002) law intended to implement IASs/IFRSs for Greek listed companies never came into force.
5
publication date for full financial statement (to three months after the year end) (Decision 6/372/15.2.06, Law 3461/06). Subsequently, at the end of March 2006 the first set of annual financial statements of Greek listed companies prepared in accordance with IFRSs became available. 3. Literature Review Studies using reconciliation statements Gray (1980) provided the first study attempting to quantify the impact of different national accounting practices on profit measurement by means of a ‘conservatism index’: 1 - [(RA – RD) / |RA|], where RA = adjusted profits and RD disclosed profits. Thus Gray’s study differed from other studies of harmonization (e.g. van der Tas, 1988; Archer et al., 1995) which instead calculate the incidence of accounting differences (Weetman et al., 1998; Street et al., 2000). Measuring post-tax profits as disclosed in French, German and UK financial statements against these profits as adjusted for international financial analysis,14 Gray found that French and German companies’ results were more conservative than the results of the UK companies.
Gray’s seminal work has been widely replicated and extended, in particular by studies using of companies’ form 20-F reconciliations to US GAAP (Weetman and Gray, 1990; 1991; Cooke, 1993; Hellman, 1993, etc.). Breaking the index down into partial indices (Weetman and Gray, 1990, 1991; Norton, 1995; etc.) also permitted the measurement of the impact of specific adjustments or reconciling items.
Adams et al. (1993) extended the use of the index and of partial indices also to measuring conservatism in equity (see below). Hellman (1993) and Whittington (2000) additionally examined return on equity (ROE). Whittington’s study focused on only two companies - one British, one French - from the same industry comparing US GAAP reconciliations, and found that such reconciliations to a common GAAP only have limited benefits for financial analysis. Hellman (1993) expected a conservative accounting regime to yield lower profits and lower equity (than a less conservative regime), and that this dual effect would smooth out any effect on ROE; however this was not borne out. Also Norton (1995:199) finds that ‘the hypothesis that U.S. GAAP is more conservative than Australian financial reporting practice is not supported in terms of impact on profits, but is supported in terms of the impact on shareholders’ equity’.15 To emphasise the index’s use as a measure of comparability (without judging relative conservatism), Weetman et al. (1998) rename the index ‘comparability index’, a terminology which is adopted by subsequent studies.
While earlier studies consider the materiality of adjustments (see esp. Weetman et al., 1998), such materiality is a specific focus of Adams et al. (1999), who find that while UK reported net income was higher, and UK shareholders' equity lower, than those reported under US GAAP, the majority of adjustments was not material. (Adams et al. (1999) therefore challenge the assumption of the usefulness of US GAAP reconciliation statements.)
Adams et al. (1993) was the first study employing the index in comparing national GAAP with IAS, and found Finnish balance sheet equity measure to be more
14 The ‘European Method’ developed by the European Federation of Financial Analysts Societies. 15 Traditional definitions of conservatism imply understatement of book values and earnings figures, however, differences in earnings figures are temporary and will eventually reverse (Garcia Lara and Mora, 2004). Garcia Lara and Mora therefore distinguish between balance sheet conservatism and earnings conservatism, the former implying understatement of the book value of equity, the latter a desire to require a higher degree of verification for recognition of good news than for bad news (ibid.).
6
conservative than IAS adjusted measure. However, results for profit measures were largely not statistically significant. They also found that the Finnish companies’ IAS reconciliations offered only limited benefits to financial statement users, mainly because of inconsistent presentation and inadequate explanations. From the late 1990s comparability studies increasingly focused on IAS/IFRS. Initially studies provided descriptive comparisons of IAS measurement rules with those of UK and US GAAP (Weetman et al., 1998) and of the EU directives (Adams et al., 1999). Weetman et al. (1998) found that US GAAP and IAS were becoming more closely aligned as part of the IASB’s core standards programme. Such convergence was subsequently confirmed by empirical findings. Street et al. (2000), Ucieda Blanco and Garcia Osma (2004) and Haverty (2006) thus measure the difference between IAS/IFRSs and US GAAP based earnings of non-US companies with US listings. One important additional finding of Street et al. was that auditors do not always report on incomplete compliance with IAS. Haverty’s findings, based on the financial statements of Chinese companies listed on the New York Stock Exchange, suggest that while there is movement towards convergence, de facto a lack of comparability between US GAAP and IAS financial statements prepared by these Chinese companies still exists, mainly due to revaluation of fixed assets under IFRSs but not under US GAAP. The study by Ucieda Blanco and Garcia Osma (2004) covers a longer time period than that by Street et al. (2000), including the transition to the IAS 1 revised (1997) and finds that although the number of adjustments increased, their overall materiality declined, and that differences appear to be narrowing.
Among studies not applying the comparability index, Chen et al. (1999) found that during 1994 to 1997 Chinese GAAP earnings were considerably higher than IASs based earnings for companies reporting under both. Changes to Chinese GAAP effective from 1998 however led the authors to expect a reduction in differences after the period investigated. Hung and Subramanyam (2006) examined the impact of voluntary IAS adoption among German companies during 1998 to 2002. They make use of the fact that the financial statements prepared under German accounting rules for the year preceding change to IAS have to be restated on the basis of IAS as comparatives for the year of transition. In line with expectations, they found higher balance sheet conservatism (and income smoothing) under German accounting rules.16 In a different setting, the same approach was adopted by Goodwin and Ahmed (2006) to examine the transition from Australian GAAP to Australian IFRSs looking at any relationship between firm size and impact from transition to the new accounting regime. Descriptive statistics were used to capture the impact on major balance sheet and income statement items, on reconciling items and income variability. They report that ‘more than half of small firms have no change in net income or equity from A-IFRS and that small firms experience higher earnings variability than medium-sized or large firms under A-IFRS’ (Goodwin and Ahmed, 2006:460).
The recent transition of European companies to IFRSs as a result of the EU Regulation is now giving rise to studies attempting to capture the impact of this, making use of the 2004 financial statements, initially prepared on the basis of national GAAP and restated under IASs as comparatives for the 2005 financial statements. Thus focusing on the 2004 financial statements of companies listed on the Milan stock exchange, Bertoni and De Rosa (2006), applying Gray’s index to net income, equity, ROE, and partial adjustments, find that Italian GAAP is more conservative
16 This study also reports on the respective value relevance of both sets of financial statements.
7
than IFRSs, but that this result is not as strong as had been expected. ‘the Italian accounting system does not produce measures systematically more conservative than those derived by the adoption of IFRS’ (ibid.,: 16). Asbitt (2006) made use of the reconciliations of 2004 balance sheets of the FTSE 100 companies under UK GAAP to these balance sheets restated under IFRSs. Not using the comparability index, she examined the effect of the transition on net assets and on individual balance sheet line items. She found that there was no overall significant effect on equity, but that the effect varied for different companies, with no apparent industry effects. Further, ‘the effect of the change in convention on individual line items could have important consequences for financial analysis and contractual obligations’ ((ibid.:117). Lopes and Viana (2007) found, with reference to the comparability index, that the transition to IFRSs had led to less conservative reported profits for Portuguese listed companies. The authors noted also poor compliance with disclosure recommendations and inconsistently presented reconciliations.
With reference to partial indices, prior literature identifies two ways of classifying adjustments reported within the reconciliation statements: a standard approach or a transaction approach The first combines adjustments with reference to the standard which requires the adjustments (see Weetman and Gray, 1990; Adams et al., 1993; Weetman et al., 1998; Street et al., 2000; Bertoni and De Rosa, 2006; and Asbitt 2006), while the second does so with reference to the specific transactions giving rise to the adjustment (see Ucieda Blanco and Garcia Osma, 2004). Studies on the Greek market I have identified two prior studies which examine transition to IFRSs in Greece. Both are non-academic studies published in Greek and not available in the English language.
The first of these was carried out by the HCMC in May 2006. It examined the impact of transition to IFRSs, in terms of percentage changes, on revenues, earnings and shareholders’ equity of Greek listed companies. The study reports its results across 11 sectors but not according to the ICB industry classification employed here. It used the ASE’s industry classification as at 31st December 2005. This means its findings cannot be compared to this or similar studies on IFRSs implementation in other countries which have adopted the ICB classification. Unlike the present study it does not examine the impact on financial indicators and as it was not intended for an international (academic) audience, it also only provides a very brief discussion of the differences between Greek GAAP and IFRSs. Its analysis follows a transaction, and not a standard approach as I do here for reporting the adjustments disclosed in the reconciliation statements. However, like the present study, it reports frequency and significance in value only in respect to adjustments to shareholders’ equity.17 It acknowledges as limitation the poor quantity and quality of disclosures provided by companies.
The findings of HCMC’s study, which does not exclude outliers, reveal that on average, under IFRSs, equity was 2.44% higher and profit after tax 6.16% higher. The aggregate impact on revenues was not material (decrease of 0.49%; although the Constructions sector was materially affected with an increase of 27.63%). The strongest impact on shareholders’ equity was caused by adjustments to tangible assets, 17 According to the anonymous key informant interviewee, this was for two reasons: Firstly, the HCMC attributes higher importance to the impact on shareholders’ equity. Secondly, because of timing and resource constraints: the study was published just one month after the publication of companies’ annual financial statements.
8
deferred tax assets and liabilities, and intangible assets. The most frequent adjustments were recognition of deferred tax assets and liabilities, derecognition of start up costs capitalised as intangible assets and recognition of pension liabilities. Reconciliation adjustments were presented inconsistently and “other” appeared as an adjustment for 52% of companies. This included both positive and negative adjustments which cannot be identified by the reader. As a result, the fact that a high degree of subjective judgment is required to assess the impact of adjustments is mentioned as a limitation of the study (HCMC, 2006).
In June 2006, Grant-Thornton published a more comprehensive study which also reports the differences on earnings and shareholders’ equity.18 It also does not exclude outliers and found that 54% of firms reported a positive impact on equity. The impact on small companies (small cap 80 index) tended to be negative, that on the two other indices (FTSE 20 and FTSE Mid 40) positive. The effect on net profit was an increase of 4%. The study reports that the most significant positive adjustments related to fixed and deferred tax assets. The most significant negative adjustments related to the recognition of liabilities for employee benefits, impairment losses on loans and receivables and derecognition of start-up costs previously capitalised.
Again some subjective judgment was required in assessing the impact because of deficiencies in format and content of the disclosures. It is indicative that the study reports 20 key areas where companies’ recognition, measurement, and disclosure practices fall short of IFRSs (discussed in sections 4.1.2.2 and 4.1.2.3). Although the findings are presented inter alia for the 10 ICB sectors; the constituents of ICB industries and ASE’s indices are those as of the end of May 2006. Accordingly, the findings are not fully comparable to those presented here because of differences in the composition of the sectors used. The study focuses only on impact on earnings and equity and, similar to the HCMC study, very little reference is made to the differences between the two GAAPs. Moreover, the adjustments approach has been also followed here although a reference to the related standards is provided. Limitations of studies using reconciliation statements Prior research has identified a number of limitations of approaches based on reconciliation statements. One issue relates to the timing of studies: changes to national accounting regulations date findings and make comparison of earlier studies with later ones problematic.19 A major problem is non-uniform presentation of reconciliations, requiring researchers to restate data or make adjustments. This appears the case equally for US GAAP and for IAS reconciliation statements (see e.g. Weetman and Gray, 1990, 1991; Adams et al., 1999; Street et al., 2000; Ucieda Blanco and Garcia Osma, 2004; Aisbitt, 2006). Limitations of studies using US GAAP reconciliations relate to questions of whether companies with overseas listings are representative of quoted companies in their home country and their accounting principles of their domestic GAAP, as well as concerns regarding industry specific distortions (Norton, 1995). Also in some cases the small size of populations meant that studies had to adopt a case study approach (Weetman and Gray, 1991; Cook,
18 The findings of this study were later presented to the European Financial Reporting Advisory Group (EFRAG). Additionally, the results relating to small companies are more comparable to the findings of the current study as I exclude financials which are the bigger ones. 19 For example, amortisation of goodwill was one of the most material reconciling items between UK and US GAAP (e.g. Weetman and Gray, 1990, 1991), but this is likely to have been addressed by the UK’s FRS 10 (Weetman et al., 1998).
9
1993) or were conceived as pilot study (Hellman, 1993), rather than testing statistical significance of findings or case study Whittington (2000).
There is also a risk that the results reflect short-term timing differences, which may reverse in later accounting periods (Street et al., 2000). In prior studies this problem was overcome by examining data over a number of years, although as Norton (1995) points out, even then the window of analysis may be too narrow to allow for timing differences to be resolved. However, the current studies examining compulsory transition to IFRSs can only make use of the 2004 financial statements (see above). An additional problem for these and other studies using prior period comparatives is that this carries the risk of ‘noise’ introduced by prior period adjustments (Ucieda Blanco and Garcia Osma, 2004).
Further, de jure GAAP may differ from de facto accounting practice (Hellman, 1993; Norton, 1995, etc.). This needs to be taken into account when differences in de jure accounting regulation are examined and discussed in order to explain or contextualise empirical (comparison index) findings. As Norton (1995: 186) points out: ‘company accounts may continue to be influenced by older, presently unacceptable, accounting policies. Furthermore, companies may adopt a policy of non-compliance in relation to reporting requirements. In such cases reporting practice will differ from reporting requirements’. Similarly Street et al. (2000) found that sample companies violated IASs, although unqualified audit reports indicated compliance. However companies included in the sample had adopted IASs voluntarily and I could add as a reference the rest studies examined compliance with IASs after the implementation of IAS 1 revised which was expected to bring some improvement, as it prohibits companies claiming compliance unless they comply completely (ibid.) (see Street et al, 1999; Street and Bryant, 2000; Cairns, 2001; Street and Gray; 2001; Glaum and Street, 2003). 4. Differences between Greek GAAP and IFRSs and research questions Differences between Greek GAAP and IFRSs Greek accounting principles differ substantially from IFRSs and can be characterised as stakeholder-oriented and tax-driven (Ballas, 1994; Spathis et al., 2002). Whilst Greek GAAP follows a ‘prudent’ approach to asset valuation and liability recognition, IFRSs perceive shareholders as the main users of financial statements, promote the ‘fair value’ approach and are independent of tax reporting considerations (Spathis and Georgakopoulou, 2007). The main differences between IFRSs and Greek GAAP are summarised in Table 1.
Table 1 – About Here As is apparent from Table 1, the concepts of deferred tax, assets held for sale, investment properties, biological assets and biological produce are not recognised by Greek Law. Additionally, the fair value model is not considered. Land and properties can be revalued every four years, but only in accordance with government indices. Depreciation and amortisation rates for tangible and intangible assets are also specified by the government; the estimated useful life of assets is not considered. Start-up costs and interest during the construction period of properties are capitalised together with acquisition costs. Government grants are recognised within equity, proposed dividends are recognised as liabilities, pension deficits are rarely recognised and there are no specific requirements for hedge accounting. Finally, several consolidation differences exist between the two accounting regimes as interests in
10
joint ventures is treated as investment at cost, subsidiaries with different activities may be excluded from consolidation and the condition of significant influence is not considered for the consolidation of investments in associates (in cases of less than 20% interest). Research questions Taking into consideration the substantial differences between IFRSs and Greek GAAP, the following five research questions addressed by this study are:
1. Has the financial position and performance of Greek listed companies been materially affected by the transition to IFRSs?
Accordingly, my purpose is to identify the magnitude/materiality of the change on shareholders’ equity, net profit and return on equity. Additionally, the transition to IFRSs and the changes in companies’ financial positions may have an impact on their contractual obligations (Asbitt, 2006, with reference to Ormrod and Taylor, 2004). This becomes an important issue as in Greece banks are the main capital providers for companies. On that basis, the second research question is:
2. Have the liquidity and gearing of Greek listed companies been materially affected under IFRSs?
Having the opportunity to examine a relatively large sample of companies disaggregated across fourteen sectors, I explore the impact on the different sectors. Therefore the third research question is:
3. Is there a difference in the impact across the fourteen sectors and to what extent is the impact on different sectors material?
Although I have identified the major differences between the two sets of GAAPs (Table 1) I believe that the accounting, auditing, and investing communities are interested in knowing which IFRS cause a material impact. In other words do the changes in the bottom line figures derive from aggregate adjustments or did the implementation of particular standards cause distinct and material changes to companies’ financial position? Since, because of inconsistencies in presentation and lack of disclosures I was unable to examine the impact of individual standards on income statement reconciliations, my fourth research question focuses on equity, as follows:
4. To what extent the various standards cause a material impact on shareholders’ equity?
Following this, I examine the materiality of the impact (or any trends) caused by each standard and the frequency with which the standards appear in companies’ reconciliation statements across the different sectors. Subsequently, the fifth research question under examination is:
5. Which standards cause the most material impact and appear most frequently across the different sectors?
11
5. Research methods and data Research methods The present study adopts the comparability index for evaluating the impact of IFRSs on equity and earnings. I follow Hellman (1993), Whittington (2000) and Bertoni and DeRosa (2006) by also employing the index to explore differences in ROE, which is one of the most common performance measures. I expand on previous studies by exploring the impact of IFRSs recognition and measurement requirements on gearing and liquidity. Where Greek reported equity (or other) is compared to that reported under IFRSs, the index is expressed by the formula:
||1
IFRS
GRIFRS
EquityEquityEquity −
− (1)
In parallel to previous studies, a value larger than 1 suggests that equity under Greek GAAP is higher than equity under IFRSs, a value lower than 1 suggests that equity under Greek GAAP is lower than equity under IFRSs and an index value of 1.0 is neutral suggesting no change.
One limitation of the index is that it reports extreme values where equity under IFRSs approaches zero and equity under Greek GAAP is a relatively large amount (cf. Weetman et al., 1998; Street et al., 2000). However, the fact that the formula reports changes comparative to those used under the accounting concept of materiality outweighs the presence of such outliers (cf. Weetman et al., 1998; Street et al, 2000). In addition ‘materiality cannot be judged on a relative value basis when net income is small or the item causes a change from a small net income to a small net loss’ (Street et al., 2000: 45-6; cf. Weetman et al., 1998).20
I follow the prior studies in using as the denominator the ‘yardstick’ or benchmark of the adjusted equity (or other), i.e. here the equity (or other) as reconciled to IFRSs, because I assume that IFRSs are of higher quality than Greek GAAP, and because application of IFRSs is now required by EU and subsequently Greek law. Therefore an international investor would view any differences between Greek GAAP and IFRSs as departures from IFRSs rather than departures from Greek GAAP. This implies that an investor could compare companies from different European countries on the basis of IFRSs reported figures. Using IFRSs as denominator will also aid comparison with other studies focusing on other countries (cf. Hellman, 1993; Adams et al., 1999 with respect to US GAAP). This may be particularly relevant as the current transition period of IFRSs implementation in EU member states, is likely to give rise to comparable studies elsewhere (cf. Bertoni and De Rosa, 2006).
20 As an alternative I considered the ‘forecasting errors’ methodology which is common for identifying the difference between actual earnings and forecasted earnings (Bails and Peppers, 1993; Brown, et al. 1985). However, several advantages of the index led us to employ it for the purposes of the present study: The index not only provides evidence of the magnitude of the changes but also reveals the sign of the change (similar to the ‘forecasting errors’ methodology). In addition to this, when the value computed is multiplied by the IFRSs reported figures the total equals to equity (or other) as reported under Greek GAAP. Moreover, it can be broken down into partial indices, which allows the identification of the impact of each particular adjustment/standard (see below). Most importantly, use of the index allows our results to be compared to other academic studies employing this methodology (Hellman, 1993; Adams et al., 1999; Bertoni and De Rosa, 2006). (I thank Paul Andre for pointing out this alternative).
12
Although there is no agreed threshold of materiality, most researchers provide their results based on two bands of materiality thresholds: 5% and 10% (Weetman and Gray, 1990; 1991; Weetman et al., 1998; Adams et al., 1999; Street et al., 2000 etc). In addition, because I expect to find changes of considerable magnitude, and to avoid loss of what I consider relevant information, I also provide information based on the 20% band. (These thresholds do not coincide with those of statistical significance).
Similar to the previous studies, I use partial indices for the adjustments in the reconciliations of shareholders’ equity. The following formula for measuring partial indices is employed:
||1
IFRSEquityustmentsPartialAdj
− (2)
This formula provides a relative measure of the contribution or in other words
the significance of each reconciling item. I follow the ‘standard approach’ (see above) in clustering adjustments and thus examine the effect caused by the adoption of each specific standard. (For example, deferred tax adjustments have been captured as deriving from the adoption of IAS 12 ‘Income taxes’.) Accordingly, any reported partial adjustment has been allocated to the relevant IFRS(s). I follow this approach because in many cases, items are combined and may have been netted off, i.e. companies explicitly refer to the impact of a particular standard without any further explanation and this does not allow for the identification of the magnitude of several individual adjustments falling within a single standard. The value of the partial index may be interpreted as the % difference between equity under IFRSs and Greek GAAP because of the effect of each individual standard. The partial indices or the impact attributed to the adoption of each standard add up to the total index (which represents the total impact of the adoption of IFRSs) as follows:
Total Index: (3) )1(1
−−∑ nAdjustmentn
n
Data In contrast with previous studies based on (sometimes small) samples, the present research investigated the majority of available Greek industrial listed companies’ accounts, thus avoiding any sampling bias. Companies belonging to the banking, insurance and financial services sector were excluded (due to their specific accounting and reporting requirements), as were companies whose shares were suspended from trading or were under supervision by the HCMC. Companies which have the 30th of June as their year end were also excluded.21 Thus from a population of 318 listed companies (including those under suspension/supervision), 238 companies were utilised in this study. Table 2 provides an analysis of the number of companies utilised in the study, disaggregated across each ICB sector.
Table 2 – About Here
21 Jumbo SA, Rainbow SA, Epilektos SA, Texapret SA, Hellenic Sugar Industry SA, Nakas Music SA, CPI Computer Peripherals International SA, Ilektroniki Athinon SA, Alysida SA, Vivere SA, Everest SA.
13

I acquired from the ASE the 2004 financial statements (under the Greek GAAP) in electronic format. This contained all the line by line items of the statements for each listed company. I then downloaded from the ASE website the 2005 financial statements. From these, I captured ‘by hand’ and transferred to a spreadsheet for analysis the comparative figures referring to the 2004 accounts under the IFRSs, together with the adjustments from the reconciliation statements. Statistical tests I employ the ‘one sample Student’s t-test for a mean’ to test whether the means of the index values of the bottom line items and financial indicators where statistically significantly different from their neutral value. I acknowledge that this is a parametric test, and although my sample is relatively large and subsequently the central limit theorem applies (Argyrous, 2006), the results have to be treated cautiously because of possibly skewed distributions (cf. Adams et al., 1999). Although I report the median values in parallel to the mean, I do not employ the Wilcoxon signed rank test because this is more appropriate to studies with relatively small sample size (Adams et al., 1999; Pallant, 2005). I employ the non-parametric ‘Kruskall-Wallis H test’ so as to conclude if there is statistically significant difference in the comparability index value (both for total and partial indices) across the fourteen sectors (Pallant, 2005). 6. Results General findings Starting from evaluating companies’ reconciliation statements, I created three categories for classifying companies’ transitional disclosures: a) ‘Detailed’, which included companies which provided both reconciliation statements and additional, narrative disclosures explaining the transition to IFRSs; b) ‘Adequate’, which included companies which provided reconciliation statements both for earnings and shareholders’ equity but which did not provide additional narrative disclosures; and c) ‘Inadequate’, within which fall companies which did not provide reconciliation statements, did not provide narrative disclosures or which did provide inadequate narratives (which did not enable the users to evaluate the impact caused by individual standards). Table 3 shows that 42 out of the 238 companies in the sample (17.6%) provided inadequate reconciliation disclosures. It is interesting that only two of these had been audited by a big-four auditing firm. Further, 5 had provided reconciliation statements which did not allow identification of the individual standards’ effects, and the remaining 37 did not provide reconciliation statements for either shareholders’ equity or net income. Subsequently, I examined any possible relationship between companies’ transitional disclosures and their auditors and the Chi-Square test reveals that there is statistically significant relationship between them (p=0.009).
Table 3 – About Here Considering that companies may be less willing to discuss the negative aspects of change in their financial position and performance (see Clatworthy and Jones, 2003), I examined if there is a relationship between the impact on shareholders’ equity and earnings and the transitional disclosures provided. The possible relationship was investigated using Pearson product-moment correlation coefficient. However, like Asbitt (2006), I have to reject this hypothesis as there is no statistically
14
significant relationship between transitional disclosures and impact on earnings or equity. Impact on financial position Users of financial statements are interested in specific companies; however the mean and the median of all companies’ results provide a broader picture on overall effects. Accordingly, Table 4 presents the distributions across the materiality bands together with descriptive statistics and the results of the significance test employed. To avoid distortion through extreme values, I have excluded cases where the index values were lower than -2.0 and higher than 4.0. This means that I exclude symmetrically cases where equity (or other) under Greek GAAP was less or more than 300% of that under IFRSs. Appendix 2 presents the companies treated as outliers with their index values for each category examined in this study. Table 4 shows that, although the median index of 0.99 reveals that more companies were affected positively by the transition to IFRSs (120 compared to 109 with negative impact), the average index value reveals that under Greek GAAP, shareholders’ equity was 8% higher of that under IFRSs. Additionally, the t-test shows that the mean index of 1.08 was significantly higher than 1 (p=0.004). However, the standard deviation (0.42), together with the minimum (0.35) and maximum (2.99) index values reveal that there is a broad range of index values per se. In line with prior studies (Weetman et al., 1998) and auditors’ perceptions of materiality I consider changes of less than 5% as not material, and changes of more than 10% as material, with a ‘grey’ area between 5% and 10%. On that basis, 41 companies faced a positive or negative transition change of less than 5% whilst only 5 faced no change. Additionally, 39 are to be found in the ‘grey’ area of equal or more than 5% and less than 10%. This leaves us with 149 companies facing a material effect (≥ 10%) on their net assets which represents 63% of the total sample (excluding 4 outliers). Gearing and liquidly have also been affected materially by the transition to IFRSs22. For 191 companies gearing under Greek GAAP was lower. The average gearing ratio index value of 0.61 reveals that gearing under Greek GAAP was 61% of that under IFRSs and the t-test shows that this mean is statistically lower than 1.0 (p=0.000). As with impact on net assets, a broad range of index values is revealed as the standard deviation is 0.48, the minimum value is 0.00 and the maximum value is 3.02. For only 17 companies are these changes not material and only 2 faced no change; a further 10 fall within the ‘grey’ area. Subsequently there are 206 companies (87%) with material change in their gearing ratio. The liquidity ratio was higher for 138 and lower for 87 companies under Greek GAAP. As with shareholders’ equity, on average the liquidity ratio was 108% of that under IFRSs and the t-test shows that the mean index of 1.08 was significantly higher than 1 (p=0.000). While the minimum value is 0.02 and the maximum is 2.32, standard deviation in this case is lower compared to the other two measures (0.26). Similarly, fewer companies (132) are facing material effects, however the majority of these (69) faced a change of more than 20% on their liquidity. 64 companies faced a positive or negative transition change of less than 5% and 39 are to be found in the ‘grey’ area. Companies with no change to their liquidity ratio were 12. 22 Gearing is defined as Total long-term liabilities/Net assets and Liquidity as Current assets/Current Liabilities. When looking at the gearing comparability index the reader should be cautious on the interpretation. A lower than 1.0 index value means that gearing under Greek GAAP was lower, so we see a negative impact which is the opposite interpretation to other measures.
15

Table 4 – About Here
Although the number of companies varies substantially (from 2 to 39) across
the 14 sectors used in this study, Table 5 shows the average index values and the standard deviations for the measures under examination with reference to all sectors in comparison to the overall values. Additionally, Table 6 shows the results of the Kruskal Wallis H test which identifies any statistically significant differences in the index values across the various sectors.
Table 5 – About Here
Table 6 – About Here
The findings in Table 5 reveal that some sectors are affected more strongly (or differently) than others and the findings in Table 6 support this finding as, in relation to all three measures, the index values are statistically different across the sectors (shareholders’ equity (p=0.047), gearing (p=0.003), liquidity (p=0.000)). More specifically, the impact on equity was particularly positively high in the ‘Health care’, ‘Oil and gas’, and ‘Telecommunications’ sectors: Greek GAAP reported equity was, respectively, 88%, 77% and 88% of IFRSs. In contrast, equity of companies at the ‘Media’, ‘Technology’ and ‘Constructions and materials’ sectors have been affected negatively: Greek GAAP equity was 20%, 26% and 14% higher than that under IFRSs. Gearing appears to be substantially lower under the Greek GAAP, expressed as a % over IFRSs, for companies in the utilities (38%), personal and household goods (46%), and media (46%) sectors. Although most companies in the remaining sectors follow the same trend, only those in the ‘Oil and gas’, ‘Telecommunications’ and ‘Travel and leisure’ sectors have been affected positively from the transition to IFRSs. Turning to liquidity, the findings reveal that 5 industries have been affected positively and 9 negatively with the average index in the retail sector being 1.02 which means on average a very low negative change. Another characteristic of the liquidity comparability index values is that although we see material (more than 10%) changes in several industries, these are less spread out as the standard distribution values are relatively lower than in relation to the other two measures. Impact on performance Under Greek GAAP companies providing consolidated financial statements are not required to report profit after tax. On that basis, this figure was not available for some 50 companies and this study is limited to examining the impact on earnings after tax in the remaining 188 companies provided this information. Information on 12 outliers excluded can be found in appendix 2. Table 4 shows that compared to shareholders’ equity, on average, impact on net income was positive and in particular (earnings under) Greek GAAP were 2% lower than those under IFRSs. Although, the t-test on the mean was inconclusive (p=0.770), the median value of 0.96 supports this finding, as does the fact that 99 companies faced a positive change. The majority of those (88) faced a material change of equal or more than 10% whilst, on the other hand, 54 companies faced material negative impact. Only 7 companies’ net income did not change and for 28
16

the change was not material. Finally, it is interesting that only 9 companies fall into the area of 5% to 10% change. The material and statistically significant negative change to equity seems to affect the impact on ROE as this on average was lower under IFRSs. More specifically, although the t-test is again inconclusive (p=0.416), it appears that on average ROE was 4% higher under Greek GAAP. The median value of 1.0 is indicative of the fact that 87 companies faced a negative impact and 84 a positive one. Like net income, in the area of 5% to 10% change we find only 14 companies. Additionally, 25 companies faced no or immaterial change and the remaining 137 have been materially affected. Focusing on the impact on companies’ performance in relation to net profit and ROE across the different sectors, tables 5 and 6 report material changes but statistically inconclusive results as the H test reveals no statistically different index values across sectors (net income (p=0.240) and ROE (p=0.105)). In particularly, only companies in the ‘Industrial goods & services’ sector reported on average net profit of 95% of that under IFRSs. However, the standard deviation of 0.82 reveals substantial spread over the individual changes23. Furthermore, the average change of four sectors falls in the materiality band of 5% and 10%. For the remaining eight sectors the average impact was material. With reference to ROE, companies in the ‘Industrial goods & services’, ‘Basic resources’ and ‘Media’ sectors have faced a non material change (index values of 0.99, 0.95, and 1.02 respectively). Within the ‘grey area’ of 5% to 10% change fall companies in further three sectors: ‘Retail’ (index 1.09); ‘Technology’ (index 1.06); and ‘Food and beverage’ (0.93). Like net income, the remaining eight sectors appear to have been materially affected. However, the high standard deviations in all cases merit attention. Individual standards’ effects Having identified 20 companies which either did not provide reconciliation statements in relation to shareholders’ equity (15) or unclear reconciliations (5), this discussion is limited to the 218 companies which I was able to analyse. Additionally, as some companies did not adopt IAS 32 and IAS 39 for the 2004 restated comparatives and adopted them for the restated equity as of 1st January 2005, this discussion refers to equity at the beginning of 2005. However, as I exclude financial companies and as most companies adopted these standards from the date of transition, this fact does not cause a significant change in the aggregate impact on the restated shareholders’ equity at 31st December 2004 and 1st January 2005. The same companies treated as outliers in the previous section remain as such in this section.
I report the findings in four tables: 7-10. Table 7 shows the frequency of the 9 standards (including the category ‘other’) which appear in more than 50% of the companies under examination together with the materiality of each standard based on the 5 categories I have defined. Table 8 reports the significance of the average impact caused by the adoption of each of those 9 standards across the 14 sectors considered in the present study. Tables 9 and 10 show the same information with reference to the remaining 13 standards which appear with less frequency in companies’ reconciliations. Although, I focus my discussion on Tables 7 and 8 the reader should be aware that there are 5 standards affecting significantly company’s financial
23 And the one company within the Telecommunications sector reported Greek GAAP earnings being 96% of that under IFRS.
17
position but they appear in less than 37% of the reconciliations under study (see Table 9).
Table 7 - About here
Table 8 – About here
Table 9 – About here
Table 10 – About here The absence of the concept of deferred tax under Greek GAAP results in almost all companies (203-94.9%) to make an adjustment because of the adoption of IAS 12. However, the average impact does not appear to be material (index 1.01) or statistically significant (p=0.056). However, it worth mentioning that, 42 companies reported a material adjustment on shareholders’ equity relating to recognition of deferred tax assets and liabilities. Additionally, although none of the sectors appear to have been affected more that 10% (4 can be found in the ‘grey’ area of 5% to 10%) the Krustal Wallis H test reveals that the mean across sectors is significantly different (p=0.000). The latter allow us to generalise that some sectors face different impact than others. The second standard appearing more often is IAS 38 (almost 91%) which in contrast with IAS 12 causes a change of 7% which is statistically significant. More specifically, on average shareholders’ equity under Greek GAAP was 7% higher than that under IFRSs (mainly) because of recognition of start-up costs as intangible assets whereas these do not meet the recognition criteria of IAS 38. The fact that the impact of the adoption of IAS 38 was not material is supported by the fact that 137 companies have a partial index between 0.95 and 1.04. However, companies within the ‘Retail’ and ‘Technology’ sectors have been materially negatively affected as the average indices are 1.18 and 1.23 respectively. In common with IAS 12 average partial indices differ significantly across different sectors (p=0.019). Taking into consideration the main characteristics of IAS 16 which are: a) the option of the fair value model to be followed for recognition of property, plant and equipment; and b) the consideration of the useful life of the assets for defining the depreciation period and charges, results in its adoption to cause adjustments to 88.8% of the companies surveyed. Additionally its impact is material (115 of those companies faced a change of more than 10%) and statistically significant (p=0.000). This becomes even more obvious by looking at table 8 which shows that only one sector faced a non-material change, one falls in the area of 5% to 10% and the rest 12 faced a material change between 15% and 39%. However, the Kruskal Wallis H test reveals insignificantly different partial indices across sectors (p=0.075). The recognition of the defined benefit liabilities required by IAS 19 result in this standard appearing in 185 (86.4%) companies’ reconciliation statements causing a statistically significant non-material negative change (index 1.02; p=0.000). We find only 11 companies facing a material change and only one sector is on average affected materially (‘Oil & Gas’; partial index 1.11) and similar to above the average partial indices differ significantly across sectors (p=0.000). Looking at the adoption of IAS 32 and IAS 39, perhaps the two most discussed IASs, we find that their adoption causes an average negative impact of 9% on 175 companies (81.8%). The main adjustments related to these standards were the deduction of own shares from shareholders’ equity (IAS 32) and impairment of loans
18

and receivables (IAS 39). 40 companies have been affected materially causing a material effect on 4 sectors: ‘Healthcare’ (1.20); ‘Technology’ (1.14); ‘Constructions & materials’ (1.15); and ‘Food & beverage’ (1.14). However, this evident range of average partial indices across sectors is not statistically significant (p=0.059). The same applies to IAS 10 which although appears in 146 companies’ reconciliations and causes a statistically significant positive change of 5% the average sectors’ partial indices are not statistically different (p=0.196). Furthermore, its adoption causes materially positive change only into 12 companies and two sectors: ‘Travel & leisure’ (0.87) and ‘Oil & gas’ (0.86). Like IAS 10, IAS 37 appears to cause diverse impact on companies’ financial positions. In particularly, 134 companies (62.6%) have adjusted their net assets following adoption of this standard with an average statistically significant (p=0.000) negative effect of 8%. Although it causes a material impact into 28 companies, on average two sectors have been affected materially: ‘Media’ (28%) and ‘Technology’ (12%). Additionally, the Kruskal Wallis H test produces inclusive results relating to the different average partial index values across sectors (p=0.616). The last standard appears frequently (59.3%) on companies reconciliation statements is IAS 2 and its adoption causes an average 5% negative change which is statistically significant (p=0.000). Additionally it is apparent that companies across the 14 sectors affected differently as there is an apparent statistically significant difference across the partial indices (p=0.008). However, only 17 companies faced a material change including those in the ‘Utilities’ sector which faced on average a material impact of 32% because of implementation of IAS 20. Finally, in common with the two previous non-academic studies we see that 55.6% of the companies in the sample present adjustments under the category ‘Other’. Nevertheless, the mean index value of 1.00, median index value of 1.00 and relatively low standard deviation are indicative of the fact these adjustments do not cause material impact. More specifically, in only 8 companies shareholders’ equity these adjustments cause a material change and in only 4 companies cause adjustments which are within the band of 5% to 10%. Similarly, in none of the sectors these adjustments cause a material change and sectors’ average index values do not differ significantly (p=0.805). 7. Limitations While Table 1 lists de jure differences between Greek GAAP and IFRSs, the empirical analysis focuses on de facto differences. In other words, it may be possible that Greek companies had, in their 2004 financial statements, not (completely) complied with Greek GAAP, and/or that they are not (completely) complying with IFRSs in their restatement of the 2004 comparatives (cf. e.g. Hellman, 1993; Norton, 1995; Weetman et al., 1998; Haverty, 2006). This is an important issue because creative accounting is not a rare phenomenon in the Greek corporate practice (see Spathis 2002; Spathis et al. 2002). Additionally, with reference to Table 3 it is obvious that there is a large proportion of companies do not comply with the disclosure requirements of IFRSs. This has been discussed by HCMC’s and Grant-Thornton studies and both interviewees mentioned their concerns in respect of compliance with the measurement and recognition aspects. Additionally, Vroustouris24 (2007) states that ‘there is the sensation that a systematic audit of financial statements, by experienced and specialised auditors, would reveal many and
24 Mr Vroustouris is member of ELTE.
19
significant problems in relation to IFRSs’ implementation’. Avlonitis (2007),25 with reference to the first IFRSs financial statements, states that in addition to non compliance with IFRSs’ disclosure requirements some companies violated the Standards’ measurement and recognition requirements.
Norton (1995) also points out that the period covered by studies may not reflect a typical economic environment and typical accounting policies, a consideration that may be especially true in the period of transition: The EU Regulation was passed in 2002, making it likely that at least some companies’ accounting policy choices were influenced by anticipation of the change. Further, in common with other studies examining the one-off event of transition to IFRSs we cannot assess the impact of timing differences (cf. also Bertoni and De Rosa, 2006). 8. Conclusion With reference to the research questions, the key findings of this study are as follows: On average shareholders’ equity faced a significant negative change on transition to IFRSs, although the average comparability index is to be found at the ‘grey’ area of 5% to 10% change. Looking at the reconciliation statements, these reveal that 8 standards appear in more than 59% of companies’ reconciliations whilst 7 of those affect significantly shareholders’ equity though only one causes a material average impact. Additionally, 5 of these standards appear to cause significantly different impact across sectors. Material and significant negative impact on gearing is revealed whilst liquidity is similarly changed significantly although its negative change falls into the materiality band of 5% to 10%. Like impact on shareholders’ equity for both measures average sector index values appear to be significantly different. In contrast with impact on financial position impact on financial performance appear to be material for many companies but on average is not statistically significant. More specifically, net income faced a low positive change of 2% but the t-test revealed inconclusive results. Likewise, ROE faced a negative insignificant average change. Furthermore, although 8 sectors have been affected materially, on average, there are no significantly different mean index values across sectors. With particular interest to regulators, standard setters and investors overall transitional disclosures appear to be of low quality whilst 17.6% provided inadequate reconciliation statements. This also provides an opportunity for researchers to explore in depth overall level of compliance with IFRSs’ disclosure requirements as is apparent that these lack uniformity and transparency.
25 Mr Avlonitis is the director of the ‘Listed companies supervision’ division in HCMC.
20

References Adams, C.A. Weetman, P. Jones, E.A.E. and Gray, S.J. (1999). ‘Reducing the burden
of US GAAP reconciliations by foreign companies listed in the United States: the key question of materiality’. European Accounting Review, 8(1):1-22.
Adams, C.A. Weetman, P. and Gray, S.J. (1993). ‘Reconciling national with international accounting standards: lessons from a study of Finnish corporate reports’. European Accounting Review, 2(3):471-494.
Aisbitt, S. (2006). ‘Assessing the effect of the transition to IFRS on equity: the case of the FTSE 100’. Accounting in Europe, 3:117-133.
Archer, G.S., Delvaille, P., and McLeay, S.J. (1995). ‘The measurement of harmonisation and the comparability of financial statement items: within-country and between-country effects’. Accounting and Business Research, 25(98), 67-80.
Argyrous, G. (2006). ‘Statistics for research with a guide to SPSS’. Second Edition, London: SAGE Publications.
Athens Stock Exchange, (2005). www.ase.gr Avlonitis, X. (2007). ‘The new framework of financial transparency of Greek listed
companies, findings from the transition to IFRSs’. Presentation at the 3rd conference ‘The interaction between supervisory and supervised bodies and market competition’, organised by the HCMC and the Federation of Greek Industries held between the 16 and 18 January 2007, Athens, Greece.
Bails, D.G. and Peppers, L.C. (1993). ‘Business fluctuations: forecasting techniques and applications’. Second edition, Prentice-Hall International Inc, USA.
Ballas, A.A. (1998). ‘The creation of the auditing profession in Greece’. Accounting, Organizations and Society, 23(8):716–36.
Ballas, A.A. Hevas, D. and Neil, D. (1998). ‘The state of accounting and the state of the state’. Journal of Management and Governance, 2:267-285.
Ballas, A.A., (1994). ‘Accounting in Greece’. European Accounting Review, 1:107-121.
Baralexis, S. (2004). ‘Creative accounting in small countries: the Greek case’. Managerial Auditing Journal, 19(3):440-461.
Bertoni, M. and De Rosa, B. (2006). ‘Measuring balance sheet conservatism: empirical evidence from Italian first time adopters of IFRS’. Proceedings of the international conference Emerging Issues in International Accounting and Business, Padua, Italy, July 20-22 2006, 1:33-54.
Brown, P. Foster, G. and Noreen, E. (1985). ‘Security analyst multi year earnings forecasts and the capital market”, American Accounting Association’, USA.
Cairns, D. (2001). ‘International Accounting Standards Survey 2000’. David Cairns, London, UK.
Caramanis, V.C. (2005). ‘Rationalisation, charisma and accounting professionalisation: perspectives on the intra-professional conflict in Greece, 1993-2001’. Accounting, Organizations and Society, 30:195-221.
Caramanis, V.C. (2002). ‘The interplay between professional groups, the state and supranational agents: Pax Americana in the age of ‘globalisation’’. Accounting, Organizations and Society, 27:379-408.
Caramanis, V.C. (1999). ‘International Accounting Firms Versus Indigenous Auditors: Intra-Professional Conflict in the Greek Auditing Profession, 1990-1993’. Critical Perspectives on Accounting, 10(2):153-196.
Caramanis, V.C. (1996). ‘Intra-professional conflict in the Greek auditing profession: ‘liberalisation’ and its impact on auditor behaviour’. Unpublished PhD thesis, University of Edinburgh, UK.
21
Central Security Depository (2006). December 2006 Statistical Bulletin, cited in http://www.hcsd.gr/files/en/nfo/MSD200612.pdf
Charalambis, D. (1996). ‘The Relationship of the Private and Public in the Greek Political System’. Athens: Sakis Karagiorgis Foundation.
Chen, C.J.P. Gul, F.A. and Su X. (1999). ‘A comparison of reported earnings under Chinese GAAP vs. IAS: evidence from the Shanghai Stock Exchange’. Accounting Horizons, 13(2):91-111.
Clatworthy, M. and Jones, M.J. (2003). ‘Financial reporting of good news and bad news: evidence from accounting narratives’. Accounting and Business Research, 33(3):171-185
Cooke T.E., (1993). ‘The impact of accounting principles on profits: the US versus Japan’. Accounting and Business Research, Autumn: 23(92):460-476.
Doukas, G. (1993). ‘Party Elites and Democratisation in Greece’. Parliamentary Affairs 46: 506–516.
Diamantouros, N. (1993). ‘Politics and culture in Greece, 1974-91: an interpretation’, cited in R. Clogg (Ed.), ‘Greece 1981-89: the populist decade’: pp1-25.
Faubion, J. (1993). ‘Modern Greek lessons: a primer in historical constructivism’. New Jersey: Princeston University Press.
Federation of Greek Manufacturing (1999), Greek Manufacturing in 1998 (in Greek), Athens: Federation of Greek Manufacturing.
FTSE, (2006). ‘Country classification’, September 2006 Update. www.ftse.com Garcia Lara, J.L. and Mora, A (2004). ‘Balance sheet versus earnings conservatism in
Europe’. European Accounting Review, 13(2):261-292. Glaum, M. and Street, D. (2003). ‘Compliance with the disclosure requirements of
Germany’s new market: IAS versus US GAAP’. Journal of International Financial Management and Accounting, 14(1):64-100.
Goodwin, J. and Ahmed, K. (2006). ‘The impact of international financial reporting standards: does size matter?’. Managerial Auditing Journal, 21(5):460-475.
Grant-Thornton, (2006). ‘Study on the impact of IFRSs’ first application on Greek Listed companies in Athens Stock Exchange (ASE)’. June, www.grant-thornton.gr
Grant-Thornton, (2003). ‘How ready are the Greek companies to adopt IFRS?’, December, www.grant-thornton.gr
Gray, S.J. (1980). ‘The impact of international accounting differences from a security-analysis perspective: some European evidence’. Journal of Accounting Research, Spring: 18(1):64-76.
Haverty, J.L., (2006). ‘Are IFRS and U.S. GAAP converging? Some evidence from People’s Republic of China companies listed on the New York Stock Exchange’. Journal of International Accounting Auditing and Taxation, 15:48-71.
Hellenic Capital Market Commission, (2007). www.hcmc.grHellenic Capital Market Commission, (2006). ‘Study on the impact of IFRS on the
financial statements of Greek Listed companies in ASE’. May, www.hcmc.gr Hellman, N. (1993). ‘A comparative analysis of the impact of accounting differences
on profits and return on equity’. European Accounting Review, 2(3):495-530. Herzfeld, M. (1993). ‘The social production of indifference: exploring the symbolic
roots of Western bureaucracy’. New York and London: The University of Chicago Press.
Herzfeld, M. (1987). ‘Anthropology through the looking-glass: critical ethnography in the margins of Europe’. New York: Cambridge University Press.
22
Hung, M and Subramanyam, K.R. (2006). ‘Financial Statement Effects of Adopting International Accounting Standards: The Case of Germany’. Review of Accounting Studies, (forthcoming).
Iliokaftos, I.D., (2005). ‘Practical guide on Société Anonyme’, Kaitatzi Bros Publications, Athens [in Greek].
Leventis, S. and Caramanis, V.C., (2005). ‘Determinants of audit time as a proxy of audit quality’, Managerial Auditing Journal, 20(5):460-478.
Leventis, S. Weetman, P. and Caramanis, V.C. (2005). ‘Determinants of Audit Report Lag: Some Evidence from the Athens Stock Exchange’, International Journal of Auditing, 9:45-58.
Lopes, P.T. and Viana, R.C., (2007). ‘The transition to IFRS: disclosures by Portuguese listed companies’. Working paper, presented at the European Accounting Association’s conference, Lisbon, Portugal, May 2007, pp 1-21.
Mantikidis, T. (2000). ‘UBS Warbourg is upgrading Sophocleous’ (in Greek), Sunday Vima, Sunday 21/05, Athens.
Michalatos, D. (2001). ‘Greece’, cited in ‘European accounting guide’, Fourth edition, Miller, Aspen Law and Business, New York, USA.
Mouzelis, N. (1995). ‘Greece in the twenty-first century: institutions and political culture’, cited in Constas, D. and Stavrou (Eds.). ‘Greece prepares for the twenty-first century’, pp17-34, Washington, Maryland: Woodrow Wilson Centre Press, John Hopkins University Press.
Mouzelis, N. (1986). ‘Politics in the semi-periphery: early parliamentarism and late industrialisation in the Balkans and Latin America’. London: Macmillan.
Mouzelis, N. (1978). ‘Modern Greece: facets and underdevelopment’. London: Macmillan.
Nobes, C. and Parker R. (1998) ‘Comparative International Accounting’. Hemel Hempstead: Prentice-Hall.
Norton, J. (1995). ‘The impact of financial accounting practices on the measurement of profit and equity: Australia versus the United States’. Abacus, 31(2):178-200.
Ormrod, P. and Taylor, P. (2004). The impact of the change to International Accounting Standards on debt covenants: a UK perspective’. Accounting in Europe, 1:71-94.
Owusu-Ansah, S. and Leventis, S. (2006). ‘Timeliness of corporate annual financial reporting in Greece’, European Accounting Review, 15(2):273-287.
Pallant, J. (2005). ‘SPSS Survival manual: a step by step guide to data analysis using SPSS version 12’. Berkshire: Open University Press.
Papas, A. (1993). ‘Group accounting in Greece’, cited in Gray, S.J. Coenenberg, A. and Gordon, P., (1993). ‘International group accounting: issues in European harmonisation’. Second Edition, Routledge publications, London, UK.
Sakellis, E. (2005). ‘Compilation of financial statements in accordance with IFRS using the Greek Accounting Plan’. Sakellis Publications, Athens, [in Greek].
Spanos, J.L. (2005). ‘Corporate governance in Greece: developments and policy implications’. Corporate Governance, 5(1):15-30.
Spathis, C.T. (2002). ‘Detecting false financial statements using published data: some evidence from Greece’, Managerial Auditing Journal, 17(4):179-191.
Spathis, C. Doumpos, M. and Zopounidis, C. (2002). ‘Detecting falsified financial statements: a comparative study using multicriteria analysis and multivariate statistical techniques’. European Accounting Review, 11(3):509-535.
23

24
Spathis, C. and Georgakopoulou, E. (2007). ‘The adoption of IFRS in South Eastern Europe: the case of Greece’. International Journal of Financial Services Management, 2(1):50:63
Street, D. and Gray, S.J. (2001). ‘Observance of International Accounting Standards: Factors explaining non-compliance’. ACCA Monograph, UK.
Street, D.L. Nichols, N.B. and Gray, S.J. (2000). ‘Assessing the acceptability of International Accounting Standards in the US: an empirical study of the materiality of US GAAP reconciliations by non-US companies complying with IASC standards’. International Journal of Accounting, 35(1):27-63.
Street, D. and Bryant, S. (2000). ‘Disclosure level and compliance with IASs: a comparison of companies with and without U.S. listings and fillings’, International Journal of Accounting, 35(3):305-329.
Street, D. Gray, S.J. and Bryant, S. (1999). ‘Acceptance and observance of International Accounting Standards: An empirical study of companies claiming to comply with IASs’. International Journal of Accounting, 34(1):11-48.
Tsakumis, G.T. (2005). ‘The influence of culture on accountants’ application of financial reporting rules’. Abacus, 43(1):27-48.
Tsoukalas, C. (1993). ‘Free riders in Wonderland: on the Greeks in Greece’, Greek Review of Political Science:9–52 (in Greek).
Ucieda Blanco, J.L. and Garcia Osma, B. (2004). ‘The comparability of international accounting standards and US GAAP: an empirical study of Form 20-F reconciliations’. International Journal of Accounting Auditing and Performance Evaluation, 1(1):5-36.
Van der Tas, L.G. (1988). ‘Measuring harmonisation of financial reporting practice’, Accounting and Business Research, 18(70):157-169.
Venieris, G., (1999). ‘Greece’, cited in McLeay, S. (1999). ‘Accounting Regulation in Europe’, Macmillan Press Ltd, UK.
Vroustouris, P. (2007). ‘The technical support of listed companies and auditors, strong and weak points from IFRS implementation’. Presentation at the 3rd conference ‘The interaction between supervisory and supervised bodies and market competition’, organised by the HCMC and the Federation of Greek Industries held between the 16 and 18 January 2007, Athens, Greece.
Weetman, P. Jones, E.A.E. Adams, C.A. and Gray, S.J., (1998), ‘Profit measurement and UK accounting standards: a case of increasing disharmony in relation to US GAAP and IASs’, Accounting and Business Research, Summer: 28(3):189-208.
Weetman, P. and Gray, S.J. (1991). ‘A comparative international analysis of accounting principles on profits: the US versus the UK, Sweden and the Netherlands’, Accounting and Business Research, 21(84):363-379.
Weetman, P. and Gray, S.J., (1990). ‘International financial analysis and comparative corporate performance: the impact of UK versus US accounting principles on earnings’. Journal of International Financial Management and Accounting, 2(2&3):111-130.
Whittington, M. (2000). ‘Problems in comparing financial performance across international boundaries: A case study approach’. International Journal of Accounting, 35(3):399-413.

Tables Table 1 – Key accounting differences between IFRSs and Greek GAAP
IFRSs Greek GAAP (Law 2190/20) IAS 2 ‘Inventories’ Inventories shall be measured at the lower of cost and net realisable value (para 9) using
the first-in, first-out (FIFO) or weighted average cost formula. For inventories with a different nature or use, different cost formulas may be justified (para 25).
IAS 23 ‘Borrowing Costs’ identifies limited circumstances where borrowing costs are included in the cost of inventories (para 17).
For the measurement of the cost of inventories, the retail method may be used for convenience if the results approximate cost (para 21).
In some circumstances, it may be appropriate to group similar or related items (para 29). Materials and other supplies held for use in the production of inventories are not written
down below cost if the finished products in which they will be incorporated are expected to be sold at or above cost (para 32).
The amount of any write-down of inventories to net realisable value and all losses of inventories shall be recognised as an expense in the period the write-down or loss occurs. Any reversal arising from an increase in net realisable value shall be recognised as a reduction in the amount of inventories recognised as an expense in the period in which the reversal occurs (para 34).
Inventories shall be measured per-item at the lower of cost and fair value
(Per item lower value rule). If fair value is less than cost but higher than net realisable value, measurement shall be made at net realisable value.
The cost of inventories can be assigned by all the possible accepted methods (including last-in, first-out / LIFO).
The use of the retail method is not permitted. The use of different cost formulas for inventories with different nature or
use is not permitted and in no case the grouping of similar or associated goods is permitted (this applies also to the case of material and other supplies).
In no case borrowing costs can be included in the cost of inventories, even if they need time to mature.
In the event of an increase in fair value of any inventories previously written-down no reversal is recognised.
IAS 10 ‘Events after the balance sheet date’ If an entity declares dividends to holders of equity instruments after the balance sheet
date, the entity shall not recognise those dividends as a liability at the balance sheet date (para 12). Such dividends are disclosed in the notes (para 13).
Dividends declared after the balance sheet date shall be recognised as a
liability. Only if these dividends are declared for the purpose of increase in capital shall be recognised in equity (D.L. 148/1967, Art. 3).
IAS 12 ‘Income Taxes’ The Standard distinguishes Current from Deferred tax and specifies when a deferred tax
asset may be recognised.
There is no distinction between current and deferred tax. The concept of
deferred tax does not exist. The advantage related to tax in respect of losses carried forward is not
considered neither recognised.
25

IAS 16 ‘Property, Plant and Equipment’ An entity shall choose either the cost model or the revaluation model as its accounting
policy and shall apply that policy to an entire class of property, plant and equipment (para 29).
The cost of an item of property, plant and equipment comprises: (a) its purchase price, including import duties and non-refundable purchase taxes, after deducting trade discounts and rebates (b) any costs directly attributable to bringing the asset to the location and condition necessary for it to be capable of operating in the manner intended by management (c) the initial estimate of the costs of dismantling and removing the item and restoring the site on which it is located (para 16).
If a company applies the revaluation model and an asset’s carrying amount is increased as a result of a revaluation, the increase shall be credited directly to equity under the heading of revaluation surplus (para 39).
The depreciable amount of an asset shall be allocated on a systematic basis over its useful life (para 50).
The residual value and the useful life of an asset shall be reviewed at least at each financial year-end and, if expectations differ from previous estimates, the change(s) shall be accounted for as a change in an accounting estimate in accordance with IAS 8 ‘Accounting Policies, Changes in Accounting Estimates and Errors’ (para 51).
There is no distinction between different classifications of assets such as
held for sale, biological assets or investment properties. Only in respect of properties: any acquisition costs together with interest
during the construction period are capitalised as assets under the heading ‘expenses of perennial depreciation’. As a general rule these should either be expensed in the period incurred or amortised in equal tranches over a maximum period of 5 years.
Fixed assets are recognised at cost and revaluation is not permitted unless a special law is applicable. The tax law 2065/1992 introduced a system of revaluation, only for land and buildings, which allows revaluation every 4 years following indices provided by the minister of finance. The increase in value is recognised within equity as the company issues free shares to the shareholders.
The depreciation is carried in accordance with depreciation indices set by the Ministry of Finance. However, these are not in line with the assets’ useful life. (The most recent P.D. which defines the depreciation factors is the P.D. 299/2003)
In case of impairment, on the basis that this is temporary, a provision is recognised.
IAS 17 ‘Leases’ The Standards defines explicitly finance and operating leases (para 8) and provides
specific recognition and measurement requirements for each case (paras 20 & 33).
There is no distinction between finance leases and operating leases. All
leases are treated as operating leases and the accounting treatment is the same with that of IAS 17.
**It has to be stated though that the Greek GAAP has “converged” with IFRS in this respect. With Law 3229/04 (Art. 13), companies have the option to adopt IAS 17 ‘Leases’.
IAS 18 ‘Revenue’ The Standard identifies the circumstances in which these criteria will be met and,
therefore, revenue will be recognised. It also provides practical guidance on the application of these criteria. As a rule, Revenue is recognised when it is probable that future economic benefits will flow to the entity and these benefits can be measured reliably (Objective).
Revenue recognition is driven by tax considerations. Revenue is
recognised as soon as services or products have been invoiced which usually takes place after the delivery of goods or services.
The effective interest method is not used for recognising revenue arising from interest.
26
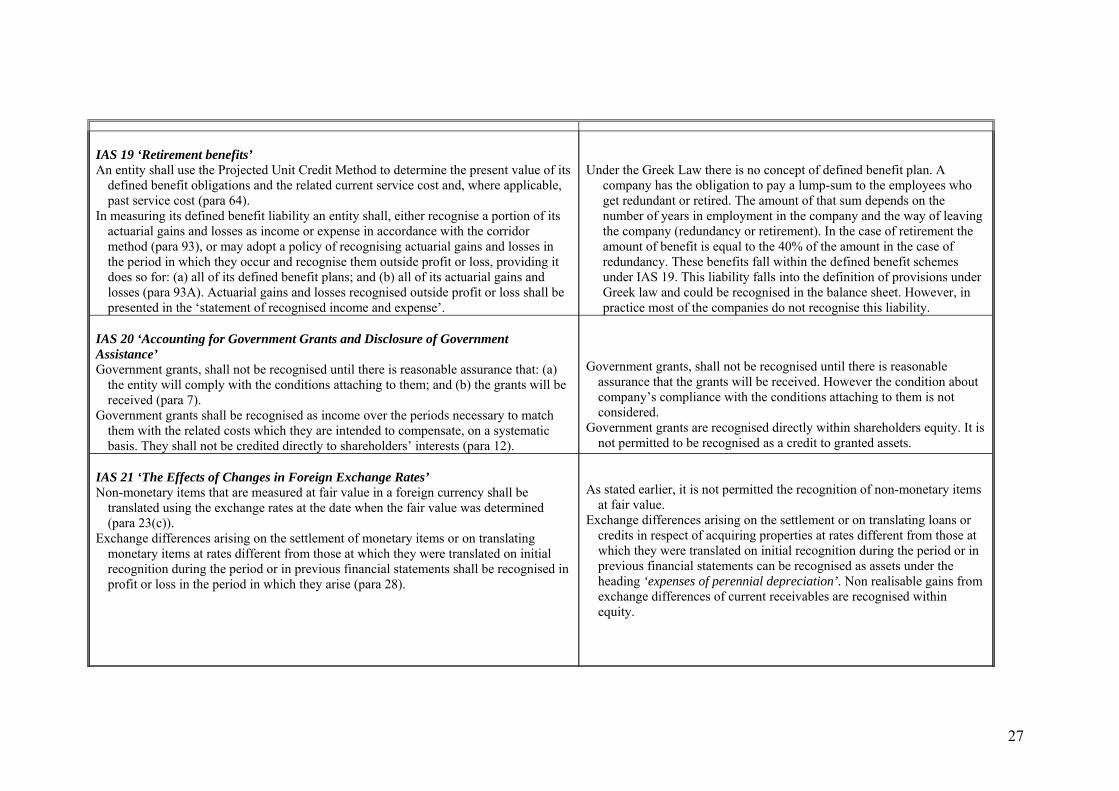
IAS 19 ‘Retirement benefits’ An entity shall use the Projected Unit Credit Method to determine the present value of its
defined benefit obligations and the related current service cost and, where applicable, past service cost (para 64).
In measuring its defined benefit liability an entity shall, either recognise a portion of its actuarial gains and losses as income or expense in accordance with the corridor method (para 93), or may adopt a policy of recognising actuarial gains and losses in the period in which they occur and recognise them outside profit or loss, providing it does so for: (a) all of its defined benefit plans; and (b) all of its actuarial gains and losses (para 93A). Actuarial gains and losses recognised outside profit or loss shall be presented in the ‘statement of recognised income and expense’.
Under the Greek Law there is no concept of defined benefit plan. A
company has the obligation to pay a lump-sum to the employees who get redundant or retired. The amount of that sum depends on the number of years in employment in the company and the way of leaving the company (redundancy or retirement). In the case of retirement the amount of benefit is equal to the 40% of the amount in the case of redundancy. These benefits fall within the defined benefit schemes under IAS 19. This liability falls into the definition of provisions under Greek law and could be recognised in the balance sheet. However, in practice most of the companies do not recognise this liability.
IAS 20 ‘Accounting for Government Grants and Disclosure of Government Assistance’ Government grants, shall not be recognised until there is reasonable assurance that: (a)
the entity will comply with the conditions attaching to them; and (b) the grants will be received (para 7).
Government grants shall be recognised as income over the periods necessary to match them with the related costs which they are intended to compensate, on a systematic basis. They shall not be credited directly to shareholders’ interests (para 12).
Government grants, shall not be recognised until there is reasonable
assurance that the grants will be received. However the condition about company’s compliance with the conditions attaching to them is not considered.
Government grants are recognised directly within shareholders equity. It is not permitted to be recognised as a credit to granted assets.
IAS 21 ‘The Effects of Changes in Foreign Exchange Rates’ Non-monetary items that are measured at fair value in a foreign currency shall be
translated using the exchange rates at the date when the fair value was determined (para 23(c)).
Exchange differences arising on the settlement of monetary items or on translating monetary items at rates different from those at which they were translated on initial recognition during the period or in previous financial statements shall be recognised in profit or loss in the period in which they arise (para 28).
As stated earlier, it is not permitted the recognition of non-monetary items
at fair value. Exchange differences arising on the settlement or on translating loans or
credits in respect of acquiring properties at rates different from those at which they were translated on initial recognition during the period or in previous financial statements can be recognised as assets under the heading ‘expenses of perennial depreciation’. Non realisable gains from exchange differences of current receivables are recognised within equity.
27
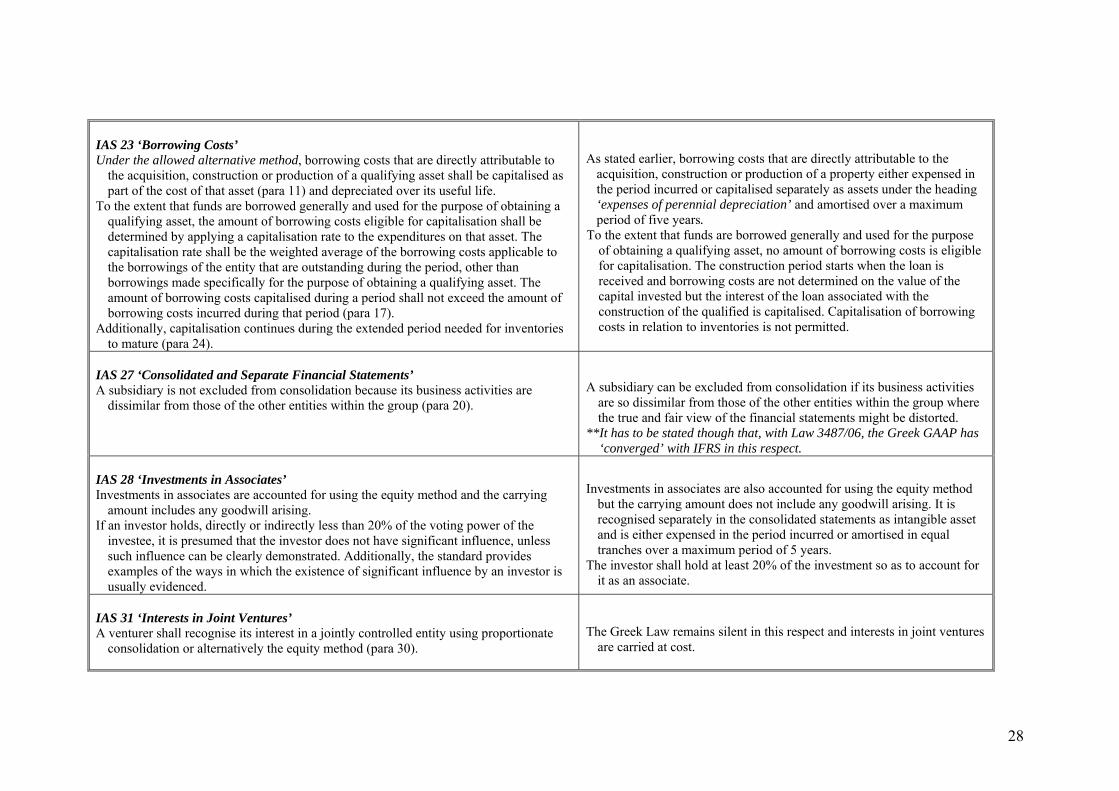
IAS 23 ‘Borrowing Costs’ Under the allowed alternative method, borrowing costs that are directly attributable to
the acquisition, construction or production of a qualifying asset shall be capitalised as part of the cost of that asset (para 11) and depreciated over its useful life.
To the extent that funds are borrowed generally and used for the purpose of obtaining a qualifying asset, the amount of borrowing costs eligible for capitalisation shall be determined by applying a capitalisation rate to the expenditures on that asset. The capitalisation rate shall be the weighted average of the borrowing costs applicable to the borrowings of the entity that are outstanding during the period, other than borrowings made specifically for the purpose of obtaining a qualifying asset. The amount of borrowing costs capitalised during a period shall not exceed the amount of borrowing costs incurred during that period (para 17).
Additionally, capitalisation continues during the extended period needed for inventories to mature (para 24).
As stated earlier, borrowing costs that are directly attributable to the
acquisition, construction or production of a property either expensed in the period incurred or capitalised separately as assets under the heading ‘expenses of perennial depreciation’ and amortised over a maximum period of five years.
To the extent that funds are borrowed generally and used for the purpose of obtaining a qualifying asset, no amount of borrowing costs is eligible for capitalisation. The construction period starts when the loan is received and borrowing costs are not determined on the value of the capital invested but the interest of the loan associated with the construction of the qualified is capitalised. Capitalisation of borrowing costs in relation to inventories is not permitted.
IAS 27 ‘Consolidated and Separate Financial Statements’ A subsidiary is not excluded from consolidation because its business activities are
dissimilar from those of the other entities within the group (para 20).
A subsidiary can be excluded from consolidation if its business activities
are so dissimilar from those of the other entities within the group where the true and fair view of the financial statements might be distorted.
**It has to be stated though that, with Law 3487/06, the Greek GAAP has ‘converged’ with IFRS in this respect.
IAS 28 ‘Investments in Associates’ Investments in associates are accounted for using the equity method and the carrying
amount includes any goodwill arising. If an investor holds, directly or indirectly less than 20% of the voting power of the
investee, it is presumed that the investor does not have significant influence, unless such influence can be clearly demonstrated. Additionally, the standard provides examples of the ways in which the existence of significant influence by an investor is usually evidenced.
Investments in associates are also accounted for using the equity method
but the carrying amount does not include any goodwill arising. It is recognised separately in the consolidated statements as intangible asset and is either expensed in the period incurred or amortised in equal tranches over a maximum period of 5 years.
The investor shall hold at least 20% of the investment so as to account for it as an associate.
IAS 31 ‘Interests in Joint Ventures’ A venturer shall recognise its interest in a jointly controlled entity using proportionate
consolidation or alternatively the equity method (para 30).
The Greek Law remains silent in this respect and interests in joint ventures
are carried at cost.
28
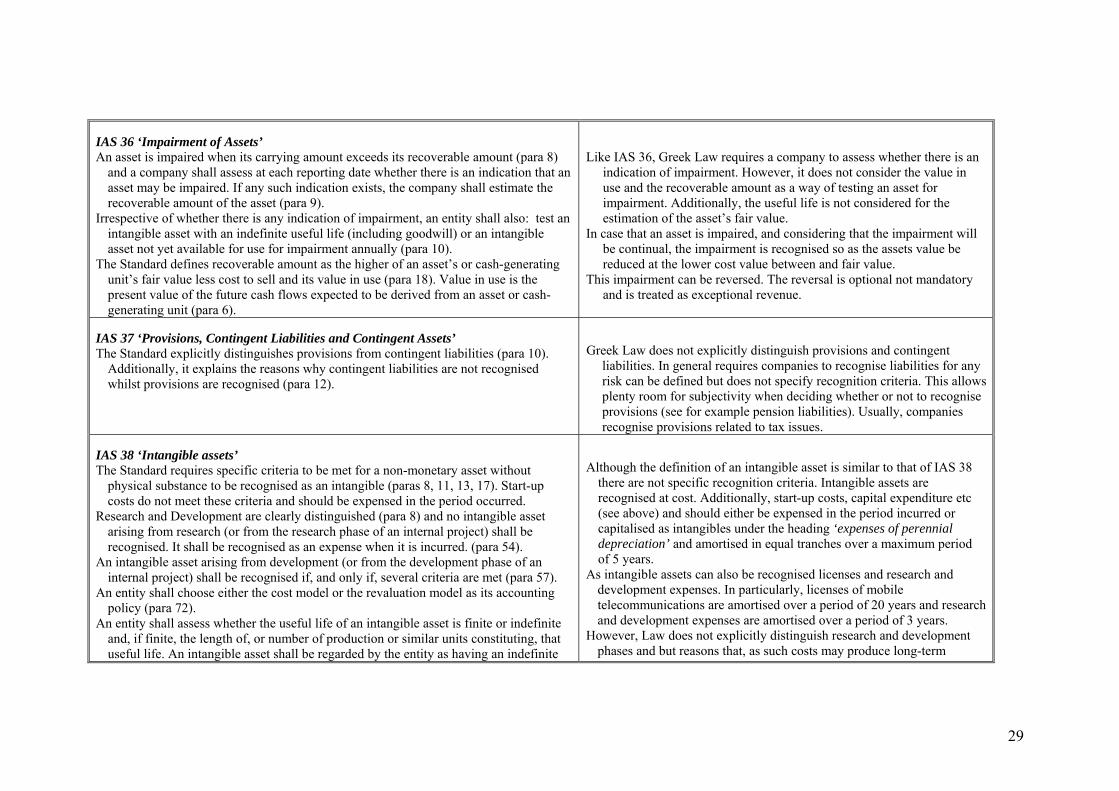
IAS 36 ‘Impairment of Assets’ An asset is impaired when its carrying amount exceeds its recoverable amount (para 8)
and a company shall assess at each reporting date whether there is an indication that an asset may be impaired. If any such indication exists, the company shall estimate the recoverable amount of the asset (para 9).
Irrespective of whether there is any indication of impairment, an entity shall also: test an intangible asset with an indefinite useful life (including goodwill) or an intangible asset not yet available for use for impairment annually (para 10).
The Standard defines recoverable amount as the higher of an asset’s or cash-generating unit’s fair value less cost to sell and its value in use (para 18). Value in use is the present value of the future cash flows expected to be derived from an asset or cash-generating unit (para 6).
Like IAS 36, Greek Law requires a company to assess whether there is an
indication of impairment. However, it does not consider the value in use and the recoverable amount as a way of testing an asset for impairment. Additionally, the useful life is not considered for the estimation of the asset’s fair value.
In case that an asset is impaired, and considering that the impairment will be continual, the impairment is recognised so as the assets value be reduced at the lower cost value between and fair value.
This impairment can be reversed. The reversal is optional not mandatory and is treated as exceptional revenue.
IAS 37 ‘Provisions, Contingent Liabilities and Contingent Assets’ The Standard explicitly distinguishes provisions from contingent liabilities (para 10).
Additionally, it explains the reasons why contingent liabilities are not recognised whilst provisions are recognised (para 12).
Greek Law does not explicitly distinguish provisions and contingent
liabilities. In general requires companies to recognise liabilities for any risk can be defined but does not specify recognition criteria. This allows plenty room for subjectivity when deciding whether or not to recognise provisions (see for example pension liabilities). Usually, companies recognise provisions related to tax issues.
IAS 38 ‘Intangible assets’ The Standard requires specific criteria to be met for a non-monetary asset without
physical substance to be recognised as an intangible (paras 8, 11, 13, 17). Start-up costs do not meet these criteria and should be expensed in the period occurred.
Research and Development are clearly distinguished (para 8) and no intangible asset arising from research (or from the research phase of an internal project) shall be recognised. It shall be recognised as an expense when it is incurred. (para 54).
An intangible asset arising from development (or from the development phase of an internal project) shall be recognised if, and only if, several criteria are met (para 57).
An entity shall choose either the cost model or the revaluation model as its accounting policy (para 72).
An entity shall assess whether the useful life of an intangible asset is finite or indefinite and, if finite, the length of, or number of production or similar units constituting, that useful life. An intangible asset shall be regarded by the entity as having an indefinite
Although the definition of an intangible asset is similar to that of IAS 38
there are not specific recognition criteria. Intangible assets are recognised at cost. Additionally, start-up costs, capital expenditure etc (see above) and should either be expensed in the period incurred or capitalised as intangibles under the heading ‘expenses of perennial depreciation’ and amortised in equal tranches over a maximum period of 5 years.
As intangible assets can also be recognised licenses and research and development expenses. In particularly, licenses of mobile telecommunications are amortised over a period of 20 years and research and development expenses are amortised over a period of 3 years.
However, Law does not explicitly distinguish research and development phases and but reasons that, as such costs may produce long-term
29
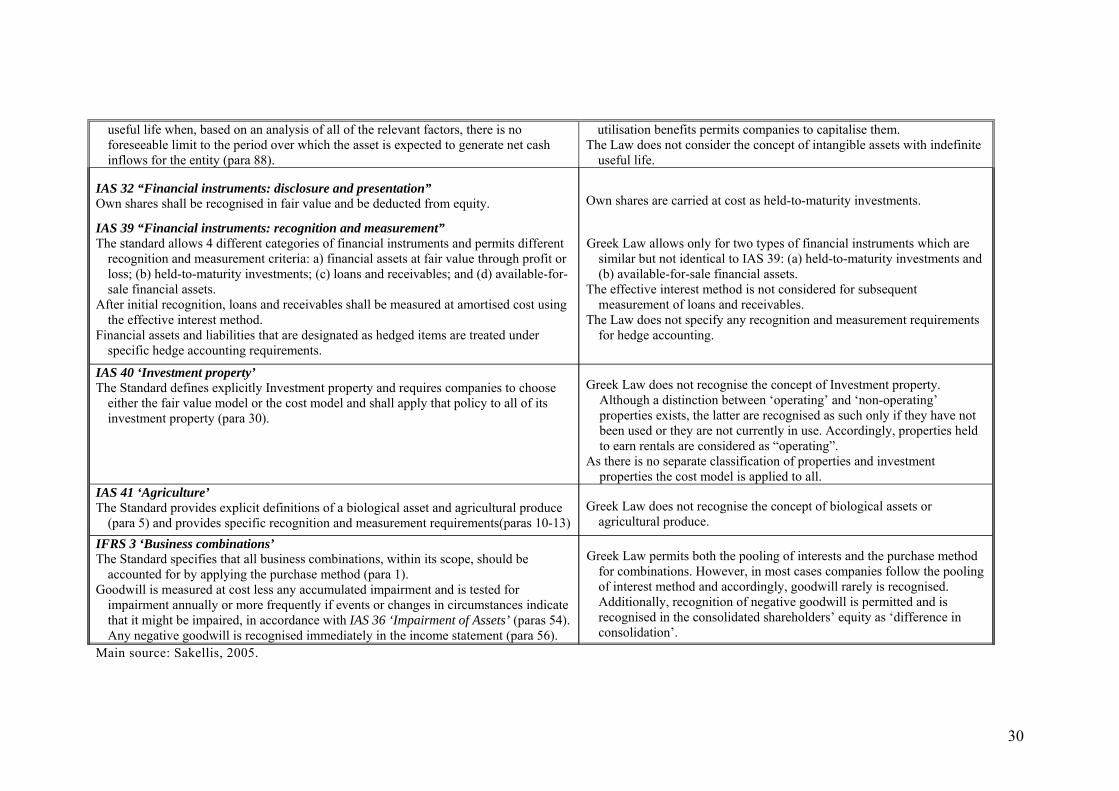
30
Main source: Sakellis, 2005.
useful life when, based on an analysis of all of the relevant factors, there is no foreseeable limit to the period over which the asset is expected to generate net cash inflows for the entity (para 88).
utilisation benefits permits companies to capitalise them. The Law does not consider the concept of intangible assets with indefinite
useful life. IAS 32 “Financial instruments: disclosure and presentation” Own shares shall be recognised in fair value and be deducted from equity.
IAS 39 “Financial instruments: recognition and measurement” The standard allows 4 different categories of financial instruments and permits different
recognition and measurement criteria: a) financial assets at fair value through profit or loss; (b) held-to-maturity investments; (c) loans and receivables; and (d) available-for-sale financial assets.
After initial recognition, loans and receivables shall be measured at amortised cost using the effective interest method.
Financial assets and liabilities that are designated as hedged items are treated under specific hedge accounting requirements.
Own shares are carried at cost as held-to-maturity investments. Greek Law allows only for two types of financial instruments which are
similar but not identical to IAS 39: (a) held-to-maturity investments and (b) available-for-sale financial assets.
The effective interest method is not considered for subsequent measurement of loans and receivables.
The Law does not specify any recognition and measurement requirements for hedge accounting.
IAS 40 ‘Investment property’ The Standard defines explicitly Investment property and requires companies to choose
either the fair value model or the cost model and shall apply that policy to all of its investment property (para 30).
Greek Law does not recognise the concept of Investment property.
Although a distinction between ‘operating’ and ‘non-operating’ properties exists, the latter are recognised as such only if they have not been used or they are not currently in use. Accordingly, properties held to earn rentals are considered as “operating”.
As there is no separate classification of properties and investment properties the cost model is applied to all.
IAS 41 ‘Agriculture’ The Standard provides explicit definitions of a biological asset and agricultural produce
(para 5) and provides specific recognition and measurement requirements(paras 10-13)
Greek Law does not recognise the concept of biological assets or
agricultural produce.
IFRS 3 ‘Business combinations’ The Standard specifies that all business combinations, within its scope, should be
accounted for by applying the purchase method (para 1). Goodwill is measured at cost less any accumulated impairment and is tested for
impairment annually or more frequently if events or changes in circumstances indicate that it might be impaired, in accordance with IAS 36 ‘Impairment of Assets’ (paras 54). Any negative goodwill is recognised immediately in the income statement (para 56).
Greek Law permits both the pooling of interests and the purchase method
for combinations. However, in most cases companies follow the pooling of interest method and accordingly, goodwill rarely is recognised. Additionally, recognition of negative goodwill is permitted and is recognised in the consolidated shareholders’ equity as ‘difference in consolidation’.

31
Table 2 - Number of companies per sector*
Media 14 Travel and leisure 16
Health care 8 Retail 13
Personal and household goods 39 Technology 22
Constructions & materials 32 Food and beverage 31
Basic resources 17 Telecommunications 3
Oil and gas 2 Industrial goods and services 27
Chemicals 11 Utilities 3
Total 238 *Appendix 1 shows the constituents of each sector Table 3 – Transitional information and auditing firms
Transitional information
Detailed Adequate Inadequate
Big four 16 34 2 Auditing firm Other 56 90 40 Pearson Chi-Square: 9.441ª, 2df, Asymp. Sig. (2-sided) 0.009 ª 0 Cells (.0%) have expected count less than 5. The minimum expected count is 9.18.
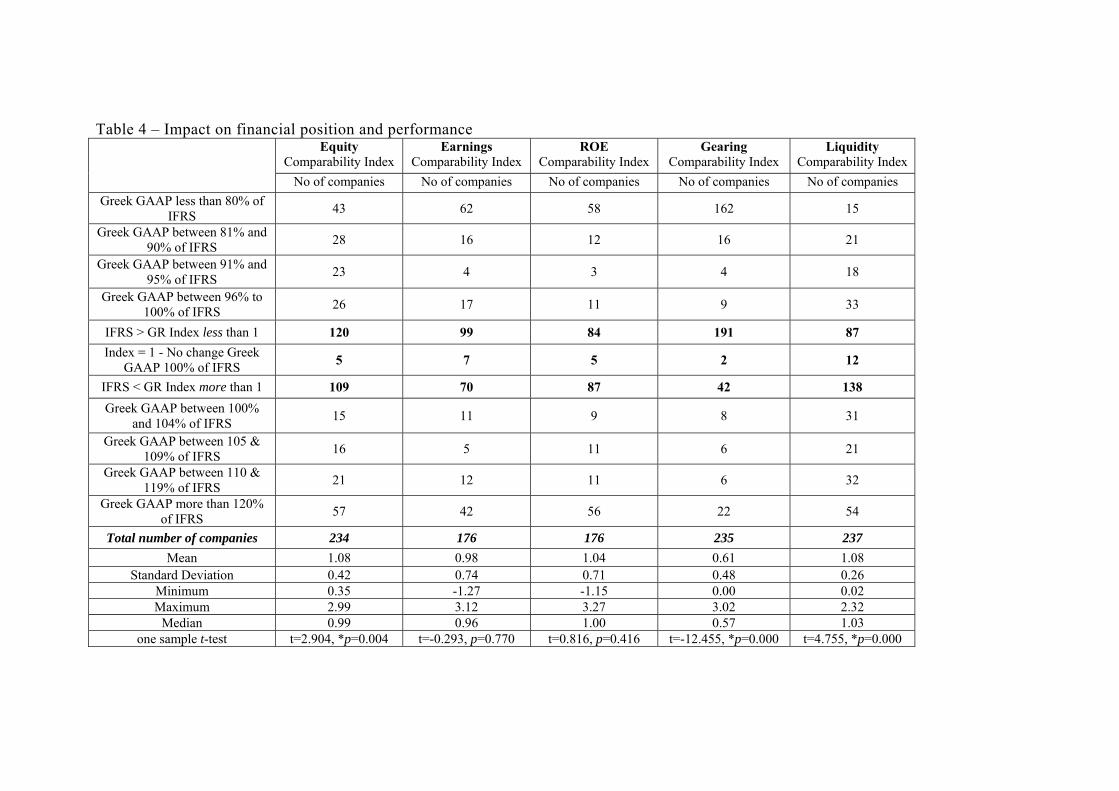
Table 4 – Impact on financial position and performance Equity
Comparability Index Earnings
Comparability Index ROE
Comparability Index Gearing
Comparability Index Liquidity
Comparability Index
No of companies No of companies No of companies No of companies No of companies Greek GAAP less than 80% of
IFRS 43 62 58 162 15
Greek GAAP between 81% and 90% of IFRS 28 16 12 16 21
Greek GAAP between 91% and 95% of IFRS 23 4 3 4 18
Greek GAAP between 96% to 100% of IFRS 26 17 11 9 33
IFRS > GR Index less than 1 120 99 84 191 87Index = 1 - No change Greek
GAAP 100% of IFRS 5 7 5 2 12
IFRS < GR Index more than 1 109 70 87 42 138Greek GAAP between 100%
and 104% of IFRS 15 11 9 8 31
Greek GAAP between 105 & 109% of IFRS 16 5 11 6 21
Greek GAAP between 110 & 119% of IFRS 21 12 11 6 32
Greek GAAP more than 120% of IFRS 57 42 56 22 54
Total number of companies 234 176 176 235 237 Mean 1.08 0.98 1.04 0.61 1.08
Standard Deviation 0.42 0.74 0.71 0.48 0.26 Minimum 0.35 -1.27 -1.15 0.00 0.02Maximum 2.99 3.12 3.27 3.02 2.32
Median 0.99 0.96 1.00 0.57 1.03one sample t-test t=2.904, *p=0.004 t=-0.293, p=0.770 t=0.816, p=0.416 t=-12.455, *p=0.000 t=4.755, *p=0.000

Table 5 – Average comparability indices per sector
Equity Comparability
Index
Earnings Comparability Index
ROE Comparability Index
Gearing Comparability Index
Liquidity Comparability Index
Sectors Total
number of companies N* Mean & St.
Deviation N* Mean & St. Deviation N* Mean & St.
Deviation N* Mean & St. Deviation N* Mean & St.
Deviation Media 14 14 1.20 (0.66) 11 1.20 (0.80) 11 1.02 (0.53) 14 0.46 (0.36) 14 1.08 (0.21) Travel & leisure 16 16 1.04 (0.45) 12 1.18 (0.55) 13 1.58 (0.79) 16 1.03 (0.67) 16 0.95 (0.25) Health care 8 7 0.88 (0.25) 6 0.68 (1.05) 5 1.10 (0.39) 8 0.98 (0.75) 8 1.20 (0.22) Retail 13 12 1.09 (0.48) 12 1.06 (0.72) 12 1.09 (0.52) 12 0.57 (0.38) 13 1.02 (0.11) Personal & household goods 39 39 1.04 (0.32) 24 0.85 (0.63) 24 0.82 (0.64) 39 0.46 (0.42) 39 1.04 (0.17)
Technology 22 22 1.26 (0.36) 18 1.08 (0.68) 17 1.06 (0.51) 21 0.72 (0.45) 22 1.11 (0.16) Constructions & materials 32 32 1.14 (0.51) 17 0.75 (0.85) 18 0.81 (0.79) 32 0.49 (0.43) 31 1.22 (0.40)
Food & beverage 31 29 1.10 (0.51) 24 0.91 (0.79) 24 0.93 (0.88) 30 0.53 (0.45) 31 1.20 (0.37)
Basic resources 17 17 0.99 (0.41) 15 0.77 (0.27) 15 0.95 (0.31) 17 0.79 (0.45) 17 1.03 (0.12)
Telecoms 3 3 0.88 (0.38) 1 0.96 (-) 1 1.90 (-) 3 1.12 (0.43) 3 0.87 (0.23) Oil & gas 2 2 0.77 (0.23) 2 0.93 (0.05) 2 1.25 (0.31) 2 1.18 (0.50) 2 0.92 (0.07) Industrial goods & services 27 27 0.98 (0.26) 22 0.95 (0.82) 22 0.99 (0.81) 27 0.54 (0.42) 27 0.97 (0.14)
Chemicals 11 11 1.05 (0.23) 10 1.50 (0.95) 10 1.50 (0.87) 11 0.61 (0.31) 11 1.08 (0.09)
Utilities 4 4 1.35 (0.16) 2 2.11 (0.40) 2 1.64 (0.31) 3 0.38 (0.16) 3 0.90 (0.15)
Total 238 234 1.08 (0.42) 176 0.98 (0.74) 176 1.04 (0.71) 235 0.61 (0.48) 237 1.08 (0.26)
N* : Number of companies excluding outliers (For outliers see Appendix II)
33
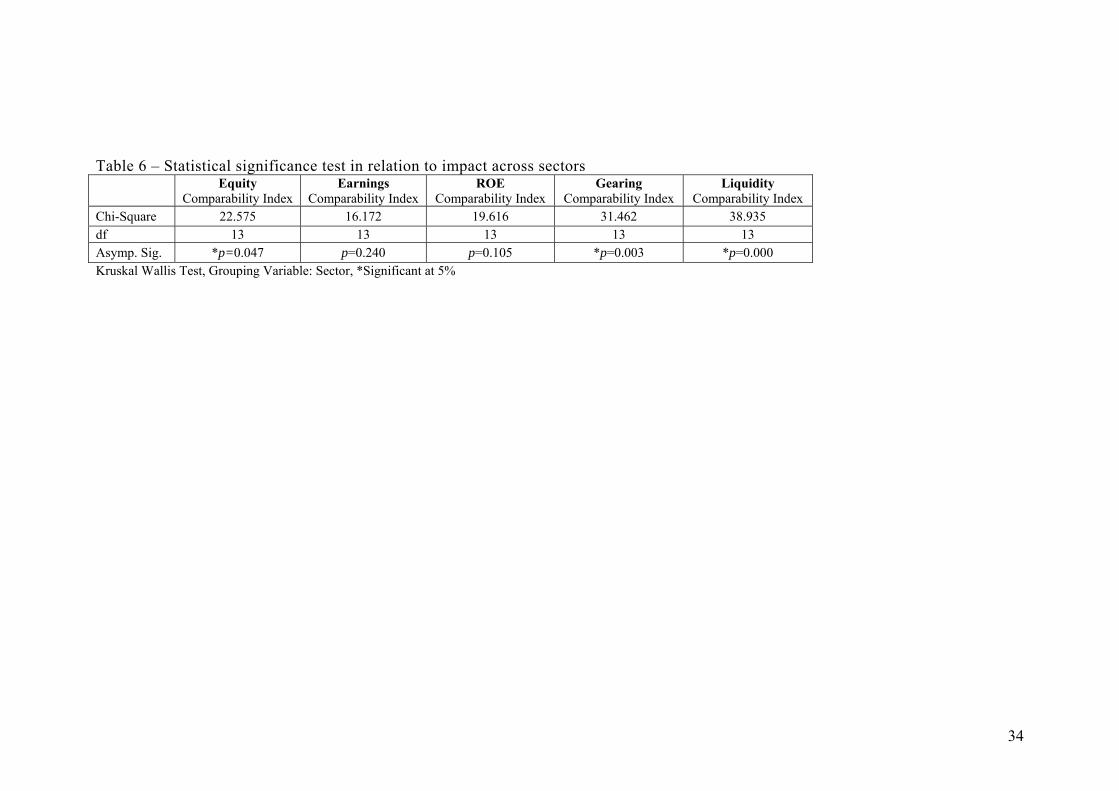
Table 6 – Statistical significance test in relation to impact across sectors Equity
Comparability Index Earnings
Comparability Index ROE
Comparability Index Gearing
Comparability Index Liquidity
Comparability Index Chi-Square 22.575 16.172 19.616 31.462 38.935 df 13 13 13 13 13Asymp. Sig. *p=0.047 p=0.240 p=0.105 *p=0.003 *p=0.000 Kruskal Wallis Test, Grouping Variable: Sector, *Significant at 5%
34
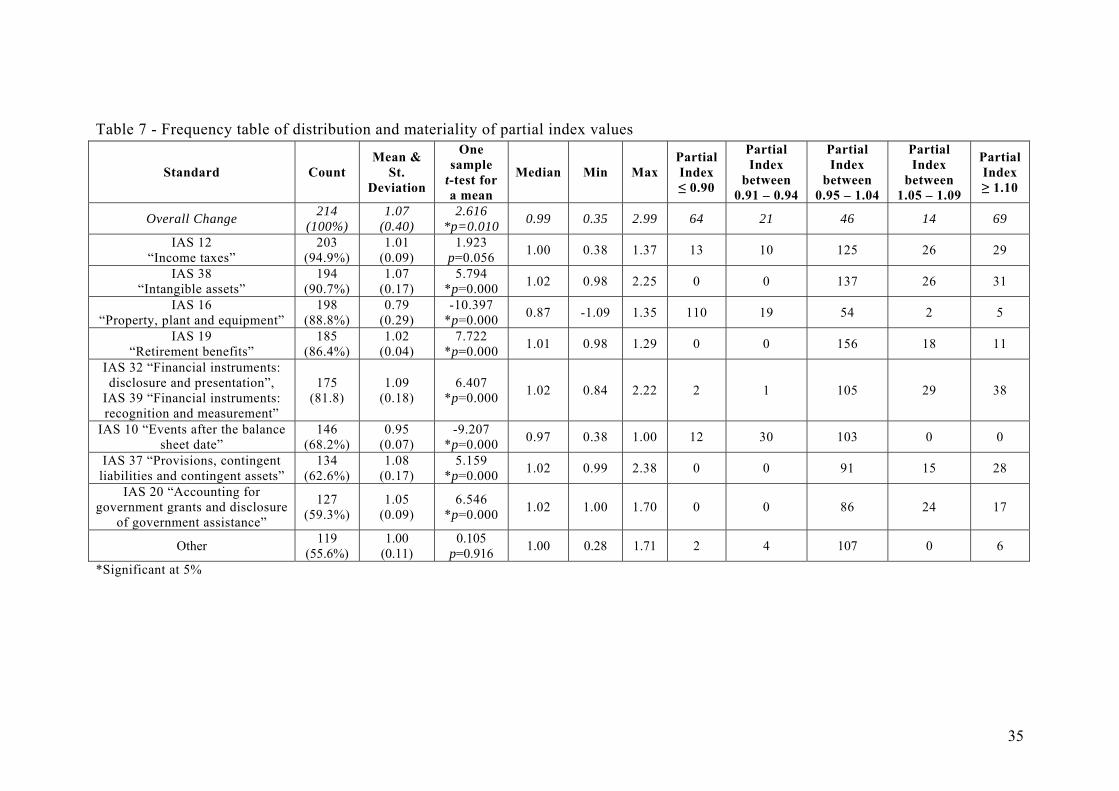
Table 7 - Frequency table of distribution and materiality of partial index values
*Significant at 5%
Standard Count Mean &
St. Deviation
One sample
t-test for a mean
Median Min MaxPartial Index ≤ 0.90
Partial Index
between 0.91 – 0.94
Partial Index
between 0.95 – 1.04
Partial Index
between 1.05 – 1.09
Partial Index ≥ 1.10
Overall Change 214 (100%)
1.07 (0.40)
2.616 *p=0.010 0.99 0.35 2.99 64 21 46 14 69
IAS 12 “Income taxes”
203 (94.9%)
1.01 (0.09)
1.923 p=0.056 1.00 0.38 1.37 13 10 125 26 29
IAS 38 “Intangible assets”
194 (90.7%)
1.07 (0.17)
5.794 *p=0.000 1.02 0.98 2.25 0 0 137 26 31
IAS 16 “Property, plant and equipment”
198 (88.8%)
0.79 (0.29)
-10.397 *p=0.000 0.87 -1.09 1.35 110 19 54 2 5
IAS 19 “Retirement benefits”
185 (86.4%)
1.02 (0.04)
7.722 *p=0.000 1.01 0.98 1.29 0 0 156 18 11
IAS 32 “Financial instruments: disclosure and presentation”,
IAS 39 “Financial instruments: recognition and measurement”
175 (81.8)
1.09 (0.18)
6.407 *p=0.000 1.02 0.84 2.22 2 1 105 29 38
IAS 10 “Events after the balance sheet date”
146 (68.2%)
0.95 (0.07)
-9.207 *p=0.000 0.97 0.38 1.00 12 30 103 0 0
IAS 37 “Provisions, contingent liabilities and contingent assets”
134 (62.6%)
1.08 (0.17)
5.159 *p=0.000 1.02 0.99 2.38 0 0 91 15 28
IAS 20 “Accounting for government grants and disclosure
of government assistance”
127 (59.3%)
1.05 (0.09)
6.546 *p=0.000 1.02 1.00 1.70 0 0 86 24 17
Other 119 (55.6%)
1.00 (0.11)
0.105 p=0.916 1.00 0.28 1.71 2 4 107 0 6
35
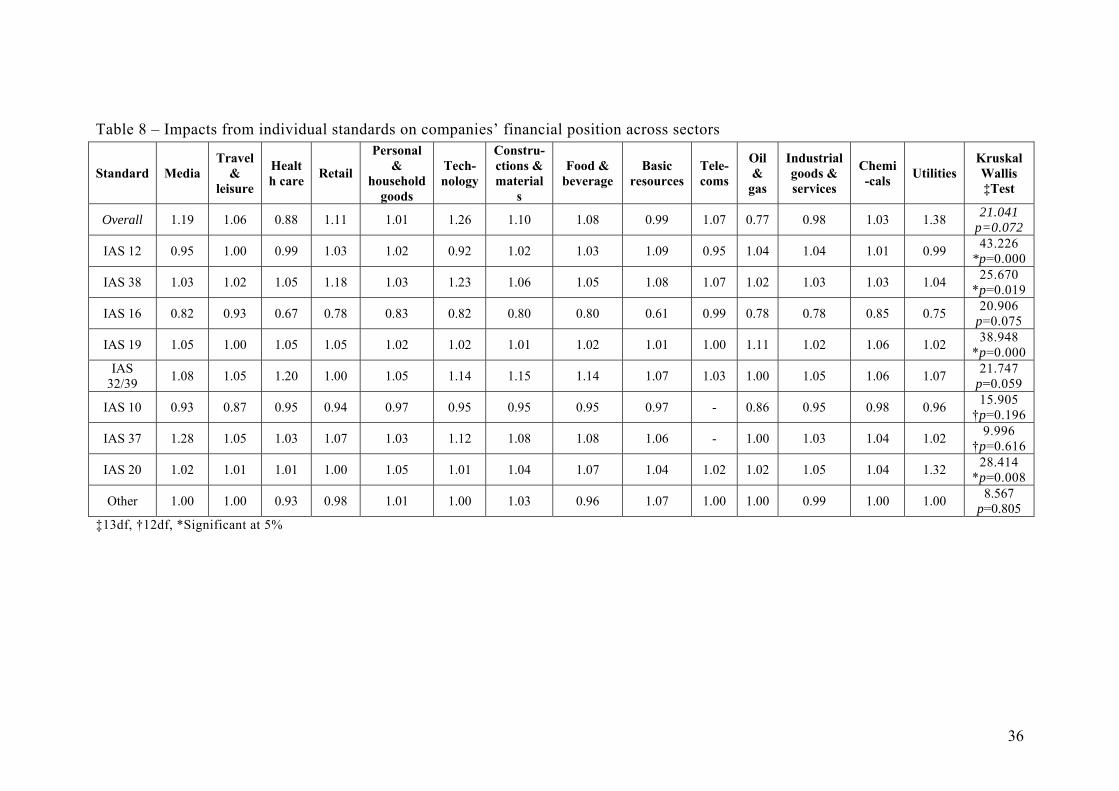
Table 8 – Impacts from individual standards on companies’ financial position across sectors
‡13df, †12df, *Significant at 5%
Standard MediaTravel
& leisure
Health care Retail
Personal &
household goods
Tech-nology
Constru-ctions & material
s
Food & beverage
Basic resources
Tele-coms
Oil &
gas
Industrial goods & services
Chemi-cals Utilities
Kruskal Wallis ‡Test
Overall 1.19 1.06 0.88 1.11 1.01 1.26 1.10 1.08 0.99 1.07 0.77 0.98 1.03 1.38 21.041 p=0.072
IAS 12 0.95 1.00 0.99 1.03 1.02 0.92 1.02 1.03 1.09 0.95 1.04 1.04 1.01 0.99 43.226 *p=0.000
IAS 38 1.03 1.02 1.05 1.18 1.03 1.23 1.06 1.05 1.08 1.07 1.02 1.03 1.03 1.04 25.670 *p=0.019
IAS 16 0.82 0.93 0.67 0.78 0.83 0.82 0.80 0.80 0.61 0.99 0.78 0.78 0.85 0.75 20.906 p=0.075
IAS 19 1.05 1.00 1.05 1.05 1.02 1.02 1.01 1.02 1.01 1.00 1.11 1.02 1.06 1.02 38.948 *p=0.000
IAS 32/39 1.08 1.05 1.20 1.00 1.05 1.14 1.15 1.14 1.07 1.03 1.00 1.05 1.06 1.07 21.747
p=0.059
IAS 10 0.93 0.87 0.95 0.94 0.97 0.95 0.95 0.95 0.97 - 0.86 0.95 0.98 0.96 15.905 †p=0.196
IAS 37 1.28 1.05 1.03 1.07 1.03 1.12 1.08 1.08 1.06 - 1.00 1.03 1.04 1.02 9.996 †p=0.616
IAS 20 1.02 1.01 1.01 1.00 1.05 1.01 1.04 1.07 1.04 1.02 1.02 1.05 1.04 1.32 28.414 *p=0.008
Other 1.00 1.00 0.93 0.98 1.01 1.00 1.03 0.96 1.07 1.00 1.00 0.99 1.00 1.00 8.567 p=0.805
36
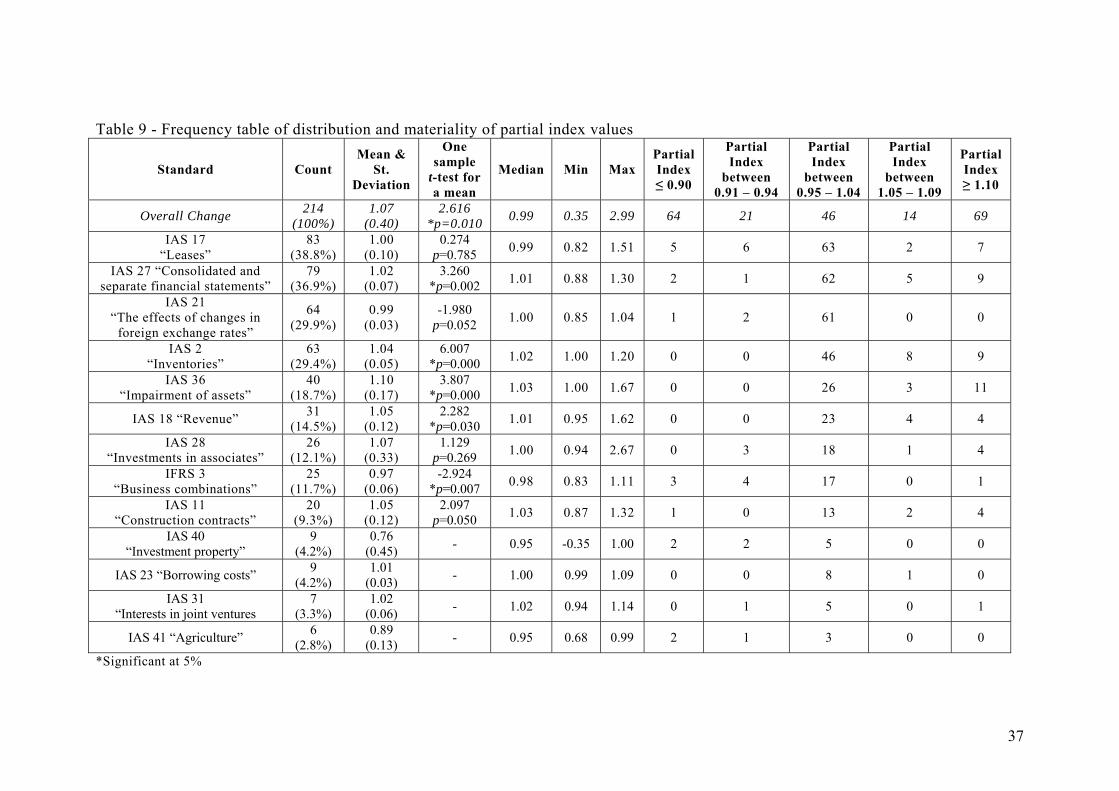
Table 9 - Frequency table of distribution and materiality of partial index values
Standard Count Mean &
St. Deviation
One sample
t-test for a mean
Median Min MaxPartial Index ≤ 0.90
Partial Index
between 0.91 – 0.94
Partial Index
between 0.95 – 1.04
Partial Index
between 1.05 – 1.09
Partial Index ≥ 1.10
Overall Change 214 (100%)
1.07 (0.40)
2.616 *p=0.010 0.99 0.35 2.99 64 21 46 14 69
IAS 17 “Leases”
83 (38.8%)
1.00 (0.10)
0.274 p=0.785 0.99 0.82 1.51 5 6 63 2 7
IAS 27 “Consolidated and separate financial statements”
79 (36.9%)
1.02 (0.07)
3.260 *p=0.002 1.01 0.88 1.30 2 1 62 5 9
IAS 21 “The effects of changes in
foreign exchange rates”
64 (29.9%)
0.99 (0.03)
-1.980 p=0.052 1.00 0.85 1.04 1 2 61 0 0
IAS 2 “Inventories”
63 (29.4%)
1.04 (0.05)
6.007 *p=0.000 1.02 1.00 1.20 0 0 46 8 9
IAS 36 “Impairment of assets”
40 (18.7%)
1.10 (0.17)
3.807 *p=0.000 1.03 1.00 1.67 0 0 26 3 11
IAS 18 “Revenue” 31 (14.5%)
1.05 (0.12)
2.282 *p=0.030 1.01 0.95 1.62 0 0 23 4 4
IAS 28 “Investments in associates”
26 (12.1%)
1.07 (0.33)
1.129 p=0.269 1.00 0.94 2.67 0 3 18 1 4
IFRS 3 “Business combinations”
25 (11.7%)
0.97 (0.06)
-2.924 *p=0.007 0.98 0.83 1.11 3 4 17 0 1
IAS 11 “Construction contracts”
20 (9.3%)
1.05 (0.12)
2.097 p=0.050 1.03 0.87 1.32 1 0 13 2 4
IAS 40 “Investment property”
9 (4.2%)
0.76 (0.45) - 0.95 -0.35 1.00 2 2 5 0 0
IAS 23 “Borrowing costs” 9 (4.2%)
1.01 (0.03) - 1.00 0.99 1.09 0 0 8 1 0
IAS 31 “Interests in joint ventures
7 (3.3%)
1.02 (0.06) - 1.02 0.94 1.14 0 1 5 0 1
IAS 41 “Agriculture” 6 (2.8%)
0.89 (0.13) - 0.95 0.68 0.99 2 1 3 0 0
*Significant at 5%
37
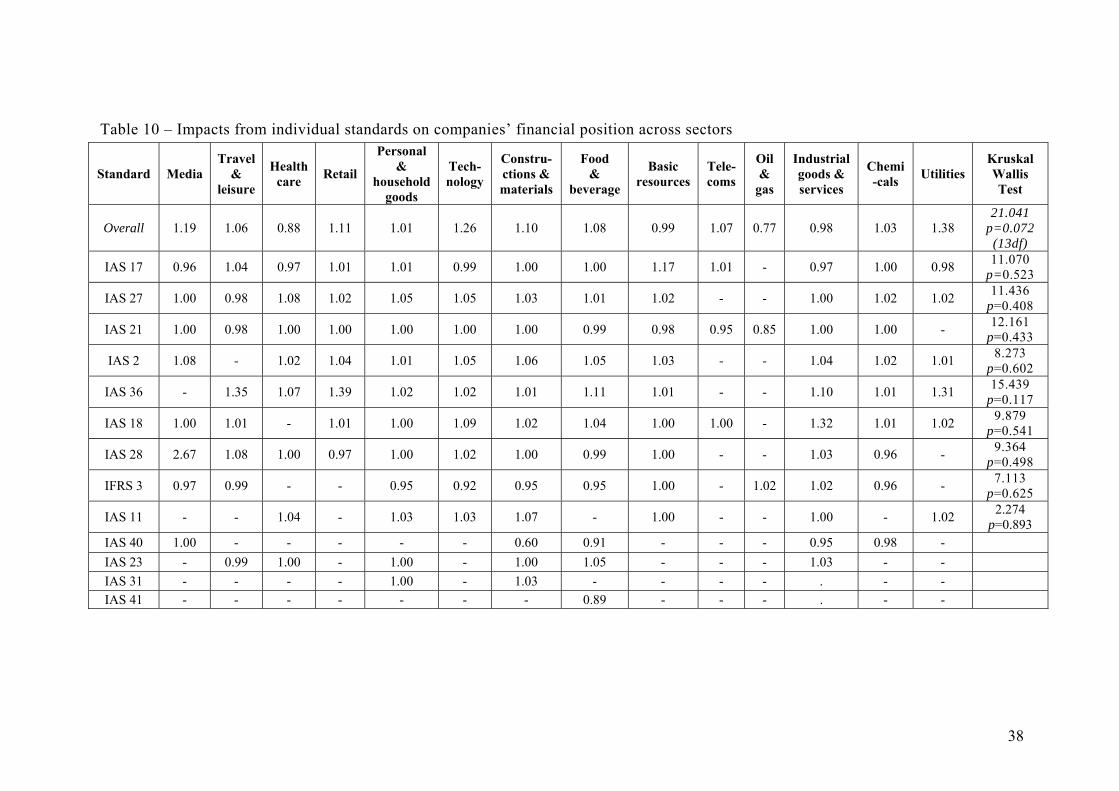
Table 10 – Impacts from individual standards on companies’ financial position across sectors
Standard MediaTravel
& leisure
Health care Retail
Personal &
household goods
Tech-nology
Constru-ctions & materials
Food &
beverage
Basic resources
Tele-coms
Oil &
gas
Industrial goods & services
Chemi-cals Utilities
Kruskal Wallis Test
Overall 1.19 1.06 0.88 1.11 1.01 1.26 1.10 1.08 0.99 1.07 0.77 0.98 1.03 1.38 21.041
p=0.072 (13df)
IAS 17 0.96 1.04 0.97 1.01 1.01 0.99 1.00 1.00 1.17 1.01 - 0.97 1.00 0.98 11.070 p=0.523
IAS 27 1.00 0.98 1.08 1.02 1.05 1.05 1.03 1.01 1.02 - - 1.00 1.02 1.02 11.436 p=0.408
IAS 21 1.00 0.98 1.00 1.00 1.00 1.00 1.00 0.99 0.98 0.95 0.85 1.00 1.00 - 12.161 p=0.433
IAS 2 1.08 - 1.02 1.04 1.01 1.05 1.06 1.05 1.03 - - 1.04 1.02 1.01 8.273 p=0.602
IAS 36 - 1.35 1.07 1.39 1.02 1.02 1.01 1.11 1.01 - - 1.10 1.01 1.31 15.439 p=0.117
IAS 18 1.00 1.01 - 1.01 1.00 1.09 1.02 1.04 1.00 1.00 - 1.32 1.01 1.02 9.879 p=0.541
IAS 28 2.67 1.08 1.00 0.97 1.00 1.02 1.00 0.99 1.00 - - 1.03 0.96 - 9.364 p=0.498
IFRS 3 0.97 0.99 - - 0.95 0.92 0.95 0.95 1.00 - 1.02 1.02 0.96 - 7.113 p=0.625
IAS 11 - - 1.04 - 1.03 1.03 1.07 - 1.00 - - 1.00 - 1.02 2.274 p=0.893
IAS 40 1.00 - - - - - 0.60 0.91 - - - 0.95 0.98 - IAS 23 - 0.99 1.00 - 1.00 - 1.00 1.05 - - - 1.03 - -IAS 31 - - - - 1.00 - 1.03 - - - - . - -IAS 41 - - - - - - - 0.89 - - - . - -
38
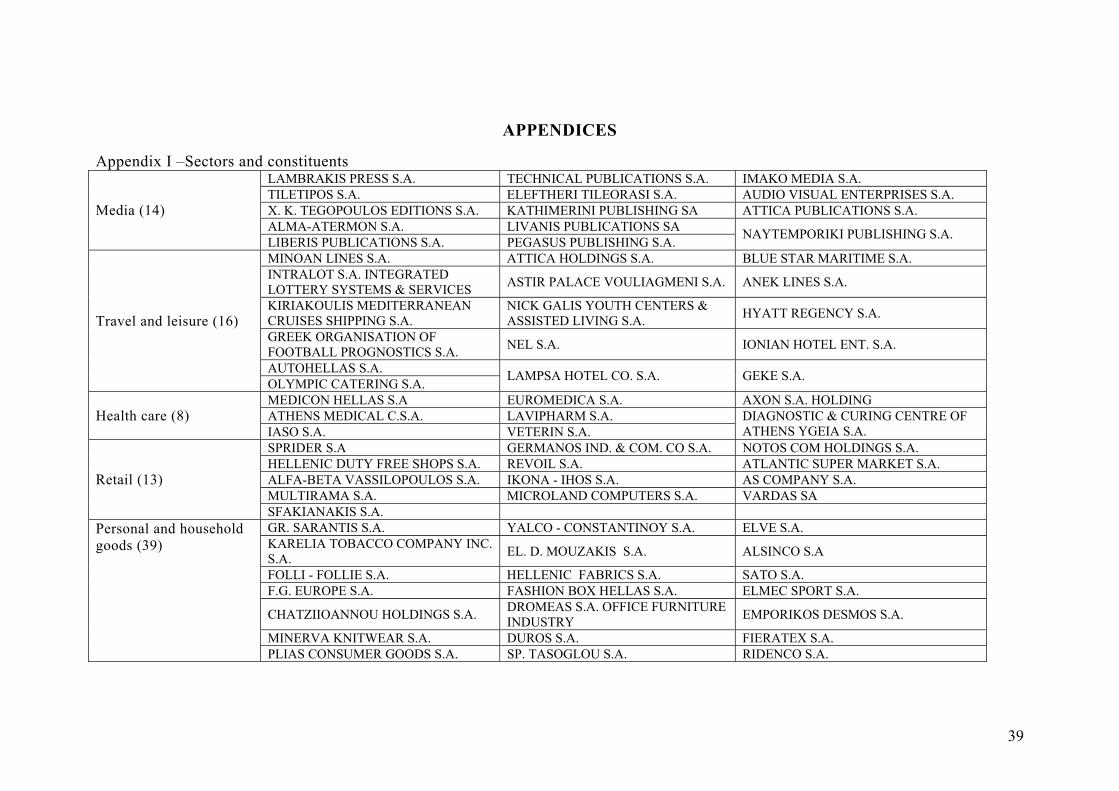
APPENDICES Appendix I –Sectors and constituents
LAMBRAKIS PRESS S.A. TECHNICAL PUBLICATIONS S.A. IMAKO MEDIA S.A. TILETIPOS S.A. ELEFTHERI TILEORASI S.A. AUDIO VISUAL ENTERPRISES S.A. X. K. TEGOPOULOS EDITIONS S.A. KATHIMERINI PUBLISHING SA ATTICA PUBLICATIONS S.A. ALMA-ATERMON S.A. LIVANIS PUBLICATIONS SA
Media (14)
LIBERIS PUBLICATIONS S.A. PEGASUS PUBLISHING S.A. NAYTEMPORIKI PUBLISHING S.A.
MINOAN LINES S.A. ATTICA HOLDINGS S.A. BLUE STAR MARITIME S.A. INTRALOT S.A. INTEGRATED LOTTERY SYSTEMS & SERVICES ASTIR PALACE VOULIAGMENI S.A. ANEK LINES S.A.
KIRIAKOULIS MEDITERRANEAN CRUISES SHIPPING S.A.
NICK GALIS YOUTH CENTERS & ASSISTED LIVING S.A. HYATT REGENCY S.A.
GREEK ORGANISATION OF FOOTBALL PROGNOSTICS S.A. NEL S.A. IONIAN HOTEL ENT. S.A.
AUTOHELLAS S.A.
Travel and leisure (16)
OLYMPIC CATERING S.A. LAMPSA HOTEL CO. S.A. GEKE S.A.
MEDICON HELLAS S.A EUROMEDICA S.A. AXON S.A. HOLDING ATHENS MEDICAL C.S.A. LAVIPHARM S.A. Health care (8) IASO S.A. VETERIN S.A.
DIAGNOSTIC & CURING CENTRE OF ATHENS YGEIA S.A.
SPRIDER S.A GERMANOS IND. & COM. CO S.A. NOTOS COM HOLDINGS S.A. HELLENIC DUTY FREE SHOPS S.A. REVOIL S.A. ATLANTIC SUPER MARKET S.A. ALFA-BETA VASSILOPOULOS S.A. IKONA - IHOS S.A. AS COMPANY S.A. MULTIRAMA S.A. MICROLAND COMPUTERS S.A. VARDAS SA
Retail (13)
SFAKIANAKIS S.A. GR. SARANTIS S.A. YALCO - CONSTANTINOY S.A. ELVE S.A. KARELIA TOBACCO COMPANY INC. S.A. EL. D. MOUZAKIS S.A. ALSINCO S.A
FOLLI - FOLLIE S.A. HELLENIC FABRICS S.A. SATO S.A. F.G. EUROPE S.A. FASHION BOX HELLAS S.A. ELMEC SPORT S.A.
CHATZIIOANNOU HOLDINGS S.A. DROMEAS S.A. OFFICE FURNITURE INDUSTRY EMPORIKOS DESMOS S.A.
MINERVA KNITWEAR S.A. DUROS S.A. FIERATEX S.A.
Personal and household goods (39)
PLIAS CONSUMER GOODS S.A. SP. TASOGLOU S.A. RIDENCO S.A.
39
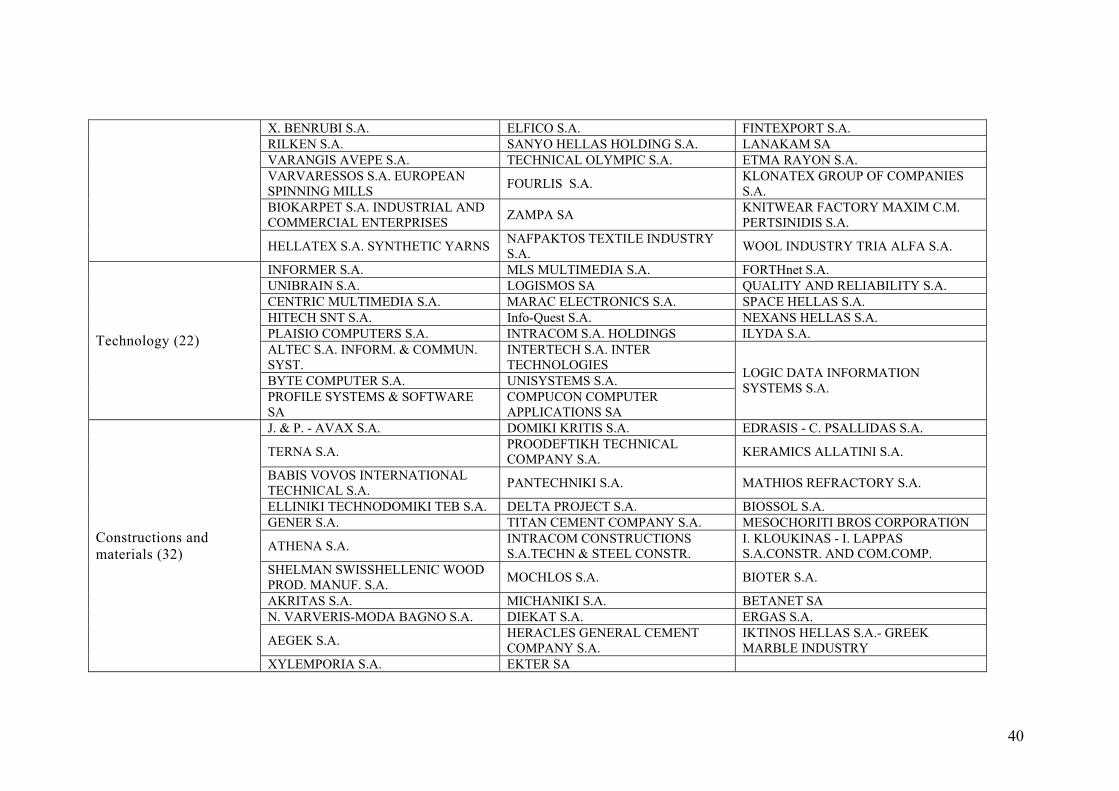
X. BENRUBI S.A. ELFICO S.A. FINTEXPORT S.A. RILKEN S.A. SANYO HELLAS HOLDING S.A. LANAKAM SA VARANGIS AVEPE S.A. TECHNICAL OLYMPIC S.A. ETMA RAYON S.A. VARVARESSOS S.A. EUROPEAN SPINNING MILLS FOURLIS S.A. KLONATEX GROUP OF COMPANIES
S.A. BIOKARPET S.A. INDUSTRIAL AND COMMERCIAL ENTERPRISES ZAMPA SA KNITWEAR FACTORY MAXIM C.M.
PERTSINIDIS S.A.
HELLATEX S.A. SYNTHETIC YARNS NAFPAKTOS TEXTILE INDUSTRY S.A. WOOL INDUSTRY TRIA ALFA S.A.
INFORMER S.A. MLS MULTIMEDIA S.A. FORTHnet S.A. UNIBRAIN S.A. LOGISMOS SA QUALITY AND RELIABILITY S.A. CENTRIC MULTIMEDIA S.A. MARAC ELECTRONICS S.A. SPACE HELLAS S.A. HITECH SNT S.A. Info-Quest S.A. NEXANS HELLAS S.A. PLAISIO COMPUTERS S.A. INTRACOM S.A. HOLDINGS ILYDA S.A. ALTEC S.A. INFORM. & COMMUN. SYST.
INTERTECH S.A. INTER TECHNOLOGIES
BYTE COMPUTER S.A. UNISYSTEMS S.A.
Technology (22)
PROFILE SYSTEMS & SOFTWARE SA
COMPUCON COMPUTER APPLICATIONS SA
LOGIC DATA INFORMATION SYSTEMS S.A.
J. & P. - AVAX S.A. DOMIKI KRITIS S.A. EDRASIS - C. PSALLIDAS S.A.
TERNA S.A. PROODEFTIKH TECHNICAL COMPANY S.A. KERAMICS ALLATINI S.A.
BABIS VOVOS INTERNATIONAL TECHNICAL S.A. PANTECHNIKI S.A. MATHIOS REFRACTORY S.A.
ELLΙNIΚΙ TECHNODOMIKI TEB S.A. DELTA PROJECT S.A. BIOSSOL S.A. GENER S.A. TITAN CEMENT COMPANY S.A. MESOCHORITI BROS CORPORATION
ATHENA S.A. INTRACOM CONSTRUCTIONS S.A.TECHN & STEEL CONSTR.
I. KLOUKINAS - I. LAPPAS S.A.CONSTR. AND COM.COMP.
SHELMAN SWISSHELLENIC WOOD PROD. MANUF. S.A. MOCHLOS S.A. BIOTER S.A.
AKRITAS S.A. MICHANIKI S.A. BETANET SA N. VARVERIS-MODA BAGNO S.A. DIEKAT S.A. ERGAS S.A.
AEGEK S.A. HERACLES GENERAL CEMENT COMPANY S.A.
IKTINOS HELLAS S.A.- GREEK MARBLE INDUSTRY
Constructions and materials (32)
XYLEMPORIA S.A. EKTER SA
40

HELLENIC FISHFARMING S.A. CHATZIKRANIWTIS & SONS MILLS S.A. PERSEUS SPECIALTY FOODS S.A.
ALLATINI Ind. and Com Co. S.A. KRE.KA S.A. DIAS AQUA CULTURE S.A. C. CARDASSILARIS & SONS - CARDICO S.A. INTERFISH AQUACULTURE S.A. DELTA HOLDINGS S.A.
FLOUR MILLS C. SARANTOPOULOS S.A. KTIMA KOSTAS LAZARIDIS S.A. ELAIS - UNILEVER S.A.
KARAMOLENGOS BAKERY INDUSTRY S.A. FLOUR MILLS KEPENOS S.A. KEGO S.A.
KRI-KRI MILK INDUSTRY S.A. EVROFARMA SA STELIOS KANAKIS S.A.
NIREFS S.A. EUROHOLDINGS CAPITAL & INVESTMENT CORP. S.A. HIPPOTOUR S.A.
KATSELIS SONS S.A. BREAD IND. GREGORY'S MIKROGEVMATA S.A. J.BOUTARIS & SON HOLDING S.A. P.G. NIKAS S.A. ELBISCO HOLDING S.A. SELONDA AQUACULTURE S.A. KRETA FARM SA GALAXIDI FISH FARMING S.A DELTA ICE-CREAM S.A.
Food and beverage (31)
ELGEKA S.A. S & B INDUSTRIAL MINERALS S.A. ETEM S.A. ALCO HELLAS S.A. N. LEVENTERIS S.A. BITROS HOLDING S.A. KORDELLOS CH. BROS S.A.
MYTILINEOS HOLDINGS S.A. PIPE WORKS L. GIRAKIAN PROFIL S.A. SIDMA S.A., STEEL PRODUCTS
ALUMINIUM OF GREECE S.A. ELVAL ALUM. PROCESS. Co. S.A. SHEET STEEL CO. S.A.
HALKOR S.A (FORMER VECTOR) A. KALPINIS - N. SIMOS Steel Service Center S.A. SIDENOR S.A. (FORMER ERLIKON)
Basic resources (17)
ALUMIL MILONAS ALUM. IND. S.A. CORINTH PIPEWORKS S.A.
Telecommunications (3) HELLENIC TELECOM. ORG. S.A. COSMOTE - MOBILE TELECOMMUNICATIONS S.A LAN-NET S.A.
Oil and Gas (2) MOTOR OIL (HELLAS) CORINTH REFINERIES S.A.
ELINOIL HELLENIC PETROLEUM COMPANY S.A.
FRIGOGLASS S.A. VOGIATZOGLOU SYSTEMS S.A. CROWN HELLAS CAN S.A. METKA S.A. HELLENIC CABLES S.A. IMPERIO S.A. M. J. MAILLIS S.A. INFORM P. LYKOS S.A. KLEEMAN HELLAS S.A. VIS Container Manufacturing Co. S.A. FLEXOPACK S.A. GEN. COMMERCIAL & IND SA PIRAEUS PORT AUTHORITY S.A. MEVACO S.A. P. PETROPOYLOS S.A
Industrial goods and services (27)
E. PAIRIS S.A NEWSPHONE HELLAS S.A. AUDIOTEX KARATZIS S.A.
41
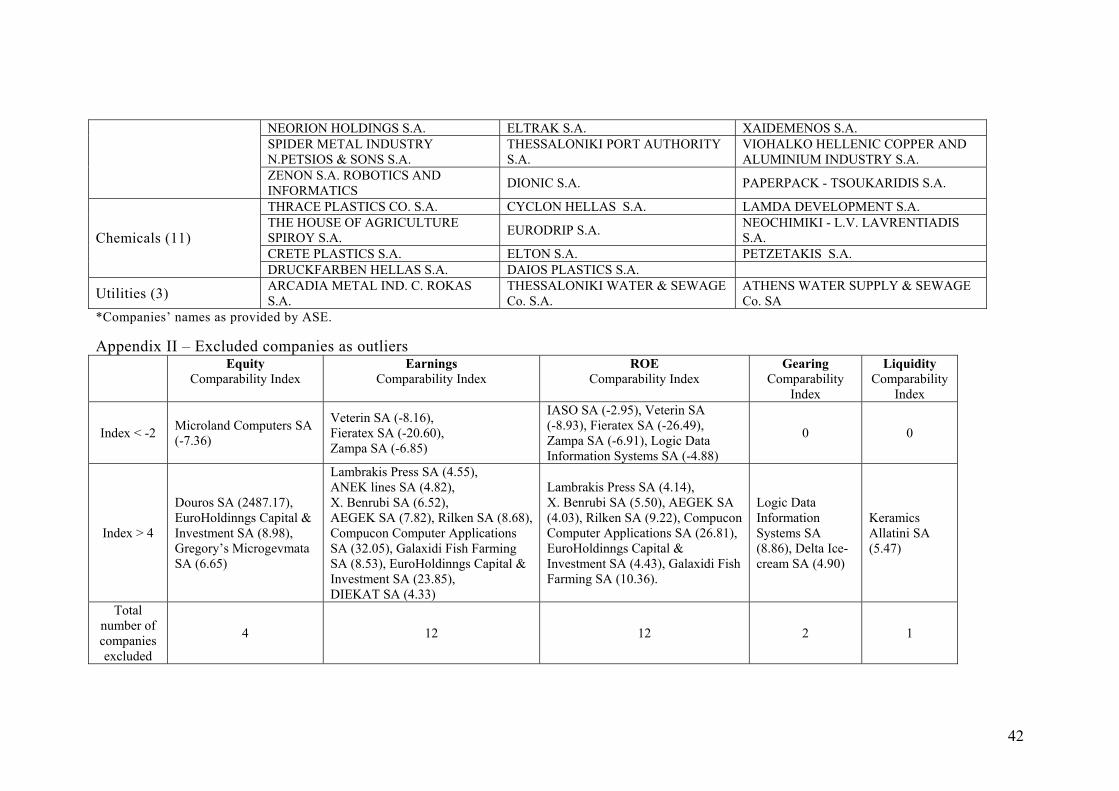
NEORION HOLDINGS S.A. ELTRAK S.A. XAIDEMENOS S.A. SPIDER METAL INDUSTRY N.PETSIOS & SONS S.A.
THESSALONIKI PORT AUTHORITY S.A.
VIOHALKO HELLENIC COPPER AND ALUMINIUM INDUSTRY S.A.
ZENON S.A. ROBOTICS AND INFORMATICS DIONIC S.A. PAPERPACK - TSOUKARIDIS S.A.
THRACE PLASTICS CO. S.A. CYCLON HELLAS S.A. LAMDA DEVELOPMENT S.A. THE HOUSE OF AGRICULTURE SPIROY S.A. EURODRIP S.A. NEOCHIMIKI - L.V. LAVRENTIADIS
S.A. CRETE PLASTICS S.A. ELTON S.A. PETZETAKIS S.A.
Chemicals (11)
DRUCKFARBEN HELLAS S.A. DAIOS PLASTICS S.A.
Utilities (3) ARCADIA METAL IND. C. ROKAS S.A.
THESSALONIKI WATER & SEWAGE Co. S.A.
ATHENS WATER SUPPLY & SEWAGE Co. SA
*Companies’ names as provided by ASE. Appendix II – Excluded companies as outliers Equity
Comparability Index Earnings
Comparability Index ROE
Comparability Index Gearing
Comparability Index
Liquidity Comparability
Index
Index < -2 Microland Computers SA (-7.36)
Veterin SA (-8.16), Fieratex SA (-20.60), Zampa SA (-6.85)
IASO SA (-2.95), Veterin SA (-8.93), Fieratex SA (-26.49), Zampa SA (-6.91), Logic Data Information Systems SA (-4.88)
0 0
Index > 4
Douros SA (2487.17), EuroHoldinngs Capital & Investment SA (8.98), Gregory’s Microgevmata SA (6.65)
Lambrakis Press SA (4.55), ANEK lines SA (4.82), X. Benrubi SA (6.52), AEGEK SA (7.82), Rilken SA (8.68), Compucon Computer Applications SA (32.05), Galaxidi Fish Farming SA (8.53), EuroHoldinngs Capital & Investment SA (23.85), DIEKAT SA (4.33)
Lambrakis Press SA (4.14), X. Benrubi SA (5.50), AEGEK SA (4.03), Rilken SA (9.22), Compucon Computer Applications SA (26.81), EuroHoldinngs Capital & Investment SA (4.43), Galaxidi Fish Farming SA (10.36).
Logic Data Information Systems SA (8.86), Delta Ice-cream SA (4.90)
Keramics Allatini SA (5.47)
Total number of companies excluded
4 12 12 2 1
42

43