comparing responses of triploid and diploid eastern
TRANSCRIPT

COMPARING RESPONSES OF TRIPLOID AND DIPLOID EASTERN OYSTERS, Crassostrea virginica, TO COMMON FARM STRESSORS
by
Sarah R. Bodenstein
A thesis submitted to the Graduate Faculty of Auburn University
in partial fulfillment of the requirements for the Degree of
Master of Science
Auburn, Alabama May 4, 2019
Copyright 2019 by Sarah R. Bodenstein
Approved by
William C. Walton, Chair, Associate Professor, School of Fisheries, Aquaculture and Aquatic Sciences
James Stoeckel, Associate Professor, School of Fisheries, Aquaculture and Aquatic Sciences
Ruth H. Carmichael, Professor of Marine Sciences, University of South Alabama

ii
ACKNOWLEDGEMENTS
I would like to thank my advisor Bill Walton, for taking me on as his student, and teaching me
how to become a better scientist. Thank you to James Stoeckel, Ruth H. Carmichael, F. Scott
Rikard, Glen Chaplin, Brian Callam, Jason Rider, Todd Steury, Grant R. Lockridge, Timothy P.
McDonald, and Pengmin Pan for providing guidance and assistance with this research. Thank
you, as well as the staff at the AUSL, the Michael Voisin Oyster Research Lab and Hatchery,
and the Mississippi Department of Marine Resources for all of their help with field work and lab
work. This research was supported by an award from the Gulf States Marine Fisheries
Commission and by Auburn University.
This thesis is dedicated to my parents, Ira Bodenstein and Julia Smith, who have always
supported my fascination with marine creatures.

iii
ABSTRACT
Commercial off-bottom aquaculture of the Eastern oyster, Crassostrea virginica, is challenged
by repeated spring and summer mortality events that disproportionally affect triploid oysters.
Many farmers believe common farm practices, especially during hot summer months, may cause
triploids to die. This study aimed to investigate how diploid and triploid oysters react differently
to common stressors imposed by farmers such as tumbling during size grading and desiccation to
prevent bio-fouling. A field experiment was run to subject diploids and triploid oysters to these
stressors and monitor their responses. Additionally, lab experiments were performed to assess the
responses of diploid and triploid oysters to desiccation stress using shell-closing strength.
Triploid oysters did not suffer from higher mortality rates than diploid oysters exposed to the
same stress treatment in the field. Furthermore, triploids oysters were less vulnerable to repeated
desiccation stress than diploid oysters during the lab trials. This study did not capture the
environmental conditions that caused higher mortality in triploids, but it does rule-out two
common farm practices as a likely cause. Hence, other factors, potentially environmental stress
or the interaction of environmental factors and farm practices may limit triploid survival and
warrant further study.
Key words: oysters, triploids, mortality, stress, aquaculture, shell-closing strength, SCS
iv
TABLE OF CONTENTS
ACKNOWLEDGEMENTS............................................................................................................ii
ABSTRACT ..................................................................................................................................iii
LIST OF TABLES.........................................................................................................................vi
LIST OF FIGURES .....................................................................................................................vii
CHAPTER ONE: AN OVERVIEW OF EASTERN OYSTER, Crassostrea virginica, BIOLOGY AND AQUACULTURE...............................................................................................1
Overview of Eastern Oyster Biology...................................................................................2
Overview of Oyster Aquaculture.........................................................................................9
Triploidy and Summer Mortality.......................................................................................12
CHAPTER TWO: TESTING CAUSES OF DIFFERENTIAL MORTALITY RATES BETWEEN TRIPLOID AND DIPLOID EASTERN OYSTERS, Crassostrea virginica, IN THE NORTHERN GULF OF MEXICO...............................................................................................17
Introduction........................................................................................................................18
Methods..............................................................................................................................21
Data analysis…….……….....................................................................................26
Results…............................................................................................................................28
Growth Rates….…......………..............................................................................28
Mortality.………...................................................................................................35
Environmental parameters…….............................................................................43
Discussion..........................................................................................................................49
Growth Rates….…......………..............................................................................49
Mortality.………...................................................................................................51
Conclusion.........................................................................................................................54
v
CHAPTER THREE: DEVELOPING A METHOD OF MEASURING SHELL-CLOSING STRENGTH TO GAUGE THE REACTIONS OF DIPLOID AND TRIPLOID EASTERN OYSTERS, Crassostrea virginica, TO DESICCATION STRESS...............................................56
Introduction........................................................................................................................57
Methods..............................................................................................................................60
Developing a Device to Measure SCS…………………………………………...60
Measuring Responses to Desiccation Stress with SCS……..................................64
Trial One: Continuous Desiccation………………….…...........................64
Trial Two: Repeated Desiccation………………….…..............................66
Trial Three: Comparing Adductor Muscles and Condition Indices……...67
Data analysis…….……….....................................................................................68
Results................................................................................................................................72
Trial One: Continuous Desiccation........................................................................72
Trial Two: Repeated Desiccation...........................................................................76
Trial Three: Comparing Adductor Muscles and Condition Indices……...............80
Discussion………………………......................................................................................80
Conclusion……………………….....................................................................................84
LITERATURE CITED…..............................................................................................................86
APPENDIX....................................................................................................................................93
Appendix A ………….......................................................................................................93

vi
LIST OF TABLES
Table Page
CHAPTER TWO: TESTING CAUSES OF DIFFERENTIAL MORTALITY RATES BETWEEN TRIPLOID AND DIPLOID EASTERN OYSTERS, Crassostrea virginica, IN THE NORTHERN GULF OF MEXICO
1. Analysis of variance for growth rate across the three experimental sites......................29
2. Analysis of variance for growth rate at each of the three experimental sites................30
3. Analysis of variance for the interaction between ploidy and tumbling at Grand Bay.....................................................................................................................................34
4. Percent mortality and standard deviations of diploid and triploid oysters during the first sampling period in June……………………….…….….………….…….….……..….…35
5. Analysis of variance for percent interval mortality across the three experimental sites ….………….…….….………….…….….………….…….….……..….………….…….36
6. Analysis of variance for percent interval mortality at each of the three experimental sites ….…….…….….………….…….….………….…….….……..….………….…….37
7. Environmental parameters from May through August ………….................................45
CHAPTER 3: DEVELOPING A METHOD OF MEASURING SHELL-CLOSING STRENGTH TO GAUGE THE REACTIONS OF DIPLOID AND TRIPLOID EASTERN OYSTERS, Crassostrea virginica, TO DESICCATION STRESS
1. Multiple linear regression analysis for shell morphology characteristics and ploidy on initial SCS in Trial One……….…………………………………..…….………………..72
2. Multiple linear regression analysis for shell morphology characteristics and ploidy on initial SCS in Trial One ……...……………………………………………….………….76
3. Linear regressions tests relating initial SCS to time to death, for on each ploidy subjected to each desiccation treatment in Trial Two……………………………...…….80
APPENDIX A
A1. Analysis of variance for percent cumulative mortality across the three experimental sites ….………….…….….…………..….………….…….….……..….………….…….94
A2. Analysis of variance for percent cumulative mortality at each of the three experimental sites ……..……………..….………….…….….……..….………….…….95
vii
LIST OF FIGURES
Figure Page
CHAPTER TWO: COMPARING TRIPLOID AND DIPLOID GROWTH AND MORTALITY IN FARMED OYSTERS, Crassostrea virginica, IN THE NORTHERN GULF OF MEXICO
1. Map of Mobile Bay and Mississippi Sound...................................................................22
2. Diagram of the OysterGro set-up for one farm site......................................................23
3. Shell metrics used for determining growth and condition index ..................................26
4. Plot of oyster growth for each desiccation level, across ploidy, tumbling level and site…..................................................................................................................................30
5. Plot of growth rate for each ploidy at Grand Isle...........................................................31
6. Plot of growth rate for each ploidy at Deer Island.........................................................32
7. Plot of growth rate for each desiccation level at Grand Bay.........................................33
8. Plot of growth rate for the interaction between ploidy and tumbling at Grand Bay......35
9. Plot of percent interval mortality for diploid vs. triploid oysters at Grand Isle…….....38
10. Plot of percent interval mortality for desiccation levels at Grand Isle.......................39
11. Plot of percent interval mortality for tumbling levels at Grand Isle...........................40
12. Plot of percent interval mortality for the interaction between desiccation and tumbling at Deer Island......................................................................................................41
13. Plot of percent interval mortality for desiccation levels at Grand Bay.......................42
14. Plot of percent interval mortality for tumbling levels at Grand Bay..........................43
15. Water temperature at the three experimental sites from May to September …...........46
16. Salinity at the three experimental sites from May to September………….................47
17. Plots of water temperature and salinity for three time intervals at the three experimental sites plotted against triploid and diploid interval mortality…………….....48
CHAPTER 3: DEVELOPING A METHOD OF MEASURING SHELL-CLOSING STRENGTH TO GAUGE THE REACTIONS OF DIPLOID AND TRIPLOID EASTERN OYSTERS, Crassostrea virginica, TO DESICCATION STRESS

viii
1. Photos of reverse pliers used to open oysters …….…………………………..….….61
2. Photos and diagram of complete setup to measure SCS.………………...…….…….63
3. Shell metrics used for determining growth and condition index ................................65
4. Photo of oysters from Trial One drying………………………………………….......66 5. Survival plot of triploid and diploid oysters in Trial One……………………………73 6. Linear regressions for SCS over time of triploid and diploid oysters in Trial One….74 7. Linear regressions for time to death and SCS of triploid and diploid oysters in Trial
One …………………………………………………………………………………..75 8. Survival plots of desiccated and control triploid oysters, and desiccated and control
diploid oysters in Trial Two………………………………………………………….77 9. Linear regressions for SCS over time of desiccated and control triploid oysters and
desiccated and control diploid oysters in Trial Two…………………………………79
APPENDIX A
1. Plot of percent cumulative mortality for tumbling levels at Grand Isle.......................96
2. Plot of percent cumulative mortality for each ploidy at Grand Bay….........................97

1
CHAPTER ONE:
A BRIEF REVIEW OF THE BIOLOGY AND AQUACULTURE OF THE EASTERN
OYSTER, Crassostrea virginica
2
OVERVIEW OF EASTERN OYSTER BIOLOGY
Crassostrea virginica, the Eastern oyster, is benthic organism native to the waters off of
the Eastern United States and Canada. This mollusk, in the Order Ostreoida, is one of the oldest
species of extensively cultured bivalves (Ozbay et al 2014; Sellers & Stanley 1984, Lorio &
Malone 1995). Today Eastern oysters are grown along the east coast of North America, down
through the Gulf of Mexico. In 2013-14 the values of C. virginica harvested in Maryland and
Virginia were $15.7 million and $28 million respectively, making them one of the most valuable
aquaculture products in Chesapeake Bay (NOAA 2017). Bivalve aquaculture, including Eastern
oysters, is considered a sustainable aquaculture production system (Shumway et al. 2003). They
require no feed because they can filter food out of the surrounding water while rejecting less
nutritious particles as pseudofeces before digestion (Newell 2004). While filtering and digesting
suspended particulate matter, oysters can sequester carbon and nitrogen (Newell 2004, Fodrie et
al. 2017). Oyster populations can assimilate land-derived, anthropogenic nitrogen loads via tissue
assimilation, burial, and denitrification (Carmichael et al. 2012). Oysters can also act as carbon
sinks through assimilation into their carbonate shells carbon and burial (Fodrie et al. 2017).
Eastern oysters also play an important role in creating coastal ecosystems. Crassostrea virginica
form oyster reefs providing habitat for sessile plants and animals, and for free-swimming
organisms. Therefore, Eastern oysters are important as they offer economic opportunities as well
as contribute essential ecosystem services
In its natural environments, C. virginica spawns in late spring, as water temperatures rise.
Oysters located farther north spawn at temperatures between 15.5-20°C, and oysters located
farther south spawn at temperatures above 20°C (Wallace 2001). Spawning can continue
throughout spring and into summer depending on water temperatures for that year. Usually,

3
spawning starts in June and peaks in July. Crassostrea virginica are sequential hermaphrodites
and male and female oysters release their sperm and eggs into the water column as broadcast
spawners. A female oyster can produce 15 to 114 million eggs in a single reproductive cycle
(NOAA 2017). The gametes mix and fertilization occurs in the water column. The fertilized eggs
will develop within six hours into free-swimming trochophore larvae, which have cilia and a
small shell. These larvae cannot feed and depend on an internal yolk sac. After 24 to 48 hrs the
trochophore will develop into veliger larvae that are able to capture food and swim with ciliated
vela. After two weeks, larvae will develop a foot and eyespots. This is the pediveliger larvae
stage. Pediveligers look for suitable surfaces, called cultch, on which to settle. Eastern oyster
larvae prefer to settle on a clean, hard substrate such as a shell. Adults are normally found in
sheltered river valleys and bar-built lagoon-estuaries (NOAA 2007; MacKenzie & Wakida-
Kusunoki 1997). Once a surface has been chosen, the pediveliger will cement itself down and
metamorphose into spat (a small oyster). Spat are mostly male though some will transform into
females after their first or second spawning. Furthermore, females can also turn back into males.
Sexual maturity can be reached within four months (Wallace 2001) and Eastern oysters life span
varies greatly depending on water quality conditions (particularly salinity, temperature, and
dissolved oxygen), disease prevalence and virulence, and predator and parasite prevalence
(NOAA 2007; Martin 1987).
Salinity and water temperature, and their interaction, are two of the most important
factors in the growth and mortality of Eastern oysters (Lowe et al. 2017). Crassostrea virginica
is capable of surviving in a wide range of salinities. Larvae can survive in anywhere from 10 to
27.5 ppt while adults have an even wider range of 5 to 40 ppt. Optimal salinity is considered to
be 14 to 28 ppt (Shumway 1996). Oysters are osmoconformers and able to adjust their body

4
fluids with ambient salinity as long as the changes in salinity are gradual and within the range of
tolerance (Hand & Stickle 1977). Despite this salinity tolerance, significant increases in oyster
mortality have been associated with long periods of low salinity during summer months (Munroe
et al. 2013). Abrupt changes in salinity or salinity outside of the tolerance range of oysters cause
valve closure for extended periods of time (Hand & Stickle 1977). Eastern oysters perform
anaerobic metabolism during valve closures which can lead to mortality due to CO2 buildup,
especially at higher temperatures (Rybovich et al. 2016; de Zwaan & Wijsman 1976, Michaelidis
et al. 2005, Lannig et al. 2008, Lombardi et al. 2013).
Water temperature affects the metabolic rates of oysters, and therefore their growth and
mortality (Galtsoff 1964). Eastern oysters have a wide temperature range. Larvae thrive in
temperatures of 20 - 32.5°C and adults thrive in 20 - 30°C (NOAA 2007; Calabrese & Davis
1966). The minimum temperature reported for growth of oyster larvae is 17.5º C (NOAA 2007;
Hofstetter 1977), and Eastern oysters have been reported to survive freezing temperatures in
shallow-water habitats (Galtsoff 1964; Shumway 1996). Exposure to temperatures above 36ºC
negatively affects oyster feeding and metabolism (Galtsoff 1964). Although maximum
temperature tolerances for Eastern oysters have been studied, these tolerances will vary with
salinity, as well as geographic location, genetic adaptability, time of the year, and gonadal
condition (Shumway 1996). Similarly, lower salinity limits depend on temperature, duration of
exposure, and other environmental factors known to affect oyster physiology (Rybovich et al.
2016). Distinctive combinations of temperature and salinity affect oyster mortality and growth
rate differently depending on the origin of the oysters and oyster size. Louisiana oysters grow
more rapidly under lower salinity and higher temperature conditions than other Eastern oyster
populations, particularly those along the Atlantic Coast (Lowe et al. 2017). Lowe et al. (2017)

5
suggested that due to these differences local adaptation may exist (Lowe et al. 2017). Rybovich
et al. (2016) compared the mortality and growth of three oyster size classes (spat, seed, and
market-sized) in different salinity and temperature regimes. Market-sized oysters were most
sensitive to the low salinity - high water temperature combination, and to each separately. Spat
were the least sensitive, only experiencing high mortality at extreme low salinity, and at the low
salinity - high water temperature combination (Rybovich et al. 2016).
Another factor that affects oyster growth and mortality is dissolved oxygen. The amount
of dissolved oxygen in the water depends on a variety of factors including water temperature,
salinity, and depth (Patterson & Carmichael 2018). Dissolved oxygen concentrations decrease as
water temperature, salinity and depth increase in estuarine systems (Kemp & Boynton 1980).
Eastern oysters require at least 3.2 mg L-1 of oxygen and grow best in 5.5 mg L-1 (Patterson
2014). Dissolved oxygen and water temperature influence preferred depth for Eastern oysters to
grow. Oysters growing in warmer waters prefer to be located closer to the surface, as the overall
system has lower dissolved oxygen availability. For example, oysters in cooler Canadian water
prefer a depth of 0.6-2.0 m, while oysters off the coast of Mid-Atlantic States in warmer waters
prefer a depth of 0.6-5.0 m, and oysters in the warmest waters of the Gulf of Mexico prefer
depths of 0.0-4 m (NOAA 2007; MacKenzie & Wakida-Kusunoki 1997; Dugas et al. 1997).
Crassostrea virginica has a higher tolerance for low dissolved oxygen than most other species in
their ecosystem (Stickle et al. 1989, Gray et al. 2002). This tolerance is due to the oyster’s ability
to clamp their valves closed and use anaerobic respiration for several hours if dissolved oxygen
in the surrounding water is low (Widdows et al. 1989; de Zwaan 1983). Oysters can use this
ability to withstand periodic sustained low dissolved oxygen in situ (Patterson & Carmichael
2018) and it may also allow them to survive during periods out of the water such as following

6
harvest or during maintenance of aquaculture stocks. Larger oysters are more vulnerable to low
dissolved oxygen concentrations due to having smaller gill surface area to body weight ratios
than smaller individuals (Shumway & Koehn 1982). The sensitivity of larger oysters to low
dissolved oxygen is further exacerbated at higher temperatures and lower salinity (Patterson &
Carmichael 2018). Therefore, low dissolved oxygen concentrations may contribute to slower
oyster growth and oyster mortality during the summer months. Deviations from any of the
optimal ranges for these water quality parameters (temperature, salinity, and dissolved oxygen)
will slow oyster growth. If the deviations are too great, growth will stop altogether and mortality
can occur (Patterson & Carmichael 2018, Lowe et al. 2017, Rybovich et al. 2016, Munroe et al.
2013, Galtsoff 1964).
Crassostrea virginica grow at an average rate of 25 mm per year, though growth rate is
highly dependent on temperature and food availability (NOAA 2007; Hofstetter 1962; Berrigan
et al. 1991). Shell growth usually occurs in the spring, when food is abundant. Shell growth is
not uniform between the two valves; the left valve grows faster than the right (Galtsoff 1964).
The left valve forms the cup, whose shape is very important for the oyster-on-the-half-shell
market. During the warmer summer months, Eastern oysters spawn and this reproductive process
uses a large portion of an oyster’s energy budget. After spawning season is over, oysters will
have lost a significant amount of “meat weight” and meat quality which makes them undesirable
for harvest (Wallace 2001). Crassostrea virginica grown in the Gulf of Mexico can reach 76 mm
(market size) in 10 - 15 months, depending on the site and year. Eastern oysters grown further
north, in colder waters such as the Long Island Sound, can take up to 5 years to reach this size
(Galtsoff 1964).

7
There are several diseases that affect C. virginica growth and survival. Two such
diseases, MSX and Dermo, have had the greatest negative impact on oyster recruitment,
restoration efforts, and aquaculture (Ozbay 2014; Ewart & Ford 1993, Ford & Tripp 1996, Mann
& Powell 2007). Dermo is caused by the protozoan pathogen Perkinsus marinus. This protozoan
is an intracellular parasite that infects the blood cells and reproduces there. In doing so the
oyster’s cells are destroyed and overall health decreases (La Peyre et al. 1995). The infected
oyster becomes stressed, and gamete production and growth slow. The infection also invades
immune cells suppressing the oyster’s immune response (Hughes et al. 2010). Oysters do not die
immediately after infection. The mortality rate is 50% one year after infection with levels
reaching 80-90% by the third year (NOAA 2007). Dermo is horizontally transmitted from oyster
to oyster via parasites released from the disintegrated, dead oyster tissue (Andrews 1996).
Perkinsus marinus in the water column can be ingested by uninfected oysters and invade the
epithelium of the stomach and intestine. Transmission can also occur via vectors such as
parasitic snails. Dermo was first recorded in the 1940s in Louisiana and Virginia and is
associated with summer oyster mortalities. It is more common in warmer water with high
salinities (Andrews 1996).
MSX, which stands for Multinucleated Sphere X, is an oyster disease caused by the
parasitic protozoan Haplosporidium nelson (Burreson & Stokes 2000). The early stages of the
MSX infection are found in the gills of an oyster. From there, the infection spreads to the
digestive diverticulum, and finally, all the tissues of the oyster are infected with plasmodia,
multinucleated cells (Ford & Haskin 1982). These multinucleated cells are where the disease gets
its name and ranges from 5 to 100 µm in diameter. After the initial infection, oysters start to die
within one month. MSX is not transmitted from oyster to oyster. In fact, at this time it is
8
unknown how MSX is transmitted (Ford & Haskin 1982). MSX was first discovered in 1957 in
Delaware Bay, but one of the most prolific outbreaks happened in the spring of 1959 in
Chesapeake Bay. Within three years, more than 90% of the oysters in the lower bay were
affected. MSX disease is suppressed by low salinities and low temperatures. The parasites cannot
survive in waters with salinities less than 15-20 ppt (Burreson & Stokes 2000).
Other, less prolific, oyster diseases include Roseovarius Oyster Disease (ROD),
previously known as Juvenile Oyster Disease (JOD). It infects hatchery-raised oyster seed and
first appeared in 1988 in Northeastern American hatcheries (Ford & Borrero 2001). ROD is
caused by a marine α–proteobacterium, Roseovarius crassostreae (Boettcher et al. 2005). This
disease infects juvenile oysters under 25 mm in length and causes significant mortalities.
Decreased growth rate is the first sign of infection, and mortalities begin one week later.
Mortality levels range from 20 – 100%. ROD typically occurs at temperatures between 21 and
26°C and salinity ranges from 25-32 ppt (Ford & Borrero 2001). It causes a decrease in growth
rate, unequal shell growth, brown rings (conchiolin rings) on the internal shell surface, and death.
Conchiolin rings are often deposited between the adductor muscle and shell and cause gaping
and eventually death. Mantle epithelium degeneration has also been noted in oysters infected
with ROD (Boettcher et al. 2005).
As of now, there are no treatments that prevent or cure any of the above oyster diseases.
However, over the years a great deal of research has been conducted to breed lines of oysters that
are disease resistant, particularly to Dermo and MSX (Allen et al. 1993). In the late 1950s, Dr.
Hal Haskin was the first to successfully breed oysters that exhibited a natural heritable resistance
for the parasite MSX. He produced five lines of MSX-resistant oysters (Allen, Gaffney & Ewart
1993). In Louisiana, where Dermo causes significant mortalities every year, a line of oysters
9
called ‘OBOY’ has been selectively bred for Dermo-resistance since 1999 (Casas et al. 2017;
Stickle et al. 2001). Casa et al. (2017) recently compared oysters from this line to unselected
oysters stock. They observed less than 10% mortality in the OBOY oysters while the worst-
performing, unselected oysters experienced over 25% mortality from Dermo.
Outside of oyster diseases, two of the dominant factors influencing the growth and
mortality of Eastern oysters in the Gulf of Mexico are water temperature and salinity (La Peyre
et al. 2003, La Peyre et al. 2013, Rybovich et al. 2016). Low salinity events have been to be
significant predictors of oyster mortality. Additionally, high water temperature has a significant
positive correlation with mortality (La Peyre et al. 2013). The interaction between salinity and
water temperature also control oyster growth and mortality. The low salinity - high water
temperature combination in particular increases oyster mortality and is not an unusual occurrence
in Gulf of Mexico waters (Rybovich et al. 2016). These two factors greatly affect oyster
aquaculture are common causes of oyster mortality in Gulf Coast waters.
OVERVIEW OF OYSTER AQUACULTURE
Intense commercial harvest of the Eastern oysters began during the industrial revolution.
New technology, such as dredges, permitted oystermen to harvest oyster beds in deep water that
had previously been untouched (Kirby 2004). In addition, with the advent of canning, which
allowed oyster meat to be preserved, the demand for oysters soared (Mackenzie 1996). By 1875,
17 million bushels were taken from the Chesapeake Bay alone. Harvesting in the Bay peaked in
the 1880s, with 20 million bushels being harvested each year (Mackenzie 1996). By the 1920s
oyster harvests began to decline and today, harvests of Eastern oysters are now less than 1% of
historical levels due to over-harvesting, changes in water quality, and disease (NOAA 2017).
10
Following this decline in production in the 1920s the oyster industry started looking for a new
solution: farming oysters.
There are several different culture systems used to grow C. virginica, ranging from very
simple to complex. The simplest form of oyster culture is called on-bottom shell-cultch method
and involves “planting” cultch in the sediment (Wallace 2001). Cultch, usually treated (aged in
the sun) shells, provides a clean, hard surface for juvenile oysters to settle on and grow. These
oysters can be harvested in one to three years depending on growth rates and water temperature.
After harvest, more cultch is planted to provide more substrate for new oysters to settle. Cultch
must be planted in the right location relative to an oyster reef (Lorio & Malone 1994). Cultch
must be planted in a location where water currents will carry oyster larvae from the reef to the
farm site or no larvae will be available to settle. More intensive on-bottom shell-cultch methods
involve seeding the culture site with spat already set on the cultch (or shell), which decreases
dependence on natural recruitment and allows the culture of selected lines (Lorio & Malone
1994).
Most types of more intensive C. virginica aquaculture rely on spawning larvae in a
hatchery. In hatcheries, spawning is induced by raising the water temperature to 15-20°C in
shallow tanks containing 20 to 30 large oysters (broodstock). After the oysters have had time to
acclimate, warm water, usually 5 ºC higher than ambient temperature, is pumped into the tank to
induce spawning (Wallace et al. 2008). If this technique does not work within an hour, sperm can
be stripped from a male and delivered by pipette to the shell openings of several oysters to
stimulate spawning (Wallace 2001). After spawning has occurred, the eggs and sperm are mixed
together. Fertilized eggs develop into free-swimming larvae after 24 hrs. These larvae are
typically kept in large rearing tanks and fed algae, usually Isochrysis galbana, Chaetocero

11
calcitrans, or Thalassiosira pseudonana (Wallace et al. 2008). These algae can either be grown
in the hatchery using tall, clear fiberglass tubes or large plastic bags. Algae is pumped into the
larvae holding tanks via tubing (Wallace et al. 2008). The cost of producing enough algae to feed
oyster larvae can be quite high and so oysters are moved into the natural environment as quickly
as possible (FAO 2015). Every few days the larvae are strained through a series of differently
sized sieves to separate larvae of different sizes into separate tanks. At ten to sixteen days of age,
the larvae develop into pediveligers. Pediveligers are the last larval stage of an oyster in which
the veliger develops a foot and seeks a substrate on which to settle (Galtsoff 1964). The
pediveligers are sieved from the tanks and allowed to settle on cultch or micro-cultch depending
on the culture method (Wallace et al. 2008).
An increasingly popular and profitable method of oyster farming is the single oyster
method. In the single oyster method, pediveliger oyster larvae are placed into settling containers
that hold microcultch, finely ground cultch, around 250 microns (Supan 2002). Microcultch can
be ground up bivalve shells or chicken egg shells. These pieces of microcultch are so small that
only one pediveliger can attach to each piece, thus allowing each oyster to grow individually.
Individual oysters are more desirable for the halfshell market as their shells tend to grow
uniformly and have a deep cup. Pediveligers are introduced at a rate of 236 per cm2 into settling
containers (Wallace 2001). These containers are barrels with fine mesh bottoms, usually 150
microns, covered in microcultch. Settling containers are suspended in large raceways or troughs
of filtered seawater. At first, water is gently pumped downwards into these containers. This
system is known as a downweller system. After 48 hours, once the larvae have settled, the spat
are moved to upweller systems (Wallace et al. 2008). The water is pumped upwards through the
mesh on the bottom of the settling containers. The water provides food, removes waste, keeps

12
out larger organisms like sea squirts, and reduces fouling on the screen bottoms (FAO 2015). As
the oysters grow in the upwellers they are moved to barrels with larger mesh bottoms to reduce
clogging of the mesh and increase water flow. When oysters reach 8 - 10 mm in size, about a
month after settling, they are placed in mesh bags or cages and put out into the grow site or farm
site (Lorio & Malone 1994). Single oysters would face high predation risk if not protected in
bags or cages and are grown off-bottom so as to not be smothered by soft sediment.
Off-bottom farming methods are those methods where oysters bags are not sitting directly
on the sea floor. There are a wide variety of off-bottom farming methods and gear types. The
method chosen is dependent on a farmer’s personal preference, investment and operating costs,
profitability, desired farm layout, availability of equipment and replacement parts, ease of
handling, durability, and likelihood of surviving severe weather (Walton et al. 2013). The
Auburn University Shellfish Laboratory, for example, uses the suspended and floating culture
methods. Suspended culture is any method where the gear allows oysters to hang in the water
column at a set depth (Walton et al. 2012). A common way of achieving this is with baskets hung
from long lines that run between poles driven into the sediment. Long lines can be rigged to be
adjustable so if the farmer desires the baskets can be raised out of the water to dry and reduce
biofouling. Floating culture, by contrast, is where oysters float at the surface of the water in
floating bags or cages (Davis et al. 2012). OysterGro cages are a commonly used gear type in
floating culture. These consist of cages, wherein bags of oysters are stored, suspended below
large floats in a vinyl-coated wire mesh cage. Cages can be flipped up out of the water (with the
floats underneath) to desiccate oysters when desired. Desiccation is a means of controlling
biofouling (Davis et al. 2012). Oysters can become overgrown with marine organisms such as
sea squirts, barnacles, mussels and bryozoans. The cages must be flipped over regularly to kill
13
parasites and algae. Additionally, oysters in floating gear are naturally tumbled by wave action,
potentially giving them the deep cup desired in restaurants (Walton, pers. comm.).
While some gear types will naturally tumble and desiccate oysters, it is common practice
for farmers to intentionally do so to improve the quality of their crop (Ring 2012). To tumble
their oysters, farmers run them through a rotary style mechanical grader or tumbler. This
machine sorts the oysters by size and chips away at the fragile edges of the oyster shells. In
doing so, the apparent size of the oyster is reduced (Walton, pers. comm.). Consequently, the
marketability of the oysters increases, because the meat is relatively plumper and the shells are
thicker. It is recommended that farmers tumble their oysters once per month (Ring 2012). To
desiccate their oysters, farmers remove them from the water and expose them to the ambient air.
The method of doing so depends on the gear type. Long-line baskets are adjusted to hang out of
the water and OysterGro are flipped so cages are out of the water. Generally, farmers will
desiccate oysters for 18-24 hrs once a week (Walton, pers. comm.). In the warmer, more
nutrient-rich waters C. virginica grow faster and can be ready to harvest in as little as 9 months
when using off-bottom methods. However, between 10 and 15 months is a more typical harvest
age (NOAA 2007, Shumway 1996). If farmers wish to grow oysters more quickly or harvest
during spawning season they must grow triploid oysters.
TRIPLOIDY AND SUMMER MORTALITY
Many advances have been made to oyster aquaculture over the years, and one such
innovation is the development of triploid oysters. Triploid oysters, those with three sets of
chromosomes (3n) rather than the usual two sets (2n) or diploidy are now commonly used in
aquaculture. Triploid oysters were introduced in the 1980s due to apparent faster growth

14
compared to diploid siblings. Triploidy can be induced chemically in oysters with the use of
cytochalasin B, a substance that can stop the extrusion of one set of chromosomes. Triploid
oysters can also be produced by mating a tetraploid, 4n, male with a diploid female (Allen,
Gaffney & Ewart 1993), and is the current method of commercial production in the US. Triploid
oysters have reduced gametogenesis and are unlikely to spawn. Therefore, triploids do not
expend as much energy on reproduction and can grow faster and reach market size sooner than
diploids (Maryline et al. 2019; Benfey, 1999). Stanley et al. (1984) performed some of the first
work demonstrating that triploid C. virginica had faster growth rates than their diploid controls.
Allen & Downing (1986) observed that triploid C. gigas triploids continued to grow and used
less of their stored glycogen reserves through the period of gametogenesis than diploids.
Therefore, triploids do not use their glycogen reserves for gametogenesis and have more energy
available for growth and higher meat quality relative to their diploid counterparts (Nell 2002).
Wallace (2001) indicated that triploid oysters can weigh 30 to 60% more than diploid oysters
that were grown for the same length of time in the same conditions. Raising triploid oyster has
become increasingly popular in recent years due to their increased growth rates and higher meat
quality. In 2014, triploids made up 91% of growers' plantings in Virginia (NOAA 2017). The
Auburn University Shellfish Laboratory has produced oyster seed (juvenile oysters) for farms in
the Gulf of Mexico; in 2017, these orders were dominated by triploid seed. More than 30 million
triploid larvae were produced and sent to oyster hatcheries in the Gulf and 36 million triploid
seed were sent to off-bottom oyster farms in the region. Only 6 million diploid seed were ordered
(Rikard unpubl. data).
Triploids were originally developed in part to address the complex issue of summer
mortalities. Triploids have poorly developed gonads and rarely spawn, and so scientist believed
15
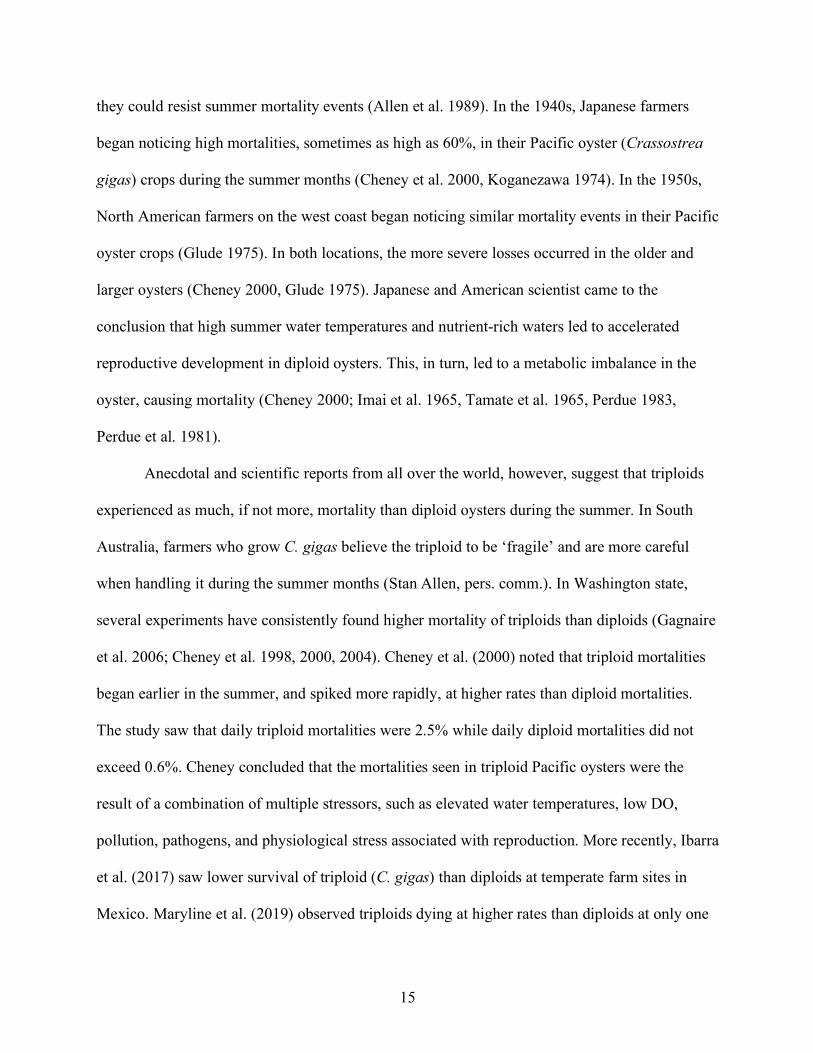
they could resist summer mortality events (Allen et al. 1989). In the 1940s, Japanese farmers
began noticing high mortalities, sometimes as high as 60%, in their Pacific oyster (Crassostrea
gigas) crops during the summer months (Cheney et al. 2000, Koganezawa 1974). In the 1950s,
North American farmers on the west coast began noticing similar mortality events in their Pacific
oyster crops (Glude 1975). In both locations, the more severe losses occurred in the older and
larger oysters (Cheney 2000, Glude 1975). Japanese and American scientist came to the
conclusion that high summer water temperatures and nutrient-rich waters led to accelerated
reproductive development in diploid oysters. This, in turn, led to a metabolic imbalance in the
oyster, causing mortality (Cheney 2000; Imai et al. 1965, Tamate et al. 1965, Perdue 1983,
Perdue et al. 1981).
Anecdotal and scientific reports from all over the world, however, suggest that triploids
experienced as much, if not more, mortality than diploid oysters during the summer. In South
Australia, farmers who grow C. gigas believe the triploid to be ‘fragile’ and are more careful
when handling it during the summer months (Stan Allen, pers. comm.). In Washington state,
several experiments have consistently found higher mortality of triploids than diploids (Gagnaire
et al. 2006; Cheney et al. 1998, 2000, 2004). Cheney et al. (2000) noted that triploid mortalities
began earlier in the summer, and spiked more rapidly, at higher rates than diploid mortalities.
The study saw that daily triploid mortalities were 2.5% while daily diploid mortalities did not
exceed 0.6%. Cheney concluded that the mortalities seen in triploid Pacific oysters were the
result of a combination of multiple stressors, such as elevated water temperatures, low DO,
pollution, pathogens, and physiological stress associated with reproduction. More recently, Ibarra
et al. (2017) saw lower survival of triploid (C. gigas) than diploids at temperate farm sites in
Mexico. Maryline et al. (2019) observed triploids dying at higher rates than diploids at only one

16
of three experimental sites in France, but up to 54% of some triploid batches died at that site. The
study also saw unexpectedly high levels of advanced gametogenesis in triploid oysters and
detected the Vibrio aestuarianus pathogen, both of which corresponded with mortality events.
Higher triploid mortality is a trend seen in multiple oyster species all over the world that could
limit the growth potential of oyster aquaculture.
Triploid summer mortality events have also been detected at oyster farms on the Gulf of
Mexico coast. In 2016 and 2018, farmers in Alabama noticed unexpectedly high levels of
mortality in their oyster crops, and many of these mortalities were associated with triploids
(Walton, pers. obs.). Wadsworth et al. (2019) compared the mortality of diploids and triploids
deployed adjacent to oyster farms at four different sites in waters off the coast of Alabama. This
experiment started in late 2016 and data on growth and survival were collected through October
2017. It was discovered that at all four grow-out sites, triploid oysters had significantly higher
cumulative summer mortality than diploid oysters. Perkinsus marinus infection levels were
measured in this study but were not the primary cause of mortality at all sites. However, the
pathogen could have been a contributing factor at sites with higher salinity. The experiment
concluded that a number of potential stressors could have influenced the increased triploid
summer mortality, with no clear single factor. The potential stressors included salinity,
temperature, food supply, flow rate, disease presence, gametogenesis and age of the oyster.
Despite previous studies, the exact causes of triploid summer mortality events are inconclusive
and likely complex. The need to understand and prevent triploid summer mortalities is vital to
the continued success of the oyster industry.

17
CHAPTER TWO:
COMPARISON OF MORTALITY RATES BETWEEN TRIPLOID AND DIPLOID EASTERN
OYSTERS, Crassostrea virginica, IN THE NORTHERN GULF OF MEXICO

18
INTRODUCTION
Crassostrea virginica, the eastern oyster, is native to the waters off of the Eastern United
States and Canada. Today eastern oysters are grown along the east coast of North America, down
through the Gulf of Mexico. The estimated value of total US eastern oyster aquaculture
production in 2015 was $173 million (NOAA Fisheries 2015). The industry is growing,
especially in the Northern Gulf of Mexico off the coasts of Alabama, Mississippi, Florida, and
Louisiana. Off-bottom oyster farming has increased in Louisiana, Alabama, and Florida in recent
years, and permits are being sought in Mississippi (Casas et al. 2017). In Alabama alone in 2016,
oyster farmers harvested at least 2.6 million oysters with a farm-gate value of nearly $2 million
(Grice & Walton 2017). In each state, new farms are being started and current farms are
expanding operations, through increased acreage and increased production per acre (Walton,
pers. obs.). However, a major problem facing the industry is summer mortality events (Casas et
al. 2017).
Summer mortality is a concern for both diploid and triploid oysters, both of which are
commonly used in aquaculture. Triploidy is a condition in which the animal retains three sets of
chromosomes, 3n, rather than the usual two sets, 2n or diploidy. Triploid oysters have reduced
gametogenesis and therefore rarely spawn. Consequently, they expend less energy on
reproduction and can grow faster and reach market size sooner than diploid oysters. One study
indicated that triploids can weigh 30 to 60% more than diploids that were grown for the same
length of time in the same conditions (Wallace 2001). Reduced gonad production in triploids
also improves the meat quality. Raising triploid oyster has become increasingly more popular in
recent years. In 2014, triploids made up 91% of growers' plantings in Virginia (Hudson &
Murray 2015). In the Gulf of Mexico, the use of triploids is pervasive. The Auburn University

19
Shellfish Laboratory (AUSL) produces oyster seed (juvenile oysters) for farms in the Gulf of
Mexico. In 2017, the lab filled 85% of commercial seed orders for farms in the Gulf and these
orders were dominated by triploid seed. The Auburn Shellfish Lab produced and shipped over 30
million triploid larvae to oyster hatcheries in the Gulf and 36 million triploid seed to off-bottom
oyster farms in the region. Only 6 million diploid seed were ordered (Rikard unpubl. data).
There is an increasing concern in the industry that triploid oysters are more sensitive to
summer mortality events. In South Australia, farmers who grow Crassostrea gigas, the Pacific
oyster, believe the triploids to be ‘fragile’ and are more careful when handling them during the
summer months (Stan Allen, pers. comm.). In summer 2016, several farmers in Alabama noticed
unexpectedly high levels of triploid oyster mortality. Some saw rates as high as 91-100%
mortality, with the majority of the mortality occurring over only a few weeks in early July
(Wadsworth 2017). In early May of 2018, a local commercial farm located in Grand Bay,
Alabama reported triploid mortality around 30% (Walton, pers. comm). The causes of these
events are inconclusive, and the need to reduce triploid summer mortalities is vital to the
continued success of the oyster industry. A study at AUSL (Wadsworth et al. 2019) compared
the mortality of diploids and triploids deployed adjacent to oyster farms at four different sites off
the coast of Alabama. This experiment started in late 2016 and data on growth and survival was
collected through October 2017. It was discovered that while triploids demonstrated a significant
growth advantage over diploids, they suffered from higher mortality levels, particularly during
warm months (June and August). The experiment concluded that there was a clear difference in
vulnerability to stressors between ploidies and that there were a number of potential stressors that
could have influenced the increased summer mortality (Wadsworth et al. 2019). Though

20
disproportionate triploid mortality has been observed, more data is needed to understand the
interacting factors that may contribute to higher summer mortality in triploids.
In addition to naturally occurring environmental stressors, oysters are subject to stressors
imposed by aquaculture activities as well. Desiccation and tumbling are two such potentially
imposed stressors. Desiccation is the practice of exposing oysters to ambient air for extended
periods of time to reduce biofouling and infestation of many marine parasites (Grodeska et al.
2016). It is common for farmers to desiccate oysters for 18-24 hrs duration once a week.
Tumbling is the process of running oysters through a rotary style mechanical grader, or tumbler,
in order to sort the oysters by size (Ring 2012). It has the added benefit of chipping away fragile
new shell-growth thus reducing the apparent size of the oyster. Tumbling positively influences
the marketability of the oysters as the meat inside the now smaller shell looks larger. It is
recommended that farmers tumble their oysters once per month; there is no increased benefit to
handling oysters more frequently (Ring 2012). The kind of stress desiccating or tumbling
imposes on oysters is known as pulse perturbation. Pulse perturbations are changes in the
environment, or environmental parameters, that last for a short, discrete period of time. After the
perturbation has passed the ecosystem has time to recover and returns to the pre-perturbed state,
call equilibrium (Arnoldi et al. 2018). Measuring the response of oysters to a pulse perturbation,
or stressor event may give insight into how different ploidies react to disturbances typically
experienced on an aquaculture farm. Triploids, already stressed from increased summer water
temperatures, are predicted to react more poorly to aquaculture-related stressor events. This
experiment aimed to test two possible causes of increased triploid summer mortality by
subjecting oysters to common stressors potentially imposed by farmers: tumbling during
21
mechanical grading and desiccation. Based on the results, best farm management practices can
be recommended to farmers to reduce summer mortality.
METHODS
This experiment was conducted at three farm sites across the Northern Gulf of Mexico
(Fig 1). Sites in different states were chosen so that results could reflect the variable growing
conditions across the northern Gulf and also engage commercial oyster farmers in collaborative
research. The first site was at Grand Bay Oyster Park in Grand Bay, AL, at an AUSL research
site. The second site was at Deer Island in Biloxi, MS in cooperation with the Mississippi
Department of Marine Resources. The third site was at the Michael Voisin Oyster Research Lab
and Hatchery in Grand Isle, LA in cooperation with Louisiana Sea Grant and Louisiana State
University.

22
Figure 1. A map of the three farm sites; Grand Bay, AL (circle), Deer Island, MS (triangle), and Grand Isle, LA
(square).

23
At each of the three sites, seven OysterGro cages were deployed in early April 2018 (Fig
2). Each cage held six, oyster 12-mm grow-out bags (36cm x 18.9cm x 7.6cm). Three bags in
each cage contained diploid oysters and three bags contained triploid oysters, in an alternating
pattern. All oysters were twelve-month-old, half-sibling triploids and diploids spawned and
raised at AUSL and grown out in Portersville Bay in 2017. Each bag was initially stocked with
seventy-five oysters. There was a total of forty-two bags per site with a grand total of one
hundred and twenty-six bags across all three sites. All oysters were allowed to acclimate for one
month after being deployed. In early May the first stressor trial was imposed on the oysters at all
three sites, because it was qualitatively observed in prior years that oyster mortality begins to rise
at this time of year, with warming water temperatures.
At each site, each of the seven cages was randomly assigned to a two-factor stressor
treatment: desiccation x tumbling. There were four possible levels of desiccation (0, 18, 24 or 48
hrs) and two possible levels of tumbling (tumbled or not through a mechanical grader). This
approach produced a total of seven stressor treatments; 0 hrs of desiccation and not tumbled (0N
or the control), 18 hrs of desiccation and not tumbled (18N), 18 hrs of desiccation and tumbled
(18Y), 24 hrs of desiccation and not tumbled (24N), 24 hrs of desiccation and tumbled (24Y), 48
hrs of desiccation and not tumbled (48N), and 48 hrs of desiccation and tumbled (48Y). There
was no ‘tumbled by 0 hrs’ treatment because oysters must come out of the water to be tumbled.
Each treatment had three replicates per ploidy per site due to each OysterGro containing three
bags of triploids and three of diploids.
Two HOBO Pendant® MX Water Temperature Data Loggers were placed at each site to
track temperature fluctuations. To ensure the rate of temperature change would more accurately
reflect conditions inside of an oyster shell, each logger was inserted between two oyster shells

24
that were bound together with zip ties. One logger was placed inside a control bag (0N) to
monitor water temperature for the duration of the experiment. The other logger was placed inside
a bag in the 48Y treatment to monitor temperature changes for oysters taken out of the water to
be tumbled and desiccated.
Figure 2. A diagram of the OysterGro set-up for one farm site. Three are in the drying position and four are in the
submerged position. Photo credit: Victoria Pruente, Auburn University Shellfish Lab.
Oysters that were desiccated and not tumbled stayed in their OysterGro cage, which was
flipped to the drying position, with floats down. The cage was then flipped back over to the
submerged position, floats up, once the appropriate amount of time had passed. Oysters that were
desiccated and tumbled were removed from their cage and taken to the mechanical grader at each
site to be tumbled. At Grand Isle, the grader was located on land adjacent to the oyster farm. At
Grand Bay and Deer Island, the graders were located farther from the farm sites, and oysters
needed to be driven about 20 minutes to be tumbled. Each bag was fed through the grader, one at
a time in a random order, and all oysters were placed back in the bag before the next one was
started. Tumbled oysters were left to desiccate on land overnight before being returned to their
respective cages, already flipped to the drying position, the following morning. These cages were
then flipped back over once the appropriate amount of desiccation time had passed, inclusive of
the overnight desiccation on land.

25
Oysters at each site were allowed to sit for approximately one month after the stressor
trial at that site had been completed. In June, samples were taken to assess oyster mortality and
growth rate. Mortality was measured by counting the number of living and dead oysters in each
bag. Growth rates were evaluated by using calipers to measure the length, height, and width to
the nearest 0.01 mm (Fig 3) of five haphazardly selected oysters from each bag. Growth rates
were calculated using Equation 1. The natural log response ratio (RR) was used to compare
triploid and diploid growth rates within the same stressor treatment (Equation 2). Interval
mortality and cumulative mortality were calculated for each bag (Equations 2 and 3,
respectively). Due to very low observed mortality at this time point, at the start of the following
month (July), the stressor trials were run again at all sites to impose the stressors during a
warmer period. Approximately one month after the second round of stressor trials, in August,
mortality, and growth rates were again assessed. In September, one final round of sampling was
performed to track any residual impacts the imposed stress might have had on mortality and
growth.
During the first stressor trial at the Deer Island site, three bags of triploids and one bag of
diploids were accidentally mixed during tumbling. As a result, no data are available for two
triploid replicates in the 18Y treatment and one triploid and one diploid replicate in the 48Y
treatment.
26
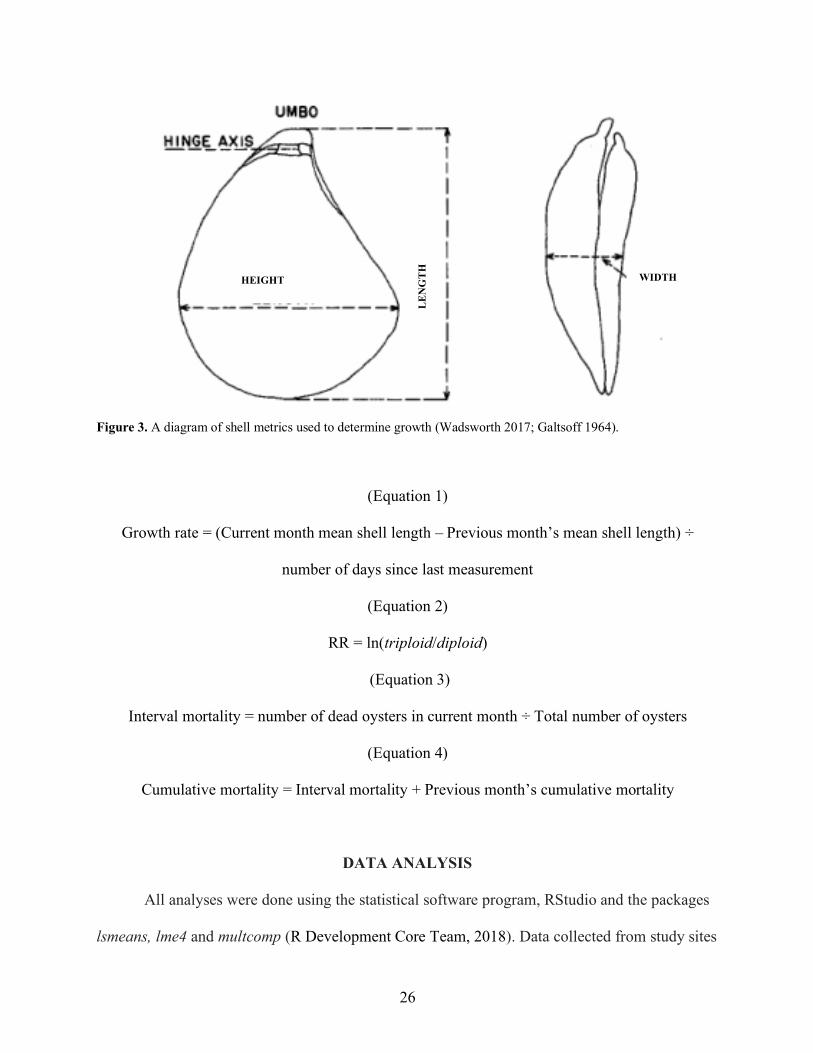
Figure 3. A diagram of shell metrics used to determine growth (Wadsworth 2017; Galtsoff 1964).
(Equation 1)
Growth rate = (Current month mean shell length – Previous month’s mean shell length) ÷
number of days since last measurement
(Equation 2)
RR = ln(triploid/diploid)
(Equation 3)
Interval mortality = number of dead oysters in current month ÷ Total number of oysters
(Equation 4)
Cumulative mortality = Interval mortality + Previous month’s cumulative mortality
DATA ANALYSIS
All analyses were done using the statistical software program, RStudio and the packages
lsmeans, lme4 and multcomp (R Development Core Team, 2018). Data collected from study sites
LE
NG
TH
HEIGHT WIDTH

27
in summer 2018 were initially analyzed by site (2 df), ploidy (1 df), desiccation (3 df), tumbling
(1 df), and the interaction between the four (84 df) for the following response variables: final
shell length, growth rate (change in shell length in mm per day), and percent interval mortality.
Analysis of variance (ANOVA) tests were used to determine statistical significance between
each factor (site, ploidy, tumbled, and desiccation) and the response variables (growth rate and
mortality). When an interaction was found between sites for a response variable, each site was
analyzed separately for that variable still using ANOVA. Post-hoc analyses were performed
using the Tukey’s post-hoc criteria. The normality of residuals was determined using the
Shapiro-Wilk test. Data were considered normally distributed when p > 0.05. The parameters of
final shell length and growth rate were found to be normal. Percent interval mortality data were
found to be non-normal. Percent mortality was calculated by dividing the number of dead oysters
(from June and August) by the total number of oysters originally in each bag (75) and then
multiplying that number by one hundred. The number of oysters originally in each bag was used
and not the number alive at the end of June to capture percent mortality from May to August.
The percent mortality data were found to be non-normal using a Shapiro-Wilk test. The data
were log transformed to restore normality.
Water temperature data was collected from HOBO sensors placed at each site. At the
Grand Isle and Deer Island sites salinity data was collected from USGS sensors and at Grand
Bay salinity data was collected from an Aquatrol Sonde at the site. Analysis of variance
(ANOVA) tests were used to determine statistical differences between water temperature and
salinity at each site (GI, DI, and GBOP). Additionally, plots of water temperature and salinity for
three time intervals (May-June, June-August, and August-September) at each site were plotted

28
against triploid and diploid mortality levels at each site. This was done in an attempt to discern
possible patterns between the two environmental parameters and mortality.
RESULTS
GROWTH RATES
At deployment in April, diploid oysters had an average shell length of 68.3 ± 10.48 mm,
while triploid oysters had an average shell length of 61.51 ± 7.65 mm. A multivariate analysis of
oyster shell length, height, and width showed that there was a difference in these shell
morphology parameters among sites (p < 0.001), ploidies (p < 0.001), treatments (p < 0.01), and
an interaction between site and ploidy (p < 0.001). Due to this large initial difference in all three
shell morphology parameters, the analysis was done on the change in oyster size, as an
approximation of oyster growth rate. Growth rate, in mm day-1, was calculated with the change
in length (mm) of oysters from the average initial size in April to the final individual size in
September 2018. Growth rate was significantly affected by ploidy (Table 1). By the end of the
experiment in September, at each site, triploid oysters had a growth advantage over diploid
oysters, across all treatments (Tukey post-hoc pairwise, p £ 0.001, for all comparisons). The
triploid advantage was 13.0% at Grand Isle, 44.9% at Deer Island, and 42.0% at Grand Bay.
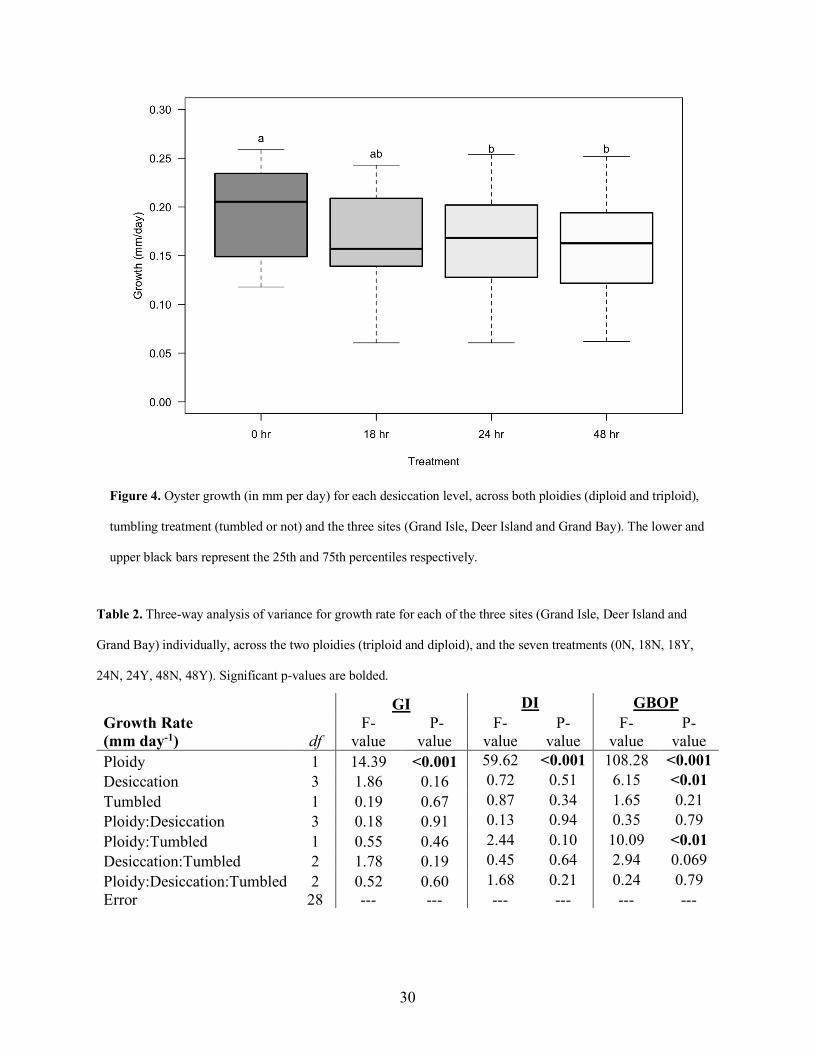
Growth rate was also significantly affected by desiccation treatments (Table 1). Across all sites,
oysters subjected to the 24 or 48 hrs of desiccation had on average 18% slower growth than
oysters that were not desiccated at all (Tukey’s post-hoc p £ 0.04 for all comparisons) (Fig 4).
Additionally, there was a three-way site x ploidy x tumbling interaction (Table 1). Given the
expected environmental variation among sites, this interaction led us to analyze each site
separately, focusing on the effects of ploidy, desiccation and tumbling (and their interactions).

29
Table 1. Four-way analysis of variance for growth rate across the three sites (Grand Isle, Deer Island and Grand
Bay), the two ploidies (triploid and diploid), two tumbling levels (No and Yes), and the four desiccation levels (0,
18, 24, and 48 hrs). Degrees of freedom (df), Sum of Square (SM), F-values, and p-values are reported. Significant
p-values are bolded.
Growth Rate (mm day-1) df
F value P-value Site 2 16.21 <0.001 Ploidy 1 144.59 <0.001 Desiccation 3 4.77 <0.01 Tumbled 1 0.77 0.38 Site:Ploidy 2 5.57 0.01 Site:Desiccation 6 1.42 0.22 Ploidy:Desiccation 3 0.39 0.76 Site:Tumbled 2 0.77 0.47 Ploidy:Tumbled 1 1.36 0.25 Desiccation:Tumbled 2 0.76 0.47 Site:Ploidy:Desiccation 6 0.11 0.10 Site:Ploidy:Tumbled 2 4.55 0.01 Site:Desiccation:Tumbled 4 2.07 0.09 Ploidy:Desiccation:Tumbled 2 1.72 0.19 Site:Ploidy:Desiccation:Tumbled 4 0.38 0.82 Error 84 --- ---
30
Table 2. Three-way analysis of variance for growth rate for each of the three sites (Grand Isle, Deer Island and
Grand Bay) individually, across the two ploidies (triploid and diploid), and the seven treatments (0N, 18N, 18Y,
24N, 24Y, 48N, 48Y). Significant p-values are bolded.
Growth Rate (mm day-1) df
GI DI GBOP F-
value P-
value F-
value P-
value F-
value P-
value Ploidy 1 14.39 <0.001 59.62 <0.001 108.28 <0.001 Desiccation 3 1.86 0.16 0.72 0.51 6.15 <0.01 Tumbled 1 0.19 0.67 0.87 0.34 1.65 0.21 Ploidy:Desiccation 3 0.18 0.91 0.13 0.94 0.35 0.79 Ploidy:Tumbled 1 0.55 0.46 2.44 0.10 10.09 <0.01 Desiccation:Tumbled 2 1.78 0.19 0.45 0.64 2.94 0.069 Ploidy:Desiccation:Tumbled 2 0.52 0.60 1.68 0.21 0.24 0.79 Error 28 --- --- --- --- --- ---
Figure 4. Oyster growth (in mm per day) for each desiccation level, across both ploidies (diploid and triploid),
tumbling treatment (tumbled or not) and the three sites (Grand Isle, Deer Island and Grand Bay). The lower and
upper black bars represent the 25th and 75th percentiles respectively.

31
At Grand Isle, the only factor that affected growth rate was ploidy (Table 2). Across all
treatments, triploid oysters grew 23.53% faster than diploid oysters (p < 0.001) (Fig 5).
At Deer Island, the only factor that significantly affected growth rate was, like Grand
Isle, ploidy (Table 2). Triploids had an average of 57.70% faster growth than diploids across all
other treatments (Fig 6).
Figure 5. Average triploid and diploid oyster growth rate (mm day-1) from April-September across all
stressor treatments the at Grand Isle site. The lower and upper black bars represent the 25th and 75th
percentiles respectively.

32
At the Grand Bay site, there was a significant effect of desiccation on growth rate and an
interaction between ploidy and tumbling on growth rate (Table 2). Oysters at Grand Bay,
subjected to any amount of desiccation (18, 24 or 48 hrs), across ploidy and tumbling level grew,
on average, 28.30% slower when compared to oysters in the control treatment of no desiccation
(Tukey’s post-hoc p £ 0.03 for all comparisons) (Fig 7). Oysters subjected to desiccation (18, 24
and 48 hrs) did not have growth rates that were statistically different from each other (Tukey’s
post-hoc p ³ 0.19 for all comparisons). There was also an interaction between ploidy and
tumbling at Grand Bay (Table 2). Triploids, either tumbled or not, grew faster than diploids
Figure 6. Average triploid and diploid oyster growth rate (mm day-1) from April-September across all
stressor treatments the at Deer Island site. The lower and upper black bars represent the 25th and 75th
percentiles respectively.

33
(Tukey’s post-hoc p £ 0.001 for all comparisons) (Table 3). Diploid oysters that were tumbled
did not have a significantly different growth rate from diploid oysters that were not tumbled
(Tukey’s post-hoc p = 0.91). Tumbled triploid oysters, however, grew on average 23.83% more
slowly than triploid oysters that were not tumbled (Tukey’s post-hoc p = 0.001) (Fig 8).
Figure 7. Average oyster growth rate (mm day-1) in each desiccation level from April-September across
ploidy and tumbled level at the Grand Bay site. The lower and upper black bars represent the 25th and 75th
percentiles respectively.

34
when compared to control triploids. oysters.
Tumbled Diploid GR Mean ±SD
Triploid GR Mean ±SD
Mean RR Triploid Advantage
No
Yes
0.117 ±0.043
0.118 ±0.023
0.218 ±0.025
0.176 ±0.018
0.624
0.399
87%
49%
Figure 8. Average triploid and diploid oyster growth rate (mm day-1) in each tumbled level (yes or no)
from April-September across desiccation level at the Grand Bay site. The lower and upper black bars
represent the 25th and 75th percentiles respectively.
Table 3. Growth rates (GR) (mm day-1) and standard deviation for all stressor treatments at the Grand Bay site. RR denotes
the natural log response ratio (RR = ln(triploid/diploid)]). The triploid advantage refers to the improved growth in triploids
relative to diploids, calculated by back transforming the response ratio (exp[ln(triploid/diploid)]).
35
MORTALITY
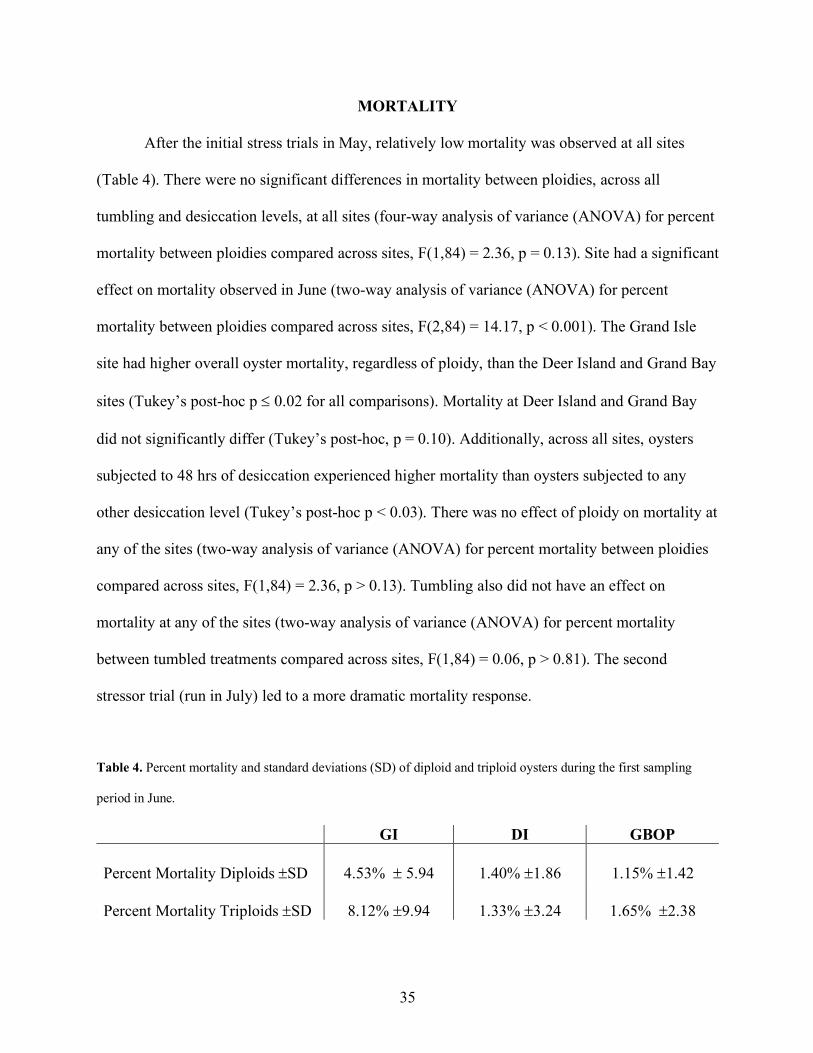
After the initial stress trials in May, relatively low mortality was observed at all sites
(Table 4). There were no significant differences in mortality between ploidies, across all
tumbling and desiccation levels, at all sites (four-way analysis of variance (ANOVA) for percent
mortality between ploidies compared across sites, F(1,84) = 2.36, p = 0.13). Site had a significant
effect on mortality observed in June (two-way analysis of variance (ANOVA) for percent
mortality between ploidies compared across sites, F(2,84) = 14.17, p < 0.001). The Grand Isle
site had higher overall oyster mortality, regardless of ploidy, than the Deer Island and Grand Bay
sites (Tukey’s post-hoc p £ 0.02 for all comparisons). Mortality at Deer Island and Grand Bay
did not significantly differ (Tukey’s post-hoc, p = 0.10). Additionally, across all sites, oysters
subjected to 48 hrs of desiccation experienced higher mortality than oysters subjected to any
other desiccation level (Tukey’s post-hoc p < 0.03). There was no effect of ploidy on mortality at
any of the sites (two-way analysis of variance (ANOVA) for percent mortality between ploidies
compared across sites, F(1,84) = 2.36, p > 0.13). Tumbling also did not have an effect on
mortality at any of the sites (two-way analysis of variance (ANOVA) for percent mortality
between tumbled treatments compared across sites, F(1,84) = 0.06, p > 0.81). The second
stressor trial (run in July) led to a more dramatic mortality response.
Table 4. Percent mortality and standard deviations (SD) of diploid and triploid oysters during the first sampling
period in June.
GI DI GBOP Percent Mortality Diploids ±SD 4.53% ± 5.94
1.40% ±1.86
1.15% ±1.42
Percent Mortality Triploids ±SD 8.12% ±9.94
1.33% ±3.24
1.65% ±2.38
36
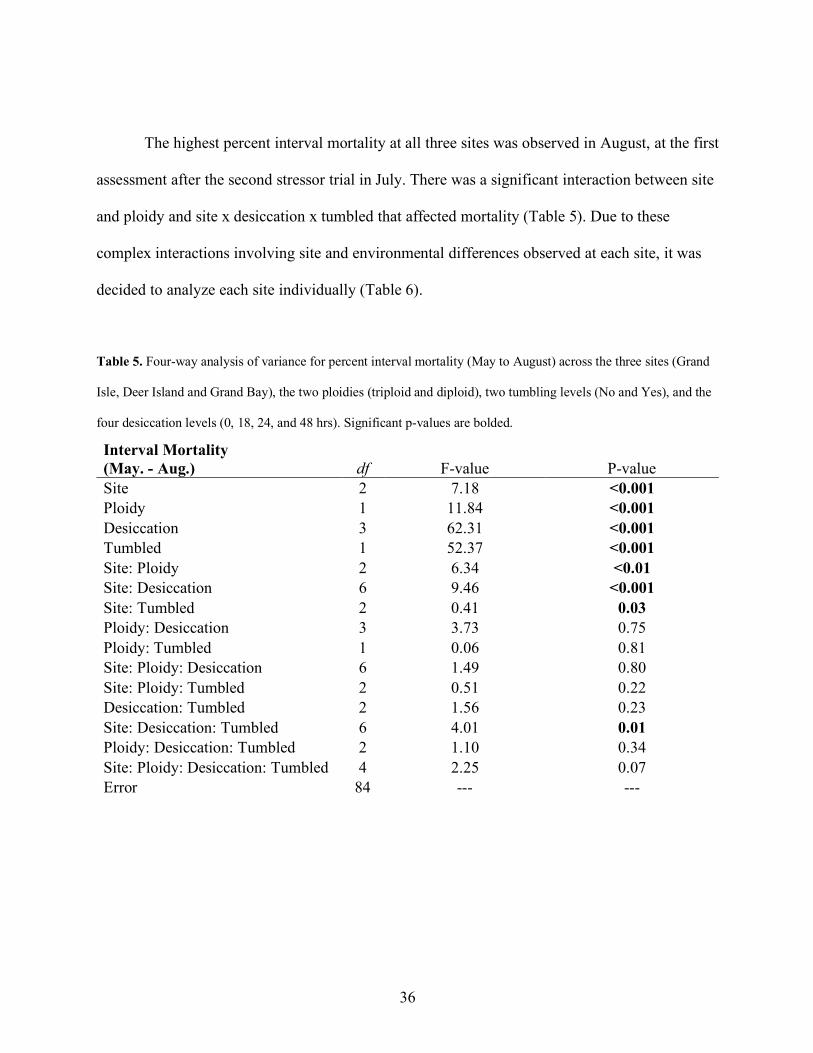
The highest percent interval mortality at all three sites was observed in August, at the first
assessment after the second stressor trial in July. There was a significant interaction between site
and ploidy and site x desiccation x tumbled that affected mortality (Table 5). Due to these
complex interactions involving site and environmental differences observed at each site, it was
decided to analyze each site individually (Table 6).
Table 5. Four-way analysis of variance for percent interval mortality (May to August) across the three sites (Grand
Isle, Deer Island and Grand Bay), the two ploidies (triploid and diploid), two tumbling levels (No and Yes), and the
four desiccation levels (0, 18, 24, and 48 hrs). Significant p-values are bolded.
Interval Mortality (May. - Aug.) df F-value P-value Site 2 7.18 <0.001 Ploidy 1 11.84 <0.001 Desiccation 3 62.31 <0.001 Tumbled 1 52.37 <0.001 Site: Ploidy 2 6.34 <0.01 Site: Desiccation 6 9.46 <0.001 Site: Tumbled 2 0.41 0.03 Ploidy: Desiccation 3 3.73 0.75 Ploidy: Tumbled 1 0.06 0.81 Site: Ploidy: Desiccation 6 1.49 0.80 Site: Ploidy: Tumbled 2 0.51 0.22 Desiccation: Tumbled 2 1.56 0.23 Site: Desiccation: Tumbled 6 4.01 0.01 Ploidy: Desiccation: Tumbled 2 1.10 0.34 Site: Ploidy: Desiccation: Tumbled 4 2.25 0.07 Error 84 --- ---

37
Table 6. Three-way analysis of variance for percent interval mortality (May to August) for each of the three sites
(Grand Isle, Deer Island and Grand Bay) individually, across the two ploidies (triploid and diploid), two tumbling
levels (No and Yes), and the four desiccation levels (0, 18, 24, and 48 hrs). Significant p-values are bolded.
*Deer Island had 24 degrees of freedom.
At Grand Isle, ploidy, desiccation and tumbling each significantly affected mortality
(Table 6). Triploids oysters at Grand Isle had 3.54% (±1.65; 95% C.I.) higher mortality than
diploids oysters, across all tumbling and desiccation levels (Tukey’s post-hoc p < 0.001) (Fig 9).
In terms of the effects of desiccation, oysters subjected to 48 hrs of desiccation experienced
higher mortality than oysters subjected to any other desiccation level (Tukey’s post-hoc p £
0.001 for all comparisons). Oysters subjected to 18 and 24 hrs of desiccation did not experience
increased mortality when compared to each other or oyster subjected to 0 hrs of desiccation
(Tukey’s post-hoc p ³ 0.73 for all comparisons) (Fig 10). In terms of the effects of tumbling,
oysters that experienced tumbling had 3.97% (±1.65; 95% C.I.) higher mortality than oysters that
experienced no tumbling, across both ploidies and all desiccation levels (Tukey’s post-hoc p <
0.01) (Fig 11).
Interval Mortality (May. - Aug.)
GI DI GBOP
df F-value P-value
F-value
P-value
F-value
P-value Ploidy 1 30.22 <0.001 0.43 0.52 1.84 0.19 Desiccation 3 14.31 <0.001 16.84 <0.001 38.093 <0.001 Tumbled 1 6.91 0.01 54.74 <0.001 11.070 <0.01 Ploidy:Desiccation 3 0.76 0.53 0.68 0.57 0.23 0.87 Ploidy:Tumbled 1 1.10 0.30 0.19 0.66 1.32 0.26 Desiccation:Tumbled 2 1.03 0.37 11.43 0.000 1.21 0.31 Ploidy:Desiccation: Tumbled
2 3.02 0.07
2.56
0.098
1.17
0.33
Residuals 28* --- --- --- --- --- ---

38
Figure 9. Plot of percent mortality for diploid vs. triploid oysters from May to August at Grand Isle.
Individual points are outlier data located outside of the 25th and 75th percentiles (represented by the
lower and upper black bars respectively).

39
Figure 10. Plot of percent mortality for each desiccation level oysters from May to August at Grand Isle.
The lower and upper black bars represent the 25th and 75th percentiles respectively.

40
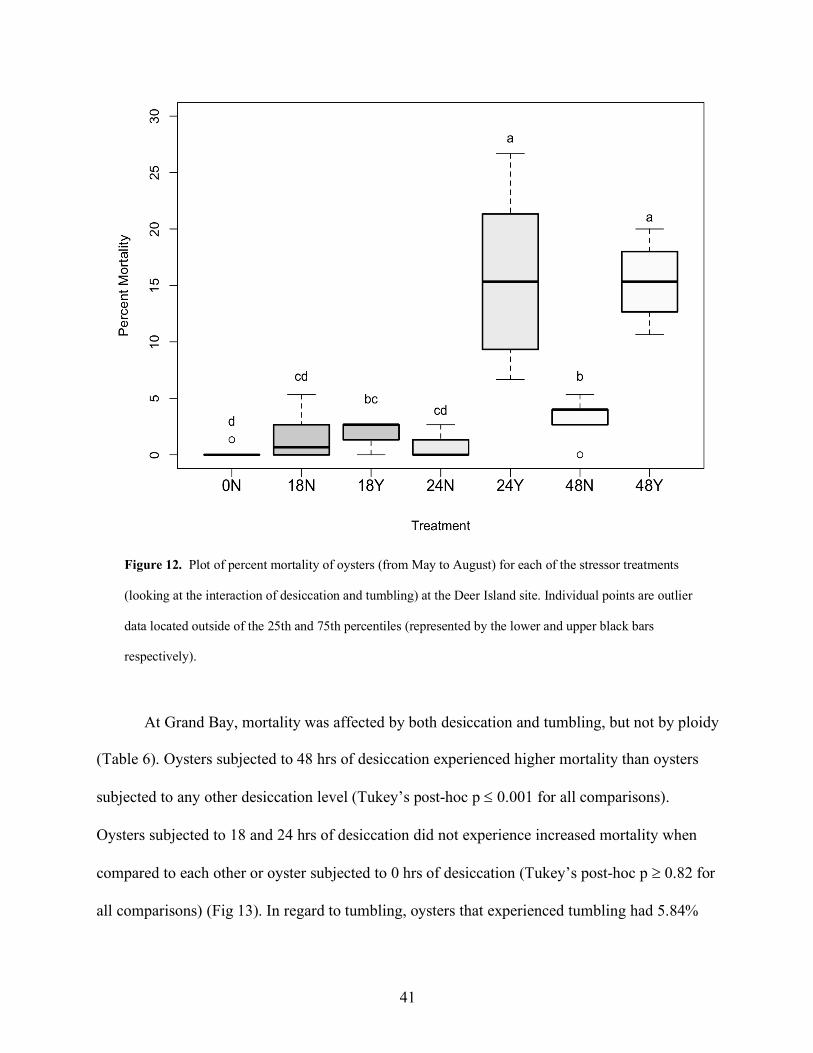
At Deer Island, there was a significant interaction between desiccation and tumbling but
again no effect of ploidy (Table 6). There appeared to be an additive effect of stress induced by
tumbling at the two highest desiccation levels; 24 and 48 hrs. Oysters subjected to 24 hrs of
desiccation and tumbling experienced 14.55% (±0.91; 95% C.I.) higher mortality than oysters
subjected to only 24 hrs of desiccation and no tumbling (Tukey’s post-hoc p < 0.001).
Additionally, oysters subjected to 48 hrs of desiccation and tumbling experienced 12.21%
(±1.06; 95% C.I.) higher mortality than oysters subjected to only 48 hrs of desiccation (Tukey’s
post-hoc p < 0.001) (Fig 12).
Figure 11. Plot of percent mortality for not tumbled vs. tumbled oysters from May to August at Grand Isle.
Individual point is outlier data located outside of the 25th and 75th percentiles (represented by the lower and
upper black bars respectively).
41
At Grand Bay, mortality was affected by both desiccation and tumbling, but not by ploidy
(Table 6). Oysters subjected to 48 hrs of desiccation experienced higher mortality than oysters
subjected to any other desiccation level (Tukey’s post-hoc p £ 0.001 for all comparisons).
Oysters subjected to 18 and 24 hrs of desiccation did not experience increased mortality when
compared to each other or oyster subjected to 0 hrs of desiccation (Tukey’s post-hoc p ³ 0.82 for
all comparisons) (Fig 13). In regard to tumbling, oysters that experienced tumbling had 5.84%
Figure 12. Plot of percent mortality of oysters (from May to August) for each of the stressor treatments
(looking at the interaction of desiccation and tumbling) at the Deer Island site. Individual points are outlier
data located outside of the 25th and 75th percentiles (represented by the lower and upper black bars
respectively).

42
(±2.24; 95% C.I.) higher mortality than oysters that experienced no tumbling, across both
ploidies and all desiccation levels (Tukey’s post-hoc p < 0.01) (Fig 14).
Figure 13. Plot of percent mortality for each desiccation level oysters from May to August at Grand Bay.
Individual points are outlier data located outside of the 25th and 75th percentiles (represented by the lower
and upper black bars respectively).

43
There was little mortality observed between the August sampling and the final sampling at the
end of September across treatments and sites. Cumulative mortality through the end of
September did not substantially differ from the interval mortality in August; complete results can
be found in Appendix A.
ENVIRONMENTAL PARAMETERS
All three sites had significantly increased water and air temperatures from the first
stressor trial in the beginning of May to the second stressor trial in the beginning of July (linear
regression for water and air temperatures at each site recorded during the stressor trials, t(347) ³
6.89, p £ 0.001, for all comparisons). The environmental conditions varied among the three
Figure 14. Plot of percent mortality for not tumbled vs. tumbled oysters from May to August at Grand Bay.
Individual points are outlier data located outside of the 25th and 75th percentiles (represented by the lower
and upper black bars respectively).

44
experimental grow-out sites. The Grand Isle site (LA) was the closest to shore and had the most
suspended sediment of any site (based on qualitative field observations). The Grand Isle site had
a higher average water temperature than Grand Bay from May to September (linear regression
for water temperature compared across sites, t(349) = -2.23, p = 0.03) but not Deer Island (linear
regression for water temperature compared across sites, t(349) = -1.22, p = 0.22).
The Grand Bay Oyster Park farm site (AL) was in a protected area where many other
oysters are grown. The OysterGro cages were located in the middle of the oyster park, among
other floating oyster cages and long-line systems. Therefore, they did not appear to be subjected
to as much wave action as the other two sites, even though average wind speeds at this site were
the highest (linear regression for wind speed across sites, t(12) £ -5.10, p £ 0.001 for all
comparisons). The Grand Bay site had higher salinity than Deer Island (linear regression for
salinity compared across sites, t(453) = -5.71, p < 0.001) but not Grand Isle (linear regression for
salinity compared across sites, t(453) = -0.96, p = 0.34). The Grand Bay site also had the highest
average rainfall and largest salinity fluctuation from May to August. Tropical storm Gordon
passed to the east of Grand Bay in early September while the study was still running. Minimal
damage was done to the site, but some cages came unmoored on one end of the line. No oysters
were lost, and no visible damage was inflicted.
The Deer Island site (MS) was the farthest offshore and not protected by surrounding
oyster cages or long-lines. Therefore, the oysters at this site appear to have been subjected to the
most wave action. This site had the lowest average salinity from May to August (linear
regression for salinity across sites, t(453) £ 5.71, p £ 0.001 for all comparisons) and smallest
water temperature fluctuations from May to August. The average temperatures, wind speed,
monthly rainfall, and salinities for each site in May to September can be seen in Table 7 below.

45
A graph of the Hobo Sensors water temperature data and a graph of salinity data from each site
from May to September can be seen in Figures 15 and 16 respectively.
Table 7. Average water temperature, wind speed, rainfall, and salinity for each of the three grow-out sites in the
months of May through September. Water temperature data was collected from HOBO sensors, all other data were
collected from USGS. The Deer Island water temperature for August and September was also taken from the USGS
as the temperature sensors may have malfunctioned. Letters indicate significant differences (p < 0.05) in temperature
or salinity between sites for that month.
Experimental Sites Temperature
± SD (˚C)
Wind Speed SEM
(km/h)
Monthly Rainfall
SEM (mm)
Salinity ± SD (ppt)
May Grand Isle 28.97 ±1.80b 11.3 132.08 12.20 ±1.56ab
Grand Bay 27.66 ±1.76a 16.1 137.16 10.8 ±1.42a
Deer Island 29.22 ±0.95b 11.3 114.55 14.45 ±1.42b
June
Grand Isle 30.07 ±1.44a 9.66 127 14.42 ±0.74b
Grand Bay 29.83 ±1.88a 14.5 137.2 18.01 ±0.74c
Deer Island 30.01 ±1.20a 9.7 134.62 12.48 ±0.91a
July
Grand Isle 30.25 ±1.47a 8.05 160.02 22.09 ±1.20b
Grand Bay 30.45 ±1.53a 12.87 195.58 20.19 ±1.21b
Deer Island 30.15 ±1.08a 8.1 173.99 15.27 ±1.20a
August
Grand Isle 30.23 ± 1.16b 9.7 160.02 21.20 ±0.77b
Grand Bay 29.78 ± 1.24b 13 177.8 23.20 ±0.77c
Deer Island 29.01 ± 1.30a 8 163.83 18.26 ±0.78a
September
Grand Isle 28.74 ±2.73a 9.65 157.48 17.75 ±1.30b
Grand Bay 28.89 ±1.05a 13.1 162.56 15.83 ±1.29b
Deer Island 28.41 ±1.69a 10 160.78 13.25 ±1.29a

46
Figure 15. Water temperature fluctuations (°C) from May to September at each of the three sites, Grand Isle (GI),
Grand Bay (GBOP), Dauphin Island (DI). Data were collected from the HOBO sensors placed at each site. An error
with the sensor at Deer Island stopped the device from recording halfway through August, so data from USGS was
used for mid-August through September.

47
Figure 16. Water salinity fluctuations (ppt) from May to September at each of the three sites, Grand Isle (GI), Grand
Bay (GBOP), Dauphin Island (DI). Data were collected from USGS for GI and DI sites and from Aquatrol Sonde
for the GBOP site.
At the Grand Isle site, a trend was seen where triploid mortality was higher in the May-
June and Aug-Sept time periods and Grand Isle also had the highest temperatures in those time
periods (Fig 17). No trend between mortality and salinity was observed.
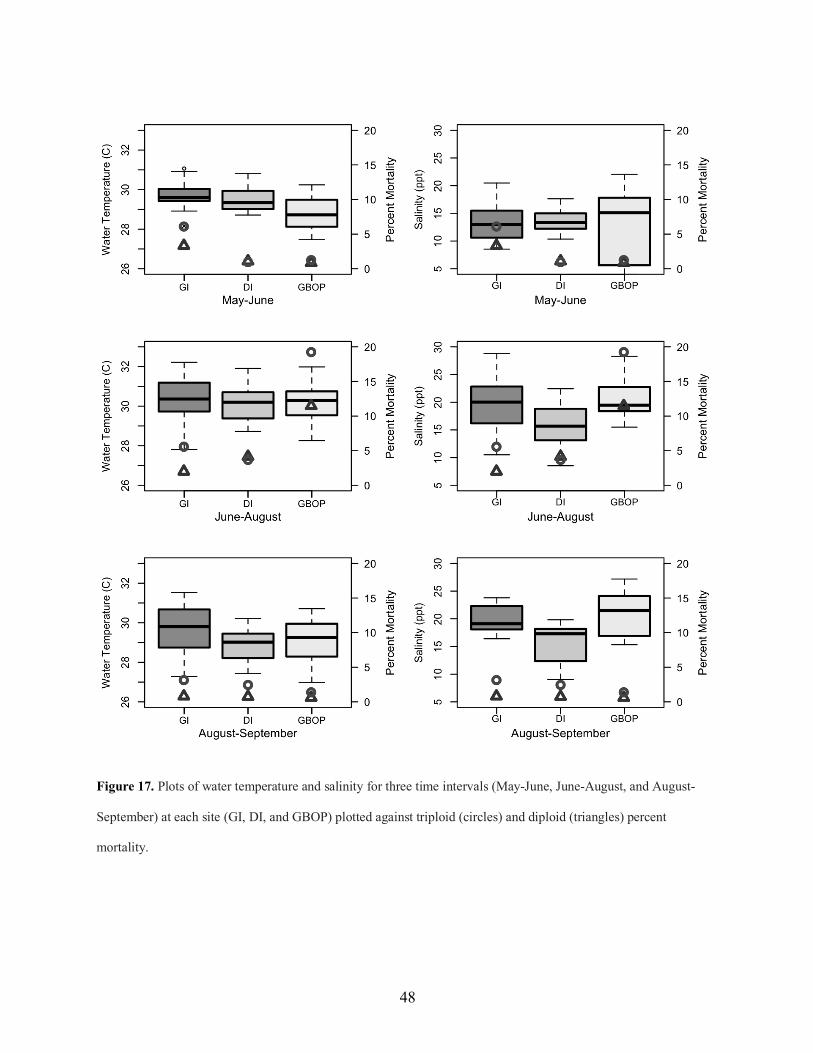
48
Figure 17. Plots of water temperature and salinity for three time intervals (May-June, June-August, and August-
September) at each site (GI, DI, and GBOP) plotted against triploid (circles) and diploid (triangles) percent
mortality.

49
DISCUSSION
GROWTH RATES
Imposed farm stress had a negative effect on oyster growth. The growth rates of oysters,
regardless of ploidy, decreased when any amount of desiccation stress (18, 24, or 48 hrs) was
imposed across all sites and at Grand Bay (Fig 4 and Fig 8). However, despite imposed stress,
triploid oysters at all three farm sites demonstrated a significant growth advantage over
comparable diploid oysters in all observed parameters: shell length, height, width, and growth
rate. The triploid growth advantage from Grand Bay and Deer Island surpassed expectations set
with a previous study in by Walton et al. (2013), that reported a triploid advantage of 16.7% in
oysters of a similar age. This growth advantage is consistent with the triploid advantage at Grand
Isle but smaller than the triploid advantage at the other two sites. One explanation for this
increased triploid advantage at Deer Island and Grand Bay is the stress imposed on the oysters.
Triploids have been shown to grow faster than diploids under poorer site conditions or in more
stressful site environments (Garnier-Gere et al. 2002). The faster growth of triploid oysters may
be due to both reduced gametogenesis and higher heterozygosity of triploid oysters, leading to
lower metabolic energy costs (Hawkins & Day 1996; Hawkins 1996). Therefore, triploids may
have more energy available for growth under stressful conditions than diploids at Deer Island
and Grand Bay. Triploids at the Grand Isle site may have lost their growth advantage in the final
month of the experiment due to a higher amount of suspended organic solids than other sites
(based on qualitative field observations). Kesarcodi-Watson et al. (2001) observed that high
concentrations of microalgae reduced efficiency in clearance rates (1 h-1) of triploid Sydney rock
oysters (Saccostrea commercialis). Additionally, triploid Sydney rock oysters were observed to
have lower absorbed energy (J h-1) as microalgae concentrations increased. Kesarcodi-Watson et

50
al. (2001) concluded that adult triploid oysters did not have the ability to handle fluctuating food
conditions. It is possible that the apparently high amount of suspended solids at Grand Isle
decreased the feeding efficiency of triploid oysters resulting in slower growth rates.
While all sites individually saw an effect of ploidy on growth rate, only Grand Bay saw
effects of the imposed stress treatments, including an interaction between ploidy and tumbling
(Table 2). The increased vulnerability to stress seen in the Grand Bay oysters may be due to
environmental factors. Grand Bay experienced the highest change in salinity and water
temperature from May to August (Table 7). Studies have noted in the past that compounding
stressors, such as environmental stress and induced farm stress, can cause increased adverse
effects to oysters (Cheney et al. 2000). At Grand Bay, there was an interaction between ploidy
and tumbling stress. Triploid oysters that were tumbled had faster growth rates than diploid
oysters (both tumbled and not) but slower growth rates than triploid oysters that were not
tumbled (Fig 8). These findings suggest that triploids, while still having a growth advantage over
diploids, were more vulnerable to tumbling stress. Triploids may have seen a larger impact of
tumbling because of their faster growth rate. A faster growth rate means triploids had more
fragile shell the tumbler could chip away, resulting in the measured slower growth of tumbled
triploids when compared to not tumbled triploids. This is consistent with previous studies
conducted by Ortega (1981). Ortega found that intertidal oysters living in high-stress
environments with more wave action, exhibited reduced growth when compared to oysters (of
the same ploidy) living in lower stress environments. The growth performance of triploid oysters
suffered when tumbling stress was imposed, while diploids suffered no adverse effects.
51
MORTALITY
The highest interval mortality was seen during August sampling, between the second
stress trial and the sampling period. Higher August mortality was most likely in part due to
increased air and water temperatures during the second stressor trial in July, which added
increased stress on oysters, producing amplified mortality in response to the stressor treatments.
Cumulative mortality was primarily driven by August interval mortality and so the two were
highly correlated. An ANOVA analysis was run to compare percent cumulative mortality at each
of the three sites, across ploidies, tumbled levels and desiccation levels. The results from this
analysis were similar to those of percent interval mortality, with two exceptions. Firstly, the
effect of tumbling in Grand Isle was lost. Secondly, triploids had higher percent cumulative
mortality than diploids at Grand Bay (Table A2). The mortalities seen in August were thought to
be a more direct response to the stress trial induced in July. Mortalities observed after August
were thought to be due to environmental stress, not the imposed stress, because they occurred too
long after the imposed farm stress and there were no ploidy x stress treatment interactions.
Despite expectations of higher mortality in triploids, triploids experienced higher interval
mortality than diploids only at Grand Isle and not at Deer Island or Grand Bay (Table 6).
Previously published studies comparing mortality between diploids and triploids vary. Cheney et
al. (2000) found that mortality in triploid Pacific oysters, Crassostrea gigas, was higher than in
diploid oysters. Conversely, Gagnaire et al. (2006) found the opposite, that mortality in triploid
C. gigas was lower than in diploid oysters. Degremont et al. (2010) saw no difference in
mortality between triploid and diploid C. gigas oysters. A previous study conducted in Alabama
observed that at four farm sites in the summer of 2017, triploid oysters experienced higher
percent cumulative mortality than diploid oysters (Wadsworth et al. 2019). In this study, at one
52
of the three sites (Grand Isle), triploids had a higher percent interval mortality than diploids
across tumbled and desiccation levels. There were no ploidy by stress treatment interactions at
Grand Isle (or any of the sites), meaning that diploid and triploid oysters exposed to the same
stress treatments died at statistically similar rates. Therefore, higher triploid mortality was not
driven by the imposed stress treatments but may have been by environmental conditions at the
site. Grand Isle had higher average water temperatures from May-September than Deer Island.
Additionally, a trend was observed where water temperatures were highest at Grand Isle in the
May-June and Aug-Sept time periods and triploid mortality was also highest at the Grand Isle
site during those time periods (Fig 17). Cheney et al. (2000) also saw higher water temperatures
correlated with increased triploid mortality; though it was stated that high water temperature
alone may not be lethal. No trend between triploid mortality and salinity at any of the sites was
observed (Fig 17), but other environmental factors that were not measured, such as DO, could
have played a role in higher triploid mortality in Grand Isle.
The lack of differential mortality between ploidies, though not unprecedented, was
surprising as the study was predicated on previous work by Wadsworth et al. (2019). Wadsworth
et al. (2019) observed triploid oysters dying at significantly higher rates than diploid oysters at
four experimental sites in prior years. The oysters in the study were not exposed to farm stress
(desiccation or tumbling). It was thought that farm stressors would exacerbate the higher
mortality seen in triploids. However, the results of this study indicate that differential mortality
between ploidies was driven by environmental factors and not routine farming activities.
Therefore, triploid oysters in Grand Isle had a higher percent interval mortality, not because of
the stress treatments, but certain environmental factors that stressed triploids. Furthermore,
triploid oysters in Grand Isle and Grand Bay ended the experiment with higher percent
53
cumulative mortality than diploid oysters (Table A2). Again, this higher triploid mortality in was
thought to be driven by environmental stressors at the sites because there were no ploidy by
treatment interactions.
While stress treatments did not disproportionately affect triploid oyster mortality, they
did affect overall oyster mortality. All three sites saw effects of tumbling and desiccation on
mortality, though only Deer Island experienced an interaction between desiccation and tumbling
(Table 6). Both Grand Isle and Grand Bay saw similar patterns in how desiccation time and
tumbling affected mortality. At both sites, oysters desiccated for 48 hrs had significantly higher
levels of mortality than oysters desiccated for any other amount of time (0, 18 or 24 hrs). These
results are consistent with Bartol et al. (1999) who found that oysters experienced the lowest
mortalities in low intertidal zones (1-3% aerial exposure) as opposed to oysters in mid-intertidal
zones (17% aerial exposure). Additionally, at both sites, oysters that were tumbled experienced
significantly higher levels of mortality than oysters that were not tumbled (Table 6). Any amount
of tumbling, regardless of desiccation time, increased mortality while negative effects of
desiccation, regardless of tumbling, were only seen at the most extreme levels (48 hrs).
This study also observed a possible additive effect of stress on oyster mortality. At Deer
Island, there was an interaction between desiccation and tumbling. Oysters that were tumbled
and desiccated for 24 and 48 hrs exhibited higher mortality than oysters desiccated for the same
amount of time but not tumbled. Ring (2012) observed similar results, concluding that oysters
removed from the water and tumbled had higher mortality than oysters removed from the water
but not tumbled. Notably, the combined effect of 24 hr desiccation and tumbling induced
significantly higher mortality than 48 hr desiccation alone (Fig 12). Combinations of different
stressors have long been thought to be the cause of summer mortality events. Stressors such as

54
elevated water temperature, pathogens, low DO, salinity, age of oyster, high trophic level,
aquaculture practices and physiological stress associated with reproduction are often cited
(Cheney et al. 2000, Gagnaire et al. 2006, Soletchnik et al. 2007, Pernet et al. 2012, Degremont
et al. 2012). The combination of stressors (imposed desiccation and tumbling stress) in addition
to the ambient heat stress from elevated summer water temperatures, were more lethal than
desiccation stress and heat stress alone.
CONCLUSION
Contrary to predictions, triploid oysters did not suffer from higher mortality rates than
diploid oysters exposed to the same farm stress treatments. At two of the three sites, triploids did
experience higher cumulative mortality than diploids. However, these differences in mortality
were likely due to environmental factors at each site and not the imposed farm stress treatments.
Triploid oysters were more sensitive to stress treatments in one regard though. Triploids at Grand
Bay exposed to tumbling stress, while still having a growth advantage over diploids, did not
perform as well as triploids exposed to no tumbling (Fig 8).
Across ploidies, any amount of desiccation stress reduced growth rates during the
summer sampling. In addition, any amount of tumbling and more severe desiccation levels
increased mortality. Many farmers already treat oysters with more care during the summer,
reducing handling stress and desiccation time. It is impossible, however, for farmers to
completely avoid imposing stress on oysters during the summer as desiccation and tumbling are
necessary practices in order to produce the highest grade of oyster (Ring 2012). This study
recommends that farmers do not desiccate oysters for more than 24 hrs in the summer.
Furthermore, oysters should be allowed to ‘rest’ between tumbling and desiccation routines to
55
avoid any mortality resulting from additive stressor effects. Another solution could be selectively
breeding oysters that are more resistant to heat and environmental stress. Stock selection for the
purpose of lowering oyster mortality due to stressors has been successfully performed. Casas et
al. (2017) were able to produce a line of oysters that was more resistant to Perkinsus marinus,
Dermo disease, and so exhibited lower mortality than unselected oyster stock. Additionally,
Degremont et al. (2010) compared diploid oysters, whose parents had been selected for
resistance to summer mortality, to triploid oysters with a diploid parent selected for resistance. A
positive response to survival was found for both these diploid and triploid lines, demonstrating
that selection works. However, the diploids still had higher survival than the triploids, most
likely due to the fact that the selected diploids parents only contributed a third of the genome to
the triploid offspring. Selecting for resistance in tetraploid, as well as diploid, parents would
create a triploid line with higher resistance to summer mortality events.
In future studies, we recommend increasing the number of replicates of stress treatments
for each ploidy. In this study, there was substantial variation among replicates and this may have
obscured differences in how each ploidy reacted to the same stress treatment. Focusing on a
single site and increasing the number of replicates may be preferable if resources are limited.
56
CHAPTER THREE:
USING SHELL-CLOSING STRENGTH TO GAUGE THE RESPONSES OF DIPLOID AND
TRIPLOID EASTERN OYSTERS, Crassostrea virginica, TO DESICCATION STRESS

57
INTRODUCTION
Summer mortality events that disproportionately affect triploid Eastern oysters,
Crassostrea virginica, are a problem confronting farmers and scientists in the oyster aquaculture
industry (Casas et al. 2017). While the causes of these mortality events are unknown, it is
believed that a combination of environmental and farm stress lead to oyster mortality (Cheney et
al. 2000). The effects of stress in C. virginica are commonly evaluated by tracking mortality
rates, performing enzyme analysis on tissue samples, or evaluating condition index (Rainer &
Mann 1992, Mercado-Silva 2005). Condition index is a health parameter commonly used to
evaluate how organisms are affected by their environment (Mercado-Silva 2005; Van Dolah et
al. 1992, Rheault & Rice 1996). Condition index compares the dry meat weight of an animal to
the interior volume of that animal’s shell. These methods of determining a stressor’s effect on
oyster health, while long-established, have some shortcomings.
Tracking mortality does not take into account how oysters that survived stressful events
were affected. Prior to mortality or in recovering animals, oysters may exhibit negative health
consequences, known as sublethal effects. Sublethal effects are described as changes in
physiological processes, growth, reproduction, behavior, and/or development that have adverse
effects on an individual’s fitness. Sublethal effects may reduce the chance of the animal to be
successful in its environment (Sprague 1971) and are increasingly recognized as important. Both
enzyme analysis and condition index are able to assess sublethal affects but involve sacrificing
the oysters, and enzyme analysis is costly. Avoiding oyster sacrifice with non-lethal and cost-
effective approaches are valuable to research and commercial aquaculture because they allow for
better-designed breeding strategies (Puchnick-Legat et al. 2015; Suquet et al. 2009; 2010).
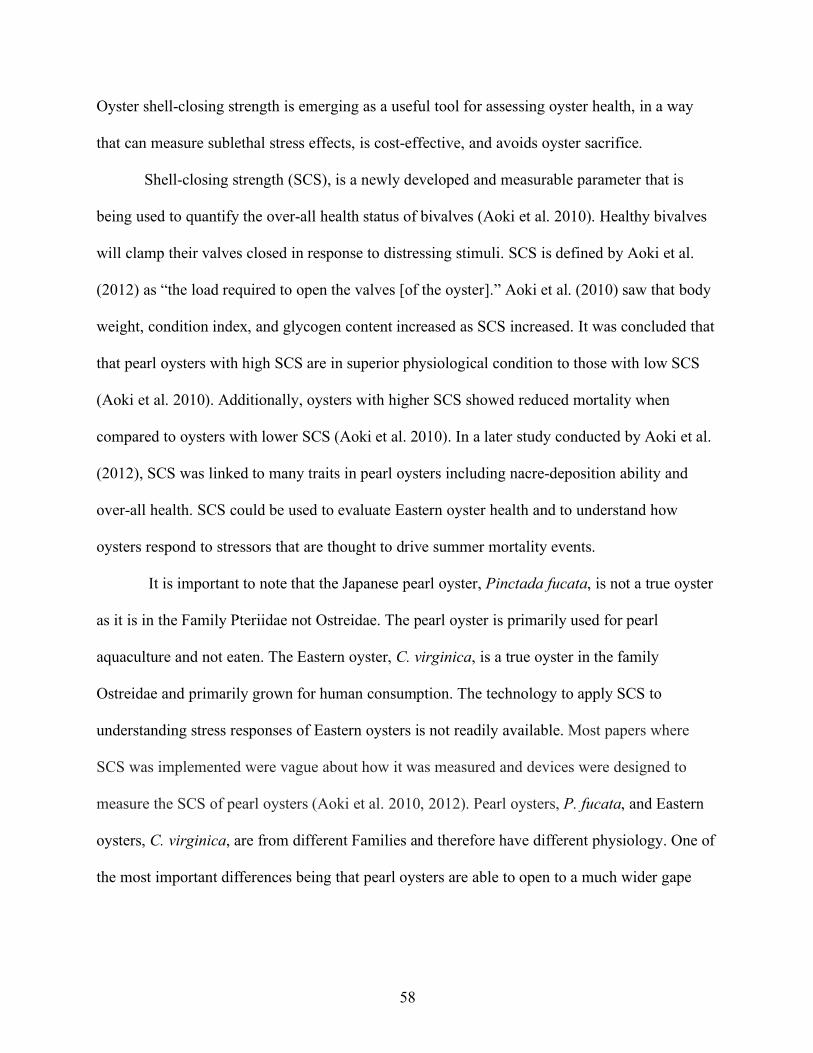
58
Oyster shell-closing strength is emerging as a useful tool for assessing oyster health, in a way
that can measure sublethal stress effects, is cost-effective, and avoids oyster sacrifice.
Shell-closing strength (SCS), is a newly developed and measurable parameter that is
being used to quantify the over-all health status of bivalves (Aoki et al. 2010). Healthy bivalves
will clamp their valves closed in response to distressing stimuli. SCS is defined by Aoki et al.
(2012) as “the load required to open the valves [of the oyster].” Aoki et al. (2010) saw that body
weight, condition index, and glycogen content increased as SCS increased. It was concluded that
that pearl oysters with high SCS are in superior physiological condition to those with low SCS
(Aoki et al. 2010). Additionally, oysters with higher SCS showed reduced mortality when
compared to oysters with lower SCS (Aoki et al. 2010). In a later study conducted by Aoki et al.
(2012), SCS was linked to many traits in pearl oysters including nacre-deposition ability and
over-all health. SCS could be used to evaluate Eastern oyster health and to understand how
oysters respond to stressors that are thought to drive summer mortality events.
It is important to note that the Japanese pearl oyster, Pinctada fucata, is not a true oyster
as it is in the Family Pteriidae not Ostreidae. The pearl oyster is primarily used for pearl
aquaculture and not eaten. The Eastern oyster, C. virginica, is a true oyster in the family
Ostreidae and primarily grown for human consumption. The technology to apply SCS to
understanding stress responses of Eastern oysters is not readily available. Most papers where
SCS was implemented were vague about how it was measured and devices were designed to
measure the SCS of pearl oysters (Aoki et al. 2010, 2012). Pearl oysters, P. fucata, and Eastern
oysters, C. virginica, are from different Families and therefore have different physiology. One of
the most important differences being that pearl oysters are able to open to a much wider gape

59
than Eastern oysters (Aoki et al. 2010). In this experiment, we had to develop and describe a new
method to measure SCS that works with C. virginica physiology.
SCS has the potential to easily identify healthy Eastern oysters for breeding purposes, or
unhealthy oysters that are suffering from sublethal stressors effects, especially in the summer.
Okamoto et al. (2006a) conducted one of the first studies showing that pearl oysters with higher
SCS were in better physiological condition and had lower rates of mortality associated with a
summer-time oyster disease (Akoya oyster disease). Furthermore, Okamoto et al. (2006a) found
SCS could be used as a genetic indicator for selective breeding programs to develop a lineage of
Japanese pearl oysters, P. fucata, with high survival rates, particularly in the summer.
Additionally, Aoki et al. (2012) noted that pearl oysters with higher SCS had lower mortality
during the summer. Summer mortality events that disproportionately affect triploid oysters (C.
virginica) are an increasing concern in the oyster aquaculture industry. Farmers have reported
that triploids die at higher rates than diploids during the summer (Wadsworth et al. 2019), and
the cause is as yet unknown (Cheney et al. 2000, Maryline et al. 2019, Wadsworth et al. 2019).
Some oyster farmers believe that triploid oysters are more sensitive to stress, such as desiccation,
during the summer months. Desiccation is the practice of exposing oysters to ambient air for
extended periods of time to reduce biofouling and infestation of many marine parasites
(Grodeska et al. 2016). Desiccation is a necessary part of oyster aquaculture. It is common for
farmers to repeatedly desiccate oysters for 18-24 hrs durations every week; though farmers may
choose to desiccate their oysters for longer, continuous periods of time (up to 48 hrs) depending
on fouling severity (Grodeska et al. 2016). A better understanding of how exposure to continuous
periods of desiccation stress and weekly, repeated desiccation stress effects the physiology of
triploid and diploid oysters could help farmers avoid losses in their crops. Because SCS is an

60
indicator of oyster health, measuring SCS could to shed light on how triploid and diploid oysters
respond to desiccation stress. The goal of this study was to test the ability of SCS to anticipate
oyster death. I predicted that the SCS of triploid oysters would decline more rapidly than diploid
oysters when exposed to constant and repeated desiccation stress.
METHODS
DEVELOPING A DEVICE TO MEASURE SCS
The first step in this study was to develop a method to measure SCS in Eastern oysters.
Aoki et al. (2010) described their use of a shell opener and a portable load meter to measure
SCS. In this study, reverse pliers were used as a shell opener and were wedged between the
valves of an oyster. Once between the valves, the lower handle of the pliers was placed atop a
load meter. The pliers were opened to a predefined gape by pressing down on the upper handle,
placing the force on the lower handle and the load meter. The load meter then recorded the force
being used to open the pliers and therefore the valves. This force was a representation of the
adductor muscle strength or SCS for that oyster.
Most previously published SCS studies used Japanese pearl oysters, P. fucata, which are
able to open their valves to a gape of 10 mm or more (Aoki et al. 2010). Conversely, while
experimenting with one and two year-old C. virginica (ranging 75 to 130 mm in length), it was
found that they are not able to be opened to a gape greater than 4 mm without risk of tearing the
adductor muscle (unpublished data, S. Bodenstein, Auburn University). Therefore, a standard
gape of 3.5 mm was selected. Measuring the exact gape of oyster valves is prone to error,
however. The pliers were opened and marked at a 3.5 mm gape, and that measurement was used
to standardize the procedure. Next, a method to insert the reverse pliers into the oyster needed to
61
be developed. Through trial and error, it was determined that a notch in the shell could be made
with a shucking knife. This notch permitted the reverse pliers (Imperial External Lock Ring
Pliers, Tip Angle: 90°) to be inserted between the valves without breaking the shell or tearing the
adductor muscle (Fig 1.A & B). The notch was made just large enough to barely allow for the
insertion of the pliers – which contacted the lower and upper edges of the notch while closed.
The load cell selected for the experiment was an OMEGA LC201-50 Load Cell: a tension
and compression type sensor with analog output, and a force range of 0 to 50 lbs. This load cell
was placed underneath the reverse pliers, on a wooden stand built to hold the pliers in place (Fig
2.A). The load cell, which continually recorded load data, was hooked up to an Arduino Uno
Rev3 board and Adafruit Assembled Data Logging Shield, programmed in Arduino to record
output from a load cell (unpublished code, Grant Lockridge) (Fig 2.B). Arduino Software and the
Arduino programming language is open-source. Code can be written in a downloadable software
and uploaded to the Arduino board. Arduino runs on all major operating system: Windows, Mac
OS X, and Linux. Instructions for the setup and wiring of the load cell to the board were found at
theorycircuit.com. The Arduino board and logging shield required 9 volts to function. The output
Figure 1
A. The reverse pliers inserted into the notch between the oyster’s valves.
B. The reverse pliers prying open the valves.
A B

62
of the load cell (lbs. of force) was recorded in Arduino and saved to an SD card in the Data
Logging Shield. The maximum recorded value used to open the oyster’s valves was reported as
that oyster’s SCS in lbs. of force. We ran repeated trials to test the consistency of the SCS
measuring device. A rubber band was wrapped around two oyster shells (from a deceased oyster)
and the reverse pliers were inserted between the shells. Force was applied to the pliers to open
the shells to a 3.5mm gape and the maximum recorded value used to open the shells was
reported. We repeated the process twenty times and standard deviation in measuring SCS with
this tool was 0.56. A diagram of the complete setup is shown below (Fig 2.C). This method was
used to record all SCS data during the study.

63
Figure 2.
A. Set up of the reverse pliers resting on the load cell (the small silver device screwed into the black
metal stand) on the wooden stand.
B. The Arduino Uno Rev3 board and Adafruit Assembled Data Logging Shield configuration.
C. Diagram of the complete setup of the pliers, load cell, logging shield, Arduino board and computer
(Arduino wiring source: theorycircuit.com). Note: pliers are not open upon insertion.
A Bv
Cv

64
MEASURING RESPONSES TO DESICCATION STRESS WITH SCS
TRIAL ONE: CONTINUOUS DESICCATION
Farmers desiccate their oysters for different amounts of time. Generally, desiccation
times range from continuous 18-24 hrs periods but sometimes can reach up to 48 hrs periods
(Grodeska et al. 2016). Farmers repeat their desiccation routines on a weekly basis. Therefore,
there are two ways desiccation stress can affect oysters; exposure to a one-time continuous
desiccation period and exposure to weekly, repeated desiccation periods. The goal of the first
trial was to assess how triploid and diploid oysters responded to an extreme period of continuous
desiccation stress. Fifteen each of diploid and triploid one-year-old Eastern oysters were
collected from the Auburn University Bayou Sullivan Oyster Park area in Portersville Bay on the
coast of Alabama and transported in long-line baskets by truck to the Auburn University
Shellfish Lab. All oysters were spawned at the Auburn University Shellfish Lab in summer 2017
and were collected in early July 2018. Of the collected oysters, nine triploids and nine diploids of
similar sizes (based on length) were selected. Similarly sized oysters were chosen because larger
oysters tend to have bigger adductor muscles, and consequently higher SCS’s. On the first day of
the trial, the oysters were cleaned of barnacles and algae and whole wet weight measurements
were taken. Calipers were used to measure the length, height, and width of each oyster (Fig 3),
so the effects of shell morphology characteristics and ploidy on initial SCS could be determined.
Finally, a notch was chipped in each oyster for insertion of the reverse pliers. The SCS at time
zero was recorded for each oyster. Next, each oyster was placed in a weigh boat, labeled diploid
or triploid 1-9, to keep track of each individual oyster. Parafilm was then secured over the notch
of each oyster to prevent artificially high rates of desiccation due to the notch.

65
Figure 3. A diagram of shell metrics used to determine the shell morphology characteristics of length, height and
width (Wadsworth 2017; Galtsoff 1964).
The oysters were placed outside at ambient air temperatures to desiccate (Fig 4). SCS
was measured after three, six and nine hours of desiccation on the first day for each oyster
(diploid and triploid oysters 1-9). Each time SCS measurements were taken, the parafilm was
removed from each oyster and afterwards a new sheet was put over the notch before oysters were
set out to desiccate between measurements. On the second day of the trial, SCS measurements
were taken after twenty-four, twenty-seven, thirty, and thirty-three hours of desiccation for each
oyster. On the third and final day, SCS measurements were taken after forty-eight, fifty-one, and
fifty-four hours of desiccation. Oysters were measured in these three-hour increments on each
day to allow for partial recovery from the stress of SCS measurements. Throughout the trial, any
oyster mortality was noted at each measurement period and dead oysters were thrown away.
Oysters were marked as dead when the oyster gaped and did not close its valves when probed.
LE
NG
TH
HEIGHT WIDTH

66
Figure 4. Oysters in Trial One, wrapped in parafilm and set out to desiccate.
TRIAL TWO: REPEATED DESICCATION
The goal of the second trial was to compare the SCS of diploid and triploid oysters
exposed to weekly, repeated desiccation stress (as would be seen on a typical farm) to control
diploid and triploid oysters, exposed to no desiccation. Sixty, two-year-old Eastern oysters, half
diploid and half triploid, were collected from the Portersville Bay grow-out site. These oysters
had been spawned at the Auburn University Shellfish Lab in summer 2016 and were collected in
late September 2018. Twenty triploids and twenty diploids of similar sizes (based on length)
were selected. The oysters were cleaned of barnacles and algae, and length, height, width, and
whole wet weight measurements were taken. This was done so the effects of shell morphology
characteristics and ploidy on initial SCS could be determined. A notch was chipped in each
oyster and SCS measurements at time zero were taken. Oysters were then divided into four
treatments; diploid control, triploid control, diploids subjected to weekly 24 hrs desiccation
periods, and triploids subjected to weekly 24 hrs desiccation periods. There were ten oysters per
treatment. Each treatment was placed in a separate tray and all trays were placed in the same
brood-stock holding tank, kept at 20°C. Oysters were left to acclimate to the tank for one week.
Oysters were fed Shellfish Diet 1800® Instant Algae based on guidelines from Rikard & Walton

67
(2013). After one week, triploids and diploids in the desiccation treatments were removed from
the tank, their notches were covered in parafilm, and desiccated for 24 hrs. After the 24 hrs
period, SCS measurements of the desiccated oysters were taken and they were placed back into
the broodstock tank. Control triploid and diploid oysters were removed from the tank and SCS
measurements were immediately taken. Control oysters were then placed back into the tank and
all oysters were left in the tank for one week. After a week this procedure was repeated for the
following five weeks. In total this trial was run for six weeks. Throughout the trial, oyster
mortality was noted at each measurement period and dead oysters were thrown away.
TRIAL THREE:
COMPARING ADDUCTOR MUSCLES AND CONDITION INDICES
SCS is a function of the size and health of an oyster’s adductor muscle in pearl oysters
(Aoki et al. 2012). The goal of the third trial was to compare the adductor muscles sizes and
condition indices of similarly sized triploid and diploid Eastern oysters to see if one ploidy’s
advantage in SCS could be due to these factors. Forty, two-year-old Eastern oysters, half diploid
and half triploid, were collected from the Portersville Bay grow-out site. These oysters had been
spawned at the Auburn University Shellfish Lab in summer 2016 and were collected in late
September 2018. Of the forty, ten triploids and ten diploids of similar sizes (based on length)
were selected to compare adductor muscle size and condition index. Length, height, width, and
whole wet weight measurements were taken. Then each oyster was shucked and the adductor
muscle was separated from the shell and the rest of the oyster soft tissue. The adductor muscle
and remaining soft tissue samples were placed in labeled weigh boats (labeled triploid or diploid
1-10) and placed in a drying oven for 48 hrs at 80°C. The shells were also placed in

68
corresponding, labeled weigh boats and left to air dry for 48 hrs. After the drying period,
adductor muscle, remaining soft tissue, and shell dry weights were taken.
Shell cavity volume was calculated by subtracting dry shell weight from whole wet
weight of the oyster (Equation 1). This method was used by Mercado-Silva (2005) who reasoned
that the amount of water the shell could hold could be calculated from the weight difference
between whole wet weight and when the animal was completely dried. That weight could then be
converted from gram into milliliters; a one to one conversion. Next, the ratio of dry adductor
weight to shell cavity volume was calculated using Equation 2. Condition index was calculated
using Equation 3, where dry tissue weight is dry adductor and dry soft tissue weight combined
(Mercado-Silva 2005; Abbe & Sanders 1988). These parameters were used to compare the
morphology and condition of similarly sized diploid and triploid oysters.
(Equation 1)
Shell cavity volume (ml) = Whole wet weight (g) – Dry shell weight (g)
(Equation 2)
Adductor to Volume Ratio (g/ml) = Dry Adductor Weight (g) /Shell cavity volume (ml)
(Equation 3)
Condition Index = [dry tissue weight (g) / shell cavity volume (ml)] × 100
DATA ANALYSIS
All analyses were done using the statistical software program, RStudio and the packages
lsmeans, multcomp, and nlme (R Development Core Team, 2018). For Trial One, the effect of
shell morphology characteristics and ploidy on initial SCS was determined using a multiple

69
linear regression model. The multiple linear regression model was run on the initial SCS of the
oysters, SCS at time zero, and four shell morphology characteristics (length, height, width, and
weight), and ploidy. The United States EPA’s Toxicity Relationship Analysis Program (TRAP)
was used to analyze and graph the mortality data, as well as calculate LT50 values (Lethal Time
until death for 50% of the population) for each ploidy. Maximum Likelihood Tolerance
Distribution was performed with Gaussian distribution. Initially, SCS measurements were
analyzed using a linear regression model to see the effect ploidy had on SCS over time.
However, to make comparisons between SCS regressions of each ploidy over time, a repeated
measures design was used, using individual oysters as a random variable. The equation is shown
below:
(Equation 4)
SCS = µ + b1(Time) + b2(Ploidy) + eoyster ~N(0, soyster) + erandom ~N(0, srandom)
SCS = dependent variable, shell-closing strength
µ = overall mean
Time= continuous time from the start of the experiment until the end
Ploidy= the effect of ploidy (Triploid or diploid)
eoyster = Random effect of oyster
erandom = Random effect
In RStudio, the linear mixed-effects model function was used to analyze and compare the
regressions of SCS and for each ploidy over time. The normality of residuals was determined
using the Shapiro-Wilks test. Data were considered normally distributed when p > 0.05. All
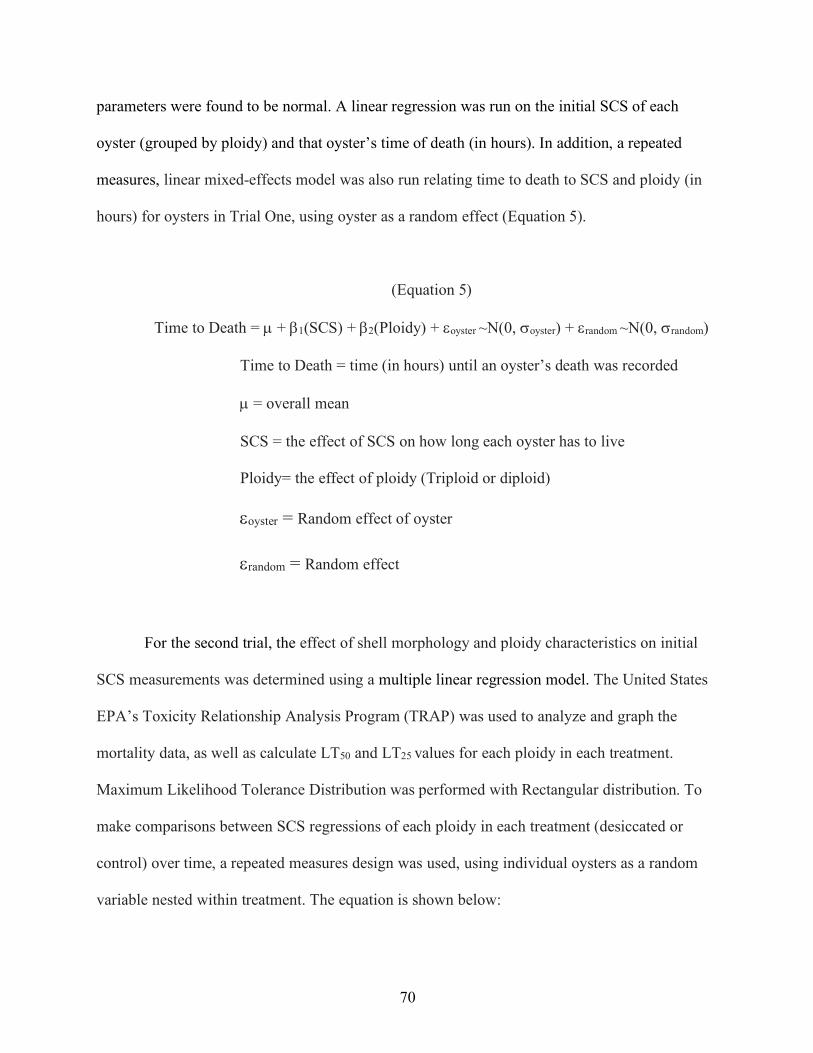
70
parameters were found to be normal. A linear regression was run on the initial SCS of each
oyster (grouped by ploidy) and that oyster’s time of death (in hours). In addition, a repeated
measures, linear mixed-effects model was also run relating time to death to SCS and ploidy (in
hours) for oysters in Trial One, using oyster as a random effect (Equation 5).
(Equation 5)
Time to Death = µ + b1(SCS) + b2(Ploidy) + eoyster ~N(0, soyster) + erandom ~N(0, srandom)
Time to Death = time (in hours) until an oyster’s death was recorded
µ = overall mean
SCS = the effect of SCS on how long each oyster has to live
Ploidy= the effect of ploidy (Triploid or diploid)
eoyster = Random effect of oyster
erandom = Random effect
For the second trial, the effect of shell morphology and ploidy characteristics on initial
SCS measurements was determined using a multiple linear regression model. The United States
EPA’s Toxicity Relationship Analysis Program (TRAP) was used to analyze and graph the
mortality data, as well as calculate LT50 and LT25 values for each ploidy in each treatment.
Maximum Likelihood Tolerance Distribution was performed with Rectangular distribution. To
make comparisons between SCS regressions of each ploidy in each treatment (desiccated or
control) over time, a repeated measures design was used, using individual oysters as a random
variable nested within treatment. The equation is shown below:

71
(Equation 6)
SCS = µ +b1(Time)+b2(Ploidy)+b3(Desiccation)+eoyster ~N(0, soyster)+
erandom ~N(0, srandom)
SCS = dependent variable, shell-closing strength
µ = overall mean
Time= continuous time from the start of the experiment until the end
Ploidy= The effect of ploidy (Triploid or diploid)
Desiccation= The effect of desiccation level (0 hrs or 24 hrs)
eoyster = Random effect of oyster nested within treatment
erandom = Random effect
The normality of residuals was determined using the Shapiro-Wilks test. Data were considered
normally distributed when p > 0.05. All parameters were found to be normal. A linear regression
was run on the initial SCS of each oysters (grouped by ploidy and desiccation time) and that
oyster’s time of death (in weeks).
For the third trial, linear regression models were used to analyze differences in adductor
muscle characteristics (adductor muscle mass, adductor mass to shell cavity volume ratio, and
condition index) between triploid and diploids oysters.
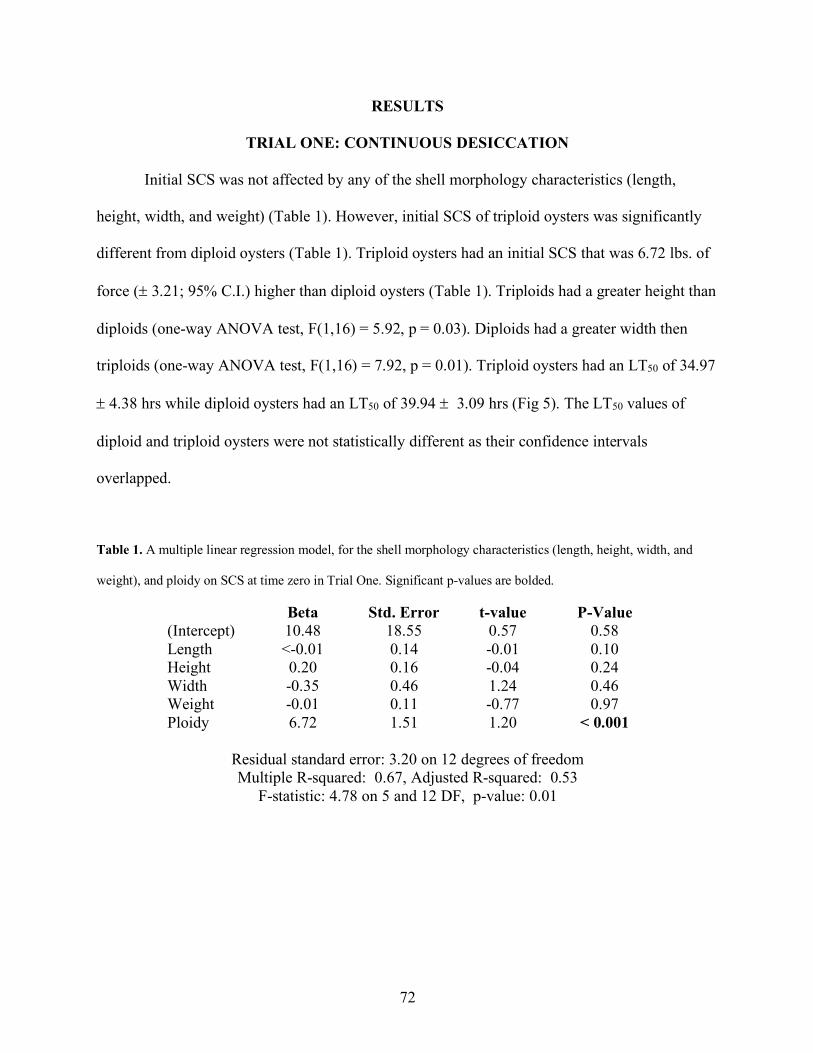
72
RESULTS
TRIAL ONE: CONTINUOUS DESICCATION
Initial SCS was not affected by any of the shell morphology characteristics (length,
height, width, and weight) (Table 1). However, initial SCS of triploid oysters was significantly
different from diploid oysters (Table 1). Triploid oysters had an initial SCS that was 6.72 lbs. of
force (± 3.21; 95% C.I.) higher than diploid oysters (Table 1). Triploids had a greater height than
diploids (one-way ANOVA test, F(1,16) = 5.92, p = 0.03). Diploids had a greater width then
triploids (one-way ANOVA test, F(1,16) = 7.92, p = 0.01). Triploid oysters had an LT50 of 34.97
± 4.38 hrs while diploid oysters had an LT50 of 39.94 ± 3.09 hrs (Fig 5). The LT50 values of
diploid and triploid oysters were not statistically different as their confidence intervals
overlapped.
Table 1. A multiple linear regression model, for the shell morphology characteristics (length, height, width, and
weight), and ploidy on SCS at time zero in Trial One. Significant p-values are bolded.
Beta Std. Error t-value P-Value (Intercept) Length Height Width Weight Ploidy
10.48 <-0.01 0.20 -0.35 -0.01 6.72
18.55 0.14 0.16 0.46 0.11 1.51
0.57 -0.01 -0.04 1.24 -0.77 1.20
0.58 0.10 0.24 0.46 0.97
< 0.001
Residual standard error: 3.20 on 12 degrees of freedom Multiple R-squared: 0.67, Adjusted R-squared: 0.53
F-statistic: 4.78 on 5 and 12 DF, p-value: 0.01
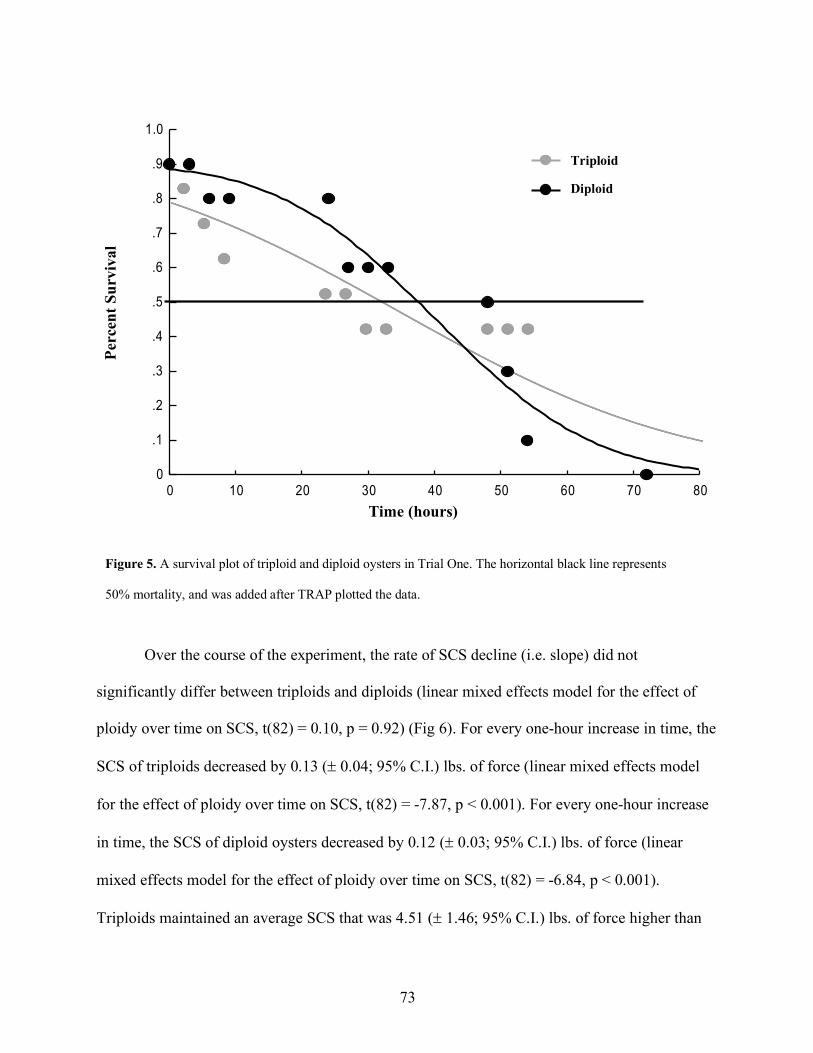
73
Over the course of the experiment, the rate of SCS decline (i.e. slope) did not
significantly differ between triploids and diploids (linear mixed effects model for the effect of
ploidy over time on SCS, t(82) = 0.10, p = 0.92) (Fig 6). For every one-hour increase in time, the
SCS of triploids decreased by 0.13 (± 0.04; 95% C.I.) lbs. of force (linear mixed effects model
for the effect of ploidy over time on SCS, t(82) = -7.87, p < 0.001). For every one-hour increase
in time, the SCS of diploid oysters decreased by 0.12 (± 0.03; 95% C.I.) lbs. of force (linear
mixed effects model for the effect of ploidy over time on SCS, t(82) = -6.84, p < 0.001).
Triploids maintained an average SCS that was 4.51 (± 1.46; 95% C.I.) lbs. of force higher than
Figure 5. A survival plot of triploid and diploid oysters in Trial One. The horizontal black line represents
50% mortality, and was added after TRAP plotted the data.
Exposure Variable
Effec
t Vari
able
0 10 20 30 40 50 60 70 800
.1
.2
.3
.4
.5
.6
.7
.8
.9
1.0
Time (hours)
Perc
ent S
urvi
val
Triploid
Diploid

74
diploids throughout the experiment (linear mixed effects model for comparisons of the effect of
ploidy over time on SCS, t(82) = 6.20, p < 0.001).
When a linear regression was run on triploid oysters used in the first trial, there was a
significant positive correlation between the initial SCS of triploid oysters and each oyster’s
corresponding time of death (t(4) = 3.35, r= 0.73, p = 0.03). Additionally, there was a significant
relationship between the initial SCS of diploid oysters and each oyster’s corresponding time of
death when a linear regression was performed (t(4) = 2.78, r= 0.51, p = 0.03).
A significant relationship was found between time to death and SCS for triploid and
diploid oysters (linear mixed effects model for comparisons of the effects of ploidy and SCS on
Figure 6. A plot of individual SCS measurements (the points, in lbs. of force) in relation to time and
regression lines for diploids and triploids.
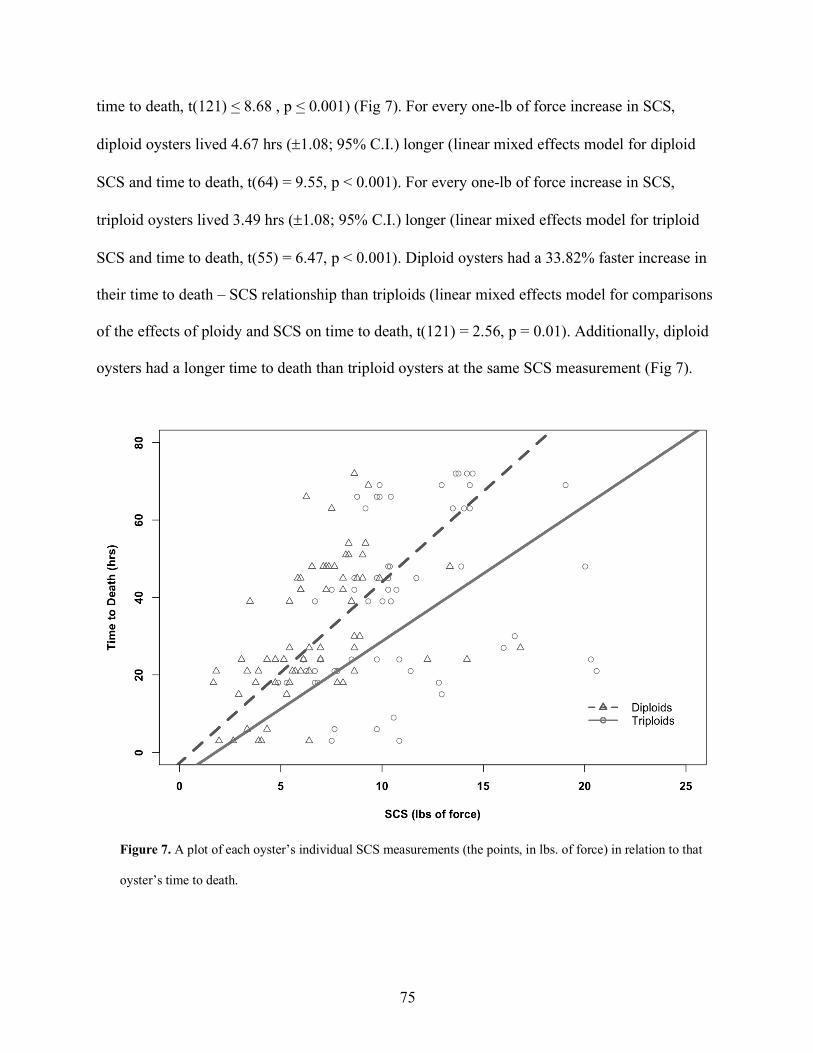
75
time to death, t(121) < 8.68 , p < 0.001) (Fig 7). For every one-lb of force increase in SCS,
diploid oysters lived 4.67 hrs (±1.08; 95% C.I.) longer (linear mixed effects model for diploid
SCS and time to death, t(64) = 9.55, p < 0.001). For every one-lb of force increase in SCS,
triploid oysters lived 3.49 hrs (±1.08; 95% C.I.) longer (linear mixed effects model for triploid
SCS and time to death, t(55) = 6.47, p < 0.001). Diploid oysters had a 33.82% faster increase in
their time to death – SCS relationship than triploids (linear mixed effects model for comparisons
of the effects of ploidy and SCS on time to death, t(121) = 2.56, p = 0.01). Additionally, diploid
oysters had a longer time to death than triploid oysters at the same SCS measurement (Fig 7).
Figure 7. A plot of each oyster’s individual SCS measurements (the points, in lbs. of force) in relation to that
oyster’s time to death.
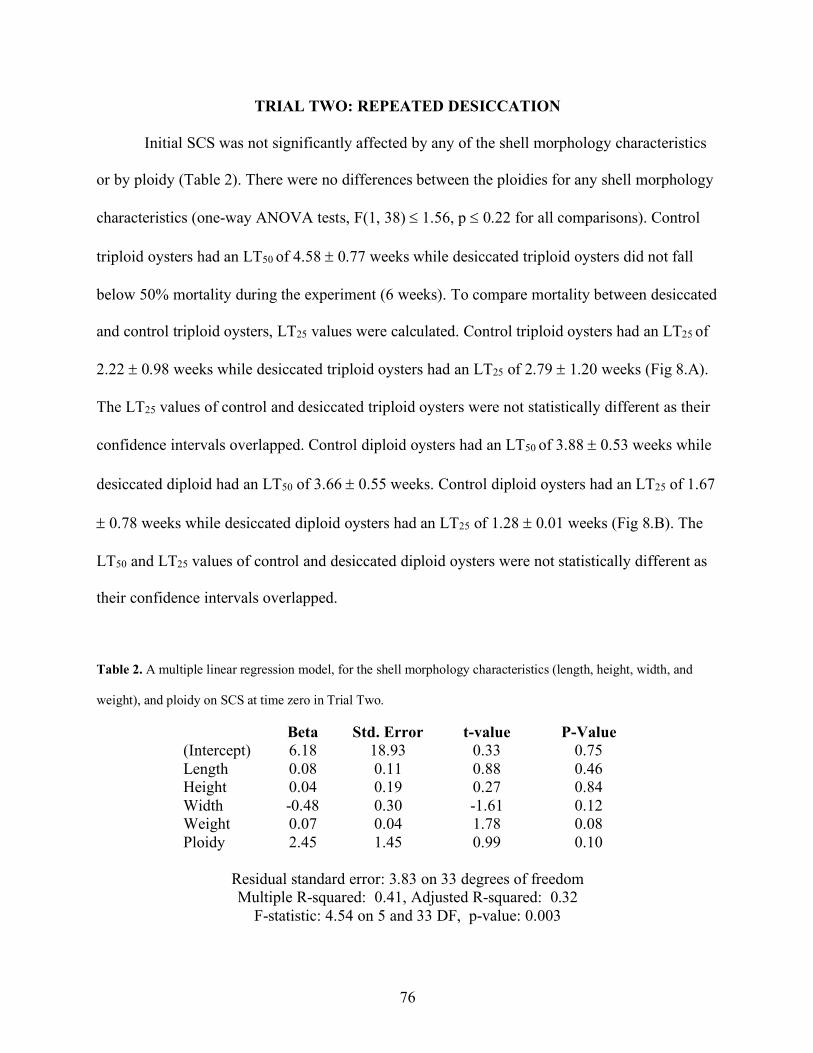
76
TRIAL TWO: REPEATED DESICCATION
Initial SCS was not significantly affected by any of the shell morphology characteristics
or by ploidy (Table 2). There were no differences between the ploidies for any shell morphology
characteristics (one-way ANOVA tests, F(1, 38) £ 1.56, p £ 0.22 for all comparisons). Control
triploid oysters had an LT50 of 4.58 ± 0.77 weeks while desiccated triploid oysters did not fall
below 50% mortality during the experiment (6 weeks). To compare mortality between desiccated
and control triploid oysters, LT25 values were calculated. Control triploid oysters had an LT25 of
2.22 ± 0.98 weeks while desiccated triploid oysters had an LT25 of 2.79 ± 1.20 weeks (Fig 8.A).
The LT25 values of control and desiccated triploid oysters were not statistically different as their
confidence intervals overlapped. Control diploid oysters had an LT50 of 3.88 ± 0.53 weeks while
desiccated diploid had an LT50 of 3.66 ± 0.55 weeks. Control diploid oysters had an LT25 of 1.67
± 0.78 weeks while desiccated diploid oysters had an LT25 of 1.28 ± 0.01 weeks (Fig 8.B). The
LT50 and LT25 values of control and desiccated diploid oysters were not statistically different as
their confidence intervals overlapped.
Table 2. A multiple linear regression model, for the shell morphology characteristics (length, height, width, and
weight), and ploidy on SCS at time zero in Trial Two.
Beta Std. Error t-value P-Value (Intercept) Length Height Width Weight Ploidy
6.18 0.08 0.04 -0.48 0.07 2.45
18.93 0.11 0.19 0.30 0.04 1.45
0.33 0.88 0.27 -1.61 1.78 0.99
0.75 0.46 0.84 0.12 0.08 0.10
Residual standard error: 3.83 on 33 degrees of freedom Multiple R-squared: 0.41, Adjusted R-squared: 0.32
F-statistic: 4.54 on 5 and 33 DF, p-value: 0.003

77
Figure 8.
A. Survival plot of control and desiccated triploid oysters in Trial Two.
B. Survival plot of control and desiccated diploid oysters in Trial Two.
The horizontal solid line represents 50% mortality, the horizontal dotted line represents 25% mortality in both
A
B
T ime (w eeks)
Perce
nt Su
rvival
0 1. 2. 3. 4. 5. 6. 7.0
.1
.2
.3
.4
.5
.6
.7
.8
.9
1.0
Perc
ent S
urvi
val
Time (weeks)
Triploid desiccated
Triploid control
T ime (w eeks)
Percen
t Surv
ival
0 1. 2. 3. 4. 5. 6. 7.0
.2
.4
.6
.8
1.0
1.2
Time (weeks)
Perc
ent S
urvi
val
Diploid control
Diploid desiccated
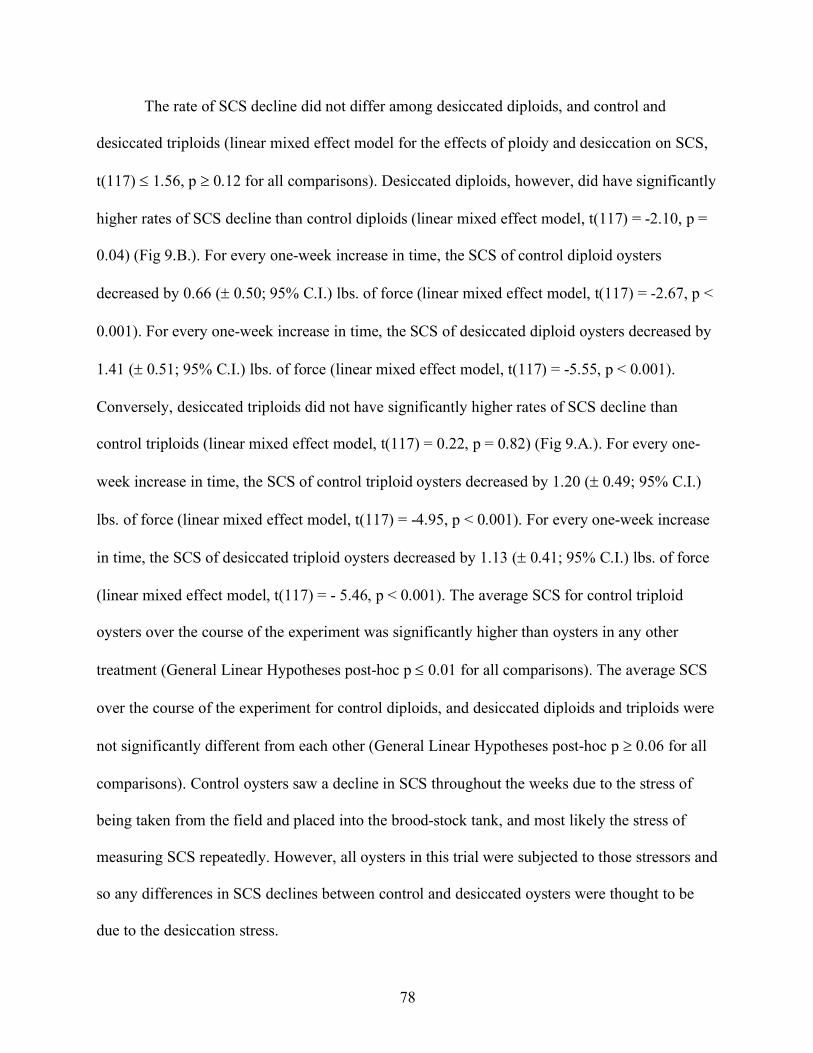
78
The rate of SCS decline did not differ among desiccated diploids, and control and
desiccated triploids (linear mixed effect model for the effects of ploidy and desiccation on SCS,
t(117) £ 1.56, p ³ 0.12 for all comparisons). Desiccated diploids, however, did have significantly
higher rates of SCS decline than control diploids (linear mixed effect model, t(117) = -2.10, p =
0.04) (Fig 9.B.). For every one-week increase in time, the SCS of control diploid oysters
decreased by 0.66 (± 0.50; 95% C.I.) lbs. of force (linear mixed effect model, t(117) = -2.67, p <
0.001). For every one-week increase in time, the SCS of desiccated diploid oysters decreased by
1.41 (± 0.51; 95% C.I.) lbs. of force (linear mixed effect model, t(117) = -5.55, p < 0.001).
Conversely, desiccated triploids did not have significantly higher rates of SCS decline than
control triploids (linear mixed effect model, t(117) = 0.22, p = 0.82) (Fig 9.A.). For every one-
week increase in time, the SCS of control triploid oysters decreased by 1.20 (± 0.49; 95% C.I.)
lbs. of force (linear mixed effect model, t(117) = -4.95, p < 0.001). For every one-week increase
in time, the SCS of desiccated triploid oysters decreased by 1.13 (± 0.41; 95% C.I.) lbs. of force
(linear mixed effect model, t(117) = - 5.46, p < 0.001). The average SCS for control triploid
oysters over the course of the experiment was significantly higher than oysters in any other
treatment (General Linear Hypotheses post-hoc p £ 0.01 for all comparisons). The average SCS
over the course of the experiment for control diploids, and desiccated diploids and triploids were
not significantly different from each other (General Linear Hypotheses post-hoc p ³ 0.06 for all
comparisons). Control oysters saw a decline in SCS throughout the weeks due to the stress of
being taken from the field and placed into the brood-stock tank, and most likely the stress of
measuring SCS repeatedly. However, all oysters in this trial were subjected to those stressors and
so any differences in SCS declines between control and desiccated oysters were thought to be
due to the desiccation stress.
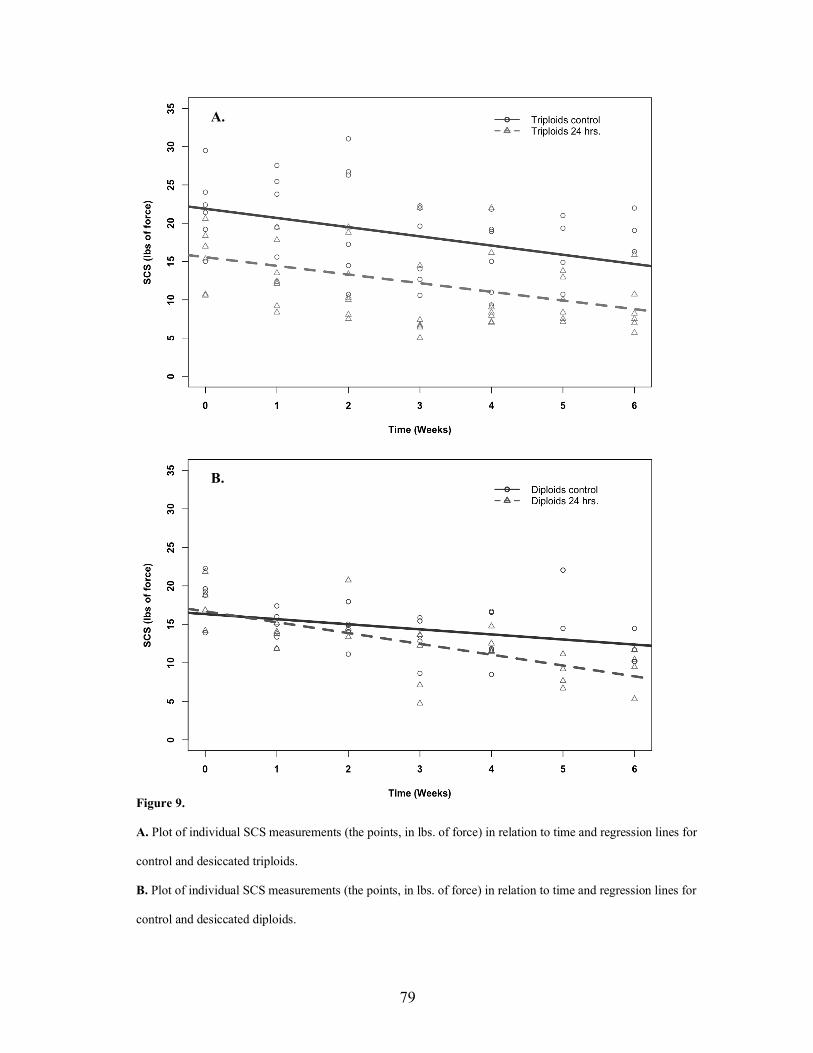
79
Figure 9.
A. Plot of individual SCS measurements (the points, in lbs. of force) in relation to time and regression lines for
control and desiccated triploids.
B. Plot of individual SCS measurements (the points, in lbs. of force) in relation to time and regression lines for
control and desiccated diploids.
A.
B.

80
With the exception of desiccated triploids, there was a significant positive relationship
between the initial SCS of oysters and each oyster’s corresponding time of death (Table 3).
Table 3. Individual linear regressions of initial SCS for each ploidy subjected to each desiccation treatment and to
time of death, in Trial Two. Significant p-values are bolded.
Treatment df Beta Std. Error t-value P-Value Triploid 0 hrs Diploid 0 hrs Triploid 24 hrs Diploid 24 hrs
7 7 5 8
1.59 1.43 1.22 1.23
0.59 0.33 0.57 0.29
2.67 4.34 2.15 4.21
0.03 <0.01 0.08 <0.01
TRIAL THREE:
COMPARING ADDUCTOR MUSCLES AND CONDITION INDICES
Initial dry adductor muscle mass, the ratio of adductor mass to shell cavity volume, and
condition index all differed significantly between ploidies. Triploids had a dry adductor weight
that was 0.35 (±0.21; 95% C.I.) grams greater than diploids (linear regression of adductor weight
between ploidies, t(12) = 3.72, p < 0.01). Triploids had an Adductor to Volume Ratio (calculated
from Equation 2) that was 0.01 (± <0.01; 95% C.I.) g/ml greater than the ratio for diploids (linear
regression of adductor to volume ratio between ploidies, t(12) = 4.11, p < 0.001). Triploids had a
condition index (calculated from Equation 3) that was 0.02 (±0.01; 95% C.I.) greater than that of
diploids (linear regression of condition indices between ploidies, t(12) = 3.84, p < 0.01).
DISCUSSION
Diploid and triploid oysters reacted similarly to the continuous desiccation stress of the
first trial. While triploids had a higher initial SCS than diploids, neither the LT50 values or rate of
81
SCS decline of triploid and diploid oysters in Trial 1 differed in response to the desiccation (Fig
5 & 6). These results differ from the conventional wisdom (of many scientists and farmers)
because triploids are thought to be more sensitive to stress than diploids. However, diploid and
triploid oysters have been observed dying at the same rates under extreme stress conditions.
Lombardi et al. (2013) saw no effect of ploidy on mortality when triploid and diploid Eastern
oysters were subjected to critically hypoxic conditions (0.5 mg/L of dissolved oxygen). The
stress imposed in the first trial may have been so severe, that any potential differences in
responses between the ploidies were overwhelmed.
Diploid oysters were more vulnerable to the weekly, repeated desiccation stress of the
second trial. Under the same stressful conditions, desiccated triploids in this experiment had
lower mortality than desiccated diploids. Also, desiccated triploids did not have significantly
higher rates of SCS decline when compared to their control counterparts, whereas desiccated
diploids did. The LT50 values among control triploid and diploid (control and desiccated) oysters
in Trial 2 were all similar (Fig 8.A & B). Desiccated triploid oysters, however, did not reach
50% mortality during the course of the experiment and so could not be compared. LT25 values
were calculated so all four groups could be compared to each other. Triploid and diploid oysters
(both control and desiccated) all had LT25 values that were similar. This finding suggests that
early in the experiment all oysters, regardless of ploidy and desiccation level, were dying at
similar rates. However, control diploid oysters had a lower rate of SCS decline when compared
to oysters from any other treatment (Fig 9.A & B). Consequently, desiccated diploids had a
steeper rate of SCS decline than control diploids. This difference in SCS rates was not found
when comparing desiccated triploids to control triploids. In addition, desiccated triploid oysters
had the lowest mortality rate; they did not reach 50% mortality during the experiment. These

82
findings suggest that diploid oysters were more vulnerable to repeated desiccation stress than
triploid oysters. Triploid oysters could possess inherent physiological factors that allow for them
to have increased resistance to repeated desiccation stress. Nell et al. (1994) saw triploid Sydney
rock oysters, S. commercialis, living in intertidal areas exposed to intermittent desiccation
periods, suffer less mortality than the diploid oysters during the winter months (when water
temperatures in Australia are warmest). Triploid oysters are known to use less of their stored
glycogen reserves through the period of gametogenesis (generally when water temperature begin
to warm) than diploids (Allen & Downing 1986). Glycogen is a crucial energy store during
hypoxic conditions (David et al. 2005), therefore, triploids may be better equipped to deal with
desiccation stress than diploids.
The adductor muscle advantage of triploid oysters could also explain their decreased
vulnerability to repeated desiccation stress. In the first trial, none of the shell morphology
characteristics (length, height, width, and weight) had an effect on initial SCS (Table 1). The two
ploidies reacted similarly to the continuous desiccation stress, despite triploids having a greater
height and shorter width than diploids. Differences in the rates of SCS decline between ploidies
did not appear to be related to differences in morphology. Again, in the second trial, none of the
shell morphology characteristics (length, height, width, and weight) of the oysters had an effect
on initial SCS (Table 2). Additionally, there were no differences in shell morphology
characteristics between the ploidies. However, triploid oysters did have an advantage in every
adductor muscle characteristic measured in Trial Three: dry adductor weight, adductor weight to
volume ratio, and condition index. Poulet et al. (2003) found a positive correlation between
adductor muscle diameter and tension (the unit of force the study used to measure SCS).
Furthermore, Aoki et al. (2010) found a positive relationship between SCS, and dry adductor

83
muscle mass and condition index. The results from this experiment too, seem to suggest that a
triploid’s larger adductor muscle and higher condition index helped them maintain a similar SCS
decline rate to what they would have under normal conditions. Therefore, potential differences in
SCS rates between ploidies in this experiment were not based on shell morphology
characteristics but may have been due to adductor muscle size and condition index. While this
did not appear to give triploids an advantage with an overwhelming amount of stress (i.e.
continuous desiccation stress in the first trial), it may have assisted them in resisting smaller
amounts of stress (i.e. repeated desiccation stress in the second trial).
The higher an individual oyster’s initial SCS was, the longer it took for that oyster to die.
There was a significant positive relationship between the initial SCS of the oysters and each
oyster’s corresponding time of death in Trial One. Additionally, the same relationship was found
between control triploid and diploid oysters, and diploids desiccated for 24 hrs in the second trial
(Table 3). Aoki et al. (2010) found a comparable correlation concluding that “… pearl oysters
with high SCS showed reduced mortality”. The relationship between initial SCS and time of
death for triploid oysters desiccated for 24 hrs in the second trial was not significant (Table 3).
The majority of triploid oysters in the 24 hrs desiccation treatment did not die and so the sample
size maybe have been too small to find a significant relationship.
Shell-closing strength is able to provide a measure of sublethal stress. Desiccated oysters
exhibited sublethal stress effects (i.e. decreasing SCS or the ability to clamp their valves) leading
up to their deaths. Therefore, this measure of sublethal stress (SCS) has the potential to allow
farmers to anticipate oyster death. Diploid oysters had a longer time to death than triploid oysters
at the same SCS measurement in the first trial (Fig 7). However, diploid oysters came closer to
dying with every lost lb of force of SCS. This might be due to the fact that diploids generally
84
start off at a lower SCS than triploids, thus every lb of force lost had a greater effect. A more
accurate prediction of oyster death could be achieved if the relationship between an oyster’s time
to death and SCS was standardized. More trials like Trial One would need to run to provide
multiple regressions between time to death and SCS. If the regressions were similar, data points
from all the experiments could be pooled together to form a regression between time to death and
SCS, thus standardizing the relationship. Shell-closing strength can be used as a farm
management tool to detect sublethal stress effects on oyster health and anticipate oyster death,
thus reducing crop losses. A more streamlined device for measuring SCS may need to be
developed in order for farmers to access it, however. A lever operated force gauge could be used
to press down on reverse pliers inserted between an oyster’s valves. This gauge would display
the maximum force used to open the valves (with the pliers) to a certain gape. That force would
be the SCS of the oyster. This tool would eliminate the need for an Arduino board and computer
to measure SCS. A lever operated force gauge was not used in this experiment due to budget
limitations.
CONCLUSION
This study demonstrates the potential for SCS to inform oyster farm management. Due to
significant differences between SCS in control oysters and SCS in oysters exposed to continuous
desiccation, we propose that SCS could be used to monitor oyster health while oysters are in
transit, being stored, or being desiccated. Additionally, SCS was a good predictor of how long an
oyster had left to live. Standardization of the time to death - SCS regression could alert farmers
to potential losses when oysters are being transported or desiccated. Selection of oysters with
higher SCS could also be used in breeding programs. Aoki et al. (2010) demonstrated that SCS

85
was a heritable trait and a useful indicator for selecting oysters with higher survival in warmer
water temperatures. Breeding lines of triploid oysters with higher SCS could reduce the
prevalence of summer mortality events in the Gulf of Mexico.
Despite concern over the ability of triploids to withstand desiccation stress during the
summer, tracking SCS indicated triploids to be equally as vulnerable to continuous desiccation as
diploids and less vulnerable to repeated desiccation than diploids. Furthermore, the field
experiment in the previous chapter indicates that neither desiccation stress, tumbling stress, or a
combination of the two disproportionately affect triploid oysters. The results of the field and lab
experiments in this study were surprising and suggest that farm and heat stressors alone do not
cause high triploid mortality. We propose that triploid mortality events may be triggered by a
combination of several stressors. An interaction of stressors such as elevated water temperature,
low salinity, low DO, pathogens, age of the oyster, high trophic level, farm practices, increased
gametogenesis, and physiological stress associated with reproduction are all possible causes of
mortality events (Cheney et al. 2000, Gagnaire et al. 2006, Soletchnik et al. 2007, Pernet et al.
2012, Degremont et al. 2012, Maryline et al. 2019). Further study is needed to identify potential
conditions that lead to higher triploid mortality during the summer months.

86
LITERATURE CITED
Allen S K, Downing S L (1986) Performance of triploid Pacific oysters, Crassostrea gigas (Thunberg). I. Survival, growth, glycogen content, and sexual maturation in yearlings. J Exp Mar Biol Ecol 102:197–208
Allen S K, Downing S L, Chew K K (1989) Hatchery manual for producing triploid oysters.
University Washington Press, Seattle, USA. pp. 1-27. Allen S K, Gaffney P M, Ewart J W (1993) Genetic Improvement of the Eastern Oyster
for Growth and Disease Resistance in the Northeast. NRAC Fact Sheet No. 210 Andrews J D (1996) History Of Perkinsus Marinus, A Pathogen Of Oysters In Chesapeake Bay
1950-1984. VIMS Articles. 503 Aoki H, Ishikawa T, Fujiwara T, Atsumi T, Nishikawa H, Okamoto C, Komaru A (2010) Utility
of shell-closing strength as the indicator of good health in breeding and culture management of Japanese pearl oyster Pinctada fucata. Aquaculture 308:115–118
Aoki H, Tanaka S, Atsumi T, Abe H, Fujiwara T, Kamiya N, Komaru A (2012) Correlation between Nacre-deposition Ability and Shell-closing Strength in Japanese Pearl Oyster Pinctada fucata. Aquaculture 60: 451-457
Arnoldi J F, Bideaultab A, Loreaua M, Haegemana B (2018) How ecosystems recover from
pulse perturbations: A theory of short- to long-term responses. J Theor Biol 436: 79-92 Bartol I K, Mann R, Luckenbach M (1999) Growth and mortality of oysters (Crassostrea
virginica) on constructed intertidal reefs: effects of tidal height and substrate level. J Exp Mar Biol Ecol 237: 157-184
Boettcher K J, Geaghan K K, Maloy A P, Barber B J (2005) Roseovarius crassostreae sp. nov., a
member of the Roseobacter clade and the apparent cause of juvenile oyster disease (JOD) in cultured Eastern oysters. Int J Syst Evol Microbiol 55:1531–1537
Burreson E M, Stokes N A (2000) Increased Virulence in an Introduced Pathogen:
Haplosporidium nelsoni (MSX) in the Eastern Oyster Crassostrea virginica. J Aquat Anim Health 12:1–8
Carmichael R H, Walton W C, Clark Heidi (2012) Bivalve-enhanced nitrogen removal from
coastal estuaries. Can J Fish Aquat Sci 69: 1131–1149 Casas S, Walton W, Chaplin G, Rikard S, Supan J, La Peyre J (2017). Performance of oysters
selected for dermo resistance compared to wild oysters in northern Gulf of Mexico estuaries. Aquacult Environ Interact 9: 169-180
87
Cheney D P, Macdonald B F, Elston R A (2000) Summer Mortality of Pacific Oysters, Crassostrea gigas (Thunberg): Initial Findings on Multiple Environmental Stressors in Puget Sound, Washington 1998. J Shellfish Res 19:353-359
Cheney D P, Burnett L E, Christy A, Davis J P, Elston R A, Friedman C S, Griffin F, Langdon
C, Suhrbier A (2004) Improvement of disease resistance and understanding of summer mortality in Pacific oysters Crassostrea gigas. J. Shellfish Res. 23:284–285.
David E, Tanguy A, Pichavant K, Moraga D (2005) Response of the Pacific oyster Crassostrea
gigas to hypoxia exposure under experimental conditions. FEBS J. 272:5635–5652 Davis, J E, Walton W C, Chaplin G, Rikard F S, Swann D L and Hanson T (2012) Gulf Coast
Off-Bottom Oyster Farming Gear Types: Floating Cage System. Mississippi- Alabama Sea Grant Consortium Publication #12-013-03. 2 pp.
Dégremont L, Soletchnik P, Boudry P (2010) Summer Mortality of Selected Juvenile Pacific
Oyster Crassostrea gigas Under Laboratory Conditions and in Comparison with Field Performance. J Shellfish Res 29: 847-856
Dégremont L, Garcia C, Frank-Lawale A, Allen Jr. S K (2012) Triploid Oysters in the
Chesapeake Bay: Comparison of Diploid and Triploid Crassostrea virginica. J Shellfish Res 31: 21-31
FAO (Food and Agriculture Organization of the United Nations). (2015) Crassostrea
virginica (Gmelin, 1791) http://www.fao.org/fishery/culturedspecies/Crassostrea_virginica/en#tcNA003C. (accessed 8 Oct 2017)
Fodrie F J , Rodriguez A B , Gittman R K , Grabowski J H, Lindquist N L , Peterson C H,
Piehler M F, and Ridge J T (2017) Oyster reefs as carbon sources and sinks. Proc R Soc B 284
Ford S E, Borrero F J (2001) Epizootiology and Pathology of Juvenile Oyster Disease
in the Eastern Oyster, Crassostrea virginica. J Invertebr Pathol 78:141–154 Ford S E, Haskin H (1982) History and Epizootiology of Haplosporidium nelsoni (MSX), an
Oyster Pathogen in Delaware Bay, 1957-1980. J Invertebr Pathol 40:118-141 Gagnaire B, Soletchnik P, Madec P, Geairon P,Le Moine O, Renaulta R (2006) Diploid
and triploid Pacific oysters, Crassostrea gigas (Thunberg), reared at two heights above sediment in Marennes-Oleron Basin, France: Difference in mortality, sexual maturation and haemocyte parameters. Aquaculture 254: 606-616
Galtsoff P S (1964) Morphology and Structure of Shell. In: The American Oyster, Crassostrea
virginica Gmelin. Fishery Bulletin 64. United States Government Printing Office.

88
Garnier-Gere P H, Naciri-Graven Y, Bougrier S, Magoulas A, Héral M, Kotoulas G, Hawkins A, Gérard A. (2002) Influences of triploidy, parentage and genetic diversity on growth of the Pacific oyster Crassostrea gigas reared in contrasting natural environments. Mol Ecol 11:1499-514
Glude J B (1975) A summary report of the Pacific Coast oyster mortality investigations 1965-
1972. Proceedings of the Third U.S.-Japan Meeting on Aquaculture at Tokyo, Japan. October 15-16, 1974. p. 28.
Gray J S, Wu R S, Or Y Y (2002) Effects of hypoxia and organic enrichment on the
coastal marine environment. Mar Ecol Prog Ser 238: 249–279 Grice R, Walton W (2017) Alabama shellfish aquaculture situation and outlook report:
Production Year 2016. Auburn University Marine Extension and Research Center. Grodeska S M, Jones J L, Arias C R, Walton W C (2016) Effects of desiccation practices and
ploidy on Vibrio spp. abundances of cultured oysters, Crassostrea virginica. J Food Prot 80: 1280–1287
Hand S C, Stickle W B (1977) Effects of tidal fluctuations of salinity on pericardial fluid
composition of the American oyster Crassostrea virginica. Mar Biol 42:259–271. Hawkins A J S & Day A J (1996) The metabolic basis of genetic differences in growth efficiency
among marine animals. J Exp Mar Biol Ecol 203: 93-115 Hudson K, Murray T J (2015) Virginia Shellfish Aquaculture Situation and Outlook Report,
Results of the 2014 Virginia Shellfish Aquaculture Crop Reporting Survey. VIMS Marine Resource Report No. 2015-3
Hughes F M, Foster B, Grewal S, Sokolova I M (2010) Apoptosis as a host defense mechanism
in Crassostrea virginica and its modulation by Perkinsus marinus. Fish & Shellfish Immunology 29:247-257
Kemp W M, Boynton W R (1980) Influence of biological and physical processes on dissolved
oxygen dynamics in an estuarine system: Implications for measurement of community metabolism. Estuar Coast Mar Sci 2: 407-431
Kesarcodi-Watson A, Klumpp D W, Lucas J S (2001) Comparative feeding and physiological
energetics in diploid and triploid Sydney rock oysters (Saccostrea commercialis): II. Influences of food concentration and tissue energy distribution. Aquaculture 203:195– 216
Kirby M X (2004) Fishing down the coast: Historical expansion and collapse of oyster fisheries
along continental margins. Proc Natl Acad Sci USA 101(35)
89
Koganezawa A (1974) Present status of studies on the mass mortality of cultured oysters in Japan and its prevention. In: Proceedings of the Third U.S.-Japan Meeting on Aquaculture. Tokyo, Japan, October 15-16, 1974. pp. 29-34.
La Peyre J F, Chu F E, Meyers J M (1995) Haemocytic and humoral activities of eastern and
Pacific oysters following challenge by the protozoan Perkinsus marinus. Fish Shellfish Immunol 5(3) 179-190
La Peyre M K, Nickens A D, Volety A K, Tolley G S, La Peyre J F (2003) Environmental
significance of freshets in reducing Perkinsus marinus infection in eastern oysters Crassostrea virginica: potential management applications. Mar Ecol Prog Ser. 248:165- 176
La Peyre M K, Eberline B S, Soniat T M, La Peyre J F (2013) Differences in extreme low
salinity timing and duration differentially affect eastern oyster (Crassostrea virginica) size class growth and mortality in Breton Sound, LA. Estuar Coast Shelf Sci. 135:146- 157
Lombardi S A, Harlan N P, and Paynter K T (2013) Survival, Acid-Base Balance, and Gaping
Responses of the Asian Oyster Crassostrea ariakensis and the Eastern Oyster Crassostrea virginica During Clamped Emersion and Hypoxic Immersion. J Shellfish Res. 32(2):409–415
Lorio W J and Malone S (1994) The Cultivation of American Oysters (Crassostrea
virginica). Southern Regional Aquaculture Center Publication 432 Lowe M R, Sehlinger T, Soniat T M, La Peyre M K (2017) Interactive Effects of Water
Temperature and Salinity on Growth and Mortality of Eastern Oysters, Crassostrea virginica: A Meta-Analysis Using 40 Years of Monitoring Data. J. of Shellfish Res 36(3):683-697
Maryline H, Suzanne T, Lucie D, Elise O, Beatrice A, Mélanie L, Pierre-Hugues P (2019)
Abnormal mortality of triploid adult Pacific oysters: Is there a correlation with high gametogenesis in Normandy, France? Aquaculture 505
Mercado-Silva N (2005) Condition index of the eastern oyster, Crassostrea virginica (Gmelin,
1791) in Sapelo Island Georgia-Effects of site, position on bed and pea crab parasitism J Shellfish Res 24:121-126
Munroe D, Tabatabai A, Burt I, Bushek D, Powell E N, Wilkin J (2013) Oyster mortality in
Delaware Bay: Impacts and recovery from Hurricane Irene and Tropical Storm Lee. Estuar Coast Shelf Sci 135: 209-219
Nell J A (2002) Farming triploid oysters. Aquaculture 210:69 – 88
90
Nell J A, Cox E, Smith I A, Maguire G B (1994) Studies on triploid oysters in Australia. I. The farming potential of triploid Sydney rock oysters Saccostrea commercialis (Iredale and Roughley). Aquaculture. 126:243-255
Newell R I E (2004) Ecosystem Influences of Natural and Cultivated Populations of Suspension-
Feeding Bivalve Molluscs: A Review. J Shellfish Res 23:51-61 NOAA (Fisheries Eastern Oyster Biological Review Team) (2007) Status Review of the Eastern
Oyster (Crassostrea virginica). National Marine Fisheries Service, Northeast Regional Office
NOAA (2017) Chesapeake Bay Oyster Facts (Crassostrea Virginica).
https://chesapeakebay.noaa.gov/fish-facts/oysters (accessed 16 Oct 2017) NOAA Fisheries (2015) Fisheries of the United States, 2016.
https://www.fisheries.noaa.gov/feature-story/fisheries-united-states-2016 (accessed 28 Mar 2019)
Okamoto C, Komaru A, Hayashi M, Isowa K (2006a) Shell-closing strength of pearl oyster,
Pinctada fucata martensii and its relationship to mortality and various parts weight of oyster. Aquaculture 54:293-299
Ortega S (1981) Environmental stress, competition and dominance of Crassostrea virginica near
Beaufort, North Carolina, USA. Marine Biology 62: 47–56 Ozbay G, Reckenbeil B, Marenghi F, Erbland P (2014) Eastern oyster (Crassostrea virginica)
aquaculture and diversity of associated species. Delaware State University, Department of Agriculture and Natural Resources. pp. 1-54.
Patterson H K (2014) Dissolved oxygen stress on the eastern oyster, Crassostrea virginica:
Implications for physiology, management and restoration efforts. PhD dissertation. University of South Alabama, Mobile, AL.
Patterson H K, Carmichael R H (2018) Dissolved oxygen concentration affects d15N values in
oyster tissues: implications for stable isotope ecology. Ecosphere 9(3). Pernet F, Barret J, Le Gall P, Corporeau C, Dégremont L, Lagarde F, Pépin J-F, Keck N (2012)
Mass mortalities of Pacific oysters Crassostrea gigas reflect infectious diseases and vary with farming practices in the Mediterranean Thau lagoon, France. Aquacult Environ Interact Vol. 2: 215–237
Poulet S A, Lennon J, Plouvenez F, Jalabert F, Correc G, Cueff A, Lacoste A (2003) A
nondestructive tool for the measurement of muscle strength in juvenile oysters Crassostrea gigas. Aquaculture 217:49-60
91
Puchnick-Legat A, Legat J F, Gomes C, Suhnel S, Melo CM (2015) Anesthesia in oysters of the genus Crassostrea cultured in Brazil. Bol. Inst. Pesca. 41: 785-793
Rainer J S, Mann R (1992) A comparison of methods for calculating condition
index in eastern oysters Crassostrea virginica (Gmelin, 1791). J Shellfish Res 11(1):55-58
Rikard F S, Walton W C (2013) Use of Microalgae concentrations for Rearing Oyster
Larvae. Mississippi-Alabama Sea Grant Consortium MASGP-12-048 Ring C C (2012) Evaluation of a Mechanical Grader for the Improvement of the Aquaculture
Production of the Eastern Oyster, Crassostrea virginica, in the Northern Gulf of Mexico. MSc dissertation, Auburn University, Auburn, AL
Rybovich M, La Peyre M K, Hall S G, La Peyre J F (2016) Increased Temperatures Combined
with Lowered Salinities Differentially Impact Oyster Size Class Growth and Mortality. J. of Shellfish Res 35(1):101-113
Shumway, S. E (1996) Natural environmental factors. In: Kennedy, V. S., R. I. E. Newell and A.
F. Eble., ed. The Eastern Oyster Crassostrea virginica. Maryland Sea Grant College, University of Maryland, College Park, Maryland. pp. 467-514.
Shumway S E, Davis C, Downey R, Karney R, Kraeuter J, Parsons J, Rheault R, Wikfors G
(2003) Shellfish aquaculture - In praise of sustainable economies and environments. J World Aquacult Soc 34
Shumway, S E, Koehn R K (1982) Oxygen consumption in the American oyster Crassostrea
virginica. Mar Ecol Prog Ser 9:59–68. Soletchnik P, Ropert M, Mazurié J, Gildas Fleury P, Le Coz F (2007) Relationships between
oyster mortality patterns and environmental data from monitoring databases along the coasts of France. Aquaculture 271: 384-400
Sprague J B (1971) Measurement of Pollutant Toxicity to Fish III – Sublethal effects and “safe”
concentrations. Water Research Pergamon Press 5:245-266 Stanley J G, Hidu H, Allen S K (1984) Growth of American oysters increased by polyploidy
induced by blocking meiosis I but not meiosis II. Aquaculture 37:147–155. Stickle W B, Kapper M A, Liu L, Gnaiger E, Want A Y (1989) Metabolic Adaptations of
Several Species of Crustaceans and Molluscs to Hypoxia: Tolerance and Microcalorimetric Studies. Bio Bull Rev 177:303-312
Supan J (2002) Extensive Culture of Crassostrea virginica in the Gulf of Mexico Region.
Southern Regional Aquaculture Center Publication 4300

92
United States Geological Survey (2018) National Water Information System. https://waterdata.usgs.gov/usa/nwis/uv?07380251 (accessed 13 Sept 2018)
Wadsworth P (2017) Comparing Triploid and Diploid Growth and Mortality in Farmed Oysters,
Crassostrea virginica, in the Northern Gulf of Mexico. MSc dissertation, Auburn University, Auburn, AL
Wadsworth P, Casas S, La Peyre J, Walton W (2019). Elevated mortalities of triploid eastern
oysters cultured off-bottom in northern Gulf of Mexico. Aquaculture 505 Wallace R K (2001) Cultivating the Eastern Oyster, Crassostrea virginica. Southern Regional
Aquaculture Center Publication 432. Wallace R K, Waters P, Rikard F S (2008) Oyster Hatchery Techniques. SRAC Publication No.
4302 Walton W (2015) State of the Alabama Oyster Farming Industry.
http://www.auburn.edu/~wcw0003/resources/oyster-farmers/state-of-the-alabama-oyster.html. (accessed 19 Oct 2017)
Walton W (2016) in Prep Testing causes of triploid oyster summer mortality. Identify production
and technical challenges hindering full implementation of oyster farming. Walton W C, Davis J E, Chaplin G I, Rikard F S, Hanson T R, Waters P J, Swann D L (2012)
Off-Bottom Culture of Oyster Farming. Alabama Cooperative Extension System Fisheries & Aquaculture Series
Walton W C, Davis J E, Supan J E (2013) Off-Bottom Culture of Oysters in the Gulf of Mexico.
SRAC Publication No. 4308 Walton W C, Rikard F S, Chaplin G I, Davis J E, Arias C R, Supan J E (2013) Effects of
ploidy and gear on the performance of cultured oysters, Crassostrea virginica: Survival, growth, shape, condition index and Vibrio abundances. Aquaculture 415:260–266
Widdows J, Newell R I E, Mann R (1989) Effects of Hypoxia and Anoxia on Survival, Energy
Metabolism, and Feeding of Oyster Larvae (Crassostrea virginica, Gmelin). Bio Bull 177: 154-166

93
APPENDIX A
CUMULATIVE MORTALITY
Results from analyzing percent cumulative mortality were mostly consistent with results
from percent interval mortality with two exceptions. At Grand Isle, there was no longer an effect
of tumbling on mortality (Table A2). Oysters who experienced tumbling had 0.92% (±0.60; 95%
C.I.) higher mortality than oysters who experienced no tumbling, across both ploidies and all
desiccation levels (Tukey’s post-hoc p = 0.42); this difference was not significant (Fig A1). In
addition, ploidy had an effect on percent cumulative mortality at Grand Bay (Table A2).
Triploids oysters at Grand Bay had 0.65% (±0.57; 95% C.I.) higher percent cumulative mortality
than diploids oysters, across all tumbling and desiccation levels (Tukey’s post-hoc p = 0.03) (Fig
A2).

94
Table A1. Four-way analysis of variance for percent cumulative mortality (May to August) across the three sites
(Grand Isle, Deer Island and Grand Bay), the two ploidies (triploid and diploid), two tumbling levels (No and Yes),
and the four desiccation levels (0, 18, 24, and 48 hrs).
Cumulative Mortality (May. - Sept.) df F-value P-value Site 2 8.88 <0.001 Ploidy 1 21.91 <0.001 Desiccation 3 44.77 <0.001 Tumbled 1 20.51 <0.001 Site: Ploidy 2 4.35 0.02 Site: Desiccation 6 7.35 <0.001 Ploidy: Desiccation 3 0.63 0.60 Site: Tumbled 2 2.30 0.11 Ploidy: Tumbled 1 0.35 0.56 Desiccation: Tumbled 2 0.09 0.92 Site: Ploidy: Desiccation 6 1.53 0.18 Site: Ploidy: Tumbled 2 0.68 0.51 Site: Desiccation: Tumbled 4 5.90 <0.001 Ploidy: Desiccation: Tumbled 2 0.00 0.10 Site: Ploidy: Desiccation: Tumbled 4 0.92 0.46 Error 84 --- ---

95
Table A2. Three-way analysis of variance for percent cumulative mortality (May to September) for each of the three
sites (Grand Isle, Deer Island and Grand Bay) individually, across the two ploidies (triploid and diploid), two
tumbling levels (No and Yes), and the four desiccation levels (0, 18, 24, and 48 hrs). Significant p-values are bolded.
*Deer Island had 24 degrees of freedom.
Cumulative Mortality (May. - Sept.)
GI DI GBOP
df F-value P-value
F-value
P-value
F-value
P-value Ploidy 1 21.55 <0.001 0.85 0.37 5.09 0.03 Desiccation 3 6.89 <0.01 11.06 <0.001 39.57 <0.001 Tumbled 1 0.66 0.42 15.22 <0.001 11.51 <0.01 Ploidy:Desiccation 3 0.16 0.93 2.60 0.07 1.36 0.28 Ploidy:Tumbled 1 0.04 0.85 1.92 0.18 0.16 0.70 Desiccation:Tumbled 2 1.89 0.17 9.98 <0.001 1.82 0.18 Ploidy:Desiccation: Tumbled
2 0.30 0.74
1.31 0.29
0.44 0.65
Residuals 28* --- --- --- --- --- ---
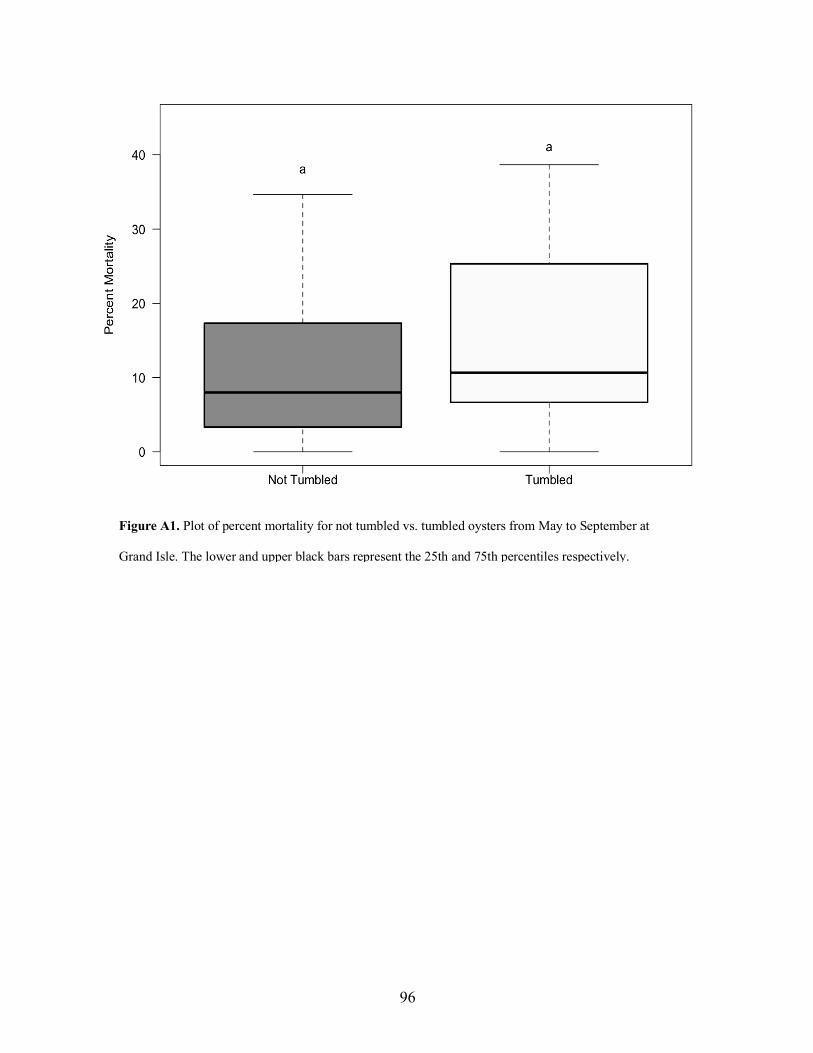
96
Figure A1. Plot of percent mortality for not tumbled vs. tumbled oysters from May to September at
Grand Isle. The lower and upper black bars represent the 25th and 75th percentiles respectively.

97
Figure A2. Plot of percent mortality for diploid vs. triploid oysters from May to August at Grand Bay.
The lower and upper black bars represent the 25th and 75th percentiles respectively.