comparing spatial patterns of informal … orina sirueri-s1273655_final.pdf · this document...
TRANSCRIPT

COMPARING SPATIAL PATTERNS
OF INFORMAL SETTLEMENTS
BETWEEN NAIROBI AND DAR ES
SALAAM
FELIX ORINA SIRUERI
February, 2015
SUPERVISORS:
Dr. Richard Sliuzas (1st Supervisor)
Ms. Monika Kuffer, MSc (2nd Supervisor)
Dr. H. Taubenböck (External Supervisor, German Aerospace Centre)
Thesis submitted to the Faculty of Geo-Information Science and Earth
Observation of the University of Twente in partial fulfilment of the
requirements for the degree of Master of Science in Geo-information Science
and Earth Observation.
Specialization: Urban Planning and Management
SUPERVISORS:
Dr. R. Sliuzas (1st Supervisor)
Ms. M. Kuffer, Msc (2nd Supervisor)
Dr. H. Taubenböck (External Supervisor, German Aerospace Centre)
THESIS ASSESSMENT BOARD:
Prof. Dr. Ir. M.F.A.M van Maarseveen (Chair)
Msc. M. Klotz (External Examiner, German Aerospace Centre)
Dr. R. Sliuzas (1st Supervisor)
MSc. Ms. M. Kuffer (2nd Supervisor)
COMPARING SPATIAL PATTERNS
OF INFORMAL SETTLEMENTS
BETWEEN NAIROBI AND DAR ES
SALAAM
FELIX ORINA SIRUERI
Enschede, The Netherlands, February, 2015

DISCLAIMER
This document describes work undertaken as part of a programme of study at the Faculty of Geo-Information Science and
Earth Observation of the University of Twente. All views and opinions expressed therein remain the sole responsibility of the
author, and do not necessarily represent those of the Faculty.

i
ABSTRACT
Currently, in many cities in the developing world, spatial data on informal settlements are generalized,
outdated, or even non-existent. Moreover, there is a lack of comprehensive information about spatial
factors that influence the location of informal settlements a cross different cities. These settlements
continue to develop posing many urban challenges. This research employs locational and morphological
parameters to measure and quantify the patterns of informal settlements using two example cities that is,
Nairobi and Dar es Salaam. Remote sensing, GIS and spatial metrics are used to examine and explore the
differences and commonalities of these settlements at three levels: landscape, settlement and object level.
The patterns of the informal settlements were analysed at landscape, settlement and object levels. At
landscape level, the roads, rivers, industries and market centres were used as input data to calculate
accessibility of the settlements. In addition, the analysis of land use in the surrounding areas of such
settlements was also carried out as well as the terrain analysis. At settlement level, the morphological
aspects of the informal settlements were analysed using spatial metrics with the main focus on the size,
shape, density and pattern of the informal settlements. At object level, the building characteristics were
analysed: the size, shape, pattern and inter-building distances. Furthermore, four aspects of road network
were analysed i.e. the density, circuitry, complexity and connectivity. This was done using graph theory.
The results obtained demonstrate that the locational and morphological patterns in Nairobi INSEs are
different from those in Dar es Salaam INSEs. The road accessibility in the settlements in Nairobi is higher
than in Dar es Salaam. The dominant land use in the environs of informal settlement is residential land
use. The morphological results indicate that Nairobi settlements cover smaller area and are more
fragmented compared to those in Dar es Salaam. The building characteristics also differ as the mean
building size in Nairobi is higher compared to Dar es Salaam. The distance between buildings is shorter in
Nairobi compared to the buildings in Dar es Salaam settlements. In addition, the building shapes are
rectangular in both cities with mean shape index of 1.25. The road connectivity results shows that Dar es
Salaam settlements are more connected than those in Nairobi. In conclusion, there is a direct substantial
relationship between road connectivity and road density in informal settlement areas in both cities.
Key Words: Informal settlements; spatial metrics; Nairobi; Dar es Salaam.

ii
ACKNOWLEDGEMENTS
I take this opportunity to thank all those people who assisted me during my studies and research phase.
Firstly, I thank God for his protection, guidance and good health during my entire study period. I am
greatly indebted to The Netherlands Fellowship Program (Nuffic) for awarding me the scholarship and
funding for my studies. Without their support my studies would have been unsuccessful.
I would also like to thank Prof. Alphonse Kyessi and Mr. Alpha Mangula of Ardhi University in Dar es
Salaam for enabling me to acquire the data and a work permit during my fieldwork. The knowledge and
insights I got from Prof. Kyessi especially in understanding the growth of informal settlements in Dar es
Salaam is invaluable.
I owe special thanks to Mr. Patrick Kiamati from Orbital Geoinformation Ltd for assisting me with
buildings data for Nairobi informal settlements. As well, his effort in helping me carry out the field work
in Nairobi is indispensable. In addition, I acknowledge the assistance I got from Mr. Alloys Andama of
Nairobi city county in enabling me acquire relevant data for my research.
My sincere gratitude goes to my thesis advisors Dr. Richard Sliuzas, Ms. Monika Kuffer and Dr. H.
Taubenböck for their guidance, support, motivation and constructive criticism during the research period.
They enabled me execute and complete my research work within stipulated time while at the same time
ensuring that it is of high quality. I also acknowledge my thesis committee chair Prof. Dr. Ir. M.F.A.M van
Maarseveen for insightful advice and comments during different stages of my thesis.
I acknowledge my fellow UPM students for keeping the spirit of unity and togetherness while at the same
time sharing ideas, knowledge and offering assistance during the entire study period. Lastly, I am indebted
to my family members for their moral support, encouragement and prayers during the entire study period
here in The Netherlands.

iii
TABLE OF CONTENTS
TABLE OF CONTENTS .......................................................................................................................................... iii
LIST OF FIGURES .................................................................................................................................................... iv
LIST OF TABLES ....................................................................................................................................................... vi
1. INTRODUCTION .............................................................................................................................................. 1
1.1. Background and Justification ....................................................................................................................................1 1.2. Research Problem ........................................................................................................................................................2 1.3. Research Objectives and Questions .........................................................................................................................3 1.4. The Conceptual Framework ......................................................................................................................................3 1.5. Significance of the Study ............................................................................................................................................5 1.6. Thesis outline ...............................................................................................................................................................5
2. A REVIEW OF INFORMAL SETTLEMENTS .......................................................................................... 7
2.1. Introduction .................................................................................................................................................................7 2.2. The Informal Settlements Concepts ........................................................................................................................7 2.3. The Stages of INSE Development...........................................................................................................................8 2.4. An overview of INSEs in Africa ..............................................................................................................................9 2.5. Remote Sensing and Patterns of INSEs............................................................................................................... 13 2.6. Spatial Levels of Analysis ........................................................................................................................................ 14 2.7. Analysis of INSEs Patterns using Spatial Metrics .............................................................................................. 15 2.8. The INSE Locational and Morphological Indicators ........................................................................................ 17
3. DATA AND METHODOLOGY ................................................................................................................. 19
3.1. Overview of Methodology ...................................................................................................................................... 19 3.2. Location of the Study Areas ................................................................................................................................... 20 3.3. Data Collection Approach ...................................................................................................................................... 21 3.4. Data Pre-processing Approach .............................................................................................................................. 26 3.5. Methods, Tools and Software Requirements ...................................................................................................... 26 3.6. Landscape Analysis .................................................................................................................................................. 27 3.7. Settlement and Object Level Analysis .................................................................................................................. 33
4. RESULTS AND DISCUSSION .................................................................................................................... 37
4.1. Introduction .............................................................................................................................................................. 37 4.2. Accessibility and Proximity of INSEs .................................................................................................................. 38 4.3. The Scale Factor and Standardisation ................................................................................................................... 39 4.4. Accessibility Comparison Statistics ....................................................................................................................... 40 4.5. Proximity Comparison Statistics ............................................................................................................................ 42 4.6. The DEM and Slope Values ................................................................................................................................... 43 4.7. Neighbourhood Characteristics ............................................................................................................................. 44 4.8. Settlement Level Metrics ......................................................................................................................................... 45 4.9. Object Level Metrics ................................................................................................................................................ 47 4.10. Road Network Connectivity ................................................................................................................................... 53 4.11. The INSE Comparison Matrix .............................................................................................................................. 54 4.12. Policy Implications of the Results ......................................................................................................................... 57 4.13. Summary and General Discussion ........................................................................................................................ 58
5. CONCLUSION AND RECOMMENDATION ....................................................................................... 59
5.1. Introduction .............................................................................................................................................................. 59 5.2. Summary of Findings and Conclusion ................................................................................................................. 59 5.3. Limitations of the Study and Future Research Directions ................................................................................ 61
LIST OF REFERENCES......................................................................................................................................... 63
APPENDICES ........................................................................................................................................................... 67

iv
LIST OF FIGURES
Figure 1: A Conceptual framework of informal settlement patterns .................................................................... 4
Figure 2: Concepts of INSE expansion, densification and intensification - Adapted from Abebe (2011) .... 8
Figure 3: Proportion of urban population living in INSEs in African countries (UN-HABITAT, 2010) ..... 9
Figure 4: Location of INSEs in Nairobi city (Source: Own construct) .............................................................. 10
Figure 5: A photograph showing INSEs in Kibera, Nairobi (Wikipedia, 2014b) ............................................. 11
Figure 6: Location of INSEs in Dar es Salaam city (Source: Own construct) .................................................. 12
Figure 7: A photograph showing INSEs in Kinondoni, Dar es Salaam (UN-HABITAT, 2014b)................ 13
Figure 8: Hierarchical structure of spatial analysis levels of INSE - Adapted from Kohli et al. (2012)........ 14
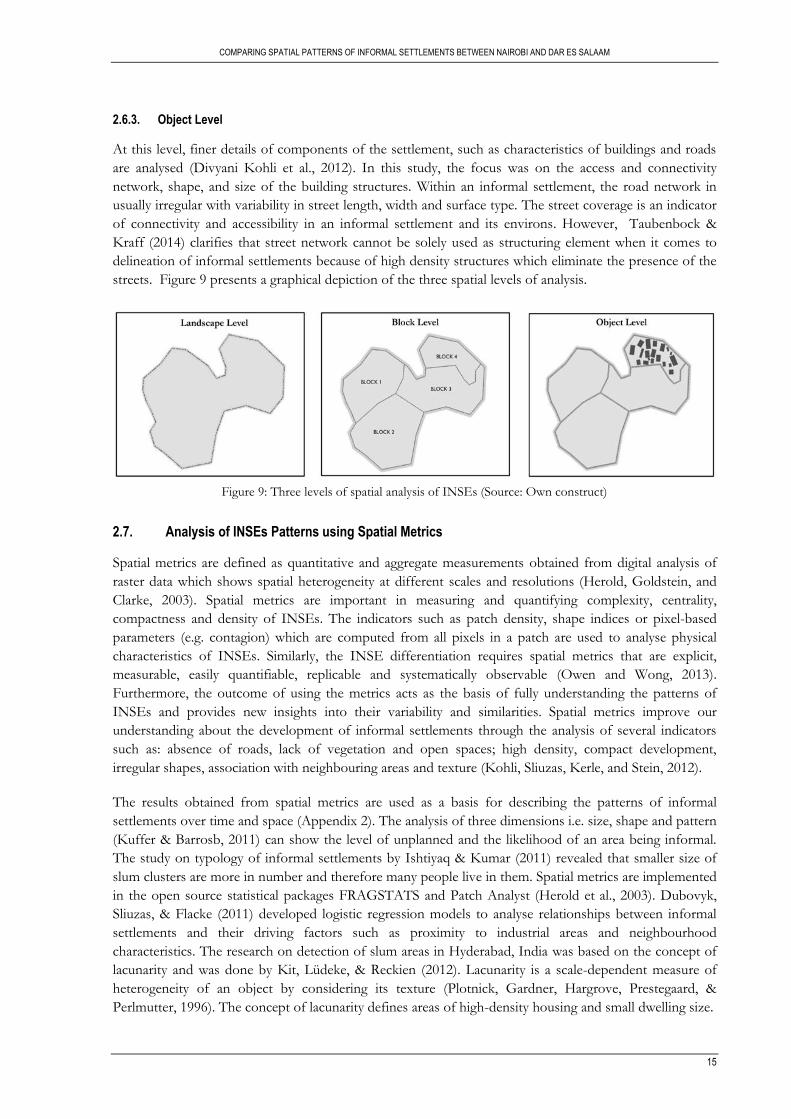
Figure 9: Three levels of spatial analysis of INSEs (Source: Own construct) ................................................... 15
Figure 10: Spatial metrics for quantifying the structure of INSEs (Huang, Lu, & Sellers, 2007) .................. 16
Figure 11: A general methodological framework ................................................................................................... 19
Figure 12: The location of the study areas, Source of base image: (Esri, 2015a) .............................................. 20
Figure 13: Location of the sample sites in the city of Nairobi ............................................................................. 22
Figure 14: The DEMs of (a) Nairobi and (b) Dar es Salaam ............................................................................... 23
Figure 15: Land use classification in the cities of Nairobi and Dar es Salaam .................................................. 24
Figure 16: A comparison of proportion of percentages of land use classification ........................................... 25
Figure 17: Proximity and accessibility measurement approach ........................................................................... 27
Figure 18: Accessibility analysis layer for network computations ....................................................................... 28
Figure 19: A road network dataset with walk support covering an INSE ......................................................... 29
Figure 20: Analysis of proximity of INSE to the rivers ........................................................................................ 30
Figure 21: Neighbourhood measurement approach .............................................................................................. 30
Figure 22: Terrain analysis approach of INSE sites .............................................................................................. 31
Figure 23: Generation of slope values from a DEM, Source: (Esri, 2015b) ..................................................... 31
Figure 24: An interpretation of INSE slope values ............................................................................................... 32
Figure 25: An illustration of random points on INSE site overlaid on the slope layer ................................... 32
Figure 26: The methodology used in settlement and object level analysis ......................................................... 33
Figure 27: An illustration of road links and nodes using graph theory .............................................................. 34
Figure 28: Mathare sample site in Nairobi showing clusters of buildings .......................................................... 35
Figure 29: The INSEs in (a) Nairobi and (b) Dar es Salaam, Source: (Google Earth, 2015) ......................... 37
Figure 30: Road accessibility comparison in Dar es Salaam and Nairobi .......................................................... 38
Figure 31: Comparison of accessibility to industries in Dar es Salaam and Nairobi ........................................ 38
Figure 32: Market centre accessibility comparison in Dar es Salaam and Nairobi ........................................... 39
Figure 33: Proximity to rivers comparison in Dar es Salaam and Nairobi ........................................................ 39
Figure 34: Graphs showing accessibility to roads in (a) Nairobi and (b) Dar es Salaam ................................. 40
Figure 35: A graph showing comparison of accessibility to roads ...................................................................... 40
Figure 36: Graphs showing accessibility to industries in (a) Nairobi and (b) Dar es Salaam .......................... 40
Figure 37: A graph showing comparison of accessibility to industries ............................................................... 41
Figure 38: Graphs showing accessibility to market centres in (a) Nairobi and (b) Dar es Salaam ................. 41
Figure 39: A graphs showing a comparison of accessibility to market centres ................................................. 41
Figure 40: Graphs showing proximity to rivers in (a) Nairobi and (b) Dar es Salaam .................................... 42
Figure 41: A graph showing a comparison of proximity to rivers ...................................................................... 42
Figure 42: The INSE DEM values in Nairobi (a) and Dar es Salaam (b) .......................................................... 43
Figure 43: The INSE slope values in Nairobi (a) and Dar es Salaam (b) ........................................................... 43
Figure 44: Proportions of land use in INSE environs .......................................................................................... 44

v
Figure 45: The Mean Shape Index of INSEs in Nairobi and Dar es Salaam cities ......................................... 45
Figure 46: Diagrams showing a comparison of mean areas of the buildings ................................................... 48
Figure 47: A comparison of (a) building patch densities (b) buildings per area (hectare) .............................. 49
Figure 48: An illustration of MSI values for different shapes ............................................................................. 49
Figure 49: A radar chart showing a comparison of (a) MSI and (b) SD ............................................................ 50
Figure 50: A radar chart showing a comparison of (a) SDI and (b) SEI of the buildings .............................. 51
Figure 51: A radar chart showing a comparison of (a) OMD and (b) NNR .................................................... 52
Figure 52: A normal distribution curve showing nearest neighbour statistics .................................................. 52
Figure 53: Road connectivity network in Nairobi's Mathare INSE ................................................................... 53
Figure 54: Comparative results at (a) landscape, (b) settlement and (c) object levels...................................... 56
Figure 55: Mukuru informal settlements in Nairobi, Source: (Google Earth, 2015) ....................................... 58

vi
LIST OF TABLES
Table 1: The INSE factors and indicators............................................................................................................... 17
Table 2: The MSI values of the two cities ............................................................................................................... 46
Table 3: The statistics for the buildings in the 5 sites ............................................................................................ 48
Table 4: The Patch density of buildings in 5 sites .................................................................................................. 48
Table 5: The MSI of the buildings in 5 sites ........................................................................................................... 50
Table 6: The SDI and SEI values of sample sites .................................................................................................. 50
Table 7: The ANN statistics of the sample sites .................................................................................................... 51
Table 8: Alpha, beta and gamma indices ................................................................................................................. 53
Table 9: The INSE Comparison Matrix .................................................................................................................. 55

vii
LIST OF ACRONYMS AND ABBREVIATIONS
AI Aggregation Index
ANN Average Nearest Neighbour
ASL Above Sea Level
BND Boundary
CBD Central Business District
CI Contagion Index
CNFER Centre for Northern Forest Ecosystem Research
DBF Database Format
GDB Geodatabase
DEM Digital Elevation Model
ED Euclidean Distance
EOD Earth Observation
ESRI Environmental System Research Institute
GIS Geographical Information System
GPS Global Positioning System
HI Heterogeneity Index
INSE Informal Settlement
KML Keyhole Markup Language
KNBS Kenya National Bureau of Statistics
MA Mean Area
MoL Ministry of Lands
MS Microsoft
MSI Mean Shape Index
PD Patch Density
RS Remote Sensing
SD Standard Deviation
SDI Shannon's Diversity Index
SEI Shannon's Evenness Index
SHP Shapefile
SM Spatial Metrics
SPSS Statistical Package for Social Sciences
TNBS Tanzania National Bureau of Statistics
UPM Urban Planning and Management
VHR Very High Resolution WGS World Geodetic System

viii
COMPARING SPATIAL PATTERNS OF INFORMAL SETTLEMENTS BETWEEN NAIROBI AND DAR ES SALAAM
1
1. INTRODUCTION
Urbanisation ('push' and 'pull' mechanism) 1 and an ever increasing number of informal settlements
(INSEs) are among today's most serious challenges to sustainable urban development. While, in the past,
urban areas have been - and still are - places of opportunities, today, they are described as hotspots of
crime and numerous challenges (Wamsler & Brink, 2014). The urban environment is highly complex in
terms of growth and development (Bolay, 2006). In the developing world, there is a high rate of migration
to urban areas which has further worsened the situation. The people who relocate from rural to urban
areas in search for better economic opportunities such as employment often choose to settle in informal
areas (Tsenkova, 2010) because of high cost of living in the cities. These people are often faced with
extreme poverty and social exclusion (UN-HABITAT, 2003).
1.1. Background and Justification
Most countries in sub-Saharan Africa face myriad of problems such as high urbanisation and weak
institutional structures (Kombe, 2005). Apparently, urban planning concepts and regulations that were
inherited from the colonial administrators have proven to be obsolete and inappropriate to cope with the
ever increasing urban growth challenges. In most urban areas in the developed countries, the allocation of
land for different uses is relatively visible, although mixed land uses remain widespread. In contrast, in
many cities of the developing world, the separation of land uses and degrees of prosperity are so common
that the more wealthy people reside in well-serviced neighbourhoods, gated communities and well-built
formal settlements, whereas the poor are confined to inner-city, vulnerable areas or peri-urban informal
settlements characterised by overcrowding, dilapidated structures and inadequate access to basic services
such as clean water and healthcare facilities (UN-HABITAT, 2010b).
Addressing the challenges of informal settlements require comprehensive information on these highly
dynamic areas as a basis for coordinated actions at local, national, regional and international level. Since
informal settlements are directly affiliated to poverty, consistent information on their nature and extent is
useful for planning, implementing and monitoring urban poverty alleviation programmes. The systematic
quantification of INSEs requires methods to identify and define them spatially and consistently in support
of the intervention programmes such as slum improvement projects (Kohli, Sliuzas, Kerle, and Stein,
2012). In this context, the study is anchored on the fact that most of the research has focused on a single
city and there are few studies that compare INSEs patterns in the realm of spatial and structural
characteristics in the cities from different countries.
Traditionally, formal and informal settlements were distinguished based on administrative definitions or
socio-economic indicators (Divyani Kohli et al., 2012) such as 'the number of people who live on a dollar
a day' (Gulyani, Bassett, and Talukdar, 2014). These approaches of using spatial-social data have proved to
be inaccurate and inconsistent because they lack a uniform global availability (Herold, Goldstein, and
Clarke, 2003). Again, they tend to generalize poverty based on indicators within the administrative units.
Consequently, contradictions in the definition of informal settlements in different countries make data
exchange and monitoring of effective intervention strategies strenuous to achieve (Divyani Kohli et al.,
2012).
1 Migrants are “attracted” to the cities, for instance, by the greater availability of jobs opportunities and the higher wage prospects. At the same time, rural places are “repulsive”, since they are normally considered as areas of poverty.

COMPARING SPATIAL PATTERNS OF INFORMAL SETTLEMENTS BETWEEN NAIROBI AND DAR ES SALAAM
2
In the recent past, there has been relatively little systematic research about physical and location
characteristics of INSEs. Owen and Wong (2013) developed indicators to measure informal settlements
(Appendix 2). Recent research has used high-resolution satellite data to map and analyse INSEs
(Taubenbock & Kraff, 2014). Kohli et al. (2012) have developed the ontology of slums for image based
classification that uses a framework at three spatial levels: object level, settlement level and environment
level (Figures 8 and 9). Sliuzas and Kuffer (2008) based their identification of slum areas on very high-
resolution (VHR) optical satellite data. They correlate visually detected slums with textural measures and
interpretation based on the set of spatial variables.
Additionally, Taubenböck, Wegmann, Roth, Mehl, and Dech (2009) have applied a bottom-up generic
classification approach for urban structure-type derivation (including informal settlements) using
morphological parameters e.g. building size, shape, height, and density (Taubenbock & Kraff, 2014).
Furthermore, Owen and Wong (2013) have utilised spectral, texture, geomorphology and road accessibility
metrics to differentiate informal settlements in Guatemala. All these studies show that little research has
been conducted that focus on analysis and comparison of spatial patterns (locational and morphological)
of INSEs between cities from different countries.
1.2. Research Problem
Currently, in many cities, spatial data on informal settlements are generalized, outdated, or even non-
existent (Taubenbock and Kraff, 2014). In addition, the conventional data sources such as maps are
obsolete, inaccessible and inaccurate. Furthermore, there is lack of comprehensive information about the
spatial factors that influence the location of an informal settlement in many cities across the developing
world. The absence of development monitoring mechanisms has led to the continuous growth of such
settlements hence posing many urban challenges. Again, contrary to the premise that the previous
researches as described in previous section focused on developing context-specific methods, GIS and
remote sensing applications are being utilised to study and analyse the growth patterns of informal
settlements; including spatio-temporal modelling (e.g. Dubovyk, Sliuzas and Flacke, 2011). Surprisingly,
there has been little or no attempt made to compare and explain the patterns, size, shape and density of
these settlements within cities from the point of view of different spatial factors that influence their
location (Dubovyk et al., 2011). Many studies on INSE have focused on a single city and none has focused
on comparison of spatial patterns between cities (e.g. Taubenbock & Kraff, 2014). Some of the studies on
INSEs have been anchored on analysis of socio-economic data and indicators. Consequently, the
availability of information on location and structural attributes of INSEs in most urban areas is limited.
This research employs locational and physical parameters to analyse the spatial and morphological
characteristics of informal settlements using two example cities that is, Nairobi and Dar es Salaam. These
two cities were chosen because of the availability of data on INSEs. The research employs the use of GIS
and spatial metrics in examining and exploring the differences and commonalities of INSEs; thus creating
an explicit understanding about their patterns and characteristics in the context of their location. The
results provide new insights into structural and locational aspects across different INSEs in view of
creating an understanding of their growth pattern and proliferation. This study provides additional and
valuable information to urban planners, managers and policy makers at both local and national level since
presently there is insufficient knowledge on how similar or dissimilar informal areas are from one city to
another. The information such as the size, shape, pattern and density of INSEs is of paramount
importance as it provides mechanisms2 during implementation of programmes such as poverty alleviation,
informal settlement improvement programmes; curbing their further development and expansion.
2 Some of these mechanisms include establishing the location of open space within the settlement for upgrading programs and social service provision. This is currently taking place in most INSEs in Nairobi city such as Kibera, Mathare and Korogocho.

COMPARING SPATIAL PATTERNS OF INFORMAL SETTLEMENTS BETWEEN NAIROBI AND DAR ES SALAAM
3
1.3. Research Objectives and Questions
1.3.1. The Main Objective
The main objective of this research is to compare the spatial and morphological characteristics of informal
settlements in Nairobi and Dar es Salaam using quantitative parameters and methods.
1.3.2. Specific Objectives and Questions
1. To analyse the locational characteristics of informal settlements using spatial parameters.
What spatial parameters can be used to measure the location of INSEs?
What are the typical spatial characteristics of the location of INSEs?
What is the dominant land use in the neighbourhoods surrounding the INSEs?
2. To analyse the morphological characteristics of informal settlements using spatial metrics.
Which spatial metrics are relevant in understanding the morphology of INSE?
Are the structures of INSEs homogenous or heterogeneous?
What are the patterns, sizes and shapes of the INSEs?
Is the form of the informal settlements compact or fragmented?
How does the road connectivity in INSEs compare between Nairobi and Dar es Salaam?
3. To develop a comparison matrix showing locational and morphological characteristics between the
INSEs in Nairobi and Dar es Salaam.
What are the similarities and differences of INSEs at landscape, settlement and object level in the two
cities?
How is the comparison matrix used to present the similarities and differences at landscape, settlement
and object levels?
How can the comparison matrix be used to advice on the policy implications of informal settlements
in each city at local and national levels?
1.4. The Conceptual Framework
This section describes the scientific pillars on which the research is anchored to and the approach adopted
to achieve aforementioned objectives. It highlights characteristics which are analysed using spatial and
morphological parameters by combining GIS, RS and spatial metrics with an aim of creating an
understanding on the patterns and location of INSEs (Figure 1). The GIS provides vital spatial analysis
tools such as proximity, near distance measures, network and overlay analysis. It is also able to handle
different vector and raster data formats. Through remote sensing, satellite images together with spatial
metrics play a role in understanding the structure (size, shape, distribution, density and pattern) of the
informal settlements. The metrics show whether the structure of an informal settlement is regular or
irregular, elongated or circular, dense or dispersed. The road connectivity and accessibility measures are
also be analysed at object level (Figure 8). All these indicators differ from one settlement to another.
Before embarking on analysis of informal settlements, their location characteristics have to be understood.
As indicated in figure 1, a combination of GIS, remote sensing and spatial metrics plays a key role in
demystifying the structural and location aspects of informal settlements at landscape, settlement and
object levels. At different analysis levels, the characteristics of informal settlements that are obtained vary.
At landscape level, INSE associations are analysed using GIS operations (proximity, neighbourhood and
terrain analysis). For instance, the location of city centre and availability of undeveloped land may act as a
pull factor hence contributing to the development of informal settlements. The finer details of

COMPARING SPATIAL PATTERNS OF INFORMAL SETTLEMENTS BETWEEN NAIROBI AND DAR ES SALAAM
4
morphological patterns such as density, size, shape and pattern are obtained at settlement and object
levels. The combination of both location and morphology indicators are paramount in developing the
INSE comparison matrix which aid in understanding similarities and differences among INSEs patterns.
Figure 1: A Conceptual framework of informal settlement patterns
The analysis of INSE patterns are done at three levels namely landscape, settlement and object level.
Using spatial metrics, the size, shape, density and patterns are analysed at settlement and object levels. The
goal is to derive a clear understanding of the spatial patterns in terms of morphology and location aspects.
For instance, the morphology characteristics assist in understanding the fragmentation, compactness or
the density of an INSE. In some cities, the settlements patches grow close to each other while in others
they exhibit fragmentation3. The spontaneous development results in haphazard growth of INSE which
are classified in relation to their location and morphology. Whereas some settlements grow close to the
city centres due to proximity to job opportunities, others grow in urban periphery (Barros & Sobreira,
2002). The main factor is often the availability of vacant or undeveloped land, regardless its location.
Spatial metrics play a major role in analysing these dynamics of INSE morphology and location. For
instance, the number of patches or patch densities shows the coverage of the settlements at a given
landscape. Again, the percentage of roof coverage is also an important indicator of how porous the
informal settlement is. In addition, the locational and physical characteristics of INSEs may differ from
one city to another because of different land use policies such as zoning regulations. Thus, the comparison
is important in understanding the contributing factors on INSE development and their impact on national
urban policies between the two cities. 3 The INSE patches often have different morphological patterns, shapes and sizes in space and are disconnected from each other.
Aspects of Informal Settlements
Morphology Location
Dimensions - Compactness
- Size and shape - Patch Density
- Centrality - Porosity
- Heterogeneity Index
Association - Neighbourhood
(Industries etc) - Site-specific (slope, rivers) - Proximity
(e.g. to CBD, roads)
Patterns of
Informal
Settlements
Levels of Spatial Analysis
Landscape Level
Settlement Level
Object Level
Informal Settlements
- Lack of secure ownership
- Lack of basic services
- Lack of open space
-Dilapidated structures
-Located in hazardous areas
- Located close to rivers
Characteristics of INSEs
Comparison
Matrix of INSEs
Patterns
GIS, RS & Spatial Metrics
Patterns in Dar
es Salaam city
Patterns in
Nairobi city

COMPARING SPATIAL PATTERNS OF INFORMAL SETTLEMENTS BETWEEN NAIROBI AND DAR ES SALAAM
5
1.5. Significance of the Study
The informal settlements are highly dynamic and complex areas in terms of formation and growth. To
achieve a comprehensive and thorough understanding of informal settlements development, the
information about their spatial pattern i.e. the location and morphology attributes is a prerequisite. This
information is crucial for the urban planners and policy makers in understanding the structure of INSEs,
their characteristics in terms of formation and development over time, thus enabling them to make
informed mitigation and holistic proactive measures which in turn will prevent further proliferation.
Further, the development of an explicit spatial framework of informal settlements creates a better
understanding and hence an opportunity to develop more effective and efficient management strategies as
well as ensuring that proper interventions such as slum upgrading programs and provision of social
services are carried out systematically. Consequently, in most cases, slum improvement aims at ensuring
appropriate, sustainable and affordable housing. It contributes to not only reducing social inequalities but
also improving urban safety through its social, economic, environmental and spatial impacts (UN-
HABITAT, 2014a). Furthermore, the research provides the basis of advice on policy implications at
different levels of governance in informal housing sector at local and national levels.
1.6. Thesis outline
This section summarizes the flow of research from introduction to the conclusion and recommendations.
The structure of the research is therefore divided into the following sub-sections.
Chapter One: Introduction
This chapter provides introduction and general background information about informal settlements, their
formation, locational and physical characteristics. In general, the societal problem on which the study is
anchored on is discussed here. Also, in this chapter, the research problem, the main objective and sub-
objectives; research questions; anticipated results are presented. The concepts used in this study are
outlined in the conceptual framework section. Lastly, the significance of the study as well as the thesis
outline is discusses in detail.
Chapter Two: Literature Review
Chapter two discusses empirical and theoretical information about informal settlements including their
review, the characteristics, types and development stages. Also in this section, there is a general discussion
on INSEs in Africa is presented with particular reference to Nairobi and Dar es Salaam cities. The chapter
reviews some of the concepts such as remote sensing, spatial metrics including their significance in INSE
analysis. The three spatial levels of INSE analysis (landscape, settlement and object) are also presented.
Further, the previous work that has been done in INSEs identification and mapping domains including
the methods and approaches in addressing problems akin to this one is described. Lastly, the INSEs
locational and morphological indicators are presented in this chapter.
Chapter Three: Data and Methodology
This chapter presents the overview of the study area as well as the approaches and processes used in
executing this research. The locations of the study areas i.e. Nairobi and Dar es Salaam have been
outlined. Additionally, the data collection methods and sources i.e. primary and secondary are well
documented in this section. This includes data collection approaches and sources; types of data and their
characteristics in relation to study areas; a list of comparable data; software used; tools used measuring and
COMPARING SPATIAL PATTERNS OF INFORMAL SETTLEMENTS BETWEEN NAIROBI AND DAR ES SALAAM
6
quantifying INSEs patterns. The methods of measuring and quantifying the patterns of INSEs are
described including their relevance and the extent to which they can be applied. The process of selecting
the spatial metrics has been outlined in this chapter. Lastly, the road connectivity indices (alpha, gamma,
beta) using graph theory have been described in detail.
Chapter Four: Results and Discussion
This chapter puts forward the output obtained in analysis of spatial and morphological characteristics of
INSEs. The similarities and differences between the cities in question are also given in form of maps,
statistical tables, graphs and charts. Also, the INSE comparison matrix in a tabular format is presented at
this stage. The chapter focuses on the reflection on results obtained in the study with an aim of
establishing the implication on policies and whether they are realistic insofar as spatial patterns of INSE
are concerned. The apparent occurrences of certain INSE patterns in some areas such as close to rivers,
roads etc are also reviewed and discussed explicitly. Again, the environmental implications of INSEs
location especially on hazard zones and along flood prone areas are outlined; and ostensibly their impacts
to a large extent. Additionally, a reflection on road connectivity index values in analysing the road
connectivity in the two cities are discussed in detail. The results are resented using maps, graphs,
histograms, spider charts and tables.
Chapter Five - Conclusion and Recommendation
The last chapter provides general conclusions and key findings. It responds to objectives outlined in this
research and gives a summary of the methods and results achieved as well as recommendations on
appropriate further research. It also highlights some of the limitations of carrying out the research along
with possible recommendation on how to overcome them especially during further research. Finally, the
possible further research areas in the realm of informal settlements have been proposed in this chapter.

COMPARING SPATIAL PATTERNS OF INFORMAL SETTLEMENTS BETWEEN NAIROBI AND DAR ES SALAAM
7
2. A REVIEW OF INFORMAL SETTLEMENTS
2.1. Introduction
This chapter discusses the issues of informal settlements in the cities of Nairobi and Dar es Salaam. It
starts by revisiting the INSE concepts and characteristics, followed by the stages of INSE development.
An overview of the status of INSE in Africa is presented with a focus on the countries which are most
affected by these settlements. The main focus is on the settlements in Nairobi and Dar es Salaam since
they have been chosen as example cities in this research. The concepts of remote sensing and spatial
metrics are also dealt with making reference to the previous work which has been done on INSE.
2.2. The Informal Settlements Concepts
There is lack of agreed definition of INSEs and slums. The terms such as 'unplanned', 'illegal', 'squatter',
and 'shanties' 'ghetto' testify imprecise connotations. The informal settlements are defined as unplanned
settlements which are setup illegally either on the public or private land in a haphazard manner without
following norms or planning regulations (Ishtiyaq & Kumar, 2011). On the other hand, UN-HABITAT
(2003) defines slums as urban areas where inhabitants lack one or more of the following: durable housing,
sufficient living space, easy access to safe water and adequate sanitation; and security of tenure. Slums
differ in size, shape, pattern and population size (Taubenbock & Kraff, 2014). Separately, informal
settlements are often reviewed in the context of informality and high density housing, recognising
the fact that they incorporate predominantly informal housing developments (UNECE, 2008). In this
study, the term 'slum' is used interchangeably with terms 'informal settlement' or 'unplanned'. Again,
according to UN-HABITAT (2003), almost all informal settlements share many and similar characteristics.
A map in Appendix 7 gives a global overview of percentages of urban population living in INSEs in
different countries. Most INSEs are characterised by the following attributes (UN-HABITAT, 2003),
(Sliuzas, 2008) and (Kuffer, Barros, & Sliuzas, 2014).
High density, overcrowded and dilapidated building structures with lack of spatial order;
Absent or insufficient public facilities like schools, hospitals, cemeteries or parks;
Lack of accessibility (poor quality of infrastructure such as roads);
Often located in hazardous and vulnerable areas such as flooding zones and steep or unstable slopes;
Often located in areas that are close proximity to employment - low travel costs;
Often low-cost building materials are used to construct houses.
Occasionally, the informal settlements tend to cluster in inner cities and expand towards peri-urban areas.
The centrality of location implies formations close to the city centre or industrial areas. This is beneficial
to residents as they access employment opportunities with ease, but often the substandard housing on
sites exposed to hazards is unfit for urban development (UNECE, 2008). Although some of these
settlements are being upgraded over time, accommodating the haphazard and rapid movement to urban
areas from the past has created a number of challenges. These challenges are often manifested in
inadequate infrastructure, shortages in water and electricity supply, and limited access to basic services
such as security, education and health services. These informal settlement aspects often differ from one
city to another. For instance, some INSEs are supplied with electricity but they lack water, security and
health services. Others may lack electricity and adequate infrastructure but have clean water and security.

COMPARING SPATIAL PATTERNS OF INFORMAL SETTLEMENTS BETWEEN NAIROBI AND DAR ES SALAAM
8
There exist trade-offs in variability of locations and qualities of INSEs across different cities. For instance,
an INSE located in a hazardous area (flood-prone area) that is close to city centre exhibits the trade-off
between accessibility to opportunities such as jobs vis-à-vis the risks. Some of the INSE are located in
dumpsite areas which are close to industrial areas. This also shows a trade-off between health risks and
employment opportunities. These two illustrations occur mainly because INSE residents are often faced
with extreme poverty hence choose to reside in areas where they can access opportunities quickly and
easily regardless of how risky the location where they live are; and often try to minimize their expenses.
However, this situation varies from one city to another depending on the layout of the city and the
distribution of the informal settlements within the city. The political, economic and social factors also play
a major role in influencing the location of the INSEs in a city.
2.3. The Stages of INSE Development
The informal settlement development undergoes various stages during its growth; that is, infancy,
consolidation and saturation. Infancy is the initial stage where vacant lands often along the river banks, road
reserves, and hazardous areas are occupied by slum dwellers. Consolidation is the stage between infancy and
saturation. It is normally characterised by increased outward expansion, subdivision, construction, and
tenancy (Sliuzas, 2008). At saturation stage, expansion stops and empty spaces get filled up with new
structures. This stage is normally characterised by high overcrowding which exacerbate living conditions
of slum dwellers (Sori, 2012).
The figure 2 below shows three distinct and overlapping means of informal settlements growth that is,
expansion, densification and intensification (Abebe, 2011). The INSE expansion can either be inward,
outward or independent from an existing settlement. The key feature of the expansion process is that the
settlement increases in size. The densification entails horizontal infilling of empty or unoccupied spaces
within an existing boundary (increased roof coverage area). The terms such as population density and
residential density are used to describe densification process. To illustrate this process, let's consider this s:
At time (t1), the residential density of a given INSE is (d1) and at time (t2), the residential density is (d2). If
d2>d1 then densification has taken place assuming that there is no change in boundary of an existing
settlement (See figure 2 below). Lastly, intensification refers to vertical increment of built-up structures
and it is often an internal growth along with densification i.e. the increase in floor area ratio.
Figure 2: Concepts of INSE expansion, densification and intensification - Adapted from Abebe (2011)

COMPARING SPATIAL PATTERNS OF INFORMAL SETTLEMENTS BETWEEN NAIROBI AND DAR ES SALAAM
9
2.4. An overview of INSEs in Africa
Rapid urban growth in Sub-Sahara Africa has been strongly associated with high poverty levels and
unprecedented informal settlement growth. Fortunately, a number of countries have, to some extent,
managed to curb the further expansion of INSEs as well as improving their current conditions (UN-
HABITAT, 2010b). Over the past 10 years, the proportion of the urban population living in INSEs in
developing world has been seen to be significantly declining from 39 per cent in the year 2000 to
approximately 32 per cent in 2012 (UN-HABITAT, 2010b). Surprisingly, the absolute number of
population living in informal settlements has been increasing over years! But pressure due to population
growth and urban expansion dynamics has led to further growth and proliferation of these settlements.
According to UN-HABITAT (2010) and as depicted in Figure 3 below, most countries have more than 70
percent of their urban population living in informal settlements (Also refer to Appendix 7). The countries
such as Ghana, Senegal, Uganda, Rwanda and Guinea are the most successful countries in the sub-region
that have reduced the proportions of INSE dwellers by over one-fifth in the last decade (UN-HABITAT,
2010b).
Figure 3: Proportion of urban population living in INSEs in African countries (UN-HABITAT, 2010)
2.4.1. INSEs in the City of Nairobi
According to 2009 census (KNBS, 2011), the population in Kenya was 38.6 million people. The projected
population in the year 2030 is approximated at 65.9 million people. Currently the city of Nairobi has 3.9
million people and is projected to reach 6.4 million by the year 2030 (Omwenga, 2011). The city is facing
critical challenges due to the combination of demographic, economic and political intricacies. As indicated
in figure 3 above, about 40 to 60% of the population in Kenya lives in informal settlements. In particular,
the city of Nairobi has approximately 60% of its 4 million people (2.4 million people) living in informal
settlements that occupy only 5% of the total land area! The city's population is expected to double in the
Kenya
Tanzania

COMPARING SPATIAL PATTERNS OF INFORMAL SETTLEMENTS BETWEEN NAIROBI AND DAR ES SALAAM
10
next 15 years (UN-HABITAT, 2008) leading to an increase in INSEs as a result of poor urban policies.
According to Mutisya & Yarime (2011), Nairobi's INSE population is in a constant rise.
The informal settlements in Nairobi have a long history dating from colonial period, where most Africans
were barred from living in certain residential areas that were reserved for Europeans and Asians. In spite
of existence of informal settlements since the Nairobi city's inception, the government has been reluctant
and unwilling to address this pressing issue and challenges faced by inhabitants. Although in the past
INSE dwellers faced forced evictions, strategic plans and policies have been put in place that recognises
the existence of informal settlements (Mutisya & Yarime, 2011). Unfortunately, this does not address
issues such as the lack of security of tenure and access to social services e.g. clean water and healthcare
facilities.
Figure 4: Location of INSEs in Nairobi city (Source: Own construct)
In the year 1963, Kibera (Figure 4) which is one of the largest informal settlements in Kenya was declared
illegal by the government (Mutisya & Yarime, 2011). In spite of this declaration, the settlement continued
to grow and now is a home to one million residents. Its close proximity to the city centre provides ideal
location for people who move in search for employment opportunities. There is also great disparity in the
estimation of the total population in Kibera settlements. Whereas UN-HABITAT puts the total
population at between 350,000 to one million, the experts on informal settlements give an estimate of
800,000 people whilst the government puts it at 200,000 people (Mutisya & Yarime, 2011)! This has led to
poor basic service delivery and misinformed decisions related to these settlements.
2.4.2. Addressing INSE Challenges in Nairobi
The UN-HABITAT (2008) report indicates that the government of Kenya has embarked on rigorous
slum upgrading activities which have continued unabated under Kenya Slum Upgrading Projects
(KENSUP). These programmes are done jointly with World Bank and UN-HABITAT. The approach
which has been adopted combines elements such as income generation activities, capacity building,
housing finance provision, provision of housing improvements as well as provision of basic services like
clean water and sanitation. These projects are done jointly so as to realign and harmonise UN-HABITAT's
and the world Bank's strategies with those of the government (UN-HABITAT, 2008). Further, the aim
has been to incorporate the principles from the provision of water, sanitation and infrastructure as well as
UN-HABITAT's slum upgrading into the programme and develop them into implementation strategy.
Some of the UN-HABITAT and KENSUP Projects include: Kibera slum Upgrading Initiative; Kibera
Kibera

COMPARING SPATIAL PATTERNS OF INFORMAL SETTLEMENTS BETWEEN NAIROBI AND DAR ES SALAAM
11
Integrated Water, Sanitation and Waste Management Project; Youth Empowerment Programme; Kahawa
Soweto and Korogocho Slum Upgrading Programme in Nairobi.
Figure 5: A photograph showing INSEs in Kibera, Nairobi (Wikipedia, 2014b)
2.4.3. INSEs in the City of Dar es Salaam
Tanzania is one of the countries with the highest proportion (approximately 60-70 %) of its urban
residents living in informal settlements (Figure 3). The city of Dar es Salaam, like many other cities in East
Africa region, is a highly urbanising. Its projected population in the year 2030 is expected to reach 6.7
million people (TNBS, 2006). In Dar es Salaam, about 60 percent of the estimated 4.3 million inhabitants
live in such settlements (Kombe, 2005). The number of informal settlements in Dar es Salaam increased
from roughly 40 in the year 1985 to over 150 in 2003 (Kombe, 2005). Again, discussing the dynamics of
INSEs in Dar es Salaam, Kombe (2005) notes that although the growth of the INSEs has intensified in
Tanzania over the last three decades, attempts to adopt new holistic measures to curb and regulate the
development of such settlements have been fruitless.
The land tenure system in Tanzania is either statutory or customary (UN-HABITAT, 2010a). The existing
land tenure system in Tanzania has contributed to the development of informal settlements because the
government has been tolerant and sympathetic to development of such settlements. In addition, one of
the fundamental principles of National Land Policy of 1995 is to "pay full, fair and prompt compensation
to any person whose right of occupancy or recognized long-standing occupation or customary use of land
is revoked" (UN-HABITAT, 2010a). This has led to development of INSE in haphazard manner because
the construction of such settlements does not follow land use planning regulations such as zoning.
Some of the households in informal settlements construct permanent houses with modern building
materials including use of cement and tiles. This has led to a wide range of social economic groups that is,
the rich and the poor live close together in the same informal settlement. Another contributing factor to
this situation is favourable security of tenure as well as land ownership policy which encourages people to
build houses using durable building materials (UN-HABITAT, 2010a). This has made it difficult to
distinguish between formal and informal settlement in Dar es Salaam. This has been due to the fact that

COMPARING SPATIAL PATTERNS OF INFORMAL SETTLEMENTS BETWEEN NAIROBI AND DAR ES SALAAM
12
there are many permanent structures within informal areas. However, the major difference is that in
formal settlement areas, plot boundaries are clearly demarcated and surveyed with well established
beacons as opposed to informal settlements where plot boundaries are not physically demarcated. The
hedges and trees are used as boundaries.
Figure 6: Location of INSEs in Dar es Salaam city (Source: Own construct)
Although there has been an increasing number of informal settlements in many cities in Africa,
interventions such as improving living conditions to achieve sustainability has been insignificant. Whereas
some cities have taken tremendous measures, such as upgrading and sustainable provision of basic
policies, others have focused on governance and institutional restructuring hence creating a refined long-
term response to INSEs challenges.
2.4.4. Addressing Informal Settlement Challenges in Dar es Salaam
As one of the developing countries, Tanzania is faced with rapid development of unplanned urban
settlements. Nevertheless, the Tanzanian government has over the years developed many policies and
programmes to address the informal settlements problems. According to (Mkurabita, 2012), the initiatives
that have been put in place include "the Urban Housing Programme of 1969; Sustainable Cities
Programme initiated in 1992; National Sites and Squatter Upgrading Programme (1972-1990); Community
Infrastructure Upgrading Programme (2003-2012); Unplanned Urban settlement Regularisation Program
in 2004 and the Property and Business Formalisation Programme initiated in 2004."
The development of these initiatives has been done considering the global and national policies on
informal settlements such as "the Millennium Development Goals; National Vision 2025; National
Strategy for Growth and Reduction of Poverty (NSGRP); National Land Policy of 1995; and the human
Settlement Policy of 2000'' (Mkurabita, 2012). Additionally, in participatory urban land formalisation
process, there is involvement of residents in planning, implementation and monitoring of various urban
settlement programmes. Thus, the principle of "community participation" is an approach adopted in
promoting wider acceptance, ownership as well as sustainability of the process of formalisation
(Mkurabita, 2012). The community participation has been successfully implemented in a number of town
councils other than Dar es Salaam such as Njombe, Morogoro and Arusha. This process involves

COMPARING SPATIAL PATTERNS OF INFORMAL SETTLEMENTS BETWEEN NAIROBI AND DAR ES SALAAM
13
"sensitisation of key stakeholders, technical training, identification of properties, surveying of individual
plots, preparation of regularisation schemes as well as cadastral plans, approval of schemes of
regularisation and survey plans, application for Certificate of Right of Occupancy (CRO), approval by
zonal assistant, issuance of the CRO and finally capitalisation of the formalised property"(Mkurabita,
2012).
Figure 7: A photograph showing INSEs in Kinondoni, Dar es Salaam (UN-HABITAT, 2014b)
2.4.5. Similarities and Differences of Nairobi and Dar es Salaam INSEs
The INSEs exhibit similarities and differences in patterns. The building sizes are often small (Kuffer et al.,
2014) and mostly rectangular in shape with irregular layout and pattern. The INSEs in Nairobi (figure 4)
cover small area and some of them are sandwiched along the road reserves. The INSEs in Dar es Salaam
are extensive covering most parts of the city and they have large patch sizes (figure 6). Unlike the INSEs
in Dar es Salaam which have medium densities, most INSEs in Nairobi have high densities.
2.5. Remote Sensing and Patterns of INSEs
Remote sensing and GIS techniques offer robust approaches and techniques that permit spatially explicit
measurement and analysis of patterns of informal settlements including their location and structural
characteristics such as shape, size and texture. Remote sensing data have an enormous importance in this
regard, because they provide independent, area-wide, and up-to-date datasets (Taubenbock & Kraff,
2014). Today’s capability of remote sensing data is essential not only in analysing surface features but also
underground features e.g. oil pipelines. Remote sensing is one of the data sources (Refer to Appendix 1)
which can support the analysis of the complex heterogeneity of slums significantly, especially from a
physical point of view. The products obtained from remote sensing vary in resolution and application
insofar as analysis of patterns of informal settlements is concerned. The high resolution images give finer
details hence high accuracy.
Although primary data collection methods such as field surveys can be adopted, in most cases the cost of
conducting such surveys to acquire spatial data is high. For instance, field data collection within informal
settlements is very challenging because there is often lack of accessibility and security. Therefore, satellite
imagery may be used as an alternative source of data for measuring, quantifying and evaluating spatial
patterns of informal settlements. Crucial in the measurement, description, analysis of patterns of features
or phenomena, are remote sensing-derived data (Herold et al., 2003). For instance, the DEM as a remote
sensed product can be further processed to derive the slope which is crucial in analysing surface terrain of

COMPARING SPATIAL PATTERNS OF INFORMAL SETTLEMENTS BETWEEN NAIROBI AND DAR ES SALAAM
14
INSE location. Remote sensing methods, according to D Kohli, Warwadekar, Kerle, Sliuzas, & Stein
(2013), have the potential to capture the heterogeneity by following a hierarchical procedure for
object-classification and by including contextual information for objects and non-physical features.
2.6. Spatial Levels of Analysis
One of the objectives of the study is to carry out the physical comparison of informal settlements. To
conduct a systematic structural comparison and subsequent depiction of INSE patterns, the study area is
divided into three analysis levels (Taubenbock & Kraff, 2014)(Taubenbock & Kraff, 2014)(Taubenbock &
Kraff, 2014)(Taubenbock & Kraff, 2014)(Taubenbock & Kraff, 2014). The analysis is done from
landscape level to object level (figure 8).
Figure 8: Hierarchical structure of spatial analysis levels of INSE - Adapted from Kohli et al. (2012)
2.6.1. Landscape Level
This level is also known as environs level (Divyani Kohli et al., 2012). At this level, the general location
characteristics of informal settlements in relation to the surrounding areas are analysed. This spatial level
of analysis does not reflect diverse urban landscape in terms of a mixture of different land uses
(Taubenbock and Kraff, 2014). Further, at this level, the analysis of location of informal settlement in
respect to environmentally sensitive areas such as flood prone and hazardous zones is done. The location
of informal settlements also depends on socio-economic factors such as close to opportunities for
unskilled or semi-skilled jobs (Divyani Kohli et al., 2012). The GIS methods such as proximity and
accessibility measures are used to establish the relationship between location of INSE and that of roads,
market centres, industries etc. This research explores and demystifies how the characteristics differ
between the cities of Nairobi and Dar es Salaam.
2.6.2. Settlement Level
At this level, the overall size, form, shape (e.g. irregular or detached), density of the INSEs settlement
blocks are analysed (Divyani Kohli et al., 2012). In addition to that, the planned and unplanned
settlements are distinguished based on texture characteristics and the level of heterogeneity. In most cases,
informal settlements tend to follow the shape of linear features such as roads, railways or rivers. Hence
their shapes tend to be elongated and irregular. Separately, the density of building structures is also a key
in identifying INSEs. In spite of the roof coverage being high with little open space and green areas,
normally the density of an INSE differs locally and depends on how old such a settlement is as well as its
location characteristics such as terrain (Divyani Kohli et al., 2012) and (Taubenbock & Kraff, 2014).
Landscape Level
Settlement Level
Object Level
Incr
ease
in
det
ail o
f an
alys
is
COMPARING SPATIAL PATTERNS OF INFORMAL SETTLEMENTS BETWEEN NAIROBI AND DAR ES SALAAM
15
2.6.3. Object Level
At this level, finer details of components of the settlement, such as characteristics of buildings and roads
are analysed (Divyani Kohli et al., 2012). In this study, the focus was on the access and connectivity
network, shape, and size of the building structures. Within an informal settlement, the road network in
usually irregular with variability in street length, width and surface type. The street coverage is an indicator
of connectivity and accessibility in an informal settlement and its environs. However, Taubenbock &
Kraff (2014) clarifies that street network cannot be solely used as structuring element when it comes to
delineation of informal settlements because of high density structures which eliminate the presence of the
streets. Figure 9 presents a graphical depiction of the three spatial levels of analysis.
Figure 9: Three levels of spatial analysis of INSEs (Source: Own construct)
2.7. Analysis of INSEs Patterns using Spatial Metrics
Spatial metrics are defined as quantitative and aggregate measurements obtained from digital analysis of
raster data which shows spatial heterogeneity at different scales and resolutions (Herold, Goldstein, and
Clarke, 2003). Spatial metrics are important in measuring and quantifying complexity, centrality,
compactness and density of INSEs. The indicators such as patch density, shape indices or pixel-based
parameters (e.g. contagion) which are computed from all pixels in a patch are used to analyse physical
characteristics of INSEs. Similarly, the INSE differentiation requires spatial metrics that are explicit,
measurable, easily quantifiable, replicable and systematically observable (Owen and Wong, 2013).
Furthermore, the outcome of using the metrics acts as the basis of fully understanding the patterns of
INSEs and provides new insights into their variability and similarities. Spatial metrics improve our
understanding about the development of informal settlements through the analysis of several indicators
such as: absence of roads, lack of vegetation and open spaces; high density, compact development,
irregular shapes, association with neighbouring areas and texture (Kohli, Sliuzas, Kerle, and Stein, 2012).
The results obtained from spatial metrics are used as a basis for describing the patterns of informal
settlements over time and space (Appendix 2). The analysis of three dimensions i.e. size, shape and pattern
(Kuffer & Barrosb, 2011) can show the level of unplanned and the likelihood of an area being informal.
The study on typology of informal settlements by Ishtiyaq & Kumar (2011) revealed that smaller size of
slum clusters are more in number and therefore many people live in them. Spatial metrics are implemented
in the open source statistical packages FRAGSTATS and Patch Analyst (Herold et al., 2003). Dubovyk,
Sliuzas, & Flacke (2011) developed logistic regression models to analyse relationships between informal
settlements and their driving factors such as proximity to industrial areas and neighbourhood
characteristics. The research on detection of slum areas in Hyderabad, India was based on the concept of
lacunarity and was done by Kit, Lüdeke, & Reckien (2012). Lacunarity is a scale-dependent measure of
heterogeneity of an object by considering its texture (Plotnick, Gardner, Hargrove, Prestegaard, &
Perlmutter, 1996). The concept of lacunarity defines areas of high-density housing and small dwelling size.

COMPARING SPATIAL PATTERNS OF INFORMAL SETTLEMENTS BETWEEN NAIROBI AND DAR ES SALAAM
16
The structure and pattern of informal settlement are highly amorphous. Therefore, the use of spatial
metrics to quantify the patterns of informal settlements offers a detailed representation of these dynamic
and heterogeneous areas; and provides a link between the physical structures and INSE form as well as
the process. Furthermore, spatial metrics have been used for comprehensive analysis of the
spatiotemporal patterns of land use change; and in the explanation and accuracy assessment of models
(Herold et al., 2003). The spatial metrics are an important tool for the analysis of remotely sensed derived
data for informal settlement. Additionally, they provide tremendous rich level of quantitative information
about the structure and pattern of the landscape, and they effectively capture the changing dynamics of
INSE growth. Using spatial metrics is advantageous for the analysis of land use change because they offer
a comprehensive method for the description of process and the comparison with theory (Herold et al.,
2003). Spatial metrics are used to analyse the morphology of unplanned areas (Kuffer & Barrosb, 2011)
come in handy in guiding the spatial land use pattern and future growth of an area, thus acting as a policy
and planning tool. The figure 10 shows an illustration of some of the metrics used to quantify the
structure of informal settlements.
Figure 10: Spatial metrics for quantifying the structure of INSEs (Huang, Lu, & Sellers, 2007)
The complexity index measures the irregularity of the patch shape (Figure 10). The area weighted mean
shape index is used to measure the irregularity of the patches. The higher the value of the index, the more
irregular the shape is (Huang et al., 2007). Another important index is fractal dimension which has a
potential to measure also the ruggedness of the INSE shape. Fractal dimension of value 1 represents
shapes which are simple e.g. a circle but as it approaches a value of 2 the shapes become more complex.
The centrality index measures the distance between the largest patch and other patches. The elongated INSE
shapes have bigger centrality indices than the circular ones. The compactness index (CI) measures both the
fragmentation of INSE landscape as well as the individual patch shape (Huang et al., 2007). Normally, the
higher values of CI are associated with the 'regular shape' of patches and smaller number of patches.
Another important indicator of measuring the ratio of open space in comparison to the total INSE
landscape area is porosity. In this research, the metrics that have discussed shall be used to measure and
quantify the patterns of INSE in both cities. The differences in index values between the two countries
will assist in understanding the extent of their morphological variations.

COMPARING SPATIAL PATTERNS OF INFORMAL SETTLEMENTS BETWEEN NAIROBI AND DAR ES SALAAM
17
2.8. The INSE Locational and Morphological Indicators
The quantification of the patterns of INSEs requires identification of measurable variables at three levels
of analysis (figure8). In this study, a number of variables and indicators were documented prior to
quantification process as presented in table 1.
Table 1: The INSE factors and indicators
INSE Aspects Data/Object Measured Variable
Analysis Levels
Landscape Settlement Object
Location
Major Roads Accessibility
- -
Industrial Areas Accessibility - -
Major Rivers Proximity
- -
Town Centres and CBD
Accessibility - -
Terrain (Slope) Site-specific (Overlay) - -
Flood-prone areas Site-specific (Overlay) - -
Landuse in INSE environs
Neighbourhood (buffer) - -
Morphology
Settlement
Dwelling size - Mean area -
Dwelling density - PD -
Number of INSEs - Number of patches
-
Shape of settlement - MSI -
Settlement Pattern - AI , SEI and SDI
-
Buildings
Building size - - Mean area
Building shape - - MSI
Building density - - PD
Building pattern - - AI, SDI and SEI
Roads
Density of roads - - Percentage coverage
Connectivity,
Circuitry
Complexity
Density
- -
Nodes; length; links
2.8.1. The Location Aspects
The proximity is a measure of how close an INSE is to spatial features such as roads, rivers, railway and
industries. In this research, accessibility is used as a measure of proximity because the time component
was factored in. The road network was used as linkages amongst different locations in the informal areas.
The network distance tools are used to explore the accessibility relationship and measurements are

COMPARING SPATIAL PATTERNS OF INFORMAL SETTLEMENTS BETWEEN NAIROBI AND DAR ES SALAAM
18
constrained to a road, railway and rivers. Additionally, assessing the accessibility to industries by INSE
inhabitants require the creation of network service area. The contour service areas show how accessibility
varies with distance along the network. The service area also shows how many people have access to a
certain facility for instance, 100 people have access to the industries within 10 minutes of walking from
their homes. Unlike Nairobi where INSE are located in different parts of the city, the major roads are
significant drivers of INSE growth in the city of Dar es Salaam (Abebe, 2011). Often lack of streets in the
cities has a negative impact because the provision of services such as water is hampered (UN-HABITAT,
2013). In addition, there has been a challenge of establishing coherent road network in major cities.
The location of INSE is often associated with environmental hazards such as soil erosion, flooding, steep
slopes, mining sites and sand harvesting areas. These areas are either vacant or undeveloped and are
considered to be threats to descent habitation. The slope used in this study to analyse the terrain
characteristics is obtained from the DEM of 30 m spatial resolution and is calculated as a percentage. In
the methodology section, this process of generating slope from DEM is discussed in detail. The
proportion of INSE, undeveloped land and land use in the surrounding areas is computed using the cell
size of 20 metres (cell size area of 400 square metres). The data used in this research is mainly vector data
although in the case of terrain, raster data (DEM and slope) is used for analysis.
2.8.2. The Morphology Aspects
The spatial metrics have been utilised to analyse the morphology of unplanned areas in Nairobi and Dar es
Salaam. The morphology of the INSEs has been analysed using settlement, buildings and roads data. Each
of these factors requires different approach and spatial metrics. As shown in table 1, a set of spatial
metrics describing the morphology were adopted. Their selection was based on the fact that some metrics
are highly correlating within one dimension whilst others are insignificant. For instance, according to the
study done in Dar es Salaam by Kuffer & Barrosb (2011), the patch, edge and patch richness density
correlates. Therefore, in this research the patch density was chosen while edge and patch richness density
were dropped. In describing shape complexity of INSEs, the mean patch fractal dimension (MPFD) mean
perimeter-area ratio (MPAR) and mean shape index (MSI) are computed. The mean shape index was
adopted while MPFD and MPAR were dropped. Further, the spatial metrics that were selected for the
analysis of pattern include aggregation index, contagion index, Shannon's evenness index (SEI) and
Shannon's diversity index (SDI).
In this study, FRAGSTATS (McGarigal, Cushman, & Ene, 2012) and Patch Analyst are used to compute
the metrics. These software applications calculate above metric statistics that quantify the landscape
configuration and the complexity of the patch shape. The description of the metrics has been presented in
the subsequent sections. It is important to note that most of the shape metrics are based on perimeter-area
relationships. In addition, the metrics are just numbers and indices hence without critical and clarity in
interpretation they will not make sense. The INSEs are typically more irregular, have high density and high
complexity hence using the spatial metrics aids in understanding the morphology and at the same time in
revealing some of their latent characteristics.
Apart from analysing the settlements and buildings, the road network connectivity (including the density,
circuitry, complexity and connectivity) within the INSEs was also analysed. In most settlements, the road
network coverage is often low and people tend to use walk support to access the main road network. As
described in the subsequent sections, the accessibility to the road was done at landscape level. However,
the analysis of road coverage and connectivity at the settlement level was still feasible although the main
focus was on building structures with emphasis on analysing their sizes, densities, shapes and patterns.
Additionally, other important indicators include road density, length and number of nodes. The analysis of
roads was done in five sample sites that were selected in each example city as described in the next section.

COMPARING SPATIAL PATTERNS OF INFORMAL SETTLEMENTS BETWEEN NAIROBI AND DAR ES SALAAM
19
3. DATA AND METHODOLOGY
3.1. Overview of Methodology
Figure 11 below gives a full description of an overview of the research methodology and details including
data requirements, the methods and approach that will be employed in the execution of the research. The
study areas, methods, data, workflow and analysis have been discussed in the subsequent sections.
Figure 11: A general methodological framework
Lan
dsc
ape
Lev
el A
nal
ysis
Input Data Pre-processing Spatial and Statistical Analysis
Set
tlem
ent
& O
bje
ct L
evel
An
alys
is
An
alys
is
Proximity
Clipping layers
Generate Slope
Create network
dataset
Terrain Analysis
Landscape GIS
Analysis
Statistical Analysis in
SPSS
Clip INSEs &
building layers
GIS Overlay
Operations
Neighbourhood
Spatial Data
Spatial Data
Creation of
analysis layer
Size
Density
HI values
Porosity
Shape
Results/Output
-Spatial & morphological indicators -Statistical tables, charts and maps
-HI values & comparison matrix tables
Classified Vector
Data
Vector to Raster
Conversions
Run Process on Patch
Analyst/FRAGSTAT
Output maps and
GIS Analysis
Classify the
layers
Rivers
Roads
DEM
Landuse
Buildings
Admin_BN
D
Buildings
layer
INSE layer
VHR satellite
imagery
Create topology
SM Dimensions
Select the spatial
Metrics
Comparison of the results
between Nairobi and Dar es
Salaam cities

COMPARING SPATIAL PATTERNS OF INFORMAL SETTLEMENTS BETWEEN NAIROBI AND DAR ES SALAAM
20
As indicated in the figure 11 above the research is done in two phases (i) landscape level (ii) settlement and
object level. At landscape analysis, basic GIS operations such as proximity, accessibility, near distance
measurements, neighbourhood and site-specific analyses are done in relation to INSE characteristics. At
settlement and object phase, spatial metrics are employed to analyse structural patterns of INSEs. There
are differences between Nairobi and Dar es Salaam. Whereas Nairobi is a capitalist and open market
economy, Dar es Salaam is a socialist economy. As stated earlier, the comparison of locational and
morphological aspects was done at three levels i.e. landscape, settlement and object level.
3.2. Location of the Study Areas
The locations of the study areas are Nairobi city in Kenya and Dar es Salaam city in Tanzania (Figure 4).
Nairobi city is located in the central part of Kenya (1.2859°S, 36.8195°E) at an altitude of 1660 metres
ASL while Dar es Salaam is located in the Eastern region in Tanzania bordering the Indian Ocean
(6.8001°S, 39.2835°E) at 60 metres ASL. The administrative extent of Nairobi city covers 696 Km2
(Wikipedia, 2014a) while that of Dar es Salaam (study area extent) is 980 sq. km (Abebe, 2011). The whole
administrative boundary of Dar es Salaam city covers an area of 1590 Km2. The reasons for selecting the
study sites are: The informal settlements in both cities have been identified based on the previous
research; the availability of data; both cities also correspond well to the chosen research problem and
methodology. This research is confined to the cities of Nairobi and Dar es Salaam only. The cities are used
as examples to explore the commonalities and differences in informal settlement patterns. The geographic
location and the landscape of these cities is also different hence making comparison relevant.
Figure 12: The location of the study areas, Source of base image: (Esri, 2015a)

COMPARING SPATIAL PATTERNS OF INFORMAL SETTLEMENTS BETWEEN NAIROBI AND DAR ES SALAAM
21
Description of the Location of INSEs
A number of social-spatial characteristics can be used to identify types and the location of informal
settlements. They include: size, location, resident profiles and spatial organisation. Despite a wide range of
spatial phenomena, the several INSEs exist in different areas (Tsenkova, 2010). Some of these areas
described in subsequent sections below.
Squatter settlements on public or private land are those settlements which are built by residents on illegally
occupied land. This is as a result of movement to cities due to migration and change of urban economies.
These informal settlements are normally located in peri-urban areas either on private or public land. These
types of settlements are predominant in Nairobi city.
Further, settlements for refugees and vulnerable people are the settlements often developed by the
refugees or internally displaced people as a result of wars or natural calamities like earthquakes. These
settlements are found on urban periphery and have limited access to social services.
In the upgraded squatter settlements, the legal status of these settlements varies. They begin with the
illegal occupation status and over time they acquire legal ownership and occupation rights. This enables
the settlements to develop rapidly with land owners investing in their homes. As a result of regularisation
process, these settlements have become dominant in Dar es Salaam city although Nairobi has also begun
the process of INSE upgrading.
Lastly, there exist illegal suburban land subdivisions on private or public land. The residents in these
settlements often possess titles to the land and the houses are built with proper planning and approval
procedures. Often unauthorised land development and illegal subdivisions are rampant. For instance,
agricultural land is subdivided and sold to developers who later convert it to urban areas without following
proper planning procedures and zoning regulations. Some of these cases are rampant in Nairobi city.
3.3. Data Collection Approach
This phase comprises of pre-data collection including sampling, preparation of site maps and identification
of the data to be collected. The two types of data collected are primary and secondary data. The
subsequent sections discuss general data collection approach used in this research.
3.3.1. Primary Data
The fieldwork was carried out in two cities i.e. Dar es Salaam and Nairobi. As indicated above, during the
fieldwork process the data collection was done on all sample sites in both cities (Appendix 5). Some of the
data include: building floors; construction materials; roofing materials; photographs of roads and buildings
in sample sites. This data was collected mainly to assess the general characteristics of INSEs with an aim
of creating a better understanding of location and morphology characteristics.
In total, five sample sites were selected in both cities i.e. Nairobi and Dar es Salaam. These sites were
selected by considering different spatial aspects. These include: site on steep slopes, along the road,
railway, along the river, close to CBD and close to industrial area. The map on Figure 13 presents a
detailed illustration of the location of the sites in Nairobi city. Basically, field observations were done on
the whole settlement considering the characteristics and factors that drive INSE development as discussed
previously. A number of sample objects were measured (e.g. width of road, number of floors of buildings
etc). The criterion was based on the general morphology characteristics of the whole settlement. For

COMPARING SPATIAL PATTERNS OF INFORMAL SETTLEMENTS BETWEEN NAIROBI AND DAR ES SALAAM
22
comparison purposes, similar approach was applied to the remaining sites which are along steep slopes,
close to roads or railway, CBD, industries etc. Figure 13 shows some of the sample sites in Nairobi city.
Figure 13: Location of the sample sites in the city of Nairobi
The five sample sites were used in each city because some data such as buildings for the entire city was
unavailable. The appendix 5 shows the primary data that was collected during the field work. The data will
be used during the interpretation of the results.
3.3.2. Description of Field Observations
The general observations were made during the site visits to INSEs in both cities. They are documented in
appendix 5. Below is a brief description of the sample sites in Nairobi and Dar es Salaam.
Firstly, Nairobi sample sites were visited and a number of general observations made. The INSEs in
Nairobi are located mainly close to rivers and major roads. Some INSEs such as Majengo and Mathare are
small in size, compact with high density building structures. They are located on gentle slopes close to
rivers and at a distance of approximately 3 km (Majengo) and 5 km (Mathare) to CBD. Kibera,
Kawangware and Mukuru Kwa Njenga have large spatial extent compared to the Majengo and Mathare.
Mukuru and Kibera are located along the railway line while Kawangware is located close to affluent area of
Lavington estate. The building density in these settlements is high with structures mainly made of
corrugated iron sheets (roofing and walls) although some mud houses exist in these INSEs. In addition to
low percentage of open spaces, these areas have few road networks since building structures tend to be
close to each other. However, the roads that exist in these INSEs are mainly earth and unpaved.
Unlike Nairobi, the INSEs in Dar es Salaam are more dominant along the major roads and more complex
in terms of the physical structure and pattern. The INSEs in Kimara and Mbagala Kuu areas are located
on steep slopes. There is also a mix of building structures incorporating mud houses, semi-permanent and
permanent houses. Some of the buildings (those in the areas that have undergone regularisation process)
have up to 4 floors although they are few. The percentage of open space here is quite high compared to
Kinondoni which is located close to the CBD and along flooding zone. The building density in Kinondoni
is high compared to the other four sites because it is located close to the CBD where land demand is high.
Kinduchi site is located along the main road heading to Bagamoyo town. The building density here is low.
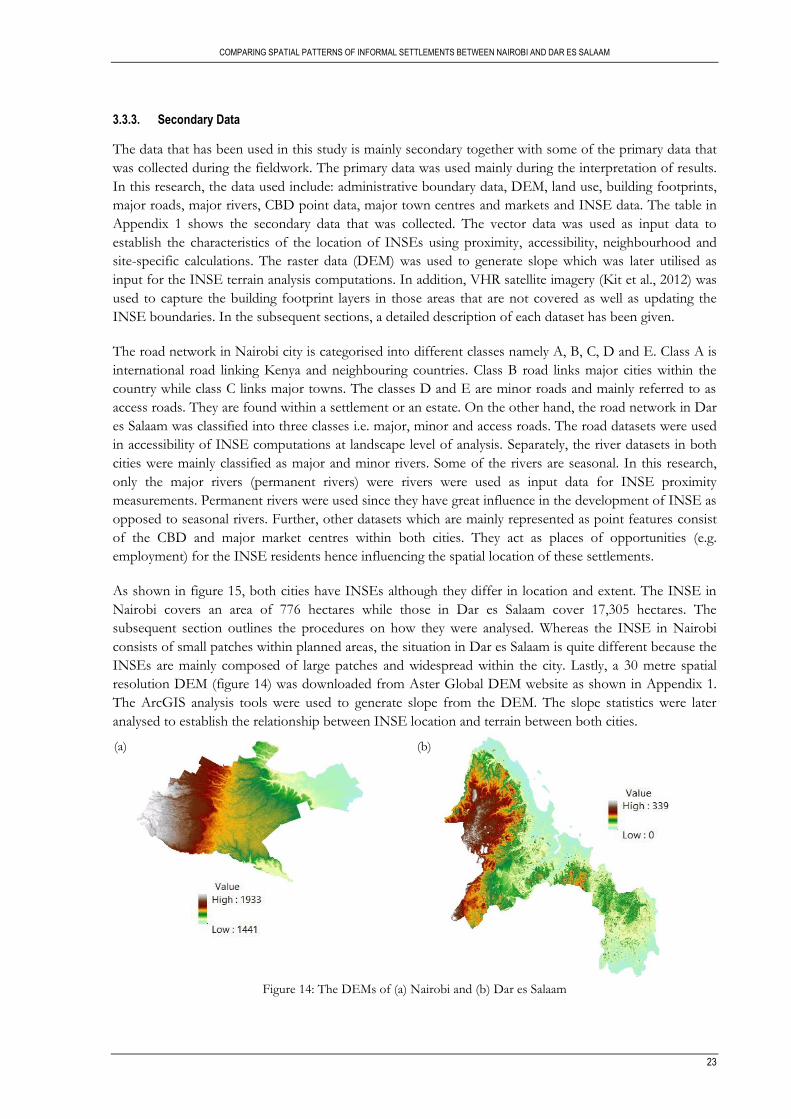
COMPARING SPATIAL PATTERNS OF INFORMAL SETTLEMENTS BETWEEN NAIROBI AND DAR ES SALAAM
23
3.3.3. Secondary Data
The data that has been used in this study is mainly secondary together with some of the primary data that
was collected during the fieldwork. The primary data was used mainly during the interpretation of results.
In this research, the data used include: administrative boundary data, DEM, land use, building footprints,
major roads, major rivers, CBD point data, major town centres and markets and INSE data. The table in
Appendix 1 shows the secondary data that was collected. The vector data was used as input data to
establish the characteristics of the location of INSEs using proximity, accessibility, neighbourhood and
site-specific calculations. The raster data (DEM) was used to generate slope which was later utilised as
input for the INSE terrain analysis computations. In addition, VHR satellite imagery (Kit et al., 2012) was
used to capture the building footprint layers in those areas that are not covered as well as updating the
INSE boundaries. In the subsequent sections, a detailed description of each dataset has been given.
The road network in Nairobi city is categorised into different classes namely A, B, C, D and E. Class A is
international road linking Kenya and neighbouring countries. Class B road links major cities within the
country while class C links major towns. The classes D and E are minor roads and mainly referred to as
access roads. They are found within a settlement or an estate. On the other hand, the road network in Dar
es Salaam was classified into three classes i.e. major, minor and access roads. The road datasets were used
in accessibility of INSE computations at landscape level of analysis. Separately, the river datasets in both
cities were mainly classified as major and minor rivers. Some of the rivers are seasonal. In this research,
only the major rivers (permanent rivers) were rivers were used as input data for INSE proximity
measurements. Permanent rivers were used since they have great influence in the development of INSE as
opposed to seasonal rivers. Further, other datasets which are mainly represented as point features consist
of the CBD and major market centres within both cities. They act as places of opportunities (e.g.
employment) for the INSE residents hence influencing the spatial location of these settlements.
As shown in figure 15, both cities have INSEs although they differ in location and extent. The INSE in
Nairobi covers an area of 776 hectares while those in Dar es Salaam cover 17,305 hectares. The
subsequent section outlines the procedures on how they were analysed. Whereas the INSE in Nairobi
consists of small patches within planned areas, the situation in Dar es Salaam is quite different because the
INSEs are mainly composed of large patches and widespread within the city. Lastly, a 30 metre spatial
resolution DEM (figure 14) was downloaded from Aster Global DEM website as shown in Appendix 1.
The ArcGIS analysis tools were used to generate slope from the DEM. The slope statistics were later
analysed to establish the relationship between INSE location and terrain between both cities.
Figure 14: The DEMs of (a) Nairobi and (b) Dar es Salaam
(a) (b)

COMPARING SPATIAL PATTERNS OF INFORMAL SETTLEMENTS BETWEEN NAIROBI AND DAR ES SALAAM
24
The Land use in Nairobi and Dar es Salaam
The map in figure 15 below shows a comparison of land use classification in Nairobi and Dar es Salaam.
Figure 15: Land use classification in the cities of Nairobi and Dar es Salaam

COMPARING SPATIAL PATTERNS OF INFORMAL SETTLEMENTS BETWEEN NAIROBI AND DAR ES SALAAM
25
The land use in both cities has been reclassified into eleven classes (Figure 15). The land use data for
Nairobi is for the year 2010 whilst that of Dar es Salaam is for the year 2012. The sources of the
respective land uses have been provided in the appendix 1. The land uses were reclassified into the same
number of classes to achieve comparable results. The percentages of land use classes (11 classes) in both
cities are shown in the diagram below (Figure 16).
Figure 16: A comparison of proportion of percentages of land use classification
As shown in the figure above, agricultural land use in Dar es Salaam has the highest percentage of 47
covering an area of 69,740 hectares while the highest land use in size in Nairobi is residential with 35
percent covering 22,316 hectares of land. The residential land use in Dar es Salaam covers 27 percent of
the total area of the city. There is also the presence of a national park in Nairobi which covers a large area
of about 20% of the total area of the city! As depicted in figure 16, the INSEs are more extensive in Dar
es Salaam (12%) with total area of 17,305 hectares compared to Nairobi (1%) covering an area of 776
hectares (figure 15). Unlike in Dar es Salaam, the INSEs in Nairobi are composed of small patches.
3.3.4. Data Quality Assessment
Most of the data used in this research especially for the city of Dar es Salaam was obtained from ITC
archive and has been used to conduct various studies in the past. The datasets for Nairobi (land use, roads,
railway, rivers etc) were mainly obtained from government ministries and agencies that are entrusted with
various mandates according to laws of Kenya. The data also contains a list of metadata which is crucial in
understanding the scale, spatial resolution, the date of acquisition, the coordinate system, spatial extent
and additional information such as the modalities on how the data was obtained as well as its uses.
In assessing the overall accuracy, currency and consistency of the data, the GIS data layers were converted
into Google KML format and loaded on Google Earth. The visual checks and inspection on the data was
done. This process was carried out layer by layer to ascertain that the data was up-to-date. Some
modifications were also carried out such as updating some data by digitizing the new roads, capturing new
buildings, erasing buildings that have been demolished etc. Some of the datasets had to be converted from
local datum to WGS84 global datum in order to achieve harmonisation of data layers in the geodatabase.

COMPARING SPATIAL PATTERNS OF INFORMAL SETTLEMENTS BETWEEN NAIROBI AND DAR ES SALAAM
26
3.4. Data Pre-processing Approach
At this interim stage, the main processes that were carried out include the creation of analysis layer,
creation of slope layer from DEM, clipping layers, GIS overlay operations, categorising the land use,
creation of network dataset and service area; extraction of INSEs from land use data was carried out. The
extent of the study area was limited to the administrative boundaries of the cities (city boundary layer)
hence this layer was used as an input for clipping operations. Some data layers such as roads, rivers and
DEM were obtained at national levels hence they were clipped to ensure efficiency during data processing.
All data preparation tasks and pre-processing are done in the ArcGIS software because of its capability
and inbuilt algorithms for handling both vector and raster data. At this stage, it was also crucial for the
data to be transformed into the unified coordinate system (data in Arc1960 datum was transformed into
WGS84 datum) and stored in a geodatabase to ensure that GIS processes were carried out expeditiously.
During accessibility measures and creation of the road network dataset, it was imperative to ensure the
network data integrity. The use of GIS topological data inspection was done thus ensuring that errors
inherent in the dataset such as gaps and overlaps were all corrected. As pointed earlier, the use of a
geodatabase plays a crucial role since the correction of topological errors is possible. All the data layers
were inspected before they were used in subsequent processes and analyses. The creation of slope (in
degrees and as percentage) from a DEM (30 metre spatial resolution) was also done at this stage. A slope
is a raster layer which depicts a change of elevation with distance. Each raster cell within the slope layer
has same slope value given either as a percentage or degrees. The higher spatial resolution of a DEM often
gives finer details of slope analysis hence increases accuracy of the results. In this study, 30 metre
resolution was used which implies that a ground area of 900 square metres has the same slope values. The
30 metre DEM used in this study was ideal for the analysis and the results obtained were sufficient.
3.5. Methods, Tools and Software Requirements
In this research, the focus was mainly on analysis of spatial and morphological characteristics of informal
settlements (Appendix 6). To carry out spatial analysis, the data as indicated in 3.4.3 above was used. The
factors and indicators which determine the spatial development of INSEs (proximity, site-specific and
neighbourhood) were analysed (Dubovyk et al., 2011) as well as morphological indicators using spatial
statistical methods. The spatial analysis was performed at landscape level using a combination of ArcGIS
proximity and overlay operations while Microsoft Excel and SPSS was used in carrying out statistical
analysis. Despite the analysis at landscape level being generic, more insights on location aspects were
derived using spatial statistical methods incorporating spatial metrics at settlement and object levels of
analysis. At object level, the characteristics of building and roads (circuitry, complexity and connectivity)
were evaluated. Some of the buildings indicators used include the size, shape, density and pattern.
In ensuring that the above processes were carried out expeditiously, different software packages were used
to achieve the study objective. The ArcGIS was mainly used during spatial analysis incorporating the
creation of geodatabases; topological error correction; proximity and overlay measurements; exporting
database tables to excel and SPSS as well as creation of analysis maps. Separately, an open source tool
(MapWindow GIS) was utilised in the generation of INSE centroids for the hexagon layer which was later
used in accessibility computations. The centroids were used as 'origins' while CBDs and market centres
were 'destinations' in accessibility calculations. Other software packages i.e. FRAGSTATS and Patch
Analyst were used to carry out spatial statistical analysis by utilising derived landscape and class metrics
from vector and raster data at settlement and object levels. The patch analyst was used to generate the
hexagonal cells dataset which was later used in road accessibility measures computations within INSEs.
Lastly, the SPSS and MS Excel were used mainly for statistical computations as well as generating
statistical charts and graphs including bar charts, statistical tables, radar charts, histograms among others.

COMPARING SPATIAL PATTERNS OF INFORMAL SETTLEMENTS BETWEEN NAIROBI AND DAR ES SALAAM
27
3.6. Landscape Analysis
These operations entail proximity, neighbourhood and site specific measurements in relation to the
location of informal settlements in both cities. The combination of GIS proximity and overlay operations
is used as well as the spatial statistics analysis as shown in the subsequent sections.
3.6.1. Proximity and Accessibility Measurements
Accomplishing the goal of accessibility analysis at aggregate level requires the origins (demand) and
destinations with opportunities (supply) (Ahmed, 2004). The spatial accessibility of informal settlements
refers to the ease with which residents of a given INSE area can reach places of opportunities such as
industries, CBD and market centres. Besides, the roads act as a network on which accessibility analysis is
implemented. The assumption made is that the mode of transport used by inhabitants in informal
settlements is walking. Since the major roads in informal settlements are often non-existent, a virtual road
network called the walk support4 (Figure 19) is used for the hexagons of the INSEs. This process of
assessing the accessibility and proximity is implemented using a number of vector based GIS tools and
operations as indicated in figure 17 below.
Figure 17: Proximity and accessibility measurement approach
4 The walk support is constructed by joining the centroids of hexagons assuming that people walk in Euclidean distance to reach the real road network from their homes.
Create Analysis
Layer
Output
analysis
maps
INSE Railway Rivers Roads Major Towns
Intersect
Layers
NEAR Distance
computations
Network Service
Area
Network
Dataset
Classify output
layer
Industries
INSE
Served Area by
market centre and
industries
Intersect
Layers
Classified INSE
Classify INSE
Layer
Output
statistical
charts
Summarise and
export attribute
table
Comparison

COMPARING SPATIAL PATTERNS OF INFORMAL SETTLEMENTS BETWEEN NAIROBI AND DAR ES SALAAM
28
3.6.2. Accessibility Analysis Layer
Often an INSE is a cluster of houses with some socio-economic and physical characteristics (Sori, 2012)
therefore an individual building cannot be said to be an INSE. The process of defining the smallest spatial
cluster that constitutes an INSE is not only difficult but also time consuming since its demarcation is not
well defined spatially. On the other hand, the aggregation of data at city level or district level often tends
to hide spatial variability of urban structure and ultimately that of the INSEs. Therefore, a standardised
geometry is required to aid in long-term monitoring and planning applications. The alternative approach
was to define an INSE as geographic area using disaggregated spatial layer of analysis. The disaggregated
layer ensures that high accuracy results are achieved. This layer often varies in scale (global, national or
local). Thus, in the context of this study, the analysis layer was at a local scale (city level).
The creation of accessibility analysis layer involved various steps using Patch Analyst5 and MapWindow
GIS software. The Patch Analyst was used to create hexagonal cells of the size 100 metres while the
MapWindow was used to create the centroids. The cell size of 100 metres was chosen to be sufficient
considering the GIS processing time, the scale of analysis (citywide) and the level of required details of the
results. However, the possibility of the cell size being bigger or smaller depending on the scale of analysis
is also feasible. The smaller the size of grid the finer the details but the process consumes a lot of time
especially when the layer covers large spatial extent e.g. a country. The entire city area was divided into
hexagonal cells to capture and model spatial interaction within informal settlements at city level. The
assumption made is that a cell contains homogenous spatial characteristics such as the distance to the
road, distance to the river and population density. Often the distance analyses require the measurements
to be constrained to a linear feature such as a road, a river or a railway network. Furthermore, the
centroids were used as origins and were created using MapWindow GIS6. The centroids store the data
regarding the inhabitants of an informal settlement hence in the context of this research, they are
considered to be origins of the cells (Figure 18). On the other hand, the destinations normally depict areas
with opportunities such as the industries, commercial centres, CBDs and so on.
Figure 18: Accessibility analysis layer for network computations
5 An ArcGIS add-on extension developed under Spatial Ecology Program that facilitates the spatial analysis of landscape patches and modeling of attributes associated with patches. 6 This is an open source software application used for performing GIS analysis, mapping and has a programmable add-on module.

COMPARING SPATIAL PATTERNS OF INFORMAL SETTLEMENTS BETWEEN NAIROBI AND DAR ES SALAAM
29
3.6.3. Computation of INSE Accessibility
The accessibility is often evaluated in terms of road network connectivity in an area. In this study, the
topological relationship was established amongst the network links prior to design of road net dataset. In
improving the road network data integrity and consistency, the errors including the gaps and overlaps on
the road layer were all corrected. For instance, the dangles were trimmed and gaps on the junctions
snapped together. This was done to ensure that the accessibility computations were robust and accurate.
The accessibility was used to measure proximity of INSE using the road network. The centroids of
industrial layer, market centres and CBD layers were used as input in creating the service area layer. After
the service area layers for the roads, industries, market centres and CBD were created, they were later
intersected with the INSE layer and classification done thereafter. This process was done for each layer
separately and the results that were obtained are presented in the results and discussion section.
During accessibility calculations, some assumptions were made. An average walking speed of 4 kilometres
per hour (70 metres per minute) was adopted based on the work of Ahmed (2004). While walking, people
normally do not follow a straight line but often consider using the shortest distance between their homes
and places of opportunities. In figure 19 below as described in section 3.7.1 above, the triangular network
are referred to as the walk support. They are obtained by joining the centroids of the hexagons. Separately,
the service areas were created in order to evaluate the level of accessibility of INSE at the city level. The
generated layer was spatially joined with informal settlements layer. The GIS intersection process was also
done followed by union of the resulting layers which were later classified as shown in results section.
Figure 19: A road network dataset with walk support covering an INSE
The road segments were chosen as impedance for service area calculation. Using GIS network analyst
tool, a service area analysis was calculated and the attribute table obtained summarised as per minutes of
travel per road segment. The table was exported to MS Excel as a database file and statistical analysis
followed with graphs and charts generated as outputs. The service area was classified and intersected with
INSE layer and maps were generated. From this analysis, it is possible to identify how much land or how
many people are within a given contour for instance, 10,000 people can access roads within 10 minutes
from their homes. The same approach was adopted for calculating the accessibility of INSE to industries
or market centres but the former were used as origins and the latter as destinations. The analysis maps and
statistical charts were created as shown in the results section.
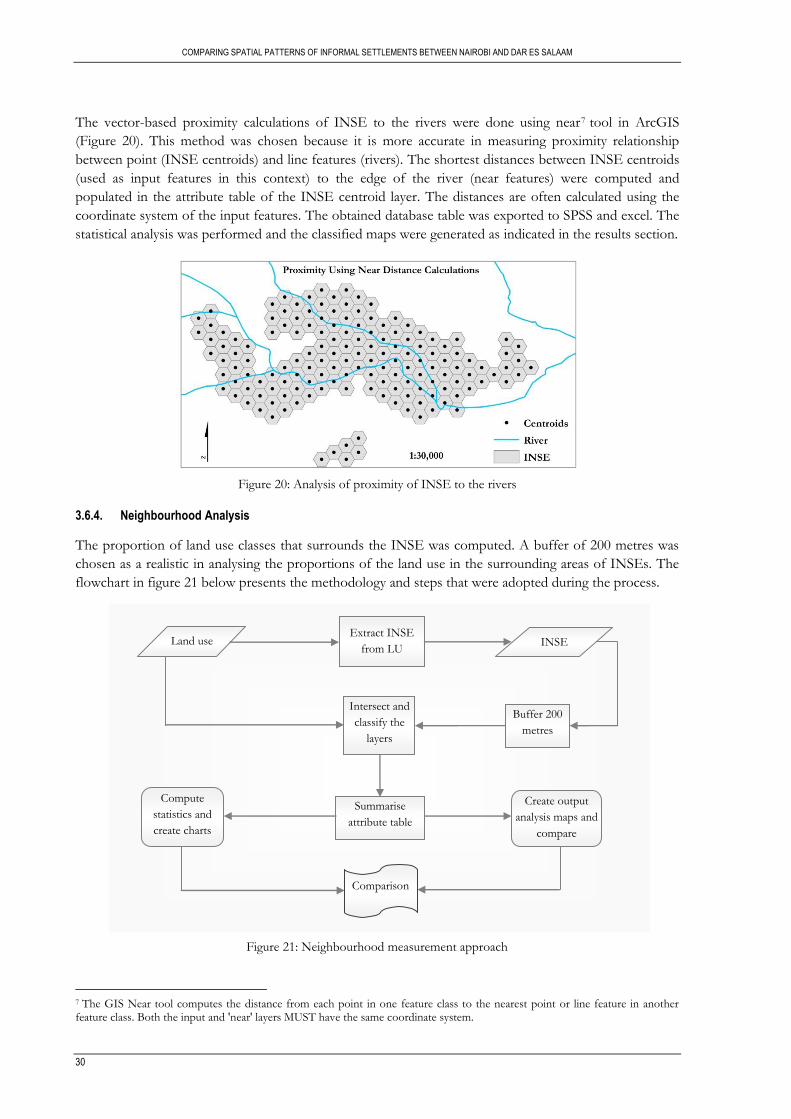
COMPARING SPATIAL PATTERNS OF INFORMAL SETTLEMENTS BETWEEN NAIROBI AND DAR ES SALAAM
30
The vector-based proximity calculations of INSE to the rivers were done using near7 tool in ArcGIS
(Figure 20). This method was chosen because it is more accurate in measuring proximity relationship
between point (INSE centroids) and line features (rivers). The shortest distances between INSE centroids
(used as input features in this context) to the edge of the river (near features) were computed and
populated in the attribute table of the INSE centroid layer. The distances are often calculated using the
coordinate system of the input features. The obtained database table was exported to SPSS and excel. The
statistical analysis was performed and the classified maps were generated as indicated in the results section.
Figure 20: Analysis of proximity of INSE to the rivers
3.6.4. Neighbourhood Analysis
The proportion of land use classes that surrounds the INSE was computed. A buffer of 200 metres was
chosen as a realistic in analysing the proportions of the land use in the surrounding areas of INSEs. The
flowchart in figure 21 below presents the methodology and steps that were adopted during the process.
Figure 21: Neighbourhood measurement approach
7 The GIS Near tool computes the distance from each point in one feature class to the nearest point or line feature in another feature class. Both the input and 'near' layers MUST have the same coordinate system.
Land use INSE
Intersect and
classify the
layers
Compute
statistics and
create charts
Extract INSE
from LU
Buffer 200
metres
Summarise
attribute table
Create output
analysis maps and
compare
Comparison

COMPARING SPATIAL PATTERNS OF INFORMAL SETTLEMENTS BETWEEN NAIROBI AND DAR ES SALAAM
31
The process of analysing the surrounding landuse in the INSE was carried out as described in figure 21.
Further, the overlay analysis was done whereby INSE layer was erased using the buffer as the input layer.
The resulting output layer was then intersected with landuse data and thereafter classification done on the
resulting output (figure 21). Thereafter, the statistical analysis was then done to evaluate the status of the
land use surrounding the INSEs in both cities as indicated in the results section.
3.6.5. The INSE Sites Analysis
The location of INSEs differs from one city to another. The aim of analysing sites is to determine how the
terrain varies from one INSE to another. The raster DEM was used as the input data to generate the slope
from which the terrain was analysed. The flowchart in Figure 22 below shows the overall methodology
adopted in analysing terrain of the INSE sites.
Figure 22: Terrain analysis approach of INSE sites
Slope is referred to as the rate of maximum change in z-value from a raster cell to its surrounding cell. The
diagram in figure 23 below shows a raster slope (classified in degrees) which was generated from a DEM.
Often an INSE located in an area as shown in Figure 23 will have varying slope values. The slope
determines the orientation of building structures within the settlement area and depicts immediate
reflection on the physical and spatial configuration as well as different risk situations that are inherent in
an area.
Figure 23: Generation of slope values from a DEM, Source: (Esri, 2015b)
DEM Generate
Slope
Slope values to
points
INSE
Export dbf
table to SPSS
Slope
Create output
analysis maps
Statistical
analysis
Frequency
charts and
statistics
Generate random
points
Comparison
Number of
points?

COMPARING SPATIAL PATTERNS OF INFORMAL SETTLEMENTS BETWEEN NAIROBI AND DAR ES SALAAM
32
For percent rise in slope, the range is often zero to essentially infinity. As shown in figure 24 below, a flat
surface has a 0% rise in slope whilst a 45 degree surface has a 100 percentage rise in slope. As the INSE
surface becomes more vertical, the percentage rise becomes increasingly larger until it reaches infinity (at
90 degrees rise). Generally, the lower slope values depict a flat terrain whilst the higher slope values are
associated with steep terrain (Figure 24). It is worth noting that the DEM used in this study has a spatial
resolution of 30 metres. Further, in this type of analysis, real surface observations may present more
accurate results as opposed to the results obtained using this kind of dataset (DEM). However, in the
context of this study, this was the highest resolution DEM that was available and it fulfilled the main
objective of the research as well as that of sub-objective one that entails analysing terrain for INSEs sites.
Figure 24: An interpretation of INSE slope values
In this research, a sample of 10% random points was generated covering the entire INSE layer (Figure
25). The aim of generating sample points was to evaluate the changes in slope values in all INSEs in
vector environment. Still, the process was also done for all the sample sites in both cities. It is important
to note that at landscape level, the INSEs exist as different patches which are disjointed from each other
therefore analysing slope values in raster format is a daunting task because each patch need to be stored as
a single layer prior to analysis. Additionally, the slope layer clipped using INSE patch boundary layer since
the area of interest is within the informal settlements and not the entire city. This approach of generating
random points proved to ideal in the context of required output and analysis. Using GIS overlay
operations; the slope values (degrees) were transferred to the random point layer and populated as dbf file
prior to statistical analysis. The slope layer was generated as a percentage as well as in degrees. The slope
values obtained were populated in the attribute of the point layer (Figure 22). A similar approach was
adopted in both Nairobi and Dar es Salaam cities. The analysis maps and statistical charts were generated
as shown in Figure 22 and comparison followed thereafter.
Figure 25: An illustration of random points on INSE site overlaid on the slope layer

COMPARING SPATIAL PATTERNS OF INFORMAL SETTLEMENTS BETWEEN NAIROBI AND DAR ES SALAAM
33
3.7. Settlement and Object Level Analysis
The morphology of INSE was analysed at settlement and object levels as shown in figure 26. At these
levels, the additional details of INSE analysis were derived using spatial statistical approaches and spatial
metrics as discussed by Kohli et al. (2012). As discussed in previous sections, the main focus is to achieve
robust and comparable results since both cities differ in terms of location, size and population size.
However, a number of parameters and indicators were used including the size, shape, pattern and density
of INSEs. The FRAGSTATS and Patch Analyst software packages were used to explicitly calculate and
measure the metrics that depict compactness, pattern, fragmentation, ratio of open space; and
heterogeneity values of INSEs. As indicated in Figure 26, a similar approach incorporating data (INSE,
buildings, roads), methods, and analysis was applied on both cities hence ensuring robust comparison
results.
Figure 26: The methodology used in settlement and object level analysis
INSE_All
Selection of the
sample sites
Roads_All
Intersect the layers
(GIS overlay)
Spatial statistical analysis
(Size, density, shape, pattern
and HI values)
Buildings_All
Comparison
Convert SHP to KML and
export to Google earth;
Nairobi City Dar es Salaam
INSE_E Roads_E Buildings_E
Sample sites
Roads_S Buildings_S
Capture new
buildings on
Google earth
Road connectivity
analysis (density,
nodes, links)
Results in Nairobi city
Results in Dar es Salaam
Rasterize
Perform visual checks and
editing; convert to GDB
KEY: INSE_E: edited informal settlements Roads_S: roads in sample sites Buildings_S: buildings in sample sites
Buildings_E: edited buildings Roads_E: edited roads

COMPARING SPATIAL PATTERNS OF INFORMAL SETTLEMENTS BETWEEN NAIROBI AND DAR ES SALAAM
34
As depicted in figure 25, morphological analysis was done using INSEs, buildings and roads as input data.
The initial stage involved GIS data conversion to KML format and later exporting it to Google earth for
checks and editing. After that, the data layers were converted back to GIS layers and stored in a
geodatabase. During the analysis and comparison of the patterns of INSEs in both cities, five sample sites
(clusters) had been selected in each city as described in section 3.8.1 (also in figure 26).
At settlement level, the metrics that were computed include mean shape index, patch size, patch density,
open space ratio and aggregation index. Similarly, at object level, most of the aforementioned metrics were
also adopted but the analysis was mainly on individual buildings as opposed to the entire settlements. In
addition to using above metrics at object level, the orientation of buildings were analysed at each sample
site together with the roads connectivity. From the practical standpoint, capturing buildings for the entire
city (especially Dar es Salaam) was infeasible hence the approach of using sample sites deemed fit.
The analysis of roads connectivity within the sample sites was also done where the analysis focused on the
number of edges, nodes and total road lengths (Patarasuk, 2013) . Based on these variables, various indices
were calculated to characterise all aspects of connectivity of the road network. The aspects such as
circuitry (α), complexity (β) and connectivity (γ) were also established using relevant formulas given below.
α = ((L-V)+1)/(2V-5)
β = L/V
γ = L/(3*(V-2))
Where, L is the number of links and V is the number of nodes (Patarasuk, 2013). For instance, as shown
in figure 27, the number of links (L) is 15 whilst the number of nodes (V) is 8.
Figure 27: An illustration of road links and nodes using graph theory
The concept of alpha, beta and gamma is based on graph theory (figure 27). A graph in this context is
made up of vertices (nodes) and lines (edges) that connect them. A graph can be directed from one node
to another or undirected, meaning lack of distinction between two nodes associated with each edge. The
alpha (α) index measures the circuitry of a road network that is, the number of complete cycles in a
network. The index ranges from 0 (0%) to 1 (100%). The beta (β) index reflects both the complexity and
completeness of a road network (Patarasuk, 2013). This is done by expressing the ratio of links to nodes.
When β < 1 then it implies that the network is disconnected; β = 1 a single circuit; β > 1 indicates a
greater of the road network connectivity in an area. The gamma (γ) index values were also computed as
shown in table 8. This index measures the extent to which the nodes are connected. It is also a ratio of
links and nodes and its value ranges from 0 to 1 (Patarasuk, 2013). Gamma is independent of the number
of nodes within the road network. Often a value of 1 denotes a completely connected road network whilst
0 indicates lack of connectivity. All these indices are important in understanding and comparing the INSE
road connectivity in both cities.
(2)
(1)
(3)

COMPARING SPATIAL PATTERNS OF INFORMAL SETTLEMENTS BETWEEN NAIROBI AND DAR ES SALAAM
35
3.7.1. Selection of Sample Sites
A sample of sites for analysing INSE patterns were selected in both cities. The selection of five sites was
done by considering different physical and location aspects. These include: sites on steep slopes, along the
road or railway, along the river, close to CBD and the sites close to industrial area. The maps were created
that give a detailed illustration of the location of the sites (appendices 3 and 4). As indicated in previous
section, some field observations were done by general observations on the buildings (type, height, roofing
material, walls, size and shape) as well as roads (width and surface type) within each settlement. The
sample site S1 in Nairobi was chosen considering its location a long major road (figure 28). The site S2 is
located close to CBD. The site S3 is located along a major river while the site S4 is located along the railway
line. Lastly, site S5 is located on the area with steep slopes (Appendix 3 and 4). The logic of selecting these
sites was based on the general morphology and location characteristics of the settlement at the city level.
For comparison purposes, a similar criteria of selecting the sites was applied in the city of Dar es Salaam.
Figure 28: Mathare sample site in Nairobi showing clusters of buildings
3.7.2. The Selection of Spatial Metrics
A set of spatial metrics with the potential to analyse the morphology of INSE (size, shape, density and
pattern) were selected based on a review of existing literature and previous work e.g. (Kuffer et al., 2014;
Herold, Couclelis, & Clarke, 2005; Martin Herold, XiaoHang Liu, 2003). The initial step involved
analysing metrics in Table 1 according to their ability to show clear distinction in morphology between the
two cities. As stated earlier, the five sample sites were used for this purpose. Further, all metrics were
calculated for samples sites in Nairobi and Dar es Salaam. Some of the metrics that correlate (e.g.
perimeter-area ratio, fractal dimension and mean shape index) were eliminated while shape index was
adopted for quantification of shapes of INSE patches. Some of the metrics that do not show clear
distinction in morphology were excluded as well. The spatial metrics were calculated using FRAGSTATS
and Patch Analyst. Some formulas for the metrics used in the research are described below. What is
crucial; however, are the numerical values of the indices obtained and their interpretation. The difference
between population and sample formulas is insignificant when the number of patches are large e.g., >30
(McGarigal & Marks, 1994).
The Mean Patch Size (MPS) is the average size of the patches that make up the landscape. This metric was
used to analyse the size of the patches of settlements and those of building structures (Equation 4).
Where, a is the total sum of the area of all patches and n is the sum of the patches in the landscape.
(4)

COMPARING SPATIAL PATTERNS OF INFORMAL SETTLEMENTS BETWEEN NAIROBI AND DAR ES SALAAM
36
The Patch Density (PD) is expressed as the total number of patches (n) per area in hectares (A). It reflects
both the amount of INSE and building patches present i.e. their composition as well as their configuration
on the landscape. The PD was computed using the formula in equation 5.
The Mean Shape Index (MSI) is the sum of each patch's perimeter divided by the square root of patch area
(in hectares) for each class (when analysis is done by class) or all patches (when analysis is done by
landscape), then modified for circular standard (often for polygons), or square standard (often for raster
data or grid), divided by the number of patches (CNFER, 2012). The MSI is used to measure the degree
of irregularity hence complexity of the INSE and buildings patches. MSI was computed using Patch
Analyst at class level and at the landscape level.
Pi is the proportion of the landscape occupied by the patch type of class i and m is the number of patch
types i.e. classes in the landscape while a is the area in m2 of patch ij.
The Average nearest neighbour (ANN) distance tool computes the Euclidean distance between each building
centroid and its nearest neighbour location (equations 7 below). In essence, ANN is the average of these
distances in entire study area. The ANN was computed in each sample site using ArcGIS software. The
main of computing ANN index was to determine whether the buildings in each sample site are clustered
or dispersed.
Where, and
Where, Do is the observed mean distance, DE is the expected mean distance, di is the distance between
feature i and its nearest neighbouring feature; m is the total number of patches.
The Shannon Evenness Index (SEI) measures patch distribution and abundance using equation 8. In equation
8, Pi is the proportion of the landscape occupied by the patch type of class i and m is the number of patch
types i.e. classes in the landscape. In this study, SEI was used to quantify the pattern of the INSEs as well
as those of the buildings.
The Shannon Diversity Index (SDI) measures the INSE patch diversity in a landscape. Equation 9 shows the
formula used to calculate SDI. The variables Pi, i and m have been defined above.
The set of spatial metrics that have described above were computed using both the FRAGSTATS and Patch Analyst software. The calculation of the metrics was done in each city and thereafter their comparison. The results are presented in the subsequent sections.
(6)
(5)
(7)
(9)
(8)

COMPARING SPATIAL PATTERNS OF INFORMAL SETTLEMENTS BETWEEN NAIROBI AND DAR ES SALAAM
37
4. RESULTS AND DISCUSSION
4.1. Introduction
This chapter addresses three main issues namely: comparison INSE location and morphology; road
connectivity index values and comparison matrix. The results are presented using GIS analysis maps,
statistical tables, bar charts and histograms. However, the main challenge was the fact that the INSEs in
Dar es Salaam cover a great spatial extent compared to those in Nairobi hence comparability of results
using maps and statistical charts was strenuous to achieve. This is because for a good and meaningful
comparison, the maps for instance, have to be standardised using the same scale; the quantitative results
have to be at the same intervals for both cities and so on. Therefore, the subsequent sections in this
chapter present the results obtained at landscape, settlement and object levels of analysis as well as the
discussion and argumentation.
As discussed earlier, informal settlements are associated with small building sizes, high densities (more
than 80%) and lack of public (green) spaces (Kuffer et al., 2014). Figure 29 shows some of these
characteristics. Generally, the analysis that was carried out measures the ratio of open space, the building
size and density, accessibility among other indicators. A point worth noting is that, some assumptions
were made during analysis stage especially at object level. For instance, the results obtained from the
sample sites e.g. the building size and shape reflect the characteristics of the entire city and the results are
not limited to those sample sites only. As discussed in the previous section, the criteria used in selecting
the sample sites from different parts of both cities was based on a number of locational and physical
factors such as proximity to CBD, the rivers, steep slopes and so on. This deemed fit since these are the
main drivers of INSEs development. For instance, the density of those INSEs which are close to CBD is
far much higher (e.g. Kibera in Nairobi) than those located on steep slopes (e.g. Kimara in Dar es Salaam)
as depicted in figure 29.
Figure 29: The INSEs in (a) Nairobi and (b) Dar es Salaam, Source: (Google Earth, 2015)
(a) (b)
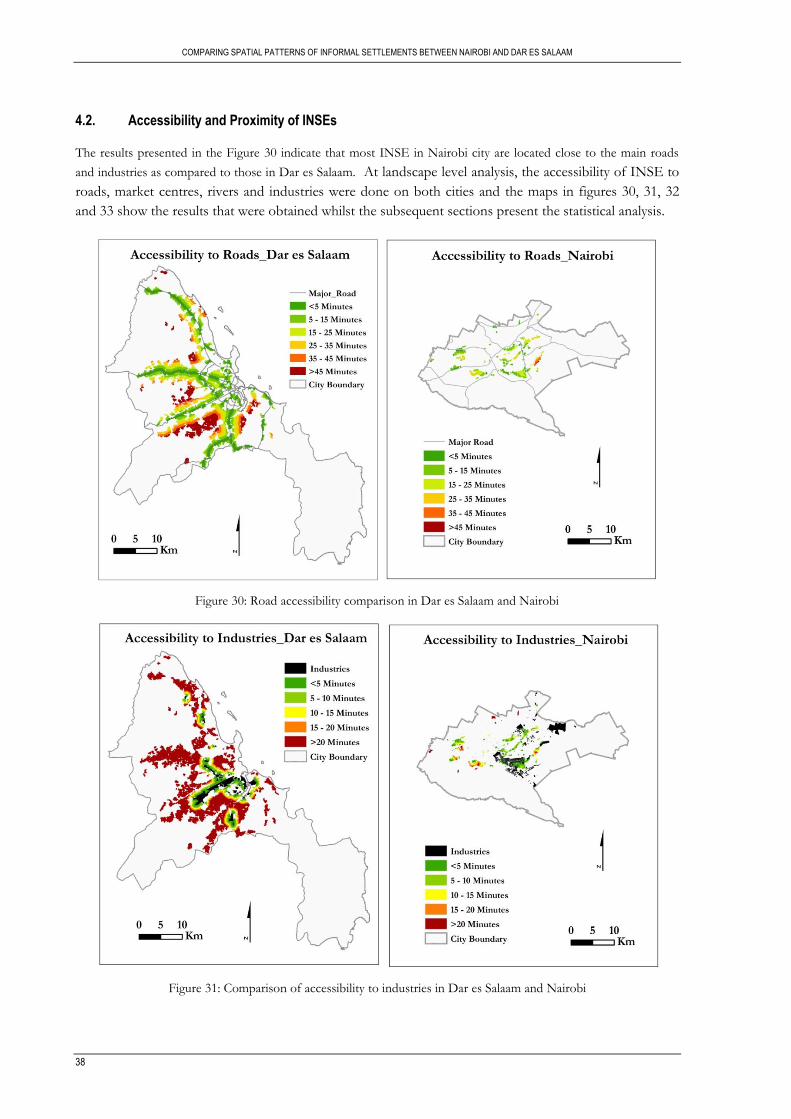
COMPARING SPATIAL PATTERNS OF INFORMAL SETTLEMENTS BETWEEN NAIROBI AND DAR ES SALAAM
38
4.2. Accessibility and Proximity of INSEs
The results presented in the Figure 30 indicate that most INSE in Nairobi city are located close to the main roads
and industries as compared to those in Dar es Salaam. At landscape level analysis, the accessibility of INSE to
roads, market centres, rivers and industries were done on both cities and the maps in figures 30, 31, 32
and 33 show the results that were obtained whilst the subsequent sections present the statistical analysis.
Figure 30: Road accessibility comparison in Dar es Salaam and Nairobi
Figure 31: Comparison of accessibility to industries in Dar es Salaam and Nairobi

COMPARING SPATIAL PATTERNS OF INFORMAL SETTLEMENTS BETWEEN NAIROBI AND DAR ES SALAAM
39
Figure 32: Market centre accessibility comparison in Dar es Salaam and Nairobi
Figure 33: Proximity to rivers comparison in Dar es Salaam and Nairobi
4.3. The Scale Factor and Standardisation
During creation of analysis maps and comparison, a same scale was adopted for realistic comparison of
the results. As indicated in the figures 30 to 33 above, the spatial extent of Nairobi is less compared to
that of Dar es Salaam. The size of patches in Nairobi is far much less compared to those of Dar es Salaam
which are large and predominant. Using a similar scale and intervals comes in handy and is prelude
especially in ensuring comparability of the results. The INSE areas were also standardised as percentages.

COMPARING SPATIAL PATTERNS OF INFORMAL SETTLEMENTS BETWEEN NAIROBI AND DAR ES SALAAM
40
4.4. Accessibility Comparison Statistics
The accessibility to roads, market centres, rivers and industries varies across Nairobi and Dar es Salaam
cities. The INSEs in Dar es Salaam occupy more surface area than those of Nairobi. As depicted in the
figure above, the INSEs in Dar es Salaam have large continuous patches than those in Nairobi.
Figure 34: Graphs showing accessibility to roads in (a) Nairobi and (b) Dar es Salaam
Figure 35: A graph showing comparison of accessibility to roads
As indicated in the figures 34 and 35 above, more INSE area (65%) in Nairobi is accessed within 10
minutes of walking as compared to that in Dar es Salaam 48%. The same situation is evident at 20 minutes
walking time although less area covered at 26% and 14% respectively. This is an indication that at average,
people living in Nairobi INSEs can access the road network faster compared to those living in Dar es
Salaam INSEs. The fact that a greater percentage of INSEs is accessed in Nairobi in less than 10 minutes
is also an indication that they are located close to the roads compared to those in Dar es Salaam.
Figure 36: Graphs showing accessibility to industries in (a) Nairobi and (b) Dar es Salaam
(a) (b)
(a) (b)

COMPARING SPATIAL PATTERNS OF INFORMAL SETTLEMENTS BETWEEN NAIROBI AND DAR ES SALAAM
41
Figure 37: A graph showing comparison of accessibility to industries
The accessibility from INSEs to industries in both cities also varies (figures 36 and 37). At less than 5
minutes, 45% of INSE area can access industries in Nairobi compared to 10% of Dar es Salaam INSE
area. The fact that industries in Nairobi are more accessible does not only imply that those INSEs are
more connected with the roads. It is just an indication that the INSEs are closer to the industries. This
means that it is not only the road network that contributes to the overall accessibility but also other factors
such as number of industries and their relative location to the INSEs. This leads to an inference that a
greater percentage of the INSEs in Nairobi are located close to industries more so those that lie within 10
minutes walking time as depicted in figure 36a. A greater percentage of INSE in Dar es Salaam (>70%)
cannot access industries within 20 minutes because the industries are mainly located close to the CBD.
Another important factor exemplified in the figures above and need to be taken into consideration is the
spatial extent of INSEs in both cities. That is, the INSEs patches in Dar es Salaam are large and cover
extensive area than those in Nairobi which have small and fragmented patches.
Figure 38: Graphs showing accessibility to market centres in (a) Nairobi and (b) Dar es Salaam
Figure 39: A graphs showing a comparison of accessibility to market centres
(a) (b)

COMPARING SPATIAL PATTERNS OF INFORMAL SETTLEMENTS BETWEEN NAIROBI AND DAR ES SALAAM
42
The accessibility to market centres also varies across the INSEs in Nairobi (figure 38a) and those in Dar es
Salaam (figure 38b). During the analysis, the market centres were used as places of opportunities
(destinations) whilst the INSE centroids were used as places of supply (origins). The accessibility to
markets was computed and results are presented in figures 38 and 39. From these results, the market
centres in Nairobi can be accessed at an average of 43 minutes of walking from the INSEs while those in
Dar es Salaam can be accessed within 80 minutes at average. At less than 20 minutes, 21% of INSE in
Nairobi can access the markets compared to 8% of INSE in Dar es Salaam (figure 39). As stated earlier,
the INSE in Dar es Salaam cover greater spatial extent than those in Nairobi hence there is higher
accessibility in Nairobi than in Dar es Salaam as depicted in figure 38a. The accessibility of market centres
from INSEs is much higher in Nairobi due to the fact the market centres are spread across the city
compared to those in Dar es Salaam which are more confined to the CBD area. This results into less
accessibility especially from those INSEs which are located far from these centres due to the fact that
accessibility is measured to the nearest market centre (figure 39). A greater percentage of INSEs in Dar es
Salaam (38%) can access any market greater than 100 minutes walking time compared to 3% in Nairobi.
4.5. Proximity Comparison Statistics
The proximity of the INSEs to the rivers was computed and results presented in figures 40 and 41. The
river dataset was used as input to calculate the proximity as shown in Figure 20. The INSEs in Nairobi are
located at an average 270 metres from major rivers in Nairobi compared to 470 metres in Dar es Salaam.
Figure 40: Graphs showing proximity to rivers in (a) Nairobi and (b) Dar es Salaam
Figure 41: A graph showing a comparison of proximity to rivers
As depicted in the figures 40 and 41 above, most of the INSEs in Nairobi are located close to the rivers
(less than 100 metres). As the distance increases gradually, the percentage of INSEs close to the rivers also
decreases. The histograms depict a similar pattern in the INSEs of both cities. The location of rivers play a
major role in influencing the development of INSE since in this study, a focus was on major rivers which
(a) (b)

COMPARING SPATIAL PATTERNS OF INFORMAL SETTLEMENTS BETWEEN NAIROBI AND DAR ES SALAAM
43
experience natural hazards such as flooding. Again, the presence of riparian reserves acts as a driver for
INSE development since they are normally vacant and development of buildings is neither allowed nor
feasible in such areas. Furthermore, the growth of the INSEs also depends on the development policies of
a city such as zoning and land use planning. The presence of undeveloped land without restrictions plays a
major role in the development of INSEs. In fact, as depicted in the figure above, a greater percentage of
the INSEs are located within a distance of less than 100 metres from the rivers which is actually the
riparian reserve. The limitation to this kind of approach is that the sizes of the INSEs and the number of
major rivers differ between the two cities hence this makes comparability of results a bit challenging.
4.6. The DEM and Slope Values
As described in the methodology section, the DEM was used as input dataset to generate the slope. The
figure 42 show the result obtained. The lowest and highest elevation points for Nairobi INSEs are 1525
and 1900 metres ASL respectively whilst those in Dar es Salaam are zero and 300 metres ASL. The city of
Dar es Salaam is located close to Indian Ocean that is why it has an average elevation of 55 metres ASL.
Figure 42: The INSE DEM values in Nairobi (a) and Dar es Salaam (b)
As indicated in the figure 42, both histograms are left skewed impling that INSEs elevations in both cities
vary although the presence of crests in Nairobi (1600, 1700 and 1800) indicates some locational pattern.
For Dar es Salaam, there is one elevation crest of approximately 50 metres (figure 42).
Figure 43: The INSE slope values in Nairobi (a) and Dar es Salaam (b)
The slope values depict the changes of elevation from one cell to a neighbouring cell. The figure 43 shows
that the average slope value for Nairobi INSE is 12% which is equivalent to 5 degrees rise while that of
(a) (b)
(a) (b)

COMPARING SPATIAL PATTERNS OF INFORMAL SETTLEMENTS BETWEEN NAIROBI AND DAR ES SALAAM
44
Dar es Salaam is 14% (or 6 degrees rise). This is a clear indication that most of the INSEs are located on
gentle slopes although some of the INSEs in Dar es Salaam are located on very steep slopes with values of
more than 350% (greater than 45 degrees) especially in Kimara site. The slope values are different in
Nairobi INSEs where the maximum value is 53% (24 degrees). Unlike Nairobi where a greater percentage
of INSEs exhibit slope ranges of between 0 to 12 degrees, those in Dar es Salaam differ with a range of
between 0 to 23 degrees. Furthermore, the most frequent slope value for Nairobi INSEs is 10% compared
to 4% for Dar es Salaam since most of its area is located close to the ocean where the slope is gentle.
4.7. Neighbourhood Characteristics
The proportion of the land use within a buffer of 200 metres from the INSEs in both cities was analysed.
The results are presented in the figure 44. A greater proportion of land use within the INSE environs is
residential (52% in Nairobi) and (64% in Dar es Salaam). The fact that INSEs are areas of residence for
low income earners is a clear indication of a relationship that exist between those areas zoned as
residential and the informal settlements. Arguably, another probable reason is that often INSEs develop in
areas that are vacant and are in close proximity to already built up areas. Still, some INSEs develop within
residential areas as pockets of unplanned settlements. Nairobi city is notable for numerous small pockets
of these settlements some of which are located along the major roads or riparian reserves as elongated
strips. Nearly all the land in Nairobi city has been surveyed and a small percentage of vacant land exists.
The lack of undeveloped land and presence of strict zoning regulations prohibits such developments.
The location of INSE depends on a number of physical and socioeconomic factors. From the figure 44
below, educational (10% in Nairobi) and industries (9% in Nairobi) also play a role in influencing the
location of INSEs. Unlike industries which attract people due to job opportunities, learning institutions
are normally built within the INSEs as social facilities. In Dar es Salaam, there is nearly 10% of
undeveloped land within INSE environs compared to 7% in Nairobi. The presence of vacant land also
acts as a pull to the development of such settlements. For transportation, approximately 5% of the area is
occupied by the INSEs in both cities. This is yet another indication that either some INSE are located on
the road reserves or the settlements fall within the buffer zone of 200 metres from the road centrelines.
However, this does not necessarily imply that they are located along the road reserves because some
INSEs may be located within a distance of 100 metres, 150 metres and so on from the roads. Another
important land use is commercial and market centres which also offer many opportunities such as jobs
that attract the development of INSEs. As well, they act as places where the residents meet to buy or sell
their commodities. In a nutshell, the results obtained exemplify the fact that residential is the dominant
land use in INSE environs in Nairobi and Dar es Salaam.
Figure 44: Proportions of land use in INSE environs

COMPARING SPATIAL PATTERNS OF INFORMAL SETTLEMENTS BETWEEN NAIROBI AND DAR ES SALAAM
45
4.8. Settlement Level Metrics
A number of metrics were computed at settlement level for all INSEs. The settlement Mean Shape Index
(MSI) was calculated and results are shown in figure 45. Often the shape of a spatial object is a complex
indicator in terms of precise measurement and quantification using the spatial metrics (McGarigal et al.,
2012). The shape index (SI) metrics measures the overall geometric complexity of the patches on a
landscape. It provides a standardised measure of the observed perimeter of all patches verses the
perimeter of a compact patch of similar size and category (Taubenböck, Wegmann, Roth, Mehl, & Dech,
2009b). In this study, the MSI values were measured at class and landscape levels (Taubenböck et al.,
2009b). As shown in the figure 45 below and corresponding SI values, the INSEs in Dar es Salaam have
more complex shapes than those of Nairobi. There is comparability problem as MSI values often vary
with the size of the patch.
Figure 45: The Mean Shape Index of INSEs in Nairobi and Dar es Salaam cities

COMPARING SPATIAL PATTERNS OF INFORMAL SETTLEMENTS BETWEEN NAIROBI AND DAR ES SALAAM
46
The next step entailed establishing the minimum, maximum and mean MSI values and their associated
shapes as depicted in table 2. The shape index indicates the irregularity of settlement patches. It equals 1
for circular or square features and as the shape of INSE becomes more irregular, the MSI increases
gradually as depicted in table 2. However, a point worth noting is that if the shape of any patch is held
constant, then an increase in patch size will always cause a decrease in the MSI value.
Table 2: The MSI values of the two cities
Shape Index Nairobi City Dar es Salaam City
a. Mean SI value
1.78
1.86
b. Maximum SI value and shape
5.77
7.00
c. Minimum SI value and shape
1.09
1.05
The MSI in Nairobi INSEs is 1.78 while that of Dar es Salaam is 1.86 (table 2) hence higher values of SI
are associated with more complex shapes. The highest MSI in Nairobi is associated with elongated shapes.
The maximum MSI in Nairobi is associated with INSEs which are sandwiched along the road or riparian
reserves whilst in Dar es Salaam the maximum MSI is for those settlements located on steep slopes where
the terrain is rugged. Those INSEs with smaller MSI have simpler shapes and are often small in size.
The Mean Patch Size: Whereas the mean patch size for Nairobi INSEs is 6 ha with largest patch size of 49
ha; in Dar es Salaam, the mean patch size is 76 ha with the largest patch having an area of 1978 ha. The
INSEs in Nairobi exist as small patches with high density in terms of roof coverage. The INSEs in Dar es
Salaam exist as continuous blocks and are widespread hence covering larger spatial extent. The Patch
Density was also computed at settlement level. The patch density of the INSEs in Nairobi is 183 compared
to 228 in Dar es Salaam. This indicates that there are more patches in Dar es Salaam than Nairobi. The
reason is that the city of Dar es Salaam covers more extensive area than Nairobi although the mean patch
size for Dar es Salaam is 76ha whilst that of Nairobi is 49ha. The PD varies because the area in Dar es
Salaam is larger compared to that in Nairobi although it is factual that Nairobi has smaller patch sizes.
Percentage Coverage: The average land coverage for settlements in Nairobi is 2% while that in Dar es Salaam
is 12%. One of the probable reasons of higher percentage value in Dar e Salaam is that a greater
percentage of land use is agricultural hence unoccupied (figure 15); this aggregate area was factored in
during the computation of percentages. The same case applies to Nairobi with a large junk of forest land
(figure 15). Shannon Evenness Index was also calculated at settlement level. Often the SEI index ranges from
0 to 1 with the value 0 depicting only 1 patch on the landscape while value 1 depicts a perfect distribution
of area among the patches within the landscape. SEI for Nairobi is 0.814 while that of Dar es Salaam is
0.703 implying that the INSE in Nairobi with SEI values approaching 1 are more even with perfect
distribution of the area than those in Dar es Salaam which have less SEI value.

COMPARING SPATIAL PATTERNS OF INFORMAL SETTLEMENTS BETWEEN NAIROBI AND DAR ES SALAAM
47
4.9. Object Level Metrics
4.9.1. Introduction
The objects in the context of this study refer to the buildings and the roads. Generally, a building is
defined as any structure with a roof and walls. A building can be permanent, semi-permanent or a
temporary structure. Using satellite images, buildings within an INSE can be identified using their roofs
but it is impossible to observe the walls of such buildings from an image. The images can also be used to
provide indicators e.g. pattern which in turn helps in distinguishing formal and informal settlements. The
building sizes in an INSE often vary. One of the major characteristics of such buildings is that they
consist of rectangular shapes with small sizes of mean area of 50 m2. However, some of the buildings have
larger sizes of more than 100 m2 especially in Nairobi where the INSE consist of commercial entities with
tenant-landlord agreements. In Dar es Salaam, there is absolute ownership of the buildings by the
developer hence most of them accommodate different family sizes. Another point worth noting is that
not all buildings in Nairobi INSEs have latrines hence these facilities are shared amongst the residents.
Although they are visible on the image, identifying these small objects in some cases is quite challenging.
In this study, the buildings were captured from recent satellite images of 60 cm spatial resolution. The
buildings with areas of more than 10 m2 were captured. The area of 10 m2 was set as a minimum threshold
since most objects less than 10 m2 may not be necessarily buildings. They can either be sheds, vehicles or
other temporary structures. However, there are errors of omissions and commissions due to the fact that
capturing buildings from the satellite images depends on the level of one's visual image interpretation
skills. Within an INSE, there is often a mixture of building types with varying heights, sizes and shapes.
All the buildings in the INSEs were captured regardless of their sizes but the minimum threshold area was
maintained. As described in the subsequent sections, a number of spatial metrics were used to analyse the
building characteristics including the size, shape, density, pattern and building to building distance.
The road network connectivity was also analysed. The classification of roads differs from one city to
another. In Kenya, the roads are classified starting from class A to class E. These classes were described in
the data and methodology section. The roads dataset obtained for the city of Dar es Salaam has the roads
categorised from class 1, class 2, class 3 and so on. In both cases, the roads can also be categorised as
either major or minor roads. In the context of this research, the main focus was on INSE roads most of
which are not motorable hence better described as walking paths or pedestrian paths. But the term 'road'
shall be used to refer to all types of roads within the INSE including those used by vehicles and walking
paths for pedestrians as long as they can be discerned from a satellite image. Most of these roads have
unpaved surfaces with narrow widths ranging from 3 to 5 metres although some roads have the widths of
up to 10 metres. The assumption made in this perspective is that, people who live in the INSEs do not
own vehicles hence they often access their houses by walking using road network links. Separately, in this
study, visual image interpretation was employed to capture all the roads within the settlements from VHR
satellite imagery. The subsequent section presents the road network connectivity results (circuitry,
complexity, and connectivity). The density of the roads was also analysed in each sample site.
4.9.2. Building Characteristics
At the object level, analysis was done on the building sizes, shapes, densities and patterns within each of
the five INSE sample sites in both cities. As described in preceding sections, the buildings were captured
from VHR satellite imagery using visual interpretation techniques. The results that are drawn from the
entire sample sites in each city are used as a representative of morphological characteristics of the INSE
buildings in that city. The analogy used is that, the INSE buildings in any given locality often tend to
exhibit similar characteristics. The results obtained are described in subsequent sections.

COMPARING SPATIAL PATTERNS OF INFORMAL SETTLEMENTS BETWEEN NAIROBI AND DAR ES SALAAM
48
The Building Mean Size: The mean size of buildings in the 5 sample sites were computed using ArcGIS. A
sum of areas of all buildings per sample site was calculated and the result divided by the total number of
buildings to obtain the mean area (MA). The results are presented in table 3 and figure 46 below. The
radar charts are used to spatially visualise the comparison of morphological characteristics of the buildings.
Table 3: The statistics for the buildings in the 5 sites
Nairobi Dar es Salaam
Sample Site S1 S2 S3 S4 S5 S1 S2 S3 S4 S5
Min Area (m2 ) Max Area (m2 ) Mean Area (m2 ) Std Dev. (SD) Total Buildings
9 177 47
0.013 1916
12 803 168
0.011 2979
8 537 160
0.010 9748
5 634 92
0.006 8981
14 176 51
0.010 9521
4 713 104
0.009 10623
8 831 62
0.005 4809
5 634 98
0.007 15578
6 812 91
0.006 8253
10 666 70
0.010 77315
The mean areas of the 5 sites were plotted on the radar chart as shown in the figure 46 below. The mean
sizes of buildings in Nairobi vary from site 1 to 5. In Nairobi INSEs, the sites 2 and 3 have the largest
mean area of buildings is at 168 m2 and 160 m2 respectively (figure 46) compared to 104 m2 in Dar es
Salaam. The sites S2 and S3 in Nairobi are located along the major highway and close to market centres
therefore there is the presence of informal commercial buildings. The same case applies to Kinduchi area
(S1) in Dar es Salaam city. However, more than 50% of the buildings exhibit small building sizes of less
than 100 m2 in both cities. Further, the low standard deviation (SD) in all sites in both cities as depicted in
table 3 show that the all building sizes (area) tend to be very close to the mean hence less variation is size.
Figure 46: Diagrams showing a comparison of mean areas of the buildings
The Patch Density: Patch density is a measure of the total number of patches in a given landscape per
hectare. The total number of buildings per a given sample site and their areas were computed and the
results given in table 4 and figure 38.
Table 4: The Patch density of buildings in 5 sites
Nairobi Dar es Salaam
Sample Site S1 S2 S3 S4 S5 S1 S2 S3 S4 S5
Total buildings Site area in (Ha) Patch density Buildings/Ha
1916 42
1916 45
2979 76
2979 39
9748 389
9748 25
8981 229
8981 39
9521 211
9521 45
10623 1266
10623 8
4809 112
4809 43
15578 1143
15578 14
8253 763
8253 11
7315 776
7315 9

COMPARING SPATIAL PATTERNS OF INFORMAL SETTLEMENTS BETWEEN NAIROBI AND DAR ES SALAAM
49
(a) (b)
The sample sites had varying sizes therefore from a practical standpoint, it was imperative also to compute
the total number of buildings per hectare for each site. This was done to make the results comparable
because an inference based on total number of buildings per site alone cannot be a justification of building
densities. This could have been practical if the corresponding sample sites in both cities had same areas.
But since the area is a variant, the total number of buildings per site was used to calculate the building
density using equation 5. Therefore, the total number of buildings per site was divided by the area of
corresponding sample INSE within the site expressed in hectares. The results are presented in the figures
47 (a) and (b). It is clear that nearly all the sites in Dar es Salaam have higher PD compared to Nairobi.
However, when considering the total number of buildings per hectare, all sites in Nairobi have a higher
number of buildings per area (ha) ratio compared to those in Dar es Salaam. This is also an indication that
INSEs in Nairobi have high building density thus are less porous compared to Dar es Salaam.
Figure 47: A comparison of (a) building patch densities (b) buildings per area (hectare)
The Mean Shape Index (MSI): This metric was used in analysing the complexity of building shapes. The MSI
also measures the degree of irregularity of the shapes of the building structures. Different shapes often
have different MSI values. As indicated in the figure 48 below, circular objects have lowest MSI of 1. In
the context of this study, the MSI is a standardized indicator of perimeter-area relationship of the shape of
a building patch. The MSI value increases with increasing patch shape irregularity hence complexity.
Figure 48: An illustration of MSI values for different shapes
The mean shape index and their standard deviations of INSE building structures were calculated for all
the sample sites in each city using Patch Analyst software. The results obtained are presented in the table 5
and figure 49. The MSI values for Nairobi buildings ranges from 1.22 to 1.32 while the range for Dar es
Salaam buildings is 1.20 to 1.39. There are also higher SD values of the MSI values in Dar es Salaam sites
compared to Nairobi. In Dar es Salaam, sample site 5 (Kimara) has the highest SD value of 1.057
compared to site 3 in Nairobi which has SD of 0.179. This is an indication that the buildings in Dar es
Salaam have more complex and irregular shapes than those in Nairobi. This is because the degree of
variability of the MSI values from their mean is high in Dar es Salaam sites as compared to the Nairobi
sites. The results of the MSI and SD values are presented in table 5.

COMPARING SPATIAL PATTERNS OF INFORMAL SETTLEMENTS BETWEEN NAIROBI AND DAR ES SALAAM
50
(a) (b)
Table 5: The MSI of the buildings in 5 sites
Sample Site Nairobi Dar es Salaam
MSI Standard Deviation MSI Standard Deviation
S1 1.225 0.112 1.230 0.314
S2 1.266 0.141 1.313 0.456
S3 1.330 0.179 1.222 0.296
S4 1.244 0.128 1.204 0.265
S5 1.240 0.130 1.386 1.057
The results obtained indicate site 3 in Nairobi has the highest MSI of 1.33 compared to 1.39 for site 5 in
Dar es Salaam (table 5). This indicates that the buildings in Kimara site (Dar es Salaam) and Kawangware
(Nairobi) have the most complex shapes which are not rectangular. The MSI of buildings in all sites in
Nairobi is 1.25 while that of Dar es Salaam is 1.24 (figure 49). Therefore, generally all INSE buildings in
both cities have nearly the same shapes which are rectangular because rectangular shapes have MSI of
1.23. The radar chart in figure 49 shows the comparison of the MSI results graphically. The fact that the
highest MSI in Nairobi is 1.33 and that of Dar es Salaam is 1.39 does not imply that there are no buildings
with higher MSI values. The MSI is the aggregate mean of the shape indices of all buildings within an area
therefore there is a likelihood of buildings with higher MSI values, regardless their quantity in space.
Figure 49: A radar chart showing a comparison of (a) MSI and (b) SD
The standard deviation of MSI is lower for Nairobi buildings compared to those in Dar es Salaam. In fact,
all the sites in Nairobi have low and nearly the same SD hence less variations in the MSI values. The
higher MSI values correspond to large SD values as shown in site 5 in Dar es Salaam.
Shannon Diversity Index (SDI) and Shannon Evenness Index (SEI): The SDI measures the patch diversity in a
landscape while SEI measure patch distribution and abundance.
Table 6: The SDI and SEI values of sample sites
Sample Site Nairobi Dar es Salaam
SDI SEI SDI SEI
S1 7.2251 0.9561 8.9476 0.9652
S2 7.8163 0.9771 7.6587 0.9641
S3 6.9683 0.9749 9.4431 0.9786
S4 8.8448 0.9768 7.9125 0.9779
S5 8.9876 0.9811 6.0449 0.9262

COMPARING SPATIAL PATTERNS OF INFORMAL SETTLEMENTS BETWEEN NAIROBI AND DAR ES SALAAM
51
(a) (b)
The SDI and SEI indices were computed for each sample site at landscape level (table 6). The SDI is
often zero when there is only one patch in the landscape and increases proportionally as the number of
patches increases. The S5 (Mukuru) in Nairobi and S3 (Mbagala Kuu) in Dar es Salaam have the highest
SDI of 8.99 and 9.44 respectively since they cover the largest area hence high diversity in arrangement of
the buildings. In addition, they have complex pattern of buildings which vary. Separately, the highest SEI
in Nairobi is 0.9811 in S5 whilst for Dar es Salaam is 0.9786 in site S3. These sites depict a higher evenness
value hence a perfect distribution of area among the building patches which also show high diversity
compared to other sites. On the other hand, the S1 in Nairobi has lowest SEI value of 0.9561 compared to
Dar es Salaam which has 0.9262 in S5 (figure 50). This indicates that the level of patch evenness varies
from one INSE to another with S1 (Nairobi) and S5 (Dar es Salaam) having less degree of evenness in
buildings' area distribution. Therefore, there is less uniformity in building patterns in site 5 in Dar es
Salaam since it has the lowest SEI value. In conclusion, the SEI value approaches 1 when the area of the
buildings is perfectly even. As the value decreases, then the variability in the building areas becomes high
and patterns less even. Normally, planned areas have higher SEI values than unplanned areas.
Figure 50: A radar chart showing a comparison of (a) SDI and (b) SEI of the buildings
Average nearest Neighbour (ANN): The ANN of buildings in all sample sites was computed and results are
presented in the table 7. The Nearest Neighbour Ratio (NNR) is the ratio between the Observed Mean
Distance (OMD) and the Expected Mean Distance (EMD). The formulas in equation 7 were used to
calculate the ANN values. The NNR measures the degree of clustering or dispersion of the buildings in a
given site.
Table 7: The ANN statistics of the sample sites
Name of the City Site OMD (m) EMD (m) NNR Z-Score P-Value
Nairobi
S1 9.7834 14.5928 0.6704 -27.5985 0
S2 10.1910 10.8138 0.9424 -6.0140 0
S3 11.0505 13.8797 0.7962 -13.9081 0
S4 9.8909 11.8272 0.8363 -28.9832 0
S5 9.4434 15.2170 0.6206 -70.8109 0
Dar es Salaam
S1 16.9200 33.7071 0.5019 -98.1994 0
S2 8.3498 9.3369 0.8943 -15.7407 0
S3 15.1416 20.8229 0.7274 -65.0783 0
S4 14.5949 28.1218 0.5190 -52.6454 0
S5 15.5719 33.2299 0.4686 -86.5677 0

COMPARING SPATIAL PATTERNS OF INFORMAL SETTLEMENTS BETWEEN NAIROBI AND DAR ES SALAAM
52
(a) (b)
The mean of distances for Nairobi is 10 metres while that for Tanzania is 14 metres. Further, The NNR
for Nairobi INSEs buildings is approximately 0.77 while that of Dar es Salaam is 0.62.
Figure 51: A radar chart showing a comparison of (a) OMD and (b) NNR
The difference in NRR appears to be small but very significant. This implies that the degree of clustering
in Nairobi is higher than that in Dar es Salaam. This is depicted in figure 51. The sample site S2 in Dar es
Salaam (Kinondoni) exhibits the lowest OMD value (8.35 metres) basically because it is located in close
proximity to the CBD hence buildings tend to be close to each since the land value is high and INSE
residents tend to occupy any open space so that they are close to job opportunities. This situation is also
exemplified in Nairobi although most of the buildings have OMD of 10 metres which is higher than that
of Kinondoni. The NNR for site S4 (Kibera) in Nairobi is 0.84 which indicates that the buildings are also
clustered (figure 51). Given the z-score of -28.9832, there is a likelihood of less than 1% that this clustered
pattern could be the result of random chance (figure 52).
Figure 52: A normal distribution curve showing nearest neighbour statistics

COMPARING SPATIAL PATTERNS OF INFORMAL SETTLEMENTS BETWEEN NAIROBI AND DAR ES SALAAM
53
4.10. Road Network Connectivity
Road development often aims to improve both social and economic development because they link
places, regions and people. As described in the previous section, the roads incorporate all accessibility
links including walking paths and those used by vehicles. The total number of nodes, edges and total road
lengths for all sites were computed using the formulas that are described in the previous section. The
figure 53 shows an illustration of road connectivity in Mathare INSE. The road connectivity indices were
computed and tabulated as shown in table 8 below.
The study employed the use of graph theory (using alpha, beta and gamma concepts) to measure the level
of road connectivity, circuitry and complexity within the sample sites (Patarasuk, 2013). Table 8: Alpha, beta and gamma indices
Name of the City Sample site L V Alpha (α) Beta (β) Gamma (γ)
Nairobi
S1 9 8 0.18 1.13 0.50
S2 18 15 0.16 1.20 0.46
S3 13 15 -0.04 0.87 0.33
S4 10 11 0 0.91 0.37
S5 78 64 0.12 1.22 0.42
Dar es Salaam
S1 431 180 0.71 2.39 0.81
S2 62 26 0.79 2.38 0.86
S3 146 63 0.69 2.32 0.80
S4 392 193 0.52 2.03 0.68
S5 105 56 0.47 1.88 0.65
The alpha (α) index measures the circuitry of a road network that is, the number of complete cycles in a
network. The index ranges from 0 (0%) to 1 (100%). The average α index for Nairobi INSEs is 0.08 or
8% whilst those in Dar es Salaam have α value of 0.64 or 64%. This indicates high road circuitry in Dar es
Salaam INSEs compared to that in Nairobi. The settlements in Nairobi have high building densities with
little road network coverage; high NRR value and their spatial extend is also smaller compared to Dar es
Salaam hence high level of clustering (table 7). The S3 has negative value of -0.04 which implies that the
sample site either has a very low level of circuitry or a greater number of the nodes are disconnected.
The beta (β) index reflects both the complexity as well as the completeness of a road network (Patarasuk,
2013). This is done by expressing the ratio of links to nodes. When β < 1 then it implies that the network
Figure 53: Road connectivity network in Nairobi's Mathare INSE

COMPARING SPATIAL PATTERNS OF INFORMAL SETTLEMENTS BETWEEN NAIROBI AND DAR ES SALAAM
54
is disconnected; β = 1 a single circuit; β > 1 indicates a greater of the road network connectivity in an area.
The maximum value of β is often 3. This implies that in practical sense there is no any road network
which has a β value of greater than 3 (Patarasuk, 2013). Dar es Salaam INSEs have higher number of links
but less nodes compared to those in Nairobi hence they generally have higher β value. In a situation where
the number of nodes is less than that of the links, then β is less than 0. Further, when the number of links
equals that of nodes, then β equals 1. The average β index value for Dar es Salaam sites is 2.2 whilst that
of Nairobi is 1.06. Therefore, Dar es Salaam INSEs are more connected to inside and have more complex
network than those INSEs in Nairobi which have moderate complexity.
The gamma (γ) index values (table 8) measure the extent to which the nodes are connected. It is also a
ratio of links and nodes and its value ranges from 0 to 1 (Patarasuk, 2013). Gamma is independent of the
number of nodes within the road network. Often a value of 1 denotes a completely connected road
network whilst 0 indicates lack of connectivity. The values of γ evince more or less similar patterns to
those of α and β, depicting greater level of road network connectivity in Dar es Salaam than Nairobi. The
average value of gamma (γ) in Nairobi INSEs is 0.42 compared to 0.76 in Dar es Salaam. This is also an
indication that the INSEs in Dar es Salaam are more connected than those in Nairobi. However, an
important point to note is that the dead-end roads often generate a disproportionate number of nodes as
compared to the number of links in the network hence results in a decrease of the indices. Again,
improved road network connectivity often allows many choices of alternative routes to destinations thus
reducing transportation time as well as the costs. Lastly, the levels of connectivity differ according to the
spatial scale employed as well as the structure of the road network. That is, connectivity at ward level may
differ considerably from that of a district, a city or a province.
4.11. The INSE Comparison Matrix
In this research, one of the objectives was to come up with a comparison matrix to exemplify and
epitomise the locational as well as morphological aspects of the informal settlements. Thus, the overall
goal is to schematise the mean values of the measured parameters in both cities for meaningful
comparability. The values presented in the table 9 indicate the variability in location and morphology of
INSEs between the two cities. However, there are other quantifiable parameters which demystify some
similarities in terms of location and morphology as indicated in table 9. The analysis on locational and
morphological aspects was done at three levels using the spatial and statistical approaches. The importance
of this matrix is to guide the comparison of the similarities and differences of the INSE patterns between
the two cities.
The results obtained in the table clearly demonstrate that there are differences in location and physical
aspects between the two cities. The most dominant land use in the neighbourhood of the INSEs was also
analysed and found to be residential. The main goal was therefore to establish the similarities and
differences in pattern of the informal settlements and whether there are those indicators that influence the
location of such settlements. This is important in evaluating the drivers of INSE growth. From the values
obtained in table 9 above, it can be pointed out that the INSEs each city exhibit different locational and
morphological characteristics as well as patterns. To start with, Nairobi has higher accessibility to roads,
industries and market centres compared to Dar es Salaam. The differences in accessibility vary
considerably although it can be pointed out that the major roads have a greater influence on the location
of informal settlements because of high accessibility values depicted in both cities (figure 30 and 35). This
however does not imply that accessibility is directly proportional to road network connectivity. For
instance, Dar es Salaam has low road accessibility compared to Nairobi but in terms of road network
connectivity, Dar es Salaam has 76% while Nairobi has 42% (table 9). In figure 54 a graphical comparison
of the results at landscape, settlement and object levels is presented.

COMPARING SPATIAL PATTERNS OF INFORMAL SETTLEMENTS BETWEEN NAIROBI AND DAR ES SALAAM
55
Table 9: The INSE Comparison Matrix
Aspect Indicator/Data Parameter Measured Comparison of Mean Values
Nairobi Dar es Salaam
Location
Major Roads Accessibility 13 minutes 23 minutes
Lan
dsc
ap
e
Leve
l Industrial Areas Accessibility 8 minutes 49 minutes
Market Centres Accessibility 10 minutes 95 minutes
Major Rivers Proximity 431 metres 1683 metres
Neighbourhood Land use in the environs Residential Residential
Elevation DEM values 1645 metres ASL 54 metres ASL
Terrain Slope values 12 % (5.4° ) 13 % (5.9°)
Morphology
Settlements
Mean settlement size 6 hectares 76 hectares
Sett
lem
en
t L
eve
l Largest settlement size 49 hectares 1978 hectares
Settlement density (PD) 183 228
Shape of settlement (MSI) 1.78 1.86
Settlement Pattern (SEI) 0.81 0.71
Percentage coverage (%) 2% 12%
Buildings
Building size (MA) 103 m2 85 m2
Ob
ject
Leve
l
Building shape (MSI) 1.25 1.24
Building density (PD) 6629 9316
Buildings per hectare 39 17
Roof coverage (%) 49% 36%
Building pattern (SEI) 0.97 0.96
Building distances (ANN) Building NRR
10 metres 0.77
14 metres 0.62
Road Network
Road Circuitry (α) 0.08 0.64
Road Complexity (β) 1.06 2.20
Road Connectivity (γ) 0.42 0.76
Road density (σ) 0.02 0.05
Whereas Nairobi's INSE network has approximately the same number of links and nodes (table 8), Dar es
Salaam sites have high number of links compared to that of nodes (table 8). The high values of the indices
show that Dar es Salaam INSEs are more connected than Nairobi. By analysing the road density in both
cities, Nairobi has a lower road density of 0.02 compared to 0.05 in Dar es Salaam. An area with high road
network connectivity often has a high road density as depicted in the results obtained from both cities.
That is, Nairobi has low road density and low road connectivity. In contrast, Dar es Salaam has high road
density as well as the road connectivity. To exemplify this fact, unlike the road connectivity which is a
function of the road network links as well as the nodes and how they are distributed within an INSE, road
density is the ratio of the total length of the road coverage and the aggregate area (m2) of the INSE.
Consequently, Nairobi has nearly the same number of road links and the nodes in all the INSEs (figure 53
and table 8) whilst in Dar es Salaam, the number of links are far much more than those of nodes as

COMPARING SPATIAL PATTERNS OF INFORMAL SETTLEMENTS BETWEEN NAIROBI AND DAR ES SALAAM
56
(c)
(b) (a)
depicted in table 8. Hence, from the results obtained, it can be deduced that there is a direct substantial
relationship between road connectivity and road density network in an area.
The INSE road network indices (circuitry, complexity and connectivity) were obtained using objective
graph theory (table 9). The high values of alpha, beta and omega depict high levels of circuitry, complexity
and connectivity respectively of the road network. The results show that even though the total length of
the roads increases, the connectivity does not always do so. Consequently, the high level of accessibility in
an area does not always imply that the area is more connected. The presence of good roads and road
connectivity play a major role in INSE development in a given area owing to the fact that often people use
the roads to access places of opportunities such as schools, health centres, industries and market centres.
It also worth noting that the distance between the locations of INSEs to the places of opportunities plays
a key role in determining the level of accessibility. The mode of transport and availability of a good road
network are also paramount in evaluating accessibility in an area.
Figure 54: Comparative results at (a) landscape, (b) settlement and (c) object levels
For visualization purposes, spider charts were prepared for the three different levels of analysis. The
numerical values were standardised by finding their logarithms to the base 10. This was mainly done to
ensure that the values were within a comparable range. From figure 54 (a), the analysis results at landscape
level indicate that slope values in both cities are nearly the same. Accessibility to roads, industries, market
centres and proximity to rivers is higher in Nairobi than in Dar es Salaam. At settlement level (figure 54
b), the MSI and PD is similar in both cities while the PC, LSS and MSS differ considerably in both cities.
At object level (figure 54 c), the MSI is similar in both cities because buildings exhibit nearly the same
shapes with minimal differences. The MBS, PC, PD and ANN are different in both cities. The percentage
roof coverage (PC) is higher in Nairobi than in Dar es Salam and indicated in the results in table 9.
KEY
AR - Accessibility to rivers
AI - Accessibility to industries
AM - Accessibility to market centres
TS - Terrain slope values
PR - Proximity to rivers
MSS - Mean settlement size
LSS - Largest settlement size
PD - Patch density
PC - Percentage coverage
MSI - Mean shape index
MBS - Mean building size
ANN - Average nearest neighbour distance

COMPARING SPATIAL PATTERNS OF INFORMAL SETTLEMENTS BETWEEN NAIROBI AND DAR ES SALAAM
57
The Buildings sizes in Nairobi have larger sizes (103 m2) than those in Dar es Salaam (85 m2). The main
reason for this is that the houses in Nairobi are large to accommodate more tenants. Again, the INSEs in
Nairobi are more of commercial in the way they have constructed and there is landlord-tenant relationship
as opposed in the case in Dar es Salaam where most land owners in the settlements reside in their own
houses. This is the major reason why the buildings in Nairobi have high roof coverage and small distances
from one building to another. Therefore, in such settlements, middle income and middle-high income are
well protected against forced eviction, because of their political influence and capacity to regularise the
situation. Further, the land tenure and ownership in any given city is often one of the major contributing
factors that determine the type of informality in an area i.e. low, medium or high density (figure 55). The
land ownership in Dar es Salaam city is communal as opposed to private ownership in Nairobi city. In
conclusion, the results demonstrate that there are locational and morphological aspects which are similar
in both cities while others are different. By applying and extending the same methodology to other cities
in different countries which are faced with INSEs challenges; will aid in the development of a global
INSE comparison matrix with both locational and physical aspects of the informal settlements. This will
create a holistic understanding about their growth and proliferation as well as their policy implications.
4.12. Policy Implications of the Results
The growth of INSEs are caused by rapid urbanisation, failure of the formal systems to provide surveyed
and serviced land, easy access to land in informal areas and unfavourable land use planning policies. The
location of rivers and roads has an influence on the development of INSEs because often, rivers and
roads have riparian and road reserves respectively and people tend to construct illegal structures along the
roads and rivers regardless of the risks posed such as flooding and health risks. This situation is a major
challenge more so in Nairobi city because of weak institutional and urban planning policies regarding
conservation of riparian and road reserves. There is also lack of continuous monitoring of the reserves.
In Tanzania, Human Settlements Development Policy, 2000 addresses planning and building regulations
while the Land Policy 1997 (second issue) deals with land ownership and regulations. Kenya's Session
Paper No. 3 of 2009 national land policy recognises land use planning as an essential tool in sustainable
management of land utilisation. Clear legislative and administrative legal frameworks need to be
established within these policies to oversee the regularisation and management of the INSEs.
Some INSEs are located on risky areas such as flooding zones hence appropriate mechanisms need to be
put in place so that people living in such areas are relocated are resettled in safer places. As well, the
process of regularising the INSEs that are found on public or community lands also need to be facilitated
so that there is proper upgrading and development. There should be laws that recognise the presence of
INSEs and residents should have informal titles to reduce the high frequent rate of evictions by private
developers from the INSEs. The list of all INSEs within a city, their precise locations and details of the
owners is also important. Unlike Dar es Salaam where a small percentage of land has been surveyed, more
than 85% of land in Nairobi has been surveyed and have title deeds (Lamba, 2005). The large informal
settlement sizes in Dar es Salaam are also indicative of a poorly planned city in comparison to Nairobi.
The presence of a clear legal framework in ensuring that vacant land is transferred to the people living in
INSEs is vital. The establishment of a legal mechanism for eviction based on internationally recognised
guidelines should be adopted (MoL, 2009). The informal commercial activities should also be carried out
in a structured manner within the INSEs and city county government should be involved in collection
taxes etc. In addition, the information about INSEs open space ratio and the type of building structures is
vital during INSE improvement program. For instance, in Nairobi's Kibera slums, the process of
upgrading was initiated in the year 2010 by UN-HABITAT but later stall because of lack of open space.

COMPARING SPATIAL PATTERNS OF INFORMAL SETTLEMENTS BETWEEN NAIROBI AND DAR ES SALAAM
58
4.13. Summary and General Discussion
The absence of a clear and consistent definition of an informal settlement often hinders the development
of objective and universally applicable methods for mapping INSE using spatial statistical methods which
require a clear conceptualisation of the object of interest. Indeed, the absence of a clear and systematic
approach to measure locational and morphological characteristics of informal settlements across the world
has posed challenges especially during interventions such as INSE improvement and poverty alleviation
programmes. The rationale behind this is because it is strenuous to distinguish an INSE from a non-INSE
in the context of physical characteristics alone because there are latent aspects which need to be discerned.
A solely physical perspective of defining an INSE (e.g. figure 55) is not an ideal approach considering the
consistency, objective measurements and comparability of the parameters. As such, there are many other
factors that influence the location of these settlements apart from physical parameters alone hence this
approach misses out on all factors relevant for the definition and analysis of such settlements. Ideally, the
combination of both the highly detailed physical knowledge and demographic statistics such as population
density and income levels is a feasible approach of delineating the INSEs from the formal areas.
The comparison of the locational characteristics of INSEs between Nairobi and Dar es Salaam cities
demonstrated that the presence of roads is in an area is the main driver of INSE development. The
proximity to rivers is yet another driving force as evident from the results obtained although the values
differ considerably between the two cities. The INSEs environs are dominated by residential land use in
both cities although this scenario may differ with other cities within these countries. Separately, the nature
of the terrain does not have a huge impact on the location of the INSEs. Actually, in the case of Dar es
Salaam, some INSEs are located on gentle slopes whilst others are situated on steep slopes more so in
Kimara area although the slope values of approximately 5.5° of INSE is more or less the same in both
cities. People living in INSEs also tend to live closer to places of opportunities such CBD and industries.
The morphological aspects also vary especially the size, density, shape as well as the pattern between
Nairobi and Dar es Salaam. The Dar es Salaam INSEs depict large patch sizes with more complex shapes
and patterns as opposed to those INSEs in Nairobi. At object level, it can be deduced that the buildings in
the settlements have rectangular shapes with MSI of 1.25. Still, the buildings in Nairobi have large mean
sizes with lesser distances between them compared to those in Dar es Salaam. In the context of road
network connectivity, Dar es Salaam has a more connected, dense and complex network as opposed to
that in Nairobi. It is also worth noting that road accessibility and road connectivity are two different
connotations although both are measured by incorporating the road network in the calculations.
Figure 55: Mukuru informal settlements in Nairobi, Source: (Google Earth, 2015)

COMPARING SPATIAL PATTERNS OF INFORMAL SETTLEMENTS BETWEEN NAIROBI AND DAR ES SALAAM
59
5. CONCLUSION AND RECOMMENDATION
5.1. Introduction
The main objective of this study was the comparison of locational and morphological characteristics of
informal settlements between Nairobi and Dar es Salaam cities using quantitative parameters and methods.
The approach developed in this research demonstrates how the combination of GIS methods and a set of
spatial metrics can be used to quantify the location, size, shape, density and pattern of the informal
settlements. As such, the same indicators were chosen in both cities followed by GIS operations which
were done so as to analyse these indicators at landscape level by focusing mainly on proximity,
accessibility and terrain analysis of the INSEs. Again, at settlement and object levels, the spatial metrics
were employed to analyse the morphological aspects of the settlements, buildings and roads. The results
obtained in Nairobi were compared with those in Dar es Salaam with an aim of establishing whether there
exist a distinct pattern of the informal settlements in both cities. From the results obtained, the similarities
and differences of INSE in both cities were also documented. Based on these results, it can be concluded
that the main objective of the study was achieved.
It is worth noting that, the comparison between Nairobi and Dar es Salaam demonstrated that the
approach used is crucial, although the selection of the parameters cannot be applied universally at this
stage owing to the fact that the set of spatial metrics need to be adjusted from one city to another since
some of the metrics highly correlate with each other. Nonetheless, the results obtained show that the size,
shape, density and pattern of the informal settlements can be quantified using spatial metrics and spatial-
statistical methods.
5.2. Summary of Findings and Conclusion
The conclusions of study have been structured based on the sub-objectives as described in the following
sections:
5.2.1. Locational Characteristics
The first sub-objective was to analyse the locational characteristics of informal settlements using spatial
parameters. Based on the results obtained, the locational characteristics can be summarised as follows:
The spatial parameters that are used to measure location of INSEs are proximity to major rivers,
roads, industries and market centres; and analysis of the nature of the terrain. The results obtained
indicate that the roads have greater influence on INSEs development although the level of influence
differs from one city to another. That is, the road accessibility in Nairobi is 13 minutes while that of
Dar es Salaam is 23 minutes.
The typical spatial characteristics of the location of INSEs also vary from one city to another. In
Nairobi, the INSEs exist as small patches within planned areas while in Dar es Salaam they exist as
large and dominant patches dominating most parts of the city. The slope on INSE location is almost
the same with Nairobi having a mean of 5.4° of slope while Dar es Salaam has 5.9°.
The dominant land use in the neighbourhoods surrounding the INSEs is residential land use. This is
exemplified in both cities of Nairobi (52%) and Dar es Salaam (65%).

COMPARING SPATIAL PATTERNS OF INFORMAL SETTLEMENTS BETWEEN NAIROBI AND DAR ES SALAAM
60
The locational characteristics of INSEs show some similarities as well as differences. For instance, the
land use in the INSEs environs is residential in both cities. Some of the aspects vary especially accessibility
measures. It therefore implies that the INSEs in different cities often exhibit locational characteristics
which are often influenced by layout of the city, land use planning, zoning, legislative and administrative
frameworks as well as urban land policies related to the settlements.
5.2.2. Morphological Characteristics
The second sub-objective was to analyse the morphological characteristics of informal settlements using
spatial metrics. The INSEs morphological characteristics were quantified by a number of parameters by
focusing on the size, pattern, shape and density. From the results obtained, the following conclusions can
be drawn:
There are many spatial metrics that are relevant in understanding the morphology of INSE. In this
study, the metrics were employed at settlement and object levels of analysis. Based on the previous
work and literature review, the metrics that were used are the mean patch size, patch density, mean
shape index, Shannon Evenness Index and Shannon Diversity Index. The results obtained from these
metrics indicate that the sizes, densities and patterns of INSE in Nairobi and Dar es Salaam differ
except the building shapes which are rectangular in both cities.
The structures of the INSEs in both cities are heterogeneous. Based on the MSI values obtained,
Nairobi INSEs has less complex shapes than those in Dar es Salaam. At object level, the buildings in
both cities exhibit rectangular shapes with MSI of approximately 1.25.
The alpha, beta and omega values obtained show that the roads in Dar es Salaam are more connected,
dense and complex compared to Nairobi. However, the road accessibility in Nairobi is higher than in
Dar es Salaam. There is a substantial relationship between the road density and road connectivity.
The patterns and sizes of the INSEs vary from Nairobi to Dar es Salaam. The quantification of the
patterns was done using SEI and SDI metrics while the sizes were analysed using the mean patch size.
From the SEI values obtained show that the INSEs in Nairobi have high values. Therefore, it can be
deduced that the buildings patterns in Nairobi are more even than those in Dar es Salaam.
The form of the informal settlements is more compact in Dar es Salaam while in Nairobi the form is
more fragmented. The average nearest neighbour (ANN) distance between buildings in Nairobi is 10
metres while in Dar es Salaam is 14 metres. Additionally, there are 39 buildings per hectare in Nairobi
INSEs compared to 17 buildings in Dar es Salaam. This is also an indication that that the building
pattern in Nairobi is denser than that in the Dar es Salaam.
The INSE areas in Dar es Salaam have low built-up density and less clustered compared to those in
Nairobi. All the sites in Nairobi have high roof coverage of more than 50% compared to Dar es
Salaam of approximately 40%. Kinondoni site has high roof coverage of 52% since it is located close
to the CBD and buildings tend to cluster. These results were obtained for the entire INSE sites some
of which exhibit greater open space compared to the built-up area hence lower roof coverages.
However, the roof coverage can reach 60-80% in some parts within the INSE.
The morphological characteristics of the INSEs in both cities have similarities and differences. The results
obtained indicate that all sites in Nairobi have high building densities compared to those in Dar es Salaam.
The dominant roofing material is mainly the galvanized iron sheets in both cities. The road surfaces are
mainly unpaved and earth. The morphology characteristics vary from an INSE in one city to another.

COMPARING SPATIAL PATTERNS OF INFORMAL SETTLEMENTS BETWEEN NAIROBI AND DAR ES SALAAM
61
5.2.3. The INSEs Comparison Matrix
The last sub-objective was to develop a INSEs comparison matrix showing similarities and differences
between the two cities. From the comparison matrix developed in table 9, the following are deduced:
The locational characteristics of INSEs are different in Nairobi as compared to those in Dar es
Salaam. The results in the matrix table show that there is no distinct pattern of the INSEs in both
cities except for the terrain and the building shapes. There is also high accessibility to roads, industries
and market centres in Nairobi as compared to that in Dar es Salaam.
The structural characteristics of informal settlements are dissimilar as shown in the results obtained.
The similar variable is the shape of buildings which is rectangular in both cities. The sizes of buildings
differ with Nairobi having mean size of 105 m2 while Dar es Salaam has a mean size of 85 m2.
Further, the standard deviations of the areas of buildings are low hence less variations in the building
sizes from their mean.
Whereas Nairobi has small areas of unplanned development within planned areas, Dar es Salaam city
has large areas of unplanned development that are dominant and extensive in the larger parts of the
city. The INSEs in Dar es Salaam are more compact and less fragmented than those in Nairobi.
The comparison matrix presents the INSEs similarities and differences at landscape, settlement and
object levels in a tabular form. At landscape, the accessibility, proximity and terrain analysis results are
presented for both cities. At settlement and object levels, the morphological results (size, shape,
density, pattern and connectivity) of INSEs, buildings, and roads are presented in both cities.
The comparison matrix can be used to aid and advice on the policy implications of the informal
settlements in each city at local and national levels. For instance, slum improvement programs are
complex exercises that require prior information regarding the nature of the INSE such as open
space, terrain, density and the pattern. This information is important to policy makers and planners as
it assists in establishing a framework on where and how such upgrading activity can be carried out.
The presence of a clear legal framework in ensuring that vacant land is transferred to the people living
in INSEs is vital. The establishment of a legal mechanism to safeguard the rights of the INSE
residents is paramount. This can be done by ensuring that INSEs are recognized together with the
commercial activities that are carried out in these settlements. This will prevent frequent evictions.
The comparison matrix is an ideal way of presenting the results in both cities. This method is
advantageous because it is easy to observe the similarities and differences at different levels of analysis.
The use of the spider charts is also important in the visualization of the results at three levels of analysis
hence clear understanding of locational and morphological characteristics of the INSEs in both cities.
5.3. Limitations of the Study and Future Research Directions
This study successfully explored the use spatial-statistical methods (spatial metrics) to quantify and
compare the locational and morphological characteristics of informal settlements between Nairobi and
Dar es Salaam. However, the results obtained only apply to the two cities in question hence further
research is required in other cities in Sub-Sahara Africa, Latin America and Asia. By so doing, a global
INSE comparison matrix can be developed that aids in policy matters such as INSE improvement
programmes. This will also enable the urban planners to develop alternative strategies for social service
delivery to the INSEs.

COMPARING SPATIAL PATTERNS OF INFORMAL SETTLEMENTS BETWEEN NAIROBI AND DAR ES SALAAM
62
The process of calculating the spatial metrics is a time consuming exercise especially when the study area
is extensive. Therefore, the choice of relevant metrics needs to be done decisively to avoid redundancies
since often there are correlations between the metrics and spatial pattern components. In addition, the
data on buildings is important in understand the physical characteristics of the INSEs. In this study, the
sample sites were used because the buildings data was not available.
The relationship between accessibility and road connectivity need to be established in future studies in
order to investigate if it influences the INSE development. This is because unlike Nairobi which has high
accessibility values but low road connectivity and density, Dar es Salaam has low accessibility but high
road connectivity and density. Therefore, it is imperative for future research be conducted in this realm to
demystify these facts.
To confirm the universality of the adopted spatial metrics and the derived results, further case studies and
theoretical analysis need to be administered. However, the results obtained in this study can be used as a
basis for further studies more so on incorporating both spatial and socioeconomic data such as
demographic data to develop alternative INSE growth models. These models will assist in forecasting the
future INSE growth scenarios and their impacts in a given city.
The research was limited to the analysis of spatial and morphological aspects of informal settlements. To
fully understand the growth patterns of such settlements in both cities over time, further research on
drivers of growth need to be carried out by incorporating the spatiotemporal components as well as
factoring in 3D information such as height information. This will be important in monitoring the growth
and development patterns of such settlements hence holistic mitigation measures can be put in place.

COMPARING SPATIAL PATTERNS OF INFORMAL SETTLEMENTS BETWEEN NAIROBI AND DAR ES SALAAM
63
LIST OF REFERENCES
Abebe, F. K. (2011). Modelling Informal Settlement Growth in Dar es Salaam, Tanzania. Unpublished MSc Thesis, University of Twente Faculty of Geo-Information and Earth Observation (ITC). Retrieved May 24, 2014, from http://www.itc.nl/library/papers_2011/msc/upm/abebe.pdf
Ahmed, S. J. (2004). Improving Access to Public Healthcare Services - A case study in Dar es Salaam, Tanzania. Unpublished MSc Thesis, University of Twente Faculty of Geo-Information and Earth Observation (ITC). Retrieved November 09, 2014, from http://www.itc.nl/library/Papers_2005/msc/upla/ahmed.pdf
Barros, J., & Sobreira, F. (2002). City of Slums: Self-Organisation Across Scales. Working Paper Series - Paper 55, June 2002. Retrieved November 17, 2014, from https://www.bartlett.ucl.ac.uk/casa/pdf/paper55.pdf
Bolay, J.-C. (2006). Slums and Urban Development: Questions on Society and Globalisation. Retrieved August 02, 2014, from http://infoscience.epfl.ch/record/128245/files/Slums.pdf
CNFER. (2012). Patch Analyst - ArcGIS add-on Extensions for Spatial Statistical Analysis. Web Page. Retrieved November 19, 2014, from http://cnfer.on.ca/SEP/patchanalyst/
Dubovyk, O., Sliuzas, R., & Flacke, J. (2011). Spatio-temporal modelling of informal settlement development in Sancaktepe district, Istanbul, Turkey. ISPRS Journal of Photogrammetry and Remote Sensing, 66(2), 235–246. doi:http://dx.doi.org/10.1016/j.isprsjprs.2010.10.002
Esri. (2015a). Esri Maps and Map Layers. Retrieved February 15, 2015, from http://www.esri.com/software/arcgis/arcgisonline/maps/maps-and-map-layers
Esri. (2015b). How Slope works. Retrieved February 15, 2015, from http://resources.arcgis.com/en/help/main/10.1/index.html#//009z000000vz000000
Google Earth. (2015). Exploring the Earth with Satellite Images. Retrieved February 15, 2015, from https://www.google.com/earth/
Gulyani, S., Bassett, E. M., & Talukdar, D. (2014). A tale of two cities: A multi-dimensional portrait of poverty and living conditions in the slums of Dakar and Nairobi. Habitat International, 43, 98–107. doi:10.1016/j.habitatint.2014.01.001
Herold, M., Couclelis, H., & Clarke, K. C. (2005). The role of spatial metrics in the analysis and modeling of urban land use change. Computers, Environment and Urban Systems, 29(4), 369–399. doi:10.1016/j.compenvurbsys.2003.12.001
Herold, M., Goldstein, N. C., & Clarke, K. C. (2003). The spatiotemporal form of urban growth: measurement, analysis and modeling. Remote Sensing of Environment, 86(3), 286–302. doi:10.1016/S0034-4257(03)00075-0
Huang, J., Lu, X. X., & Sellers, J. M. (2007). A global comparative analysis of urban form: Applying spatial metrics and remote sensing. Landscape and Urban Planning, 82(4), 184–197. doi:10.1016/j.landurbplan.2007.02.010
Ishtiyaq, M., & Kumar, S. (2011). Typology of Informal Settlements and Distribution of Slums in the NCT, Delhi. Unpublished Article. Retrieved August 25, 2014, from http://home.hiroshima-u.ac.jp/hindas/PDF/Ishtiyaq_and_Kumar(2011).pdf

COMPARING SPATIAL PATTERNS OF INFORMAL SETTLEMENTS BETWEEN NAIROBI AND DAR ES SALAAM
64
Kit, O., Lüdeke, M., & Reckien, D. (2012). Texture-based identification of urban slums in Hyderabad, India using remote sensing data. Applied Geography, 32(2), 660–667. doi:10.1016/j.apgeog.2011.07.016
KNBS. (2011). Kenya Population Census Data Sheet 2011. Kenya Population Census Report. Retrieved July 20, 2014, from http://www.prb.org/pdf11/kenya-population-data-sheet-2011.pdf
Kohli, D., Sliuzas, R., Kerle, N., & Stein, A. (2012). An ontology of slums for image-based classification. Computers, Environment and Urban Systems, 36(2), 154–163. doi:10.1016/j.compenvurbsys.2011.11.001
Kohli, D., Warwadekar, P., Kerle, N., Sliuzas, R., & Stein, A. (2013). Transferability of Object-Oriented Image Analysis Methods for Slum Identification. Remote Sensing, 5(9), 4209–4228. doi:10.3390/rs5094209
Kombe, W. J. (2005). Land use dynamics in peri-urban areas and their implications on the urban growth and form: the case of Dar es Salaam, Tanzania. Habitat International, 29(1), 113–135. doi:10.1016/S0197-3975(03)00076-6
Kuffer, M., Barros, J., & Sliuzas, R. V. (2014). The development of a morphological unplanned settlement index using very-high-resolution (VHR) imagery. Computers, Environment and Urban Systems, 48, 138–152. doi:10.1016/j.compenvurbsys.2014.07.012
Kuffer, M., & Barrosb, J. (2011). Urban Morphology of Unplanned Settlements: The Use of Spatial Metrics in VHR Remotely Sensed Images. Procedia Environmental Sciences, 7, 152–157. doi:10.1016/j.proenv.2011.07.027
Lamba, A. (2005). Land Tenure Management Systems in Informal Settlements. Unpublished MSc Thesis, University of Twente Faculty of Geo-Information and Earth Observation (ITC). Retrieved July 29, 2014, from http://www.itc.nl/library/papers_2005/msc/gim/lamba.pdf
Martin Herold, XiaoHang Liu, and K. C. C. (2003). Spatial Metrics and Image Texture for Mapping Urban Land Use. Web Page. Retrieved July 02, 2014, from http://www.asprs.org/a/publications/pers/2003journal/september/2003_sep_991-1001.pdf
McGarigal, K., Cushman, S., & Ene, E. (2012). FRAGSTATS Help and Technical Support Document. Retrieved January 07, 2015, from http://www.umass.edu/landeco/research/fragstats/documents/fragstats.help.4.2.pdf
McGarigal, K., & Marks, B. J. (1994). FRAGSTATS - Spatial Pattern Analysis Program for Quantfying Landscape Structure. Retrieved August 04, 2014, from http://www.umass.edu/landeco/pubs/mcgarigal.marks.1995.pdf
Mkurabita. (2012). Formalisation of Informal Urban Settlements in Tanzania. Web Document. Retrieved October 05, 2014, from http://www.mkurabita.go.tz/userfiles/2014-2-20-13-34-40_mkurabita-innovations 2012.pdf
MoL. (2009). Sessional Paper on Keny National Land Policy. Web Document. Retrieved February 10, 2015, from http://www1.uneca.org/Portals/lpi/CrossArticle/1/Land Policy Documents/Sessional-paper-on-Kenya-National-Land-Policy.pdf
Mutisya, E., & Yarime, M. (2011). Understanding the Grassroots Dynamics of Slums in Nairobi: The Dilemma of Kibera Informal Settlements. Engineering, Management, & Applied Sciences & Technologies.

COMPARING SPATIAL PATTERNS OF INFORMAL SETTLEMENTS BETWEEN NAIROBI AND DAR ES SALAAM
65
Omwenga, M. (2011). Integrated Transport System for Liveable City Environment: A Case Study of Nairobi City. Unpublished Report Presented in 47th ISOCARP Congress 2011. Retrieved July 20, 2014, from http://www.isocarp.net/data/case_studies/2022.pdf
Owen, K. K., & Wong, D. W. (2013). An approach to differentiate informal settlements using spectral, texture, geomorphology and road accessibility metrics. Applied Geography, 38, 107–118. doi:10.1016/j.apgeog.2012.11.016
Patarasuk, R. (2013). Road network connectivity and land-cover dynamics in Lop Buri province, Thailand. Journal of Transport Geography, 28, 111–123. doi:10.1016/j.jtrangeo.2012.11.011
Plotnick, R. E., Gardner, R. H., Hargrove, W. W., Prestegaard, K., & Perlmutter, M. (1996). Lacunarity analysis: A general technique for the analysis of spatial patterns. Applied Geography. Retrieved November 09, 2014, from http://research.mssm.edu/cnic/pdfs/PlotnickLacunarity.pdf
Sliuzas, R. (2008). Diversity of Global Slums Conditions - Is a Universal Spatial Definition of Slums Feasible? Report of Expert Group Meeting on Slum Identification and Mapping. Retrieved July 21, 2014, from http://www.ciesin.columbia.edu/confluence/download/attachments/34308102/Sliuzas Diversity of slumsv2.pdf?version=1&modificationDate=1212395235000&api=v2
Sliuzas, R., & Kuffer, M. (2008). Analysing the Spatial Heterogeneity of Poverty Using Remote Sensing: Typology of Poverty Areas using Selected RS Based Indicators. Remote Sensing. Retrieved July 21, 2014, from http://www.earsel.org/workshops/HighRes2008/Artikel/20_Sliuzas.pdf
Sori, N. D. (2012). Identifying and Classifying Slum Development Stages from Spatial Data. Unpublished MSc Thesis, University of Twente Faculty of Geo-Information and Earth Observation (ITC). Retrieved July 21, 2014, from http://www.itc.nl/library/papers_2012/msc/upm/dinsasori.pdf
Taubenbock, H., & Kraff, N. J. (2014). The physical face of slums: a structural comparison of slums in Mumbai, India, based on remotely sensed data. Journal of Housing and the Built Environment, 29(1), 15–38. doi:10.1007/s10901-013-9333-x
Taubenböck, H., Wegmann, M., Roth, a., Mehl, H., & Dech, S. (2009a). Urbanization in India – Spatiotemporal analysis using remote sensing data. Computers, Environment and Urban Systems, 33(3), 179–188. doi:10.1016/j.compenvurbsys.2008.09.003
Taubenböck, H., Wegmann, M., Roth, A., Mehl, H., & Dech, S. (2009b). Urbanization in India - Spatiotemporal analysis using remote sensing data. Computers, Environment and Urban Systems, 33(3), 179–188.
TNBS. (2006). Dar es Salaam - Regional and District Population Projections. Unpublished Report of Tanzania National Bureau of statistics. Retrieved July 20, 2014, from http://www.nbs.go.tz/projections/dsm_projections.pdf
Tsenkova, S. (2010). Informal settlements in post-communist cities: Diversity factors and patterns. doi:10.5379/urbani-izziv-en-2010-21-02-001
UNECE. (2008). Report on Informal Settlements in the ECE Region. Web Page. Retrieved July 02, 2014, from http://www.unece.org/fileadmin/DAM/hlm/sessions/docs2008/informal.notice.1.pdf
UN-HABITAT. (2003). The Challenge of Slums. Unpublished Global Report on Human Settlements. Retrieved July 22, 2014, from http://www.aq.upm.es/habitabilidadbasica/docs/recursos/monografias/the_challenge_of_slums-(2003).pdf

COMPARING SPATIAL PATTERNS OF INFORMAL SETTLEMENTS BETWEEN NAIROBI AND DAR ES SALAAM
66
UN-HABITAT. (2008). UN-HABITAT and the Kenya Slum Upgrading Programme. Unpublished Strategy Document. Retrieved from http://www.google.nl/url?sa=t&rct=j&q=&esrc=s&source=web&cd=1&ved=0CCUQFjAA&url=http%3A%2F%2Funhabitat.org%2F%3Fwpdmact%3Dprocess%26did%3DNjk0LmhvdGxpbms%3D&ei=HyXhU5edL4bYPam4gPgD&usg=AFQjCNHbQIZRUNPCyOup4gnut7iflNa30A&sig2=WHTcuXtGwv4KBOhmNJn5qQ&bvm=bv.72197243,d.ZWU
UN-HABITAT. (2010a). Informal Settlements and Finance in Dar es Salaam Tanzania. Web Document. Retrieved October 05, 2014, from http://www.tanzania.go.tz/egov_uploads/documents/The_Sites_and_Services_and_Settlement_Improvement_Programme_sw.pdf
UN-HABITAT. (2010b). State of the World’s Cities 2010-2011. International Report on World Cities. Retrieved July 19, 2014, from http://sustainabledevelopment.un.org/content/documents/11143016_alt.pdf
UN-HABITAT. (2013). Streets as Public Spaces and Drivers of Urban Prosperity. Retrieved from http://mirror.unhabitat.org/pmss/listItemDetails.aspx?publicationID=3513
UN-HABITAT. (2014a). Housing and Slum upgrading. Website Page. Retrieved May 31, 2014, from http://unhabitat.org/urban-themes-2/housing-slum-upgrading/
UN-HABITAT. (2014b). UN HABITAT Safer Cities Projects. Web Page. Retrieved November 17, 2014, from http://ww2.unhabitat.org/programmes/safercities/projects.asp
Wamsler, C., & Brink, E. (2014). Moving Beyong Short-term Coping and Adaptation. Environment and Urbanization. doi:10.1177/0956247813516061
Wikipedia. (2014a). Description of the Nairobi County City. Web Page. Retrieved August 22, 2014, from http://en.wikipedia.org/wiki/Nairobi_County
Wikipedia. (2014b). Kibera Slums in Nairobi. Web Page. Retrieved November 17, 2014, from http://en.wikipedia.org/wiki/Kibera
Wikipedia. (2014c). Proportions of Urban population living in Slums - a Global Perspective. Wikimedia Commons. Retrieved August 26, 2014, from http://commons.wikimedia.org/wiki/File:Urban_population_living_in_slums.png
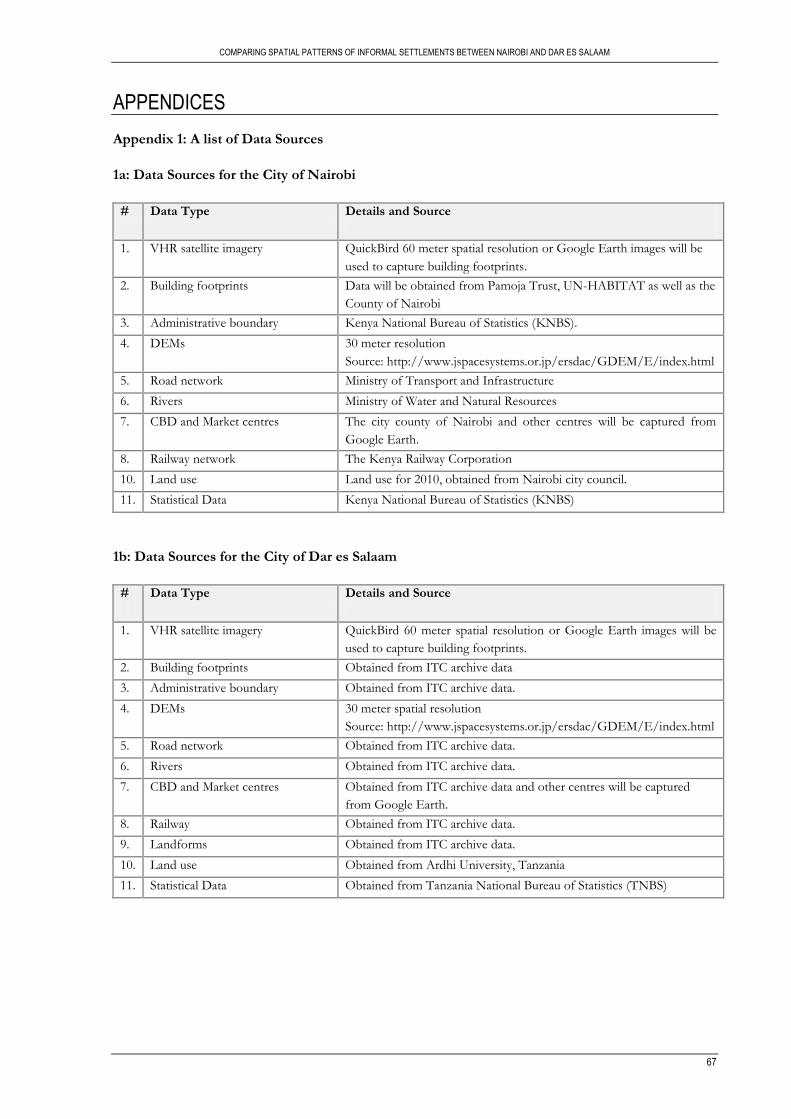
COMPARING SPATIAL PATTERNS OF INFORMAL SETTLEMENTS BETWEEN NAIROBI AND DAR ES SALAAM
67
APPENDICES
Appendix 1: A list of Data Sources
1a: Data Sources for the City of Nairobi
# Data Type Details and Source
1. VHR satellite imagery QuickBird 60 meter spatial resolution or Google Earth images will be
used to capture building footprints.
2. Building footprints Data will be obtained from Pamoja Trust, UN-HABITAT as well as the
County of Nairobi
3. Administrative boundary Kenya National Bureau of Statistics (KNBS).
4. DEMs 30 meter resolution
Source: http://www.jspacesystems.or.jp/ersdac/GDEM/E/index.html
5. Road network Ministry of Transport and Infrastructure
6. Rivers Ministry of Water and Natural Resources
7. CBD and Market centres The city county of Nairobi and other centres will be captured from
Google Earth.
8. Railway network The Kenya Railway Corporation
10. Land use Land use for 2010, obtained from Nairobi city council.
11. Statistical Data Kenya National Bureau of Statistics (KNBS)
1b: Data Sources for the City of Dar es Salaam
# Data Type Details and Source
1. VHR satellite imagery QuickBird 60 meter spatial resolution or Google Earth images will be
used to capture building footprints.
2. Building footprints Obtained from ITC archive data
3. Administrative boundary Obtained from ITC archive data.
4. DEMs 30 meter spatial resolution
Source: http://www.jspacesystems.or.jp/ersdac/GDEM/E/index.html
5. Road network Obtained from ITC archive data.
6. Rivers Obtained from ITC archive data.
7. CBD and Market centres Obtained from ITC archive data and other centres will be captured
from Google Earth.
8. Railway Obtained from ITC archive data.
9. Landforms Obtained from ITC archive data.
10. Land use Obtained from Ardhi University, Tanzania
11. Statistical Data Obtained from Tanzania National Bureau of Statistics (TNBS)

COMPARING SPATIAL PATTERNS OF INFORMAL SETTLEMENTS BETWEEN NAIROBI AND DAR ES SALAAM
68
Appendix 2: Indicators
2a: Spatial Indicators
# Indicator Description and expected informal values
1. Vegetation cover Lack of vegetation. INSEs typically have 5-10% public spaces whilst
planned settlements have 30%.
2. Geomorphology of terrain Settlements built on gullies, swampy, steep slopes and unstable soils
3. Lacunarity of housing structures Measures heterogeneity of empty spaces (lacunae) between built-up
structures
4. Proximity to hazard areas Hazards include flood zones, hydrologic setbacks, landslide and
earthquake, garbage-mountains, point source pollution, airports, energy
transmission lines, major transportation corridors;
5. Consistency of housing orientation In computer vision literature, the angles and lengths of line segments
exhibit greater angular variability and shorter lengths in informal
settlements.
6. Proximity to industrial, commercial
and residential; rivers, roads, city
centre and social places
Network analysis of distance to city services, market area or city centre,
healthcare facilities and market places. Greater distances expected.
7. Dwelling consistency of orientation Precarious house placement, road setbacks lacking.
8. Building density - dwelling
separation
Lower nearest neighbour distance using centroid of dwelling polygons.
Adapted from Owen and Wong (2013)
2b: Morphological Indicators
# Metrics Description and expected informal values
1. Compactness o The compactness index (CI) measures individual patch shape as well as fragmentation of overall landscape. The INSE have less CI value
2. Centrality o The centrality index of INSE will measure whether the shape is elongated or circular. The index is expected to be bigger for INSEs.
3. Complexity o The Area Weighted Mean Shape Index (AWMSI) for informal settlement will be higher because of irregularity of the patches.
o The Area Weighted Mean Patch Fractal Dimension (AWMPFD) will tend to approach a value of 2 since INSE shapes are complex.
4. Porosity (Open Space Ratio) o The open space ratio is expected to be less than1 at the settlement level (for INSEs). This is because patches of built-up occupy more area than the sum of open space area.
5. Patch Density o In unplanned areas, the densities of patches will be different compared with those of planned areas
6. Dwelling size and shape o The mean dwelling size will vary, 20-90 sq. metres for the INSE. o The structures are normally small in size.
Adapted from Huang, Lu, and Sellers (2007) and Kuffer et al. (2014)

COMPARING SPATIAL PATTERNS OF INFORMAL SETTLEMENTS BETWEEN NAIROBI AND DAR ES SALAAM
69
Appendix 3: Nairobi Sample Sites

COMPARING SPATIAL PATTERNS OF INFORMAL SETTLEMENTS BETWEEN NAIROBI AND DAR ES SALAAM
70
Appendix 4: Dar es Salaam Sample Sites

COMPARING SPATIAL PATTERNS OF INFORMAL SETTLEMENTS BETWEEN NAIROBI AND DAR ES SALAAM
71
Appendix 5: Sample Field Observations
a. Nairobi Sites
Majengo (S1) Mathare (S2)
1H1 - mud, iron 1R1 - earth, 3.5m 2H1 - iron, iron 2R1 - tarmac, 6.0m
1H2 - concrete, iron 1R2 - earth, 3.8m 2H2 - concrete, iron 2R2 - tarmac, 5.5m
1H3 - mud, iron 1R3 - tarmac, 4.4m 2H3 - iron, iron 2R3 - earth, 3.8m
1H4 - concrete, iron 1R4 - earth, 3.5m 2H4 - mud, iron 2R4 - murram, 4.0m
1H5 - concrete, iron 1R5 - murram, 3.7m 2H5 - concrete, iron 2R5 - earth, 3.6m
Kawangware (S3) Kibera (S4)
3H1 - concrete, iron 3R1 - earth, 3.0m 4H1 - mud, iron 4R1 - earth, 2.3m
3H2 - mud, iron 3R2 - murram, 4.5m 4H2 - concrete, iron 4R2 - earth, 2.0m
3H3 - iron, iron 3R3 - earth, 3.7m 4H3 - mud, iron 4R3 - tarmac, 6.0m
3H4 - mud, iron 3R4 - tarmac, 6.0m 4H4 - mud, iron 4R4 - earth, 3.0m
3H5 - iron, iron 3R5 - earth, 2.5m 4H5 - timber, iron 4R5 - earth, 3.6m
Mukuru (S5)
5H1 - concrete, iron 5R1 - murram, 4.3m Key: H - House (walls, roofing material)
5H2 - mud, iron 5R2 - earth, 3.1m R - Road (surface type, length)
5H3 - iron, iron 5R3 - tarmac, 6.2m
5H4 - mud, iron 5R4 - earth, 3.4m
5H5 - iron, iron 5R5 - earth, 2.7m
b. Dar es Salam Sites
Kinduchi (S1) Kinondoni (S2)
1H1 - concrete, iron 1R1 - murram, 3.8m 2H1 - concrete, iron 2R1 - tarmac, 4.0m
1H2 - concrete, tiles 1R2 - tarmac, 6.5m 2H2 - concrete, tiles 2R2 - tarmac, 4.2m
1H3 - concrete, iron 1R3 - murram, 4.0m 2H3 - concrete, iron 2R3 - tarmac, 4.1m
1H4 - concrete, iron 1R4 - earth, 3.2m 2H4 - concrete, tiles 2R4 - murram, 3.3m
1H5 - concrete, iron 1R5 - sand, 3.0m 2H5 - concrete, iron 2R5 - earth, 3.0m
Mbagala Kuu (S3) Ukonga (S4)
3H1 - mud, iron 3R1 - tarmac, 4.3m 4H1 - concrete, iron 4R1 - sand, 3.6m
3H2 - iron, iron 3R2 - earth, 2.8m 4H2 - iron, iron 4R2 - sand, 3.8m
3H3 - concrete, iron 3R3 - murram, 3.4m 4H3 - concrete, iron 4R3 - sand, 3.1m
3H4 - concrete, iron 3R4 - murram, 3.6m 4H4 - concrete, iron 4R4 - sand, 2.8m
3H5 - mud, iron 3R5 - earth, 3.1m 4H5 - concrete, iron 4R5 - earth, 2.5m
Kimara (S5)
5H1 - mud, iron 5R1 - tarmac, 6.0m Key: H - House (walls, roofing material)
5H2 - concrete, tiles 5R2 - murram, 4.2m R - Road (surface type, length)
5H3 - mud, iron 5R3 - earth, 3.2m
5H4 - mud, grass 5R4 - earth, 3.4m
5H5 - iron, iron 5R5 - earth, 3.6m

Ap
pen
dix
6:
Rese
arc
h D
esi
gn
Matr
ix
Sp
ecif
ic O
bje
ctiv
es
of
Rese
arc
h
Rese
arc
h Q
uest
ion
s D
ata
an
d S
oft
ware
T
ech
niq
ue a
nd
Pre
sen
tati
on
1.
To
an
aly
se
locati
on
al
ch
ara
cte
rist
ics
of
info
rmal
sett
lem
en
ts
usi
ng
sp
ati
al
para
mete
rs.
o
Wh
at
are
the
spat
ial
par
amet
ers
use
d
to
del
inea
te in
form
al s
ettl
emen
ts?
o
Are
IN
SE
s lo
cate
d in
th
e in
ner
cit
y or
per
i-urb
an;
on
haz
ard z
on
es o
r w
ith
in i
ndust
rial
ar
eas?
o
W
hat
is
th
e dom
inan
t la
nd
use
in
th
e n
eigh
bo
urh
oo
ds
surr
oun
din
g IN
SE
s?
o
Wh
at
spat
ial
pat
tern
do
th
e in
form
al
sett
lem
ents
ex
hib
it
in
rela
tio
n
to
the
par
amet
ers?
Dat
a
o
Lan
d u
se d
ata/
INSE
s o
In
fras
truct
ure
dat
a
o
DE
M/
Slo
pe
o
Lan
dfo
rm d
ata
o
Riv
ers/
bas
in
o
Haz
ard
s d
ata
Sof
twar
e
o
Arc
GIS
10.2
o
SP
SS a
nd
MS E
xcel
Tec
hniq
ues
o
GIS
op
erat
ion
s (
pro
xim
ity
mea
sure
men
ts; sp
atia
l jo
ins/
quer
ies;
in
ters
ecti
on
o
L
and
scap
e le
vel
An
alys
is o
f IN
SE
s usi
ng
SM
. P
rese
ntat
ion
of R
esul
ts
o
GIS
an
alys
is M
aps
o
Tab
le o
f fa
cto
rs
o
Pat
tern
Ch
arts
an
d g
rap
h
2.
To
an
aly
se
the
mo
rph
olo
gic
al
ch
ara
cte
rist
ics
of
INS
Es
usi
ng
la
nd
scap
e
metr
ics.
o
Wh
ich
sp
atia
l m
etri
cs
are
rele
van
t in
un
der
stan
din
g th
e st
ruct
ure
o
f in
form
al
sett
lem
ents
?
o
Is
the
stru
cture
o
f in
form
al
sett
lem
ents
h
om
oge
no
us
or
het
ero
gen
eous?
o
Wh
at a
re t
he
pat
tern
s, s
izes
an
d s
hap
es o
f th
e IN
SE
s in
bo
th c
itie
s an
d h
ow
can
th
ey
be
quan
tifi
ed?
o
Is
th
e fo
rm
of
the
info
rmal
se
ttle
men
ts
com
pac
t o
r fr
agm
ente
d a
nd h
ow
can
it
be
the
quan
tifi
ed?
Dat
a
o
VH
R S
atel
lite
imag
es
o
Info
rmal
set
tlem
ents
(b
lock
s)
o
Build
ings
fo
otp
rin
ts
o
Lan
d u
se d
ata
o
Ext
ract
ed r
esid
enti
al lay
er
Sof
twar
e
o
FR
AG
ST
AT
S
o
Pat
ch A
nal
yst
o
Arc
GIS
10.2
o
SP
SS a
nd
MS E
xcel
Tec
hniq
ues
o
INSE
s b
lock
an
d o
bje
ct lev
el
anal
ysis
usi
ng
SM
o
Q
uan
tifi
cati
on
of
size
, fo
rm,
shap
e, d
ensi
ty, p
atte
rn -
re
gula
r an
d irr
egula
r o
Set
tlem
ent
and
ob
ject
le
vel
A
nal
ysis
P
rese
ntat
ion
of R
esul
ts
o
An
alys
is M
aps
o
Tab
le o
f fa
cto
rs/
par
amet
ers
o
Pat
tern
s C
har
ts a
nd
gra
ph
s
3.
To
d
eve
lop
an
IN
SE
co
mp
ari
son
m
atr
ix
that
sho
ws
the s
imil
ari
ties
an
d
dif
fere
nces
betw
een
th
e
two
cit
ies.
o
Wh
at
are
stru
ctura
l si
mila
riti
es
and
dif
fere
nce
s in
pat
tern
of
INSE
s in
2 c
itie
s?
o
Ho
w c
an t
he
sim
ilari
ties
and d
iffe
ren
ces
be
pre
sen
ted?
o
A
re
the
loca
tio
nal
ch
arac
teri
stic
s o
f in
form
al s
ettl
emen
ts s
imila
r?
o
Are
th
e st
ruct
ura
l h
eter
oge
nei
ty
index
val
ues
si
mila
r an
d
wh
at
is
thei
r si
gnif
ican
ce?
Dat
a
o
All
the
dat
a lis
ted
ab
ove
will
b
e use
d t
o d
evel
op
th
e in
dex
. S
oftw
are
o
SP
SS
o
MS E
xcel
Tec
hniq
ues
o
Co
mp
arin
g b
oth
cit
ies
usi
ng
the
resu
lts
ob
tain
ed f
rom
th
e st
eps
abo
ve.
o
C
om
pute
HI
val
ues
usi
ng
form
ula
in
Ap
pen
dix
6.
Pre
sent
atio
n of
Res
ults
o
Co
mp
aris
on
Tab
le
o
Rad
ar/
spid
er c
har
ts
o
Bo
x p
lots
an
d g
rap
hs
72

Ap
pen
dix
7:
Pro
po
rtio
n o
f U
rban
Po
pu
lati
on
Liv
ing
in
In
form
al
Sett
lem
en
ts A
cco
rdin
g t
o U
N-H
AB
ITA
T D
efi
nit
ion
Sou
rce:
(W
ikip
edia
, 2014c)
73