comparing static, adaptable, and adaptive menus
TRANSCRIPT

Comparing Static, Adaptable, and Adaptive Menus
by
Leah K. Findlater
B.Sc. Hon., University of Regina, 2001
A THESIS SUBMITTED IN PARTIAL FULFILLMENT OF
THE REQUIREMENTS FOR THE DEGREE OF
Master of Science
in
THE FACULTY OF GRADUATE STUDIES
(Department of Computer Science)
We accept this thesis as conformingto the required standard
The University of British Columbia
August 2004
c© Leah K. Findlater, 2004


Abstract
Software applications continue to grow in terms of the number of features they offer,making personalization increasingly important. Research has shown that most usersprefer the control afforded by an adaptable approach to personalization rather thana system-controlled adaptive approach. Both types of approaches offer advantagesand disadvantages. No study, however, has compared the efficiency of the twoapproaches.
In two controlled lab studies, we measured the efficiency of static, adaptiveand adaptable interfaces in the context of pull-down menus. These menu conditionswere implemented as split menus, in which the top four items remained static,were adaptable by the subject, or adapted according to the subject’s frequentlyand recently used items. The results of Study 1 showed that a static split menuwas significantly faster than an adaptive split menu. Also, when the adaptablesplit menu was not the first condition presented to subjects, it was significantlyfaster than the adaptive split menu, and not significantly different from the staticsplit menu. The majority of users preferred the adaptable menu overall. Severalimplications for personalizing user interfaces based on these results are discussed.
One question which arose after Study 1 was whether prior exposure to themenus and task has an effect on the efficiency of the adaptable menus. A secondstudy was designed to follow-up on the theory that prior exposure to different typesof menu layouts influences a user’s willingness to customize. Though the observedpower of this study was low and no statistically significant effect of type of expo-sure was found, a possible trend arose: that exposure to an adaptive interface mayhave a positive impact on the user’s willingness to customize. This and other sec-ondary results are discussed, along with several areas for future work. The researchpresented in this thesis should be seen as an initial step towards a more thoroughcomparison of adaptive and adaptable interfaces, and should provide motivation forfurther development of adaptable interaction techniques.
iii


Contents
Abstract iii
Contents v
List of Tables ix
List of Figures xi
Acknowledgements xiii
1 Introduction 1
1.1 Research Objectives . . . . . . . . . . . . . . . . . . . . . . . . . . . 2
1.2 Overview . . . . . . . . . . . . . . . . . . . . . . . . . . . . . . . . . 3
2 Related Work 7
2.1 Introduction to Personalization . . . . . . . . . . . . . . . . . . . . . 7
2.2 Menu Design . . . . . . . . . . . . . . . . . . . . . . . . . . . . . . . 8
2.3 Adaptive Interfaces . . . . . . . . . . . . . . . . . . . . . . . . . . . . 11
2.4 Adaptable Interfaces . . . . . . . . . . . . . . . . . . . . . . . . . . . 14
2.5 Mixed-Initiative Interfaces . . . . . . . . . . . . . . . . . . . . . . . . 17
2.6 Evaluation of Adaptive and Adaptable Interfaces . . . . . . . . . . . 18
2.7 Summary . . . . . . . . . . . . . . . . . . . . . . . . . . . . . . . . . 20
v

3 Experimental Approach 21
3.1 Menu Conditions . . . . . . . . . . . . . . . . . . . . . . . . . . . . . 21
3.1.1 Static Split Menu . . . . . . . . . . . . . . . . . . . . . . . . . 23
3.1.2 Adaptive Split Menu . . . . . . . . . . . . . . . . . . . . . . . 23
3.1.3 Adaptable Split Menu . . . . . . . . . . . . . . . . . . . . . . 25
3.1.4 Traditional Menu . . . . . . . . . . . . . . . . . . . . . . . . . 26
3.2 Task . . . . . . . . . . . . . . . . . . . . . . . . . . . . . . . . . . . . 26
3.3 Experimental Design Issues . . . . . . . . . . . . . . . . . . . . . . . 31
3.3.1 Training . . . . . . . . . . . . . . . . . . . . . . . . . . . . . . 31
3.3.2 Motivation . . . . . . . . . . . . . . . . . . . . . . . . . . . . 32
3.4 Measures . . . . . . . . . . . . . . . . . . . . . . . . . . . . . . . . . 32
3.4.1 Performance . . . . . . . . . . . . . . . . . . . . . . . . . . . 32
3.4.2 Menu Layout . . . . . . . . . . . . . . . . . . . . . . . . . . . 33
3.4.3 Apparatus . . . . . . . . . . . . . . . . . . . . . . . . . . . . . 33
3.4.4 Procedure . . . . . . . . . . . . . . . . . . . . . . . . . . . . . 34
3.5 Summary . . . . . . . . . . . . . . . . . . . . . . . . . . . . . . . . . 35
4 Study 1: Efficiency of Static, Adaptive and Adaptable Split Menus 37
4.1 Methodology . . . . . . . . . . . . . . . . . . . . . . . . . . . . . . . 37
4.1.1 Menu Conditions . . . . . . . . . . . . . . . . . . . . . . . . . 38
4.1.2 Measures . . . . . . . . . . . . . . . . . . . . . . . . . . . . . 38
4.1.3 Experimental Design . . . . . . . . . . . . . . . . . . . . . . . 38
4.1.4 Procedure . . . . . . . . . . . . . . . . . . . . . . . . . . . . . 39
4.1.5 Pilot Study . . . . . . . . . . . . . . . . . . . . . . . . . . . . 40
4.1.6 Study . . . . . . . . . . . . . . . . . . . . . . . . . . . . . . . 41
4.2 Results . . . . . . . . . . . . . . . . . . . . . . . . . . . . . . . . . . . 42
4.2.1 Performance . . . . . . . . . . . . . . . . . . . . . . . . . . . 43
4.2.2 Self-reported Measures . . . . . . . . . . . . . . . . . . . . . . 47
4.2.3 Menu Layout . . . . . . . . . . . . . . . . . . . . . . . . . . . 49
vi

4.2.4 Summary of Results . . . . . . . . . . . . . . . . . . . . . . . 50
4.3 Implications . . . . . . . . . . . . . . . . . . . . . . . . . . . . . . . . 50
4.4 Discussion and Follow-up Study . . . . . . . . . . . . . . . . . . . . . 53
5 Study 2: Effect of Exposure on Customization 55
5.1 Methodology . . . . . . . . . . . . . . . . . . . . . . . . . . . . . . . 56
5.1.1 Practice Conditions . . . . . . . . . . . . . . . . . . . . . . . 57
5.1.2 Task . . . . . . . . . . . . . . . . . . . . . . . . . . . . . . . . 57
5.1.3 Measures . . . . . . . . . . . . . . . . . . . . . . . . . . . . . 57
5.1.4 Experimental Design . . . . . . . . . . . . . . . . . . . . . . . 57
5.1.5 Procedure . . . . . . . . . . . . . . . . . . . . . . . . . . . . . 58
5.1.6 Apparatus . . . . . . . . . . . . . . . . . . . . . . . . . . . . . 59
5.2 Study . . . . . . . . . . . . . . . . . . . . . . . . . . . . . . . . . . . 59
5.2.1 Subjects . . . . . . . . . . . . . . . . . . . . . . . . . . . . . . 59
5.2.2 Hypotheses . . . . . . . . . . . . . . . . . . . . . . . . . . . . 60
5.3 Results . . . . . . . . . . . . . . . . . . . . . . . . . . . . . . . . . . . 60
5.3.1 Performance . . . . . . . . . . . . . . . . . . . . . . . . . . . 61
5.3.2 Self-reported Measures . . . . . . . . . . . . . . . . . . . . . . 64
5.3.3 Customization (Menu Layout) . . . . . . . . . . . . . . . . . 64
5.4 Summary of Results . . . . . . . . . . . . . . . . . . . . . . . . . . . 65
5.5 Discussion . . . . . . . . . . . . . . . . . . . . . . . . . . . . . . . . . 66
6 Conclusions and Future Work 67
6.1 Limitations . . . . . . . . . . . . . . . . . . . . . . . . . . . . . . . . 67
6.2 Satisfaction of Thesis Goals . . . . . . . . . . . . . . . . . . . . . . . 69
6.3 Future Work . . . . . . . . . . . . . . . . . . . . . . . . . . . . . . . 71
6.4 Concluding Remarks . . . . . . . . . . . . . . . . . . . . . . . . . . . 73
Bibliography 75
vii

Appendix A Study 1 Questionnaires 81
Appendix B Online Instructions 87
B.1 Study 1 . . . . . . . . . . . . . . . . . . . . . . . . . . . . . . . . . . 87
B.2 Study 2 . . . . . . . . . . . . . . . . . . . . . . . . . . . . . . . . . . 89
viii

List of Tables
4.1 Two-way ANOVA (order x menu) for the speed dependent variable. 44
4.2 Pairwise comparisons for the speed dependent variable. . . . . . . . 45
4.3 Means for selection speed of all subjects, and for only those subjects
who customized (N=27). . . . . . . . . . . . . . . . . . . . . . . . . 46
4.4 Chi-square statistic for qualitative results (S=static; AV=adaptive;
AB=adaptable) (N=27). . . . . . . . . . . . . . . . . . . . . . . . . . 48
4.5 Mean layout scores for customization for the 22 subjects who cus-
tomized based on the task sequence. (Selection sequences were ran-
domly generated, so subjects had slightly different menu layout scores
from one another, even for the traditional menu.) . . . . . . . . . . . 49
5.1 Means for selection speed for Blocks 1 and 2 of the adaptable condi-
tion, comparing those subjects who did not customize according to
the task sequence to those subjects who did customize (N=30). . . . 62
5.2 Pairwise comparisons for speed dependent variable for Block 2 of the
practice conditions. . . . . . . . . . . . . . . . . . . . . . . . . . . . . 63
5.3 Summary of self-reported preference measures (N=30). . . . . . . . 63
5.4 Layout scores for customization for the 24 subjects who customized
based on the task sequence in Study 2. . . . . . . . . . . . . . . . . . 65
ix

List of Figures
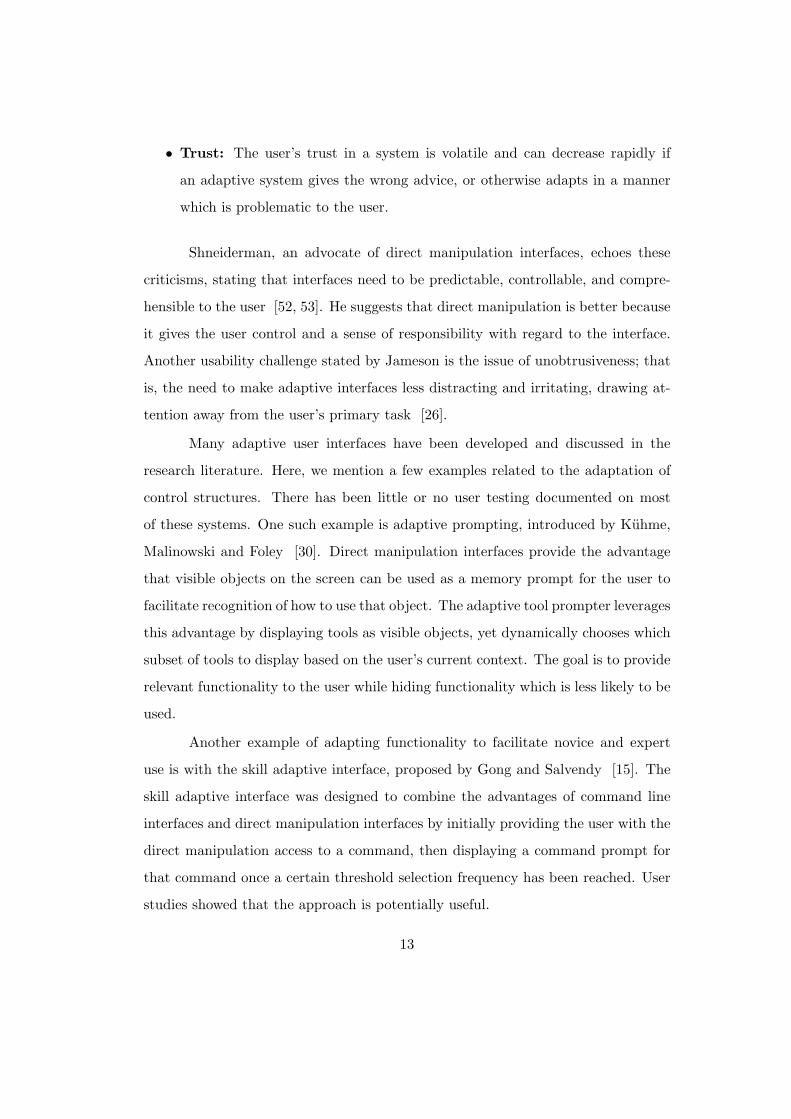
3.1 A traditional menu layout and a corresponding static split menu. In
the static split menu the most frequently used items appear above
the split (divider). . . . . . . . . . . . . . . . . . . . . . . . . . . . . 22
3.2 Adaptive algorithm. . . . . . . . . . . . . . . . . . . . . . . . . . . . 24
3.3 Coarse-grained and fine-grained customization of the split menu. . . 26
3.4 Frequencies of item selection from usage log data (total of 788 selec-
tions). . . . . . . . . . . . . . . . . . . . . . . . . . . . . . . . . . . . 28
3.5 The three menu schemes used to create isomorphic tasks. . . . . . . 30
3.6 Screenshot of experimental system, showing the prompt area on the
right-hand side and the menus at the top-left. . . . . . . . . . . . . . 34
4.1 Latin squares used for the blocking variables of scheme and order. . 39
4.2 Boxplot of menu type versus speed (N=27), showing relative medians
of the three conditions, and the greater variation in the Adaptable
condition than the other two conditions. . . . . . . . . . . . . . . . . 44
4.3 Interaction of speed dependent variable. . . . . . . . . . . . . . . . . 46
xi


Acknowledgements
I would like to first of all thank my supervisor, Dr. Joanna McGrenere, for herguidance and leadership. Joanna was always ready to answer questions and providefeedback whenever I needed it, and had an uncanny sense of exactly how long itshould take for me to get something done. My supervisory committee members, Dr.Kellogg Booth and Dr. Brian Fisher, also provided advice throughout all stages ofthis research and were influential in shaping the direction it took. Finally, as secondreader, Dr. Cristina Conati provided invaluable input on the last few versions ofthis thesis.
Many people were also indirectly involved in this research. Thanks to Dr.Ron Rensink and other members of the Visual Cognition Lab at UBC, who grantedme use of the lab for running these studies and patiently answered all of my ques-tions. Several members of Imager Lab and the Interaction Design Reading Grouphelped out along the way, as pilot study participants or through informal discus-sions. Many informal discussions (some of which were even about research) werealso had with Karyn Moffatt, Dana Sharon, and Matt Williams, who have sharedan office with me for the last year. Financial support was supplied in part throughthe Natural Sciences and Engineering Research Council of Canada (NSERC), andthrough the B.C. Advanced Systems Institute (ASI).
Leah K. Findlater
The University of British ColumbiaAugust 2004
xiii

Chapter 1
Introduction
Everyday applications, such as the word processor and the spreadsheet, provide
users with additional functionality in each new version release. Some have referred
to this phenomenon as creeping featurism [25, 48] or bloatware [28]. One impact
of this trend is that graphical user interfaces are increasing in complexity — menus,
toolbars, and dialog boxes are all multiplying in size. On the positive side, the
addition of new features can provide benefit to the user; for example, a feature may
modernize an application, as in the case of a word processor that adds support for
creating an html document for web publishing. The downside, however, is that
most users only use a small fraction of the available functions [35, 43], while wading
through many unused functions. In addition, users tend to use different functions
from one another, even when they are performing similar tasks [16]. More so than
ever before, there is a need to manage the interface, providing users with easy access
to the functions that they do use. Therefore, this suggests the need for interfaces to
be personalized to each individual user.
Adaptive and adaptable interfaces are two major approaches to personaliza-
tion. The goal of both adaptive and adaptable interfaces is to provide personaliza-
tion for the user; however, these two approaches differ in who is in control of the
adaptation process. Adaptive interfaces automatically adjust the interface in a way
1

that is intended to support the user. By contrast, adaptable interfaces provide cus-
tomization mechanisms but rely on the user him or herself to use those mechanisms
to do the adaptation. Though traditionally the system designer or administrator
has also played a role in adapting the interface to the needs of a particular user
or group, adaptable and adaptive interaction techniques are likely the only scalable
approaches to personalization [62].
There has been some debate in the human-computer interaction and intelli-
gent user interface communities as to which approach is best [53]. One side argues
that we should provide easy-to-use predictable mechanisms that keep users in con-
trol of their system, while the other side believes that if the right adaptive algorithm
can be found, users will be able to focus on their tasks, rather than on managing
their tools. Despite this debate, there has never been an empirical comparison of
the efficiency of adaptive and adaptable interaction techniques. Most research has
focused on developing systems, with little formal evaluation and even less compara-
tive evaluation of the two. One exception is a field study, performed by McGrenere,
Baecker and Booth [42], which qualitatively compared the native Microsoft Word
2000 adaptive interface to an adaptable alternative. Our work builds on this more
qualitative work by providing controlled lab evaluation of the two types of interac-
tion, and including a static condition. In addition, to maintain a strong connection
to the previous work, much of our methodology is based on the Microsoft Word 2000
interface.
1.1 Research Objectives
This thesis documents work done to compare the efficiency of static, adaptive, and
adaptable interaction techniques. While adaptive and adaptable user interfaces
differ with respect to who is in control of the personalization, they are both examples
of dynamic interfaces and relate to the concept of interface variability. Interface
variability refers to whether or not an interface changes over time, and can have one
2
of two values:
• Static: The interface does not change during the course of use.
• Dynamic: The interface changes during the course of use. For dynamic
interfaces, there are three possibilities for controlling changes to the interface.
1. Adaptive: The system controls change.
2. Adaptable: The user controls change. (Another term for this is cus-
tomizable.)
3. Mixed-initiative: Control is shared between the user and the system.
In this work, we focus on the pure adaptive and adaptable ends of the dy-
namic interface spectrum, which we consider to be an important step in the overall
evaluation of dynamic interfaces.
The objectives of this research address the lack of comparative literature for
static, adaptive, and adaptable interaction techniques. The principal goal of this
research is to formally compare the efficiency of these three types of interfaces. In
the process of attaining this goal, we also hoped to identify secondary trends which
could aid our understanding of how users customize their menus and interact with
these types of systems.
1.2 Overview
This research is divided into two studies that were designed to explore static, adap-
tive, and adaptable interaction techniques in the context of pull-down menus. Pre-
vious work relevant to this research is summarized in Chapter 2. We chose to use
pull-down menus for these studies because menus are a common, relatively simple
interface component and there are several industry and research examples of adap-
tive and adaptable menus. In particular, by basing our structure on the Microsoft
3

Word 2000 menu system, this research complements previous work by McGrenere,
Baecker and Booth [42].
Many methodological decisions were made in the design of the two studies
documented in this thesis. Chapter 3 discusses several of these decisions, such as the
choice of menu conditions. The core static, adaptive, and adaptable menu conditions
used were implemented as split menus, in which the top four menu items remained
static, were adaptable by the subject, or adapted according to the subject’s most
frequently and recently used items.
Study 1, discussed in Chapter 4, was designed to measure performance by
recording the respective speed and error rates of using static, adaptive and adaptable
split menus. Qualitative feedback was also elicited to gain an understanding of
subjective components such as preference and perceived efficiency. The study itself
involved 27 participants. The results showed that the static menu was significantly
faster than the adaptive menu, and that there was an interaction effect involving
order of presentation; that is, under certain conditions the adaptable menu was also
faster than the adaptive menu and not found to be significantly different from the
static menu. The majority of users preferred the adaptable menu and perceived it
to be the most efficient of the three types of menu. Several implications for interface
design were derived from these results.
One conclusion of Study 1 was that it would be necessary to understand the
nature of this interaction effect to predict the efficiency of adaptable menus in a
more global sense. The experimental design of that study, however, did not allow us
to isolate which specific component(s) caused this effect. After hypothesizing sev-
eral explanations for the interaction, we chose to explore the possibility that prior
exposure to different types of menus has an effect on the efficiency of the adapt-
able menu. Chapter 5 discusses this follow-up experiment, Study 2, in which 30
subjects were randomly assigned to one of three conditions, each providing a differ-
ent type of exposure: traditional menu (one which does not contain a split), static
4
split menu, and adaptive split menu. After subjects completed selection sequences
with the exposure condition, they were given adaptable menus and an opportu-
nity to customize. Though no significant effect was found for type of exposure on
customization, possibly due to low statistical power, other secondary results were
explored and ideas for future work developed.
To summarize, this thesis is organized as follows. Chapter 2 discusses re-
lated work and provides background for this research. Before presenting the studies
themselves, Chapter 3 documents our experimental approach. The design and re-
sults of Study 1 are provided in Chapter 4, along with implications of those results.
Chapter 5 documents Study 2 from design to results. Finally, Chapter 6 discusses
limitations of the work and several ideas for future research, concluding the thesis.
Substantial portions of this thesis have already been published in the 2004
proceedings of the SIGCHI conference on Human factors in computing systems [10].
5


Chapter 2
Related Work
In this chapter we introduce adaptation and provide a general background on menu
design. This is followed by a discussion on the advantages and disadvantages of
various adaptation mechanisms, and relevant evaluation. Throughout, there is a
focus on how these techniques have been applied to menu design.
2.1 Introduction to Personalization
There are several approaches to personalizing a user interface. Adaptive, or system-
controlled interfaces, automatically change the interface based on knowledge of the
user’s needs and goals. Adaptable, or user-controlled interfaces, provide mechanisms
with which the user can customize the interface him or herself. Between these
two extremes lies a variety of mixed-initiative interfaces, where control over the
adaptation process is shared between the system and the user. Finally, there has
traditionally been a role for the system administrator to adapt the interface to
specific users and workgroups. This last approach, however, may not be as scalable
as adaptive or adaptable techniques [62].
Recent research on adaptive and adaptable interfaces has been motivated
by several factors, including increasing software complexity [34, 42], the problem
of information overload, particularly on the World Wide Web and in hyperlinked
7

libraries [4, 23, 59], a shift towards more inclusive design, where interfaces are
designed to be more universally accessible than they traditionally have been [11, 55,
56, 58], and the growth of ubiquitous computing [2, 62]. Additionally, Blom groups
motivations for personalizing into three categories: enabling access to information
content, accommodating work goals, and accommodating individual differences [3].
Personalization generally focuses either on control structures or information content.
Graphical user interface components fall under the category of control structures;
for example, buttons, menu items, or toolbars can be personalized. In contrast,
personalized web sites, news delivery, and search engine results could be classified as
personalization of information content. The division is not entirely straightforward;
for example, personalizing hyperlinks to show or hide some links has elements of both
content and control structures. Since personalization of content is not as relevant
to the work presented in this thesis, it will not be discussed in depth.
2.2 Menu Design
Menus are a core control structure of complex software systems, and as such, they
provide an important target for research on user interface adaptation. There has
been a significant amount of research done on menu design in general, much of which
is summarized in a comprehensive 1991 book on the psychology of menu design by
Norman [49]. Some points from Norman’s book which are especially relevant to
our work are listed here:
• Speed and accuracy must be considered when measuring the performance of a
menu system. Measures of speed can include (1) time to select an item from
a single menu frame, (2) time to locate a target in a hierarchical structure
of menus and submenus, and (3) time to complete an entire task within the
system.
8

• Ordering of menu items can be used to facilitate searching, convey relation-
ships between items, or simply create consistency with a user’s knowledge
base. Examples of orderings are random, alphabetic, numeric, frequency of
use, and categorical grouping. Results show that alphabetic and categorical
orderings are better than random ordering.
• Practice improves both speed and accuracy of menu selections, and may help
users develop efficient methods for searching. The greatest improvement oc-
curs when the exact item name is explicitly given as a cue, as opposed to using
an implicit cue, such as the description of an item.
• Users take more time to answer questions about information that appears in
inconsistent locations on the screen compared to a consistent location. (Teit-
elbaum and Granda (1993), reported in [49]). This may lead to frustration
and confusion in the user.
• When menus change based on context it can be confusing or frustrating for
the user. Graying-out menu items in this case is preferable to hiding them
because it maintains positional consistency.
• Given the same level of practice and expertise, users vary greatly in their ability
to find a command within a menu structure. This is dictated to a large extent
by spatial visualization ability and vocabulary and comprehension abilities.
In recent years, several styles of menus have been proposed to better orga-
nize the increasing number of functions in software systems. For example, fisheye
visualization has been applied to menu design to facilitate the display of extremely
long menus [1]. In a fisheye menu, the entire menu is displayed at once, while items
in a focus area around the mouse pointer are magnified for reading and selection.
Another example of menu reorganization is simultaneous, or multiple active menus,
which have been proposed as an alternative to the traditional hierarchical sequential
9

menu layout [21]. With simultaneous menus, several levels in the menu hierarchy
are presented at once, allowing the user to select multiple items at different levels
in the hierarchy without having to backtrack.
One design which appeared earlier than the previous two examples is the
marking menu [31]. The marking menu combines gesture input with pie menus
(circular menus with pie-piece shaped items) to increase the speed with which prac-
ticed users can select menu items. Novice users can invoke the visual menu to
determine how to select an item before making the mark (physical mouse gesture)
required to actually select that item. Expert users, however, can simply make the
mark without taking the extra time to invoke the visual menu. Results showed that
expert users were able to use the marks, and that marking-only was significantly
faster than using the visual menus. Even so, these types of menus have not been
widely adopted in commercial applications.
Split menus are another approach to facilitating faster access to frequently
used menu items, by dividing the menu into two partitions [51]. The items that
are accessed frequently are located in the top partition, above “the split”. In both
a controlled experiment and a field study, Sears and Shneiderman [51] showed that
a static split menu, which contained predetermined frequent menu items in the top
partition and did not change during the course of use, was at least as fast as a static
traditional menu, and in most cases significantly faster. Their work suggested the
need for an adaptive split menu, where the items in the top partition dynamically
adapt based on a user’s usage pattern, but they did not evaluate such a design in
their studies. In the experiments reported in this thesis, we use an adaptive variant
as they suggest, and extend their split menu design to include an adaptable variant,
where the user can specify the items in the top partition.
As an approach to organizing an extremely large number of menu items
(1200 commands), the “Hotbox” combines several common techniques, such as
popup/pulldown menus, modal dialog boxes, and radial (circular) menus, into one
10

system [32]. The Hotbox was designed for a professional 3D animation application
with the goal of providing both novice and expert users with efficient access in a
single GUI widget system. Although no formal testing results have been published,
beta users of the Hotbox reported perceived benefit, showing that the Hotbox design
is useful at least for highly specialized applications. Such a complicated menu sys-
tem is likely not required for more mainstream applications which generally contain
far fewer commands.
As a final example, tracking menus, introduced by Fitzmaurice et al., are
designed for use with mouse- or pen-based computers and PDAs [13]. A tracking
menu contains graphical menu items, similar to a traditional menu, yet also uses
transparency and can “track” or follow the cursor. Fitzmaurice et al. [13] implement
the tracking menu using a pen-based interface and a menu that contains several tools.
Once the user invokes the menu and selects a tool, the menu becomes transparent
until the user lifts the pen off the input surface. The menu is then immediately
available at the current location for the user to select a new tool. This technique
has potential for tool palette-style menus or other menus where clusters of similar
functionality are directly applicable to spatial components on the screen. As yet it
is not a substitute for complex pull-down menu systems.
2.3 Adaptive Interfaces
The majority of work on adaptive interfaces appears in the research literature, and
does not make comparisons with non-adaptive designs [41]. Adaptive interfaces
employ user models, an internal representation of the user, to improve the user’s
interaction with the system. One definition of an adaptive system is:
“An interactive system that adapts its behavior to individual users on
the basis of processes of user model acquisition and application that
involve some form of learning, inference, or decision making.” [26]
11

It is important to note that adapting the interface is only one application of adaptive
systems.
In a discussion of user modelling, Fischer identifies the major potential
strengths of adaptive interfaces to be that (1) the adaptation process requires lit-
tle or no effort on the part of the user, and (2) the user does not need specialized
knowledge to use the system (i.e., to adapt the interface) [12]. While there has not
been much reported success on the use of adaptive control structures, there is more
evidence of success for adaptation of content and provision of help, such as with
Intelligent Tutoring Systems (for examples, see [7, 54]). As an example of adapting
content, Gustafson et al. examined the impact of adaptive assistance on the task of
grouping and classification of news stories for a large college daily newspaper, and
found that sorting time per story dropped 23.7% when an agent was introduced to
the interface [20]. Though the study was small (three users), the results show the
potential for real benefits with agent-assistance.
Adaptive interfaces are, however, commonly criticized because they threaten
several well-known usability principles. In a summary of the current state of adaptive
interfaces, Hook identifies the following problems [23]:
• Lack of control: Adaptive interfaces may not provide the user with control
over the adaptive process. Providing mechanisms to modify the user model
has proved problematic at times.
• Unpredictability: Since the user does not directly control the interface, he
or she may not be able to predict the consequences of certain actions.
• Transparency: Often, the user does not understand how the adaptivity
works in an interface. One issue in designing adaptive interfaces is to decide
how much to make visible to the user.
• Privacy: The user must accept that a system which is based on user models
will be maintaining a representation of his or her interaction with the system.
12
• Trust: The user’s trust in a system is volatile and can decrease rapidly if
an adaptive system gives the wrong advice, or otherwise adapts in a manner
which is problematic to the user.
Shneiderman, an advocate of direct manipulation interfaces, echoes these
criticisms, stating that interfaces need to be predictable, controllable, and compre-
hensible to the user [52, 53]. He suggests that direct manipulation is better because
it gives the user control and a sense of responsibility with regard to the interface.
Another usability challenge stated by Jameson is the issue of unobtrusiveness; that
is, the need to make adaptive interfaces less distracting and irritating, drawing at-
tention away from the user’s primary task [26].
Many adaptive user interfaces have been developed and discussed in the
research literature. Here, we mention a few examples related to the adaptation of
control structures. There has been little or no user testing documented on most
of these systems. One such example is adaptive prompting, introduced by Kuhme,
Malinowski and Foley [30]. Direct manipulation interfaces provide the advantage
that visible objects on the screen can be used as a memory prompt for the user to
facilitate recognition of how to use that object. The adaptive tool prompter leverages
this advantage by displaying tools as visible objects, yet dynamically chooses which
subset of tools to display based on the user’s current context. The goal is to provide
relevant functionality to the user while hiding functionality which is less likely to be
used.
Another example of adapting functionality to facilitate novice and expert
use is with the skill adaptive interface, proposed by Gong and Salvendy [15]. The
skill adaptive interface was designed to combine the advantages of command line
interfaces and direct manipulation interfaces by initially providing the user with the
direct manipulation access to a command, then displaying a command prompt for
that command once a certain threshold selection frequency has been reached. User
studies showed that the approach is potentially useful.
13

More recent work has been done by Gajos and Weld to develop SUPPLE, a
tool that automatically adapts user interfaces to different computing platforms [14].
SUPPLE treats the adaptation process as an optimization problem, by searching for
the interface that best meets device constraints while minimizing the user’s expected
effort to interact with the system. Sample interface renderings are given to show
how SUPPLE adapts the same software to pointer and touch-panel based devices,
to a WAP cell phone simulator, and to a computing device with a small screen.
Although a small, informal user evaluation suggests that SUPPLE may be able to
render an interface similar to that designed by a human expert, no formal user
evaluations have been performed.
A well-known commercial example of an adaptive user interface is the menu
system in the Microsoft Office 2000 (MS Office 2000) suite, which was significantly
redesigned from that in MS Office 97, and adapts to an individual user’s usage [44].
When a menu is initially opened, a “short” menu containing only a subset of the
menu contents is displayed by default. To access the “long” menu one must hover in
the menu with the mouse for a few seconds or click on the arrow icon at the bottom
of the short menu. When an item is selected from the long menu, it will then appear
in the short menu the next time the menu is invoked. After some period of non-use,
menu items will disappear from the short menu but will always be available in the
long menu. Users cannot view or change the underlying user model maintained by
the system; their only control is to turn the adaptive menus on/off and to reset the
data collected in the user model.
2.4 Adaptable Interfaces
There has been little research on adaptable, or customizable, interfaces [41]. Pro-
grammatic customization involves scripting or programming languages that allow
advanced users to modify features of an application in detail, while non-programmatic
customization provides easier-to-use customization support through configuration
14

files or direct manipulation of GUI elements [36]. Some examples of programmatic
customization can be found in systems that support end user programming, or in
some component-based systems which allow applications to be built from reusable
software components [9, 19]. Our work focuses on non-programmatic customization
mechanisms, rather than programmatic mechanisms.
The advantages of customization often complement the disadvantages of
adaptive user interfaces. Since non-programmatic customizable systems often pro-
vide graphical user interface mechanisms to control the customization, these systems
have many of the same advantages of direct manipulation interfaces in general. As
mentioned in the previous section, Shneiderman summarizes the three main advan-
tages of direct manipulation interfaces to be comprehensibility, predictability, and
controllability [52]. Since the interface is comprehensible, users may experience less
anxiety than they would using a system where they have difficulty understanding
the interaction. In addition, they may gain confidence and a feeling of control over
the system because their actions are predictable; a given action will result in a con-
sistent outcome. A result of this increase in perceived control is that users may feel
a sense of responsibility over the interaction, which can be important not only for
giving users a sense of accomplishment about completing tasks, but also in situations
where responsibility needs to be assigned to the user of a critical system.
Fisher states that one potential advantage of adaptable interfaces is that the
user may know his or her task better than adaptive reasoning can determine [12].
This ensures that adaptations made to the interface are always done with the goal
of supporting the user’s actual task, rather than with the goal of supporting a
potentially incorrect prediction of the task. However, in comparison to adaptive
interfaces, a substantial amount of work generally needs to be done on the part
of the user to adapt the interface. As well, customization mechanisms themselves
increase the complexity of the system, with the potential to make it less usable,
especially if these mechanisms are poorly designed [29].
15

Studies have found that the extent to which people customize is dependent
on their skill levels and interest. For example, MacLean et al. identify three types
of people: workers, tinkerers, and programmers [39]. Workers do not expect to
be able to tailor the system, while programmers are highly-skilled in customizing
the system. Programmers are not often directly accessible to workers, which makes
transfer of knowledge from programmers to workers difficult. Filling this gap are
tinkerers, a type of worker who enjoys exploring the computer system, and lies in
between regular workers and programmers. Mackay also distinguishes between users
who customize and those who do not [37]. A further distinction is made within
those who customize: highly skilled engineers experiment and share customizations
regardless of whether they are useful to others, while translators, who are less skilled
technically, create customizations that are tailored to the needs of others.
Mackay examined the customization process in a study of 51 users of the
UNIX operating system [38]. She found that customization was affected by exter-
nal events (e.g., job changes), social pressure, software changes (e.g., upgrades), and
internal factors (e.g., excess free time). Actual customization was minimal because
of time, difficulty, and lack of interest. Two of the most common reasons to cus-
tomize were to retrofit when the system changed, and to customize when the user
noticed that he or she was frequently repeating a pattern of interaction and wanted
to improve efficiency. One way to interpret Mackay’s work is that customization fa-
cilities need to be easy to use, if we are to expect users to customize. Although this
may seem obvious, it is a principle that has not generally been adopted in industry.
In a study of 101 users of a word processor, Page et al. have shown that
almost all users (92%) did some form of customization [50]. This high number could
be because the definition of customization was broad; many of the customizations
were small, such as showing or hiding the ruler bar. The results also showed that
the more the software was used, the higher the level of customization, and that
customization features that were simple to use tended to be used more often.
16

2.5 Mixed-Initiative Interfaces
There has been a small amount of research into interfaces that combine adaptive
and adaptable elements. Horvitz has identified several principles for the design of
mixed-initiative systems that address how to best merge direct manipulation with
interface agents [24]. The goal is to incorporate user direction into intelligent agent
systems to resolve ambiguities about the user’s goals and focus of attention. The
interpretation of mixed-initiative user interfaces can vary widely, and since this type
of interface is not the main focus of this thesis, we give only a few examples here.
One application example was introduced by Thomas and Krogsœter, who
extended the user interface of a common spreadsheet application and showed that
an adaptive component which suggests potentially beneficial adaptations to the
user could motivate users to adapt their interface [57]. More recently, Jameson
and Schwarzkopf studied the issue of controllability in an adaptive recommendation
system for choosing conference itineraries [27]. Their results were inconclusive.
Another earlier example is the adaptive bar, introduced by Debevc et al.
[8]. The adaptive toolbar is a modification of the customizable toolbar supplied in
Microsoft Word for Windows. The system adaptively suggests additions or deletions
of items on the toolbar based on a history of selection frequency. Results comparing
the adaptive toolbar to the fixed Microsoft Word toolbar suggest that the adaptive
prompting helped users more efficiently build their toolbar; however, this testing
was done over two controlled sessions and there is no reported evaluation of more
longitudinal use.
Taking a more theoretical approach, Bunt, Conati and McGrenere have used
GOMS (Goals Operators Methods Selection rules) modeling to explore whether
there are significant performance gains to be realized from customization [5]. The
GOMS modeling showed that performance benefits could be achieved through ef-
fective customization, especially for novices. Combining this finding with previous
work that shows many users do not customize efficiently suggests that there is a role
17

for adaptive support in recommending when and what to customize, as well as in
helping users maintain their personalized interface.
2.6 Evaluation of Adaptive and Adaptable Interfaces
There has been little evaluation of adaptive and adaptable interfaces in the research
literature. Recently though, there has been increased recognition in the adaptive
user interface community of the importance of empirical evaluations [6, 26, 61].
Empirical evaluations are not generally expected for contributions in the user mod-
eling community, and the criteria for the success of adaptive systems have not been
well established [61]. This lack of standard criteria makes it difficult to interpret
results and generalize across studies. One issue, for example, is whether user mod-
eling can be deemed worthwhile if users significantly prefer an adaptive system [6],
or whether it is necessary to use efficiency measures as well.
Another issue cited by Hook is that many studies compare adaptive user
interfaces to static systems, in which the adaptivity was meant to be an integral
component of those systems [22]. Designers need to be careful to evaluate a fully
functional static interface which provides static functionality comparable to that
found in the adaptive interface. Hook also states that most adaptive systems will
only be really useful when they are part of the user’s work process for a longer period
of time, which points to a need for longitudinal evaluations. Such evaluations are
difficult and time-consuming, which is why they are relatively rare, even in the HCI
community.
One evaluation which has appeared in the human-computer interaction liter-
ature is a study by Greenberg and Witten, which compared the performance of an
adaptive menu to a static menu [17]. In a controlled experiment, users were asked
to search for names in a telephone directory in each of the two menu conditions.
Results showed that the adaptive structure, which provided a shorter search path to
the most frequently accessed items, was faster than the static structure. The study
18

was designed to be a proof of concept for the viability of adaptive interfaces. As
such, certain characteristics of the task, such as a relatively simple and stable user
model, were especially appropriate for an adaptive approach.
Conversely, Mitchell and Shneiderman presented a controlled experiment
comparing adaptive (or dynamic) menus to static menus, and found that 80% of
participants preferred the static menus [46]. The adaptive menus in this case were
continuously reordered so that the more frequently an item was selected, the closer
it would appear to the top of the menu. Speed and error rate were recorded and the
results showed that the static menu condition was significantly faster than the adap-
tive condition. In contrast to the Greenberg and Witten study above, the adaptive
menus in this study were not as amenable to efficient performance.
Cognitive modeling has also been used to study adaptive systems. Warren
used the Model Human Processor to predict the cost or benefit of using an “intel-
ligent” or adaptive split menu over a static split menu in a diagnosis system for
physicians [60]. Results from applying the model showed that the adaptive system
was beneficial in theory, however, their model is conservation and assumed that the
user does not have enough familiarity with the menu to anticipate item locations.
No adaptable design was evaluated.
While there has been little evaluation of adaptive systems, there has been
even less work done to evaluate adaptable systems, or to compare the two interaction
techniques to each other. One evaluation of an adaptable interface was done on the
Favorite Folders file browser, developed by Lee and Bederson [34]. Favorite Folders
is based on Windows Explorer but shows only a user-specified subset of directories,
which are often the most frequently accessed ones. The goal of the system is to
allow users to select the directory they want more easily and quickly. A simple
direct manipulation customization process uses an “ellipsis” node in which users
can hide folders. A preliminary field study showed positive user response, however,
the study was too short to determine whether there would be long-term adoption
19

of the system.
In a longitudinal field study, McGrenere, Baecker and Booth compared a
prototype adaptable interface for Microsoft Word 2000 to the native adaptive inter-
face of the same application [42]. Their adaptable interface included two interfaces
between which the user could easily toggle: a personalized interface that the user
constructed to include only desired functions, and the static full interface of Word
2000. The native interface provided users with an adaptively determined “short”
menu as described in Section 2.3. The study showed that, given an easy-to-use cus-
tomization facility, the majority of participants were able to customize their personal
interfaces according to the functions they used. Most participants also preferred the
adaptable interface to the native adaptive interface.
2.7 Summary
There have not been many studies to evaluate adaptive and adaptable interaction
techniques, either on their own or as a comparison. The results which have been
published are often conflicting, and as a whole can be considered inconclusive. Until
now, the only comparison that has been performed of adaptable and adaptive inter-
faces was the field work conducted in McGrenere, Baecker and Booth’s study [42].
Their work, however, did not compare the performance of these approaches and due
to the field nature of the evaluation, they were not able to counterbalance the two
conditions. Our study extends this research by specifically addressing the efficiency
of the menu designs. The combination of results from McGrenere, Baecker and
Booth’s longitudinal field study and our controlled lab experiments provides a more
complete understanding of the adaptable versus adaptive debate than either study
on its own. By providing evidence to show that users can customize effectively, we
hope to motivate further development of easy-to-use customization facilities so that
users can play a role in the adaptation process.
20

Chapter 3
Experimental Approach
The primary goal of this research is to compare the efficiency of static, adaptive, and
adaptable menus in a controlled experiment. In the design of such an experiment,
several methodological choices had to be made, such as how to define the menu
conditions and task. To compare the efficiency of different types of menu items,
the time to complete a sequence of menu selections and the number of errors made
were recorded. This chapter documents the core experimental approach taken in our
research. Although the focus is on design decisions made for our initial user study,
almost identical methods were used for the follow-up study. The specific motivation
and experimental design of each study along with other methodological differences
will be given in further chapters.
3.1 Menu Conditions
The static, adaptive and adaptable menu conditions used throughout this research
were implemented as split menus, a design briefly introduced in Chapter 2. While
split menus were originally proposed as static menus, the layout provided in a split
menu design can easily accommodate adaptive or adaptable behaviour. Items in
a static split menu are placed in the top or bottom partition of the menu based
on the frequency with which each item has been selected in the past. This is not
21
(a) Traditional menu (b) Static split menu
Figure 3.1: A traditional menu layout and a corresponding static split menu. In thestatic split menu the most frequently used items appear above the split (divider).
done dynamically, but rather when the menu is initially setup as a split menu.
In a traditional static menu (one that does not contain a split), items may be
ordered by strategies such as alphabetic or functional ordering. In a split menu,
this relative ordering of items is maintained within each partition. For example, if
St. John’s appears before Montreal in the traditional menu layout, it will appear
before Montreal if both are in the top or bottom partition of the split menu. Figure
3.1 shows an example of a traditional menu layout and a corresponding split menu.
Sears and Shneiderman used the following two preliminary design guidelines
for their studies with split menus [51]:
1. At most four items should appear in the top partition.
2. The partitioning function first sorts items by frequency. Starting with the
lowest frequency item, the list is scanned until the point when the difference
between successive frequencies is greater than the mean of all frequencies.
The top items on the high frequency side of that point are assigned to the top
partition, up to a maximum of 4.
We adopted the first guideline, but relaxed the second one such that four
22

items always appeared in the top partition for all three menu conditions. This
was done so that the size of the top partition would not be a confounding factor.
Although not explicitly listed as a guideline, Sears and Shneiderman implemented
static split menus. The following subsections describe the three split menu condi-
tions we used in greater detail, along with a fourth traditional menu condition that
was used in our second study.
3.1.1 Static Split Menu
This is a classic split menu whose layout does not change during the course of
use. The four most frequently occurring items in the selection sequence of the
experimental task are determined in advance, and are placed in the top partition of
the menu. Thus, this menu represents the ideal static split menu for the task. We
chose to use a split menu for our static menu condition since Sears and Shneiderman
had shown that static split menus were at least as fast as traditional menus [51].
Any result that shows an adaptive or adaptable menu to be at least as efficient as a
static split menu would therefore suggest that the same would hold for traditional
menus as well.
3.1.2 Adaptive Split Menu
An adaptive algorithm dynamically determines which items should appear in the
top partition of the menu, based on the user’s most frequently and recently used
items. Frequency and recency are two characteristics that should be used for devel-
oping history mechanisms, as suggested by empirical observations of Greenberg and
colleagues [16, 18]. Incorporating only the most frequently used items in the adap-
tive algorithm may be sufficient for selection sequences where individual items are
evenly distributed over the entire sequence; however, temporal groupings of several
menu items exist within our input data, so representing recently used items may
also be useful.
23

Recency and frequency are also the two main characteristics of the Microsoft
adaptive algorithm [44]. Since the primary focus of this research was not on devel-
oping an adaptive algorithm (a research problem which could be enough work for
an entire thesis on its own), we chose to create a reasonable algorithm that would
be practical to implement. Though there are problems with the Microsoft adaptive
algorithm, it is the most well-known example of an adaptive menu system. We did
not intend to model the Microsoft adaptive algorithm exactly; that algorithm allows
the size of the short menu (analogous to the top partition in a split menu) to change
dynamically, which is not supported in the split menu.
Our adaptive algorithm is shown in Figure 3.2. It designates two items in
the top partition to be frequency items, and two to be recency items, and always
ensures that there are four items in the top partition. The frequency items are the
two items that have been accessed the most, while the recency items are the two
most recently accessed of the remaining menu items.
(initially: item.frequency = item.recency = 0)
selectedItem.frequency++selectedItem.recency = 0
for each remaining item[i] in the menuitem[i].recency++if the selected item is in the top partition already
do nothingelse
leastRecItem = least recently used of the recency itemsleastFreqItem = least frequent of the frequency itemsif leastRecItem.frequency < leastFreqItem.frequency
move leastRecItem to bottom partitionelse
move leastFreqItem to bottom partitionset leastRecItem.type = frequency item
move selectedItem to top partition of menuset selectedItem.type = recency item
Figure 3.2: Adaptive algorithm.
24
The initial layout of the adaptive menu is meant to provide a reasonable
starting point for the interface. Instead of priming the adaptive algorithm with the
full set or a random sample of the task data, it is initially setup in the same way as the
static split menu (i.e., the four most frequent items in the task sequence are placed
above the split). We chose to do this rather than to leave the top part initially empty
because it provides the user with a well-setup, though not fully-trained interface.
This is similar to the experience of using a newly installed software package and is
the approach taken with such commercial applications as Microsoft Word 2000.
3.1.3 Adaptable Split Menu
The adaptable menu is a dynamic menu controlled by the user. An important goal of
the adaptable menu design was to make the adaptation process as simple as possible.
Two levels of customization are provided: coarse-grained customization allows items
to be moved to the top or bottom partition of the menu; fine-grained customization
allows items to be positioned in specific locations within the top partition. This
functionality also allowed users to move items back to the bottom of the menu if
they decided they would rather choose a different item. As shown in Figure 3.3,
arrow buttons allow the user to perform this customization with a single click. Note
that the fine-grained customization allows an extra degree of precision not available
in the other two menu conditions. The order of items in the bottom partition,
however, remains static.
The top partition of the adaptable split menu is initially left empty and it is
the user’s responsibility to add items (to a maximum of four). The reason for this
is that the literature suggests users are reluctant to customize unless forced to do so
[38]. By placing default items into the top partition, subjects would not have been
forced to customize, and therefore we expected they would have been less willing to
do so.
25

Figure 3.3: Coarse-grained and fine-grained customization of the split menu.
3.1.4 Traditional Menu
In addition to the split menu conditions just described, Study 2 used a traditional
menu. This is simply a static menu which uses the original menu layout and no split.
It is identical to the adaptable split menu before the adaptable menu is customized,
but does not change dynamically through user or system control. Figure 3.1 shows
a traditional menu.
3.2 Task
We took a similar approach to task construction as Greenberg and Witten [17].
Namely, we simulated a real-world task by constructing the experimental task based
on real menus and real menu selection data. We used 20 weeks of log data from
an office administrative assistant’s use of Microsoft Word 2000 (MS Word 2000).
The log data from this administrative assistant was collected in the year 2000,
with the adaptive menus in MS Word 2000 turned off. She identified herself as
an intermediate MS Word user. She had been using MS Word since 1987 and on
average spent 3 to 5 hours per day word processing. The original 11,000 entries
in the log included toolbar and shortcut key selections as well as menu selections.
26

After removing the other items, 1387 menu selections remained.
Basing the task on the MS Word menu structure and usage data allowed
us to assess the efficiency of the menu conditions on realistic menu lengths and
complexities. While the use of a real task scenario would have given users context
to help them understand the benefit of adapting their menus, this could have con-
founded performance results. For example, if the task were to format a document
in MS Word, subjects’ existing familiarity with the software and ability to format
documents could have accounted for most of the variability in performance. For
this reason, we abstracted away the task scenario, and set the task as a sequence
of menu selections. This is similar to Sears and Shneiderman’s second experiment
[51].
Given that in our first user study we wanted to compare three types of
menus (static, adaptive, and adaptable) using a within-subjects design, we required
three isomorphic, or structurally equivalent, tasks. This was done by creating three
similar menu schemes, or layouts, to use with a single underlying task sequence.
This was most easily accomplished with a multiple of three menus; therefore, we
selected the three most frequently accessed MS Word menus from the log data:
File, Format and Insert, which together accounted for 788 menu selections. We
chose not to include submenus because this would have introduced another variable
into the study design, complicating interpretation of the results. Instead, selections
from submenus were treated as a selection from the parent top-level menu item.
The resulting aggregate selection rates are shown in Figure 3.4. File, Format and
Insert represent a variety of item selection frequency distributions: File has a
highly skewed distribution; Insert has a less skewed distribution; Format has a
relatively even distribution.
Three menu schemes, shown in Figure 3.5, were created by the following
steps:
1. We counterbalanced the location of the menus themselves by permuting the
27

(a) File (15 items, 541 selections)
(b) Format (17 items, 134 selections) (c) Insert (15 items, 113 selections)
Figure 3.4: Frequencies of item selection from usage log data (total of 788 selections).
28

order of the underlying MS Word menus as follows: {File, Format, Insert},{Format, Insert, File}, and {Insert, File, Format}. The result was that
menu selections from the underlying File menu, for example, would not always
come from the leftmost menu in our experimental setup.
2. For each of the three permuted orders, we masked the menus to reduce the
learning effect across conditions. Each mask was simply a renaming of the
menu and the menu items. For example, the File→New menu item became
the Cities→Paris menu item. The masks for the three orders were:
(a) {File, Format, Insert}→{Cities, Drinks, Occupations}
(b) {Format, Insert, File}→{Countries, Furniture, People}
(c) {Insert, File, Format}→{Kitchen, Food, Animals}
A mask is a one-to-one mapping, so each masked menu had the same number
of items as the original menu. As well, since the original menu items were not
organized alphabetically, we did not order the masked items alphabetically
either. Although the original Word menus employed some semantic grouping
(e.g., Save, Save As..., and Save as Webpage... appeared consecutively),
no grouping of items within a menu was done for the menu masks in our
experiment. This is because our task was meant to be abstract, thus not
allowing for semantic grouping of items.
A task block consisted of a 200-item selection sequence. This corresponded
to roughly a 4-week period from the original data. The sequence was a contiguous
block of selections from the 788 File, Format, and Insert selections, thus reflecting
temporal patterns in the original data which could be important to the adaptation
process. The starting index for each subject’s sequence was chosen randomly be-
tween 1 and 588, to mitigate the influence of any specific 200-item sequence. Se-
quences were considered valid if they had at least four unique menu items and 20
selections in any given menu. A selection sequence could be combined with each of
29

(a) Scheme 1 (b) Scheme 2
(c) Scheme 3
Figure 3.5: The three menu schemes used to create isomorphic tasks.
30

the three schemes to create three isomorphic tasks. For example, in Study 1 where
each subject participated in multiple conditions, the same underlying sequence was
used for that subject, although with a different scheme for each condition.
3.3 Experimental Design Issues
Designing a controlled lab experiment to test adaptive and adaptable interaction
techniques presented unique challenges. Here, we highlight two such important
challenges.
3.3.1 Training
Training is central for both adaptive and adaptable interaction techniques. The
two issues to be addressed with respect to training are: (1) how to pre-train the
adaptive system, and (2) how to help the user build a mental model of the task.
With an adaptive interface, a user model can only function well if it has had sufficient
exposure to the user’s interaction, while with an adaptable interface, a user relies on
previous exposure to a system or task to formulate predictions for future use. Issue
(1) was discussed partly in Section 3.1.2, where we described the initial setup of the
adaptive menu. The adaptive menus were reset to this initial setup at the beginning
of each selection block. Some temporal patterns exist within the selection block
data (e.g., grouped usage of Save As...) which means that selections of individual
menu items may not be evenly distributed over the entire selection sequence. As
such, items which appear in the top of the adaptive menu at the end of the entire
selection sequence may not be relevant to the beginning of the selection sequence,
so we chose to reset the adaptive menus at the beginning of both Block 1 and Block
2.
Issue (2) was addressed through the use of a split-block design in our exper-
imental procedure. For each condition, subjects repeated the selection block twice;
Block 1 acted as a training component, while Block 2, an exact repetition of Block
31

1, was the testing component. For the adaptable menu, an opportunity to customize
was given during the break between the training and testing blocks. Since subjects
were told prior to starting any menu condition that they would be repeating the
exact same selection sequence twice, they were able to build a mental model of the
interaction before being given the opportunity to customize. We chose to allow for
customization at only one point because our main goal was to test the efficiency of
the final customized menus, rather than the customization process.
3.3.2 Motivation
Users need to feel motivated if they are to customize. In a realistic setting, this
motivation could be provided by a long-term understanding of a task and the po-
tential effect of customization on that task. To simulate the desire for efficiency in
a lab setting, subjects were told that an extra $10 would be provided to the 1/3 of
subjects who completed the selection blocks the fastest. The goal was to encourage
users to perform the task quickly, thereby motivating them to customize if they
recognized that doing so would make them more efficient. The 1/3 ratio was chosen
to encourage subjects to believe they had a reasonable chance of being paid the
additional $10.
3.4 Measures
Both quantitative and qualitative measures were used for our two studies. Here, we
present the quantitative measures; the qualitative measures were more dependent
on the individual study and will be discussed in each respective study chapter.
3.4.1 Performance
Speed and error rate are the two most obvious performance measures for this re-
search. We chose to use speed as the main dependent variable, and included an
32

implicit error penalty; that is, subjects were required to correctly select an item be-
fore continuing on to the next menu selection. Speed is then defined as the total time
to select all 200 items in the selection sequence. The use of an implicit error penalty
increases the ecological validity of the experiment. This type of system behaviour
corresponds more closely to real-world user interaction than if we had measured a
more traditional speed versus accuracy trade-off. Error rate was, however, recorded
independently for completeness.
3.4.2 Menu Layout
To further assess the effectiveness of customization, a straightforward menu layout
score can be derived based on the location of each item and the frequency with which
it occurred in the 200-item selection sequence. Although somewhat arbitrary, this
is a simple metric that also enables two menu layouts to be compared for quality.
The formula to derive a menu layout score is shown in Equation 3.1, where i is an
item, n is the total number of items, frequencyi is the frequency with which item
i is selected, and locationi is the location weighting of item i. The top item in the
menu receives a location weighting of 1, while the second item receives a location
weighting of 2, and so on.
score =n∑
i=1
frequencyi ∗ locationi (3.1)
Using this formula, the score of a menu is an estimation of the minimum
total distance the mouse has to travel to make all selections in the task sequence.
Lower scores represent better layouts.
3.4.3 Apparatus
Both studies were conducted on five Apple eMacs running Mac OS 10.1.4 with
Power PC G4 processors and 128 MB RAM. The experimental systems, including
all menus, were fully automated and were coded in Java 1.3.1. A screenshot of the
33

Figure 3.6: Screenshot of experimental system, showing the prompt area on theright-hand side and the menus at the top-left.
system used for Study 1 is shown in Figure 3.6. For each selection, a prompt specify-
ing a menu and item was presented on the screen, for example, Drinks→Rootbeer.
When the subject selected this item, the prompt changed to the next item in the
selection sequence. Errors were indicated by the addition of a red ‘X’ next to the
prompt, and the subject had to correctly select the prompted item before contin-
uing. All instructions used in the experimental system are given in Appendix B,
including the descriptions of the four menu conditions.
3.4.4 Procedure
While the overall procedure in each study will be discussed in the respective study
chapters, the method for presenting a menu condition to the subject is the same for
both studies. For each menu condition, the system provided a one or two sentence
description and indicated that two identical sequences of selections would be given
34

with a short break in between. Each condition was presented in the split-block design
introduced in Section 3.3.1. Between the training and testing blocks, subjects were
given a 2 minute break. For the adaptable condition, subjects were allowed to take
extra time during the break to customize their menus if they wished to do so. That
was their only opportunity to customize. Each condition took approximately 12
minutes from start to finish, and there was a 5 minute break in between conditions.
The background questionnaires used for Study 1 and Study 2 are almost
identical (see Appendix A). Although it would have been interesting to determine
if there was a correlation between performance on the adaptive split menus in these
studies and previous exposure to the adaptive menus in Microsoft Office or Windows
XP, we felt this specific type of question might have biased subjects’ responses to the
post-evaluation questionnaire by drawing their attention specifically to the adaptive
menu condition. As a result, the background questionnaire includes only a more
general question about what operating systems subjects regularly use.
3.5 Summary
The experimental approach outlined in this chapter provides the foundation for
our two controlled lab experiments. We have outlined static, adaptive and adapt-
able split menu and traditional menu conditions, and have described the process of
designing isomorphic tasks based on actual log data from Microsoft Word 2000. De-
sign issues such as training and motivation, and the way in which these have been
addressed are applicable to a wide range of research on adaptable and adaptive
interaction techniques, not just to the studies discussed in the following chapters.
35


Chapter 4
Study 1: Efficiency of Static,
Adaptive and Adaptable Split
Menus
Study 1 reflects the primary goal of this research: to compare the efficiency of static,
adaptive and adaptable menus in a controlled environment. The data gathered here
is complementary to previous work by McGrenere, Baecker and Booth [42], and
the results provide guidance for the remainder of the thesis. This chapter presents
the study design, the results, and a discussion motivating a smaller follow-up study,
namely Study 2 (Chapter 5).
4.1 Methodology
The methodology used for this study is based on the core experimental approach
documented in the previous chapter. Only additions and clarifications are high-
lighted here.
37

4.1.1 Menu Conditions
Three menu conditions were used: static, adaptive, and adaptable split menus. We
did not explicitly include a traditional static menu specifically because previous
results showed that a static split menu is at least as efficient as a traditional static
menu [51].
4.1.2 Measures
In addition to the quantitative measures of speed (which included an implicit er-
ror penalty) and actual error rate, a poll-style questionnaire was administered to
assess qualitative measures once all conditions had been completed. Subjects were
asked to rank order each menu condition according to the following criteria: overall
preference, efficiency, error rate, frustration, and initial ease of use.
4.1.3 Experimental Design
This study used a repeated measures design with menu type and scheme as within-
subjects factors (3 levels each), and blocked on order of presentation for both factors.
Menu type was chosen to be a within-subjects factor because this increased the power
of the design, and allowed for comparative comments on the three types of menus.
To provide isomorphic tasks, subjects were presented with a different scheme for
each menu type (although the underlying selection sequence was the same), thus
requiring that scheme be a within-subjects factor as well.
To minimize learning effects, we counterbalanced the order of presentation
for menu type and scheme, which we refer to as menu order and scheme order
respectively. The factors of menu type and scheme both have three levels, so fully
counterbalancing the orders would have required 3! x 3! = 36 cells in the design.
Due to cost and time constraints, a design this large was not desirable. To address
this, we used Latin squares to block on the two orders of presentation. As shown
in Figure 4.1, each Latin square had three levels: M1, M2 and M3 for menu order,
38

Order of BlockPresentation M1 M2 M3
1 A B C2 B C A3 C A B
A = StaticB = AdaptiveC = Adaptable
(a) Menu order
Order of BlockPresentation S1 S2 S3
1 D E F2 E F D3 F D E
D = Scheme 1E = Scheme 2F = Scheme 3
(b) Scheme order
Figure 4.1: Latin squares used for the blocking variables of scheme and order.
and S1, S2 and S3 for scheme order. When the two Latin squares were fully crossed
with each other, the number of required cells was reduced from 36 to 9, allowing us
to use a multiple of 9 subjects in the experiment. Using this approach, a sample
presentation order for one subject could be M1-S1, M2-S2, M3-S3, that is, the static
menu paired with scheme 1, followed by the adaptive menu paired with scheme 2,
and finally the adaptable menu paired with scheme 3.
4.1.4 Procedure
The experiment was designed to fit in a single one hour session. The procedure was
as follows:
1. A questionnaire (see Appendix A) was used to obtain information on user
demographics and computer experience.
2. Verbal instructions, supplementary to the online instructions, were given to
subjects. These provided an overview of the experiment and stressed the
importance of speed, introducing the extra $10 cash prize based on speed.
39
3. Users were given a short block of 20 selections on a static split menu to in-
troduce them to the experimental system. This was followed by a 1 minute
break.
4. The three menu conditions were presented one at a time, with a 5 minute
break between each. For the adaptable condition, additional time was given
for customization.
5. A feedback questionnaire (see Appendix A) was used to rank the menu con-
ditions on the qualitative dependent variables and to record additional com-
ments. Brief, informal interviews were also conducted with some of the sub-
jects based on their questionnaire data.
Instructions for customization were included in the experimental system after
Block 1 of the adaptable condition as follows:
“To customize the menus above, move items to the top section of the
menu using the single up arrows. There can be at most four items in the
top section. When an item is in the top section of the menu, two arrows
will appear beside it. These can be used to move the item within the
top section, or to move it back down to the original menu. When you
are done customizing, click the button below to continue.”
4.1.5 Pilot Study
Prior to running the full experiment, we performed two iterations of pilot testing
with a total of 8 subjects. All subjects were computer science or psychology stu-
dents who volunteered to participate and were paid $10 or $15 (corresponding to
two testing locations). The first iteration, with 3 subjects, was used primarily to
test our experimental procedure. Based on feedback, modifications were made to
clarify written instructions in the system and questionnaires. In addition, the data
collection process proved tedious and was further automated.
40

During the customization break (see Step 4 of Section 4.1.4), subjects did not
immediately realize when the menus were available to be customized. The menus
were not usually visible during break periods, so it was inconsistent that they were
visible during this break period. To solve this, we added a red box around the menu
bar, attracting the user’s attention. We also added a dialog box to confirm when
the customization process was done.
The second pilot study, with 5 subjects, was used to get a sense of whether
our experimental conditions had been well chosen and would yield significant differ-
ences. The mean completion times for the testing block of the static, adaptive, and
adaptable conditions were 332.5, 369.1, and 330.8 seconds respectively. In addition,
all subjects customized their menus when given the opportunity to do so. The re-
sults suggested that our experimental design was sufficient, so we proceeded with
the full study.
4.1.6 Study
The study was run over three days in September and October 2003.
Subjects
Subjects were recruited through the Department of Psychology at the University of
British Columbia and were paid $10 to participate for one hour. In total, 27 subjects
participated, resulting in 3 subjects per cell. All were between the ages of 18 and 39;
there were 6 males and 21 females. Ten described themselves as novice computer
users, 16 as intermediate users, and 1 as an expert user. All subjects regularly used
a Microsoft Windows operating system (ranging from Windows 98 to Windows XP);
in addition, Mac OS X and UNIX were used regularly by one subject each. Five
specified they used a computer 1-5 hours per week, while 13 used a computer from
5-10 hours per week, and 9 used a computer more than 10 hours per week.
41

Hypotheses
Based on our survey of related work, we wanted to test the following hypotheses:
• H1: Adaptive is slower than both static and adaptable. Since previous results
have shown that the majority of users prefer adaptable menus to adaptive
ones [42], we predicted that efficiency would be correlated. In addition, we
predicted that the dynamic nature of the adaptive menu would cause it to be
slower than an efficiently laid-out static split menu.
• H2: Adaptable is not slower than static. After an initial training period, users
would be able to customize their menus well enough for the adaptable menus
to compete with the static menus.
We also tested the following qualitative hypotheses to replicate previous re-
sults by McGrenere, Baecker and Booth [42]:
• H3: Adaptable is preferred to both adaptive and static.
• H4: Static is preferred to adaptive.
4.2 Results
To obtain measures for 27 subjects, 31 subjects completed the experiment. Three
data sets were discarded because of incomplete results (the experimental system
crashed midway through the experiment, most likely due to a resource issue with
one of the machines). The fourth data set was discarded because the subject did not
follow the given procedure, taking a 20-minute break in the middle of the experiment.
This extended rest period could have confounded results.
Of the 27 subjects who were retained, only 22 customized based on the task
sequence. Three subjects did not customize at all, and two did not appear to
understand the customization process, each placing four items in the top partition
42

of one out of the three menus before continuing to Block 2. For one subject, none
of the customized items were ever used in the selection sequence, and for the other,
two of the items were never used. The average time spent on customization for all
27 subjects was 142 seconds; for only the 22 who customized, it was 150 seconds.
As expected, because we had used an isomorphic task, no significant main,
interaction or ordering effects were found for scheme. Therefore, we collapsed across
scheme and all further analysis of the quantitative data was performed only on menu
and menu order. For simplicity, throughout the remainder of this thesis order refers
to menu order only.
4.2.1 Performance
Separate two-way ANOVA’s (order x menu) and post-hoc pair-wise comparisons
were calculated for both the speed and error dependent measures on the data
recorded in Block 2. Along with statistical significance, we report partial eta-squared
(partial η2)), a measure of effect size. Effect size is a measure of practical signifi-
cance, and is often more appropriate than statistical significance in applied research
in human-computer interaction [33]. To interpret partial eta-squared, .01 is a small
effect size, .06 is medium, and .14 is large.
Speed
The ANOVA results for the speed dependent variable are shown in Table 4.1; a
graphical representation is given in Figure 4.2. There was a significant difference
in speed based on the menu type used; that is, a significant main effect of menu
(F (1.44, 34.64) = 12.54, p < .001, partial η2 = .343). Additionally, the order in
which the menu conditions were presented disproportionately affected the speed of
performance for each menu type, that is, there was a significant interaction effect
between order and menu (F (2.89, 34.64) = 6.14, p = .002, partial η2 = .338).
43

Table 4.1: Two-way ANOVA (order x menu) for the speed dependent variable.
Source SS df MS F Sig. Partial η2
Menu 8509.34 1.44 5895.31 12.54* .001 .343Menu ∗ order 8322.34 2.88 2882.87 6.13* .002 .338Error(Menu) 16278.45 34.64 469.90
* Significant at p < .05
Figure 4.2: Boxplot of menu type versus speed (N=27), showing relative mediansof the three conditions, and the greater variation in the Adaptable condition thanthe other two conditions.
The data was non-spherical1, so we used the Greenhouse-Geisser adjustment to the
degrees of freedom to compensate for this. We had expected to find an ordering
effect, whereby subjects would perform more quickly as the experiment progressed,
but we had not expected an interaction effect between order and menu.
To examine the interaction effect in more detail, we compared each possible
pair of menu types for each of the three orders. The results are shown in Table 4.2.
This was done with post-hoc pair-wise comparisons, computed using a Bonferroni
adjustment. The three levels of order were: (1) Static-Adaptive-Adaptable, (2)
1One assumption of a repeated measures ANOVA is that the data be spherical. When thisassumption is violated, the Greenhouse-Geisser adjustment is commonly used to compensatefor non-spherical data.
44

Table 4.2: Pairwise comparisons for the speed dependent variable.
Menu (i) Menu (j) Mean Diff-erence (i-j)
Std.Error
Sig.a Partial η2
Order 1: Static-Adaptive-AdaptableStatic Adaptable 6.084 9.785 1.00 .065Static Adaptive -20.787∗ 5.356 .002 .681Adaptable Adaptive -26.871∗ 10.082 .041 .556Order 2: Adaptive-Adaptable-StaticStatic Adaptable -.623 9.785 1.00 .001Static Adaptive -29.478∗ 5.356 .001 .719Adaptable Adaptive -28.854∗ 10.082 .026 .500Order 3: Adaptable-Static-AdaptiveStatic Adaptable -42.327∗ 9.785 .001 .672Static Adaptive -25.048∗ 5.356 .001 .810Adaptable Adaptive 17.278 10.082 .298 .225
* The mean difference is significant at p < .05a Adjusted for multiple comparisons using Bonferroni
Adaptive-Adaptable-Static, and (3) Adaptable-Static-Adaptive. The comparisons
showed that static was significantly faster than adaptive for all three orders (p =
.002, p < .001, and p < .001 for orders 1, 2, and 3 respectively).
The interaction effect can be explained by looking at the relationship between
the adaptable menu condition and order. To aid in understanding the following
discussion, Figure 4.3 shows a graphical representation of the interaction. When
adaptable was not presented first, it was significantly faster than adaptive (p = .041
and p = .026 for orders 1 and 2 respectively). In addition, it was not significantly
different from the static condition. When adaptable was presented first (order 3),
however, it was significantly slower than static (p = .001), and not significantly
different from adaptive. In other words, those subjects who saw the adaptable
condition first were significantly slower, relative to the other conditions, than those
subjects who saw the adaptable condition as the second or third condition. In fact,
4 out of the 5 subjects who did not customize were in the adaptable condition first
(order 3). Table 4.3 shows that the mean speed for the adaptable condition in Block
45

Figure 4.3: Interaction of speed dependent variable.
Table 4.3: Means for selection speed of all subjects, and for only those subjects whocustomized (N=27).
All 27 Subjects 22 Who CustomizedMenu Block 1 Block 2 Block 1 Block 2
Static 327.23 306.51 323.79 301.76Adaptable 410.71 318.80 402.28 300.72Adaptive 354.22 331.62 352.37 326.86
2 drops from 318.80 to 300.72 seconds when only the 22 subjects who customized
are considered. This is almost identical to the static condition (301.76 seconds).
Implications of this finding are considered in Section 4.3.
Error rate
Since this study design used an implicit error penalty, we cannot analyze a tradi-
tional speed versus accuracy tradeoff. However, to justify our use of an implicit
penalty in the speed measure, error rates had to be relatively flat across conditions.
For example, if two conditions had a similar mean speed but the second had a higher
46

error rate, the second may actually have been faster once the time to recover from
errors is factored out. A two-way ANOVA (order x menu) was run for error rate
and no significant main effect was found (F (2, 48) = .139, p = .870, partial η2
= .006). Though this result cannot be considered conclusive because the observed
power was low (.070), it does not contradict the choice of study design. On aver-
age, 6.8, 6.6, and 6.9 errors were made during Block 2 of the static, adaptable, and
adaptive menu conditions respectively. A significant interaction effect was found
between order and menu (F (4,48) = 2.94, p = .030, partial η2 = .197), suggesting
that subjects made more errors at different points in the experiment, perhaps as
they were learning, or as they got tired. Using a Bonferroni adjustment, however,
no pair-wise comparisons were significant.
We note that the error rate results may not reflect real error rates because
subjects were told to maximize speed, rather than minimize error rate. A separate
study would need to be done to explore whether there is an actual difference in error
rate between the three menu conditions.
4.2.2 Self-reported Measures
For each of the five self-reported variables, we analyzed the frequency with which
each menu condition was ranked first. This was done by calculating the Chi-square
statistic to determine if actual frequencies were significantly different from the case
in which all frequencies are equal. A summary of the results is shown in Table 4.4.
There were no significant correlations between order and the results for any of these
variables.
Chi-square was significant for four out of the five self-reported measures. The
adaptable menu was ranked the most positive for each of these four variables. For
overall preference, the most popular choice was the adaptable menu (15 subjects,
χ2(2,27) = 6.89, p = .032). Sixteen subjects also perceived adaptable to be the most
efficient condition (χ2(2,27) = 8.22, p = .016). Only one person found adaptable
47
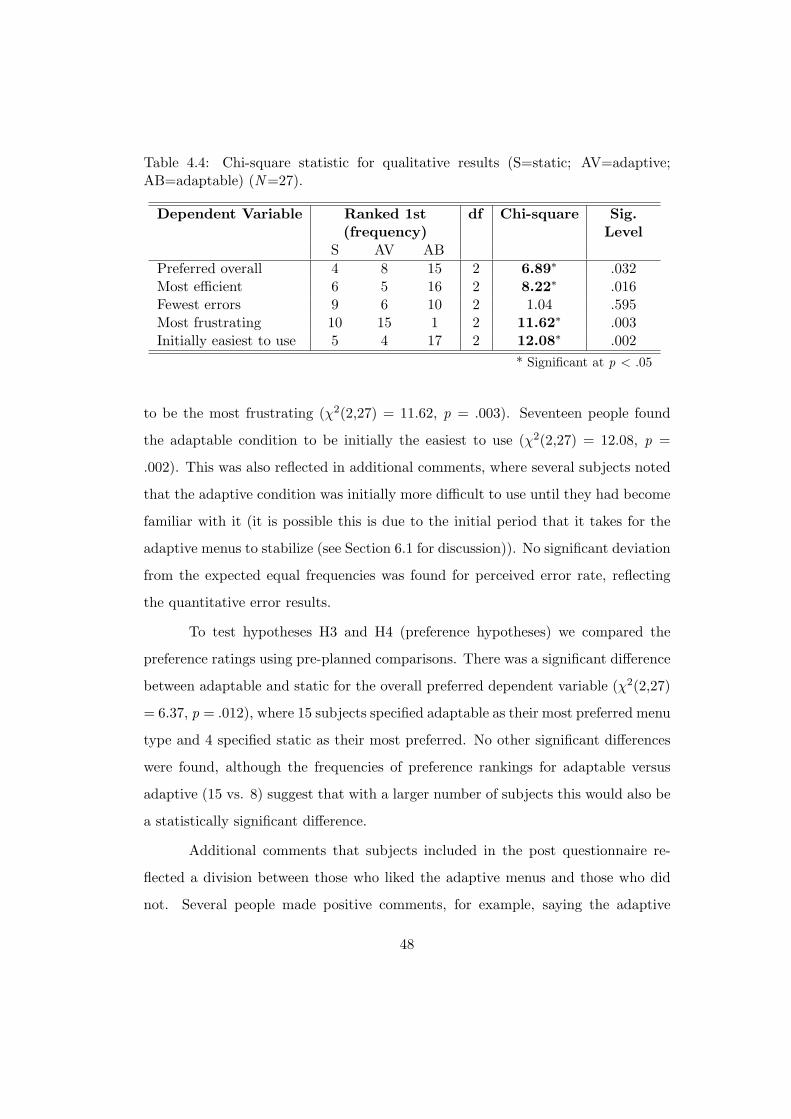
Table 4.4: Chi-square statistic for qualitative results (S=static; AV=adaptive;AB=adaptable) (N=27).
Dependent Variable Ranked 1st(frequency)
df Chi-square Sig.Level
S AV ABPreferred overall 4 8 15 2 6.89∗ .032Most efficient 6 5 16 2 8.22∗ .016Fewest errors 9 6 10 2 1.04 .595Most frustrating 10 15 1 2 11.62∗ .003Initially easiest to use 5 4 17 2 12.08∗ .002
* Significant at p < .05
to be the most frustrating (χ2(2,27) = 11.62, p = .003). Seventeen people found
the adaptable condition to be initially the easiest to use (χ2(2,27) = 12.08, p =
.002). This was also reflected in additional comments, where several subjects noted
that the adaptive condition was initially more difficult to use until they had become
familiar with it (it is possible this is due to the initial period that it takes for the
adaptive menus to stabilize (see Section 6.1 for discussion)). No significant deviation
from the expected equal frequencies was found for perceived error rate, reflecting
the quantitative error results.
To test hypotheses H3 and H4 (preference hypotheses) we compared the
preference ratings using pre-planned comparisons. There was a significant difference
between adaptable and static for the overall preferred dependent variable (χ2(2,27)
= 6.37, p = .012), where 15 subjects specified adaptable as their most preferred menu
type and 4 specified static as their most preferred. No other significant differences
were found, although the frequencies of preference rankings for adaptable versus
adaptive (15 vs. 8) suggest that with a larger number of subjects this would also be
a statistically significant difference.
Additional comments that subjects included in the post questionnaire re-
flected a division between those who liked the adaptive menus and those who did
not. Several people made positive comments, for example, saying the adaptive
48

Table 4.5: Mean layout scores for customization for the 22 subjects who customizedbased on the task sequence. (Selection sequences were randomly generated, so sub-jects had slightly different menu layout scores from one another, even for the tradi-tional menu.)
Menu Layout MeanScore
StandardDeviation
Improvement overTraditional
Adaptable 446.7 70.1 66.9%Traditional (MS Word) 1349.1 119.4 —Ideal adaptable 386.9 27.3 71.3%Static 453.1 42.8 66.4%
menus are fast “...before you know where things are really”. This refers to the fact
that one has to familiarize oneself with the menu structure before the adaptable and
static menus can be used efficiently. On the other hand, six people commented on
the inconsistency of the adaptive menus, saying that this made the menus frustrating
to use.
4.2.3 Menu Layout
As mentioned at the beginning of this chapter, only 22 of 27 subjects customized
based on the task sequence. Using these 22 data sets, menu layout scores were
calculated for each subject’s adaptable condition. In addition, a layout score was
computed for each of the following: traditional menu (original MS Word menu),
static split menu, and ideal adaptable split menu. Each of these was calculated
based on the specific 200-item selection sequence for a given subject. With the ideal
adaptable menu, the four items above the split were ordered from most to least
frequently used within the sequence; with the static split menu, the original relative
ordering of items (i.e., the ordering from the menu masks described in Section 3.2)
was maintained above the split. Table 4.5 shows a summary of the layout scores.
The results show that although subjects did not reach the optimal menu lay-
out afforded by the ideal adaptable menu (M = 446.7 and M = 386.9 for adaptable
and ideal adaptable respectively), they were able to achieve menu layouts that were
49

comparable to the static split layout (M = 453.1). This is complementary to the
results obtained from the speed analysis.
4.2.4 Summary of Results
We summarize our results according to our hypotheses:
• H1 (Adaptive is slower than both static and adaptable): The adaptive menu
was slower than the static menu. The adaptive menu was also slower than the
adaptable menu, except when subjects used the adaptable menu first.
• H2 (Adaptable is not slower than static): The adaptable menu was not slower
than the static menu, except when subjects used the adaptable menu first.
• H3 (Adaptable is preferred to both adaptive and static): The adaptable menu
was preferred to the static menu. There was also a trend, though not sta-
tistically significant, that suggested the adaptable menu is preferred to the
adaptive menu.
• H4 (Static is preferred to adaptive): Static was not preferred to adaptive.
4.3 Implications
Several factors for interface design can be drawn from the results of this study.
Influence of Exposure on Customization
Four of the five subjects who did not customize were given the adaptable condition
first. This interaction effect suggests that some users do not recognize the value of
customizing, even when the customization mechanism is easy to use. Subjects who
had seen the static or adaptive menus first recognized that placing the most frequent
items near the top resulted in better performance. Previous work had suggested that
50

users do not customize because the mechanisms are difficult to use [38]. Our work
suggests that easy-to-use mechanisms are not sufficient; exposure is also a factor.
To understand the effect of exposure on customization, we need to understand
what caused the interaction effect. We hypothesize the following explanations for
the interaction:
• H1 The exposure to different menus, in particular those with frequently or
recently accessed items at the top, impacts the user’s willingness to customize
(type of exposure).
• H2 The number of previous menu selections impacts the user’s willingness to
customize (duration of exposure).
• H3 It is a combination of type and duration of exposure that impacts the
user’s willingness to customize (combination of exposures).
• H4 This is simply a statistical artifact of our data and would not be present
in a replication of the study.
If the effect is produced by type of exposure, this suggests that for effective
customization, we may also need to guide users by providing examples, such as an
efficiently organized static split menu. Previous work using GOMS modelling has
shown that it is more efficient to customize up-front, prior to starting a task, than
as-you-go, throughout the task [5]. If the effect of exposure on customization is
produced by the duration of exposure, it may not be practical to expect users to
customize up front. In that case, further work would need to be done on how to
better encourage users to customize early on. In our Study 2, we chose to explore
the type of exposure (H1) as an explanation for the interaction.
Users Can Customize Effectively
Static split menus are the most efficient static menus documented in the literature.
Optimal efficiency can be achieved for a static split menu when the actual frequencies
51
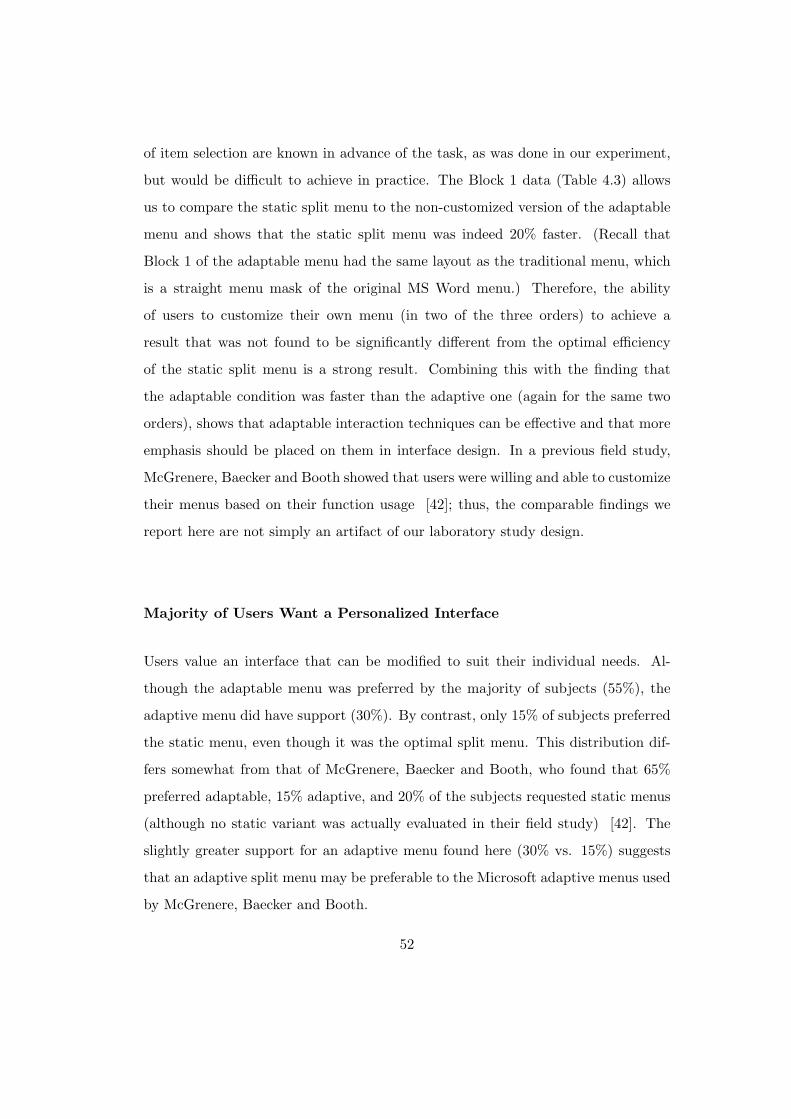
of item selection are known in advance of the task, as was done in our experiment,
but would be difficult to achieve in practice. The Block 1 data (Table 4.3) allows
us to compare the static split menu to the non-customized version of the adaptable
menu and shows that the static split menu was indeed 20% faster. (Recall that
Block 1 of the adaptable menu had the same layout as the traditional menu, which
is a straight menu mask of the original MS Word menu.) Therefore, the ability
of users to customize their own menu (in two of the three orders) to achieve a
result that was not found to be significantly different from the optimal efficiency
of the static split menu is a strong result. Combining this with the finding that
the adaptable condition was faster than the adaptive one (again for the same two
orders), shows that adaptable interaction techniques can be effective and that more
emphasis should be placed on them in interface design. In a previous field study,
McGrenere, Baecker and Booth showed that users were willing and able to customize
their menus based on their function usage [42]; thus, the comparable findings we
report here are not simply an artifact of our laboratory study design.
Majority of Users Want a Personalized Interface
Users value an interface that can be modified to suit their individual needs. Al-
though the adaptable menu was preferred by the majority of subjects (55%), the
adaptive menu did have support (30%). By contrast, only 15% of subjects preferred
the static menu, even though it was the optimal split menu. This distribution dif-
fers somewhat from that of McGrenere, Baecker and Booth, who found that 65%
preferred adaptable, 15% adaptive, and 20% of the subjects requested static menus
(although no static variant was actually evaluated in their field study) [42]. The
slightly greater support for an adaptive menu found here (30% vs. 15%) suggests
that an adaptive split menu may be preferable to the Microsoft adaptive menus used
by McGrenere, Baecker and Booth.
52

Perceived versus Measured Performance
The majority of subjects perceived themselves to be the most efficient with the
adaptable menus, even though they were actually less efficient than with the static
menus in one order, and were not significantly more or less efficient in the other two
orders. This is a surprising result for which we have no concrete explanation. The
results suggest, however, that providing users with control over their menus can lead
to both better perceived performance and higher overall satisfaction.
4.4 Discussion and Follow-up Study
This study found that the static split menus were significantly faster than the adap-
tive split menus, and that there was an interaction effect between the type of menu
and the order of presentation, such that the adaptable menus were faster than the
adaptive menus under certain conditions. As mentioned previously, we had not an-
ticipated that there would be an interaction effect between menu condition and the
order of presentation. Understanding this effect is crucial to predicting the actual
efficiency of adaptable menus.
One assumption of the Latin square design is that there are no interactions
between blocking variables (such as order) and treatments, or between blocking
variables themselves [47]. Since pilot testing with 8 subjects had indicated that
there would not be an interaction effect that included order of presentation, the
Latin square design appeared to be a valid approach to decrease the number of cells
from 36 to 9. An interaction effect was found in the full study, but because Latin
square designs are not fully-counterbalanced, we must be cautious about drawing
strong conclusions about the interaction.
In Section 4.3 we hypothesized several explanations for the effect of exposure
on customization. Given the results from Study 1, we considered the most likely
hypothesis to be that the type of exposure affects the user’s willingness to customize
53

(H1) and chose to explore it further. Since the Latin square design in Study 1 was
not fully counterbalanced, those subjects who were not presented with the adaptable
condition first were presented with either the adaptive condition or both the adaptive
and static conditions before starting the adaptable condition. Therefore, it is not
possible to discern whether exposure to the adaptive menu alone affected the user’s
willingness to customize, or whether exposure to the static menu would have had
the same positive effect. Both of these possibilities are explored in Study 2.
54

Chapter 5
Study 2: Effect of Exposure on
Customization
The results of Study 1 showed that there was an interaction effect involving the order
of presentation and speed on the three menu types. Four out of the five people who
did not customize effectively in that study were those who had seen the adaptable
menu condition first, without the prior exposure to static and adaptive menus that
was given with the other two orders of presentation. In Section 4.3, we hypothesized
several explanations for this interaction effect. The study presented in this chapter
was designed to investigate the first hypothesis: that the type of exposure a user
has prior to using the adaptable menus impacts the user’s willingness to customize.
In particular, we hypothesized that exposure to menus with frequently or recently
accessed items at the top provide the necessary experience to motivate the user to
customize.
We chose different types of exposure for this study based on the results from
Study 1. Each subject was presented with two conditions: one of three possible
exposure conditions and an adaptable condition. For both conditions, each subject
repeated the same selection sequence twice. In determining which types of exposure
to use, static and adaptive split menus were first selected because some subjects were
55

exposed to these conditions prior to the adaptable menu in Study 1. It was unclear
from Study 1 whether there is a difference in effect on customization efficiency
between the static and adaptive split menus as a type of exposure. In addition,
we chose to use the traditional menu as a type of exposure. With the split-block
design used in these studies (training block and testing block), subjects performed
the same task in a given condition twice; for the adaptable menu, the training block
was done on the original menu layout, which is essentially a traditional menu. For
this reason, we considered the traditional menu to be a third type of exposure which
may have contributed to the interaction in Study 1.
To take greater advantage of the investment required in running a study, a
secondary goal was also identified: to verify that a traditional menu layout is signif-
icantly slower than the static and adaptive split menu layouts. Since each subject
in this study will use one of traditional, static split or adaptive split menus as a
type of exposure prior to using the adaptable menus, we can compare the perfor-
mance on these three types of menus to each other. Although we did record data
on the traditional menu in Study 1 because it was an implicit part of the adaptable
menu condition, that data represented only the training block that was used in our
split-block design. The analysis done for Study 2 compares traditional, static split
and adaptive split menus with both training and testing blocks, in the same manner
as the three menu conditions were compared in Study 1. The comparison between
traditional and static split menus is a partial replication of Sears and Shneiderman’s
split menu work [51]; however, the comparison of a traditional menu to an adaptive
split menu is novel and was not answered in Study 1.
5.1 Methodology
Unless otherwise noted, the methodological details such as instructions for menu
conditions and apparatus used are as described in Chapter 3. Throughout this
chapter, we refer to types of exposure as “practice” menu conditions.
56
5.1.1 Practice Conditions
Traditional menu, static split menu, and adaptive split menu were chosen as three
types of practice.
5.1.2 Task
Two similar tasks were needed: one for the practice menu blocks, and one for the
adaptable menu blocks. These did not need to be isomorphic tasks, but to maintain
consistency with Study 1, we chose to use two of the isomorphic tasks described in
Chapter 3. In Study 1, no significant differences were found between the isomorphic
tasks, so we arbitrarily chose to use the first two schemes for Study 2. The schemes
were then paired with a different underlying 200-item selection sequence for each
subject.
5.1.3 Measures
In addition to speed and error rate, an obvious measure to analyze is the binary vari-
able of whether a subject customized or not. Given the variability we found between
subjects in Study 1, we predicted that we would need more subjects than realisti-
cally possible for our subject pool and time-line to achieve statistical significance
for this measure, so it was not included as a dependent variable.
Preference was recorded as a qualitative, self-reported measure on a post-
evaluation questionnaire (see Appendix A). Subjects were asked to rank their menu
type preference (practice menu vs. adaptable menu) on a 5-point Likert scale.
5.1.4 Experimental Design
Since we wanted to measure the effect of exposure, each subject could be exposed
to only one type of practice menu, thereby eliminating any possibility of learning
or transfer effects. As such, the design was between-subjects with one factor: type
of practice. Subjects were randomly assigned to one of the three levels of practice
57

so that each condition had an equal number of people. Separate one-way ANOVA’s
were used to calculate the main effect for each of speed and error rate.
Rather than assigning a randomly chosen selection sequence to each subject,
as in Study 1, we generated only 10 sequences, and used each sequence once in each
practice condition. Sequences were then randomly assigned within each condition.
This increased power by decreasing variability between groups, while still reducing
the effect of any one particular selection sequence.
Trade-offs always need to be made in designing a study, for example, between-
versus within-subjects designs, deciding on the total number of subjects required in
total, and the number of cells in the design. As discussed in this section, it was
necessary to use a between-subject design for Study 2. The statistical power of
Study 2 is therefore lower in than in Study 1, even though a roughly equal number
of subjects was used in each study.
5.1.5 Procedure
The experiment was designed to fit in a single 45 minute session. To clarify ter-
minology, we refer to each subject as having completed two practice blocks (which
could be on a traditional, static, or adaptive menu) and two adaptable blocks. The
procedure was as follows:
1. A questionnaire was used to obtain information on user demographics and
computer experience.
2. Verbal instructions, supplementary to the online instructions, were given to
subjects. These provided an overview of the experiment and stressed the
importance of speed, introducing the extra $10 cash prize based on speed.
3. Short block (20 item selections) to introduce the subjects to the experimental
system and to allow for questions, followed by a one minute break.
58

4. Practice menu blocks: 200-item selection sequence, two minute break, repeti-
tion of the same 200-item selection sequence.
5. Five minute break.
6. Adaptable menu blocks: 200-item selection sequence, two minute break, cus-
tomization period, repetition of the same 200-item selection sequence.
Extra $10 cash prizes based on speed were awarded as in Study 1, with the
additional step that we took into account each subject’s practice condition when
assessing comparative performance.
5.1.6 Apparatus
The experimental system used was similar to that of Study 1, with changes where
appropriate to accommodate the procedure for Study 2.
5.2 Study
After piloting with three subjects to test our experimental procedure, a study was
conducted in March and April 2004.
5.2.1 Subjects
Subjects were all undergraduate students with varying majors and were recruited
through the Department of Psychology at the University of British Columbia. In
total, 30 people participated. Each was paid either $5 or $10 (increased for the
end-of-the-semester period) to participate for a 45 minute session. All subjects
were between 18-29 years of age, with 6 males and 24 females. On the background
questionnaire (see Appendix A), 6 identified themselves as novice computer users,
20 as intermediate users, and 4 as expert users. All subjects specified that they
regularly used a Microsoft Windows operating system (ranging from Windows 98
59

to Windows XP); additionally, two people used Mac operating systems regularly.
Three used a computer 1-5 hours per week; 11 used a computer 5-10 hours per week;
16 used a computer more than 10 hours per week.
5.2.2 Hypotheses
This study is designed based on one explanation for the interaction effect found in
Study 1; that is, this study is based on the theory that exposure to different menus, in
particular those with frequently (and possibly recently) accessed items near the top
of the menu, impacts the user’s willingness to customize. The following hypotheses
were thus derived:
• H1. Efficiency of customization is no different for the adaptive and static split
menu practice conditions, since these menus share the characteristic that the
most frequently accessed items appear at the top of the menu.
• H2. Users customize least efficiently with the traditional practice condition
(i.e., a practice condition similar to the initial layout of the adaptable menus),
since the most frequently accessed items may be found anywhere in the menu.
5.3 Results
In total, 30 sets of data were obtained. Seven out of 10 subjects in each of the
traditional and static practice conditions customized according to the task sequence,
while all 10 subjects in the adaptive practice condition customized their menus.
Although a frequency analysis of this data would not be statistically significant
due to the small sample size, there may be a trend that people are more likely to
customize when they have seen the adaptive menu.
60

5.3.1 Performance
One-way ANOVA’s were calculated to assess the effect of practice on the speed
and error rate of the adaptable menu. In addition, by examining the practice blocks
only, a one-way ANOVA was calculated to compare the difference in efficiency of the
static, adaptive and traditional menus, and descriptive statistics were calculated to
examine learning between Block 1 and Block 2 of the static, adaptive and traditional
menus.
Performance of Adaptable Menus with Varying Practice Conditions
No significant main effect was found for practice on speed in the adaptable condition
using a one-way ANOVA (F (2, 27) = 1.379, p = .269, partial η2 = .093); that is,
the type of exposure did not seem to impact performance of the adaptable menus.
The test had relatively low statistical power (observed power = .271), however, so
the finding should not be considered conclusive. The mean completion times for
all subjects who were in the traditional, static, and adaptive practice conditions
were 347.0, 320.1, and 319.5 seconds respectively. To summarize the speed results,
Table 5.1 shows the mean completion times for both blocks of the adaptable con-
dition, broken into those subjects who did not customize, and those subjects who
did. The percentage improvement between Block 1 and Block 2 for those subjects
who customized was between 22.9% and 25.5% on average across the three practice
conditions. If we include the data for those subjects who did not customize, how-
ever, the average percentage improvement for subjects in the traditional and static
practice conditions decreases.
Using a one-way ANOVA, no significant effect was found for practice on
error rate (F (2, 27) = .033, p = .968, partial η2 = .002). On average, 7.0, 7.6,
and 7.9 errors were made during the adaptable Block 2 for the traditional, static,
and adaptive practice conditions respectively. The observed power was low (.054),
similar to the error rate ANOVA from Study 1, so the result is not conclusive.
61
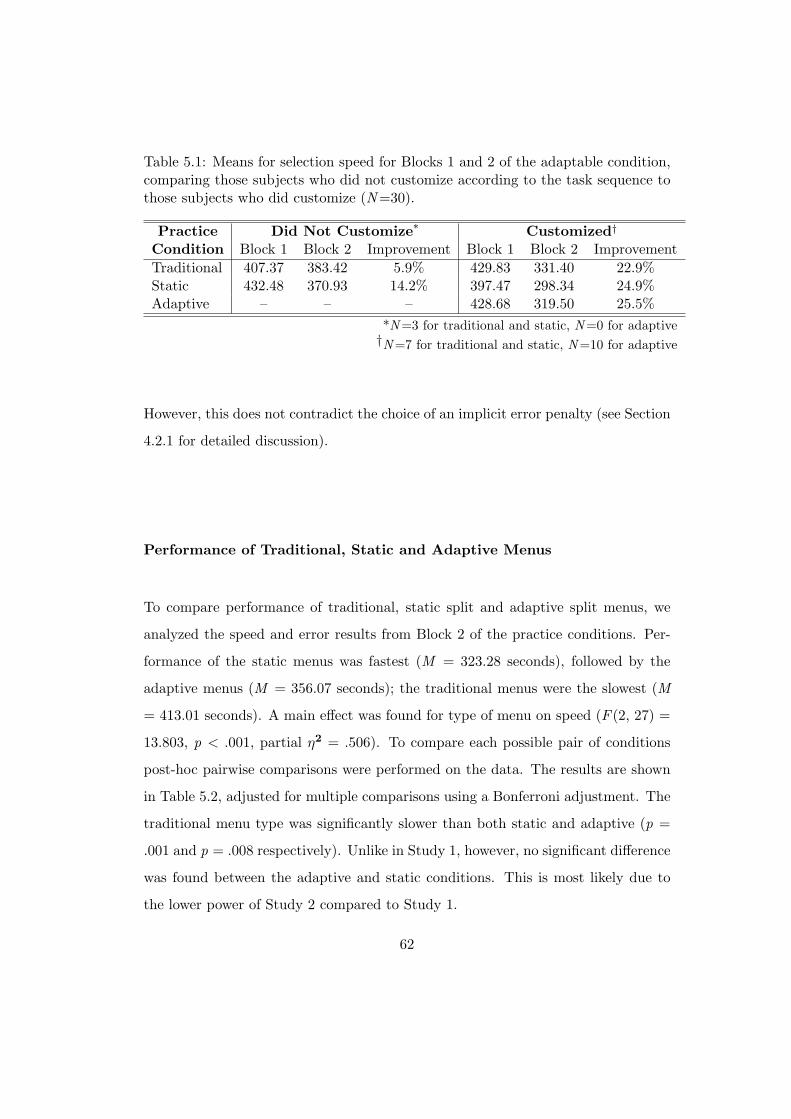
Table 5.1: Means for selection speed for Blocks 1 and 2 of the adaptable condition,comparing those subjects who did not customize according to the task sequence tothose subjects who did customize (N=30).
Practice Did Not Customize* Customized†Condition Block 1 Block 2 Improvement Block 1 Block 2 ImprovementTraditional 407.37 383.42 5.9% 429.83 331.40 22.9%Static 432.48 370.93 14.2% 397.47 298.34 24.9%Adaptive – – – 428.68 319.50 25.5%
*N=3 for traditional and static, N=0 for adaptive†N=7 for traditional and static, N=10 for adaptive
However, this does not contradict the choice of an implicit error penalty (see Section
4.2.1 for detailed discussion).
Performance of Traditional, Static and Adaptive Menus
To compare performance of traditional, static split and adaptive split menus, we
analyzed the speed and error results from Block 2 of the practice conditions. Per-
formance of the static menus was fastest (M = 323.28 seconds), followed by the
adaptive menus (M = 356.07 seconds); the traditional menus were the slowest (M
= 413.01 seconds). A main effect was found for type of menu on speed (F (2, 27) =
13.803, p < .001, partial η2 = .506). To compare each possible pair of conditions
post-hoc pairwise comparisons were performed on the data. The results are shown
in Table 5.2, adjusted for multiple comparisons using a Bonferroni adjustment. The
traditional menu type was significantly slower than both static and adaptive (p =
.001 and p = .008 respectively). Unlike in Study 1, however, no significant difference
was found between the adaptive and static conditions. This is most likely due to
the lower power of Study 2 compared to Study 1.
62

Table 5.2: Pairwise comparisons for speed dependent variable for Block 2 of thepractice conditions.
Menu (i) Menu (j) Mean Diff-erence (i-j)
Std.Error
Sig.a Partial η2
Traditional Static 89.731∗ 17.2834 .001 .574Traditional Adaptive 56.943∗ 17.2834 .008 .377Static Adaptive -32.788 17.2834 .206 .183
* The mean difference is significant at p < .05a Adjusted for multiple comparisons using Bonferroni
Table 5.3: Summary of self-reported preference measures (N=30).
PracticeCondition
AdaptablePreferred
AdaptableNot Preferred
Undecided
Adaptive 7 2 1Static 8 1 1Traditional 7 1 2Total 22 4 4
Learning of Traditional, Static and Adaptive Menus
To compare learning between traditional, static and adaptive menus, we calculated
the mean percentage decrease in completion time between Block 1 and Block 2 of
the practice conditions. There was an improvement of approximately 9% for all
three types of menu (N = 10 for all types of menu; M = 9.4%, SD = 3.3% for
traditional; M = 9.7%, SD = 2.5% for static; M = 8.5%, SD = 8.5% for adaptive).
Thus, our data did not show any difference in learning across the three types of
menus. However, since we only used two selection sequence blocks for this data, a
longitudinal study would be required to determine if there is a change in relative
learning performance over time.
63

5.3.2 Self-reported Measures
The preference rankings recorded by subjects are summarized in Table 5.3. The
results are similar to the preference results from Study 1, with the addition of the
traditional menu condition. Most people (22 of 30) in all three practice conditions
preferred the adaptable menu to the menu they used in the practice condition. A
Chi-square analysis to assess whether the total rankings differ from the case where
all categories are rated equal shows that there is a significant difference in the
number of people who preferred the adaptable menus to their respective practice
menu condition (χ2(2,30) = 21.60, p < .001).
All subjects who used the customization mechanisms stated that they did so
based on the frequency with which items appeared in the task sequence. Beyond
that, three subjects specified as well that they would choose an item closer to the
bottom of the menu if they needed to select between two items of approximately
similar frequency. Three subjects further ordered their items alphabetically within
the top partition.
For the five participants who did not customize, the reason given was that
they were already familiar with the menu layout and felt that it would be inefficient
to change it. For example, one subject noted: “... I have familiarized myself with
the location of items so did not want to change them.”
5.3.3 Customization (Menu Layout)
The mean menu layout scores for the adaptable menu are presented in Table 5.4.
When the layout scores of all subjects are compared, the subjects in the adaptive
practice condition have the lowest (best) mean score (M = 283.2), while mean
layout scores for the traditional and static practice conditions are more similar (M
= 553.5 and M = 495.7 respectively). With only those subjects who customized
their adaptable menus, the mean scores are all relatively close (M = 278.3, M
= 250.1, and M = 283.2 for traditional, static, and adaptive practice conditions
64
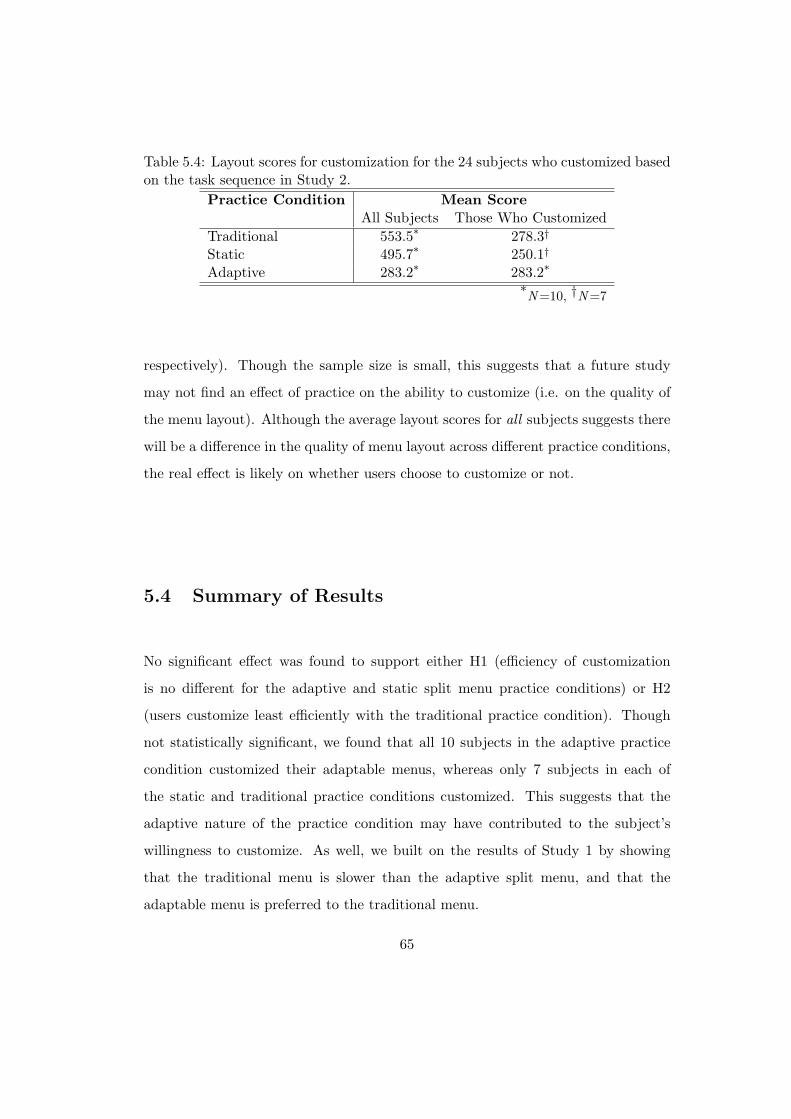
Table 5.4: Layout scores for customization for the 24 subjects who customized basedon the task sequence in Study 2.
Practice Condition Mean ScoreAll Subjects Those Who Customized
Traditional 553.5* 278.3†Static 495.7* 250.1†Adaptive 283.2* 283.2*
*N=10, †N=7
respectively). Though the sample size is small, this suggests that a future study
may not find an effect of practice on the ability to customize (i.e. on the quality of
the menu layout). Although the average layout scores for all subjects suggests there
will be a difference in the quality of menu layout across different practice conditions,
the real effect is likely on whether users choose to customize or not.
5.4 Summary of Results
No significant effect was found to support either H1 (efficiency of customization
is no different for the adaptive and static split menu practice conditions) or H2
(users customize least efficiently with the traditional practice condition). Though
not statistically significant, we found that all 10 subjects in the adaptive practice
condition customized their adaptable menus, whereas only 7 subjects in each of
the static and traditional practice conditions customized. This suggests that the
adaptive nature of the practice condition may have contributed to the subject’s
willingness to customize. As well, we built on the results of Study 1 by showing
that the traditional menu is slower than the adaptive split menu, and that the
adaptable menu is preferred to the traditional menu.
65
5.5 Discussion
Unfortunately, the study design had lower statistical power than we had anticipated.
This was the result of combining a between-subjects design with a task that had
relatively high individual variance. In estimating the number of subjects that would
be required to obtain significant results, we relied on similar individual variance as
in Study 1; however, this was not enough to compensate for the drop in statistical
power when using a between-subjects design over a within-subjects design. One
possible trend which we identified was that subjects may customize more efficiently
after exposure to the adaptive menu. If this trend were to hold for a larger sample
size, given the observed power of this study, we estimate that at least twice as many
subjects per cell would be needed to achieve statistical significance.
Study 2 tested the first of four possible explanations for the interaction effect
that was found in Study 1 (see Section 4.3): that the type of prior exposure affects
the user’s willingness to customize. Although no statistically significant effect was
found to support this hypothesis, we cannot safely conclude that the type of prior
exposure does not have an affect on willingness to customize because of the study’s
low power. This hypothesis should be retested in a future study. In addition, the
other three proposed explanations for the interaction effect in Study 1 have not yet
been tested and remain for future work. A larger sample size would also be needed
to determine if there is an effect of practice on the frequency of subjects choosing
to customize or not (i.e., to analyze frequency data using Chi-square would require
a much larger number of subjects).
66
Chapter 6
Conclusions and Future Work
The primary goal of the work presented in this thesis was to compare the efficiency
of static, adaptive, and adaptable interaction techniques. While previous work has
compared adaptive and adaptable interaction in a field setting [42], there has never
been a controlled comparison of the efficiency of these three techniques. Our work
addresses this gap and provides complementary results to strengthen the existing
body of research on adaptive and adaptable systems, and more generally on menu
design. Two separate studies were run to measure several aspects of the efficiency
of static, adaptive, and adaptable interaction techniques in the context of pull-down
menus. The implications for interface design and questions that have arisen will be
useful for guiding further research in the area.
6.1 Limitations
These studies were conducted as lab experiments, and as with any lab experiment,
there is a trade-off of realism and generalizability for increased precision [40]. The
limitations are tempered by the close connection with previous field study work
conducted by McGrenere, Baecker and Booth [42] in a more natural setting, and by
steps taken to maintain a degree of ecological validity, such as basing the task on
real usage data. Nonetheless, these issues should still be discussed.
67

In a realistic setting, several variables could affect the user’s ability to select
menu items and to customize a menu, including such factors as an extended time
between selections, switching between tasks, and the range of distractions that can
occur in a busy workplace. Since these experiments were performed over a relatively
short period of time, memory requirements placed on the user will inevitably differ
from those in a more realistic setting. In addition, though we addressed factors such
as motivation and training in our studies, these cannot be accounted for perfectly
in any lab setting.
The issue of generalizability arises for multiple reasons. First, our subject
pool was relatively constrained. Almost all subjects identified themselves as students
between the ages of 18 and 39. It is possible that due to the age and education
level of this population they have, in general, relatively high technical exposure and
expertise compared with other populations.
Furthermore, this experiment tested very specific adaptable and adaptive
systems. Questions remain as to how generalizable these menu conditions are to
other applications, and also how generalizable menu adaptivity is to other interaction
techniques. In particular, the adaptive algorithm used here was based on simple
values of frequency and recency, so that it would maintain some consistency with
Microsoft’s adaptive algorithm and would be reasonable to implement within the
scope of this research. A more sophisticated adaptive interface, however, may behave
differently and yield more positive (or possibly negative) results in comparison to
an adaptable interface.
Another possible limitation of the adaptive algorithm is that it required an
initial training period at the beginning of each selection block to attain a rela-
tively stable state (i.e., for the two most frequent menu items to remain unchanged
throughout the rest of the selection sequence). We chose to reset the adaptive algo-
rithm at the beginning of each selection block because data from a previous selection
block, or even from the end of the same selection block, may not have been relevant
68
to the current block. The result, however, was that 1, 8, and 18 selections were re-
quired on average from the Insert, Format, and File menus respectively for those
menus to stabilize in a given 200-item selection sequence. While this behaviour may
have had a negative impact on the performance of the adaptive menus, the extent
of this impact is unclear. Finally, the choice to initially populate the top part of
the adaptive split menus (consistent with the common commercial application, MS
Word) may have removed an opportunity for the user to better understand the
decisions of the adaptive algorithm. That is, if the top part of the adaptive split
menus had been initially empty and subsequently populated as a subject performed
a selection sequence, this may have given the subject a clearer understanding of the
adaptive algorithm.
6.2 Satisfaction of Thesis Goals
The research goal defined at the outset of this research was to compare the efficiency
of static, adaptive, and adaptable interaction techniques in a controlled setting. We
hoped that in the process of accomplishing this goal, we would also be able to
identify other trends about customization.
The primary goal was met through two studies. Study 1 was designed with
the initial aim of comparing the efficiency of static, adaptive, and adaptable split
menus, while Study 2 was designed as a follow-up study. The main measure of
efficiency used in both studies was speed, which included an implicit error penalty.
The results of Study 1 showed that static split menus are significantly faster
than adaptive split menus. In addition, the adaptable split menus were dispro-
portionately affected by the order of presentation. When the adaptable menu was
the first condition presented to the subject, the adaptable menu was slower than
the static menu, and not significantly different from the adaptive menu. However,
when the adaptable menu was not the first condition, the adaptable menu was faster
than the adaptive menu, and not significantly different from the static menu. Un-
69

derstanding this interaction is important to predicting the overall performance of
adaptable menus; however, we were unable to draw strong conclusions about the
nature of this effect because Study 1 used a Latin square design, which did not allow
us to identify which component of the study caused the interaction effect.
Several possible explanations can be hypothesized for the interaction effect.
In Study 2, we chose to explore whether the type of prior exposure affects the user’s
willingness to customize because we considered this to be the most likely explanation
given the results from Study 1. No significant effect was found for type of exposure
(i.e., traditional, static split, and adaptive split menus) on the performance of the
adaptable menus. However, due to high individual variation on the experimental
task, the study had low statistical power and the results should not be considered
conclusive. This remains to be explored further, but leaves open the possibility that
the duration of practice may have a stronger effect on the efficiency of the adaptable
menus than does the type of practice.
Study 2 further contributed to the primary objective of this thesis because it
allowed for the evaluation of a traditional menu (i.e., no split) to static and adaptive
split menus. As expected, the traditional menu was significantly slower than the
static split menu, replicating previous results by Sears and Shneiderman [51]. In
addition, however, the traditional menus were found to be significantly slower than
the adaptive split menus. Since a static split menu may not be feasible in a realistic
setting because the frequently used menu items need to be known in advance of
deployment to the user, traditional and adaptive menus may be more useful in
practice. In such a situation, our results show that an adaptive alternative may be
preferable.
Through Study 1, we have shown that adaptable menus can be as efficient
as an optimal static split menu, and more efficient than an adaptive split menu.
Study 1 implies that there are conditions that need to exist in order to achieve this
efficiency, in particular the duration and/or type of prior exposure; however, we
70
have not yet proven which of these conditions is required.
Implications and secondary trends have been discussed throughout this the-
sis, contributing to a deeper understanding of customization. The results of Study
1 suggested that giving users control over their menus through an adaptable mech-
anism may increase the perceived efficiency of the menus. In Study 2, based on the
post-evaluation questionnaires, we found that subjects unanimously chose to place
items in the top section of their adaptable menu based on the perceived frequency
with which those items had occurred in the selection sequence. In addition, a few
subjects chose to further arrange menu items alphabetically within the top part of
the menu. Finally, our studies found overwhelming support for personalized menu
design. Even though more users preferred the adaptable menu to the adaptive menu
in Study 1, the users who preferred the adaptive one expressed strong support for
it. This suggests that combining the two in a mixed-initiative design may be the
best way to satisfy a wide range of users.
6.3 Future Work
In addition to retesting the hypotheses of Study 2, several possibilities for future
research arise from our results. Some of these are direct extensions that explore
specific trends we have identified, whereas others are broader, more open possibilities
that build upon these results to examine new issues. The following points briefly
outline some areas for potential research.
Adaptive versus Adaptable Interaction for Different User Groups
Adaptable and adaptive approaches need to be explored in the context of accessible
interfaces for diverse user populations. Our sample was quite homogeneous; the
generalizability to other populations is worth further study. For example, children
may acclimatize easily to an adaptive interface, while elderly users may find adaptive
interfaces to be relatively incomprehensible.
71

Mixed-Initiative Interfaces
In mixed-initiative interfaces, the system and the user share control of the interac-
tion. Evaluation of this interaction style has received little attention in the research
literature. One possibility for extending our work into this area would be to provide
periodic suggestions from an adaptive system on what to add or delete from the top
partition of a user’s split menu, and measure the effect of these suggestions on the
user’s customization efficiency (as proposed in [5]). Another option would be to use
a “pinning” metaphor like the Microsoft Windows XP start menu; that is, an adap-
tive algorithm would place items in the menu, and users could permanently choose
to keep items in the menu by “pinning” them to the menu [45]. These types of
approaches have potential to produce more efficient interfaces than either adaptive
or adaptable interaction alone.
Adaptive Algorithm Transparency
The issue of predictability has been identified as a major challenge facing adaptive
interfaces [23]. One question that is a direct extension of this work is whether
knowledge of the internal process of the adaptive algorithm will affect the user’s
satisfaction and perceived efficiency. One could examine, for example, three levels
of knowledge: no knowledge, a high-level overview (i.e., this algorithm chooses the
most recent and most frequent items), and detailed understanding.
Other Types of Menus: Replication with Microsoft’s Personalized Menus
The adaptive menus found in Microsoft Office 2000 and XP display only a subset of
the menu items when they are initially opened. The full set is opened by hovering
the mouse pointer in the menu for a few seconds, or by clicking on an arrow at the
bottom of the menu. The performance differences between the static, adaptive, and
adaptable approaches may in fact be larger for menus with hidden items than for
split menus, as it takes longer for people to search for an item that is absent than
72

for an item which is visible [63]. As well, the delay or extra click to view the full
set of menu items is likely to slow down performance on this type of adaptive menu
even more. These two aspects combined could exaggerate differences between the
three types of menu.
Field Study
The hypotheses from the studies discussed in this thesis should be retested in a field
study to explore issues that would arise in a more naturalistic setting. In particular,
a field study would be useful to follow-up on the trend (identified in Study 2) that
suggests that exposure to an adaptive interface could encourage users to customize.
Although we dealt with the issue of motivation in our lab study, it will be important
to determine what types of differences there are in a setting with realistic time
and motivation constraints. For example, when users are distracted by tasks and
environmental factors, or are under other external pressure (such as deadlines at
work), their willingness to customize may decrease but could be partially offset by
providing exposure to an adaptive interface.
6.4 Concluding Remarks
This work should be seen as an initial step towards developing a thorough under-
standing of the efficiency of static, adaptive, and adaptable interaction techniques.
The results and implications presented in this thesis should in particular motivate
further research on customization and the factors which affect it. Before developing
guidelines and theories that will be appropriate for a wide range of applications,
further work needs to be done to evaluate these interaction techniques in terms of
other interface components and interaction metaphors.
73


Bibliography
[1] Bederson, B. B. (2000). Fisheye menus. In Proceedings of the 13th annualACM symposium on User interface software and technology, (pp. 217–225).ACM Press.
[2] Billsus, D., Brunk, C., Evans, C., Gladish, B., & Pazzani, M. J. (2002). Adap-tive interfaces for ubiquitous web access. Communications of the ACM, 45 (5),34–38.
[3] Blom, J. (2000). Personalization: A taxonomy. In CHI ’00 extended abstractson Human factors in computing systems, (pp. 313–314). ACM Press.
[4] Brusilovsky, P. (2001). Adaptive hypermedia. User Modeling and User-AdaptedInteraction, 11 (1-2), 87–110.
[5] Bunt, A., Conati, C., & McGrenere, J. (2004). What role can adaptive supportplay in an adaptable system? In Proceedings of the 9th international conferenceon Intelligent user interface, (pp. 117–124). ACM Press.
[6] Chin, D. N. (2001). Empirical evaluation of user models and user-adaptedsystems. User Modeling and User-Adapted Interaction, 11 (1-2), 181–194.
[7] Conati, C., & VanLehn, K. (2000). Toward computer-based support of meta-cognitive skills: A computational framework to coach self-explanation. Inter-national Journal of Artificial Intelligence in Education, 11, 389–415.
[8] Debevc, M., Meyer, B., Donlagic, D., & Svecko, R. (1996). Design and evalua-tion of an adaptive icon toolbar. User Modeling and User-Adapted Interaction,6, 1–21.
[9] Eisenberg, M., & Fischer, G. (1994). Programmable design environments: inte-grating end-user programming with domain-oriented assistance. In Proceedingsof the SIGCHI conference on Human factors in computing systems, (pp. 431–437). ACM Press.
75

[10] Findlater, L., & McGrenere, J. (2004). A comparison of static, adaptive, andadaptable menus. In Proceedings of the ACM Conference on Human Factorsin Computing (CHI 2004), (pp. 89–96).
[11] Fink, J., Kobsa, A., & Nill, A. (1998). Adaptable and adaptive informationprovision for all users, including disabled and elderly people. New Review ofHypermedia and Multimedia, 4, 163–188.
[12] Fischer, G. (2001). User modeling in human-computer interaction. User Mod-eling and User-Adapted Interaction, 11 (1-2), 65–86.
[13] Fitzmaurice, G., Khan, A., Pieke, R., Buxton, B., & Kurtenbach, G. (2003).Tracking menus. In Proceedings of the 16th annual ACM symposium on Userinterface software and technology, (pp. 71–79). ACM Press.
[14] Gajos, K., & Weld, D. S. (2004). Supple: automatically generating user in-terfaces. In Proceedings of the 9th international conference on Intelligent userinterface, (pp. 93–100). ACM Press.
[15] Gong, Q., & Salvendy, G. (1995). An approach to the design of skill adaptiveinterface. International Journal of Human-Computer Interaction, 7 (4), 365–383.
[16] Greenberg, S. (1993). The computer user as toolsmith: The use, reuse, andorganization of computer-based tools. Cambridge University Press.
[17] Greenberg, S., & Witten, I. (1985). Adaptive personalized interfaces: A ques-tion of viability. Behaviour and Information Technology, 4 (1), 31–45.
[18] Greenberg, S., & Witten, I. (1988). How users repeat their actions on comput-ers: principles for design of history mechanisms. In Proceedings of the SIGCHIconference on Human factors in computing systems, (pp. 171–178). ACM Press.
[19] Grundy, J. C., & Hosking, J. G. (2002). Developing adaptable user interfacesfor component-based systems. Interacting with Computers, 14 (3), 175–194.
[20] Gustafson, T., Schafer, J. B., & Konstan, J. (1998). Agents in their midst:Evaluating user adaptation to agent-assisted interfaces. In Proceedings of the3rd international conference on Intelligent user interfaces, (pp. 163–170). ACMPress.
[21] Hochheiser, H., Kositsyna, N., Ville, G., & Shneiderman, B. (1999).Performance benefits of simultaneous over sequential menus as task
76
complexity increases. CS-TR-4066, University of Maryland. URLciteseer.ist.psu.edu/article/hochheiser00performance.html.
[22] Hook, K. (1997). Evaluating the utility and usability of an adaptive hypermediasystem. In Proceedings of the 2nd International Conference on Intelligent UserInterfaces, (pp. 179–186). ACM Press.
[23] Hook, K. (2000). Steps to take before intelligent user interfaces become real.Journal of Interacting with Computers, 12 (4), 409–426.
[24] Horvitz, E. (1999). Principles of mixed-initiative user interfaces. In Proceedingsof the Conference on Human Factors in Computing Systems (CHI ’99), (pp.159–166). ACM Press.
[25] Hsi, I., & Potts, C. (2000). Studying the evolution and enhancement of softwarefeatures. In Proceedings of the International Conference on Software Mainte-nance, (pp. 143–151).
[26] Jameson, A. (2003). Adaptive interfaces and agents. In J. A. Jacko & A. Sears(Eds.), The human-computer interaction handbook, (pp. 305–330). LawrenceErlbaum Associates.
[27] Jameson, A., & Schwarzkopf, E. (2002). Pros and cons of controllability: Anempirical study. In Proceedings of Adaptive Hypermedia, (pp. 193–202).
[28] Kaufman, L., & Weed, B. (1998). Too much of a good thing? Identifying andresolving bloat in the user interface: A CHI 98 workshop. SIGCHI Bulletin,30 (4), 46–47.
[29] Kay, J. (2001). Learner control. User Modeling and User-Adapted Interaction,11, 111–127.
[30] Kuhme, T., Malinowski, U., & Foley, J. D. (1993). Facilitating interactive toolselection by adaptive prompting. In INTERACT ’93 and CHI ’93 conferencecompanion on Human factors in computing systems, (pp. 149–150). ACM Press.
[31] Kurtenbach, G., & Buxton, W. (1994). User learning and performance withmarking menus. In Proceedings of the SIGCHI conference on Human factorsin computing systems, (pp. 258–264). ACM Press.
[32] Kurtenbach, G., Fitzmaurice, G. W., Owen, R. N., & Baudel, T. (1999). Thehotbox: efficient access to a large number of menu-items. In Proceedings of theSIGCHI conference on Human factors in computing systems, (pp. 231–237).ACM Press.
77
[33] Landauer, T. (1997). Chapter 9: Behavioral research methods in human-computer interaction, (pp. 203–227). 2nd ed. Elsevier Science B.V.
[34] Lee, B., & Bederson, B. B. (2003). Favorite folders: A configurable, scalablefile browser. Tech report HCIL-2003-12, CS-TR-4468, UMIACS-TR-2003-38,University of Maryland.
[35] Linton, F., Joy, D., Schaefer, H.-P., & Charron, A. (2000). Owl: A recommendersystem for organization-wide learning. Educational Technology & Society, 3 (1).
[36] Ma, J., Kienle, H. M., Kaminski, P., Weber, A., & Litoiu, M. (2003). Cus-tomizing Lotus Notes to build software engineering tools. In Proceedings of the2003 conference of the Centre for Advanced Studies conference on Collaborativeresearch, (pp. 211–222). IBM Press.
[37] Mackay, W. E. (1990). Patterns of sharing customizable software. In Proceedingsof the 1990 ACM conference on Computer-supported cooperative work, (pp. 209–221). ACM Press.
[38] Mackay, W. E. (1991). Triggers and barriers to customizing software. In Pro-ceedings of the Conference on Human Factors in Computing Systems (CHI ’91),(pp. 153–160).
[39] MacLean, A., Carter, K., Lovstrand, L., & Moran, T. (1990). User-tailorablesystems: pressing the issues with buttons. In Proceedings of the SIGCHI con-ference on Human factors in computing systems, (pp. 175–182). ACM Press.
[40] McGrath, J. E. Methodology matters: Doing research in the behavioral andsocial sciences. In R. M. Baecker, J. Grudin, W. Buxton, & S. Greenberg (Eds.),Readings in Human-Computer Interaction: Towards the Year 2000, (pp. 152–169).
[41] McGrenere, J. (2002). The Design and Evaluation of Multiple Interfaces: ASolution for Complex Software. Ph.D. thesis, University of Toronto.
[42] McGrenere, J., Baecker, R., & Booth, K. (2002). An evaluation of a multipleinterface design solution for bloated software. CHI Letters, 4 (1), 163–170.
[43] McGrenere, J., & Moore, G. (2000). Are we all in the same “bloat”? InProceedings of Graphics Interface, (pp. 187–196).
[44] Microsoft Corporation (1998). Microsoft Office 2000 Product Enhance-ments Guide. URL http://www.microsoft.com/Office/previous/2000/-
ofcpeg2000.asp. Available online July 2004.
78
[45] Microsoft Corporation (2004). Windows XP Professional Product Doc-umentation: Start menu overview. URL http://www.microsoft.com/-
resources/documentation/windows/xp/all/proddocs/en/us/-
win start overview.mspx.
[46] Mitchell, J., & Shneiderman, B. (1989). Dynamic versus static menus: Anexploratory comparison. SIGCHI Bulletin, 20 (4), 33–37.
[47] Neter, J., Wasserman, W., & Kutner, M. H. (1990). Applied Linear StatisticalModels. 3rd ed. Homewood, Illinois: Irwin.
[48] Norman, D. (1998). The invisible computer. MIT Press.
[49] Norman, K. L. (1991). The Psychology of Menu Selection: Designing CognitiveControl at the Human/Computer Interface. Ablex Publishing Corporation.
[50] Page, S. R., Johnsgard, T. J., Albert, U., & Allen, C. D. (1996). User cus-tomization of a word processor. In Proceedings of the SIGCHI Conference onHuman Factors in Computing Systems, (pp. 340–346). ACM Press.
[51] Sears, A., & Shneiderman, B. (1994). Split menus: Effectively using selectionfrequency to organize menus. ACM TOCHI, 1 (1), 27–51.
[52] Shneiderman, B. (1997). Direct manipulation for comprehensible, predictableand controllable user interfaces. In Intelligent User Interfaces, (pp. 33–39).
[53] Shneiderman, B., & Maes, P. (1997). Direct manipulation vs. interface agents:Excerpts from debates at IUI 97 and CHI 97. Interactions, 4 (6), 42–61.
[54] Shute, V. J., & Psotka, J. (1996). Intelligent tutoring systems: Past, present,and future. In D. Jonassen (Ed.), Handbook of Research on Educational Com-munications and Technology, (pp. 570–600). Macmillan.
[55] Stephanidis, C., Akoumianakis, D., & Savidis, A. (1995). Design represen-tations and development support for user interface adaptation. In Proceed-ings of 1st ERCIM Workshop on User Interfaces for all. ERCIM Press. URLciteseer.ist.psu.edu/stephanidis95design.html.
[56] Stephanidis, C., Paramythis, A., Sfyrakis, M., Stergiou, A., Maou, N., Leventis,A., Paparoulis, G., & Karagiannidis, C. (1998). Adaptable and adaptive userinterfaces for disabled users in the AVANTI project. In Proceedings of the 5thInternational Conference on Intelligence and Services in Networks, (pp. 153–166). Springer-Verlag.
79

[57] Thomas, C., & Krogsoeter, M. (1993). An adaptive environment for the userinterface of excel. In Proceedings of Intelligent User Interfaces (IUI ’93), (pp.123–130).
[58] Trewin, S. (2000). Configuration agents, control and privacy. In Proceedings ofthe 2000 Conference on Universal Usability, (pp. 9–16). ACM Press.
[59] Tsandilas, T., & m. c. schraefel (2003). User-controlled link adaptation. InProceedings of the Fourteenth ACM Conference on Hypertext and Hypermedia,(pp. 152–160). ACM Press.
[60] Warren, J. (2001). Cost/benefit based adaptive dialog: Case study using em-pirical medical practice norms and intelligent split menus. In Proceedings IEEEAustralasian User Interface Conference (AUIC 2001), (pp. 100–107).
[61] Weibelzahl, S., & Weber, G. (2002). Advantages, opportunities, and limitsof empirical evaluations: Evaluating adaptive systems. Kunstliche Intelligenz,3/02, 17–20.
[62] Weld, D. S., Anderson, C., Domingos, P., Etzioni, O., Gajos, K., Lau, T., &Wolfman, S. (2003). Automatically personalizing user interfaces. In Proceedingsof the 18th International Joint Conference on Artificial Intelligence.
[63] Wolfe, J. M. (1998). What can 1 million trials tell us about visual search?Psychological Science, 9, 33–39.
80

Appendix A
Study 1 Questionnaires
81

Part I: Background Questionnaire
1. In what age group are you?
2 19 and under2 20 - 292 30 - 392 40 - 492 50 - 592 60+
2. Gender:
2 Male2 Female
3. Are you right-handed or left-handed?
2 Right-handed2 Left-handed
4. How many hours a week on average do you use a computer (including workand non-work related activities)?
2 < 12 1 - 52 5 - 102 > 10
5. Which operating systems do you currently use on a regular basis (at least ona weekly basis)? Please tick all that apply.
2 Windows (Microsoft)2 Windows XP2 Windows 20002 Windows ME2 Windows 982 Windows 952 Other - please specify:
2 Mac (Apple)2 OS X2 OS 9 or lower
2 Unix - specify window manager:
82

6. In terms of computer expertise, would you consider yourself to be:
2 Novice2 Intermediate2 Expert
7. In terms of your current occupation, how would you characterize yourself?
2 Writer2 Administrative Assistant2 Journalist2 Secretary2 Academic2 Professional2 Technical expert2 Student2 Designer2 Adminstrator/Manager2 Other, please specify:
83

Part II: Feedback Questionnaire
To refresh your memory, there were three menu schemes used in the experiment:
Static scheme: Locations of items in the menu did not change while youused the menus.
Adaptive scheme: Placement of items was adjusted by the computer as youused the menus.
Adaptable scheme: The menus did not change as you used them, however, youwere given an opportunity to customize them yourself.
Please answer the following questions. A space below each question is providedfor any additional comments you may wish to make.
1. Which menu scheme did you prefer overall? Please put a 1 beside that schemeand a 2 beside the next preferred scheme.
Static scheme Adaptive scheme Customizable scheme
Comments:
2. With which menu scheme did you feel you were the most efficient (quick)?Please put a 1 beside that scheme and a 2 beside the scheme with which youwere the second most efficient.
Static scheme Adaptive scheme Customizable scheme
Comments:
3. With which menu scheme did you feel you made the least number of errors(incorrect menu selections)? Please put a 1 beside that scheme and a 2 besidethe scheme with which you felt you made the second least number of errors.
Static scheme Adaptive scheme Customizable scheme
Comments:
4. With which menu scheme did you feel the most frustrated? Please put a1 beside that scheme and a 2 beside the scheme that was the second mostfrustrating.
Static scheme Adaptive scheme Customizable scheme
84

Comments:
5. Which menu scheme did you initially find the easiest to use? Please put a1 beside that scheme and a 2 beside the scheme that you initially found thesecond easiest to use.
Static scheme Adaptive scheme Customizable scheme
Comments:
Please use this space to make any additional comments on the menu schemes, orthe study:
Thank you for your participation!
85


Appendix B
Online Instructions
This appendix contains all textual descriptions and instructions included in theexperimental system.
B.1 Study 1
Study 1 used the following descriptions:
Introduction screen
Introduction
This experiment tests three different menu schemes. For each scheme you willbe given a sequence of menu items. When an item name appears on the screen,please select that item as quickly as possible from the corresponding menu. Ifyou select the wrong item by mistake, you will need to select the correct itembefore continuing.
To get used to the task, you will be given a short untimed practice session.To select an item, click once to open the menu, then click on the item.
End of practice session
This is the end of the practice session. If you have any questions before startingthe experiment, please ask the researcher.
Static condition
Static Menu Scheme
The locations of menu items will remain the same throughout the course ofthe selection sequence.
You will be given a sequence of 200 items to select. This will be followed bya short break, then you will be asked to repeat the same sequence.
87
Adaptive condition
Adaptive Menu Scheme
The top four items in each menu may change as you use the menu.
You will be given a sequence of 200 items to select. This will be followed bya short break, then you will be asked to repeat the same sequence.
Adaptable condition
Customizable Menu Scheme
The locations of menu items will remain the same throughout the sequence.
You will be given a sequence of 200 items to select. This will be followed bya short break, then you will be asked to repeat the same sequence.
Between the two repetitions, you will be given time to customize the menuyourself by moving items around.
Break between Block 1 and Block 2 of Static and Adaptive conditions
This is the end of the first repetition for the [current condition] menu scheme.
Please take a 2 minute break before continuing.
Break between Block 1 and Block 2 of Adaptable condition
This is the end of the first repetition for the adaptable menu scheme.
Before starting the second repetition, you will be given a few minutes to cus-tomize or change the menus if you would like to do so.
Please take a 2 minute break before continuing to the customization step.
Customization instructions
Instructions
To customize the menus above, move items to the top section of the menu usingthe single up arrows. There can be at most four items in the top section.
When an item is in the top section of the menu, two arrows will appear besideit. These can be used to move the item within the top section, or to move itback down to the original menu. When you are done customizing, click thebutton below to continue.
Confirmation dialogue box
You will not be able to change the menus after this point. Are you sure youare done customizing?
Break between conditions
This is the end of the [current condition] menu scheme. Please take a 5 minutebreak before continuing on to the next scheme.
88

End of the study
This is the end of the [current condition] menu scheme.
This is the end of the study. Please let the researcher know that you are done.Thank you for participating!
You completed all menu selections in [x] minutes and [x] seconds.
B.2 Study 2
The instructions for Study 2 were the same as those for Study 1, with appropriatemodifications (e.g., “This experiment tests two different menu schemes...”). Theonly addition was the following:
Traditional practice condition
Traditional Menu Scheme
The locations of menu items will remain the same throughout the sequence.
You will be given a sequence of 200 items to select. This will be followed bya short break, then you will be asked to repeat the same sequence.
89