comparing techniques for authorship attribution of source code
TRANSCRIPT
SOFTWARE – PRACTICE AND EXPERIENCESoftw. Pract. Exper. (2012)Published online in Wiley Online Library (wileyonlinelibrary.com). DOI: 10.1002/spe.2146
Comparing techniques for authorship attribution of source code
Steven Burrows*,†, Alexandra L. Uitdenbogerd and Andrew Turpin
School of Computer Science and Information Technology, RMIT University, GPO Box 2476,Melbourne 3001, Australia
SUMMARY
Attributing authorship of documents with unknown creators has been studied extensively for naturallanguage text such as essays and literature, but less so for non-natural languages such as computer sourcecode. Previous attempts at attributing authorship of source code can be categorised by two attributes:the software features used for the classification, either strings of n tokens/bytes (n-grams) or softwaremetrics; and the classification technique that exploits those features, either information retrieval rank-ing or machine learning. The results of existing studies, however, are not directly comparable as all usedifferent test beds and evaluation methodologies, making it difficult to assess which approach is superior.This paper summarises all previous techniques to source code authorship attribution, implements featuresets that are motivated by the literature, and applies information retrieval ranking methods or machineclassifiers for each approach. Importantly, all approaches are tested on identical collections from varyingprogramming languages and author types. Our conclusions are as follows: (i) ranking and machine classifierapproaches are around 90% and 85% accurate, respectively, for a one-in-10 classification problem; (ii) thebyte-level n-gram approach is best used with different parameters to those previously published; (iii) neuralnetworks and support vector machines were found to be the most accurate machine classifiers of theeight evaluated; (iv) use of n-gram features in combination with machine classifiers shows promise, butthere are scalability problems that still must be overcome; and (v) approaches based on informationretrieval techniques are currently more accurate than approaches based on machine learning. Copyright© 2012 John Wiley & Sons, Ltd.
Received 11 May 2011; Revised 23 May 2012; Accepted 8 July 2012
KEY WORDS: authorship attribution; benchmarking; information retrieval; machine learning; source code
1. INTRODUCTION
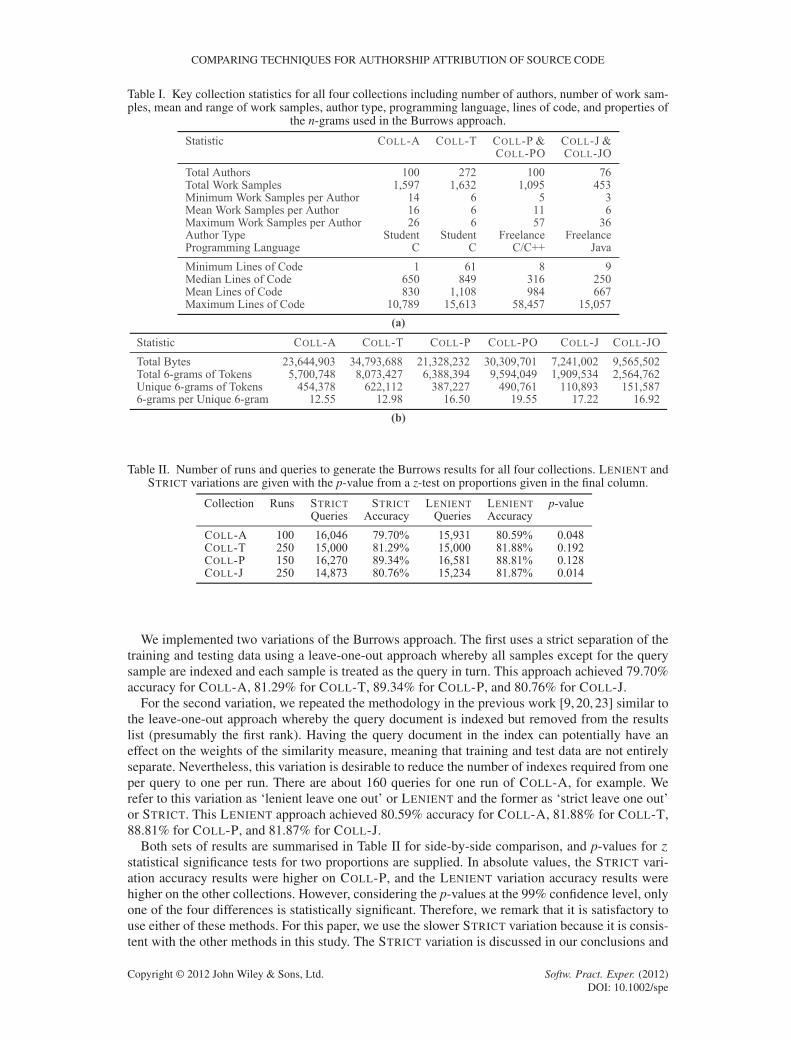
Authorship attribution is the process of assigning unknown or contentious samples of work to theircorrect authors. For this to be carried out, previous work samples for all candidate authors areexamined for stylistic traits consistent with the sample in question, and the likelihood of each authorbeing the true author is determined.
Authorship attribution for natural language is a mature field as evidenced by numerous previousstudies (see the work of Juola [1] for a comprehensive review of the field). Perhaps the most well-known problem is that of the Federalist papers [2], where 12 essays published in 1787–1788 havebeen in dispute between two authors. The problem has become popular as the correct answer isbelieved to be just one of the two authors for each essay, making the problem well contained.
Source code authorship attribution has been gaining attention since the initial empirical workof Krsul [3]. This problem is distinct from natural language authorship attribution as there is lessflexibility in expression when coding because of the unforgiving nature of compilers [4]. Krsul [3]described four key applications of source code authorship attribution techniques. First, it can assist
*Correspondence to: Steven Burrows, School of Computer Science and Information Technology, RMIT University, GPOBox 2476, Melbourne 3001, Australia.
†E-mail: [email protected]
Copyright © 2012 John Wiley & Sons, Ltd.
S. BURROWS, A. L. UITDENBOGERD AND A. TURPIN
with plagiarism detection [5], where style analyses of submitted work samples can help detect workwritten by external tutors [6] or purchased from software development marketplaces [7]. Second,it can assist with resolving legal disputes over the authorship of work in courts of law [8]. Third,it can identify previous authors of code in large software projects when maintenance activities arerequired and undocumented authors need to be identified. Finally, authorship data could be extractedfrom malicious programs or real-time intrusion detection systems to assist with the identification ofcyber-criminals. We have also used an authorship attribution approach to study the changing codingstyle of programmers over time [9], whilst isolating thematic and topical properties.
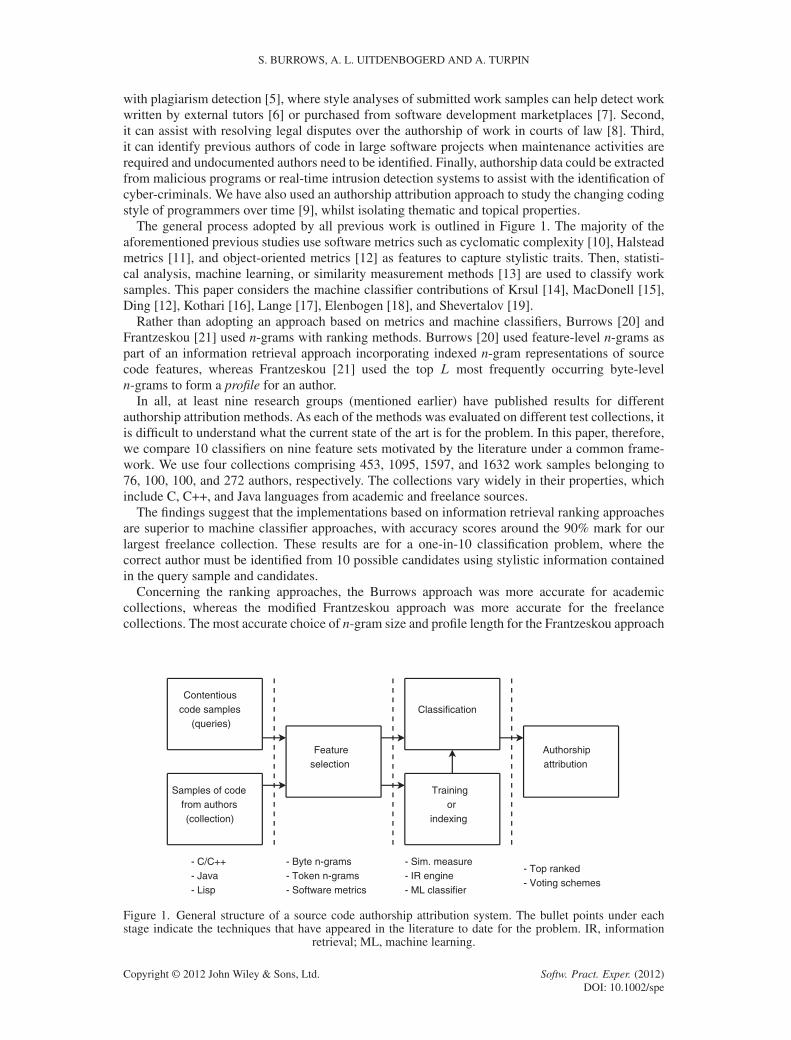
The general process adopted by all previous work is outlined in Figure 1. The majority of theaforementioned previous studies use software metrics such as cyclomatic complexity [10], Halsteadmetrics [11], and object-oriented metrics [12] as features to capture stylistic traits. Then, statisti-cal analysis, machine learning, or similarity measurement methods [13] are used to classify worksamples. This paper considers the machine classifier contributions of Krsul [14], MacDonell [15],Ding [12], Kothari [16], Lange [17], Elenbogen [18], and Shevertalov [19].
Rather than adopting an approach based on metrics and machine classifiers, Burrows [20] andFrantzeskou [21] used n-grams with ranking methods. Burrows [20] used feature-level n-grams aspart of an information retrieval approach incorporating indexed n-gram representations of sourcecode features, whereas Frantzeskou [21] used the top L most frequently occurring byte-leveln-grams to form a profile for an author.
In all, at least nine research groups (mentioned earlier) have published results for differentauthorship attribution methods. As each of the methods was evaluated on different test collections, itis difficult to understand what the current state of the art is for the problem. In this paper, therefore,we compare 10 classifiers on nine feature sets motivated by the literature under a common frame-work. We use four collections comprising 453, 1095, 1597, and 1632 work samples belonging to76, 100, 100, and 272 authors, respectively. The collections vary widely in their properties, whichinclude C, C++, and Java languages from academic and freelance sources.
The findings suggest that the implementations based on information retrieval ranking approachesare superior to machine classifier approaches, with accuracy scores around the 90% mark for ourlargest freelance collection. These results are for a one-in-10 classification problem, where thecorrect author must be identified from 10 possible candidates using stylistic information containedin the query sample and candidates.
Concerning the ranking approaches, the Burrows approach was more accurate for academiccollections, whereas the modified Frantzeskou approach was more accurate for the freelancecollections. The most accurate choice of n-gram size and profile length for the Frantzeskou approach
Contentiouscode samples
(queries)
Samples of codefrom authors(collection)
Featureselection
Classification
Trainingor
indexing
Authorshipattribution
- C/C++- Java- Lisp
- Byte n-grams- Token n-grams- Software metrics
- Sim. measure- IR engine- ML classifier
- Top ranked- Voting schemes
Figure 1. General structure of a source code authorship attribution system. The bullet points under eachstage indicate the techniques that have appeared in the literature to date for the problem. IR, information
retrieval; ML, machine learning.
Copyright © 2012 John Wiley & Sons, Ltd. Softw. Pract. Exper. (2012)DOI: 10.1002/spe
COMPARING TECHNIQUES FOR AUTHORSHIP ATTRIBUTION OF SOURCE CODE
differed to their previously published results as we explored a larger range of values for theseparameters. We recommend that n be increased from n D 6 to n D 14 and that profile trunca-tion be ignored altogether. The Burrows and Frantzeskou results are generally equally good whenusing the modified parameters for the Frantzeskou approach.
The machine learning approaches proved to be less accurate, with the best solution being neuralnetwork or support vector machine (SVM) classifiers, giving around 85% classification accuracyon the largest freelance collection when combining all feature sets used. The use of n-gram-basedfeatures also showed promise, but given that the number of n-grams increases exponentially with n,the application of standard machine classifiers becomes problematic for even moderate values of n.
The remainder of this paper is organised as follows. In Section 2, we review nine previousapproaches by providing details about the classification algorithms, feature sets, and collectionsused in the original studies. Next, in Section 3, we summarise the statistics of the four collectionsdeployed. Sections 4, 5, and 6 contain the experimental results for the Burrows, Frantzeskou, andmachine classifier approaches, respectively. Then, in Section 7, the key results are summarisedbefore offering future directions in Section 8 and conclusions in Section 9.
2. BACKGROUND
Sections 2.1 and 2.2 describe key properties of the ranking and machine classifier approaches inturn including the methodologies, collections, and feature sets.
2.1. Ranking approaches
Burrows [20] and Frantzeskou [22] have both proposed information retrieval approaches withn-grams for source code authorship attribution. N-grams are overlapping sequences of tokens oflength n generated from a longer contiguous stream of tokens. Capturing nearby tokens together inthis way generates ‘words’ that are useful in document comparison algorithms. We now review boththe Burrows and Frantzeskou approaches.
2.1.1. Burrows. Our technique [4, 9, 20, 23] involves indexed representations of the source codesamples. The Okapi BM25 similarity metric is used [24, 25] with default parameters (b D 0.75,k1 D 1.2, and k3 D 1010) in the Zettair open-source search engine [26] to score query samplesagainst the database. The methodology is as follows.
1. Tokenise stylistic features from the source files using the operators, keywords, and white spacetokens.
2. Convert each token stream into an n-gram representation by sliding a window of size n oneposition at a time across the token stream using a lexical analysis tool [27]. A token stream oflength t generates t � nC 1 n-grams per sample.
3. Index all work samples using the Zettair search engine [26].4. Use the contentious sample as a ‘query’ against the indexed samples, producing a ranked list
of the closest-matching samples.5. Take the author of the top-ranked (non-query) document as the answer.
Each study included several experiments, some of which generated incremental improvementsthat were carried forward to future studies. The first study [20] identified 6-grams as the mostaccurate n-gram size and Okapi BM25 as the most accurate similarity measure. The secondstudy [23] in part chose the most suitable feature set comprising operators, keywords, and whitespace features. The third study [23] explored the problem of authorship attribution in the context ofcoding style changing over time and yielded further improvements to the aforementioned feature set.The collections used across these three studies are COLL-A and COLL-T as described in Section 3.
2.1.2. Frantzeskou. The Frantzeskou approach [21,22,28–30] named Source Code Author Profiles(SCAP) uses byte-level n-grams as features. This has the advantage of not having to individually
Copyright © 2012 John Wiley & Sons, Ltd. Softw. Pract. Exper. (2012)DOI: 10.1002/spe
S. BURROWS, A. L. UITDENBOGERD AND A. TURPIN
derive feature sets for additional programming languages, resulting in an approach that isindependent of language.
The work used several collections comprising between 34 [30] and 333 [21] work samples percollection, containing C++, Java, or Lisp sources. The experiments ranged in difficulty from six to30 authors [21], with some results showing 100% accuracy.
The experimental methodology separates each collection into training and testing parts of roughlyequal size, taking care to stratify the work samples as best as possible. For each author, an authorprofile is created that is simply a list of the L most frequent n-grams in that author’s training data.Authorship is attributed to the author whose profile has the highest count of common n-gramswith the profile of the query document. Frantzeskou defined this measure as the simplified profileintersection (SPI):
SPID jSPA \ SPPj (1)
where SPA is an author profile and SPP is a project (or query document) profile. A limitationof this approach is the existence of the profile length parameter L that has to be tuned to eachindividual problem. For example, some profiles may be shorter than a chosen L, meaning thatsome samples will be truncated whereas others are left alone. This creates bias towards the trun-cated profiles of maximum length. Furthermore, profile lengths greater than the length of the largestprofile are superfluous unless the disabling of profile truncation is intended by using an arbitrarilylarge profile length. Therefore, statistics about the distribution of profile lengths in a collection areneeded up front.
The Frantzeskou work has explored a range of values of n-gram length n and profile lengthL [21, 22, 28–30]. Depending on the experiment, differing conclusions were drawn about the mostappropriate choices for these parameters, with values around L D 2000 and n D 6 being morecommon. The values tested were in the ranges 2 6 n 6 10 and 200 6 L 6 10 000 across allpublications combined, but we suspect that the most accurate combinations are still unclear as therewere multiple results reporting 100% accuracy in the experiments and some of these were on theboundaries of the n and L ranges listed earlier. We extend these ranges when implementing theFrantzeskou work in Section 5 and apply this to our larger data sets.
2.2. Machine classifier approaches
The machine classifier approaches differ from the earlier ranking approaches in that they mostlyuse software metrics and related measurements as individual features; for example, simple metricssuch as the number of looping constructs in a program or metrics that can be applied in softwarequality assurance such as McCabe’s cyclomatic complexity measure [10]. A collection of metrics isused to define the feature space for a classification algorithm to make authorship decisions, but thecombinations of metrics and classifiers have varied greatly in the literature. This section reviews themetrics and classification algorithms deployed in seven machine classifier approaches by Krsul [14],MacDonell [15], Ding [12], Kothari [16], Lange [17], Elenbogen [18], and Shevertalov [19]. Thecollections used are also summarised.
2.2.1. Metrics. Krsul [3] created a taxonomy of 60 metrics derived from several sources on metric,style rule, and best-practice topics. The taxonomy is divided into three parts comprising program-ming layout metrics (such as white space use and placement of brackets), programming style metrics(such as average comment length and average variable length), and programming structure metrics(such as average function length and usage of common data structures). It is clear that some ofthe Krsul metrics are provided for documentation and completeness purposes only. For example,some metrics required the programs to be executed to measure program correctness; however, theseare not helpful for non-compiling programs. Others required manual human intervention such asdetermining if the comments agree with the code; however, this does not scale to large collections.
Copyright © 2012 John Wiley & Sons, Ltd. Softw. Pract. Exper. (2012)DOI: 10.1002/spe
COMPARING TECHNIQUES FOR AUTHORSHIP ATTRIBUTION OF SOURCE CODE
MacDonell [15] used a collection of 26 metrics. Fourteen of these calculate the number ofinstances of a particular feature per line of code. Several others deal with white space and character-level metrics such as the proportion of uppercase characters. The IDENTIFIED custom-builtsoftware package was used to extract the measurements [31, 32].
Ding [12] used the same taxonomy as Krsul [33] to organise candidate metrics: program-ming layout metrics, programming style metrics, and programming structure metrics. The metricsobtained were from Krsul [33] and MacDonell [15] as mentioned earlier, plus metrics describedby Gray [31] in the paper about IDENTIFIED. These papers were all written about C and C++metrics, so some language-specific metrics were adapted for their Java collections. Ding [12] used astepwise discriminant analysis feature selection algorithm to identify and remove metrics that con-tributed little or nothing towards classification. However, the authors did not provide the final featuresubsets in full or attempt to rank all features, so it is difficult to know which to use from this studyas an implementation of their method. However, they remarked that the layout metrics generallyperformed better than the style and structure metrics.
The best-performing metric set identified by Kothari [16] considered occurrences of byte-leveln-grams. This is similar to the earlier Frantzeskou [21] approach, but occurrence counts of themetrics were used instead of matching coordinates. The n-gram length nD 4 was empirically iden-tified as the ideal n-gram length for this work. Because the set of unique byte-level 4-grams is verylarge, Kothari [16] used entropy to identify the 50 most discerning metrics for each author. Entropywas calculated for the frequency of occurrence of each feature for the samples belonging to eachauthor and the author profiles in the whole collection. The author entropy scores were divided bythe whole collection entropy scores for each metric, and the top 50 were selected. In a 10-classexperiment, this results in a pool of up to 500 available metrics prior to taking duplicates into con-sideration. We also briefly remark that the poorer of the two features sets explored by Kothari [16]used six ‘metric classes’, of which four are common with Lange [17].
Lange [17] used 18 metric classes. The metrics chosen included program features at the text levelwhere the source code is simply treated as a series of strings, and the software metric level wherea full understanding of the programs is taken into consideration. Some of the metric classes arefinite such as the ‘comment’ category that counts the number of each type of Java comment (inline,block, or JavaDoc), but others are somewhat unbounded; for example, the indentation categoriescount the number of times each level of indentation occurs for spaces and tabs. The bounds dependon the values that are represented in the collection, which means that there could be thousands ofmeasurements made on each program. For example, an indentation metric would have individualmeasurements for lines that have zero, one, two, three (and so on) spaces. The number of mea-surements required for this indentation metric could be very large because any indentation levelis allowed.
The work by Elenbogen [18] is perhaps best described as a proof of concept. It incorporatesjust six metrics based on heuristic knowledge and personal experience: lines of code, number ofcomments, average variable name length, number of variables, fraction of for-loop constructs com-pared with all looping constructs, and number of bits in the compressed program using the WinZipcompression software [34].
Shevertalov [19] took four of the Lange [17] metrics classes (leading spaces, leading tabs, linelength, and words per line) and used genetic algorithms to discretise the measurements. The original2044 measurements were reduced down to 163, but they did not provide details on this final set noron how they are shared between the metric classes, making this feature set non-reproducible.
The features from all the aforementioned seven research groups are shown in full in Appendix Bincluding comments about our implementation decisions.‡ It is clear that there is no consensus on a‘best’ set of features. This summary highlights metrics with difficult or impractical implementationrequirements, language-specific content, required modifications to avoid previously unconsiderederror scenarios, and some metrics that appear in multiple studies. An account of how we dealt withthese problems is given in Section 6.2 and Appendix B.
‡The only omission is the Shevertalov [19] set, as these metric classes are a subset of those used by Lange [17].
Copyright © 2012 John Wiley & Sons, Ltd. Softw. Pract. Exper. (2012)DOI: 10.1002/spe
S. BURROWS, A. L. UITDENBOGERD AND A. TURPIN
2.2.2. Classifiers. Many classification algorithms have been explored using the earlier feature sets.Frantzeskou [13] gave a taxonomy explaining how automated approaches can be distributed intothree broad categories: statistical analysis, machine learning, and similarity measurement tech-niques. Manual inspection is mostly of use on a case-by-case basis and is not discussed furtherin this paper.
The statistical analysis techniques are useful for pruning feature spaces to find effective featuresets. Krsul [14], MacDonell [15], and Ding [12] have all implemented variants of discriminantanalysis for solving this problem. Lachenbruch [35] define discriminant analysis as assigning “anunknown subject to one of two or more groups on the basis of a multivariate observation”. Inauthorship attribution, the multivariate observation can be a set of measurements taken from soft-ware metrics. When more than two candidate authors are dealt with, the problem is referred to asmultiple discriminant analysis as per the work by MacDonell [15] and implied by Krsul [3]. Anothervariation is canonical discriminant analysis as used by Ding [12], where features are reviewed oneat a time for inclusion in the final model until the addition of further features no longer adds value.Terminating the inclusion of features in this manner prevents the model from becoming bloated,which is the fundamental idea of canonical discriminant analysis.
Five machine learning approaches have appeared in the source code authorship attributionliterature, namely case-based reasoning [31], neural networks [15], decision trees [18], naiveBayes [16], and voting feature intervals [16]. These approaches aim to classify new unseen sampleson the basis of training conducted on samples of known authorship.
The final approach, similarity measurement, involves computing a distance between a query anda candidate document in some feature space. Calculating the distance between vectors of docu-ment features using nearest-neighbour methods [36] is one such implementation. Lange [17] useda nearest-neighbour search on normalised histogram distributions of their 18 metrics to measurecloseness of target projects to those of known authors. Shevertalov [19] was another that applied thenearest-neighbour method, but after discretisation of the feature space.
2.2.3. Collections. From the machine classifier literature, the collection by MacDonell [15] has thelargest number of work samples (351) and an average of 148 lines of code per sample. The sharedLange [17] and Shevertalov [19] collection in contrast comprised the largest average sample length(11 166 lines of code), but it only comprised 60 work samples. Further details of the used collectionsare available [4], but for a comparison of all techniques reviewed in this section, large, consistent,and comprehensive collections are needed, which we describe in the next section.
3. EVALUATION COLLECTIONS
Four large collections are employed in this study to benchmark our implementations of the sourcecode authorship attribution approaches described in the previous section. The collections arelabelled COLL-A, COLL-T, COLL-P, and COLL-J and are now discussed in turn. This section con-cludes with a summary and comparison of the key properties of each collection. The data discussedis available in part as described in Section 8.5.
3.1. COLL-A
COLL-A is comprised of C programming assignments authored by students from our home institu-tion. We obtained 1597 assignments belonging to 100 student authors ranging from 14 to 26 samplesper author. This collection was previously used in the first two Burrows studies [20, 23].
The collection was constructed by navigating a large school assignment submission repositorycontaining submissions spanning 1999 to 2006. Folders containing C assignment sources wereidentified, and submissions belonging to the 100 authors with the most samples formed COLL-A. Allbyte-identical duplicates were removed. For ethical reasons, all comments and quoted strings wereremoved from the code so that individual students could not be identified. This was in accordancewith the ethics approval granted by our institution’s Human Research Ethics Committee.
Copyright © 2012 John Wiley & Sons, Ltd. Softw. Pract. Exper. (2012)DOI: 10.1002/spe
COMPARING TECHNIQUES FOR AUTHORSHIP ATTRIBUTION OF SOURCE CODE
3.2. COLL-T
COLL-T is sourced from the same school assignment archive as COLL-A and is again comprisedof deidentified C programming sources. We obtained 1632 assignments belonging to 272 studentauthors comprising exactly six submissions per author each. The subject matter of the six submis-sions was two assignments from each of three core courses that form a prerequisite chain, resultingin each sample representing a unique period spread across three semesters. Having a fixed numberof samples per author is a key property of the third Burrows study [23], which examined evolvingauthorship style over time and the affect on classification accuracy.
We found 272 students who met these requirements, and these work samples formed COLL-T.We note that there is some overlap between the authors in COLL-A and COLL-T (47 authors), andin these cases, the COLL-T samples represent a subset of the author samples in COLL-A.
3.3. COLL-P
COLL-P was generated from C/C++ work samples downloaded from the Planet Source Codewebsite [37]. The construction of COLL-P was completed in February 2009 using work samplesavailable on the website at that time. When constructing COLL-P, we queried for all C/C++ samplesthat were zipped by their authors for convenience and then individually downloaded samples fromauthors with many samples on their author profile Web pages. We stopped downloading content oncewe had obtained 1095 samples belonging to 100 authors with 5–57 samples per author. Authors withfewer than five work samples were ignored.
We observed that the work samples represent a wide variety of demographics. For example, thecontent is ranked using four tags: ‘beginner’, ‘intermediate’, ‘advanced’, and ‘unranked’. Also, theinspected profile pages suggested that the work samples belong to individuals such as hobbyists(including high school students and tertiary students), industry professionals, and occasionally tech-nical text book authors. Some accounts have used aliases representing company names; however, inalmost all cases, these seem to belong to a single author, judging by the author descriptions, makingthem suitable for our experiments.
The subject matter of the work samples varied greatly. Many samples are implementations ofsmall games such as tic-tac-toe, snakes, bricks, pong, and so on. Other samples provide implemen-tations of fundamental algorithms and data structures. Others belong to common problems such ascalendars and calculators. Others again look like programming assignments. Also, a few samplesare larger ‘packages’ of sometimes unrelated programs where the authors have not made additionaleffort with separate postings.
We note that the C and C++ content on Planet Source Code is branded together as ‘C/C++’ asone of the content categories supported, so we did not attempt to separate the C and C++ sources.Moreover, we would expect there to be some C++ sources that are partly or mostly comprised of Ccode given that most of C is a subset of C++. Using file name extensions as a definitive label, weexpect COLL-P to comprise 14% of C programs and 86% of C++ programs.
Also, we expect the number of samples that are modest variations of one another to be small, asusers are required to update existing samples instead of posting new variations, as instructed by themoderators. Near-duplicate detection [38] is a different problem that we do not address in this paper.
3.4. COLL-J
COLL-J was again generated from the Planet Source Code website [37], but this time using Javasource files. The collection construction was again completed in February 2009. The collectioncomprises 453 work samples by 76 authors with 3–36 samples per author. The Java content wasscanned from end to end to identify authors with many samples, but there was less Java than C/C++data available.
As a result, COLL-J is more modest with fewer authors, fewer total samples, and a lowerminimum number of samples per author than COLL-P. However, this is less of an issue for a bench-marking study such as this one, and this collection can simply be considered a ‘harder’ problem.
Copyright © 2012 John Wiley & Sons, Ltd. Softw. Pract. Exper. (2012)DOI: 10.1002/spe
S. BURROWS, A. L. UITDENBOGERD AND A. TURPIN
Furthermore, there are still more work samples in this collection than those used by previousresearch groups [4].
3.5. COLL-PO and COLL-JO
COLL-A and COLL-T had to be deidentified to comply with ethics requirements by stripping awaysource code comments and quoted strings. For consistency, we applied the same procedures toCOLL-P and COLL-J. However, some machine classifier approaches included comment-level andcharacter-level metrics, so we use the original versions of COLL-P (called COLL-PO) and COLL-J(called COLL-JO) in some comparisons, such as in Section 5.3.
3.6. Summary and statistics of the collections
Our goal is to have representative collections across multiple programming languages and authortypes. The collections constructed earlier meet these goals with C, C++, and Java sources obtainedfrom both academic and freelance author types.
We stress that the collections are large, and as a result, we have only performed limited filteringof undesirable samples. For example, we would expect there to be some plagiarism incidents in theacademic collections that may mislead some classification decisions. Moreover, we would expectthere to be some multiple aliases and account sharing in the freelance collections. However, accountsharing was somewhat alleviated by ignoring obvious shared accounts named in a format such as‘Name 1/Name 2’. Importantly, this is a benchmarking study of our implementations of previoustechniques, so all systems will be equally exposed to these difficulties. All results reported in thispaper are likely to be slightly conservative because classification decisions would be easier if theseproblems did not exist.
We expect the quality of the work samples in COLL-P and COLL-J to be higher than that inCOLL-A and COLL-T. At Planet Source Code [37], there is motivation for the authors to submitgood-quality content as samples can be rated on a five-point scale from ‘poor’ to ‘excellent’. Thesescores are then used for the ‘code of the month’ competitions and bragging rights. The academiccollections cannot receive that level of exposure and scrutiny for academic integrity reasons.
Next, we note that COLL-T is remarkable because it is a rare collection that has exactly thesame number of samples for all authors. For collections with an unbalanced number of samples perauthor, we expect the authors with the most samples to be easier to classify given the extra trainingdata. There is no such bias in COLL-T. However, this collection could be considered more artificialbecause real-life scenarios with this property are rare. For example, it is possible to build collectionsfrom academic sources in this way for student groups that have followed identical academic path-ways, but this cannot be repeated for industry or freelance sources. Importantly, this study includesboth balanced and unbalanced collections in terms of the number of samples per author, allowingthe earlier issues to be explored.
The data in Table I provides a side-by-side comparison of all collections used in this study. It isuseful in accounting for some differences in the accuracy of the compared classification algorithms.Similar data for collections used by previous researchers is provided by Burrows [4] as mentionedin Section 2.2.3.
4. BURROWS APPROACH
When implementing the Burrows approach described in Section 2.1.1, we repeated the experimentfor at least 100 runs on each collection using random subsets of 10 authors, taking care to make surethat roughly the same number of queries are processed for each collection (approximately 15 000).This required 100 runs for COLL-A, 250 runs for COLL-T, 150 runs for COLL-P, and 250 runs forCOLL-J. This experiment design decision provides enough queries to generate sufficient results sothat statistically significant trends may be easily observed when present and is repeated in Sections 5and 6. The problem size was fixed at 10 authors to allow us to focus on other variables because otherproblem sizes were explored in previous work [20].
Copyright © 2012 John Wiley & Sons, Ltd. Softw. Pract. Exper. (2012)DOI: 10.1002/spe
COMPARING TECHNIQUES FOR AUTHORSHIP ATTRIBUTION OF SOURCE CODE
Table I. Key collection statistics for all four collections including number of authors, number of work sam-ples, mean and range of work samples, author type, programming language, lines of code, and properties of
the n-grams used in the Burrows approach.
Table II. Number of runs and queries to generate the Burrows results for all four collections. LENIENT andSTRICT variations are given with the p-value from a z-test on proportions given in the final column.
We implemented two variations of the Burrows approach. The first uses a strict separation of thetraining and testing data using a leave-one-out approach whereby all samples except for the querysample are indexed and each sample is treated as the query in turn. This approach achieved 79.70%accuracy for COLL-A, 81.29% for COLL-T, 89.34% for COLL-P, and 80.76% for COLL-J.
For the second variation, we repeated the methodology in the previous work [9, 20, 23] similar tothe leave-one-out approach whereby the query document is indexed but removed from the resultslist (presumably the first rank). Having the query document in the index can potentially have aneffect on the weights of the similarity measure, meaning that training and test data are not entirelyseparate. Nevertheless, this variation is desirable to reduce the number of indexes required from oneper query to one per run. There are about 160 queries for one run of COLL-A, for example. Werefer to this variation as ‘lenient leave one out’ or LENIENT and the former as ‘strict leave one out’or STRICT. This LENIENT approach achieved 80.59% accuracy for COLL-A, 81.88% for COLL-T,88.81% for COLL-P, and 81.87% for COLL-J.
Both sets of results are summarised in Table II for side-by-side comparison, and p-values for ´statistical significance tests for two proportions are supplied. In absolute values, the STRICT vari-ation accuracy results were higher on COLL-P, and the LENIENT variation accuracy results werehigher on the other collections. However, considering the p-values at the 99% confidence level, onlyone of the four differences is statistically significant. Therefore, we remark that it is satisfactory touse either of these methods. For this paper, we use the slower STRICT variation because it is consis-tent with the other methods in this study. The STRICT variation is discussed in our conclusions and
Copyright © 2012 John Wiley & Sons, Ltd. Softw. Pract. Exper. (2012)DOI: 10.1002/spe
S. BURROWS, A. L. UITDENBOGERD AND A. TURPIN
should be the benchmark when cited in future work. The LENIENT variation is not discussed furtherin this paper.
Next, it is remarkable to note the higher accuracy of the Burrows approach using the freelancecollections (STRICT). COLL-P accuracy results were around 7% higher than the academic collectionaccuracy results, and the COLL-J accuracy results were similar to the academic collection accuracyresults but achieved this result with the smallest minimum number of training samples per author.With the exception of COLL-T, we cannot say that the distribution of samples favours one collectionover another as the number of samples per author distributions for COLL-A, COLL-P, and COLL-Jare all left-skewed. We believe that the individuals from the freelance collections are motivated toproduce good work for sharing with the Planet Source Code community. Moreover, given that theseauthors do not all come from a common institution, there is more opportunity to develop individualprogramming styles instead of adapting common styles from staff and student peers in academia.
5. FRANTZESKOU APPROACH
The core component of the Frantzeskou approach is the production of lists of unique byte-leveln-grams ordered by frequency and truncated at profile length L. Table III describes the lengths ofthe query and author profiles generated using this approach for our collections. This table recordsthe minimum, median, mean, and maximum query lengths for the individual programs that madeup the test data. The same statistics are repeated for the author profiles (or training data), which aregenerated from the combined content of all remaining programs for the query author.
With the use of these profiles, experiments that follow include the verification of the profile lengthL and n-gram size n parameters explored in the Frantzeskou work. Next, we report on the changesin accuracy both before and after deidentification techniques are applied given that a differentdeidentification technique is used to the Burrows work. Finally, we compare the byte-level n-gramand feature-level n-gram approaches by comparing them both using the Okapi and SPI similarityscores used by Burrows and Frantzeskou, respectively.
5.1. Profile length
The profile length parameter L is used in the Frantzeskou approach to truncate the query profilesand author profiles at a consistent length. This parameter is volatile as it depends on the collectionas discussed in Section 2.1.2.
The Frantzeskou experimental design split the tested collections equally into training and testsets. We chose an unequal collection split for our experimental design by creating author profilesthat contain all data except for each individual query document. We believe that this experimentaldesign decision is more appropriate as our previous work has shown that discarding content whenmaking authorship classifications results in severe degradation in accuracy scores [20]. This leave-one-out cross-validation experimental design decision is deployed throughout this paper because itmaximises that amount of training data available.
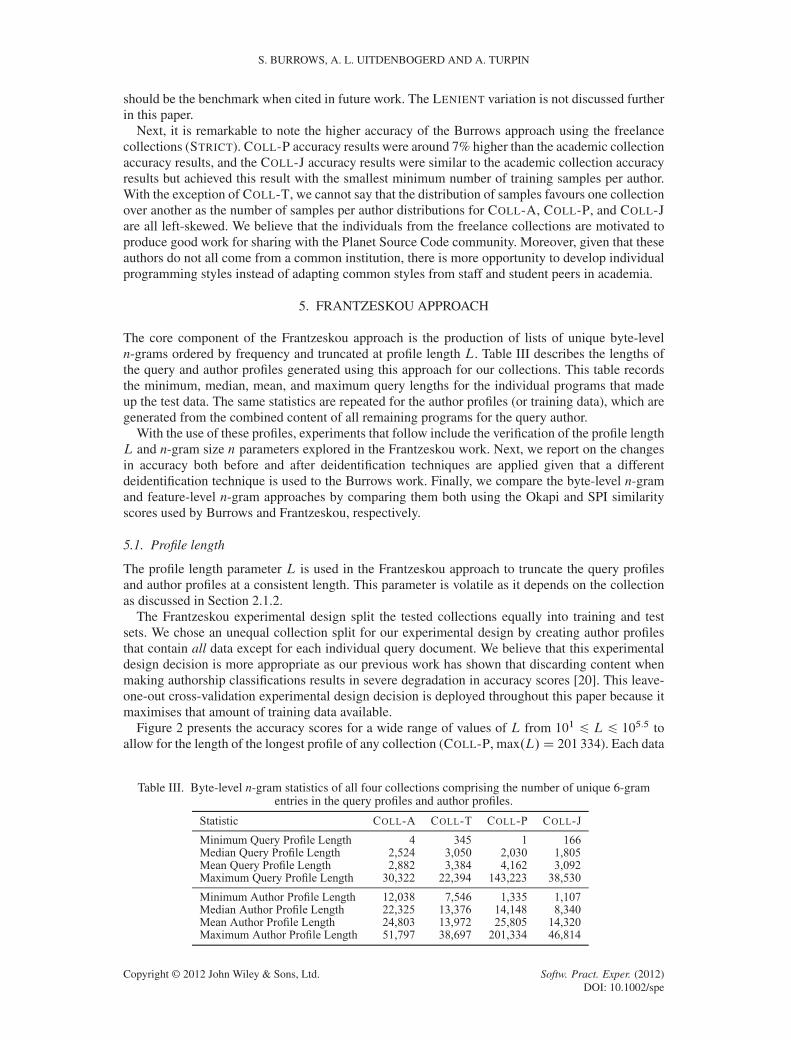
Figure 2 presents the accuracy scores for a wide range of values of L from 101 6 L 6 105.5 toallow for the length of the longest profile of any collection (COLL-P, max.L/D 201 334). Each data
Table III. Byte-level n-gram statistics of all four collections comprising the number of unique 6-gramentries in the query profiles and author profiles.
Copyright © 2012 John Wiley & Sons, Ltd. Softw. Pract. Exper. (2012)DOI: 10.1002/spe
COMPARING TECHNIQUES FOR AUTHORSHIP ATTRIBUTION OF SOURCE CODE
Frantzeskou Baseline Using Whole Profile Matching
Profile Length (L)
Acc
urac
y (%
)
101 101.5 102 102.5 103 103.5 104 104.5 105 105.50
10
20
30
40
50
60
70
80
90
100
Coll−AColl−TColl−PColl−J
Figure 2. Classification accuracy of all four collections for Frantzeskou’s profile length L parameter using19 profile lengths from 10 to 316 228.
point is the mean accuracy score of approximately 15 000 queries as used in Section 2.1.1; hence,each line represents approximately 15 000 � 19 D 285 000 queries. The n-gram length n was keptconstant at nD 6 as per the original recommendations by Frantzeskou.
We note that all of these curves plateau for the last few values ofL as these values begin to exceedthe length of the longest profile. This occurs at a different point for each collection as the length ofthe longest profile differs for each collection as previously summarised in Table III.
Accuracy is poorest for the lower values of L, and accuracy generally increases with L. Thereare modest peaks in the plotted lines for collections COLL-T and COLL-J above the maximum L
(+2.70% and +2.22%, respectively), a negligible peak for COLL-P (+0.26%), and the most accurateresult for COLL-A, which is the longest possible profile length. As a whole, these trends indicateminor bias towards prolific authors.
Table IV quantifies these differences using a z-test, and the differences between the best resultand the result for the largest L are statistically insignificant for COLL-P (p D 0.39) andCOLL-A (p D 1.00). It is clear that there is no single-best profile lengthL as agreed by Frantzeskou.However, a suitable heuristic seems to be to leave the length of profile unlimited and use the fulldistribution of all n-grams as the profile. As an aside, we note that this technique is equivalent to‘co-ordinate matching’, a ranking technique used in some information retrieval systems [39] andalso successfully applied in music information retrieval [40]. This is the approach we adopt in theremainder of the paper, giving an accuracy of 75.48% for COLL-A, 75.51% for COLL-T, 91.84%for COLL-P, and 82.30% for COLL-J using 6-grams.
Table IV. Classification accuracy scores when using the maximum profile length (L D max) and the mostaccurate profile length (L D best). The ‘Correct’ and ‘Total’ columns denote the number of successful
classifications and the total number of classifications, respectively.
Copyright © 2012 John Wiley & Sons, Ltd. Softw. Pract. Exper. (2012)DOI: 10.1002/spe
S. BURROWS, A. L. UITDENBOGERD AND A. TURPIN
5.2. n-Gram size
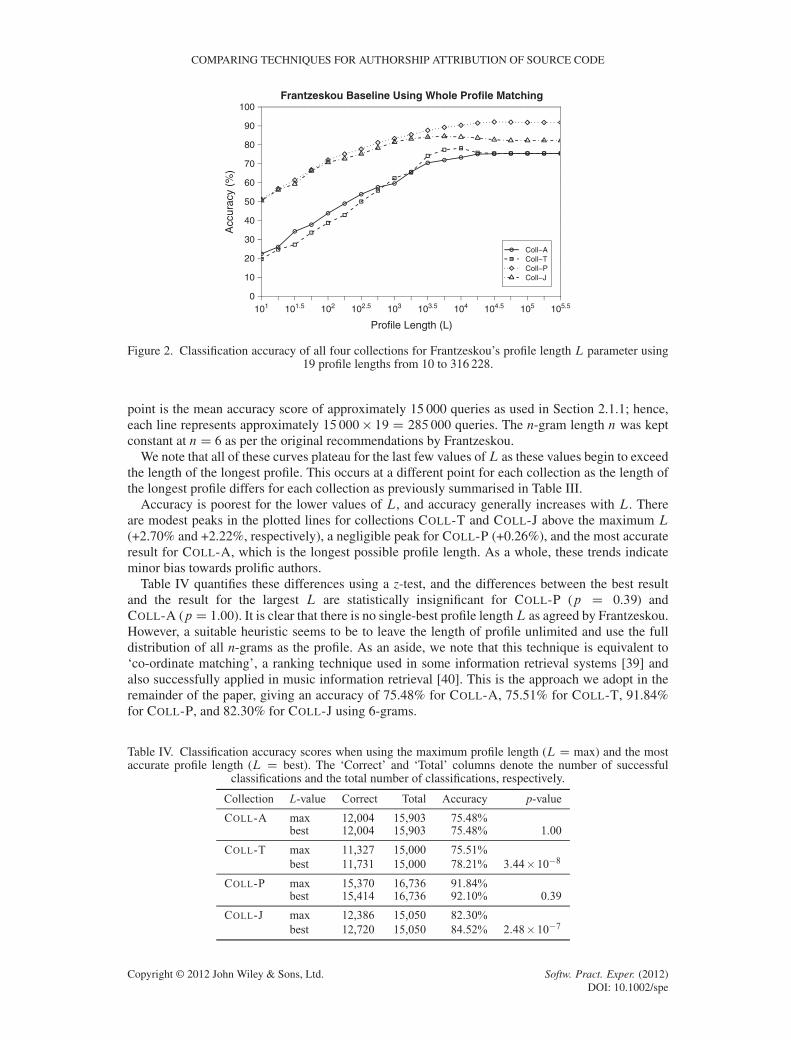
The comparisons in the previous sections used an n-gram size of nD 6 as determined by the originalauthors of the methods. We implemented the Burrows and Frantzeskou approaches using 14 n-gramsizes from 1 6 n 6 50 to confirm these settings for our benchmark collections, with the resultsshown in Figure 3. The figure reveals that the Frantzeskou approach is more accurate with n D 14,much higher than with the n D 6 reported previously. We believe the small collections used byFrantzeskou, and the fact that they did not test past nD 10, is responsible for this difference. Adopt-ing n D 14 represents a modest improvement to the previous recommendation. In this experiment,6-grams achieved 75.48% but 14-grams achieved 79.11% (+3.83%) accuracy. This is a statisticallysignificant difference when using a z-test (p D 1.09 � 10�14). Note that n D 6 seems appropriatefor the Burrows approach that uses features comprising of multiple bytes.
With this result, we decided to switch to 14-grams for the remaining collections, and accuracyscores are as follows: 80.71% (+5.20%, p D 2.20�10�16) for COLL-T, 91.88% (+0.04%, p D 0.90)for COLL-P, and 86.07% (+3.77%, p D 2.20� 10�16) for COLL-J.
5.3. Deidentification effects
The Burrows approach is based on tokens that exclude comments and string literals, whereas theFrantzeskou approach uses byte-level n-grams that captures such information if it is available.As we have versions of collections COLL-P and COLL-J that contain comments and strings,COLL-PO and COLL-JO, we can explore accuracy scores when comments are both used or omitted.We expect the Frantzeskou approach to perform with higher accuracy when comments are in use, asbyte-level n-grams use comments entirely, whereas feature-level n-grams use some of the contentsof comments by accident only. Table V shows the accuracy scores for the identified and deidentified
Comparing N−Gram Length in Burrows and Frantzeskou Work
Burrows et al.Frantzeskou et al.
N−gram Size
Acc
urac
y (%
)
1 2 4 6 8 10 12 14 16 18 20 30 40 500
10
20
30
40
50
60
70
80
90
100
Figure 3. Comparison of the most accurate n-gram length for the Burrows [20] work (Okapi with feature-level n-grams) versus Frantzeskou [22] work (simplified profile intersection with byte-level n-grams)
on COLL-A.
Table V. Mean accuracy for the Burrows and Frantzeskou approaches on collections where comments andquoted strings are both included (COLL-P and COLL-J) and excluded (COLL-PO and COLL-JO).
Copyright © 2012 John Wiley & Sons, Ltd. Softw. Pract. Exper. (2012)DOI: 10.1002/spe
COMPARING TECHNIQUES FOR AUTHORSHIP ATTRIBUTION OF SOURCE CODE
collections for the two approaches. These results show that the Frantzeskou approach has a largeraccuracy improvement for both COLL-P and COLL-J, which supports our expectation.
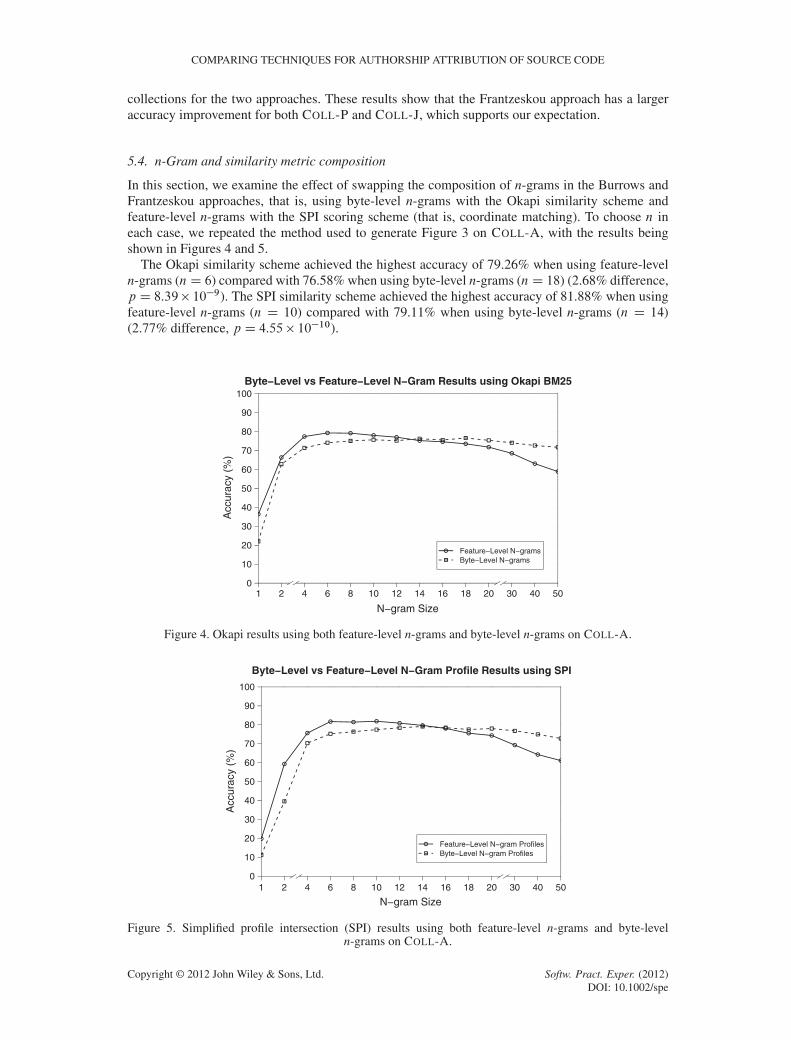
5.4. n-Gram and similarity metric composition
In this section, we examine the effect of swapping the composition of n-grams in the Burrows andFrantzeskou approaches, that is, using byte-level n-grams with the Okapi similarity scheme andfeature-level n-grams with the SPI scoring scheme (that is, coordinate matching). To choose n ineach case, we repeated the method used to generate Figure 3 on COLL-A, with the results beingshown in Figures 4 and 5.
The Okapi similarity scheme achieved the highest accuracy of 79.26% when using feature-leveln-grams (nD 6) compared with 76.58% when using byte-level n-grams (nD 18) (2.68% difference,p D 8.39� 10�9). The SPI similarity scheme achieved the highest accuracy of 81.88% when usingfeature-level n-grams (n D 10) compared with 79.11% when using byte-level n-grams (n D 14)(2.77% difference, p D 4.55� 10�10).
Byte−Level vs Feature−Level N−Gram Results using Okapi BM25
Feature−Level N−gramsByte−Level N−grams
Acc
urac
y (%
)
0
10
20
30
40
50
60
70
80
90
100
N−gram Size
1 2 4 6 8 10 12 14 16 18 20 30 40 50
Figure 4. Okapi results using both feature-level n-grams and byte-level n-grams on COLL-A.
Byte−Level vs Feature−Level N−Gram Profile Results using SPI
Feature−Level N−gram ProfilesByte−Level N−gram Profiles
Acc
urac
y (%
)
0
10
20
30
40
50
60
70
80
90
100
N−gram Size1 2 4 6 8 10 12 14 16 18 20 30 40 50
Figure 5. Simplified profile intersection (SPI) results using both feature-level n-grams and byte-leveln-grams on COLL-A.
Copyright © 2012 John Wiley & Sons, Ltd. Softw. Pract. Exper. (2012)DOI: 10.1002/spe
S. BURROWS, A. L. UITDENBOGERD AND A. TURPIN
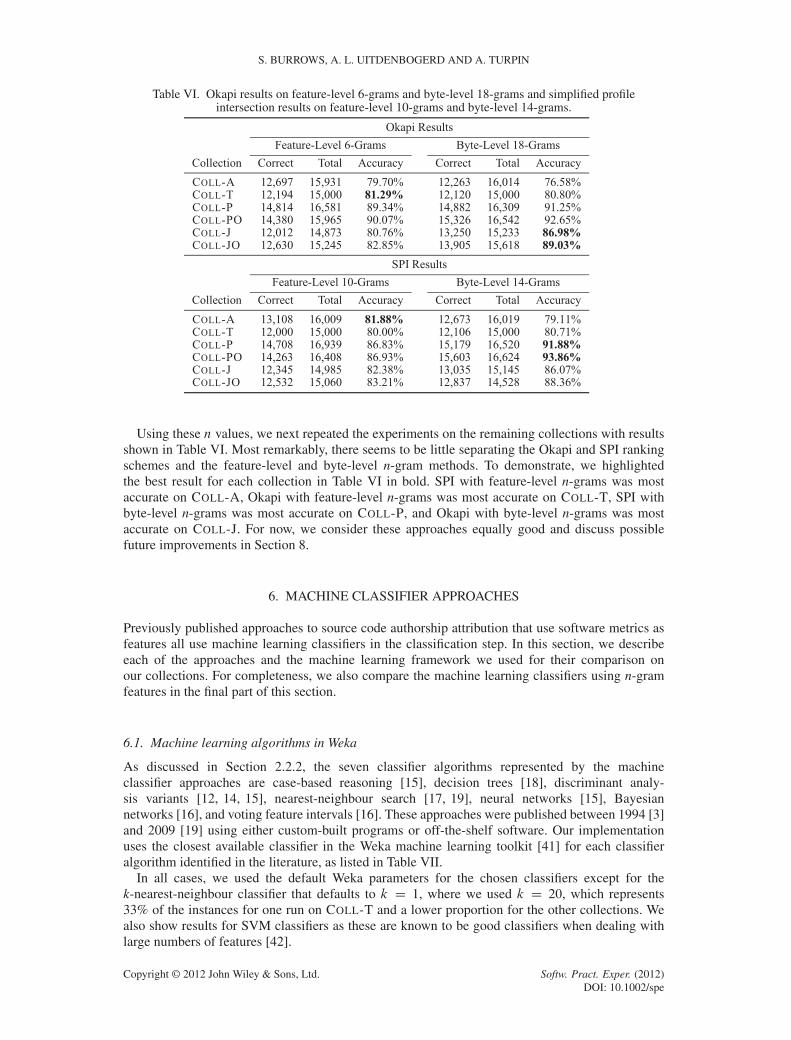
Table VI. Okapi results on feature-level 6-grams and byte-level 18-grams and simplified profileintersection results on feature-level 10-grams and byte-level 14-grams.
Using these n values, we next repeated the experiments on the remaining collections with resultsshown in Table VI. Most remarkably, there seems to be little separating the Okapi and SPI rankingschemes and the feature-level and byte-level n-gram methods. To demonstrate, we highlightedthe best result for each collection in Table VI in bold. SPI with feature-level n-grams was mostaccurate on COLL-A, Okapi with feature-level n-grams was most accurate on COLL-T, SPI withbyte-level n-grams was most accurate on COLL-P, and Okapi with byte-level n-grams was mostaccurate on COLL-J. For now, we consider these approaches equally good and discuss possiblefuture improvements in Section 8.
6. MACHINE CLASSIFIER APPROACHES
Previously published approaches to source code authorship attribution that use software metrics asfeatures all use machine learning classifiers in the classification step. In this section, we describeeach of the approaches and the machine learning framework we used for their comparison onour collections. For completeness, we also compare the machine learning classifiers using n-gramfeatures in the final part of this section.
6.1. Machine learning algorithms in Weka
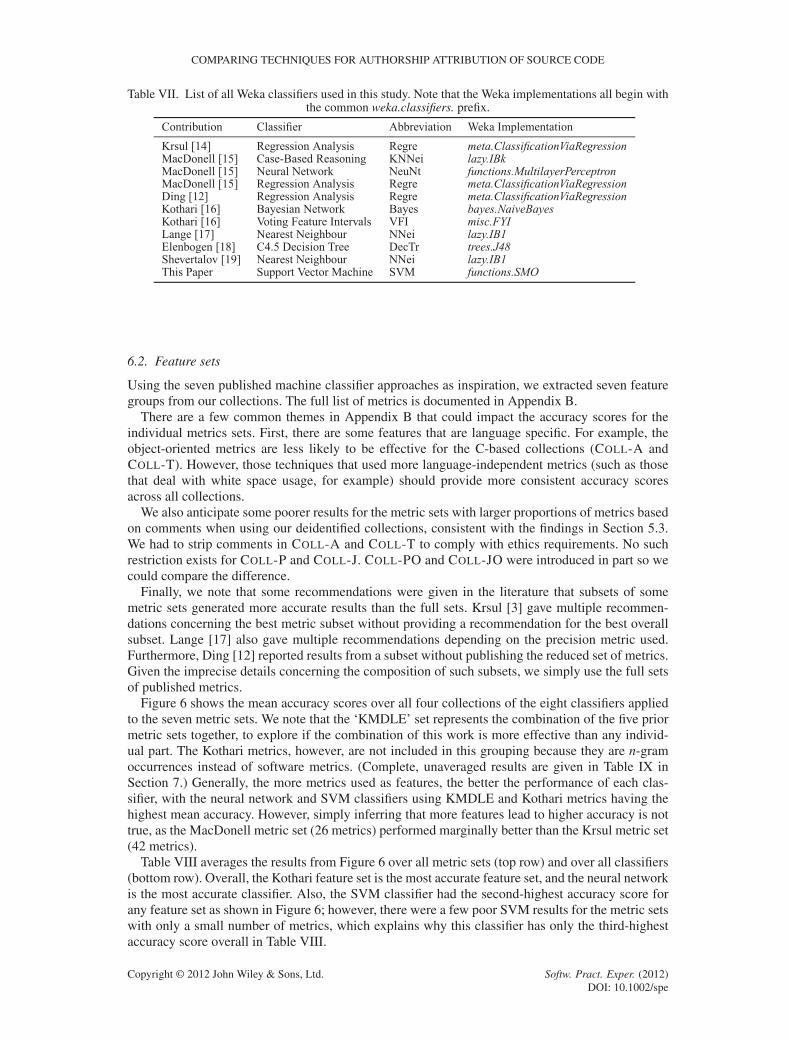
As discussed in Section 2.2.2, the seven classifier algorithms represented by the machineclassifier approaches are case-based reasoning [15], decision trees [18], discriminant analy-sis variants [12, 14, 15], nearest-neighbour search [17, 19], neural networks [15], Bayesiannetworks [16], and voting feature intervals [16]. These approaches were published between 1994 [3]and 2009 [19] using either custom-built programs or off-the-shelf software. Our implementationuses the closest available classifier in the Weka machine learning toolkit [41] for each classifieralgorithm identified in the literature, as listed in Table VII.
In all cases, we used the default Weka parameters for the chosen classifiers except for thek-nearest-neighbour classifier that defaults to k D 1, where we used k D 20, which represents33% of the instances for one run on COLL-T and a lower proportion for the other collections. Wealso show results for SVM classifiers as these are known to be good classifiers when dealing withlarge numbers of features [42].
Copyright © 2012 John Wiley & Sons, Ltd. Softw. Pract. Exper. (2012)DOI: 10.1002/spe
COMPARING TECHNIQUES FOR AUTHORSHIP ATTRIBUTION OF SOURCE CODE
Table VII. List of all Weka classifiers used in this study. Note that the Weka implementations all begin withthe common weka.classifiers. prefix.
6.2. Feature sets
Using the seven published machine classifier approaches as inspiration, we extracted seven featuregroups from our collections. The full list of metrics is documented in Appendix B.
There are a few common themes in Appendix B that could impact the accuracy scores for theindividual metrics sets. First, there are some features that are language specific. For example, theobject-oriented metrics are less likely to be effective for the C-based collections (COLL-A andCOLL-T). However, those techniques that used more language-independent metrics (such as thosethat deal with white space usage, for example) should provide more consistent accuracy scoresacross all collections.
We also anticipate some poorer results for the metric sets with larger proportions of metrics basedon comments when using our deidentified collections, consistent with the findings in Section 5.3.We had to strip comments in COLL-A and COLL-T to comply with ethics requirements. No suchrestriction exists for COLL-P and COLL-J. COLL-PO and COLL-JO were introduced in part so wecould compare the difference.
Finally, we note that some recommendations were given in the literature that subsets of somemetric sets generated more accurate results than the full sets. Krsul [3] gave multiple recommen-dations concerning the best metric subset without providing a recommendation for the best overallsubset. Lange [17] also gave multiple recommendations depending on the precision metric used.Furthermore, Ding [12] reported results from a subset without publishing the reduced set of metrics.Given the imprecise details concerning the composition of such subsets, we simply use the full setsof published metrics.
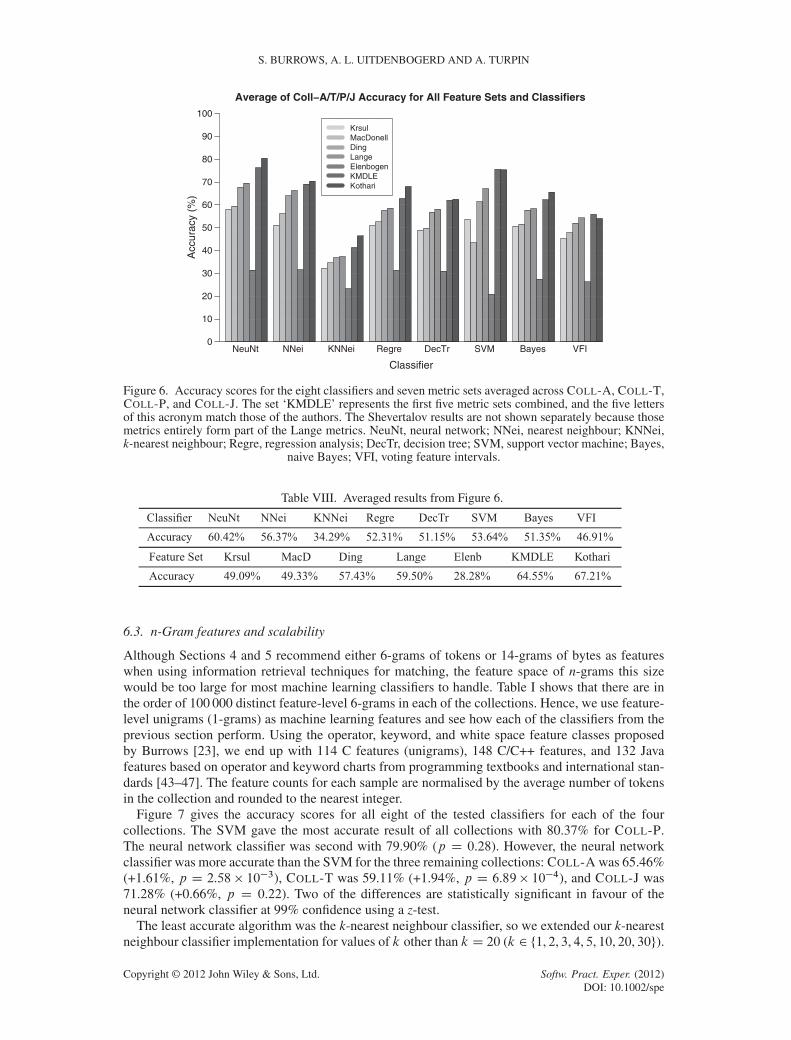
Figure 6 shows the mean accuracy scores over all four collections of the eight classifiers appliedto the seven metric sets. We note that the ‘KMDLE’ set represents the combination of the five priormetric sets together, to explore if the combination of this work is more effective than any individ-ual part. The Kothari metrics, however, are not included in this grouping because they are n-gramoccurrences instead of software metrics. (Complete, unaveraged results are given in Table IX inSection 7.) Generally, the more metrics used as features, the better the performance of each clas-sifier, with the neural network and SVM classifiers using KMDLE and Kothari metrics having thehighest mean accuracy. However, simply inferring that more features lead to higher accuracy is nottrue, as the MacDonell metric set (26 metrics) performed marginally better than the Krsul metric set(42 metrics).
Table VIII averages the results from Figure 6 over all metric sets (top row) and over all classifiers(bottom row). Overall, the Kothari feature set is the most accurate feature set, and the neural networkis the most accurate classifier. Also, the SVM classifier had the second-highest accuracy score forany feature set as shown in Figure 6; however, there were a few poor SVM results for the metric setswith only a small number of metrics, which explains why this classifier has only the third-highestaccuracy score overall in Table VIII.
Copyright © 2012 John Wiley & Sons, Ltd. Softw. Pract. Exper. (2012)DOI: 10.1002/spe
S. BURROWS, A. L. UITDENBOGERD AND A. TURPIN
NeuNt NNei KNNei Regre DecTr SVM Bayes VFI
Average of Coll−A/T/P/J Accuracy for All Feature Sets and Classifiers
Classifier
Acc
urac
y (%
)
0
10
20
30
40
50
60
70
80
90
100
KrsulMacDonellDingLangeElenbogenKMDLEKothari
Figure 6. Accuracy scores for the eight classifiers and seven metric sets averaged across COLL-A, COLL-T,COLL-P, and COLL-J. The set ‘KMDLE’ represents the first five metric sets combined, and the five lettersof this acronym match those of the authors. The Shevertalov results are not shown separately because thosemetrics entirely form part of the Lange metrics. NeuNt, neural network; NNei, nearest neighbour; KNNei,k-nearest neighbour; Regre, regression analysis; DecTr, decision tree; SVM, support vector machine; Bayes,
naive Bayes; VFI, voting feature intervals.
Table VIII. Averaged results from Figure 6.
6.3. n-Gram features and scalability
Although Sections 4 and 5 recommend either 6-grams of tokens or 14-grams of bytes as featureswhen using information retrieval techniques for matching, the feature space of n-grams this sizewould be too large for most machine learning classifiers to handle. Table I shows that there are inthe order of 100 000 distinct feature-level 6-grams in each of the collections. Hence, we use feature-level unigrams (1-grams) as machine learning features and see how each of the classifiers from theprevious section perform. Using the operator, keyword, and white space feature classes proposedby Burrows [23], we end up with 114 C features (unigrams), 148 C/C++ features, and 132 Javafeatures based on operator and keyword charts from programming textbooks and international stan-dards [43–47]. The feature counts for each sample are normalised by the average number of tokensin the collection and rounded to the nearest integer.
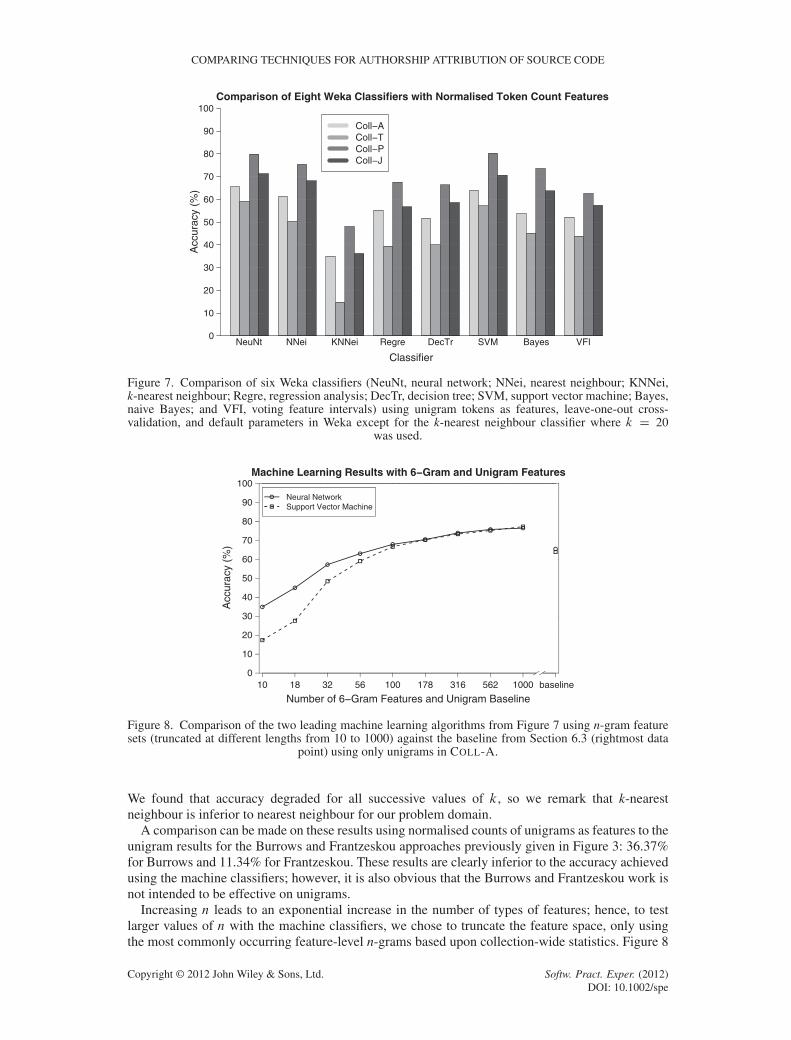
Figure 7 gives the accuracy scores for all eight of the tested classifiers for each of the fourcollections. The SVM gave the most accurate result of all collections with 80.37% for COLL-P.The neural network classifier was second with 79.90% (p D 0.28). However, the neural networkclassifier was more accurate than the SVM for the three remaining collections: COLL-A was 65.46%(+1.61%, p D 2.58 � 10�3), COLL-T was 59.11% (+1.94%, p D 6.89 � 10�4), and COLL-J was71.28% (+0.66%, p D 0.22). Two of the differences are statistically significant in favour of theneural network classifier at 99% confidence using a z-test.
The least accurate algorithm was the k-nearest neighbour classifier, so we extended our k-nearestneighbour classifier implementation for values of k other than k D 20 (k 2 ¹1, 2, 3, 4, 5, 10, 20, 30º).
Copyright © 2012 John Wiley & Sons, Ltd. Softw. Pract. Exper. (2012)DOI: 10.1002/spe
COMPARING TECHNIQUES FOR AUTHORSHIP ATTRIBUTION OF SOURCE CODE
Comparison of Eight Weka Classifiers with Normalised Token Count Features
Classifier
Acc
urac
y (%
)
0
10
20
30
40
50
60
70
80
90
100
Coll−AColl−TColl−PColl−J
NeuNt NNei KNNei Regre DecTr SVM Bayes VFI
Figure 7. Comparison of six Weka classifiers (NeuNt, neural network; NNei, nearest neighbour; KNNei,k-nearest neighbour; Regre, regression analysis; DecTr, decision tree; SVM, support vector machine; Bayes,naive Bayes; and VFI, voting feature intervals) using unigram tokens as features, leave-one-out cross-validation, and default parameters in Weka except for the k-nearest neighbour classifier where k D 20
was used.
Machine Learning Results with 6−Gram and Unigram Features
Neural NetworkSupport Vector Machine
Acc
urac
y (%
)
0
10
20
30
40
50
60
70
80
90
100
Number of 6−Gram Features and Unigram Baseline10 18 32 56 100 178 316 562 1000 baseline
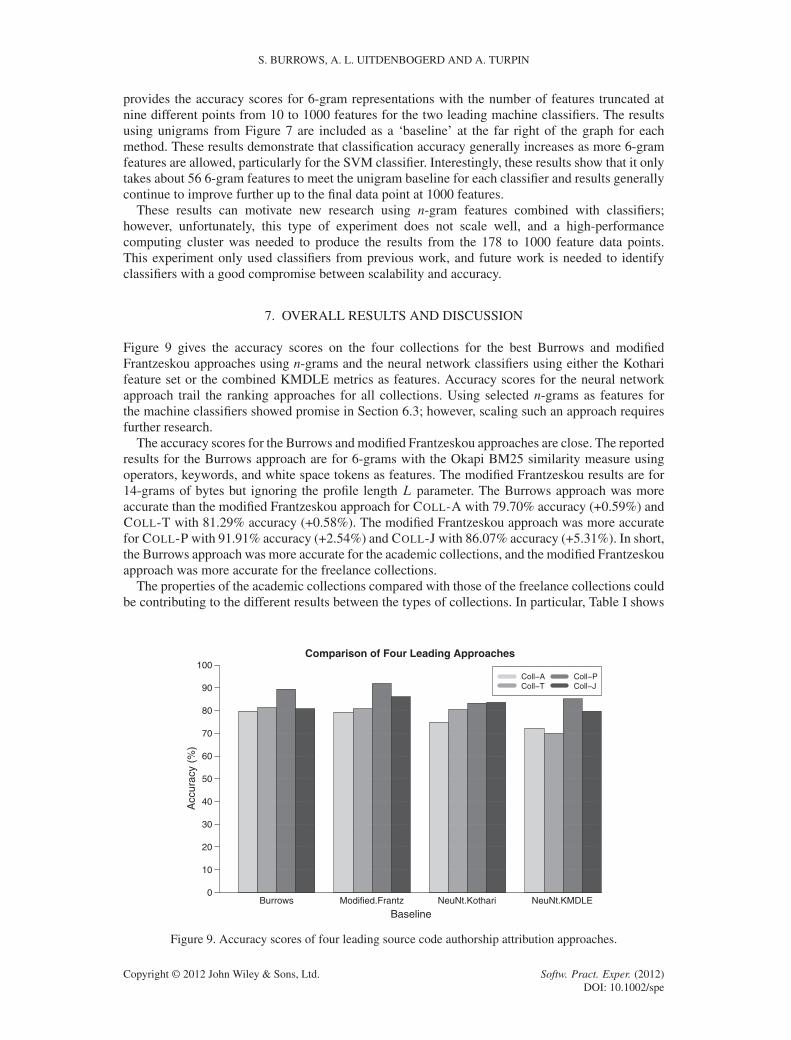
Figure 8. Comparison of the two leading machine learning algorithms from Figure 7 using n-gram featuresets (truncated at different lengths from 10 to 1000) against the baseline from Section 6.3 (rightmost data
point) using only unigrams in COLL-A.
We found that accuracy degraded for all successive values of k, so we remark that k-nearestneighbour is inferior to nearest neighbour for our problem domain.
A comparison can be made on these results using normalised counts of unigrams as features to theunigram results for the Burrows and Frantzeskou approaches previously given in Figure 3: 36.37%for Burrows and 11.34% for Frantzeskou. These results are clearly inferior to the accuracy achievedusing the machine classifiers; however, it is also obvious that the Burrows and Frantzeskou work isnot intended to be effective on unigrams.
Increasing n leads to an exponential increase in the number of types of features; hence, to testlarger values of n with the machine classifiers, we chose to truncate the feature space, only usingthe most commonly occurring feature-level n-grams based upon collection-wide statistics. Figure 8
Copyright © 2012 John Wiley & Sons, Ltd. Softw. Pract. Exper. (2012)DOI: 10.1002/spe
S. BURROWS, A. L. UITDENBOGERD AND A. TURPIN
provides the accuracy scores for 6-gram representations with the number of features truncated atnine different points from 10 to 1000 features for the two leading machine classifiers. The resultsusing unigrams from Figure 7 are included as a ‘baseline’ at the far right of the graph for eachmethod. These results demonstrate that classification accuracy generally increases as more 6-gramfeatures are allowed, particularly for the SVM classifier. Interestingly, these results show that it onlytakes about 56 6-gram features to meet the unigram baseline for each classifier and results generallycontinue to improve further up to the final data point at 1000 features.
These results can motivate new research using n-gram features combined with classifiers;however, unfortunately, this type of experiment does not scale well, and a high-performancecomputing cluster was needed to produce the results from the 178 to 1000 feature data points.This experiment only used classifiers from previous work, and future work is needed to identifyclassifiers with a good compromise between scalability and accuracy.
7. OVERALL RESULTS AND DISCUSSION
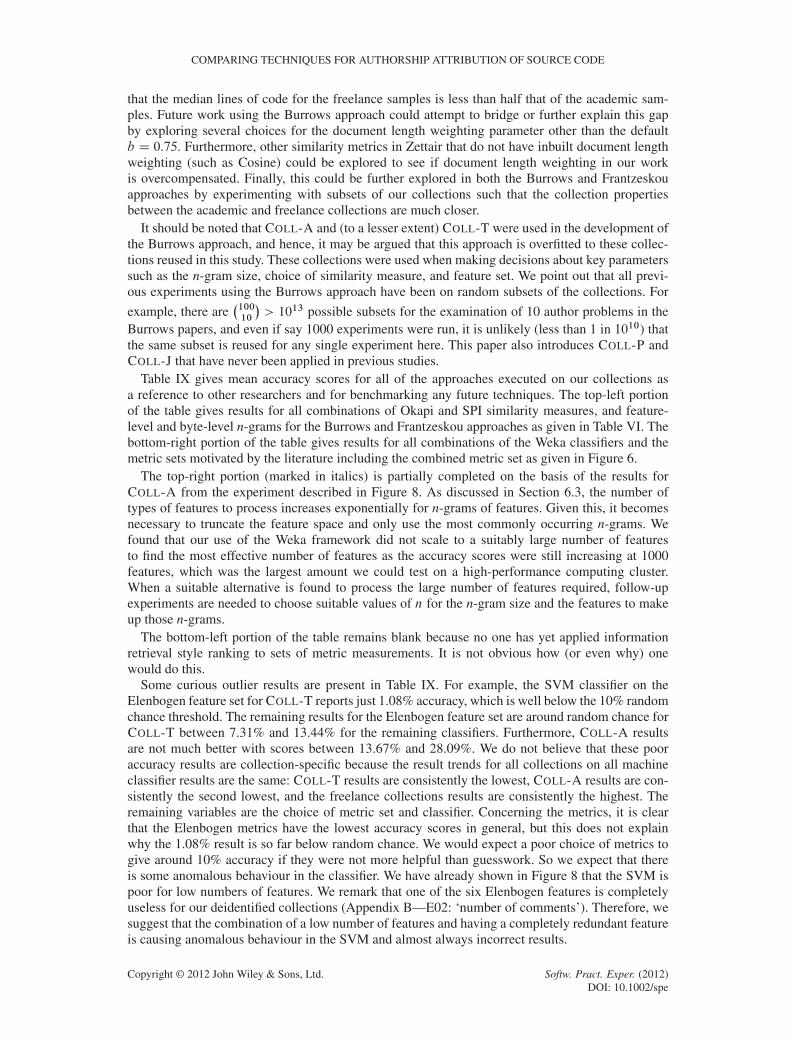
Figure 9 gives the accuracy scores on the four collections for the best Burrows and modifiedFrantzeskou approaches using n-grams and the neural network classifiers using either the Kotharifeature set or the combined KMDLE metrics as features. Accuracy scores for the neural networkapproach trail the ranking approaches for all collections. Using selected n-grams as features forthe machine classifiers showed promise in Section 6.3; however, scaling such an approach requiresfurther research.
The accuracy scores for the Burrows and modified Frantzeskou approaches are close. The reportedresults for the Burrows approach are for 6-grams with the Okapi BM25 similarity measure usingoperators, keywords, and white space tokens as features. The modified Frantzeskou results are for14-grams of bytes but ignoring the profile length L parameter. The Burrows approach was moreaccurate than the modified Frantzeskou approach for COLL-A with 79.70% accuracy (+0.59%) andCOLL-T with 81.29% accuracy (+0.58%). The modified Frantzeskou approach was more accuratefor COLL-P with 91.91% accuracy (+2.54%) and COLL-J with 86.07% accuracy (+5.31%). In short,the Burrows approach was more accurate for the academic collections, and the modified Frantzeskouapproach was more accurate for the freelance collections.
The properties of the academic collections compared with those of the freelance collections couldbe contributing to the different results between the types of collections. In particular, Table I shows
Burrows Modified.Frantz NeuNt.Kothari NeuNt.KMDLE
Comparison of Four Leading Approaches
Baseline
Acc
urac
y (%
)
0
10
20
30
40
50
60
70
80
90
100Coll−AColl−T
Coll−PColl−J
Figure 9. Accuracy scores of four leading source code authorship attribution approaches.
Copyright © 2012 John Wiley & Sons, Ltd. Softw. Pract. Exper. (2012)DOI: 10.1002/spe
COMPARING TECHNIQUES FOR AUTHORSHIP ATTRIBUTION OF SOURCE CODE
that the median lines of code for the freelance samples is less than half that of the academic sam-ples. Future work using the Burrows approach could attempt to bridge or further explain this gapby exploring several choices for the document length weighting parameter other than the defaultb D 0.75. Furthermore, other similarity metrics in Zettair that do not have inbuilt document lengthweighting (such as Cosine) could be explored to see if document length weighting in our workis overcompensated. Finally, this could be further explored in both the Burrows and Frantzeskouapproaches by experimenting with subsets of our collections such that the collection propertiesbetween the academic and freelance collections are much closer.
It should be noted that COLL-A and (to a lesser extent) COLL-T were used in the development ofthe Burrows approach, and hence, it may be argued that this approach is overfitted to these collec-tions reused in this study. These collections were used when making decisions about key parameterssuch as the n-gram size, choice of similarity measure, and feature set. We point out that all previ-ous experiments using the Burrows approach have been on random subsets of the collections. For
example, there are�10010
�> 1013 possible subsets for the examination of 10 author problems in the
Burrows papers, and even if say 1000 experiments were run, it is unlikely (less than 1 in 1010) thatthe same subset is reused for any single experiment here. This paper also introduces COLL-P andCOLL-J that have never been applied in previous studies.
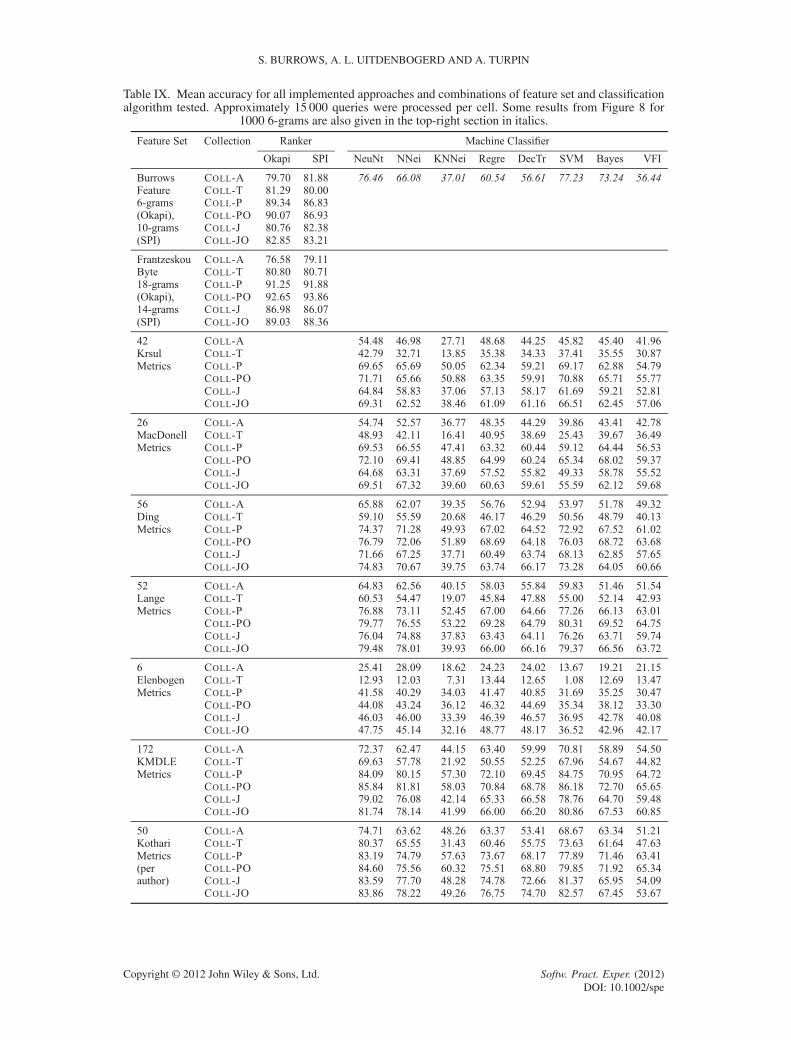
Table IX gives mean accuracy scores for all of the approaches executed on our collections asa reference to other researchers and for benchmarking any future techniques. The top-left portionof the table gives results for all combinations of Okapi and SPI similarity measures, and feature-level and byte-level n-grams for the Burrows and Frantzeskou approaches as given in Table VI. Thebottom-right portion of the table gives results for all combinations of the Weka classifiers and themetric sets motivated by the literature including the combined metric set as given in Figure 6.
The top-right portion (marked in italics) is partially completed on the basis of the results forCOLL-A from the experiment described in Figure 8. As discussed in Section 6.3, the number oftypes of features to process increases exponentially for n-grams of features. Given this, it becomesnecessary to truncate the feature space and only use the most commonly occurring n-grams. Wefound that our use of the Weka framework did not scale to a suitably large number of featuresto find the most effective number of features as the accuracy scores were still increasing at 1000features, which was the largest amount we could test on a high-performance computing cluster.When a suitable alternative is found to process the large number of features required, follow-upexperiments are needed to choose suitable values of n for the n-gram size and the features to makeup those n-grams.
The bottom-left portion of the table remains blank because no one has yet applied informationretrieval style ranking to sets of metric measurements. It is not obvious how (or even why) onewould do this.
Some curious outlier results are present in Table IX. For example, the SVM classifier on theElenbogen feature set for COLL-T reports just 1.08% accuracy, which is well below the 10% randomchance threshold. The remaining results for the Elenbogen feature set are around random chance forCOLL-T between 7.31% and 13.44% for the remaining classifiers. Furthermore, COLL-A resultsare not much better with scores between 13.67% and 28.09%. We do not believe that these pooraccuracy results are collection-specific because the result trends for all collections on all machineclassifier results are the same: COLL-T results are consistently the lowest, COLL-A results are con-sistently the second lowest, and the freelance collections results are consistently the highest. Theremaining variables are the choice of metric set and classifier. Concerning the metrics, it is clearthat the Elenbogen metrics have the lowest accuracy scores in general, but this does not explainwhy the 1.08% result is so far below random chance. We would expect a poor choice of metrics togive around 10% accuracy if they were not more helpful than guesswork. So we expect that thereis some anomalous behaviour in the classifier. We have already shown in Figure 8 that the SVM ispoor for low numbers of features. We remark that one of the six Elenbogen features is completelyuseless for our deidentified collections (Appendix B—E02: ‘number of comments’). Therefore, wesuggest that the combination of a low number of features and having a completely redundant featureis causing anomalous behaviour in the SVM and almost always incorrect results.
Copyright © 2012 John Wiley & Sons, Ltd. Softw. Pract. Exper. (2012)DOI: 10.1002/spe
S. BURROWS, A. L. UITDENBOGERD AND A. TURPIN
Table IX. Mean accuracy for all implemented approaches and combinations of feature set and classificationalgorithm tested. Approximately 15 000 queries were processed per cell. Some results from Figure 8 for
1000 6-grams are also given in the top-right section in italics.
Copyright © 2012 John Wiley & Sons, Ltd. Softw. Pract. Exper. (2012)DOI: 10.1002/spe

COMPARING TECHNIQUES FOR AUTHORSHIP ATTRIBUTION OF SOURCE CODE
8. FUTURE DIRECTIONS
8.1. N-gram tokens
We suggest more work can be performed for feature selection for the Burrows contribution. TheFigure 6 results motivate this by demonstrating that the machine classifier accuracy scores almostalways kept the same order regardless of the classification algorithm. The previous feature selectionwork [23] experimented with six classes of features as described in the literature [48]: white spacefeatures, operators, literals, keywords, input/output tokens, and standard library tokens. The com-bination of operators, keywords, and white space features was found to be most accurate and thisresult was carried forward in all following work. We suggest that the individual features could befurther refined using machine learning feature selection algorithms. Furthermore, there are severalother tokens that could have been processed that did not fall into the aforementioned six categories,most notably curly braces, semicolons, and preprocessor directives. This additional work may pushthe Burrows approach above the Frantzeskou approach as no feature selection work remains for theconstruction of unambiguous byte-level n-grams unless some specific bytes are ignored.
8.2. Information retrieval ranking
The two previous groups publishing information retrieval approaches to source code attribution usedthe Okapi and co-ordinate matching similarity measures. Although Burrows [20] performed someexperimentation with other ranking formulae, the area is underexplored.
8.3. Classifiers and metrics
More work is needed to explore scaling machine classifiers to handle the exponential growth inthe number of n-gram features as n increases. In this paper, we report simple experiments wherethe number of features was simply truncated, but more rigorous algorithms or heuristics mightimprove classification accuracy. In this respect, the use of entropy by Kothari [16] represents astep in this direction.
Similar to the recommendation for improving n-gram approaches, we again suggest feature-selection work for the machine classifier approaches. The KMDLE feature set contains 172 metrics,and pruning functionality in feature selection algorithms may be able to reduce dimensionalityby removing features that never or rarely appear or remove features that offer little or nodiscrimination between authors. These refinements may lead to increased accuracy scores. For now,we simply use all metrics to generate results and leave the classifiers to manage the good and poormetrics themselves.
Another recommendation is to consider byte-level metrics (metrics about ratios of specificbyte occurrences in the code) as a follow-up to the use of byte-level n-grams by Frantzeskou.Furthermore, metrics of byte-level n-grams can be considered similarly to metrics of feature-leveln-grams in Section 6.3.
8.4. Improvements to lexers
Our implementation of the metric sets treated all local variables, global variables, function names,function parameter names, and type definitions as generic ‘identifiers’. There was difficulty inparsing these tokens without the use of compiler suites given that samples often do not compilebecause of deidentification and poorly written code. Future work remains in better distinguishingthese types of tokens in erroneous and damaged source code.
8.5. Availability of the collections
As we were unable to obtain permission from the authors represented in our collections, wecan only release statistical features of the collections. By the provision of the frequency of each
Copyright © 2012 John Wiley & Sons, Ltd. Softw. Pract. Exper. (2012)DOI: 10.1002/spe
S. BURROWS, A. L. UITDENBOGERD AND A. TURPIN
token in each sample, as well as bigrams, our work can at least be partly reproducible in futurework by others without breaching the copyright of authors. The data are publicly available athttp://hdl.handle.net/102.100.100/166.
For the COLL-P, COLL-PO, COLL-J and COLL-JO collections, the source code is available;however, the dynamic nature of the Internet will make collections downloaded similar but notidentical to ours. Appendix A describes how these collections can be reproduced at the Planet SourceCode website using the most current samples.
9. CONCLUSIONS
At least nine research groups have published source code authorship attribution empirical work todate, but it is unclear which approach is the most accurate given varying test beds and evaluationmethodologies. This paper establishes four comprehensive collections representing multiple pro-gramming languages from academia and freelance sources upon which many techniques motivatedby the literature are tested.
The conclusions are fivefold.
1. The best results for our largest freelance collection show that both the Burrows andFrantzeskou approaches are around 90% accurate and the leading machine classifierapproaches are around 85% accurate for a one-in-10 problem.
2. The Frantzeskou work requires a larger n for the n-gram length than previously published, andthe practice of truncating author profiles at uncertain lengths can be safely ignored.
3. Of those evaluated, the neural network and SVM are the most accurate machine learningclassification algorithms for this problem; however, the SVM is poorer for small feature sets.
4. Using n-gram features in machine learning shows promise but is not scalable to large n.5. Current results suggest that the Burrows and modified Frantzeskou information retrieval
approaches are the state of the art.
There is more that could be explored to advance the techniques for source code authorshipattribution. However, if a practical system were to be implemented today, our recommendation basedon our experiments and the relative efficiency of the different approaches is to use an informationretrieval approach by extending an existing search engine.
APPENDIX A: COLL-P AND COLL-J REPRODUCTION
Planet Source Code is accessible at http://www.planet-source-code.com. To generate COLL-P andCOLL-J, we first selected the programming language we were interested in on the homepage.Second, we followed the ‘advanced category browse’ link to take us to the form that performsdetailed searches. Third, we refined the search options by selecting the following:
� “Choose a category to browse”: All� “Code type”: .Zip files (for convenience)� “Code difficulty level”: Unranked, beginner, intermediate, and advanced (all four categories)� “Scans actual code contents”: No (unnecessary)� “Display in”: Alphabetical order� “Max number of entries to view (per page)”: 50 (the maximum)
Finally, we considered the links to thousands of work samples exhaustively in turn. Each sampleweb page has a link that provides general information “about the author” containing some personalprofile information. Most importantly, the profile pages contain a link to “all submissions by thisauthor”. For each author, we downloaded all work samples in zip format providing that there wereenough samples to meet our desired minimum number of samples per author figure. The process weused unfortunately causes us to come across author profile pages that we previously visited, so we
Copyright © 2012 John Wiley & Sons, Ltd. Softw. Pract. Exper. (2012)DOI: 10.1002/spe
COMPARING TECHNIQUES FOR AUTHORSHIP ATTRIBUTION OF SOURCE CODE
had to keep a record of the author aliases that we used. There is no option to organise the results byauthor to our knowledge.
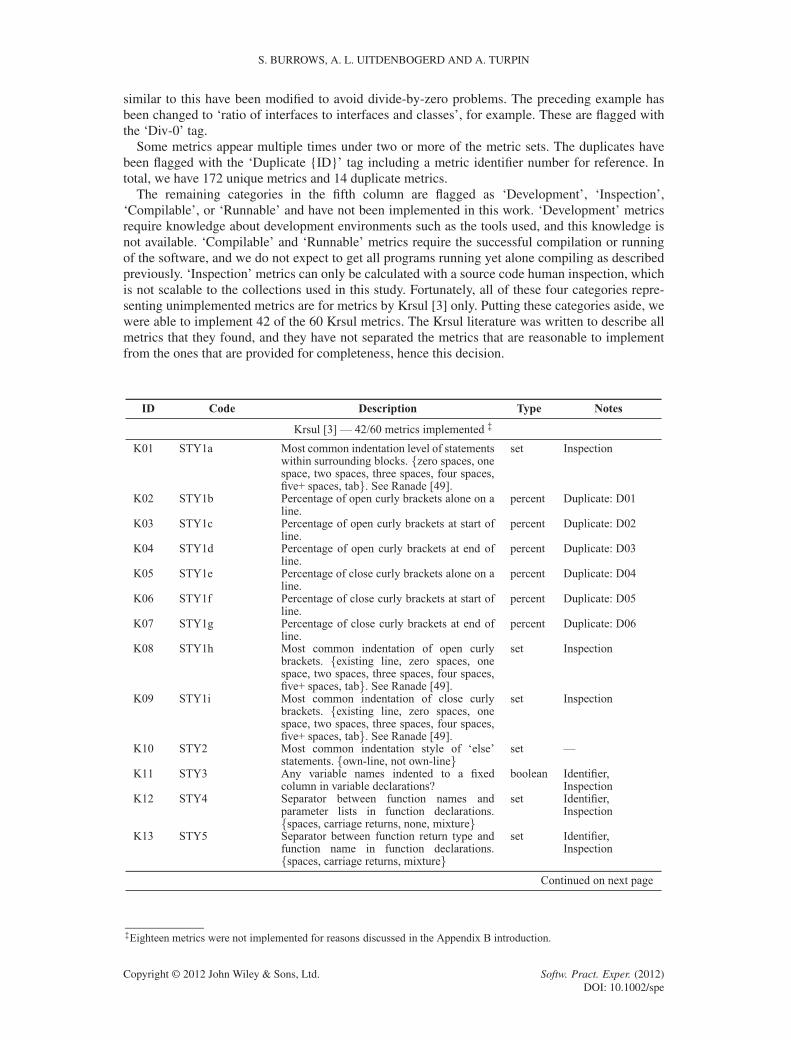
APPENDIX B: FEATURES IN THE LITERATURE
The following table lists source code features used in previous studies. We acknowledge thatthe features listed have either been reproduced or paraphrased for readability from the respectivepublications as necessary.
This table is organised into five columns. The first column contains an identification number,used for cross-referencing purposes, consisting of the first letter of the first author plus a sequentialnatural number.
The second column contains the identifying number (or ‘code’) used in the literature by most ofthe research groups. Krsul [3] and Ding [12] used similar numbering schemes to differentiate layoutmetrics, style metrics, and structure metrics. Lange [17] used metric ‘classes’ such as line-len-Nfor calculating the percentage of times code line lengths of N characters appear. Discretising N atsensible lengths was necessary for two reasons. First, we need to have a consistent value ofN acrossall collections. Second, these metric classes otherwise generated impractical numbers of metricsas input to the classification algorithms. MacDonell [15] used a naming convention similar to thedescription of the metrics. Elenbogen [18] did not use codes, so we repeated the first column iden-tification numbers here. Finally, Kothari [16] did not use codes either, as the individual byte-leveln-grams selected do not have meaningful descriptions.
The third column contains the metric descriptions as stated in the original publications. Thesedescriptions have either been reproduced or paraphrased for readability from the respectivepublications as acknowledged in the table below.
The fourth column documents the type of measurement for each metric. The five types of mea-surements are percentage measurement, integer number, real number, Boolean measurement, and‘one-of-many’ sets (or enumerations). For features with nominal measurements (Boolean and set),we chose the first-listed class descriptor in the event of measurement ties. Also, some metrics arenormalised, others are not. We respected the original decisions of the authors here, even thoughwe believe normalisation is superior when accounting for varying program lengths. Also, we chosenormalised metrics when the implementation decision is not clear.
The fifth and final column provides some ‘tags’ for common notes that would otherwise berepeated for each instance in the table. First, some of the Lange [17] metric classes such asword-len-N have been tagged with the values of N used. In the literature, Lange [17] used everyvalue of N applicable to the collection in the study. However, the histogram-based method pro-posed does not scale to a machine learning implementation with one feature for each measurement.Thousands of measurements are potentially required depending on each collection. For example,with the line-len-Nmetric, there could be hundreds of different possible line lengths in a collec-tion; hence, this metric would require hundreds of measurements in itself. Therefore, we frequentlygroup some values of N together (discretisation). For example, the line-len-N metric has beendocumented as “N 2 ¹0 : : : 19, 20 : : :1º”, indicating one measurement for lines of 0–19 charactersand another for lines with 20 or more characters.
Some metrics require more than a shallow lexicographic parsing of the source code to differentiateidentifiers such as local variables, global variables, function names, function parameter names,and type definitions. Determining higher-level labels for source code constructs requires success-ful parsing of the code and relies on correct syntax for the language grammar used. Given thatour deidentification process disrupted some syntax and that many of the source files from studentscontained syntax errors anyway, we felt that parsing to identify high-level features could not besuccessfully automated for our collections. Therefore, we simply tagged all identifiers in the sourcecode with a generic ‘identifier’ token. This meant that metrics such as ‘average characters perfunction name’ become ‘average characters per identifier’. All affected metrics are flagged withthe ‘Identifier’ tag.
Some metrics report measurements such as ‘ratio of interfaces to classes’. In this example, adivide-by-zero problem can occur if a sample contains some interfaces and zero classes. Metrics
Copyright © 2012 John Wiley & Sons, Ltd. Softw. Pract. Exper. (2012)DOI: 10.1002/spe
S. BURROWS, A. L. UITDENBOGERD AND A. TURPIN
similar to this have been modified to avoid divide-by-zero problems. The preceding example hasbeen changed to ‘ratio of interfaces to interfaces and classes’, for example. These are flagged withthe ‘Div-0’ tag.
Some metrics appear multiple times under two or more of the metric sets. The duplicates havebeen flagged with the ‘Duplicate {ID}’ tag including a metric identifier number for reference. Intotal, we have 172 unique metrics and 14 duplicate metrics.
The remaining categories in the fifth column are flagged as ‘Development’, ‘Inspection’,‘Compilable’, or ‘Runnable’ and have not been implemented in this work. ‘Development’ metricsrequire knowledge about development environments such as the tools used, and this knowledge isnot available. ‘Compilable’ and ‘Runnable’ metrics require the successful compilation or runningof the software, and we do not expect to get all programs running yet alone compiling as describedpreviously. ‘Inspection’ metrics can only be calculated with a source code human inspection, whichis not scalable to the collections used in this study. Fortunately, all of these four categories repre-senting unimplemented metrics are for metrics by Krsul [3] only. Putting these categories aside, wewere able to implement 42 of the 60 Krsul metrics. The Krsul literature was written to describe allmetrics that they found, and they have not separated the metrics that are reasonable to implementfrom the ones that are provided for completeness, hence this decision.
Copyright © 2012 John Wiley & Sons, Ltd. Softw. Pract. Exper. (2012)DOI: 10.1002/spe
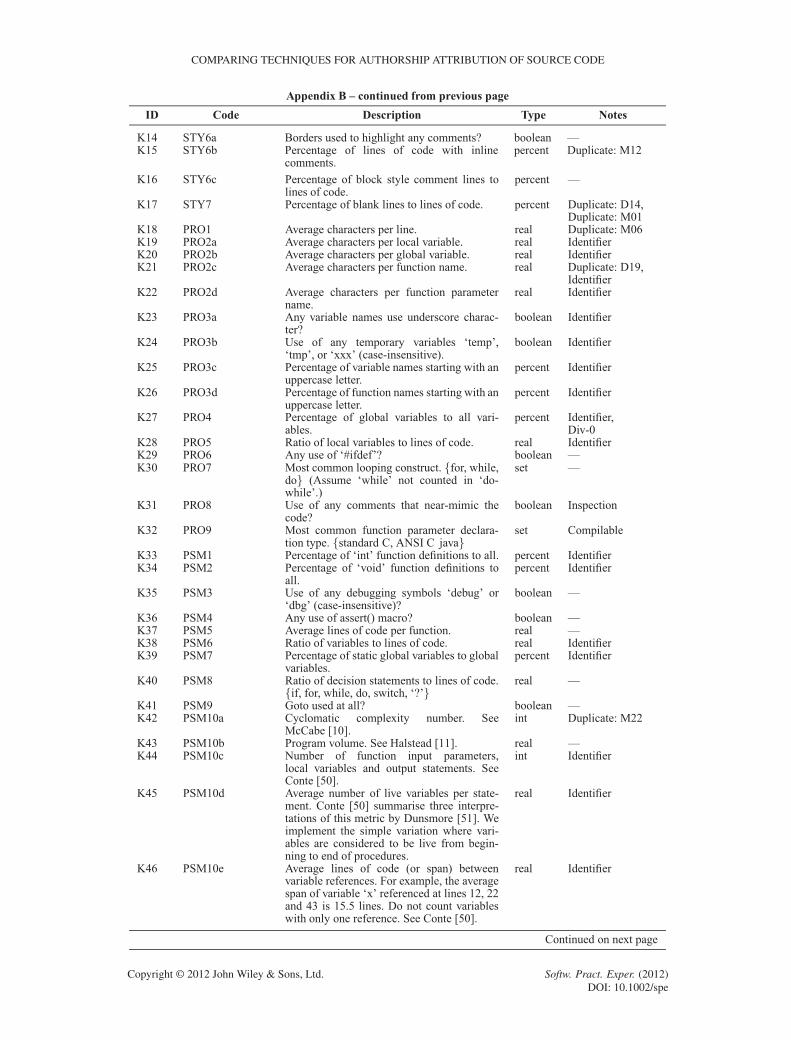
COMPARING TECHNIQUES FOR AUTHORSHIP ATTRIBUTION OF SOURCE CODE
Copyright © 2012 John Wiley & Sons, Ltd. Softw. Pract. Exper. (2012)DOI: 10.1002/spe
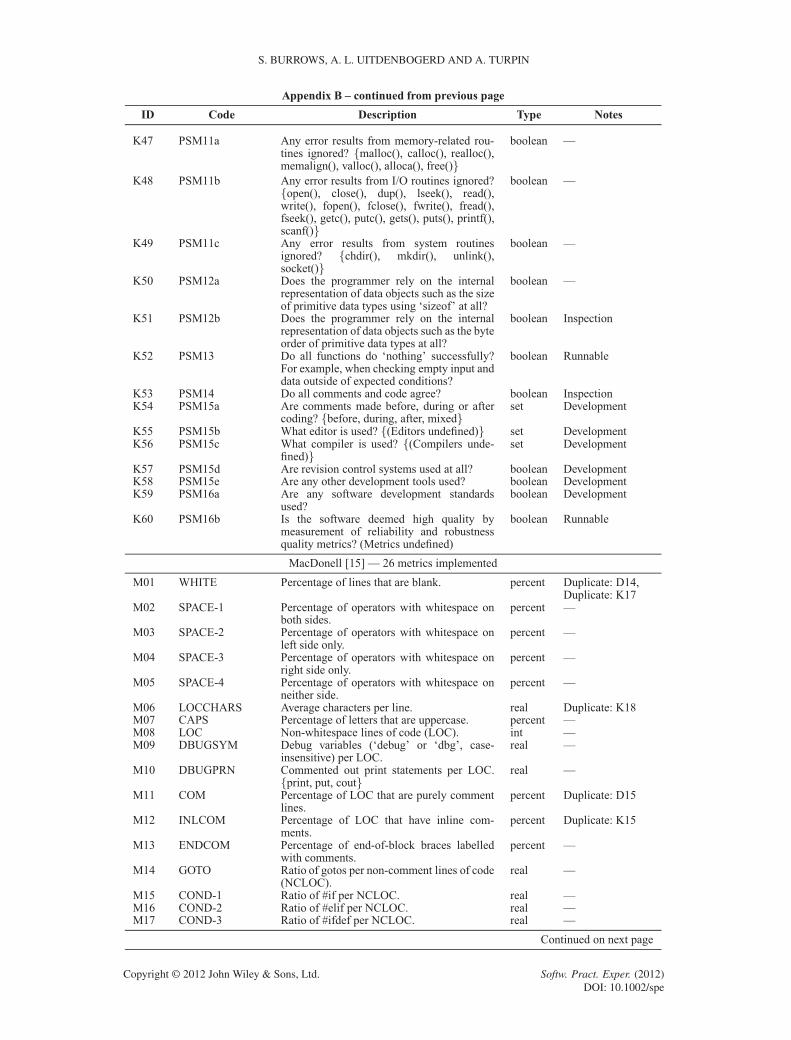
S. BURROWS, A. L. UITDENBOGERD AND A. TURPIN
Copyright © 2012 John Wiley & Sons, Ltd. Softw. Pract. Exper. (2012)DOI: 10.1002/spe
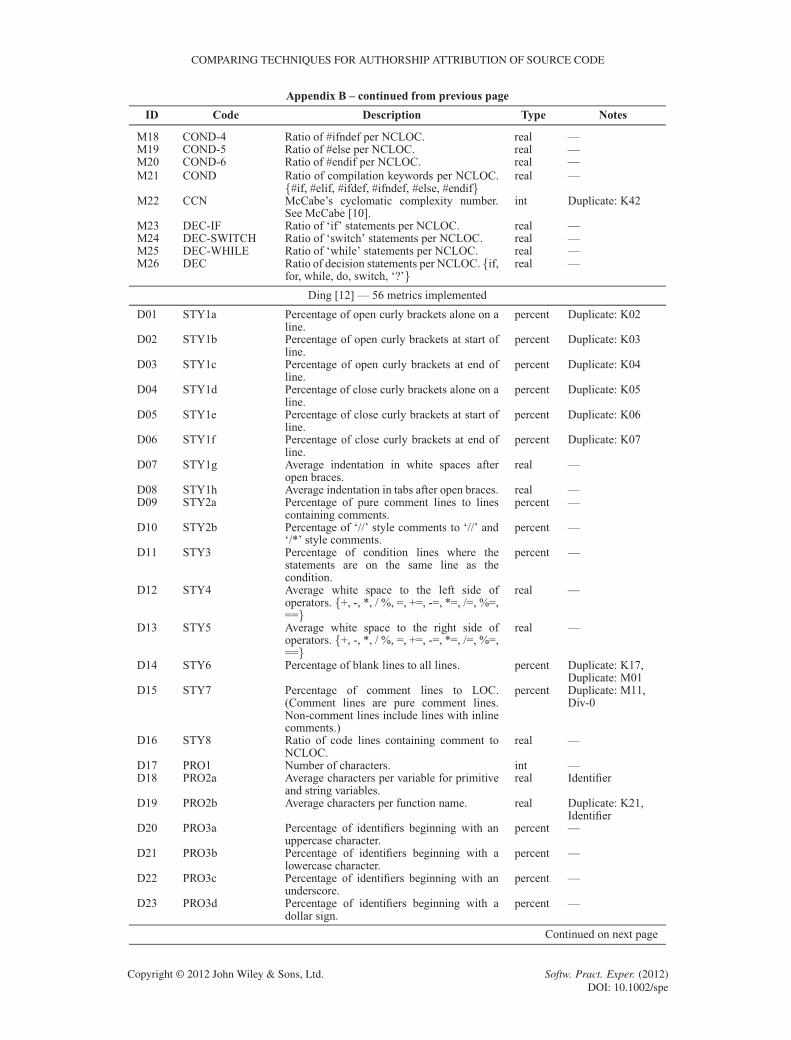
COMPARING TECHNIQUES FOR AUTHORSHIP ATTRIBUTION OF SOURCE CODE
Copyright © 2012 John Wiley & Sons, Ltd. Softw. Pract. Exper. (2012)DOI: 10.1002/spe
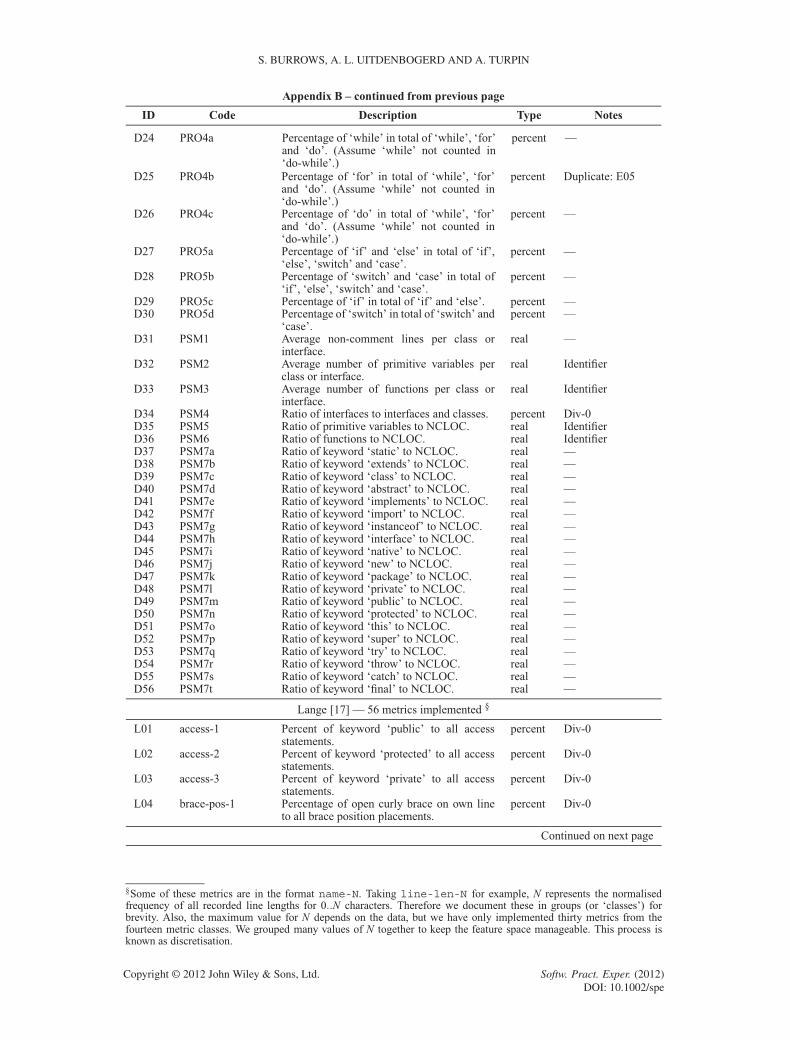
S. BURROWS, A. L. UITDENBOGERD AND A. TURPIN
Copyright © 2012 John Wiley & Sons, Ltd. Softw. Pract. Exper. (2012)DOI: 10.1002/spe
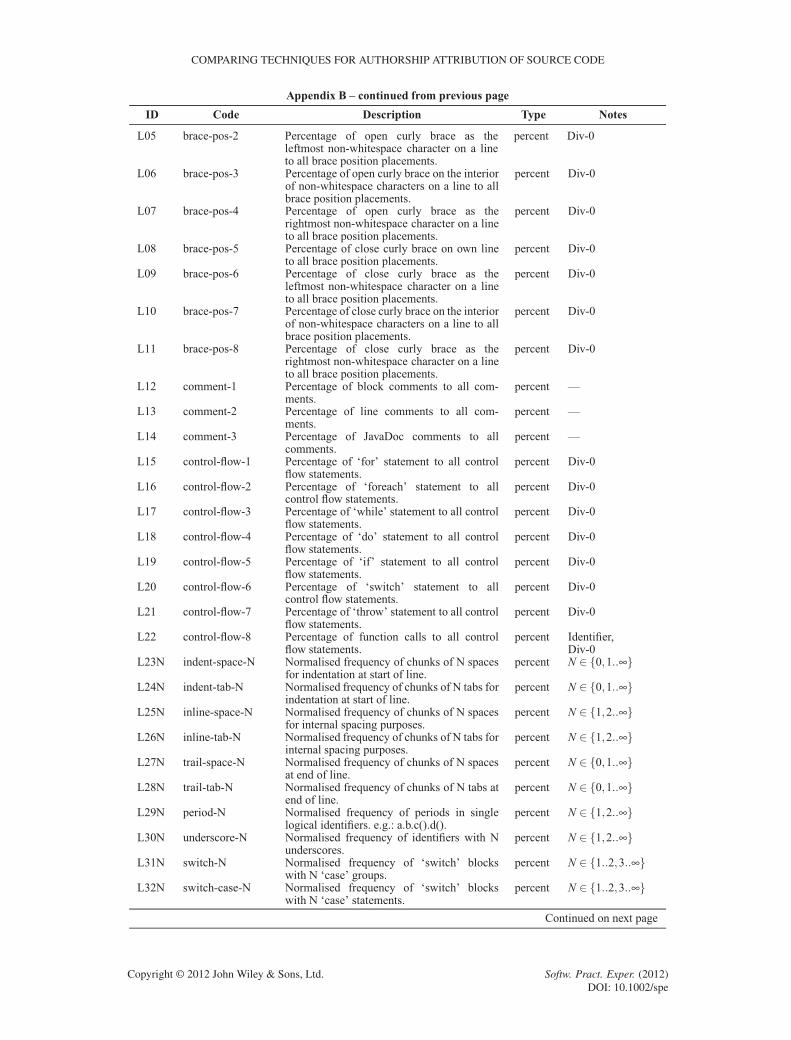
COMPARING TECHNIQUES FOR AUTHORSHIP ATTRIBUTION OF SOURCE CODE
Copyright © 2012 John Wiley & Sons, Ltd. Softw. Pract. Exper. (2012)DOI: 10.1002/spe
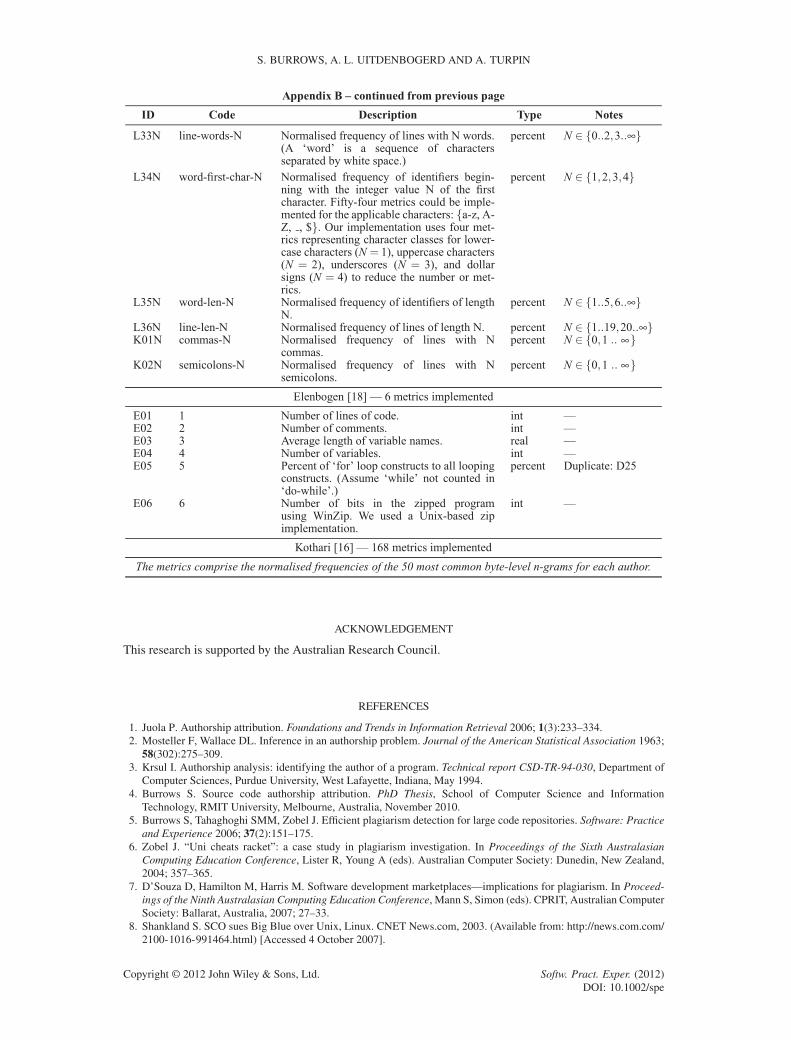
S. BURROWS, A. L. UITDENBOGERD AND A. TURPIN
ACKNOWLEDGEMENT
This research is supported by the Australian Research Council.
REFERENCES
1. Juola P. Authorship attribution. Foundations and Trends in Information Retrieval 2006; 1(3):233–334.2. Mosteller F, Wallace DL. Inference in an authorship problem. Journal of the American Statistical Association 1963;
58(302):275–309.3. Krsul I. Authorship analysis: identifying the author of a program. Technical report CSD-TR-94-030, Department of
Computer Sciences, Purdue University, West Lafayette, Indiana, May 1994.4. Burrows S. Source code authorship attribution. PhD Thesis, School of Computer Science and Information
Technology, RMIT University, Melbourne, Australia, November 2010.5. Burrows S, Tahaghoghi SMM, Zobel J. Efficient plagiarism detection for large code repositories. Software: Practice
and Experience 2006; 37(2):151–175.6. Zobel J. “Uni cheats racket”: a case study in plagiarism investigation. In Proceedings of the Sixth Australasian
Computing Education Conference, Lister R, Young A (eds). Australian Computer Society: Dunedin, New Zealand,2004; 357–365.
7. D’Souza D, Hamilton M, Harris M. Software development marketplaces—implications for plagiarism. In Proceed-ings of the Ninth Australasian Computing Education Conference, Mann S, Simon (eds). CPRIT, Australian ComputerSociety: Ballarat, Australia, 2007; 27–33.
8. Shankland S. SCO sues Big Blue over Unix, Linux. CNET News.com, 2003. (Available from: http://news.com.com/2100-1016-991464.html) [Accessed 4 October 2007].
Copyright © 2012 John Wiley & Sons, Ltd. Softw. Pract. Exper. (2012)DOI: 10.1002/spe
COMPARING TECHNIQUES FOR AUTHORSHIP ATTRIBUTION OF SOURCE CODE
9. Burrows S, Uitdenbogerd AL, Turpin A. Temporally robust software features for authorship attribution. In Proceed-ings of the Thirty-Third Annual IEEE International Computer Software and Applications Conference, Hey T, BertinoE, Getov V, Liu L (eds). IEEE Computer Society Press: Seattle, Washington, 2009; 599–606.
10. McCabe TJ. A complexity measure. IEEE Transactions on Software Engineering 1976; SE-2(4):308–320.11. Halstead MH. Natural laws controlling algorithm structure? ACM SIGPLAN Notices 1972; 7(2):19–26.12. Ding H, Samadzadeh MH. Extraction of Java program fingerprints for software authorship identification. Journal of
Systems and Software 2004; 72(1):49–57.13. Frantzeskou G, Gritzalis S, MacDonell SG. Source code authorship analysis for supporting the cybercrime investiga-
tion process. In Proceedings of the First International Conference on E-business and Telecommunication Networks,Filipe J, Belo C, Vasiu L (eds), Institute for Systems and Technologies of Information, Control and Communication.Kluwer Academic Publishers: Setubal, 2004; 85–92.
14. Krsul I, Spafford EH. Authorship analysis: identifying the author of a program. Computers and Security 1997;16(3):233–257.
15. MacDonell SG, Gray AR, MacLennan G, Sallis PJ. Software forensics for discriminating between program authorsusing case-based reasoning, feed-forward neural networks and multiple discriminant analysis. In Proceedings of theSixth International Conference on Neural Information Processing, Gedeon T, Wong P, Halgamuge S, Kasabov N,Nauck D, Fukushima K (eds). IEEE Computer Society Press: Perth, Australia, 1999; 66–71.
16. Kothari J, Shevertalov M, Stehle E, Mancoridis S. A probabilistic approach to source code authorship identification.In Proceedings of the Fourth International Conference on Information Technology, Latifi S (ed.). IEEE ComputerSociety Press: Las Vegas, NV, 2007; 243–248.
17. Lange RC, Mancoridis S. Using code metric histograms and genetic algorithms to perform author identificationfor software forensics. In Proceedings of the Ninth Annual Conference on Genetic and Evolutionary Computation,Thierens D (ed.), ACM Special Interest Group on Genetic and Evolutionary Computation. ACM Press: London,2007; 2082–2089.
18. Elenbogen BS, Seliya N. Detecting outsourced student programming assignments. Journal of Computing Sciencesin Colleges 2008; 23(3):50–57.
19. Shevertalov M, Kothari J, Stehle E, Mancoridis S. On the use of discretised source code metrics for author identi-fication. In Proceedings of the First International Symposium on Search Based Software Engineering, Harman M,Di Penta M, Poulding S (eds). IEEE Computer Society Press: Windsor, 2009; 69–78.
20. Burrows S, Tahaghoghi SMM. Source code authorship attribution using n-grams. In Proceedings of the TwelfthAustralasian Document Computing Symposium, Spink A, Turpin A, Wu M (eds). RMIT University: Melbourne,2007; 32–39.
21. Frantzeskou G, Stamatatos E, Gritzalis S, Katsikas S. Source code author identification based on n-gram authorprofiles. In Artificial Intelligence Applications and Innovations, Maglogiannis IG, Karpouzis K, Bramer M (eds).Springer: New York City, NY, 2006; 508–515.
22. Frantzeskou G, Stamatatos E, Gritzalis S. Supporting the cybercrime investigation process: effective discriminationof source code authors based on byte-level information. In Proceedings of the Second International Conference onE-business and Telecommunication Networks, Filipe J, Vasiu L (eds), Institute for Systems and Technologies ofInformation, Control and Communication. INSTICC Press: Reading, 2005; 283–290.
23. Burrows S, Uitdenbogerd AL, Turpin A. Application of information retrieval techniques for source code authorshipattribution. In Proceedings of the Fourteenth International Conference on Database Systems for Advanced Applica-tions, Zhou X, Yokota H, Kotagiri R, Lin X (eds). Springer: Brisbane, 2009; 699–713.
24. Sparck-Jones K, Walker SG, Robertson SE. A probabilistic model of information retrieval: development andcomparative experiments part 1. Information Processing and Management 2000; 36(6):779–808.
25. Sparck-Jones K, Walker SG, Robertson SE. A probabilistic model of information retrieval: development andcomparative experiments part 2. Information Processing and Management 2000; 36(6):809–840.
26. Search Engine Group. About Zettair, RMIT University, October 2009. (Available from: http://www.seg.rmit.edu.au/zettair/about.html [Accessed 27 April 2010]).
27. Flex Project. flex: the fast lexical analyser, February 2008. (Available from: http://www.flex.sourceforge.net[Accessed 31 May 2010]).
28. Frantzeskou G, Stamatatos E, Gritzalis S, Katsikas S. Effective identification of source code authors using byte-levelinformation. In Proceedings of the Twenty-Eighth International Conference on Software Engineering, Osterweil LJ,Rombach D, Soffa ML (eds), ACM Special Interest Group on Software Engineering. ACM Press: Shanghai, China,2006; 893–896.
29. Frantzeskou G, Stamatatos E, Gritzalis S, Chaski CE, Howald BS. Identifying authorship by byte-level n-grams: thesource code author profile (SCAP) method. International Journal of Digital Evidence 2007; 6(1):1–18.
30. Frantzeskou G, MacDonell SG, Stamatatos E, Gritzalis S. Examining the significance of high-level programmingfeatures in source code author classification. Journal of Systems and Software 2008; 81(3):447–460.
31. Gray AR, Sallis PJ, MacDonell SG. IDENTIFIED (integrated dictionary-based extraction of non-language-dependent token information for forensic identification, examination, and discrimination): a dictionary-based systemfor extracting source code metrics for software forensics. In Proceedings of the Third Software Engineering:Education and Practice International Conference, Purvis M, Cranefield S, MacDonell SG (eds), IEEE ComputerSociety. Technical Communication Services: Dunedin, 1998; 252–259.
Copyright © 2012 John Wiley & Sons, Ltd. Softw. Pract. Exper. (2012)DOI: 10.1002/spe
S. BURROWS, A. L. UITDENBOGERD AND A. TURPIN
32. Sallis PJ, MacDonell SG, MacLennan G, Gray AR, Kilgour R. IDENTIFIED: software authorship analysis withcase-based reasoning. In Proceedings of the Fourth International Conference on Neural Information Processing andIntelligent Information Systems, Kasabov N (ed.), Asian Pacific Neural Network Assembly. IEEE Computer SocietyPress: Dunedin, 1997; 53–56.
33. Krsul I, Spafford EH. Authorship analysis: identifying the author of a program. Technical Report TR-96-052,Department of Computer Sciences, Purdue University, West Lafayette, Indiana, September 1996.
34. WinZip Computing. Winzip—the zip file utility for windows, May 2009. (Available from: http://www.winzip.com[Accessed 12 May 2009]).
35. Lachenbruch PA, Goldstein M. Discriminant analysis. Biometrics 1979; 35(1):69–85.36. Indyk P, Motwani R. Approximate nearest neighbours: towards removing the curse of dimensionality. In Proceedings
of the Thirtieth Annual ACM Symposium on the Theory of Computing, Vitter J (ed.), ACM Special Interest Group onAlgorithms and Computation Theory. ACM Press: Dallas, TX, 1998; 604–613.
37. Exhedra Solutions Inc. Planet Source Code, March 2010. (Available from: http://www.planet-source-code.com[Accessed 11 March 2010]).
38. Theobald M, Siddharth J, Paepcke A. SpotSigs: robust and efficient near duplicate detection in large web collections.In Proceedings of the Thirty-First Annual International ACM SIGIR Conference on Research and Development inInformation Retrieval, Seng Chua T, Kew Leong M, Myaeng SH, Oard DW, Sebastiani F (eds), ACM Special InterestGroup on Information Retrieval. ACM Press: Singapore City, 2008; 563–570.
39. Witten IH, Moffat A, Bell TC. Managing Gigabytes: Compressing and Indexing Documents and Images, 2nd edn.Morgan Kaufmann Publishers: San Francisco, CA, 1999.
40. Uitdenbogerd AL, Zobel J. Music ranking techniques evaluated. In Proceedings of the Twenty-Fifth AustralasianComputer Science Conference, Oudshoorn M, Pose R (eds). Australian Computer Society: Melbourne, 2002;275–283.
41. Witten IH, Frank E. Data Mining: Practical Machine Learning Tools and Techniques, 2nd edn. Morgan KaufmannPublishers: San Francisco, CA, 2005.
42. Colas F, Paclik P, Kok JN, Brazdil P. Does SVM really scale up to large bag of words feature spaces? In Proceedingsof the Seventh International Symposium on Intelligent Data Analysis, Berthold MR, Shawe-Taylor J, Lavrac N (eds).Springer: Ljubljana, 2007; 296–307.
43. Farrell J. Object Oriented Programming Using C++, 4th edn. Course Technology: Boston, MA, 2008.44. International Standardization Organization and International Electrotechnical Commission. Programming
languages — C++. International standard 14882, Information Technology Industry Council, New York City, NY,September 1998.
45. Kelly A, Pohl I. A Book on C, 4th edn. Addison Wesley Longman: Reading, MA, 1997.46. Liang YD. Introduction to Java Programming: Comprehensive Version, 6th edn. Pearson Education Inc.:
Upper Saddle River, New Jersey, 2006.47. Lindsey CS, Tolliver JS, Lindblad T. JavaTech: An Introduction to Scientific and Technical Computing with Java, 1st
edn. Cambridge University Press: New York City, NY, 2005.48. Oman PW, Cook CR. A taxonomy for programming style. In Proceedings of the Eighteenth ACM Annual
Conference on Cooperation, Sood A (ed.), Association for Computing Machinery. ACM Press: New York City,NY, 1990; 244–250.
49. Ranade J, Nash A. The Elements of C Programming Style, 1st edn. R. R. Donnelley & Sons: New York City, NY,1992.
50. Conte SD, Dunsmore HE, Shen VY. Software Engineering Metrics and Models, 1st edn. Benjamin/CummingsPublishing Inc.: Redwood City, CA, 1986.
51. Dunsmore HE, Gannon JD. Data referencing: an empirical investigation. Computing 1979; 12(12):50–59.
Copyright © 2012 John Wiley & Sons, Ltd. Softw. Pract. Exper. (2012)DOI: 10.1002/spe