comparing the impact of the september 11 terrorist attacks on
TRANSCRIPT

Comparing the Impact of the September 11
Terrorist Attacks on International Airline
Demand
Harumi Ito∗ Darin Lee†
February 25, 2004
Abstract
This paper compares the impact of the September 11th terrorist attacks and its after-effectson airline demand in the Australia, Canada, Europe, Japan and the United States. Using avariety of time-series data, we compare how changes in risk perception following the attacksimpacted domestic and international demand. Moreover, we decompose the terrorist attacks’effects into their transitory and ongoing components on airline demand.
JEL Classifications: R41, L16, L93
Keywords: Airline Demand, International Terrorism, September 11th, Risk Perception
∗Department of Economics, Box B, Brown University, Providence, Rhode Island, 02912. Phone: (650)-329-9743,Fax: (401)-863-1970. E-mail: Harumi [email protected].
†Corresponding author. LECG, Corp. 350 Massachusetts Avenue, Suite 300, Cambridge, MA 02139. E-mail:darin [email protected]. Tel: (617)-761-0108, Fax: (617)-621-8018.

1 Introduction
The terrorist attacks of September 11th had wide-ranging impacts on the global airline industry.1
Following the attacks, the U.S. airline industry–for example–experienced unprecedented declines2
in passenger traffic as well as record financial losses. In the wake of September 11th, numerous3
U.S. carriers declared bankruptcy, including two of the country’s largest, United Airlines and US4
Airways.1 The dramatic effects of September 11th, however, were not limited solely to the United5
States. Because the aviation industry by its very nature provides cross-linkages between countries in6
an evolving global economy, the terrorist attacks had far-reaching effects on the industry worldwide.7
Indeed, numerous airlines around the world declared bankruptcy following the attacks and the decline8
in demand for airline services that followed. For example, Ansett, Australia’s second largest carrier,9
declared bankruptcy in September 2001. Sabena, Belgium’s national carrier declared bankruptcy in10
November 2001, and Canada’s largest carrier, Air Canada, declared bankruptcy in April of 2003.11
While many of these carriers were struggling financially prior to September 11th, there is little doubt12
that their prospects worsened significantly following the attacks.13
This paper assesses the impact of the September 11th terrorist attacks on domestic and interna-14
tional airline demand in Australia, Canada, Europe, Japan and the United States. While the events15
of September 11th and its after-effects have been the focus of much industry and policy attention16
(Masse 2001, Air Transport Association 2003, Hatty and Hollmeier 2003), they have thus far received17
limited attention in the economics literature. Ito and Lee (2003a) measure the impact of the attacks18
on domestic U.S. demand, while Rupp, Holmes, and DeSimone (2003) study airline schedule recov-19
eries following U.S. airport closures since September 11th. Papers studying the international impact20
of September 11th include Gillen and Lall (2003), which examine stock price reactions of various21
international airlines following September 11th and Alderighi and Cento (2004), which examine the22
post-September 11th scheduling decision of European carriers on transatlantic flights.23
Although the impact of September 11th on airline demand in the U.S. has been unprecedented,24
it is not clear at the outset how September 11th and its after effects might be expected to impact25
airline demand within and between other countries. On the one hand, the chilling television footage26
of the attacks has been replayed time and again across the globe, and thus, it is reasonable to expect27
such media coverage to instill a higher level of fear among travellers both in U.S. and elsewhere.28
Likewise, numerous countries in addition to the U.S. have adopted more rigorous passenger screening29
and security measures following September 11th, which has made travelling by air less convenient30
are relatively more time consuming than before the attacks.2 Thus, it is reasonable to believe that31
September 11th may have resulted in an overall reduction in the demand for both domestic and32
international travel–not only in the U.S.–but around the world.33
2

On the other hand, many travellers outside of the U.S. may believe that since the attacks specif-1
ically targeted U.S. interests, the threat of future terrorist attacks using commercial aircraft in their2
own country has not significantly changed since September 11th. Likewise, a number of incidents3
subsequent to September 11th such as the attempted “shoe bombing” of an American Airlines flight4
from Paris to Miami in December of 2001, the missile attack on an Israeli charter flight in Kenya5
roughly a year later, and the recent cancellation of numerous international flights between Europe6
and the U.S. may have led to a perception by many (especially those outside the U.S.) that airline-7
based terrorism is primarily targeted at international flights. If this is the case, we might observe8
travellers in countries outside of the U.S. shifting their demand away from international trips (which9
are perceived to be “riskier”) to domestic trips, which are perceived to be less risky.10
Since risk is very subjective, the perception of risk is key to understanding airline demand11
responses to disastrous events. For example, previous research (Borenstein and Zimmerman 1988,12
Mitchell and Maloney 1989) has found that the equity value of an airline suffering a fatal crash13
exhibits abnormal negative returns following the crash, while other competing airlines do not.3 This14
would tend to suggest that passengers may respond to crashes by avoiding the carrier involved in15
the accident and substituting with other carriers, while keeping the demand for overall air travel16
unchanged. In those cases, the perception of increased risk applies to a specific carrier, but does17
not apply to air travel generally. In contrast, after controlling for the degree of market overlap18
between different carriers Bosch, Eckard, and Singal (1998) found evidence of a negative spillover19
effect. Of particular relevance to our analysis is the authors’ finding that in the case of TWA flight20
800 (where numerous initial eye-witness accounts of a surface-to-air missile suggested the possibility21
of a terrorist attack), the stock prices of most other U.S. carriers suffered large negative abnormal22
returns. The authors posit that “this suggests a new safety threat to all airlines beyond the control23
of present air security measures, that is, a large negative externality.”24
In this paper, we further explore the concept of negative externalities arising from catastrophic25
airline disasters. Unlike previous air disasters, September 11th resulted in a prolonged and ongoing26
increase in the risk perception that applies to the overall U.S. commercial aviation system, including27
both domestic and international flights. In this study, we investigate if a similarly heightened risk28
perception applies to the airline industry outside the U.S., and if so, we analyze how far it extends29
by examining both the domestic and international impacts across a number of countries. Thus,30
unlike the previous literature (Borenstein and Zimmerman 1988, Mitchell and Maloney 1989, Bosch,31
Eckard, and Singal 1998), the focus of our analysis compares cross-country industry effects rather32
than carrier-specific effects within a given country.33
Our basic methodology is to estimate a reduced form model of demand for domestic and inter-34
3

national air services using monthly time-series data from Australia, Canada, Europe, Japan and the1
United States. Our analytical framework closely follows Ito and Lee (2003a), which measured the2
impact of September 11th on U.S. domestic airline demand by estimating reduced form equations for3
the price and quantity of U.S. demand between 1986 and 2003. The authors found that the attacks4
resulted in an “ongoing” demand shift of roughly -7.4% in addition to a transitory demand shock of5
roughly -30%. The authors attributed the ongoing demand shift to factors such as an increased fear6
of flying, as well as the more stringent security procedures at U.S. airports that have made traveling7
by air less convenient than before (i.e., the “hassle factor”). Ito and Lee (2003a) demonstrate that8
such hassle factors are more prominent in shorter-haul flights, as the added time and inconvenience9
they impose on air travel (relative to the total elapsed travel time) makes alternative modes of10
transportation such as driving or taking the train more attractive. Thus, we suspect that the hassle11
factor is less of an issue on many international flights–which in general–tend to be much longer than12
the average domestic flight. Like Ito and Lee (2003a), we control for macroeconomic factors that13
are likely to influence airline demand (labor force and unemployment rates) as well as factors that14
are likely to influence supply such as low cost carrier penetration and fuel costs.15
In general, we find that the September 11th terrorist attacks had far-reaching effects on air16
travel demand beyond the United States. In all of the countries we investigated, we find large (i.e.,17
15%–37%) ongoing downward shifts in demand for international air travel that have yet to dissipate18
more than two years after the attacks. Interestingly, the drops in international demand we found in19
all countries–relative to what demand would have been absent September 11th–are larger than the20
magnitude we found in the United States. Moreover, we find these large, ongoing demand shocks21
for international travel even after controlling for changes in local macroeconomic conditions and22
other events such as the war with Iraq and the Severe Acute Respiratory Syndrome (i.e., “SARS”)23
epidemic.24
The post-September 11th experiences on domestic demand, on the other hand, differ significantly25
from one country to another, depending on how travellers associate the elevated sense of risk within26
their home country. European domestic demand, for example, showed a -17.5% ongoing downward27
shift while demand in countries such as Canada and Japan demonstrated no perceivable ongoing28
change following September 11th after we decomposed the change in demand into its transitory and29
ongoing components.4 We believe that this asymmetry between domestic and international demand30
is an important factor in evaluating the impact of global terrorist attacks on the airline industry31
outside of the targeted country.32
The remainder of this paper is organized as follows. Section 2 discusses our data and empirical33
model. Estimation results are summarized in Section 3. A summary of our findings and concluding34
4

remarks are provided in Section 4.1
2 The Data & The Model2
Data on airline demand for our analysis was drawn from a variety of sources including airline industry3
groups (i.e., the U.S. Air Transport Association (ATA) and the Association of European Airlines4
(AEA)) and government organizations such as StatsCan and Australia’s AVSTATs. Following Ito5
and Lee (2003a), our primary measure of airline demand is revenue passenger kilometers (RPKs).6
Since Australia’s Department of Transportation reports monthly RPKs for domestic travel only,7
our international demand proxy for Australia is total passengers (arriving and departing). For8
each of the individual countries in our analysis, data represents travel on carriers registered in9
the respective country. Since airline service in Europe is largely transborder by nature, we used10
aggregated data representing most of the large European carriers (i.e. members of the Association11
of European Airlines) in addition to the two largest European low cost carriers–neither of whom12
are AEA members–EasyJet and Ryanair. For each of our four countries plus Europe, we compiled13
data for international as well as domestic travel. For Europe, our domestic data represents both14
intra-country travel as well as inter-country travel solely within the European Union. A complete15
description of our data and its sources is summarized in Appendix A.16
Table 1 summarizes the dependent variable used for each of the countries/geographic areas in17
our analysis. Table 1 also shows each of the area’s 2000 world rank in terms of total (domestic plus18
international) RPKs and the percentage of that country’s or region’s international RPKs that are to19
and from the United States. As indicated below, our analysis encompasses five of the world’s seven20
largest RPK generating regions and eight of the ten largest RPK generating countries.521
[INSERT TABLE 1 HERE]22
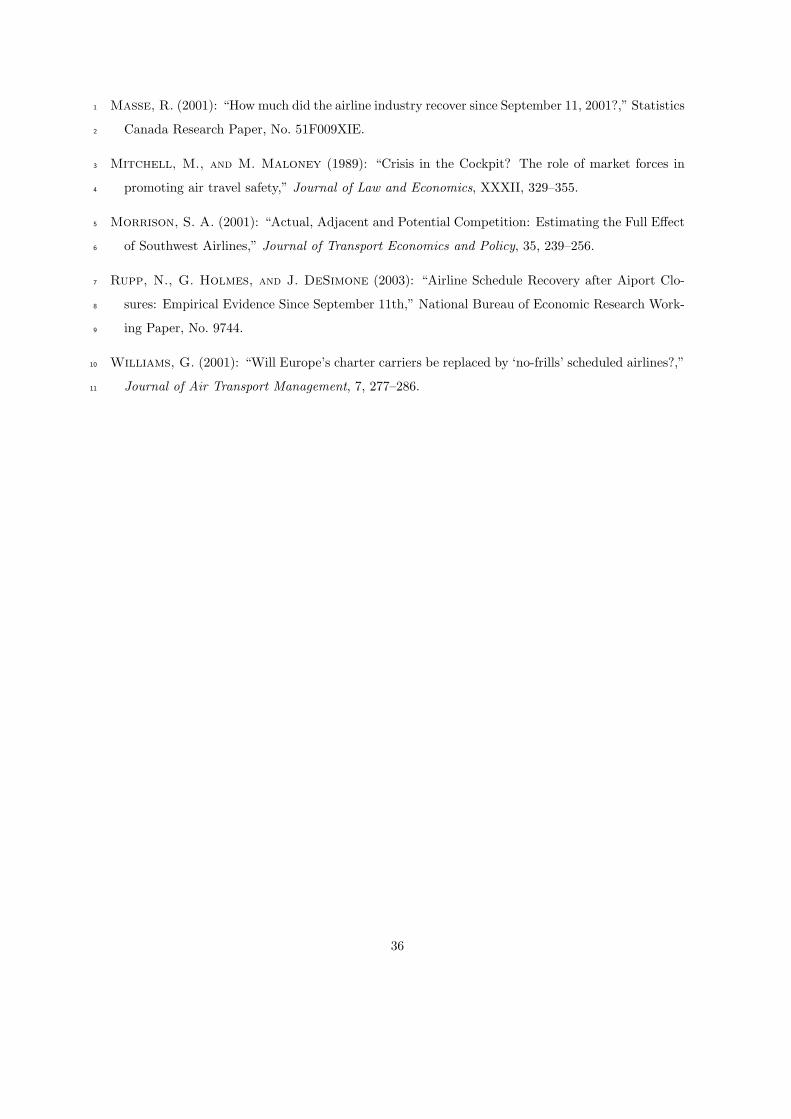
Figure 1 depicts monthly system-wide RPKs for Canada, Europe, Japan and the United States23
as well as each series’ 12-month moving average.6 Figure 1 demonstrates (a) the seasonal component24
of airline demand that is common in all countries (RPKs tend to peak in the summer and bottom25
during the winter), (b) the cyclical component of airline demand, and (c) that prior to September26
2001, airline demand had been steadily trending upwards in each region.27
[INSERT FIGURE 1 HERE]28
5

2.1 The Model1
Following Ito and Lee (2003a), our baseline demand model is a reduced form equation of the natural2
log of quantity (RPKs):3
Baseline Model
ln(RPKt) = β0 + X ′tβX + D′
tβD + εt (1)
Xt represents a vector of exogenous variables, including both demand and supply shifters. Dt is a4
vector of dummy variables, accounting for seasonality and various events that may have impacted5
the market for passenger airline service. Finally, εt is a mean-zero error term. We use OLS es-6
timation and account for the auto-correlated nature of the errors by using Newey-West standard7
error estimates. The descriptions of our independent variables, in additional to further details of our8
modelling approach, are detailed below (precise definitions of the independent variables are provided9
in Table 2).10
Seasonality: Airline demand is known to be highly seasonal, with the summer and holiday seasons11
being the strongest. Therefore, we include monthly dummy variables to control for such12
seasonality. In addition, we also control for leap years.13
Economic Trend and Cyclicality: Prior to September 2001, the demand for the world air travel14
had been growing rapidly (see Figure 1), fueled by steady economic growth in most countries15
and/or declining real airfares. The demand for air travel is also known to be highly sensitive to16
business cycles. To control for trend and cyclicality factors, we introduce two macroeconomic17
variables that we consider to be major demand-shifters and which Ito and Lee (2003a) found18
to be important predictors of domestic airline demand in the United States. Firstly, we use19
the unemployment rate as our business cycle indicator. Secondly, we use the country’s or20
geographic area’s labor force to control for the long-term growth of the overall economy. While21
we recognize that gross domestic product is the standard variable for measuring economic22
activity and its fluctuations, GDP statistics are only available on a quarterly basis, which is23
not sufficient for our analysis.724
Both the labor force variable and RPKs (domestic and international) are upwardly trended,25
raising the suspicion of a spurious regression. However, a Johansen test confirmed that these26
two variables are indeed co-integrated with a time trend in each of our data sets.8 Consequently,27
the estimated coefficients on the labor force variable are superconsistent, while estimates on28
other variables remain unbiased (Davidson and MacKinnon 1993). An alternative model such29
as one using first differences with an error correction term may be able to specify the dynamic30
6

relationship between the co-integrated variables more precisely. However, the September 11th1
attacks were a long-lag event, making the first difference estimation problematic. Moreover,2
pinning down the precise dynamics of the labor/RPK relationship is not our main research3
focus. Rather, we would like to control for the overall economic activity level while isolating4
the September 11th effect. As we will explain in Section 2.2, we will be measuring the impact5
of the September 11 attacks as a percentage change from the historical growth and trend curve6
that has not yet disappeared since the attacks.7
Supply-Side Variables: We also include two supply-side variables. Many researchers have docu-8
mented the impact of low cost carriers, both in the U.S. (i.e. Bennett and Craun 1993, Dresner9
and Windle 1999, Morrison 2001) as well as Australia (Forsyth 2003) and Europe (Williams10
2001). Thus, our first supply side variable is LCCshare, the share of domestic industry RPKs11
provided by low-cost carriers. We include LCCshare in each of our domestic regressions with12
the exception of Japan, where low cost carriers have yet to become a significant factor in the13
industry.14
Our second supply-side variable is the cost per gallon of jet fuel. Fuel accounts for approxi-15
mately 10-15% of airline operating costs, thus, its exogenous fluctuation is likely to influence16
airline pricing. Since monthly jet fuel price data by country was not readily available, we17
proxied for each country’s fuel price by using the price paid by U.S. carriers at international18
airports (deflated by the U.S. PPI) and then converted it into local currencies in Australia,19
Canada, Japan and Europe.920
Special Events: In addition to the 9/11 attacks, we also control for a few other extraordinary21
events that may have impacted the demand for air travel industry-wide. These include the22
1991 Gulf War (where the event is within our data span), the 2003 Iraq War, and the SARS23
epidemic. Controlling for the last two events is especially important because they resulted24
in visible downward pressure on demand during the post-September 2001 period. Failing to25
control for these events, therefore, would result in over-estimating the impact of September 11.26
We caution the reader that since the 2003 Iraq War and SARS epidemic overlap closely, the27
model may not be able to distinguish between these two effects. However we can still control28
for the joint effect, thereby effectively isolating them from the impact of the September 11th29
attacks.30
In addition to the common events listed above, there are some country specific events, such31
as deregulation, major bankruptcies/liquidations and strikes that require some modelling ad-32
justments. We explain these country-specific events below:33
7

• United States: One of the most significant bankruptcies in U.S. aviation history was1
that of Pan Am in 1991. Since Pan Am generated the overwhelming majority (70%-80%)2
of its RPKs internationally and accounted for a very large (i.e. 25% in 1988) proportion of3
all U.S. carrier international traffic, we suspect its bankruptcy and subsequent liquidation4
generated a substantial international supply shift.10 In order to account for the structural5
shift from this change, we allow for a break in the linear trend (both intercept and slope)6
in January 1991 (the bankruptcy was declared on January 8, 1991).7
• Australia: Australia has several events that required modelling attention. Firstly, the8
1989 Australian pilots’ strike that began in August 1989 brought the domestic air system9
to a virtual standstill in September of 1989. Although many pilots slowly returned back to10
work, the complete dispute resolution took nearly a year and half. As with the September11
11 case, we account for the transitory, but sharp drop of RPKs in September and the12
several subsequent months by including the inverse square of the months from August13
1989, starting at 1 in September 1989. Finally, we include a dummy variable that takes14
the value 1 for each of the 18 months of the strike and 0 otherwise.15
Secondly, we control for the deregulation of the Australian airline industry that took16
place in October 1990, which resulted in a visible spurt in the domestic airline market.17
In particular, we allow for a break in the growth trend (both intercept and slope of the18
labor force variable) at October 1990.19
Finally, Ansett, the second largest carrier with a market share of roughly 40%, declared20
bankruptcy on September 14, 2001 and was liquidated soon thereafter. We expect that21
the bankruptcy and liquidation of a carrier of this size is likely to generate a supply22
shift in both domestic and international airline markets. Since the timing of Ansett’s23
bankruptcy almost exactly coincides with the terrorist attacks, it is virtually impossible24
to distinguish between these two effects. Thus whatever shift we observe on and after25
September 2001 is likely to be a combination of these two effects.26
• Canada: For our Canada–international regression, we account for the Open-Sky agree-27
ments with the U.S. since the U.S. is Canada’s largest trading partner by far, and thus,28
we expect this agreement to impact Canada’s international travel demand. We include a29
dummy variable that takes the value 0 before February 1995, and 1 thereafter, to control30
for this effect.1131
• Europe: Although there have been a number of bankruptcies of European carriers dur-32
ing the period of our data such as Sabena and Swissair, none of them accounted for33
a significant fraction of total European capacity, and thus, did not require any special34
8

treatment. Likewise, while there have been a number of notable deregulatory events or1
market liberalization trends involving different European countries or carriers (i.e., the2
formation of alliances, antitrust immunity, Open-Sky agreements, etc.), we did not find3
that any particular event had a measurable impact on overall European demand.4
• Japan: Japanese air travel (both domestic and international) enjoyed steady growth5
throughout the sample period. Although Japanese deregulatory trends began in 19866
and continued throughout the period, we found no evidence that any specific deregulatory7
events generated a break or spurt in Japanese demand. Thus, we chose not to include8
any specific events in our Japanese data sets.9
Readers familiar with the literature will note that we excluded the number of airline fatalities.10
Ito and Lee (2003b) found that the number of airline fatalities had no effect on overall U.S. domestic11
demand, and we also confirmed that the same held true for U.S. international demand.12
Variable definitions and summary statistics of our independent variables are summarized in13
Tables 2–4.14
[INSERT TABLES 2–4 HERE]15
2.2 Modelling The Impact of September 11th16
Following Ito and Lee (2003a) we construct a simple non-linear model to measure the impact of17
September 11th while controlling for the effects of concurrent events such as the recent Iraq War and18
SARS epidemic. Our model needs to accommodate for two potential and different types of impacts19
from September 11th: (a) an ongoing downward shift in the demand for air travel resulting from the20
increased fear or apprehension of flying and greater inconvenience of traveling by air due to more21
rigorous security screening, and (b) the initial panic driven fear of flying directly following September22
11th. The latter “shock” component also captures the impact of widespread flight cancellations in23
the days directly following the attacks (for example, the U.S. FAA prohibited all commercial air24
service for roughly two and a half days following the attacks). We allow for the possibility of an25
ongoing downward shift in demand by including an dummy variable, Dpost911, that takes the value26
0 for all observations before September 2001 and 1 thereafter. Thus, the estimated coefficient on27
Dpost911 will measure the relative magnitude in the downward shift in demand following September28
2001.29
To account for the possibility of a sharp decline in demand following September 11th that may30
have been transitory in nature, we also incorporate a shock component that attenuates over time. In31
particular, our model includes the inverse of (T911)2 as an additional regressor, where T911 is defined32
9

as the number of months since September 2001 plus one (for example, T911 = 2 in October 2001, 31
in November 2001, and so forth). The implicit assumption is that the transitory shock will decay at2
a rate equal to the squared reciprocal of time.3
βshiftDpost911 + β 1t
1(T911)2
(2)
We append this component (2) to our reduced form demand equation in the baseline model4
(1). The key parameters of interest are the estimates for βshift, which represents the portion of5
the demand decline that has not yet recovered since September 2001, and β 1t, the transitory shock6
component from the terrorist attacks. We refer to the former effect as the “ongoing” shift while we7
call the latter effect the “immediate (downward) spike.” In this setup, our measurement benchmark8
of the September 11 attacks is what the RPKs would have grown to, had it not been for the terrorist9
attacks on September 11, 2001.10
Naturally, it remains an open question as to whether any observed “ongoing” shift will be a11
“permanent” downward shift in demand, and only time will tell if this is indeed the case. Thus, to12
be precise, our estimates should be interpreted as the downward shift in demand that has not yet13
dissipated as of the end of 2003 (the precise month depends on our data, as described in Table 1).14
For example, it is possible that this “ongoing” downshift is a part of a longer recovery trajectory.15
However, any downward shift that has lasted more than two years in the airline industry constitutes16
something far beyond what would traditionally be viewed as a “transitory” shock.17
3 Estimation Results18
We estimate RPK (quantity) equations using the OLS method. Auto-correlation robust standard19
errors are calculated using the Newey-West standard error formula. Our main results are shown in20
Tables 5–9.21
[INSERT TABLES 5–9 HERE]22
3.1 United States23
Before we discuss the results, it is useful to review the results in Ito and Lee (2003a). In that paper,24
the authors investigated the magnitude of ongoing downshift in U.S. domestic demand resulting25
from September 11th. Using the same baseline model, they estimated that September 11th resulted26
in an ongoing demand shift of -7.4% after controlling for the U.S. economic downturn, Iraq War, and27
SARS epidemic (among other factors). They also found that the average domestic yield (price paid28
10

per RPK or RPM) has declined by 10.0%, confirming an ongoing demand (rather than supply) shift1
from the September 11th attacks. We use these estimates as the basis of reference for comparing2
the effects of the terrorist attacks on domestic and international airline demand in other countries.3
As discussed earlier, there is no readily available, comparable price data for airline service outside4
of the U.S., thus, we proceed with our analysis by estimating the reduced form quantity (RPK)5
equation only.12 Although estimating a quantity reduced from equation, by itself, cannot confirm6
whether the reduction in quantity has resulted from a downshift in demand, the growth of low-7
cost carriers and/or deregulatory trends that have become a widespread international phenomena8
have generally resulted in an outward (rather than inward) shift in supply during the 1990s and9
thereafter.1310
Not surprisingly, the U.S. experienced a significant drop in international demand following11
September 11th. The immediate downward spike was -26.5%, some of which resulted from the12
temporary–but complete–shutdown of commercial air traffic system in the days following the at-13
tacks.14 However, according to our model, this effect dissipated quickly down to roughly 1% after14
five months. Even after controlling for the immediate downward spike, however, we still find that15
the attacks caused an ongoing downward shift of -19.6% which has yet to subside.16
One hypothesis that might explain some of the reduction in U.S. carrier demand for international17
travel is that some passengers may have chosen to shift their travel to non-U.S. carriers, rather18
than U.S. carriers for their international flights. To investigate this conjecture, we examined data19
from the U.S. Department of Transportation’s T100 International segment database, which records20
information for every non-stop market between the U.S. and a foreign destination. For each of21
the countries/geographic areas in our study, we computed the share of passengers carried by U.S.22
carriers. In general, we found that U.S. carrier shares did not decline following September 11th.23
For example, between the U.S. and Europe, U.S. carriers had a 39.4% share of passengers in the24
12 month period ending August 2001. This share actually rose slightly to 41.5% in the 12-month25
period ending August 2002. We also found similar results for U.S.-Canada and U.S.-Asia.1526
The trend projected by the labor force growth is a powerful predictor of U.S. international27
demand. The effect of a higher unemployment rate is negative on international demand, but the28
effect is not statistically significant. This is consistent with the fact that passengers on international29
flights are a mixture of the home country’s residents as well as passengers visiting from abroad, which30
in turn may result in international demand being less sensitive to business cycles than domestic31
demand.16 As we will see, insensitivity to business cycles as measured by the unemployment rate is32
a common finding in many of the other countries in our study.33
As expected, RPK growth experienced a break at 1991 after Pan Am declared bankruptcy, and34
11

this structural break was confirmed by a Chow test. Given the large international share (i.e., 25%1
in 1988) that Pan Am possessed among the U.S. carriers, such a change is not surprising.2
Also as expected, the model has difficulty distinguishing between the SARS epidemic and the3
2003 Iraq War because of the high degree of overlap between the two events (our Iraq War dummy4
has only one month that is not covered by our SARS dummy). Consequently, the -13.0% down shift5
shown in the SARS coefficient likely reflects the combination of these two events. We also find a6
similar result in each of the other countries in our sample.7
3.2 Australia8
Although Australia is geographically remote from the U.S., it has been a strong military and political9
ally to the U.S. during its military operations in Afghanistan and Iraq. In contrast to the U.S.,10
Australia did not experience the same immediate downward spike in domestic demand that the U.S.11
experienced, but it has faced a -27% ongoing downshift since September 2001. The interpretation12
of this downshift, however, is muddled by the bankruptcy and liquidation of Ansett that also took13
place in September 2001. Ansett, a subsidiary of Air New Zealand, was the second largest carrier14
in Australia prior to its bankruptcy and had a national share of approximately 35-40%.17 Although15
competitors such as Qantas and especially Virgin Blue quickly moved to fill the some of the vacated16
market share, a liquidation of the size of Ansett’s has clearly resulted in some disruption in the17
Australian market, and consequently, is responsible for part of the downshift. At this point, however,18
there is no way of separating the two effects. Thus, the -27% ongoing demand shift should be19
interpreted as a combination of both the September 11th and Ansett bankruptcy effects.20
As for international demand in Australia (recall that our demand proxy in this case is passengers),21
we observed a -11.6% ongoing downshift, while we see almost no immediate downward spike. As22
described above, part of this downshift almost certainly reflects the bankruptcy and liquidation of23
Ansett. In addition to the 9/11 impact, we also find that international demand fell by -6% after the24
Bali bombing that was targeted at Australian tourists in October 2002. Because of its proximity to25
Asia, international demand fell by -11% during the SARS epidemic. As was the case with the U.S.,26
the model could not distinguish between the effect of the second Iraq War and the SARS epidemic.27
Finally, there is evidence to suggest that overall prices for domestic air service in Australia28
have fallen since September 11th. For example, the Australian Bureau of Transport and Regional29
Economics’ index of real discounted leisure fares fell from 85 in September 2001 to 82 in September30
of 2002 and fell again to 74 in September of 2003. There is little doubt that this price decline is a31
reflection of the rapid growth of low cost carrier Virgin Blue. This is also partial evidence that the32
drop in RPKs is demand-driven, rather supply-driven. The index for full fare economy and business33
12

class tickets remained relatively flat over the same period.181
3.3 Canada2
Due to the proximity of Canada to the U.S., Canadian demand suffered a significant setback from the3
September 11th attacks. Domestic demand shows an immediate drop of -27%, though interestingly,4
it had no statistically significant ongoing down shift. In contrast, international demand suffered an5
ongoing shift of -15%, while the immediate spike was relatively moderate, at -8%. One possible6
explanation for the lack of an ongoing domestic demand shift is that some Canadian travelers may7
have substituted international trips with domestic trips. Thus, we see an interesting asymmetry8
between the response of international and domestic demand to the terrorist attacks. If these figures9
represents the relative perception of risk, they imply that Canadians see relatively greater security10
risk in international flights versus domestic flights (recall from Table 1 that roughly one quarter of11
Canadian international RPKs are to and from the U.S.).12
While we do not have monthly price data for Canada, there is much evidence to support the13
hypothesis that reductions in quantity were the result of a negative demand, rather than supply,14
shock. For example, as noted in its year-end financial summaries, Air Canada’s system-wide yields15
fell from 19.5 cents in 2000 to 17.0 cents in 2001, and remaind at 17.0 cents in 2002. Moreover,16
low cost carriers such as WestJet have been rapidly gaining share, which in turn would result in a17
decline in the industry’s overall yield in 2002.1918
Canada’s economic growth accelerated in the late 1990s and thereafter. Since the growth of air19
traffic preceded such economic growth, the labor force variable was not statistically significant in20
our domestic model. However, international demand grew rapidly until September 2001, which is21
partly attributable to the increased cross-border commerce resulting from the North American Free22
Trade Agreement and the “Open Skies” agreement with the U.S. that took effect in 1995.20 Because23
Toronto was one an area hit particularly hard by the SARS epidemic, we see both a domestic impact24
of approximately -7% and the international impact of -23%. And while it is arguable that the bulk25
of these shocks were indeed attributable to SARS, we emphasize once again that the effects combine26
both SARS and Iraq War effects.27
3.4 Europe28
Like the United States, much of Europe has been preoccupied with the threat of future terrorist29
attacks since September 11th. This is partly due to the fact that soon after the attacks, authorities30
learned that many of the September 11th hijackers were operating from an Al-Qaeda cell in Hamburg,31
Germany. Likewise, the attempted shoe-bombing incident of an American Airlines flight from Paris32
13

to Miami in December 2001 raised questions about the quality of security screening at European1
airports. Concerns of terrorist activities in Europe–in particular in the U.K.–increased further after2
Great Britain became the United States’ closest political and military ally during the wars with3
Afghanistan and Iraq. Indeed, one international risk consultancy identified London as one of the4
most likely targets for a future terrorist attack.215
We present four separate regressions for Europe based on different variants of our dependent6
variable. Due to the small geographic size of many European countries and the widespread use of7
trains, intra-country flights represent only a small fraction of total air travel within Europe. Thus,8
our first regression estimates “domestic” demand, where we include both intra-country flights as9
well as inter-country flights solely within the European Union. Our “international” regression for10
Europe, on the other hand, captures flights between the EU and countries outside of the EU and11
is comparable to the international demand regressions estimated for our other countries. The third12
and fourth regressions are finer subsets of the international regression: one includes all traffic across13
the North Atlantic (i.e. to the U.S. and Canada), while the other includes all Asian-bound traffic.14
Looking first at the domestic regression, we see almost no immediate downward spike following15
September 2001. However, domestic demand shows an ongoing downshift of approximately -17.4%.16
Interestingly, this downshift is more than twice the size of the ongoing downshift in the U.S. (-7.4%).17
This may reflect an increasing perception by some that Europe may be the next potential target18
for a large-scale terrorist attack. Alternatively, it may also reflect the fact that Europeans typically19
have far better ground transportation substitutes for air travel, in particular, trains.20
Turning our attention to international demand, we find even larger impacts arising from the21
September 11 attacks. For example, the ongoing downshift in total international demand was -33%.22
Moreover, the fact that we found no immediate downward spike suggest that a significant fraction23
of international passengers stopped flying directly after the attacks and have yet to resume their24
former travel patters. When we restrict our analysis to North Atlantic flights (trips to/from either25
the U.S. or Canada), the magnitude of the ongoing downshift was -31%; for flights to/from Asia, the26
ongoing downshift was -23%.22 It is important to note that the estimated magnitude of the ongoing27
downshift in demand for international demand exceeds the actual difference between the pre-9/1128
peak in traffic and today’s level of demand. This is because international demand in Europe had29
been trending upwards throughout most of the period of our analysis. Consequently, our estimated30
downshift is relative to what the model predicts demand would have been, assuming the same trend31
in growth had continued.32
Neither SARS nor the 2003 Iraq War had a significant impact on domestic European demand.33
In contrast, SARS had a large impact (-12.5%) on overall international demand and as expected,34
14

the impact is most acute in the Asian segment of the market (-26.5%). The North Atlantic segment1
of demand shows a -8% decline from SARS, but we, again, suspect that this reflects the combined2
effect of SARS and Iraq War.3
Since unemployment statistics are composites from all the European Union countries, it did not4
turn out to be a good predictor of air travel demand.5
Overall, we find that European travelers reacted very strongly to the increased safety and security6
concerns posed by the terrorist attacks, sometimes even more than their American counterparts.7
We attribute this difference partly to the widespread availability of alternative travel methods, the8
elevated perception of risk that was particularly acute in parts of Europe (i.e., the U.K.) and a9
higher risk sensitivity of European travelers.10
3.5 Japan11
The Japanese economy has been enduring the effects of a prolonged recession since 1991. Thanks12
to its gradual deregulation, however, the Japanese airline industry enjoyed steady growth until13
September 2001 (see Figure 1). Because of this asymmetry between a relatively stagnant economy14
and fairly vibrant growth in Japanese airline demand, we needed to make an adjustment to our15
baseline model. In particular, when we estimate our baseline model using the labor force variable,16
the steadily rising unemployment rate inadvertently ends up picking up the upward trend in overall17
airline demand. In order to account for this anomaly, we also include a simple linear trend in both the18
domestic and international regressions for Japan, which reverses the coefficient on the unemployment19
variable to its expected (negative) sign.20
In terms of risk perception, our results from Japan are somewhat similar to those observed21
in Canada, which suggested a substitution away from international travel into domestic travel.22
Japanese domestic demand shows little change before and after September 2001. To the extent there23
was an effect from 9/11, we see a positive upward spike of 6% immediately following September 2001.24
There is also a -2.8% ongoing downshift, but neither of the two effects are statistically significant.25
In contrast, international demand shows a dramatic drop after September 11th. Although the26
immediate spike following 9/11 was relatively modest at -8.9%, international demand shows an27
ongoing shift of -36.5%, the largest we observed in any of the countries in our analysis. It is natural28
to suspect that the SARS epidemic and War with Iraq has contributed to a part of this large, ongoing29
downshift. However, the estimation results indicate that the SARS epidemic resulted in a further30
shock of -37%, in addition to the -36.5% ongoing downward impact from 9/11.31
This downshift in international demand is much larger than those observed in other counties and32
comes as somewhat of a surprise. Unlike Europe, Japan has not traditionally been a target of inter-33
15

national terrorism. In light of the magnitude of the estimated downshift, we further investigated if1
these estimates made sense based on the actual RPK figures for Japan. From 1989 to 2001, Japanese2
international RPKs approximately doubled, growing at an average annual rate of 5.9%. Applying3
this growth rate to Japan’s international RPKs just prior to September 2001 yields projected annual4
RPKs for 2003 of approximately 110 billion kilometers. Actual observed RPKs for the year ending5
November 2003 were approximately 73 billion kilometers, or roughly a -33.6% less than the growth6
projection benchmark. Thus, although the estimated impact of 9/11 on international demand in7
Japan is extremely large, we believe that it is reasonable.8
To test the sensitivity of our results to the inclusion of the linear trend, we also stopped the9
linear trend at August 2001 and proceeded with the same estimation. The model still estimates an10
ongoing demand shift of -31.3%. Thus, the linear projection accounts for only a small fraction of the11
ongoing shift. Similarly, we also compared the actual change in RPK figures during the height of12
the SARS epidemic with our model’s results by comparing monthly international RPKs from April,13
May, and June of 2003 with the same months from the previous year. We found that RPKs dropped14
by -35.7%, -42.2% and -34.7% in April, May, and June respectively and therefore concluded that the15
estimated magnitude of the SARS coefficient provides an accurate description of its actual effect on16
international demand.17
Given the magnitude of the downshift in international demand, it is plausible that the upward18
spike in domestic demand immediately following September 2001 represents a substitution away19
from international travel to domestic travel. This result suggests that Japanese travelers associated20
the terror risk almost entirely with foreign air travel, but felt relatively safe taking flights within21
Japan. The estimates also reveal the high sensitivity of Japanese travelers to various risk factors,22
whether they be from potential terrorist attacks or new health risks such as those presented by23
SARS.24
3.6 Summary of Results and Conclusions25
Using passenger traffic data from Australia, Canada, Europe, Japan and the United States, this26
paper measures and compares the impact of the September 11 terrorist attacks on the demand for27
air travel. We found that all countries and regions in our analysis suffered significant declines in the28
demand for international air travel as a result of the attacks. After controlling for macroeconomic29
factors, the initial downward spike immediately following the attacks and the other events such as30
Iraq War and SARS epidemic, we find that the ongoing downward shift in demand for international31
travel ranged between -15% and -38%. Even though more than two years have passed since the32
attacks, these ongoing shifts have not yet dissipated. The impact on international demand appears33
16

to have been the most significant in Europe and Japan, where passenger demand (relative to what1
our model suggests it would have been absent the attacks) fell by more than in the United States.2
This suggests that there are indeed far reaching negative externalities from airline-based terrorism3
beyond the targeted country, especially when the attacks undermine the overall perception of risk4
associated with flying.5
The impact on the demand for domestic air travel, however, varied widely across countries. On6
the one hand, countries such as Japan and Canada showed no discernible long-term shift in domestic7
demand following September 2001. On the other hand, we found that domestic demand in other8
areas, such as Europe, declined significantly following September 2001. We attribute this decline to9
the widespread availability of substitute modes of transportation in Europe (in particular rail) and10
somewhat different perceptions of risk between travelers in different countries. Thus, while travelers11
in Canada and Japan appear to view the attacks as increasing the risk of international air travel12
only, their European counterparts may believe the increase risk of air travel applies more generically.13
While our analysis provides strong evidence of a negative shift in airline demand following14
September 11th, we should emphasize that our analysis has some limitations. First, at the time15
of our analysis, only 26–27 monthly observations since September 2001 were available (depending on16
the country) which limits the degrees of freedom for our analysis in the post-September 11 period.17
While the global airline industry has typically recovered from other negative shocks considerably18
faster than 27 months, a catastrophic event such as September 11th could obviously require a longer19
recovery period, and this may in fact be what we are observing. Consequently, it will be useful to20
repeat the current analysis as additional observations become available.21
Second, it is possible that the global airline industry and security authorities adapt to the post-22
September 11th environment in some unexpected way. For example, new technological innovations23
in security screening might eliminate some of the waiting time at airports, thus reducing the hassle24
factor and making air travel more convenient. Likewise, new forms of passenger screening (i.e., facial25
recognition, digitalized passports and improved immigration databases) may become widespread,26
improving passengers’ sense of security.27
Finally, we emphasize that our analysis does not attempt to account for any macroeconomic28
effects caused by the terrorist attacks. Because it is probable that September 11th directly or29
indirectly led to lower levels of macroeconomic activity–and in turn–increased unemployment, our30
results may understate the impact of September 11th on airline demand. Nevertheless, we believe31
that our analysis is useful in that it provides an approach to assist policymakers and industry leaders32
evaluating the impact of major external shocks–such as the terrorist attacks of September 11th–on33
the global airline industry.34
17

Overall, we find that the impact of catastrophic events such the September 11th terrorist attacks1
on the global air demand is quite subtle and fairly complex. Travelers’ responses depend critically on2
their perceptions of risk and these differences in risk perceptions can generate significant differences3
in demand patterns across countries, which researchers need to be aware of when analyzing or4
predicting the impact of such events. The extremely large magnitudes of the negative ongoing shifts5
that the global airline industry has faced has already necessitated an industry wide restructuring,6
with numerous carriers declaring bankruptcy and the remaining “full service” carriers attempting to7
dramatically reduce their cost structures in the face of a new demand environment. And while many8
airlines were already facing a new and emerging competitive threat from lower cost competitors,9
September 11th has accelerated the need for both policy makers and industry leaders to make swift10
adjustments in order to accommodate such structural shifts in the industry.11
Acknowledgements: The authors thank Dan Kasper and Daniel Klein for helpful suggestions and12
Phoenix Kalen for excellent and invaluable research assistance. The views expressed in this paper13
are those of the authors and do not necessarily reflect those of LECG, Corp. All errors are ours14
alone.15
18

A Summary of Dataset Construction1
In this appendix, we document the construction of our dataset.2
A.1 Australia3
Domestic RPK and international passenger data is from Australia’s Bureau of Transport and Re-4
gional Economics, Aviation Statistics & Analysis Division (AVSTATS). International passenger data5
represent enplaned passengers on Australian flag carriers. The LCCshare variable for Australia rep-6
resents the proportion of domestic RPKs provided by the country’s largest low cost carrier, Virgin7
Blue.23 Virgin Blue monthly RPK data was compiled from its press releases and its initial public8
offering prospectus, available at http://www.virginblue.com/.9
Data for the Australian labor force and unemployment rate was from Australia’s Bureau of10
Statistics (http://www.abs.gov.au/).11
A.2 Canada12
Domestic and international RPK data for the period January 1987–December 2003 was provided13
by StatsCan and represents scheduled mainline operations by Air Canada (including Tango and14
Zip), Canadian Airlines International (and its component carriers prior to their merger to create15
Canadian), and Wardair.24 To the domestic data, we added monthly data from WestJet’s press16
releases for the period July 1998 through December 2003. Although WestJet commenced service17
in March of 1996, monthly data is not available for the period March 1996–June 1998 as WestJet18
was privately held during this time period. However, aggregated RPM data for the periods March19
1996–December 1996 (219.4 million), 1997 (406.4 million) and 1998 (639.2 million) are available in20
WestJet’s public offering prospectus. Using this data, we imputed monthly data for WestJet for the21
period March 1996–December 1998 by first regressing the monthly data from July 1998–December22
2003 on monthly dummy variables, a time trend, and 9/11 effects. We found that the overwhelming23
effect on WestJet’s RPMs to date has been the time trend, which demonstrates that WestJet has24
been growing its RPMs at a rate of roughly 3.54% per month since inception. Using the estimated25
coefficients from our regression and the aggregated data from WestJet’s prospectus, we then imputed26
monthly RPM figures for WestJet for this period March 1996–June 1998. After transforming these27
figures to RPKs (1 mile equals 1.609 kilometers), we added them to the domestic portion of the28
industry data from StatsCan (to date, WestJet operates no international service).29
Data for the Canadian labor force and unemployment rate is from StatsCan’s Table 282-000130
and represents total employment estimates for all persons aged 15 years and over.31
19

A.3 Europe1
Aggregated RPK data for Europe is from the Association of European Airlines’ (AEA) historical2
database of passenger traffic and includes data for the following carriers: Air France, Finnair, Al-3
italia, British Airways, bmi, Cyprus Airways, Aer Lingus, Icelandair, Iberia, Meridiana, Spanair,4
Adria Airways, Yugoslav Airlines, KLM, Air Malta, Luxair, Lufthansa, LOT Polish Airlines, Swiss5
International Airlines, Balkan, Malev, Olympic Airways, CSA, Austrian Airlines, Croatia Airlines,6
Tarom, SAS, SN Brussels Airlines, Sabena, Swissair, Turkish Airlines, and TAP Air Portugal.25 For7
this set of carriers, we considered two primary subsets of the AEA data:8
Domestic and European transborder: All intra-country flights in addition to cross border routes9
originating and terminating within the Europe (including Turkey and Russia up to 55◦ East),10
Azores, Canary Islands, Madeira and Cyprus. For this series, we add data for Ryanair and11
EasyJet from their press releases and historical financial reports.2612
International: All scheduled service excluding European domestic and European transborder ser-13
vice.14
Unemployment and labor force data for Europe was collected from the Central European Bank,15
which represents aggregated data for Austria, Belgium, Finland, France, Greece, Germany, Ireland,16
Italy, Luxembourg, the Netherlands, Portugal and Spain. We combined this data from the UK’s17
Office of National Statistics, weighting the unemployment rate by the labor force.18
A.4 Japan19
Domestic and International RPK data for the period 1986–2003 are from the AnnualMonthly Sta-20
tistical Report of Air Transport issued by the Ministry of Land, Infrastructure and Transport.21
Domestic RPKs include all scheduled service on major and local routes. International RPKs cover22
three international carriers: Japan Airlines, All Nippon Airways, and Japanese Air System.23
Data for Japanese employment was from the International Labor Organization’s Laborsta database,24
Bulletin B1 (total employment) and is available at http://laborsta.ilo.org/. This data was sup-25
plemented for the most recent months with monthly labor force survey data from the Japan Statistics26
Bureau’s web site, http://www.stat.go.jp/.27
A.5 United States28
RPM data for was from January 1980 through December 2003 was from the Air Transport Associa-29
tion’s historical database, and includes the following carriers: Air Florida, Air New England, AirCal,30
20

Alaska, Aloha, America West, American, ATA, Best, Braniff, Capitol, Continental, Delta, Eastern,1
Hawaiian, Hughes Airwest, Jet America, JetBlue, Midwest, New York Air, Northeastern, North-2
west, Ozark, Pacific Southwest, Pan Am, Piedmont, Reeve Aleutian, Republic, Southwest, Texas3
International, Trans World, United, US Airways, and Western.27 To this list of ATA members,4
we added data for the following carriers from the Department of Transportation’s T100 Database:5
ValuJet, Midway, Frontier, AirTran, Spirit, Reno, Morris Air, Sun Country and Vanguard. Data is6
then transformed from RPMs to RPKs using the conversion factor of 1.609.7
Monthly labor force and unemployment rate data comes from the Bureau of Labor Statistics8
http://www.bls.gov.9
21

Notes1
21Other U.S. carriers declining bankruptcy in the year following September 11th include Hawaiian,3
Sun Country, and Vanguard.4
2See, for example, “Air travel still feels effects of Sept. 11: ‘Mindless security techniques’ put5
passengers off flying,” Calgary Herald, September 11, 2002.6
3Borenstein and Zimmerman (1988) also estimate the impact of crashes on carriers’ own demand.7
4The reader should note our “domestic” data for Europe includes both intra-country travel as8
well as inter-country travel solely within the European Union.9
5According to the 2002 Aviation & Aerospace Almanac, the ten largest RPK generating countries10
were: (1) United States, (2) Japan, (3) United Kingdom, (4) Germany, (5) France, (6) China, (7)11
Australia, (8) The Netherlands, (9) Singapore, and (10) Canada.12
6We exclude Australia from Figure 1 since our units of measure for domestic and international13
demand are different.14
7Another natural candidate is a measure of income, but this variable is not reported on a monthly15
basis in all countries. Moreover, Ito and Lee (2003a) experimented with including monthly earnings16
and found that it did not provide any additional information beyond the labor force and unemploy-17
ment rate.18
8We used Johansen’s test in the EasyReg software package written by Bierens (2003).19
9For Europe, we converted the price into local currency using the Deutsche Mark prior to 199320
and the Euro thereafter. Data for historical exchange rates was from the Pacific Exchange Rate21
Service at the University of British Columbia, http://fx.sauder.ubc.ca/.22
10Although some of Pan Am’s routes were purchased and continued by other carriers–most notably23
its London routes which were sold to United–a large portion of its international flying never returned.24
For example, Pan Am operated a large hub in Frankfurt and a substantial Latin American network25
that were never continued their purchasers, Delta and United respectively.26
11See, for example, The Impact of the U.S.-Canada Aviation Agreement At Its Second Anniversary,27
U.S. Department of Transportation, April 1997.28
22

12The U.S. ATA began reporting monthly international yields starting in 1995, and this data1
clearly shows that international yields for U.S. carriers fell sharply after September 11th. For2
example, in the 12-month period ending August 2001, the average monthly yields for the Atlantic,3
Latin America, and Pacific regions were 9.87 cents, 13.44 cents and 9.47 cents respectively. In the4
year ending August 2002, the average prices in the same regions fell to 9.15 cents, 12.48 cents and5
8.58 cents respectively, an average reduction of 8.0%. In the year ending August 2003, Atlantic6
prices rose slightly from 2002 to 9.51 cents, but continued to fall in the Pacific (12.21 cents) and7
Latin America (8.49 cents) regions. Source: www.airlines.org/econ.8
13One exception is in Australia where the bankruptcy of Ansett has temporarily reduced supply,9
especially on some international routes. In the domestic market, however, the rapid growth of Virgin10
Blue has served to largely counteract this effect.11
14There was a reduction in flights to the U.S. while foreign carriers made the necessary changes12
to comply with new, FAA mandated security measures for international flights bound for the U.S.13
But, this will impact the international RPKs of other countries, not the U.S. international RPKs.14
15U.S.-Australia fell slightly from 29.2% to 25.5%.15
16Ito and Lee (2003b) found a more pronounced (and statistically significant) sensitivity to the16
unemployment rate in their study of U.S domestic demand.17
17Source: The Aviation and Aerospace Almanac, 2002.18
18The index values for full fare economy tickets in September of 2001, 2002 and 2003 were 112, 109,19
and 111 respectively. The index values for business class tickets were 137, 134, and 142 respectively.20
Source: BTRE Domestic Fare Survey, available at http://www.btre.gov.au/.21
19We should also note that the Canadian government imposed a security charge up to $24 (CAD)22
per round-trip ticket since April 2002, which, depending on the elasticity of demand, has likely23
increased the price paid by travelers somewhat or served to offset some of decline in fares in Canada.24
20See The Impact of the U.S.-Canada Aviation Agreement At Its Second Anniversary, U.S. De-25
partment of Transportation, April 1997.26
21See “London ‘top terrorist target’”, CNN.com, November 11, 2003. Recent security-mandated27
cancellations of U.S. bound flights from Paris and London highlight the heightened awareness of the28
air security in the region, even though, they are not in our data samples.29
23
22The fact that the shift in aggregate international demand was slightly larger (-33%) than the1
two subsets is due to the fact that the aggregate international data also include flights to Africa, the2
Middle East, South America, and Oceania.3
23We recognize that Australia has had service from a number of other small low cost carriers such4
as Compass and Impulse, but we were unable to find reliable data for these carriers.5
24We are grateful to Robert Lund of Statistics Canada for providing this data.6
25Since Virgin Atlantic’s traffic data only became included in the AEA data starting in January7
2002, we netted out their RPKs from the out dataset.8
26Like our data for WestJet, we needed to impute some of the monthly data from annual data.9
We adopted a similar approach as described above for WestJet.10
27This data can be downloaded at http://www.airlines.org/public/industry/bin/traffic.xls.11
24

Table 1: Summary of Dependent Variable
Country/Region 2000 RPK Rank % of International RPKs Time Periodto/from U.S.†
United States 1 – 1986:1–2003:12Europe 2 42.4% 1993:1–2003:10Japan 3 40.8% 1986:1–2003:11Australia 5 9.0% 1984:1–2003:10∗
Canada 7 26.3% 1987:1–2003:12
Notes: 2000 RPK rank from The Aviation &Aerospace Almanac, 2002. ∗International data forAustralia begins in January 1985. †RPKs to/from U.S. from the U.S. Department of Trans-portation’s T100 International segment database.
25

Table 2: Variable Definitions
Variable DefinitionName
Common to All Countries/Regions
ln(RPKt) Natural log of RPKs (000s) in month t
ln(Labort) Natural log of national labor force in month t (000s)
unemployt National unemployment rate (percent) in month t
LCCsharet Low cost carriers’ share of domestic RPMs
fuelt Price per gallon of jet fuel (PPI deflated) in month t, adjusted for the local currency.
D(IraqWar)t Dummy variable taking value 1 from February to April 2003 and is 0 otherwise, toaccount for the 2003 Iraq War
D(GulfWar)t Dummy variable taking value 1 if period t is between August 1990 and March 1991 andis 0 otherwise, to account for the 1990 Gulf War.
D(SARS)t Dummy variable taking value 1 from March to July 2003, account for SARS epidemic.and is 0 otherwise
U.S.
D(PanAm) Dummy variable that takes the value 0 before January 1991 and 1 thereafter, toaccount for the Pan Am bankruptcy.
Australia
D(pilot)t Dummy variable that takes the value 1 between August 1989 and January 1991,to account for the operational cutback during the pilot dispute.
1/T 2pilot Inverse square of the number of months from August 1989, starting at 1
from September 1989, to account for the nonlinear recovery form after the pilots dispute.
D(dereg) Dummy variable that takes the value 0 before October 1990 and 1 otherwise,to account for the deregulation of the domestic airline market.
D(Bali) Dummy variable that takes the value 0 before October 2002 and 1 otherwise,to account for the demand shift after the Bali Bombing.
Canada
D(OpenSky) Dummy variable that takes the value 0 before February 1995 and 1 otherwise,to account for the enactment of the U.S.–Canada open sky agreement.
Japan
trend a linear trend, to account for the growth of the RPKs throughout the sample period.
26

Table 3: Summary Statistics for the U.S., Australia, Canada, and Japan
Sample Mean (Standard Error)Countries U.S. Australia Canada Japanln(RPK)domestic 7.371 7.441 15.418
(0.434) (0.242) (0.307)ln(RPK)international 16.653 7.876 15.455
(0.334) (0.346) (0.324)ln(PAX)international 6.782
(0.372)ln(Labor) 11.790 9.069 9.614 8.786
(0.066) (0.101) (0.067) (0.040)unemploy 5.671 7.748 8.766 3.396
(1.047) (1.362) (1.539) (1.141)LCCshare 0.093 2.681 5.108
(0.048) (7.332) (8.147)fuel 4.029 5.909 5.440 502.099
(0.1625) (0.8525) (0.510) (83.919)Notes: The numbers of observations are reported in the estimation tables.
27

Table 4: Summary Statistics for Europe
Sample Mean (Standard Error)ln(RPK)within−EU 9.490
(0.263)ln(RPK)international 10.239
(0.223)ln(RPK)EU−NorthAtlactic 9.352
(0.289)ln(RPK)EU−Asia 8.954
(0.169)ln(Labor) 5.135
(0.023)unemploy 9.342
(1.252)LCCshare 3.753
(4.095)fuel 3.676
(0.541)Notes: The numbers of observations are reported in the estimation tables.
28
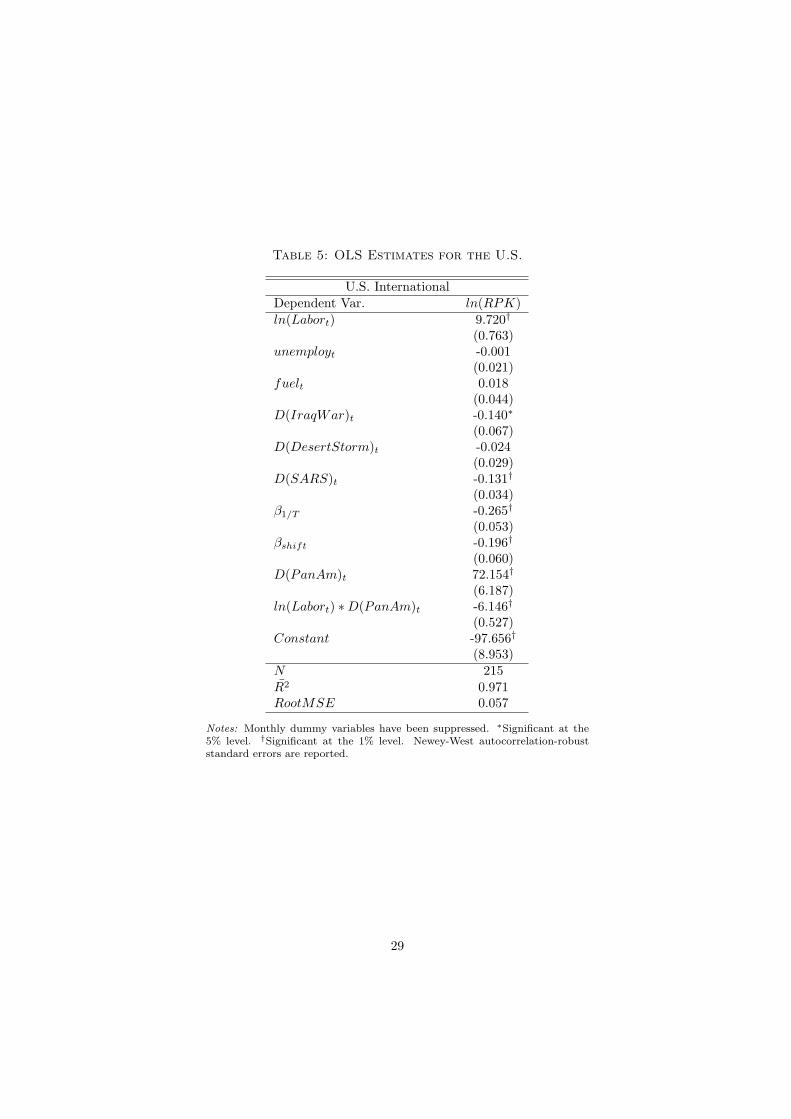
Table 5: OLS Estimates for the U.S.
U.S. InternationalDependent Var. ln(RPK)ln(Labort) 9.720†
(0.763)unemployt -0.001
(0.021)fuelt 0.018
(0.044)D(IraqWar)t -0.140∗
(0.067)D(DesertStorm)t -0.024
(0.029)D(SARS)t -0.131†
(0.034)β1/T -0.265†
(0.053)βshift -0.196†
(0.060)D(PanAm)t 72.154†
(6.187)ln(Labort) ∗D(PanAm)t -6.146†
(0.527)Constant -97.656†
(8.953)N 215R̄2 0.971RootMSE 0.057
Notes: Monthly dummy variables have been suppressed. ∗Significant at the5% level. †Significant at the 1% level. Newey-West autocorrelation-robuststandard errors are reported.
29

Table 6: OLS Estimates for Australia
Dependent Domestic InternationalVariable Ln(RPKs) Ln(Pax)
ln(Labort) 2.135† 4.237†
(0.513) (0.098)unemployt 0.026 (0.002)
(0.014) (0.007)fuelt -0.042† (0.003)
(0.010) (0.007)LCCsharet 0.008∗
(0.004)D(pilot)t -0.195∗
(0.093)1/Tpilot -1.602†
(0.143)D(Dereg)t -23.194†
(5.784)D(Dereg)t ∗ ln(Labort) 2.582†
(0.641)D(DesertStorm)t (0.029) -0.119†
(0.090) (0.018)D(IraqWar)t (0.003) 0.008
(0.021) (0.025)D(SARS)t (0.018) -0.113†
(0.018) (0.031)D(Bali) (0.060) -0.060∗
(0.058) (0.024)βshift -0.250† -0.116†
(0.057) (0.019)β1/T (0.042) 0.027
(0.043) (0.027)Constant -12.048∗ -31.456†
(4.670) (0.933)N 214.000 214.000R̄2 0.967 0.975RootMSE 0.073 0.054
Notes: Monthly dummy variables have been suppressed. ∗Significant at the5% level. †Significant at the 1% level. Newey-West autocorrelation-robuststandard errors are reported.
30

Table 7: OLS Estimates for Canada
Dependent Domestic InternationalVariable Ln(RPKs) Ln(RPKs)
ln(Labort) 0.040 2.821†
(0.303) (0.464)unemployt -0.072† -0.030†
(0.006) (0.006)fuelt -0.014 0.026
(0.021) (0.039)LCCsharet 0.012†
(0.003)D(DesertStorm)t -0.012 -0.023
(0.014) (0.028)D(IraqWar)t -0.132† 0.040
(0.033) (0.038)D(SARS)t -0.070∗ -0.233†
(0.031) (0.052)βshift 0.020 -0.151†
(0.037) (0.048)β1/T -0.270† -0.080
(0.033) (0.059)D(Opensky)t 0.237†
(0.040)Constant 7.593† -19.233†
(2.826) (4.302)N 203 203R̄2 0.927 0.943RootMSE 0.065 0.083
Notes: Monthly dummy variables have been suppressed. ∗Significant at the5% level. †Significant at the 1% level. Newey-West autocorrelation-robuststandard errors are reported.
31

Table 8: OLS Estimates for Europe
Dependent Within-EU EU-International EU-North Atlantic EU-AsiaVariable Ln(RPKs) Ln(RPKs) Ln(RPKs) Ln(RPKs)ln(Labort) 10.628† 13.304† 12.944† 12.695†
(1.506) (2.274) (2.172) (2.035)unemployt -0.009 0.013 -0.002 0.058
(0.023) (0.043) (0.042) (0.038)fuelt -0.032∗ -0.064 -0.069∗ -0.040
(0.014) (0.033) (0.035) (0.031)D(IraqWar)t -0.023 0.014 0.039 0.013
(0.012) (0.027) (0.030) (0.044)D(SARS)t -0.027∗ -0.127† -0.085† -0.265†
(0.013) (0.028) (0.031) (0.048)LCCsharet 0.006∗
(0.003)βshift -0.174† -0.332† -0.311† -0.235†
(0.022) (0.037) (0.040) (0.036)β1/T -0.009 -0.016 -0.217† -0.078∗
(0.022) (0.039) (0.048) (0.039)Constant -45.070† -57.972† -56.996† -56.566†
(7.943) (12.118) (11.556) (10.809)N 130 130 130 130R̄2 0.979 0.932 0.947 0.869RootMSE 0.039 0.058 0.066 0.061
Notes: Monthly dummy variables have been suppressed. ∗Significant at the 5% level. †Significantat the 1% level. Newey-West autocorrelation-robust standard errors are reported.
32

Table 9: Estimates for Japan
Dependent Domestic InternationalVariable Ln(RPKs) Ln(RPKs)
ln(Labort) 1.989† -1.754(0.502) (1.457)
trend 0.004† 0.007†
(0.001) (0.002)unemployt -0.039† -0.029
(0.015) (0.040)fuelt 0.000 0.000
(0.000) (0.000)D(DesertStorm)t 0.015 -0.098
(0.015) (0.085)D(IraqWar)t 0.020∗ 0.085∗
(0.010) (0.040)D(SARS)t -0.035† -0.373†
(0.012) (0.053)βshift -0.028 -0.365†
(0.020) (0.070)β1/T 0.063† -0.089
(0.022) (0.078)Constant -2.788 29.798∗
(4.353) (12.644)N 215 215R̄2 0.980 0.928RootMSE 0.044 0.088
Notes: Monthly dummy variables have been suppressed. ∗Significant at the5% level. †Significant at the 1% level. Newey-West autocorrelation-robuststandard errors are reported.
33

-
10
20
30
40
50
60
70
1991
1992
1993
1994
1995
1996
1997
1998
1999
2000
2001
2002
2003
-
2
4
6
8
10
12
14
16
18
20
1984
1985
1986
1987
1988
1989
1990
1991
1992
1993
1994
1995
1996
1997
1998
1999
2000
2001
2002
2003
-
1
2
3
4
5
6
7
8
9
1987
1988
1989
1990
1991
1992
1993
1994
1995
1996
1997
1998
1999
2000
2001
2002
2003
-
20
40
60
80
100
120
1984
1985
1986
1987
1988
1989
1990
1991
1992
1993
1994
1995
1996
1997
1998
1999
2000
2001
2002
2003
United States
Canada Europe
RP
Ks
(bill
ion
s)
RP
Ks
(bill
ion
s)R
PK
s(b
illio
ns)
RP
Ks
(bill
ion
s)
Japan
Figure 1: System-wide RPKs for Canada, Europe, Japan and the U.S.
34

References1
Air Transport Association (2003): “Airlines in Crisis: The Perfect Economic Storm,” Air2
Transport Association: Washington, D.C.3
Alderighi, M., and A. Cento (2004): “European airlines conduct after September 11,” Journal4
of Air Transport Management, 10, 97–107.5
Bennett, R., and J. Craun (1993): “The Airline Deregulation Evolution Continues: The South-6
west Effect,” Office of Aviation Analysis, U.S. Department of Transportation, Washington, D.C.7
Bierens, H. J. (2003): “EasyReg International,” Department of Economics, Pennsylvania State8
University, University Park, PA.9
Borenstein, S., and M. Zimmerman (1988): “Market incentives for Safe Commercial Alirline10
Operation,” American Economic Review, 78, 913–935.11
Bosch, J.-C., E. W. Eckard, and V. Singal (1998): “Competitive Impact of Air Crashes: Stock12
Market Evidence,” Journal of Law and Economics, XLI, 503–519.13
Davidson, R., and J. MacKinnon (1993): Estimation and Inference in Econometrics. Oxford14
University Press, New York.15
Dresner, M., and R. Windle (1999): “Competitive Responses to low cost carrier entry,” Trans-16
portation Research E, 35, 59–75.17
Forsyth, P. (2003): “Low-cost carriers in Australia: experiences and impacts,” Journal of Air18
Transport Management, 9, 277–284.19
Gillen, D., and A. Lall (2003): “International transmission of shocks in the airline industry,”20
Journal of Air Transport Management, 9, 37–49.21
Hatty, H., and S. Hollmeier (2003): “Airline strategy in the 2001/2002 crisis: the Lufthansa22
example,” Journal of Air Transport Management, 9, 51–55.23
Ito, H., and D. Lee (2003a): “Assessing the Impact of the September 11 Terrorist Attacks on U.S.24
Airline Demand,” Brown University Working Paper, No. 2003-16.25
(2003b): “Low Cost Carrier Growth in the U.S. Airline Industry: Past, Present and Future,”26
Brown University Working Paper, No. 2003-12.27
35
Masse, R. (2001): “How much did the airline industry recover since September 11, 2001?,” Statistics1
Canada Research Paper, No. 51F009XIE.2
Mitchell, M., and M. Maloney (1989): “Crisis in the Cockpit? The role of market forces in3
promoting air travel safety,” Journal of Law and Economics, XXXII, 329–355.4
Morrison, S. A. (2001): “Actual, Adjacent and Potential Competition: Estimating the Full Effect5
of Southwest Airlines,” Journal of Transport Economics and Policy, 35, 239–256.6
Rupp, N., G. Holmes, and J. DeSimone (2003): “Airline Schedule Recovery after Aiport Clo-7
sures: Empirical Evidence Since September 11th,” National Bureau of Economic Research Work-8
ing Paper, No. 9744.9
Williams, G. (2001): “Will Europe’s charter carriers be replaced by ‘no-frills’ scheduled airlines?,”10
Journal of Air Transport Management, 7, 277–286.11
36