comparing the subjective and the objective criteria...
TRANSCRIPT

Hydrology 2015; 3(4): 38-46
Published online September 25, 2015 (http://www.sciencepublishinggroup.com/j/hyd)
doi: 10.11648/j.hyd.20150304.11
ISSN: 2330-7609 (Print); ISSN: 2330-7617 (Online)
Comparing the Subjective and the Objective Criteria Weighting in Agricultural Water Resources Management
Maryam Hafezparast1, *
, Shahab Araghinejad2, Tatiana Filatova
3
1Department of Water Engineering, Faculty of Agriculture, Razi University, Emam-Khomeini Highway, Kermanshah, Iran 2Department of Irrigation & Reclamation Engineering, Faculty of Agricultural Engineering & Technology, College of Agriculture & Natural
Resources, University of Tehran, Karaj, Tehran, Iran 3Centre for Studies in Technology and Sustainable Development, Faculty of Management and Governance, University of Twente, Enschede,
the Netherlands
Email address: [email protected] (M. Hafezparast), [email protected] (S. Araghinejad), [email protected] (T. Filatova)
To cite this article: Maryam Hafezparast, Shahab Araghinejad, Tatiana Filatova. Comparing the Subjective and the Objective Criteria Weighting in Agricultural
Water Resources Management. Hydrology. Vol. 3, No. 4, 2015, pp. 38-46. doi: 10.11648/j.hyd.20150304.11
Abstract: In this study Integrated Water Resources Management (IWRM) approach is applied to the Aras basin in the North
West of Iran to integrate different criteria for demand management and decision making. Coupling between the River Basin
Management Model (MIKEBASIN) and Visual Basic Macro in Excel with the use of COM/.Net interface as a Decision Support
System (DSS) have done to evaluate the performance of 9 indicators of structural alternatives. The Analytical Hierarchical
process, Entropy method and the strategy of equal weighting are compared as three different methods of Subjective, Objective
and Equal criteria weighting. The Technique for Order of Preference by Similarity to Ideal Solution (TOPSIS) is used for Multi
Criteria Decision Making (MCDM) analysis to determine the best management alternatives. The results show that, the
alternative 'Increase water efficiency’ and ‘Decrease cultivated area’ is the most preferred option.
Keywords: Integrated Water Resources Management (IWRM), Multi Criteria Decision Making (MCDM), TOPSIS,
Aras River Basin
1. Introduction
The amount of available water in various regions, such as
deserts and tropical forests are quite different. Moreover the
variation in the supply of water contains seasonal and annual
changes. This means that the uncertainty of water resources is
a major challenge for water managers and the community
(UN-Water, 2008). In this regard, many of the less developed
countries and some developing countries, found that
increasing water supply is not the only appropriate solution
to address the increasing demands due to population growth,
economic and climate pressures. Also improved waste water
treatment, water recycling and demand management, should
be included in a package of measures to deal with the
challenges of improving inadequate water supply (UN-Water,
2008) .Related to this, integrated water resource management
(IWRM) approach can be regarded as a process which
promotes the development and management of water, land
and related resources, in order to maximize the resultant
economic and social welfare in an equitable manner without
compromising the sustainability of vital ecosystems
(UN-Water. GWP, 2007).
Large-scale integrated management of water resources in
watersheds with multiple demands from domestic use, and use
for industry, agriculture and the environment are investigated
with the use of computer simulation software. Some of these
software are based on geographic information systems (GIS)
that can simulate spatial and temporal water resources planning
simultaneously such as MIKE BASIN (DHI, 2003) and
WSMDSS (Water Strategy Man, 2002). However, decisions in
water management are characterized by multiple objectives and
multiple stakeholders (Bressers and Kuks, 2004). This
multiplicity overburdens decision makers in finding the best
decision; thus, a powerful tool is desired for the final selection.
Therefore, many researchers use multi-criteria decision making
(MCDM) methods to cope with water-related problems in their
studies, as well as in research projects that foresee the
development and use of decision support system (DSS) in order
to help acquiring sustainable development strategies (Yilmaz
and Harmancioglu, 2010). Another important issue is to find
effective and efficient methods for decision analysis and DSS

Hydrology 2015; 3(4): 38-46 39
development. This is because of the complexity of decision
analysis, especially in problem analysis and structuring, and
consequently in the development of DSSs for such complicated
MCDM problems as natural resource management (Liu and
Stewart, 2004). The first generation of DSS that combined
various components of databases, models and GIS were formed
in the mid-1990s. According to Ako et al. (2009) there are two
general trends identified currently in the field of mathematical
modeling of catchment basins: 1) hydrologic models, to model
the behavior of the components of the water cycle from rainfall
to runoff, and 2) decision support systems, to model behavior
of different processes, like physical, natural, social and
economic deliberations at hydrological basin. Generally, the
generation of DSS for water management can be classified in
three groups according to their emphasis: water quality, water
allocation and water life. There is a large body of literature on
water resources DSS linked with GIS or MCDM analysis such
as Christensen (2004) created a coupling between the River
Basin Management Model (MIKE BASIN) and the 3D
Hydrological Model (MIKE SHE) with the use of the OpenMI
System. Ireson, Makropoulos and Maksimoviv (2006) coupled
a strategic scale water resources management simulation
model, MIKE BASIN, and a finite difference groundwater
model (ASM), as a tool to support decision making in data
scarce environments. Leemhuis et al (2009) have developed a
Volta Basin Water Allocation System (VB-WAS), a decision
support tool that allows assessing the impact of infrastructure
development in the basin on the availability of current and
future water resources, given the current or future climate
conditions. The simulated historic and future discharge time
series of the joint climate-hydrological modeling approach
(MM5/WaSiM-ETH) serve as input data for a river basin
management model (MIKE BASIN). Yilmaz and
Harmancioglu (2010) developed a water resource management
model that facilitates indicator-based decisions, with respect to
environmental, social and economic dimensions in a multiple
criteria perspective, for the Gediz River Basin in Turkey.
Mathematical models are suitable tools to support the
implementation of IWRM (Humberto et.al, 2009). So that in
this paper we follow the trend of mathematical methods using
decision support systems in water allocation and try to solve
the water scarcity in the Aras basin with management
alternatives under following steps. 1) Combination of software
tools (Mike basin and Visual Basic Macro in Excel) to
simulate system operation and computing system performance
indices such as supply reliability, resiliency and vulnerability, 2)
Application of IWRM DSS in a data scarce region, 3)
Compare different method of Subjective, Objective and Equal
criteria weighting for importance of performance indices, 4)
Exploration of climate change coping strategies for Iran on the
example of Aras watershed.
2. Case-Study: The Aras River Basin
Aras River Basin is located in the northwest of Iran. The
region covers 39534 square kilometers. The latitudes of the
area are between 38 to 40 northern degrees. This basin is
bounded at the west and north side by the state borders of
Iran with Turkey, Armenia and Azerbaijan. On the south and
east, the Aras Basin is bounded by the Urmia Lake Basin and
the Balharoud River Basin. The entire population of the Aras
Basin in the year 2000 was approximately 2.4 million people,
involving nearly 3.7 percent of all the population of Iran and
the population growth rate was 0.6%. In this regard, with 63
persons per sq. Km, the Aras River Basin is one of the most
populated regions within Iran. Agricultural and industrial
developments in this basin were in recent years substantial.
Some important industrial and agricultural production centers
of Iran like the agriculture and animal husbandry in the
Moghan plain, industrial activities in the outskirt of Ardabil,
the Jolfa free merchant area, and the Poldasht, Aslandooz,
Khoy and Marand cities are all located in this basin.
Therefore, it is necessary to carry out comprehensive studies
for the possibility of reducing development impacts in this
basin. Ardabil, Julfa, Khoi, Marand and Pars-Abad are the
main cities here. The geographical location of the Aras River
Basin in Iran is represented in (Figure1).
Fig. 1. Aras river basin in the map of Iran.
3. Methodology
The flowchart of methodology contains three main parts:
data base, analysis and decision making (Figure2). The
topology of water system such as rivers, reservoirs, water
demands, and transmission links are the essential inputs into
MIKE GIS. In the analysis phase, the problem statement
regarding the relation between water demand and supply
based on the IWRM approach is described. The different
scenarios of climate change and population growth are defined
and then the proposed structural and nonstructural alternatives
are determined to be evaluated in the water allocation model
MIKE BASIN. The quantitative outputs of MIKE BASIN are
automatically analyzed in visual basic macro excels and the
performance matrix calculated in the third part of DSS. As an
aid for decision making this calculation has been done to
choose the best alternative with the MCDM method.

40 Maryam Hafezparast et al.: Comparing the Subjective and the Objective Criteria Weighting in
Agricultural Water Resources Management
Fig. 2. The flowchart of methodology.
3.1. Mike Basin
Fig. 3. Aras basin schematic in Mike Basin.
MIKE BASIN is a multi-purpose, GIS-based river basin
simulation package. Designed for analyzing water sharing
problems and environmental issues at international, national
and project scales (Danish Institute of Hydrology, 2003).
MIKE BASIN couples the power of Arc GIS with
comprehensive hydrologic modeling to provide basin-scale
solutions. MIKE BASIN embeds another DHI GIS Extension,
Temporal Analyst, which implies that an abundance of tools
for spatial associations, analysis and presentation of time
series data are available. Moreover, the MIKE BASIN code
is open-ended, and through the extensive COM/.NET
interface all input, output and allocation rules can be
accessed and manipulated, allowing for extensive
customization and even allowing for full integration of MIKE
BASIN in external modeling systems. Examples are
economic or ecologic models, customized pre- and
postprocessors and tailor made decision support systems. The
MIKE BASIN schematic in which the Aras River Basin is
represented is given in Figure 3.
3.2. Input Data
3.2.1. Proposed Alternatives
Alternatives are the structural and non structural ways to
decrease the adverse effects of future scenarios like climate
change, population growth, rapid civilization, depletion of
aquifers, water and conflict, and water quality, etcetera. The
alternatives that are considered (see Table 1) have the aim to
increase the water supply with respect to irrigation efficiency
and decrease the demand. The performance of these
alternatives differs under different hydro-climatically
scenarios. The losses from the irrigation canals in Iran are
about 30%. Consequently this subject is considered in all the
scenarios in relation to irrigation demands. Alternative A1
shows that with proper canal maintenance the losses can be
decreased gradually to 15% (Mahabghods, 2010). In
reaction to low water efficiency of irrigation in Aras basin,
the farmers in the basin is offered some significant incentives
with subsides to construct water – saving irrigation
technologies (e.g. drip irrigation systems). The policy is to
promote irrigation efficiency which is currently estimated at
approximately 30% (Mahabghods, 2010). In accordance
with this policy, alternative A2 based on improvement of
irrigation methods and educating farmers is developed to
increase water efficiency by 10% (Mahabghods, 2010).
These water demand changes are applied to the model
simulation. Since for water transfer to a receiving basin the
general satisfaction of the people within the basin of origin is
Hydrology 2015; 3(4): 38-46 41
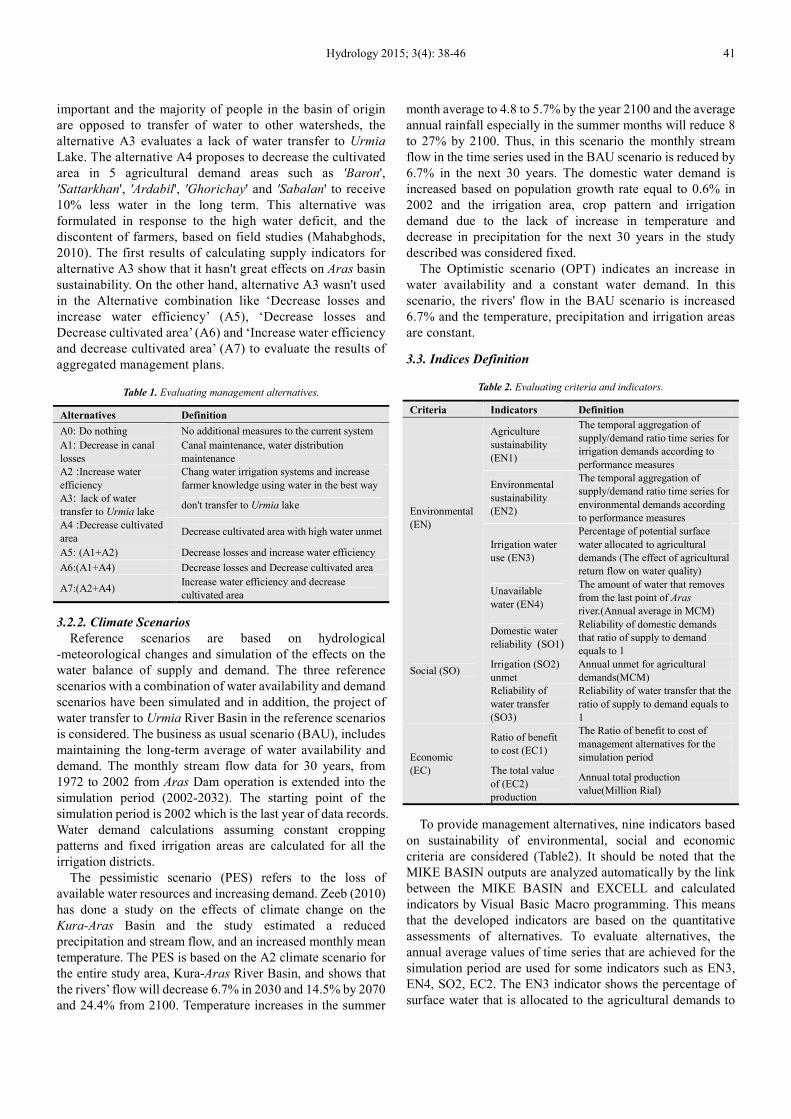
important and the majority of people in the basin of origin
are opposed to transfer of water to other watersheds, the
alternative A3 evaluates a lack of water transfer to Urmia
Lake. The alternative A4 proposes to decrease the cultivated
area in 5 agricultural demand areas such as 'Baron',
'Sattarkhan', 'Ardabil', 'Ghorichay' and 'Sabalan' to receive
10% less water in the long term. This alternative was
formulated in response to the high water deficit, and the
discontent of farmers, based on field studies (Mahabghods,
2010). The first results of calculating supply indicators for
alternative A3 show that it hasn't great effects on Aras basin
sustainability. On the other hand, alternative A3 wasn't used
in the Alternative combination like ‘Decrease losses and
increase water efficiency’ (A5), ‘Decrease losses and
Decrease cultivated area’ (A6) and ‘Increase water efficiency
and decrease cultivated area’ (A7) to evaluate the results of
aggregated management plans.
Table 1. Evaluating management alternatives.
Definition Alternatives
No additional measures to the current system A0: Do nothing
Canal maintenance, water distribution
maintenance A1 : Decrease in canal
losses
Chang water irrigation systems and increase
farmer knowledge using water in the best way A2 : Increase water
efficiency
don't transfer to Urmia lake A3: lack of water
transfer to Urmia lake
Decrease cultivated area with high water unmet A4 :Decrease cultivated
area
Decrease losses and increase water efficiency A5: (A1+A2)
Decrease losses and Decrease cultivated area A6:(A1+A4)
Increase water efficiency and decrease
cultivated area A7:(A2+A4)
3.2.2. Climate Scenarios
Reference scenarios are based on hydrological
-meteorological changes and simulation of the effects on the
water balance of supply and demand. The three reference
scenarios with a combination of water availability and demand
scenarios have been simulated and in addition, the project of
water transfer to Urmia River Basin in the reference scenarios
is considered. The business as usual scenario (BAU), includes
maintaining the long-term average of water availability and
demand. The monthly stream flow data for 30 years, from
1972 to 2002 from Aras Dam operation is extended into the
simulation period (2002-2032). The starting point of the
simulation period is 2002 which is the last year of data records.
Water demand calculations assuming constant cropping
patterns and fixed irrigation areas are calculated for all the
irrigation districts.
The pessimistic scenario (PES) refers to the loss of
available water resources and increasing demand. Zeeb (2010)
has done a study on the effects of climate change on the
Kura-Aras Basin and the study estimated a reduced
precipitation and stream flow, and an increased monthly mean
temperature. The PES is based on the A2 climate scenario for
the entire study area, Kura-Aras River Basin, and shows that
the rivers’ flow will decrease 6.7% in 2030 and 14.5% by 2070
and 24.4% from 2100. Temperature increases in the summer
month average to 4.8 to 5.7% by the year 2100 and the average
annual rainfall especially in the summer months will reduce 8
to 27% by 2100. Thus, in this scenario the monthly stream
flow in the time series used in the BAU scenario is reduced by
6.7% in the next 30 years. The domestic water demand is
increased based on population growth rate equal to 0.6% in
2002 and the irrigation area, crop pattern and irrigation
demand due to the lack of increase in temperature and
decrease in precipitation for the next 30 years in the study
described was considered fixed.
The Optimistic scenario (OPT) indicates an increase in
water availability and a constant water demand. In this
scenario, the rivers' flow in the BAU scenario is increased
6.7% and the temperature, precipitation and irrigation areas
are constant.
3.3. Indices Definition
Table 2. Evaluating criteria and indicators.
Definition Indicators Criteria
The temporal aggregation of
supply/demand ratio time series for
irrigation demands according to
performance measures
Agriculture
sustainability
(EN1)
Environmental (EN)
The temporal aggregation of
supply/demand ratio time series for
environmental demands according
to performance measures
Environmental
sustainability
(EN2)
Percentage of potential surface
water allocated to agricultural
demands (The effect of agricultural
return flow on water quality)
Irrigation water
use (EN3)
The amount of water that removes
from the last point of Aras
river.(Annual average in MCM)
Unavailable
water (EN4)
Reliability of domestic demands
that ratio of supply to demand
equals to 1
Domestic water
reliability (SO1)
Social (SO) Annual unmet for agricultural
demands(MCM)
Irrigation (SO2)
unmet
Reliability of water transfer that the
ratio of supply to demand equals to
1
Reliability of
water transfer
(SO3) The Ratio of benefit to cost of
management alternatives for the
simulation period
Ratio of benefit
to cost (EC1) Economic
(EC) Annual total production
value(Million Rial)
The total value
of (EC2) production
To provide management alternatives, nine indicators based
on sustainability of environmental, social and economic
criteria are considered (Table2). It should be noted that the
MIKE BASIN outputs are analyzed automatically by the link
between the MIKE BASIN and EXCELL and calculated
indicators by Visual Basic Macro programming. This means
that the developed indicators are based on the quantitative
assessments of alternatives. To evaluate alternatives, the
annual average values of time series that are achieved for the
simulation period are used for some indicators such as EN3,
EN4, SO2, EC2. The EN3 indicator shows the percentage of
surface water that is allocated to the agricultural demands to

42 Maryam Hafezparast et al.: Comparing the Subjective and the Objective Criteria Weighting in
Agricultural Water Resources Management
the total water surface. The EC1 indicator shows that the
benefit to cost ration is varying. It is obtained by dividing the
total benefits by the total costs.
Reliability, Resilience and Vulnerability (RRV) are used as
indices to evaluate the performance of a water resources
system in meeting the water demand (Hashimoto et al., 1982;
Fowler et al., 2003). This process for each index,C , is shown
in the time series with tC and t is the duration of the
simulation. To calculate these parameters, the upper limit and
lower limit of an acceptable range should be defined. These
values are determined by the judgment of decision makers.
SO1, SO3 are the indicators that are achieved from the
reliability index of which the equation is shown in Equation1.
Reliability (RE) is calculated as a probability of any tC
value to be within the range of values considered satisfactory
(Equation1).
( )( )
Number of Satisfactory Ct valuesRE(C)
Total number of simulated periods= (1)
Resilience (RS) describes the speed of recovery from an
unsatisfactory condition. It is the probability that a satisfactory
value 1t
C+
will follow an unsatisfactorytC value
(Equation2).
��(�) =���� �� ���� � ������������ ���� ������ ������� �� �������������� �� �����
����� ���� �� �������������� ������ (2)
Vulnerability is a statistical indicator that measures the
extent and the duration of unsatisfactory values. In this study it
is defined as expected extent-vulnerability, and the durations
of failures are excluded (Equation3).
� (�) =(∑ ��"���"��� �#����� �� �� ��������
����� ���� �� ��"���"��� �#���� �� �� �������� (3)
The sustainability index that ranges from zero to one as the
worst to the best value was calculated by multiplying the
values of reliability, resiliency, and (1-vulnerability). For
sustainability, reliability and resiliency indices should be the
maximum and minimum vulnerability. In this way, the
agricultural sustainability index (EN1) and environmental
sustainability index (EN2) are calculated according to Eqs.4
and 5, respectively. The supply/demand ratio (S/D) used for
irrigation districts and environmental demands for EN1, EN2.
The satisfactory range is selected to be between 0.8 and 1 for
agricultural and 1 for environmental demands respectively.
( )( / ) ( / ) ( / )1 * * 1
Sa Da Sa Da Sa DaEN RE RS VU= − (4)
( )( / ) ( / ) ( / )2 * * 1
Se De Se De Se DeEN RE RS VU= − (5)
3.4. Weighting the Criteria
There are several methods to determine the weights of
criteria which can be used in various ways for different policy
evaluation purposes. Alternative weighting methods could
result in different ranking. Thus, it is important to test how
sensitive the outcome of MCDM is with respect to the
weighting procedure. Some methods like analytic hierarchy
process (AHP) made via preference elicitation technique and
it's based on DMs experiences, knowledge and perception of
the problem. However, the DMs usually have different idea
and can rarely reach an agreement on the relative importance
of criteria (Yilmaz and Harmancioglu 2010). So that, in this
paper, three different weighting methods include subjective,
objective and equal weighting method compared. 1) Analytic
hierarchy process (AHP) depends on DMs experience as a
subjective method 2) Entropy method (EM) as an objective
method, and 3) The strategy of equal criteria weighting.
3.4.1. Entropy Method (EM)
Entropy was first introduced into information theory by
Shannon (1948). It has been widely used in the engineering,
socioeconomic and other fields. According to the basic
principles of information theory, information is a measure of
system’s ordered degree, and the entropy is a measure of
system’s disorder degree. To determine criteria weights by the
entropy valuejE , the PM matrix should be normalized by
(Equation6). Then a new matrix containing the values of each
alternative in each criterion is obtained (Equation7).
1
, 1,2,....,ij
ij n
iji
ar j m
a=
= =
∑ (6)
11 12 1
21 22 2
1 2
...
...
... ... ... ...
...
m
m
n n nm
r r r
r r rR
r r r
=
(7)
The values in matrix R are considered as the 'emission
power' of each criterion ( 1,2,..., )jC j m= and are used to
calculate an entropy value jE as (Equation8).
1
ln , 1,2,...,n
j ij iji
E k r r j m=
= − =∑ (8)
K , is constant and equal to 1/ lnK n= , so that
0 1jE< < . The degree of divergence ( )jd of the values in
each criterion is obtained as (Equation9).
1 , 1,2,...,j j
d E j m= − = (9)
This means that the greatest divergent in the initial scores
ija of each alternative ( 1,2,..., )
iA i n= in each criterion
jC
is the maximum value of jd and has been the most important

Hydrology 2015; 3(4): 38-46 43
for criteriajC . If
jd is considered as the specific measure of
inherent contrast of the criterionjC , the final relative weights
for each criteria is calculated by (Equation10).
1
, 1,2,...,m
j ji
w d dj j m=
= = ∑ (10)
3.4.2. Analytic Hierarchy Process (AHP)
AHP is the well-known type of subjective
weight-assessing method that was introduced by Saaty
(1970). He suggests two techniques for obtaining the
information on preference: pair wise comparison and
Eigen-vector computing. In fact, we can get these values by a
direct-rating process or compute them through the
least-square method, without affecting the validity of the
AHP model (Gwo-Hshiung et al, 1998). The first-level
criteria were compared between-each-other depending on
importance and matrix,P , is derived in which
ijP Are described as presenting the relative importance of
the i th criterion with respect to j th criterion (Equation11).
12 1
21 2
1 2
1 ...
1 ...
... ... ... ...
... 1
m
m
m m
p p
p p
p
p p
=
(11)
In the process of comparison, just the upper triangular
matrix is determined and the lower triangular is defined as
(Equation12).
1ij
ij
Pp
= (12)
The normalized pair wise comparison matrix is derived by
dividing each element in P by its column sum (Equation13).
Then, the principal eigenvector (λ) that defines the criteria
weight vector (W) is obtained by averaging across the rows of
X (Equation14), where the wj (j=1,.. m) shows the relative
weights among the criteria that are compared, and the sum of
criteria weights is 1.
1 111 11 1
11 1
1 1
1/ . . / . .
. . . . . . .
. ./ . . 1/
m m
m m tmmm t
m m
m mmm m tm
m t
P p px x
X
x xp p p
= =
= =
= =
∑ ∑
∑ ∑
(13)
11
1
1
. .1
. .
m
mm
m
mmt
t
xw
Wm
wx
=
=
= =
∑
∑
(14)
Further, the consistency of criteria weights should be
checked. Saaty (1980) proved that for a consistent reciprocal
matrix, the largest Eigen value is equal to the number of
comparisons, ormax
nλ = . Then he gave a measure of
consistency, called Consistency Index as deviation or degree
of consistency using the following formula (Equation15 and
16) and also proposed that this index in comparison with the
Consistency index (Table3), is called Random Consistency
Index ( )RI . If the value of Consistency Ratio is smaller or
equal to 10%, the inconsistency is acceptable. If the
Consistency Ratio is greater than 10%, the subjective
judgment should be revised.
Table 3. Random Consistency Index ( )RI .
n 3 4 5 6 7 8 9
1.4457 1.4217 1.3334 1.2525 1.1045 0.8832 0.5381 RI
max
1
n
CI
n
λ −=
− (15)
CICR
RI= (16)
3.5. Multi Criteria Decision Making (MCDM)
Multi Criteria Decision-Making (MCDM) methods are
gaining importance as potential tools for analyzing complex
real problems due to their inherent ability to judge different
alternatives on various criteria for possible selection of the
best/suitable alternative (s). In this study the TOPSIS method
(Hwang and Yoon, 1980) for ranking the alternatives is used.
The basic concept of this method is that the selected
alternative should have the shortest distance from the ideal
solution and the farthest distance from the negative-ideal
solution in some geometrical sense. Below we will explain its
steps.
(1) Calculate the normalized decision matrix. The
normalized value Xij is calculated as (Equation17).
2
1
, 1,2,....,ij
ijm
iji
Xr j m
X=
= =
∑ (17)
(2) Calculate the weighted normalized decision matrix. The
weighted normalized value ijv is calculated as (Equation18).
, 1,..., , 1,..., .ij j ijv w x i m j n= = = (18)
Where jw is the weight of the i th attribute or criterion,
and1
1.n
jj
w=
=∑
(3) Determine the positive ideal and negative ideal solution
and calculate the separation measures, using the
n-dimensional Euclidean distance. The separation of each
alternative from the ideal and negative ideal solution is given

44 Maryam Hafezparast et al.: Comparing the Subjective and the Objective Criteria Weighting in
Agricultural Water Resources Management
as (Equation19 and 20).
(4) Calculate the relative closeness to the ideal solution as
(Equation21) Rank the preference order. For ranking
alternatives using this index, we can rank alternatives in
decreasing order.
0.52( )
ij jjis v v+ +
= − ∑ (19)
0.52( )
ij jjis v v− −
= − ∑ (20)
i
i
i i
sc
s s
−
+
+ −
=+
(21)
4. Results and Discussion
The Performance Matrix (PM) is formed on the basis of the
9 indicators and 8 alternatives (including the alternative of do
nothing, A0). For the three scenarios, BAU, PES and OPT,
three PMs are produced, which do not only provide indicators
for evaluation but also support eventual decision-making
processes on infrastructure (Table 4). The values of indicators
across all scenarios show that the alternatives ‘Do nothing’
(A0) and ‘Don't transfer to Urmia Lake’ (A3) are less effective
than others. More dominant are the combined alternative such
as (A7) ‘Increase water efficiency and decrease cultivated
area’, (A6) ‘Decrease losses and decrease cultivated area’, and
(A5) ‘Decrease losses and increase water efficiency’. Thus, a
diversified portfolio of IWRM measures is always preferable.
This result holds under all scenarios and various weighting
methods (Table 5). Compare three different method of
subjective, objective and equal criteria weighting shows that,
the Alternative A7 received top rank 5 times out of 9
simulations, A6 got ranked top 3 times out of 9, with A5
selected only once as the top. This implies that the portfolio of
such measures as ‘Decrease cultivated area’ (in A7 and A6),
‘Increase water efficiency’ (components of A7 and A5) and
‘Decrease losses’ (A5 and A6) is the most robust one across all
considered scenarios of the future regardless of the weighting
technique.
Table 4. Performance matrix of alternative and indices.
Scenario Criteria Environmental Social Economic
Indicators EN1 EN2 EN3���� EN4���� SO1 SO2���� SO3 EC1 EC2
BAU
A0 0.14 0.117 0.400 0.378 0.97 396.8 0.967 1.26 39520
A1 0.169 0.120 0.422 0.457 0.981 259.1 0.972 1.30 41227
A2 0.167 0.114 0.335 0.468 0.981 183.3 0.975 1.14 32754
A3 0.149 0.116 0.408 0.407 0.970 363.7 - 1.27 39920
A4 0.167 0.122 0.403 0.379 0.979 280.7 0.967 1.26 39344
A5 0.189 0.129 0.344 0.539 0.987 113.1 0.978 1.16 33640
A6 0.180 0.117 0.419 0.459 0.989 153.2 0.972 1.30 40926
A7 0.183 0.113 0.332 0.471 0.991 105.5 0.975 1.13 32434
OPT
A0 0.162 0.117 0.387 0.430 0.976 331.8 0.972 1.48 40323
A1 0.173 0.143 0.4 0.516 0.985 215.4 0.978 1.51 41763
A2 0.178 0.140 0.318 0.528 0.984 155.1 0.978 1.32 33138
A3 0.158 0.128 0.389 0.463 0.976 307.7 - 1.49 40618
A4 0.174 0.120 0.384 0.414 0.985 221.8 0.972 1.48 40077
A5 0.240 0.150 0.326 0.600 0.989 85.3 0.981 1.34 33974
A6 0.183 0.138 0.397 0.520 0.993 116.9 0.978 1.51 41352
A7 0.188 0.138 0.314 0.532 0.993 82.5 0.978 1.32 32744
PES
A0 0.132 0.095 0.418 0.322 0.959 495.8 0.953 1.19 38299
A1 0.155 0.108 0.44 0.392 0.924 326.9 0.969 1.23 40368
A2 0.157 0.109 0.350 0.402 0.967 242.5 0.969 1.09 32030
A3 0.133 0.090 0.423 0.350 0.959 459.4 - 1.19 38757
A4 0.144 0.105 0.417 0.322 0.964 388.0 0.953 1.19 38016
A5 0.178 0.114 0.363 0.470 0.975 154.1 0.975 1.11 33139
A6 0.172 0.116 0.440 0.394 0.978 216.2 0.969 1.23 40112
A7 0.172 0.120 0.349 0.404 0.979 153.8 0.969 1.09 31837
Indicator to be minimized�
Table 5. Rank of alternatives with different criteria weights.
Scenario BAU OPT PES
Rank equal Weighting Entropy AHP equal Weighting Entropy AHP equal Weighting Entropy AHP
1 A7 A7 A6 A6 A7 A5 A7 A7 A6
2 A6 A5 A5 A7 A5 A7 A6 A5 A5
3 A5 A6 A7 A5 A6 A6 A5 A6 A7
4 A2 A2 A2 A2 A2 A2 A2 A2 A2
5 A1 A3 A1 A4 A3 A1 A1 A3 A1
6 A4 A1 A4 A1 A1 A4 A3 A1 A4
7 A3 A4 A3 A3 A4 A3 A4 A4 A3
8 A0 A0 A0 A0 A0 A0 A0 A0 A0

Hydrology 2015; 3(4): 38-46 45
Due to the increase in available water in the OPT scenario,
similar results appear with better performance than BAU
scenario and in the PES scenario with reduced water
availability and increased demand the alternatives have lower
performance results than in the BAU and OPT scenarios.
EN1 is an indicator that is obtained through the overlap of
reliability, resilience and vulnerability of irrigation demand
(supply/demand ratio). It varies between 0 (worst performance)
and 1 (best performance). It improves 31%, 48.1% and 34.8%
in scenarios BAU, OPT and PES respectively. This
improvement is based on A7 and A5 implementation. The
EN2 indicator that shows the sustainability of environmental
demands, can improve 0.88%, 28.2% after A5 implementation
in BAU and OPT scenarios and 33.3% after A7 in PES
scenario, It means that alternative A7 is so useful in reduced
water availability and increased demand. After
implementation of A7, the most improvement in the EN3
indicator that shows the rate of surface water use in
agricultural demands is 21.32%, 21.5% and 22.73% in
scenarios BAU, OPT and PES respectively. Minimizing the
amount of water that removes from the last point of Aras river
help to keep more water for water management and this goal is
obtained by the EN4. In this way, A7 has the most percent of
water removes and the best results for alternative A0 and A4.
The SO1 and SO3 indices show the reliability of domestic
demands and water transfer to Urmia Lake and in all the
alternatives have a high performance. The average annual
agricultural unmet demand that shows SO2 index, decreased
by alternative A7 includes ‘Increase water efficiency’ and
‘Decrease cultivated area’. This reduction equal to 73.4%,
75.13% and 68.98% in scenarios BAU, OPT and PES
respectively maximum performance of /B C related to EC1
index, respectively, reaches to 1.5, 1.3, 1.23 in OPT, BAU and
PES scenarios with implementation of the alternatives, A1
‘Decrease in canal losses’ and A6 ‘Decrease losses’ &
‘Decrease cultivated area’.
In summary, considering different criteria weighting
methods, A7 is identified as the most preferred alternative in
MCDM method that refers to aggregation of alternatives
(A2+A4).
5. Conclusion
The infrastructural resources in the Aras basin (Table1)
include 10 dams under operation and construction, and the
demands include 20 agricultural, 7 domestic, 5 industrial and
11 environmental demands and also water transfer to the
Urmia lake water basin. The results of EN1 and EN2
indicators show that, these values are so far from the
satisfactory range. So the main points are derived from the
analysis of meteorological – hydrological scenarios indicate
that the Aras basin, for each of the three scenarios, is
vigorously under water stress in dry years and water demand
management policies to solve the water crisis to achieve
sustainable development are necessary.
Based on the indicators taking into account environmental,
social and economic criteria, the decrease of cultivated area
and the increase of irrigation efficiency are the most effective
management strategies in the Aras basin. In the other hand,
Equal criteria weighting proposed to implement alternative
A7 in BAU and PES scenarios and A6 in OPT scenario. Due
to the effect of indicators in watershed sustainability,
Objective criteria weighting, in all the scenarios, A7 is the best
alternative to implementation and finally, based on decision
makers experience, the Subjective weighting method, the
alternative A6 in the BAU and PES scenarios and A5 in the
OPT scenario selected as the best one.
Since the water transfer project to Urmia Lake will be
implemented, the results show that, 300 million cubic meter of
water transfer, has no serious adverse effects on the Aras basin
water management. In this regard, the developed methodology
is a valuable tool for the evaluation of water resources
allocation systems and the implementation of integrated water
resources management in the Aras basin. The Mike basin
software is also a useful tool for planning and management of
water resources with very powerful GIS data bases. To
compare this paper with all papers that are reviewed in
literature the most important points are 1) The management
alternatives are based on field studies that governance did in
Aras basin (mahabghods,2010). 2) The quantitative indicators
are based on environmental, social and economical criteria of
Aras basin. 3) Calculating 9 indicators in 3 scenarios and 8
alternatives is so difficult in handy work so in this paper we
coupled Mike basin to Visual Basic Macro in Excel with the
use of the COM/.Net, and choose the best alternative in each
scenario by MCDM analysis, made a decision support
system.4) Compare different Subjective, Objective and Equal
criteria weighting methods, help decision makers to choose
the best alternative in each scenario. Future directions of
research are 1) Investigation of climatic scenarios based on
General Circulation Models (GCM). 2) Adding more
indicators in quality of water and soil and 3) Application of
other weighting criteria and MCDM methods.
References
[1] Ako, A. A., Eyong, G. E. T., & Nkeng, G. E. (2009). 'Water Resources Management and Integrated Water Resources Management (IWRM) in Cameroon', Journal of Water Resources Management (24): 871–888.
[2] American Society of Civil Engineers (ASCE). 1998. 'Sustainability Criteria for Water Resources Systems'. (Task Committee on Sustainability Criteria, Water Resources Planning and Management Division, ASCE and Working Group, UNESCO/IHP IV Project M-4.3). ASCE, Reston, VA.
[3] Bressers, H. and S. Kuks (2004). Governance of Water resources. In: Integrated governance and water basin management, Bressers H. and S. Kuks [eds.], Kluwer Academic Publishers.
[4] Christensen, F. 2004. 'Coupling between the River Basin Management Model (MIKE BASIN) and the 3D Hydrological Model (MIKE SHE) with use of the OpenMI System'. 6th International Conference on Hydroinformatics. Singapore.

46 Maryam Hafezparast et al.: Comparing the Subjective and the Objective Criteria Weighting in
Agricultural Water Resources Management
[5] Churchman, C. W., Ackoff, R. L., Arnoff, E. L., 1957. Introduction to Operations Research. John Wiley, New York.
[6] Danish Institute of Hydrology. MIKE BASIN.2003. A versatile decision support tool for integrated water resources management and planning, DHI Water and Environment, Denmark.
[7] Danish Institute of Hydrology. MIKE BASIN.2003. Manuals and Documentation. http:// www. dhisoftware. com/ mikebasin/ index.htm.
[8] Densham P. J. and Goodchild M. F.1989.Spatial decision support systems: a research agenda. Proceedings of GIS/LIS'89.ACSM, Bethesda Maryland, pp.707-16.
[9] Eckenrode, R. T. 1965. Weighting multiple criteria. Management Sc. 12, 180-192.
[10] Hashimoto, T., Stedinger, J. R., and Loucks, D. P., 1982, Reliability, resiliency and vulnerability criteria for water resource system performance evaluation, Water Resources Research, 18(1), 14 – 20, doi: 10.1029/ WR018i001p00014.
[11] Humberto, S. H., Ignacio, R. M. D., María Teresa, A. H.,and Alfredo, G. O., 2009. Mathematical modeling for the integrated management of water resources in hydrological basins. Water Resources Management (23): 721–730.
[12] Hwang, C. L; Yoon, K. 1981. Multiple Attribute Decision Making: Methods and Applications. New York: Springer-Verlag.
[13] Ireson, A., Makropoulos, C., Maksimovic, C., 2006. Water Resources Modeling under Data Scarcity: Coupling MIKE BASIN and ASM Groundwater Model. Journal of Water Resources Management (20):567-590.
[14] Leemhuis, C., Jung, G., Kasei, R., Liebe, J., 2009. The Volta Basin Water Allocation System: assessing the impact of small-scale reservoir development on the water resources of the Volta basin, West Africa. Journal of Advances in Geosciences (21):57-62.
[15] Dingfei Liu, Theodor J. Stewart. 2004. Integrated object-oriented framework for MCDM and DSS modelling. Decision Support Systems 38(3): 421-434.
[16] Mahabghods consulting engineering. 2010. Update the State Water Plan Aras, Sefidrood, Gorganrood, Atrak, Urmia watersheds. Aras synthesis Report.
[17] Reitsma, R. F., 1996. Structure and support of water-resources management and decision-making. Journal of Hydrology (177). Iss.3-4: 253.
[18] Saaty, T. 1994. The Analytic Hierarchy Process. Wiley, New York.
[19] Shannon Claude, E., 1948. A Mathematical Theory of Communication. Bell System Technical Journal 27 (3): 379–423.
[20] Tzeng, G-H., Chen, T-Y., Wang, J. C., 1998. A weight assessing method with habitual domains. European Journal of Operational Research, 110: 342-367.
[21] UN-Water. 2008. Status Report on Integrated Water Resources Management and Water Efficiency Plans.
[22] UN-Water. GWP. 2007. Roadmapping for Advancing Integrated Water Resources Management (IWRM) Processes.
[23] Yilmaz, B., Harmancioglu, N. B., 2010. An indicator based assessment for water resources management in Gediz River Basin, Turkey. Journal of Water Resources Management 24(15):4359-4379.
[24] Water Strategy Man project, EU Contract No. EVK1-CT-2001-00098(2002-2005) http://environ.chemeng.ntua.gr/wsm.
[25] Zeeb, S., 2010. Adaptation to Climate Change in the Kura-Aras River Basin. Snapshot Draft for Discussion.