comparison between experimental and finite … · comparison between experimental and finite...
TRANSCRIPT

INTERNATIONAL JOURNAL OF CIVIL AND STRUCTURAL ENGINEERING
Volume 3, No 2, 2012
© Copyright by the authors - Licensee IPA- Under Creative Commons license 3.0
Research article ISSN 0976 – 4399
Received on September 2012 Published on November 2012 429
Comparison between Experimental and Finite Element Modeling Data for
Triaxial Undrained Cyclic Tests in Compression on HOSTUM Sand Seyed Hassan Golmaei
1, Marc Boulon
2
1Sari Agriculture Sciences and Natural Resources University, Sari, Iran
2GRENOBLE University, France
doi:10.6088/ijcser.201203013040
ABSTRACT
Finite elements modeling data is fitted to the results of experimental undrained monotonic
and cyclic isotropic triaxial tests. The model can predict the accumulation strain /stress, and
pore pressure in undrained state. For determination of material constants, the first cycle
(loading-unloading) is performed step-by-step, using Hardening-Soil model for undrained
soil, then for the cycles greater than one, the Behavior of the soil is simulated as a pseudo
creep (Soft-Soil-Creep model, here) where the number of cycles N is considered equivalent
time. The prediction of model is compared with experimental results from monotonic and
cyclic undrained isotropic triaxial tests. Good correlation exists between predicted and
experimental response.
Keywords: Triaxial undrained, cyclic tests, Hostum sand; Pseudo cyclic creep model,
Explicit model, PLAXIS.
1. Introduction
The evolution of civil engineering constructions at sea, has highlighted the need to develop a
method for calculating foundation structure at sea, for taking into account the repeated action
of waves and wind.The behavior prediction of structures under cyclic loading requires a good
knowledge of the behavior of an element of the soil, under cyclic loading in homogenous
conditions. This knowledge is a necessary basis for each method of calculation of structure,
for example finite element method. In this study, it is limited to consideration of the cyclical
behavior of sands. It has been proposed further that the case of a slow loading during which
the soil is loaded in quasi-static, inertial forces is not involved in the analysis of the
phenomenon. In undrained conditions the application of cyclic loading leads to the
accumulation of pore pressure and modification of the soil module to the change of the
effective mean stress.
1.1 EXPLICIT Versus IMPLICIT Method
In the Finites Elements (F.E.) calculation of the accumulation due to cyclic loading two
different numerical strategies can be considered: the Implicit and Explicit methods. For high-
cyclic loading in general explicit models are the better choice. They treat the process of
accumulation under cyclic loading similar to a process governed by viscosity. The number of
cycles N replaces the time(9). Application of boundary value problems with cyclic loading
can be studied numerically by means of finite element method (FEM).The so-called
IMPLICIT method, where in each cycle is calculated with a constitutive model and many
strain increments, is not applicable for a number of cycles N higher than 50 because of the

Comparison between Experimental and Finite Element Modeling Data for Triaxial Undrained Cyclic Tests
in Compression on HOSTUM Sand
Seyed Hassan Golmaei, Marc Boulon
International Journal of Civil and Structural Engineering 430
Volume 3 Issue 2 2012
accumulation of numerical errors and the huge calculation effort. In this case the so-called
EXPLICIT method is superior to the IMPLICIT one. An explicit model treats the
accumulation of residual strains under cyclic loading similar to the problem of creep under
constant loads (9). Metals, especially under high temperatures, exhibit simultaneously the
phenomena of creep and viscoplasticity.
The former is essentially a redistribution of stress and / or strains with time under elastic
material response while the latter is a time dependent plastic deformation. Experimental
observations cannot distinguish between the two phenomena and their separation has
been largely an analytical convenience rather a physical requirement (5). The explicit
model has been used in a combined numerical strategy consisting of implicit and
explicit schemes for the solution of accumulation problems in the engineering practice.
Numerical processes, as described in this work, allow the simultaneous description of both
effects.
Three modes of operation have been distinguished in the modes of material routines.
1- explicit schemes for the solution of accumulation problems in the engineering
practice. Initial equilibrium and first cycle .The explicit model has been used in
a combined numerical strategy consisting of implicit and The accumulation
model implemented into the FE program , PLAXIS has been utilized by HSM
(hardening soil model).
2- recoding mode from the first cycle, the strain amplitude can be used for the
calculation of the second cycle and for control cycles.
3- Pseudo-creep mode :In this mode the explicit calculation of accumulation
according to SSCM (Soft Soil Creep Model) is carried out.
Figure Error! No text of specified style in document..1: Assignment of calculation steps and
program modes for the calculation of cyclically loaded Geotechnical structure
Own
weight
of soil
Averag
e load
Recording cycle Explicit creep

Comparison between Experimental and Finite Element Modeling Data for Triaxial Undrained Cyclic Tests
in Compression on HOSTUM Sand
Seyed Hassan Golmaei, Marc Boulon
International Journal of Civil and Structural Engineering 431
Volume 3 Issue 2 2012
The present study focus on finite element modeling of undrained monotonic and cyclic
triaxial tests. This is done by industrial software (PLAXIS here). The results of modeling and
experimental data found in literature are compared by curve fitting.
2. Materials and Methods
Cyclic tests were carried out by IOANNIS THANOPLOUS [8] to 200 cycles on the
undrained condition in HOSTUM sand. The series of cyclic triaxial compression tests on the
undrained condition was conducted following the drained compression test to 200 cycles.
Figure Error! No text of specified style in document..2: the mean position of the cycle and
cyclical amplitude is defined by using the two variables reduced by σm and ω (8).
Is the value of the deviator to the rupture during the test as defined monotonic
under compression Is the maximum value of axial stress during the cycle. Is the
minimum value of the axial stress during the cycle. The parameters and ω are calculated
from the stress to the rupture defined during the crushing monotonically, under
compression. Cyclic tests were carried out by LOANNIS THANOPLOUS to 200 cycles on
the undrained condition in HOSTUM sand. The series of cyclic triaxial compression tests on
the undrained condition was conducted following the drained compression test to 200 cycle.
For all these tests the initial effective lateral stress is equal to 200 kPa.
Table 1: The mean level σ3 and cyclical amplitude ω are defined by comparison to the
deviator rupture drained, (σ1 – σ3)peak (8).
( )
18.0 750 kPa
16.0 480 kPa
peak
Comparison between Experimental and Finite Element Modeling Data for Triaxial Undrained Cyclic Tests
in Compression on HOSTUM Sand
Seyed Hassan Golmaei, Marc Boulon
International Journal of Civil and Structural Engineering 432
Volume 3 Issue 2 2012
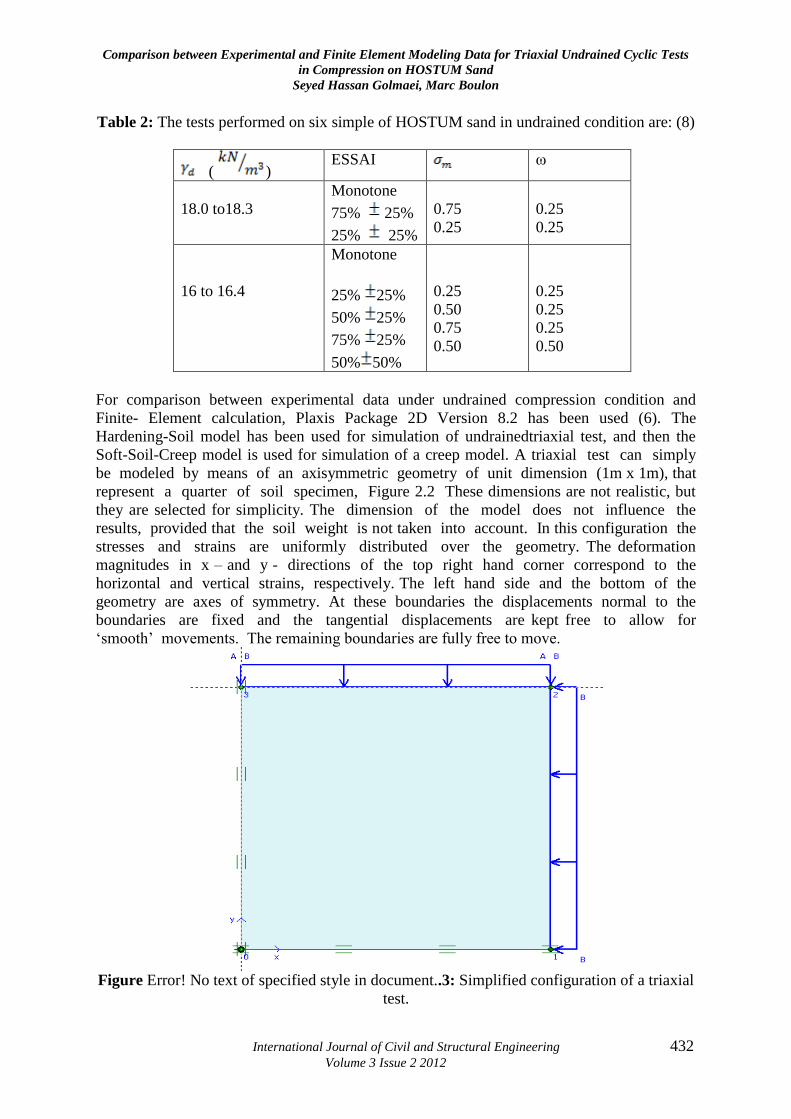
Table 2: The tests performed on six simple of HOSTUM sand in undrained condition are: (8)
( ) ESSAI ω
18.0 to18.3
Monotone
75% 25%
25% 25%
0.75
0.25
0.25
0.25
16 to 16.4
Monotone
25% 25%
50% 25%
75% 25%
50% 50%
0.25
0.50
0.75
0.50
0.25
0.25
0.25
0.50
For comparison between experimental data under undrained compression condition and
Finite- Element calculation, Plaxis Package 2D Version 8.2 has been used (6). The
Hardening-Soil model has been used for simulation of undrainedtriaxial test, and then the
Soft-Soil-Creep model is used for simulation of a creep model. A triaxial test can simply
be modeled by means of an axisymmetric geometry of unit dimension (1m x 1m), that
represent a quarter of soil specimen, Figure 2.2 These dimensions are not realistic, but
they are selected for simplicity. The dimension of the model does not influence the
results, provided that the soil weight is not taken into account. In this configuration the
stresses and strains are uniformly distributed over the geometry. The deformation
magnitudes in x – and y - directions of the top right hand corner correspond to the
horizontal and vertical strains, respectively. The left hand side and the bottom of the
geometry are axes of symmetry. At these boundaries the displacements normal to the
boundaries are fixed and the tangential displacements are kept free to allow for
„smooth‟ movements. The remaining boundaries are fully free to move.
Figure Error! No text of specified style in document..3: Simplified configuration of a triaxial
test.
Comparison between Experimental and Finite Element Modeling Data for Triaxial Undrained Cyclic Tests
in Compression on HOSTUM Sand
Seyed Hassan Golmaei, Marc Boulon
International Journal of Civil and Structural Engineering 433
Volume 3 Issue 2 2012
3. Results and Discussion
3.1 Isotropically Consolidated Undrained Monotonic Compression Tests
Preliminary to the undrained cyclic triaxial tests, in order to determine material constants,
curve fitting for correlation between the experimental and F.E. modeling data, for two series
of undrained monotonic triaxial tests (compression) were performed .The specimens were
consolidated under isotropic effective stress 200 kPa. Comparison between model prediction
and experimental results under monotonic loading on Hostum sand are shown in figures 3.1 –
3.2. In figs 3.1 a – 3.2 a, the peak friction angle (PFA, RC), the drain line slope 1:3, the
critical state line (CSL, DC) are plotted. In both figures, the path representing the state of
stresses goes back to drained loading surface. The evolutions of pore water pressure are
presented in Figs 3.1 c – 3.2 c. A drained behavior of sand that would first contracting (u
increasing) and secondly dilating (u decreasing) are shown in both figures. From the
comparison it can be concluded that model data, reasonably well, predict experimental data.
Table 3 resumes the required material constant for applying pseudo - creep mode.
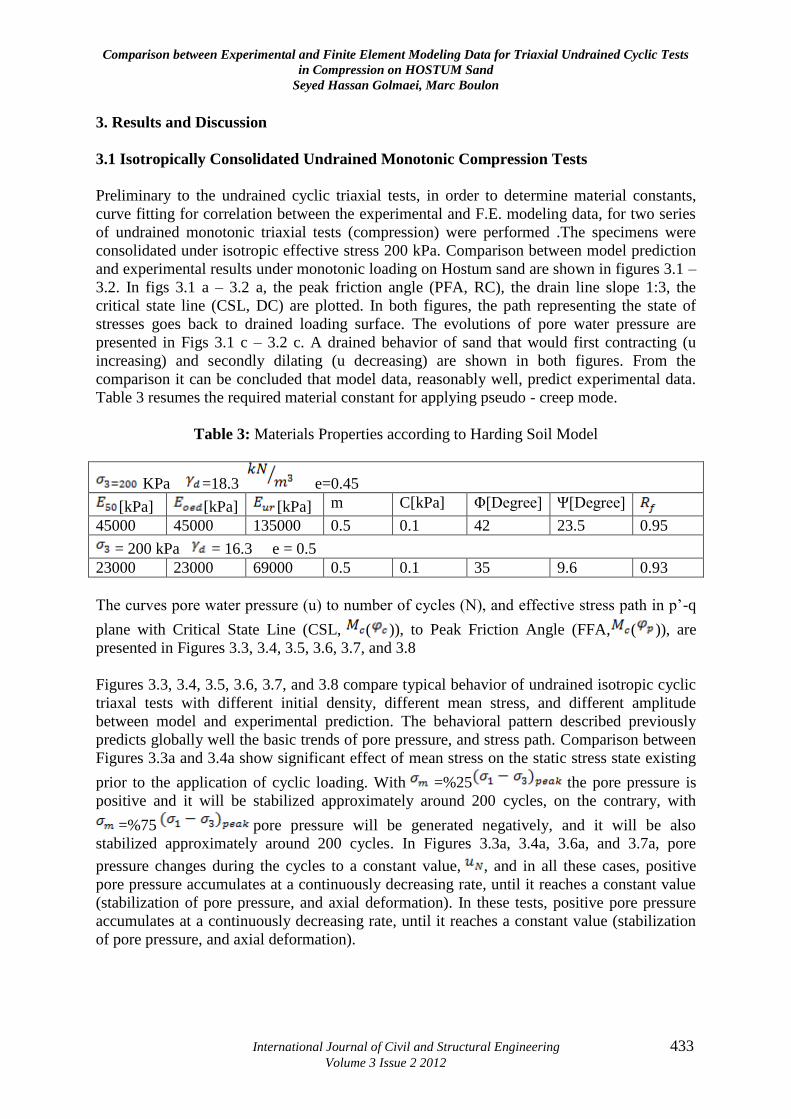
Table 3: Materials Properties according to Harding Soil Model
KPa =18.3 e=0.45
[kPa] [kPa] [kPa] m C[kPa] Φ[Degree] Ψ[Degree] 45000 45000 135000 0.5 0.1 42 23.5 0.95
= 200 kPa = 16.3 e = 0.5
23000 23000 69000 0.5 0.1 35 9.6 0.93
The curves pore water pressure (u) to number of cycles (N), and effective stress path in p‟-q
plane with Critical State Line (CSL, ( )), to Peak Friction Angle (FFA, ( )), are
presented in Figures 3.3, 3.4, 3.5, 3.6, 3.7, and 3.8
Figures 3.3, 3.4, 3.5, 3.6, 3.7, and 3.8 compare typical behavior of undrained isotropic cyclic
triaxal tests with different initial density, different mean stress, and different amplitude
between model and experimental prediction. The behavioral pattern described previously
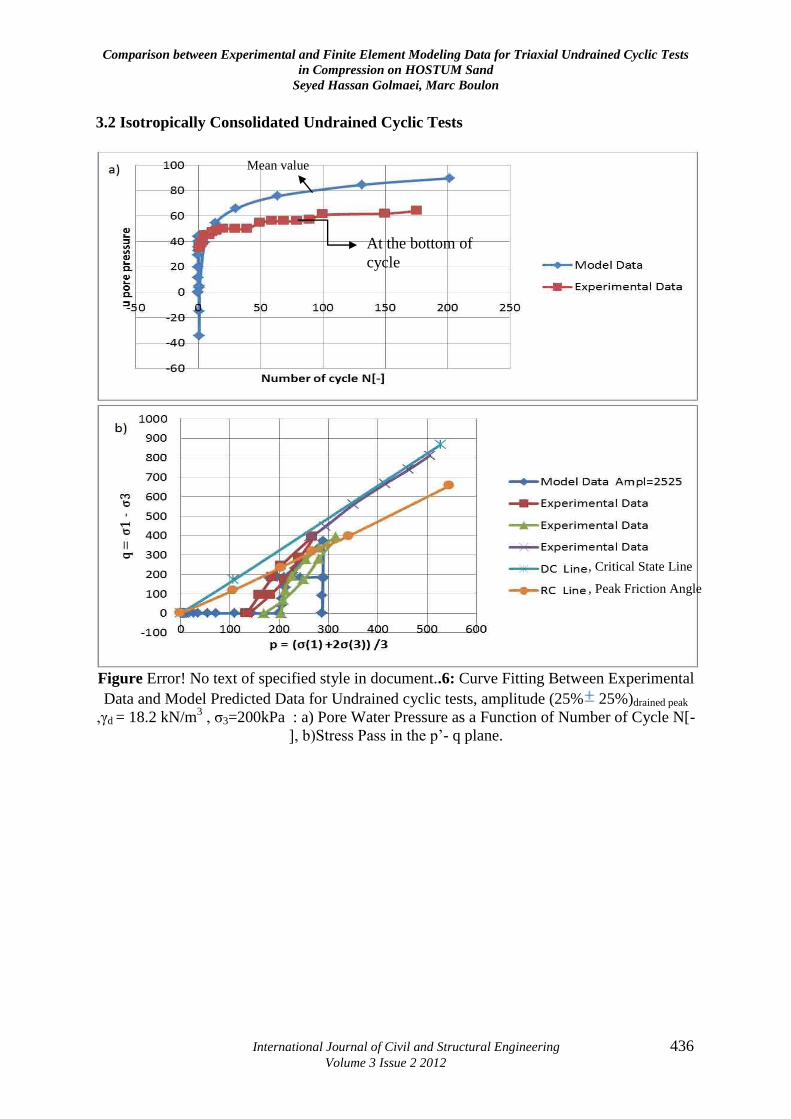
predicts globally well the basic trends of pore pressure, and stress path. Comparison between
Figures 3.3a and 3.4a show significant effect of mean stress on the static stress state existing
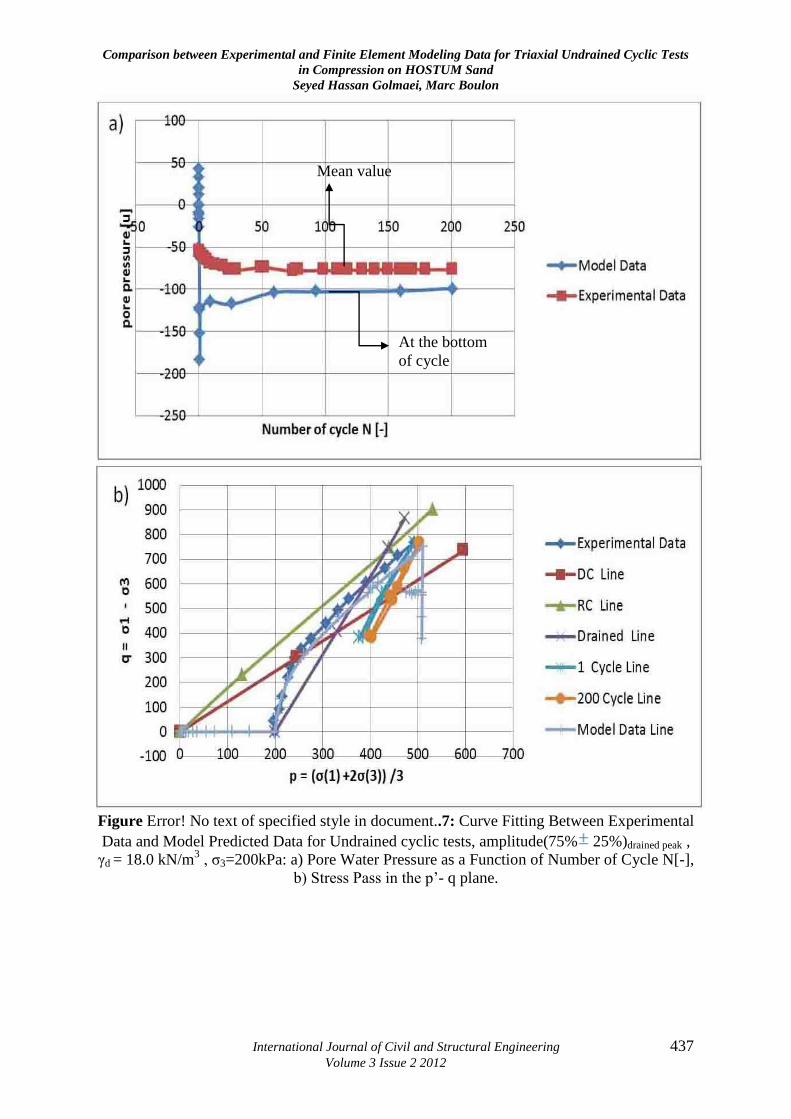
prior to the application of cyclic loading. With =%25 the pore pressure is
positive and it will be stabilized approximately around 200 cycles, on the contrary, with
=%75 pore pressure will be generated negatively, and it will be also
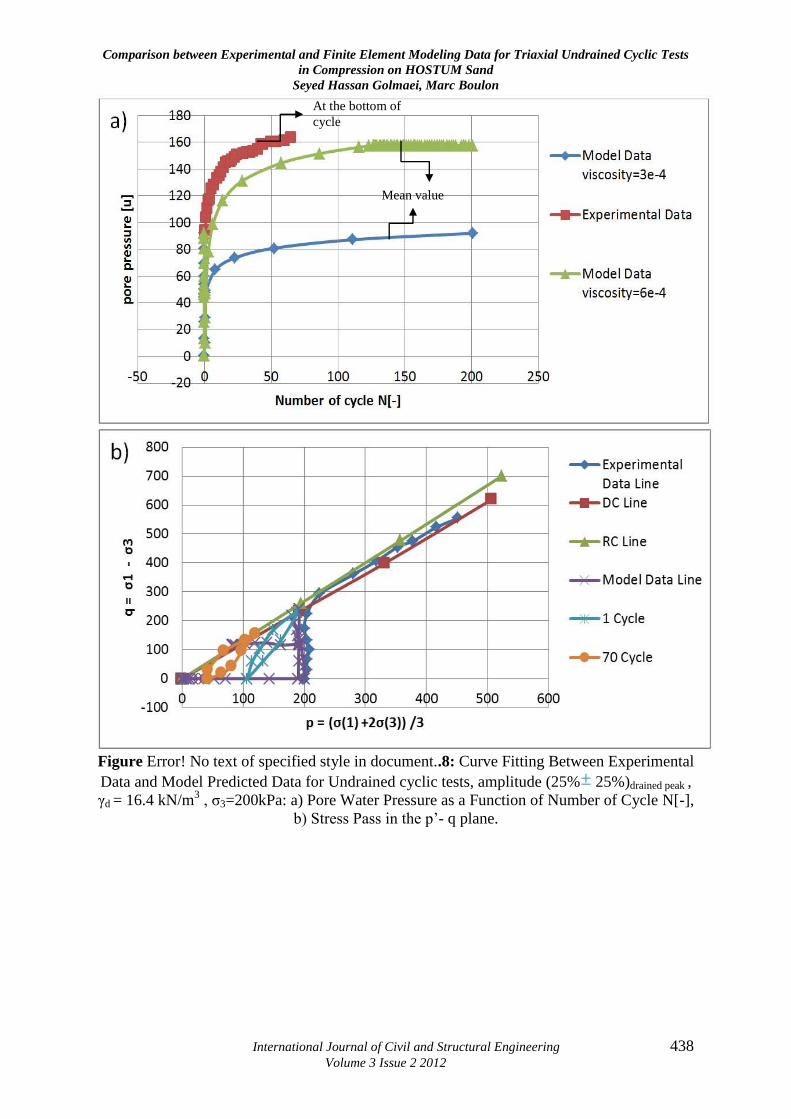
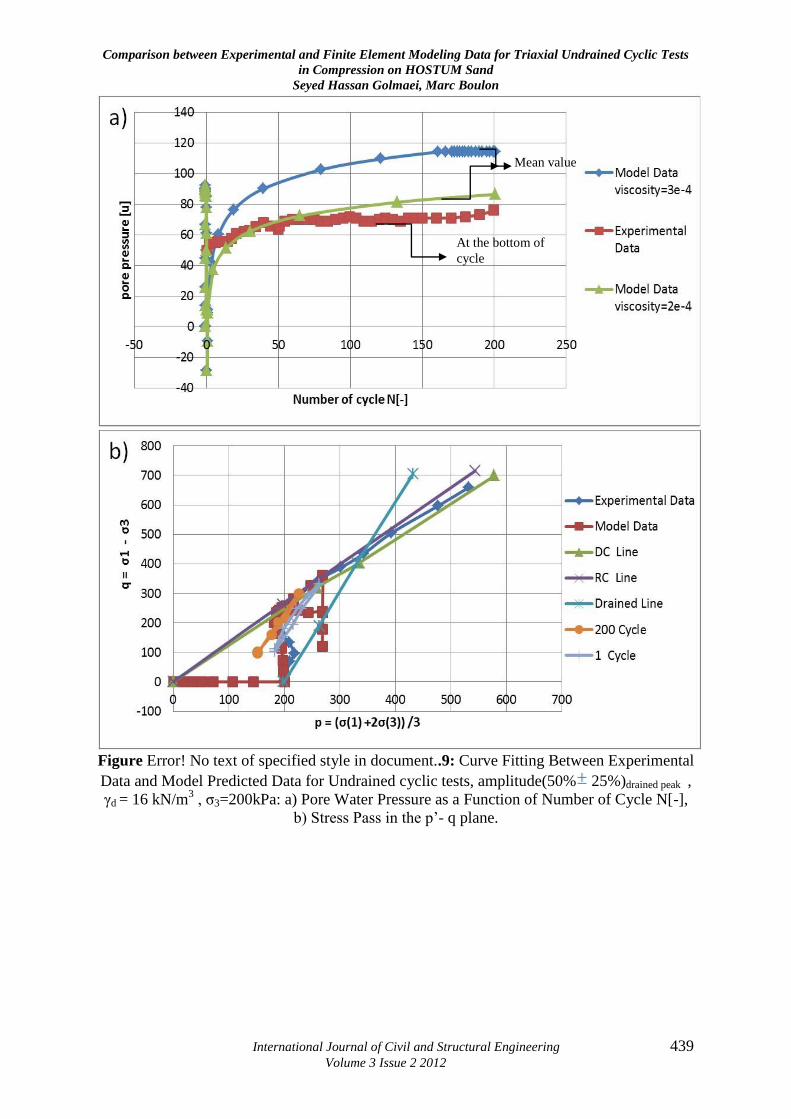
stabilized approximately around 200 cycles. In Figures 3.3a, 3.4a, 3.6a, and 3.7a, pore
pressure changes during the cycles to a constant value, , and in all these cases, positive
pore pressure accumulates at a continuously decreasing rate, until it reaches a constant value
(stabilization of pore pressure, and axial deformation). In these tests, positive pore pressure
accumulates at a continuously decreasing rate, until it reaches a constant value (stabilization
of pore pressure, and axial deformation).
Comparison between Experimental and Finite Element Modeling Data for Triaxial Undrained Cyclic Tests
in Compression on HOSTUM Sand
Seyed Hassan Golmaei, Marc Boulon
International Journal of Civil and Structural Engineering 434
Volume 3 Issue 2 2012
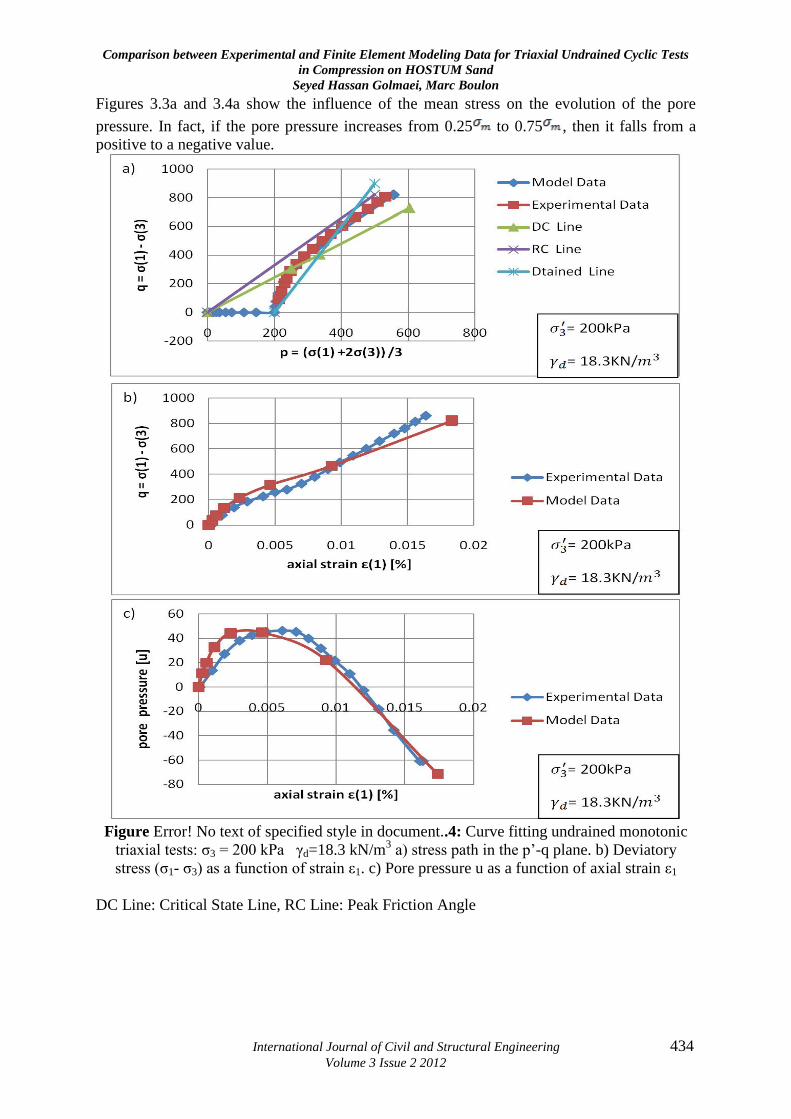
Figures 3.3a and 3.4a show the influence of the mean stress on the evolution of the pore
pressure. In fact, if the pore pressure increases from 0.25 to 0.75 , then it falls from a
positive to a negative value.
Figure Error! No text of specified style in document..4: Curve fitting undrained monotonic
triaxial tests: σ3 = 200 kPa γd=18.3 kN/m3 a) stress path in the p‟-q plane. b) Deviatory
stress (σ1- σ3) as a function of strain ε1. c) Pore pressure u as a function of axial strain ε1
DC Line: Critical State Line, RC Line: Peak Friction Angle
Comparison between Experimental and Finite Element Modeling Data for Triaxial Undrained Cyclic Tests
in Compression on HOSTUM Sand
Seyed Hassan Golmaei, Marc Boulon
International Journal of Civil and Structural Engineering 435
Volume 3 Issue 2 2012
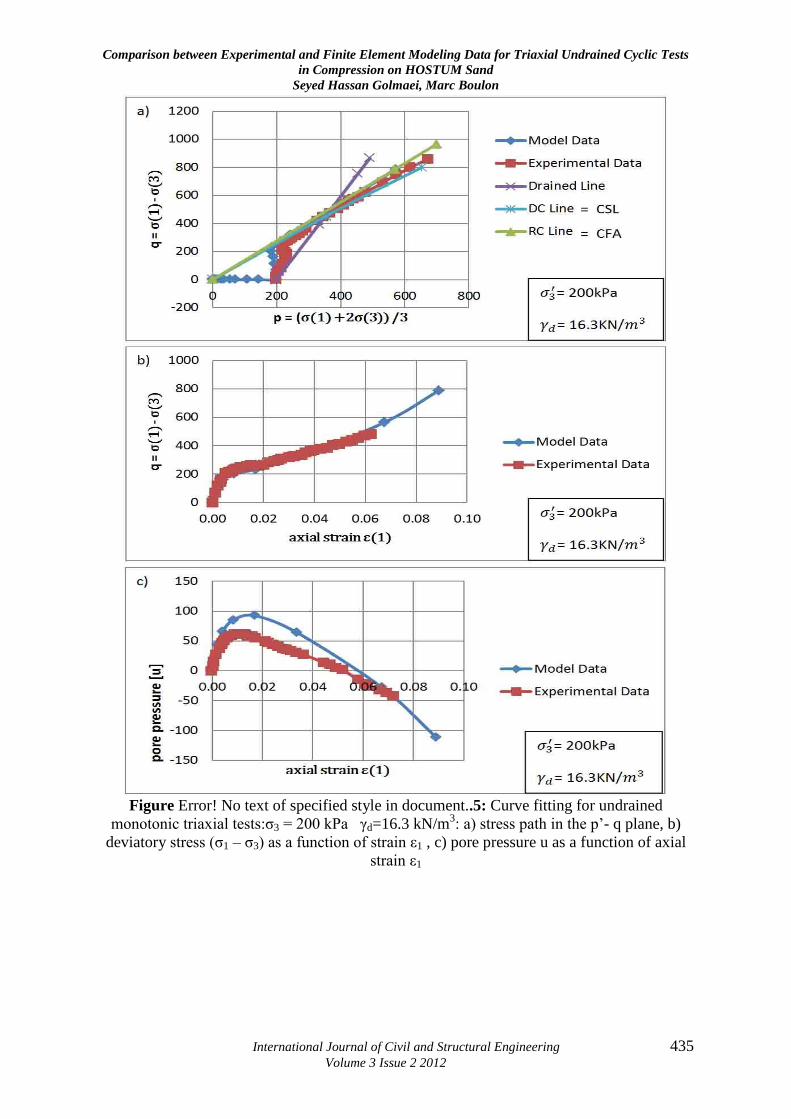
Figure Error! No text of specified style in document..5: Curve fitting for undrained
monotonic triaxial tests:σ3 = 200 kPa γd=16.3 kN/m3: a) stress path in the p‟- q plane, b)
deviatory stress (σ1 – σ3) as a function of strain ε1 , c) pore pressure u as a function of axial
strain ε1
Comparison between Experimental and Finite Element Modeling Data for Triaxial Undrained Cyclic Tests
in Compression on HOSTUM Sand
Seyed Hassan Golmaei, Marc Boulon
International Journal of Civil and Structural Engineering 436
Volume 3 Issue 2 2012
3.2 Isotropically Consolidated Undrained Cyclic Tests
Figure Error! No text of specified style in document..6: Curve Fitting Between Experimental
Data and Model Predicted Data for Undrained cyclic tests, amplitude (25% 25%)drained peak
,γd = 18.2 kN/m3 , σ3=200kPa : a) Pore Water Pressure as a Function of Number of Cycle N[-
], b)Stress Pass in the p‟- q plane.
At the bottom of
cycle
, Critical State Line
, Peak Friction Angle
Mean value
Comparison between Experimental and Finite Element Modeling Data for Triaxial Undrained Cyclic Tests
in Compression on HOSTUM Sand
Seyed Hassan Golmaei, Marc Boulon
International Journal of Civil and Structural Engineering 437
Volume 3 Issue 2 2012
Figure Error! No text of specified style in document..7: Curve Fitting Between Experimental
Data and Model Predicted Data for Undrained cyclic tests, amplitude(75% 25%)drained peak ,
γd = 18.0 kN/m3 , σ3=200kPa: a) Pore Water Pressure as a Function of Number of Cycle N[-],
b) Stress Pass in the p‟- q plane.
At the bottom
of cycle
Mean value
Comparison between Experimental and Finite Element Modeling Data for Triaxial Undrained Cyclic Tests
in Compression on HOSTUM Sand
Seyed Hassan Golmaei, Marc Boulon
International Journal of Civil and Structural Engineering 438
Volume 3 Issue 2 2012
Figure Error! No text of specified style in document..8: Curve Fitting Between Experimental
Data and Model Predicted Data for Undrained cyclic tests, amplitude (25% 25%)drained peak ,
γd = 16.4 kN/m3 , σ3=200kPa: a) Pore Water Pressure as a Function of Number of Cycle N[-],
b) Stress Pass in the p‟- q plane.
At the bottom of
cycle
Mean value
Comparison between Experimental and Finite Element Modeling Data for Triaxial Undrained Cyclic Tests
in Compression on HOSTUM Sand
Seyed Hassan Golmaei, Marc Boulon
International Journal of Civil and Structural Engineering 439
Volume 3 Issue 2 2012
Figure Error! No text of specified style in document..9: Curve Fitting Between Experimental
Data and Model Predicted Data for Undrained cyclic tests, amplitude(50% 25%)drained peak ,
γd = 16 kN/m3 , σ3=200kPa: a) Pore Water Pressure as a Function of Number of Cycle N[-],
b) Stress Pass in the p‟- q plane.
Mean value
At the bottom of
cycle
Comparison between Experimental and Finite Element Modeling Data for Triaxial Undrained Cyclic Tests
in Compression on HOSTUM Sand
Seyed Hassan Golmaei, Marc Boulon
International Journal of Civil and Structural Engineering 440
Volume 3 Issue 2 2012
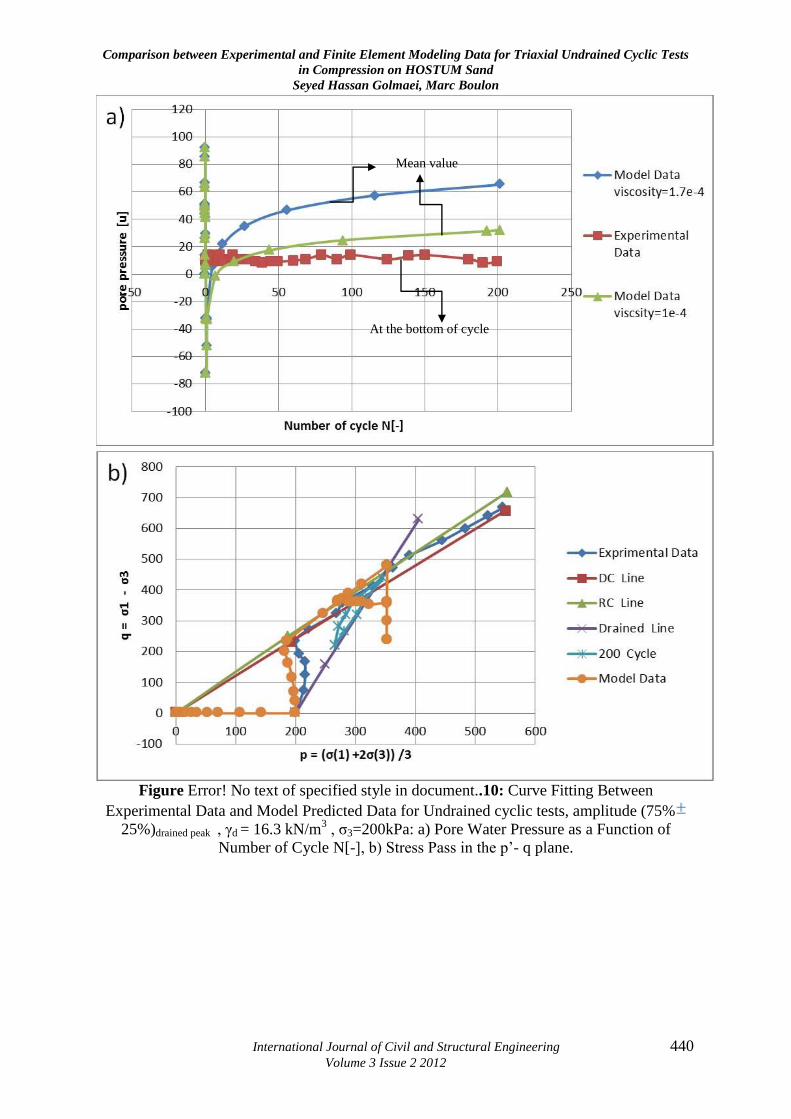
Figure Error! No text of specified style in document..10: Curve Fitting Between
Experimental Data and Model Predicted Data for Undrained cyclic tests, amplitude (75%
25%)drained peak , γd = 16.3 kN/m3 , σ3=200kPa: a) Pore Water Pressure as a Function of
Number of Cycle N[-], b) Stress Pass in the p‟- q plane.
Mean value
At the bottom of cycle

Comparison between Experimental and Finite Element Modeling Data for Triaxial Undrained Cyclic Tests
in Compression on HOSTUM Sand
Seyed Hassan Golmaei, Marc Boulon
International Journal of Civil and Structural Engineering 441
Volume 3 Issue 2 2012
Figure Error! No text of specified style in document..11: Curve Fitting Between
Experimental Data and Model Predicted Data for Undrained cyclic tests, amplitude (50%
50%)drained peak , γd = 16 kN/m3 , σ3=200kPa: a) Pore Water Pressure as a Function of Number
of Cycle N[-], b) Stress Pass in the p‟- q plane.
Acknowledgments
We are grateful to Mohammad Mahdi Jalali, Mohammad Reza Jalali, Bahram Farokhzad and
Mir Khalegh Ziatabar Ahmadi for their insightful comments and guidelines. We also express
our gratitude to GRENOBLE University laboratory under Marc Boulon management since
2010 till 2011.
Mean value
At the bottom of
cycle
Comparison between Experimental and Finite Element Modeling Data for Triaxial Undrained Cyclic Tests
in Compression on HOSTUM Sand
Seyed Hassan Golmaei, Marc Boulon
International Journal of Civil and Structural Engineering 442
Volume 3 Issue 2 2012
References
1. Bouckovolas, G. Whitman, R. V. and Marr, W. A. “Permanentdisplacement of
sand with cyclic loading”. Journal of the geotechnical engineering.vol.110, N 11,
pp. 1606-1623.
2. Ching, S. Chang, Member, ASCE, and Robert, V. Whitman, Fellow, ASCE
“Drained Permanent Deformation Of Sand Due To Cyclic Loading.” Journal of
Geotechnical Engineering, Vol. 114, No. 10, October, 1988, ASCE.
3. Messast, S. “Modelisation constitutive du comportementcyclique des sables en
coditiondrainee.” Rapport de Recherche, 2eme semester 2006, Dirige par: Boulon,
M. Prof. Emerite, Laboratoire Sols SolidesStructures(3S), Universite Joseph
Fourier, Laboratoire de Mathematique et de CaculScientifique (LARMACS),
Universite de Skikda.
4. Messast, S. Boulon, M. Flavigny, E. “Constitutive Modeling ofthe Cyclic
Behavior of the Sands in Drained Condition – Application toDense Sand.” 14eme
CRA MSG. Yaounde, 26-28 Novembre 2007.
5. Owen &Hinton “Elasto-Viscoplastic Problems in two dimensions.” Pp 271-281,
Pineridge press, Swansea, UK, 1986.
6. Plaxis, essential for geotechnical professionals, “Material Models Manual.” 2010.
7. Poblete, Mauro. Wichtmann, T.Niemunis, Andrez. Triantafyllidis, Thcodor.
“Accumulation of residual deformations due to cyclic loading with
multidimensional strain loops”. 5thinternational conference on earthquake
Geotechnical Engineering, January 2011, 10-13, Santiago, Chili.
8. Thanopoulos, I. “contribution a l‟etude du comportementcyclique des
milieuxpulverulent.” These Docteur-ingenieur, UniversiteScientifique et medical
&L‟institut national polytechnique de Grenoble, 1981.
9. Wichtmann, T. “Explicit accumulation model for non-cohesive soils under cyclic
loading”. PhD thesis, Bochum University, 2005.
10. Wichtmann, T. Niemunis, A. and Triandtafyllidis, Th. “Strain accumulation in
sand due to cyclic loading: drained triaxial tests.” Soil Dynamics and Engineering
(Vol. 25, No. 12, pp.967-979, 2005)
11. Wichtmann, T. Niemunis, A. and Triandtafyllidis, Th. “Strain accumulation in
sand due to cyclic loading: drained cyclic with triaxial extension.” Soil Dynamics
and Engineering, 2007, vol .27 No. 1, pp. 42-48.
12. PLAXIS version 8.5: a Finite Element code for soil.