comparison between niemann’s and finite element method...
TRANSCRIPT

American Journal of Engineering and Applied Sciences, 2012, 5 (2), 205-216
ISSN: 1941-7020
© 2014 K.G. Raptis et al., This open access article is distributed under a Creative Commons Attribution
(CC-BY) 3.0 license
doi:10.3844/ajeassp.2012.205.216 Published Online 5 (2) 2012 (http://www.thescipub.com/ajeas.toc)
205 Science Publications
AJEAS
Comparison Between Niemann’s and Finite Element Method for the
Estimation of Maximum Allowable Stress of Meshing Spur Gear
Teeth at Highest Point of Single Tooth Contact
Konstandinos G. Raptis, Theodore Ν. Costopoulos and Αndonios D. Tsolakis
Department of Mechanical Engineering, Laboratory of Machine Elements,
National Techical University of Athens, 9 Iroon Polytexneiou Av, GR-15780 Zografou, Athens, Greece
Received 2012-06-07, Revised 2012-08-27; Accepted 2012-08-27
ABSTRACT
Purpose of this study is the consideration of loading and contact problems encountered at rotating machine
elements and especially at toothed gears. The later are some of the most commonly used mechanical components
for rotary motion and power transmission. This fact proves the necessity for improved reliability and enhanced
service life, which require precise and clear knowledge of the stress field at gear tooth. This study investigates the
maximum allowable stresses occurring during spur gear tooth meshing computed using Niemann’s formulas at
Highest Point of Single Tooth Contact (HPSTC). Gear material, module, power rating and number of teeth are
considered as variable parameters. Furthermore, the maximum allowable stresses for maximum power
transmission conditions are considered keeping the other parameters constant. After the application of Niemann’s
formulas to both loading cases, the derived results are compared to the respective estimations of Finite Element
Method (FEM) using ANSYS software. Comparison of the results derived from Niemann’s formulas and FEM
show that deviations between the two methods are kept at low level for both loading cases independently of the
applied power (either random or maximum) and the respective tangential load.
Keywords: Highest Point of Single Tooth Contact (HPSTC), Finite Element Method (FEM)
1. INTRODUCTION
First systematic attempt to calculate the position of critically stressed point is attributed to Lewis (1882), who considered that the inscribed isosceles parabola tangent to the dedendum of the tooth flank defines the critically stressed point which is located at the point of tangency at the side which is loaded by tensile stresses.
The “30 degrees tangent” is another method which argues that the critically stressed point is independent of the load location. Instead, it is located at a specific point at the tooth root. Although this method is adopted the ISO standards, (Kawalec et al., 2006), it is approximate and applicable only to low stressed gears.
Methods, such as AGMA standard and DIN (Kawalec et al., 2006), Heywood’s semi-empirical method (Heywood, 1962) and Dolan-Broghamer’s (Dolan and Broghamer,1942) empirical formula, can be found at references and are recommended for the
determination of the precise stress level caused by the phenomenon of stress concentration at gear tooth root
According to method proposed by DIN 3990 1987 and ISO 6336 1996, standards the bending stresses calculation at gear tooth root is based on the concept of “30 degrees tangent” (Heywood, 1962), which proves to be a disadvantage. Thus, this method is quite approximate and should not be applied to the design of high loaded gearings.
Heywood’s method (Heywood, 1962), is applied for the determination of maximum real stress at critically stressed point at the root of a stubby beam with constant width. This method was later modified in order to make more precise prediction of the critical point which is located at a lower position from then on.
2. MATERIALS AND METHODS
The previously mentioned methods of maximum stress calculation at gear tooth root will not be applied at

Konstandinos G. Raptis et al. / American Journal of Engineering and Applied Sciences 5 (2) (2012) 205-216
206 Science Publications
AJEAS
the present study, because the determination of the necessary geometric features, especially at the critical region of gear tooth fillet which requires more precise computations, is a time-consuming procedure. Instead, the applied method assumes that the maximum load during gear tooth meshing is applied to the Highest Point of Single Tooth Contact (HPSTC), (Spitas et al., 2005).
2.1. Gear-Tooth Strength at the Critically
Stressed Point of Root
According to gearing theory, the total load ΡΝ applied to the gear tooth along contact path of the transverse tooth section can be seen at Fig. 1 and the tangential component of gear tooth load at pitch point C can be found using the following relation Eq. 1:
n ο on οNuP P cosβ P cosα cosβ= ⋅ = ⋅ ⋅ (1)
Assuming that gear tooth is a stubby cantilever beam fixed at dedendum circle, it can be easily seen that gear tooth loading is maximum when PN is applied at the addendum circle, as seen at Fig. 1.
When applied at the addendum circle, normal load ΡΝ
does not attain its maximum value. If we shift ΡΝ to point
M, which is located on the axis of symmetry of the gear
tooth, it can be resolved giving a tangential component
Eq. 2:
u NP P cosα'= ⋅ (2)
and a radial component Eq. 3:
R NP P sinα'= ⋅ (3)
At the critically stressed point, ΡU causes the
following bending moment Eq. 4:
B N fM = P e cosα' ⋅ ⋅ (4)
Resulting in a bending stress of Eq. 5:
Β N f
b 2
B οδ f
Μ P e cosα΄σ
W b s / 6
⋅ ⋅= ± = ±
⋅
(5)
and a shear stress τ∆ (positioned at the critical point bοδ
ef ) Eq. 6:
N
∆
οδ f
τ
P cosα΄=
b s
⋅
⋅
(6)
while ΡR causes a compressive stress Eq. 7:
N
d
οδ f
σ
P sinα΄= -
b s
⋅
⋅
(7)
Fig. 1. Gear tooth loading
Shear stress, compared to the bending and compressive stresses which are collinear and normal to the shear stress, is small enough and can be neglected. The maximum normal stress is the compressive one with a value of Eq. 8:
max b dσ = σ + σ (8)
Or Eq. 9:
N N
max 2
f f
6 P e cosa P sinafσ
b s b soδ oδ
⋅ ⋅ ⋅ ⋅= +
⋅ ⋅
΄ ΄ (9)
As gear thickness b is related to gear tooth length boδ
with the following relation Eq. 10:
oδ οb b cosβ= ⋅
(10)
And according to the previous discussion, we can
obtain the following result Eq. 11:
u k
max
P qσ =
b m
⋅
⋅
(11)
Where Eq. 12:

Konstandinos G. Raptis et al. / American Journal of Engineering and Applied Sciences 5 (2) (2012) 205-216
207 Science Publications
AJEAS
n f f
k
f on
m (6 e cosα' / s + sinα΄)q =
s cosα
⋅ ⋅ ⋅
⋅
(12)
Coefficient qk depends on the number of pinion teeth
and rack cutter shift during pinion generation.
In order to take into account the meshing of more than
one tooth pairs when the load is applied at the addendum
circle, we introduce the overlap coefficient or contact ratio
for the transverse tooth section at Eq. 11. Thus Eq. 13:
u k
max επ
P qσ = σ
b ε m
⋅≤
⋅ ⋅
(13)
where, σεπ is the allowable stress for the critical point,
which depends on gear material, tangential velocity at
pitch point and gear meshing mode. In more detail.
For a tangential velocity at pitch point lower than or
equal to 5 m sec−1
, we have Eq. 14:
B
επ
σσ =
2 3⋅ ⋅ ⋅
(14)
For a tangential velocity at pitch point greater than 5
m/sec and a single trend of rotation, we have Eq. 15:
bw
επ
σσ
1,5....2= (15)
Where:
σΒ = The tensile strength of gear material
σbw = The bending strength of gear material
2.2. Highest Point of Single Tooth Contact (HPSTC) During Tooth Meshing
It is proven that the normal load PN on a gear tooth is not maximum when applied at the addendum circle. As shown in Fig. 2 during gear tooth meshing, from point A where tooth contact begins to point Α΄ of tooth contact path and from point Β΄ to point Β, where tooth contact completes, two pairs of teeth are in contact simultaneously. On the other hand, between points Α΄ and Β΄ only a single tooth pair is in contact subjected to the total load.
It can, thus, be assumed that the worst loading condition for a tooth of gear 1 does not occur when the load is applied to the highest addendum point (point B), because the total load is distributed at two pairs of gear teeth at this point, but at point Β΄ of contact path where only a single pair of gear teeth is meshing (Niemann, 1982; Spitas et al., 2005).
Point Α΄ is defined The Lowest Point of Single Tooth
Contact (LPSTC) and point Β΄ is the Highest Point of
Single Tooth Contact (HPSTC) for gear 1.
Fig. 2. (a) Meshing teeth profiles of a gear transmission stage
(b) Positions of tooth load variation
Fig. 3. Geometric determination of HPSTC
That is, during portion Α΄Β΄ of the contact path only a single tooth of each gear is loaded, whereas during portions ΑΑ΄ and ΒΒ΄ the load is distributed to two teeth of each gear. Thus, we can infer that the maximum gear tooth loading occurs at a point on part Α΄Β΄ of the contact path (Spitas et al., 2005).

Konstandinos G. Raptis et al. / American Journal of Engineering and Applied Sciences 5 (2) (2012) 205-216
208 Science Publications
AJEAS
Determination of the point of maximum stresses during gear meshing (Fig. 3) is as follows:
gΑΒ ε t AC CB= ⋅ += (16)
( )2 2 2
o2 02 ο 002ΑC r m r cos α r sinα= + − ⋅ − ⋅ (17)
( )2 2 2
01 01 0 001ΒC r m r cos α r sinα= + − ⋅ − ⋅ (18)
Substituting Eq. (17) and (18) to Eq. (16) results Eq. 19:
( )
( ) ( )
2 2 2
o2 02 ο
2 2 2
01 01 0 01 02 0
ΑΒ r m r cos α
r m r cos α r r sin α
= + − ⋅
+ + − ⋅ − + ⋅
(19)
HPSTC is located at point Β΄. During parts AΑ΄ and
Β΄B of the contact path, load is transmitted through two pairs of gear teeth, while during part Α΄Β΄ only a single pair of gear teeth is subjected to the total load. The lengths of parts AΒ΄ and Α΄B equal the gear circular pitch, tg, at the base circle. Thus, position of HSPTC is determined according to Fig. 3 as follows Eq. 20 and 21:
( )2
2 2
02 02 0 02 0AC r m r cos α r sinα= + − ⋅ − ⋅ (20)
0gCB' AB' AC t AC π m cosα AC= − = = ⋅ ⋅ −− (21)
Using triangle O1Β΄C, radius rΒ΄ can be calculated according to the following Eq. 22:
( )2 '2 0
B' 01 01 0r r CB 2 r CB' cos α 90= + − ⋅ ⋅ ⋅ + (22)
Cartesian coordinates of point H are: (x, y) = (rΒ΄ sinφ, rΒ΄ cosφ).
2.2. Application of Niemann’s Formulas
Next we will investigate the deviation between results of the referenced maximum stress formulas and
computerized results of the finite element method. For this purpose, tangential load Ρu is applied to the highest point of single tooth contact during gear tooth meshing.
Ten different gear materials with increasing quality are assumed, starting from GS 52 and resulting to 42 Cr V6. Number of pinion teeth is constant z1 = 18, while ten sets of parameter are considered:
Number of gear teeth: z2 = 20, 50, 80 and 100
Module: m = 1, 2, 3, 4, 5 and 6 mm
Tooth length: b1 = 10, 20, 30, 40 and 50 mm
Input power: PW = 10, 18, 27, 34, 42, 53, 58,
63, 65 and 70 kW The previous sets of parameter values are identical
for each type of gear material. Next, maximum stress for each set is calculated. Table
1-3 show the detailed results for three types of gear materials, while Table 4 gathers the results derived for all gear materials.
For the determination of tangential load Pu applied to the highest point of single tooth contact during gear tooth meshing, the above parameters (m, b1, z1, z2, Ρw) are set to MITCalc software for each gear material and the value of load are computed automatically. This value is identical for each gear material assuming a common parameter set.
Using Eq. (13), (14) and (15), we determine the allowable and the maximum stress, depending on the ultimate tensile strength of each material. It was found that the maximum stress is constant for a common set of parameters and independent of the value of maximum allowable stress, which generally is different for each material.
The maximum allowable stress increases with material quality. Thus, the values of maximum stresses reach the values of the maximum allowable stress.
Using, then, MITCalc software, we import pinion geometry of each material to Solid Works software. Next, the solid model is imported to ANSYS FEM software and the maximum stress at gear tooth root is computed using the finite element method.
Table 1. Deviation between Niemann’s method results and FEM (ANSYS) results assuming GS-52 gear material and random
transmitted power
Gear Module Pw PU σεπ σmax ANSYS material (mm) Z2 (kW) (Nt) (Nt/mm2) (Nt/mm2) (Nt/mm2) %
GS 52 1 30 10 10.611,11 200 1.885,79 1.854,00 1.72 2 50 18 9.500,00 200 432,81 425,454 1.73 2 80 27 14.325,00 200 412,70 408,265 1.09 3 100 34 12.025,93 200 199,69 202,509 -1.39 3 100 42 14.855,56 200 173,05 175,304 -1.28 4 80 53 14.059,72 200 149,31 147,224 1.41 5 30 58 12.308,89 200 211,89 209,550 1.12 5 50 63 13.370,00 200 440,41 433,936 1.49 6 80 65 11.495,37 173,33 157,28 159,777 -1.56 6 100 70 12.379,63 173,33 83,37 82,198 1.43

Konstandinos G. Raptis et al. / American Journal of Engineering and Applied Sciences 5 (2) (2012) 205-216
209 Science Publications
AJEAS
Table 2. Deviation between Niemann’s method results and FEM (ANSYS) results assuming Gk-60 gear material and random
transmitted power Gear Module Pw PU σεπ σmax ANSYS material (mm) Z2 (KW) (Nt) (Nt/mm2) (Nt/mm2) (Nt/mm2) %
Ck 60 1 30 10 10.611,11 296,00 1.885,79 1.854,00 1.72 2 50 18 9.500,00 296,00 432,81 425,454 1.73 2 80 27 14.325,00 296,00 412,70 408,265 1.09 3 100 34 12.025,93 296,00 199,69 202,509 -1.39 3 100 42 14.855,56 296,00 173,05 175,304 -1.28 4 80 53 14.059,72 296,00 149,31 147,224 1.41 5 30 58 12.308,89 296,00 211,89 209,550 1.12 5 50 63 13.370,00 296,00 440,41 433,936 1.49 6 80 65 11.495,37 293,33 157,28 159,777 -1.56 6 100 70 12.379,63 293,33 83,37 82,198 1.43
Table 3. Deviation between Niemann’s method results and FEM (ANSYS) results assuming 35CrMo4 gear material and random
transmitted power Gear Module Pw PU σεπ σmax ANSYS material A(mm) Z2 (kW) (Nt) (Nt/mm2) (Nt/mm2) (Nt/mm2) %
35 CrMo4 1 30 10 10.611,11 352,00 1.885,79 1.854,00 1.72 2 50 18 9.500,00 352,00 432,81 425,454 1.73 2 80 27 14.325,00 352,00 412,70 408,265 1.09 3 100 34 12.025,93 352,00 199,69 202,509 -1.39 3 100 42 14.855,56 352,00 173,05 175,304 -1.28 4 80 53 14.059,72 352,00 149,31 147,224 1.41 5 30 58 12.308,89 352,00 211,89 209,550 1.12 5 50 63 13.370,00 352,00 440,41 433,936 1.49 6 80 65 11.495,37 456,66 157,28 159,777 -1.56 6 100 70 12.379,63 456,66 83,37 82,198 1.43
Table 4. Review of deviation between Niemann’s and FEM results for ten different gear materials and random power rating Gear Module Pw PU σεπ σmax ANSYS material (mm) Z2 (kW) (Nt) (Nt/mm2) (Nt/mm2) (Nt/mm2) %
GS 52 1 30 10 10.611,11 200 1.885,79 1.854,00 1.72 St 70 2 50 18 9.500,00 274.4 432,81 425,454 1.73 36 Mn5 2 80 27 14.325,00 280,00 412,70 408,265 1.09 Ck 60 3 100 34 12.025,93 296,00 199,69 202,509 -1.39 37 Cr 4 3 100 42 14.855,56 314,00 173,05 175,304 -1.28 42 Mnv7 4 80 53 14.059,72 320,00 149,31 147,224 1.41 35 CrMo4 5 30 58 12.308,89 352,00 211,89 209,550 1.12 31 NiCr14 5 50 63 13.370,00 372,00 440,41 433,936 1.49 34CrNiMo6 6 80 65 11.495,37 500,00 157,28 159,777 -1.56 42CrV6 6 100 70 12.379,63 566,66 83,37 82,198 1.43
Examples of the derived results using FEM are shown in Fig. 4-7, regarding GG 52, Ck 60, 36Mn 5 and 35GrMo4 gear materials respectively.
Comparison of the results between the applied
methods (Niemann’s formulas and FEM) shows a
deviation from-1.56 % to+1.73%. This % deviations are
common for each material assuming a constant of
parameter values, as can be seen at Table 1-4 in detail. Figure 8 shows a diagram of maximum stress versus
gear tooth length resulting from the concentrated results of Table 4.
Then, using trial and error method and MITCal software we find for each material the maximum
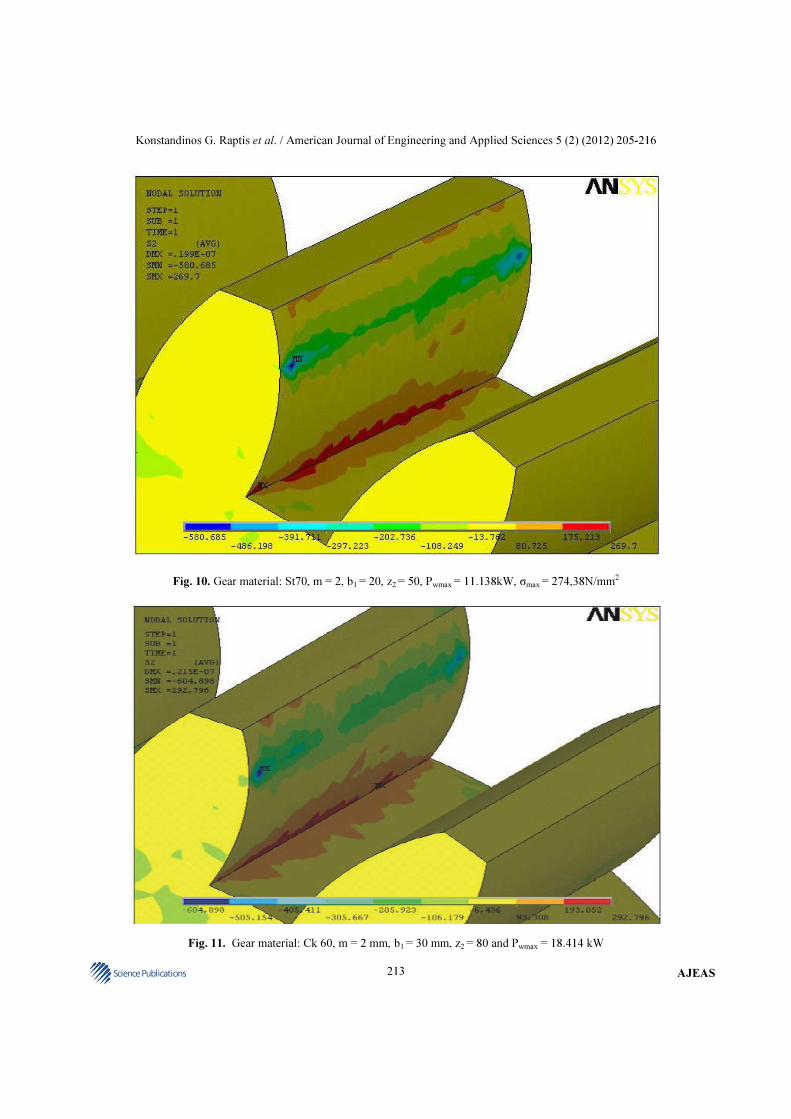
allowable power Pmax, such that the maximum stress equals allowable stress. Figure 9-12 are some examples of finite element analyses assuming GG 52, St 70, Ck 60 and 5CrMo4 gear materials, respectively.
Application of the former procedure shows that deviation between the results of maximum stress using Niemann’s formulas (Niemann, 1982) and FEM (using ANSYS) lie in the range from 1.56% to + 1.73%. This percentages are identical for each material with a common set of parameters as can be seen at Table 5-8.
Using the results of Table 8, we can create a diagram
of maximum allowable stress versus maximum rated
power, as shown in Fig. 13.

Konstandinos G. Raptis et al. / American Journal of Engineering and Applied Sciences 5 (2) (2012) 205-216
210 Science Publications
AJEAS
Fig. 4. Gear material: GG52, m = 1, b1 = 10, z2 = 30, Pw = 10KW, σmax = 1885,79 N/mm2
Fig. 5. Gear material: Ck 60, m = 2, b1=20, z2 = 50, Pw = 18KW, σmax = 432,81 N/mm2

Konstandinos G. Raptis et al. / American Journal of Engineering and Applied Sciences 5 (2) (2012) 205-216
211 Science Publications
AJEAS
Fig. 6. Gear material: 36Mn 5, m = 2 mm , b1 = 30 mm, z2 = 80 και Pw = 27 KW
Fig. 7. Gear material: 35CrMo4, m = 5 mm , b1 = 20 mm, z2 = 30 και Pw = 58 KW

Konstandinos G. Raptis et al. / American Journal of Engineering and Applied Sciences 5 (2) (2012) 205-216
212 Science Publications
AJEAS
Fig. 8. Diagram of maximum stress (σmax) versus gear tooth length (b)
Fig. 9. Gear material: GS 52, m = 1, b1 = 10, z2 = 30, Pwmax= 0.983kW, σmax= 199,92 N/mm2
Konstandinos G. Raptis et al. / American Journal of Engineering and Applied Sciences 5 (2) (2012) 205-216
213 Science Publications
AJEAS
Fig. 10. Gear material: St70, m = 2, b1 = 20, z2 = 50, Pwmax = 11.138kW, σmax = 274,38N/mm2
Fig. 11. Gear material: Ck 60, m = 2 mm, b1 = 30 mm, z2 = 80 and Pwmax = 18.414 kW

Konstandinos G. Raptis et al. / American Journal of Engineering and Applied Sciences 5 (2) (2012) 205-216
214 Science Publications
AJEAS
3. RESULTS
Consideration of the diagram shown in Fig. 8 as well
as Table 1-4 derives the following conclusions:
• Maximum stress (σmax) decreases as module (m)
increases
• Maximum stress (σmax) decreases as gear thickness
(b) increases and vice versa
• Tangential load (Pu) decreases as module (m)
increases, whereas as module (m) decreases
tangential load (Pu) increases
Consideration of the diagram shown in Fig. 13 as well as Table 5-8 derives the following conclusions:
• Increase of both pinion thickness (b) and module
(m) causes an increase of maximum rated power (Pwmax)
• Maximum rated power (Pwmax) decreases as pinion thickness (b) decreases, regardless of the module (m) increase
• Maximum rated power (Pwmax) is different for each material and increases with enhanced material quality due to an increase in the maximum allowable stress (σεπ)
Fig. 12. Gear material: 35CrMo4, m = 4mm, b1 = 40mm, z2=80 and Pwmax = 116.789 kW Table 5. Deviation between Niemann’s method results and FEM (ANSYS) results assuming GS-52 gear material and maximum
rated power
Gear Module Pw max PU σεπ σmax ANSYS
material (mm) Z2 (kW) (N) (N/mm2) (N/mm2) (N/mm2) %
GS 52 1 30 0,983 1.043,28 200 199,92 196,549 1.72
2 50 8,118 4.307,05 200 199,98 196,592 1.73
2 80 12,442 6.601,17 200 200,00 197,840 1.09
3 100 37,621 13.306,69 200 200,00 202,817 -1.39
3 100 47,027 16.633,62 200 200,00 202,600 -1.28
4 80 66,357 17.603,04 200 200,00 197,212 1.41
5 30 49,178 10.436,66 200 200,00 197,775 1.12
5 50 25,370 5.384,08 200 199,99 197,054 1.49
6 80 64,697 11.441,78 173,33 173,33 176,083 -1.56
6 100 130,420 23.065,02 173,33 173,33 170,891 1.43

Konstandinos G. Raptis et al. / American Journal of Engineering and Applied Sciences 5 (2) (2012) 205-216
215 Science Publications
AJEAS
Table 6. Deviation between Niemann’s method results and FEM (ASNYS) results assuming Ck-60 gear material and maximum
rated power
Gear Module Pw max PU σεπ σmax ANSYS material (mm) Z2 (kW) (N) (N/mm2) (N/mm2) (N/mm2) %
Ck 60 1 30 1,455 1.543,92 296,00 295,86 290,860 1.72 2 50 12,015 6.374,63 296,00 295,98 290,951 1.73 2 80 18,414 9.769,65 296,00 296,00 292,796 1.09 3 100 55,681 19.694,58 296,00 296,00 300,175 -1.39 3 100 69,600 24.617,78 296,00 296,00 299,835 -1.28 4 80 98,209 26.052,67 296,00 296,00 291,885 1.41 5 30 72,784 15.446,38 296,00 296,00 292,722 1.12 5 50 37,549 7.968,73 296,00 296,00 291,655 1.49 6 80 109,489 19.363,33 293,33 293,33 297,980 -1.56 6 100 220,713 39.033,50 293,33 293,33 289,195 1.43
Table 7. Deviation between Niemann’s method results and FEM (ASNYS) results assuming 35CrMo4 gear material and maximum
rated power
Gear Module Pw max PU σεπ σmax ANSYS material (mm) Z2 (kW) (N) (N/mm2) (N/mm2) (N/mm2) %
35 CrMo4 1 30 1,731 1.836,78 352,00 351,98 346,032 1.72 2 50 14,289 7.581,11 352,00 352,00 346,017 1.73 2 80 21,898 11.618,11 352,00 352,00 348,206 1.09 3 100 66,215 23.420,49 352,00 352,00 356,964 -1.39 3 100 82,769 29.275,70 352,00 352,00 356,567 -1.28 4 80 116,789 30.981,53 352,00 352,00 347,100 1.41 5 30 86,554 18.368,68 352,00 352,00 348,102 1.12 5 50 44,653 9.476,36 352,00 352,00 346,834 1.49 6 80 170,454 30.145,11 456,66 456,66 463,899 -1.56 6 100 343,609 60.767,89 456,66 456,66 450,222 1.43
Table 8. Review of deviations between Niemann’s and FEM results for ten different gear materials and maximum rated power
Gear Module Pw max PU σεπ σmax ANSYS material (mm) Z2 (kW) (N) (N/mm2) (N/mm2) (N/mm2) %
GS 52 1 30 0,983 1.043,28 200 199,92 196,549 1.72 St 70 2 50 11,138 5.909,33 274.4 274,38 269,700 1.73 36 Mn5 2 80 17,419 9.241,75 280,00 280,00 276,984 1.09 Ck 60 3 100 55,681 19.694,58 296,00 296,00 300,175 -1.39 37 Cr 4 3 100 73,833 26.115,01 314,00 314,00 318,071 -1.28 42 Mnv7 4 80 106,172 28.165,07 320,00 320,00 315,551 1.41 35 CrMo4 5 30 86,554 18.368,68 352,00 352,00 348,102 1.12 31 NiCr14 5 50 47,190 10.014,77 372,00 372,00 366,540 1.49 34CrNiMo6 6 80 186,630 33.005,86 500,00 500,00 507,923 -1.56 42CrV6 6 100 426,377 75.405,56 566,66 566,66 558,671 1.43
Fig. 13. Diagram of maximum allowable stress (σεπ) versus power (Pw) and maximum rated power (Pwmax)

Konstandinos G. Raptis et al. / American Journal of Engineering and Applied Sciences 5 (2) (2012) 205-216
216 Science Publications
AJEAS
Fig. 14. Concentrating diagram of maximum stress (σmax) deviation between Niemann’s estimations and finite element results
From the previous considerations it was derived that
deviations between the results of maximum allowable stresses (σmax) calculated using theoretical methods and the Finite Element Method (FEM) with application of ANSYS software are commonly ranged between-1.56% and+.73%, regardless of the transmitted power (random or maximum) and the respective tangential load, as shown in Table 1-6 as well as in concentrating Table 4-8 and Fig. 14.
4. DISCUSSION
Apart from the fatigue failure at the critically stressed point, small cracks at tooth surface have been observed at gear pitch circle (where the gear tooth is subjected to the total load), due to high pressure surface fatigue. Low viscosity lubricants can enter the cracks at high pressures. These initially small cracks can easily grow under the effect of high pressures of penetrating fluids, causing surface fatigue cracks or pitting. Therefore, it is critical to take into account the surface fatigue strength of gear during the design procedure.
5. CONCLUSION
This study investigated the minimum deviation of
maximum allowable stress estimations at highest point of
single tooth contact of meshing spur gear teeth using
Niemann’s formulas and finite element method with
application of ANSYS software. Number of gear teeth,
module and transmitted power were considered as variable
parameters. For both loading cases (random and maximum
transmitted power), common sets of other parameters (m,
z1, z2, material) derived identical deviations.
After comparison of the derived results using the discussed methods for both cases, it was concluded that deviations are acceptable, which is reasonable considering the potential errors that can be involved during the procedure.
6. REFERENCES
Dolan, T.J. and E.L. Broghamer, 1942. A photo-elastic
study of stress in gear tooth fillets. Univ. Ill. Bull.
Heywood, R.B., 1962. Designing Against Fatigue of
Metals. 1st Edn., Reinhold, New York, pp: 436.
Kawalec, A., J. Wiktor and D. Ceglarek, 2006.
Comparative analysis of tooth-root strength using
ISO and AGMA standards in spur and helical gears
with FEM-based verification. J. Mech. Des., 128:
1141-1158. DOI: 10.1115/1.2214735
Lewis, W., 1882. Investigation of the strength of gear
teeth. Proceedings of the Engineering Club No. 1,
(FC’ 82), Philadelphia, pp: 16-23.
Niemann, G., 1982. Machine Elements: Gears. 1st Edn.,
Springer-Varlag, Berlin, ISBN: 3540033785.
Spitas, V., T.H. Costopoulos and C. Spitas, 2005.
Increasing the strength of standard involute gear
teeth with novel circular root fillet design. Am. J.
Applied Sci., 2: 1058-1064. DOI:
10.3844/ajassp.2005.1058.1064