comparison of architectures and performance of …oa.upm.es/39346/1/rohit_madhukar_dhamane.pdf ·...
TRANSCRIPT

DEPARTAMENTO DE LENGUAJES YSISTEMAS INFORMÁTICOS E INGENIERÍA DE SOFTWARE
Facultad de InformáticaUniversidad Politécnica de Madrid
Ph.D. Thesis
Comparison of Architectures and Performanceof Database Replication Systems
Author
Rohit Madhukar Dhamane
Ph.D. supervisor
Marta Patiño-MartínezPh.D. Computer Science
January 2016


Thesis Committee
Chairman:
Secretary:
Member:
Member:
Member:


Acknowledgements
Firstly, I would like to express my sincere gratitude to my advisor Dr. Marta Patiño-Martínez for
the continuous support of my Ph.D study and related research, for her patience, motivation, and
immense knowledge. Her guidance helped me in all the time of research and writing of this thesis.
I would also like to express my gratitude towards Dr. Ricardo Jiménez-Peris under whom I received
the Erasmus Mundus Fellowship to start my PhD program and his guidance during my research. I
am grateful to senior researcher Dr. Valerio Vianello, labmate Iván Brondino who helped me through
discussions, experiments and understanding of the subject and Ms. Alejandra Moore for taking care of
administrative duties regarding my PhD. I will always cherish the good time I had with my colleagues
during PhD.
Last but not the least I would like to thank my family for their sacrifices, supporting me throughout
writing this thesis and my life in general. I couldn’t have done it without their immeasurable support.


Abstract
One of the most demanding needs in cloud computing and big data is that of having scalable and
highly available databases. One of the ways to attend these needs is to leverage the scalable replica-
tion techniques developed in the last decade. These techniques allow increasing both the availability
and scalability of databases. Many replication protocols have been proposed during the last decade.
The main research challenge was how to scale under the eager replication model, the one that provides
consistency across replicas. This thesis provides an in depth study of three eager database replica-
tion systems based on relational systems: Middle-R, C-JDBC and MySQL Cluster and three systems
based on In-Memory Data Grids: JBoss Data Grid, Oracle Coherence and Terracotta Ehcache. Thesis
explore these systems based on their architecture, replication protocols, fault tolerance and various
other functionalities. It also provides experimental analysis of these systems using state-of-the art
benchmarks: TPC-C and TPC-W (for relational systems) and Yahoo! Cloud Serving Benchmark (In-
Memory Data Grids). Thesis also discusses three Graph Databases, Neo4j, Titan and Sparksee based
on their architecture and transactional capabilities and highlights the weaker transactional consisten-
cies provided by these systems. It discusses an implementation of snapshot isolation in Neo4j graph
database to provide stronger isolation guarantees for transactions.


Declaration
I declare that this Ph.D. Thesis was composed by myself and that the work contained therein is my
own, except where explicitly stated otherwise in the text.
(Rohit Madhukar Dhamane)


Table of Contents
Table of Contents i
List of Figures v
List of Tables xi
I INTRODUCTION 1
Chapter 1 Introduction 3
1.1 Motivation . . . . . . . . . . . . . . . . . . . . . . . . . . . . . . . . . . . . . . . . 3
1.2 Goals and Objectives . . . . . . . . . . . . . . . . . . . . . . . . . . . . . . . . . . 4
1.3 Thesis outline . . . . . . . . . . . . . . . . . . . . . . . . . . . . . . . . . . . . . . 5
II Background 9
Chapter 2 Background 11
2.1 Databases . . . . . . . . . . . . . . . . . . . . . . . . . . . . . . . . . . . . . . . . 11
2.2 Database Replication . . . . . . . . . . . . . . . . . . . . . . . . . . . . . . . . . . 12
III Related Work 17
Chapter 3 Related Work 19
3.1 RDBMS Data Replication . . . . . . . . . . . . . . . . . . . . . . . . . . . . . . . 19
3.2 In-Memory Data Grids . . . . . . . . . . . . . . . . . . . . . . . . . . . . . . . . . 21
IV Relational Systems 25
Chapter 4 Relational Systems 27
4.1 Introduction . . . . . . . . . . . . . . . . . . . . . . . . . . . . . . . . . . . . . . . 27
i
4.2 System Architecture . . . . . . . . . . . . . . . . . . . . . . . . . . . . . . . . . . . 28
V Benchmark Implementations 37
Chapter 5 Benchmark Implementations 39
5.1 Database Benchmarks . . . . . . . . . . . . . . . . . . . . . . . . . . . . . . . . . . 39
5.2 TPC-C Benchmark . . . . . . . . . . . . . . . . . . . . . . . . . . . . . . . . . . . 40
5.3 TPC-W Benchmark . . . . . . . . . . . . . . . . . . . . . . . . . . . . . . . . . . . 43
5.4 TPC-H . . . . . . . . . . . . . . . . . . . . . . . . . . . . . . . . . . . . . . . . . . 45
VI Database Replication Systems Evaluation 49
Chapter 6 Database Replication Systems Evaluation 51
6.1 Experiment Setup . . . . . . . . . . . . . . . . . . . . . . . . . . . . . . . . . . . . 51
6.2 TPC-C Evaluation Results . . . . . . . . . . . . . . . . . . . . . . . . . . . . . . . 52
6.3 TPC-W Evaluation Results . . . . . . . . . . . . . . . . . . . . . . . . . . . . . . . 54
6.4 Fault Tolerance Evaluation . . . . . . . . . . . . . . . . . . . . . . . . . . . . . . . 57
VII Data Grids 63
Chapter 7 Data Grids 65
7.1 Introduction . . . . . . . . . . . . . . . . . . . . . . . . . . . . . . . . . . . . . . . 65
7.2 JBoss Data Grid . . . . . . . . . . . . . . . . . . . . . . . . . . . . . . . . . . . . . 66
7.3 Oracle Coherence . . . . . . . . . . . . . . . . . . . . . . . . . . . . . . . . . . . . 69
7.4 Terracotta Ehcache . . . . . . . . . . . . . . . . . . . . . . . . . . . . . . . . . . . 72
VIII YCSB Benchmark 77
Chapter 8 YCSB Benchmark 79
IX Data Grids Evaluation 83
Chapter 9 Data Grids Evaluation 85
9.1 Introduction . . . . . . . . . . . . . . . . . . . . . . . . . . . . . . . . . . . . . . . 85
9.2 Evaluation Setup . . . . . . . . . . . . . . . . . . . . . . . . . . . . . . . . . . . . 86
9.3 Performance Evaluation . . . . . . . . . . . . . . . . . . . . . . . . . . . . . . . . . 89

9.4 Analysis of Resource Consumption: Two Nodes . . . . . . . . . . . . . . . . . . . . 116
9.5 Analysis of Resource Consumption: Four Nodes . . . . . . . . . . . . . . . . . . . 140
9.6 Fault Tolerance . . . . . . . . . . . . . . . . . . . . . . . . . . . . . . . . . . . . . 164
9.7 Conclusion . . . . . . . . . . . . . . . . . . . . . . . . . . . . . . . . . . . . . . . 181
X Graph Databases 183
Chapter 10 Introduction 185
10.1 Graph Databases . . . . . . . . . . . . . . . . . . . . . . . . . . . . . . . . . . . . 185
XI Summary and Conclusions 191
Chapter 11 Summary and Conclusions 193
11.1 Contributions . . . . . . . . . . . . . . . . . . . . . . . . . . . . . . . . . . . . . . 194
11.2 Future Directions . . . . . . . . . . . . . . . . . . . . . . . . . . . . . . . . . . . . 195
XII APPENDICES 197
Chapter 12 Appendices 199
12.1 Middle-R Installation . . . . . . . . . . . . . . . . . . . . . . . . . . . . . . . . . . 199
12.2 C-JDBC Installation . . . . . . . . . . . . . . . . . . . . . . . . . . . . . . . . . . . 202
12.3 MySQL Cluster Installation . . . . . . . . . . . . . . . . . . . . . . . . . . . . . . . 204
12.4 TPC-H - Table Schema . . . . . . . . . . . . . . . . . . . . . . . . . . . . . . . . . 206
12.5 TPC-H Foreign Keys . . . . . . . . . . . . . . . . . . . . . . . . . . . . . . . . . . 208
Bibliography 211


List of Figures
4.1 Middle-R Architecture . . . . . . . . . . . . . . . . . . . . . . . . . . . . . . . . . 29
4.2 Middle-R Components . . . . . . . . . . . . . . . . . . . . . . . . . . . . . . . . . 30
4.3 C-JDBC Architecture . . . . . . . . . . . . . . . . . . . . . . . . . . . . . . . . . . 31
4.4 C-JDBC Components . . . . . . . . . . . . . . . . . . . . . . . . . . . . . . . . . . 32
4.5 MySQL Cluster. . . . . . . . . . . . . . . . . . . . . . . . . . . . . . . . . . . . . . 33
4.6 MySQL Cluster Partitioning . . . . . . . . . . . . . . . . . . . . . . . . . . . . . . 34
5.1 TPC-C Database Schema . . . . . . . . . . . . . . . . . . . . . . . . . . . . . . . . 40
5.2 TPC-W Database Schema and Workload . . . . . . . . . . . . . . . . . . . . . . . . 43
5.3 TPC-H Results . . . . . . . . . . . . . . . . . . . . . . . . . . . . . . . . . . . . . 46
5.4 TPC-H Shared Memory Results . . . . . . . . . . . . . . . . . . . . . . . . . . . . 47
6.1 Two Replica Deployment. (a) Middle-R, (b) C-JDBC, (c) MySQL Cluster . . . . . . 52
6.2 TPC-C: Throughput . . . . . . . . . . . . . . . . . . . . . . . . . . . . . . . . . . . 52
6.3 TPC-C: Average Response Time . . . . . . . . . . . . . . . . . . . . . . . . . . . . 53
6.4 TPC-W: Throughput and Response Time (Shopping : Database-1) . . . . . . . . . . 55
6.5 TPC-W: Throughput and Response Time (Shopping : Database-2) . . . . . . . . . . 56
6.6 TPC-W: Throughput and Response Time (Shopping : Database-3) . . . . . . . . . . 57
6.7 TPC-W: Throughput and Response Time (Browse : Database-1) . . . . . . . . . . . 58
6.8 TPC-W: Throughput and Response Time (Browse : Database-2) . . . . . . . . . . . 59
6.9 TPC-W: Throughput and Response Time (Browse : Database-3) . . . . . . . . . . . 60
6.10 TPC-C Response Time . . . . . . . . . . . . . . . . . . . . . . . . . . . . . . . . . 60
6.11 TPC-W Response Time . . . . . . . . . . . . . . . . . . . . . . . . . . . . . . . . . 61
7.1 JBoss Data Grid Cache Architecture . . . . . . . . . . . . . . . . . . . . . . . . . . 67
7.2 Oracle Coherence Data Grid Architecture . . . . . . . . . . . . . . . . . . . . . . . 69
7.3 Oracle Coherence - Distributed Cache (Get/Put Operations) . . . . . . . . . . . . . . 70
7.4 Oracle Coherence - Distributed Cache - Fail over in Partitioned Cluster . . . . . . . . 70
7.5 Terracotta Ehcache Architecture . . . . . . . . . . . . . . . . . . . . . . . . . . . . 73
7.6 Terracotta Server Array Mirror Groups . . . . . . . . . . . . . . . . . . . . . . . . . 73
v

8.1 Yahoo! Cloud Serving Benchmark: Conceptual View . . . . . . . . . . . . . . . . . 80
8.2 Yahoo! Cloud Serving Benchmark: Probability Distribution . . . . . . . . . . . . . 81
9.1 Average Throughput / Target Throughput: SizeSmallTypeA . . . . . . . . . . . . . . 89
9.2 Two nodes latency: SizeSmallTypeA Insert . . . . . . . . . . . . . . . . . . . . . . 90
9.3 Two nodes latency: SizeSmallTypeA Read . . . . . . . . . . . . . . . . . . . . . . . 90
9.4 Two nodes latency: SizeSmallTypeA Update . . . . . . . . . . . . . . . . . . . . . . 91
9.5 Four nodes latency: SizeSmallTypeA Insert . . . . . . . . . . . . . . . . . . . . . . 91
9.6 Four nodes latency: SizeSmallTypeA Read . . . . . . . . . . . . . . . . . . . . . . 92
9.7 Four nodes latency: SizeSmallTypeA Update . . . . . . . . . . . . . . . . . . . . . 92
9.8 Average Throughput / Target Throughput: SizeSmallTypeB . . . . . . . . . . . . . . 93
9.9 Two nodes latency: SizeSmallTypeB Insert . . . . . . . . . . . . . . . . . . . . . . 94
9.10 Two nodes latency: SizeSmallTypeB Read . . . . . . . . . . . . . . . . . . . . . . . 94
9.11 Two nodes latency: SizeSmallTypeB Update . . . . . . . . . . . . . . . . . . . . . . 95
9.12 Four nodes latency: SizeSmallTypeB Insert . . . . . . . . . . . . . . . . . . . . . . 96
9.13 Four nodes latency: SizeSmallTypeB Read . . . . . . . . . . . . . . . . . . . . . . . 96
9.14 Four nodes latency: SizeSmallTypeB Update . . . . . . . . . . . . . . . . . . . . . 97
9.15 Average Throughput / Target Throughput: sizeBigTypeA . . . . . . . . . . . . . . . 98
9.16 Two nodes latency: sizeBigTypeA Insert . . . . . . . . . . . . . . . . . . . . . . . . 99
9.17 Two nodes latency: sizeBigTypeA Read . . . . . . . . . . . . . . . . . . . . . . . . 99
9.18 Two nodes latency: sizeBigTypeA Update . . . . . . . . . . . . . . . . . . . . . . . 100
9.19 Four nodes latency: sizeBigTypeA Insert . . . . . . . . . . . . . . . . . . . . . . . . 101
9.20 Four nodes latency: sizeBigTypeA Read . . . . . . . . . . . . . . . . . . . . . . . . 101
9.21 Four nodes latency: sizeBigTypeA Update . . . . . . . . . . . . . . . . . . . . . . . 102
9.22 Average Throughput / Target Throughput: sizeBigTypeB . . . . . . . . . . . . . . . 103
9.23 Two nodes latency: sizeBigTypeB Insert . . . . . . . . . . . . . . . . . . . . . . . . 104
9.24 Two nodes latency: sizeBigTypeB Read . . . . . . . . . . . . . . . . . . . . . . . . 104
9.25 Two nodes latency: sizeBigTypeB Update . . . . . . . . . . . . . . . . . . . . . . . 105
9.26 Four nodes latency: sizeBigTypeB Insert . . . . . . . . . . . . . . . . . . . . . . . . 105
9.27 Four nodes latency: sizeBigTypeB Read . . . . . . . . . . . . . . . . . . . . . . . . 106
9.28 Four nodes latency: sizeBigTypeB Update . . . . . . . . . . . . . . . . . . . . . . . 106
9.29 Throughput Comparison per Workload : Two Nodes . . . . . . . . . . . . . . . . . . 107
9.30 Throughput Comparison per Workload : Four Nodes . . . . . . . . . . . . . . . . . 107
9.31 Scalability: sizeBigTypeA . . . . . . . . . . . . . . . . . . . . . . . . . . . . . . . 108
9.32 Scalability: sizeBigTypeB . . . . . . . . . . . . . . . . . . . . . . . . . . . . . . . 108
9.33 Type A 2 Nodes . . . . . . . . . . . . . . . . . . . . . . . . . . . . . . . . . . . . . 109
9.34 JDG CPU Statistics: sizeMediumTypeA . . . . . . . . . . . . . . . . . . . . . . . . 110

9.35 JDG Network Statistics: sizeMediumTypeA . . . . . . . . . . . . . . . . . . . . . . 110
9.36 Coherence CPU Statistics: sizeMediumTypeA . . . . . . . . . . . . . . . . . . . . . 111
9.37 Coherence Network Statistics: sizeMediumTypeA . . . . . . . . . . . . . . . . . . . 111
9.38 Terracotta CPU Statistics: sizeMediumTypeA . . . . . . . . . . . . . . . . . . . . . 112
9.39 Terracotta Network Statistics: sizeMediumTypeA . . . . . . . . . . . . . . . . . . . 112
9.40 JDG CPU Statistics: sizeMediumTypeA . . . . . . . . . . . . . . . . . . . . . . . . 113
9.41 JDG Network Statistics: sizeMediumTypeA . . . . . . . . . . . . . . . . . . . . . . 113
9.42 Coherence CPU Statistics: sizeMediumTypeA . . . . . . . . . . . . . . . . . . . . . 114
9.43 Coherence Network Statistics: sizeMediumTypeA . . . . . . . . . . . . . . . . . . . 114
9.44 Terracotta CPU Statistics: sizeMediumTypeA . . . . . . . . . . . . . . . . . . . . . 115
9.45 Terracotta Network Statistics: sizeMediumTypeA . . . . . . . . . . . . . . . . . . . 115
9.46 JBoss Data Grid: CPU usage . . . . . . . . . . . . . . . . . . . . . . . . . . . . . . 116
9.47 JBoss Data Grid: Memory . . . . . . . . . . . . . . . . . . . . . . . . . . . . . . . 117
9.48 JBoss Data Grid: Network usage . . . . . . . . . . . . . . . . . . . . . . . . . . . . 117
9.49 Coherence: CPU usage . . . . . . . . . . . . . . . . . . . . . . . . . . . . . . . . . 118
9.50 Coherence: Memory . . . . . . . . . . . . . . . . . . . . . . . . . . . . . . . . . . 118
9.51 Coherence: Network usage . . . . . . . . . . . . . . . . . . . . . . . . . . . . . . . 119
9.52 Terracotta: CPU usage . . . . . . . . . . . . . . . . . . . . . . . . . . . . . . . . . 120
9.53 Terracotta: Memory . . . . . . . . . . . . . . . . . . . . . . . . . . . . . . . . . . . 120
9.54 Terracotta: Network usage . . . . . . . . . . . . . . . . . . . . . . . . . . . . . . . 121
9.55 JBoss Data Grid: CPU usage . . . . . . . . . . . . . . . . . . . . . . . . . . . . . . 122
9.56 JBoss Data Grid: Memory . . . . . . . . . . . . . . . . . . . . . . . . . . . . . . . 123
9.57 JBoss Data Grid: Network usage . . . . . . . . . . . . . . . . . . . . . . . . . . . . 123
9.58 Coherence: CPU usage . . . . . . . . . . . . . . . . . . . . . . . . . . . . . . . . . 124
9.59 Coherence: Memory . . . . . . . . . . . . . . . . . . . . . . . . . . . . . . . . . . 124
9.60 Coherence: Network usage . . . . . . . . . . . . . . . . . . . . . . . . . . . . . . . 125
9.61 Terracotta: CPU usage . . . . . . . . . . . . . . . . . . . . . . . . . . . . . . . . . 126
9.62 Terracotta: Memory . . . . . . . . . . . . . . . . . . . . . . . . . . . . . . . . . . . 126
9.63 Terracotta: Network usage . . . . . . . . . . . . . . . . . . . . . . . . . . . . . . . 127
9.64 JBoss Data Grid: CPU usage . . . . . . . . . . . . . . . . . . . . . . . . . . . . . . 128
9.65 JBoss Data Grid: Memory . . . . . . . . . . . . . . . . . . . . . . . . . . . . . . . 128
9.66 JBoss Data Grid: Network usage . . . . . . . . . . . . . . . . . . . . . . . . . . . . 129
9.67 Coherence: CPU usage . . . . . . . . . . . . . . . . . . . . . . . . . . . . . . . . . 130
9.68 Coherence: Memory . . . . . . . . . . . . . . . . . . . . . . . . . . . . . . . . . . 130
9.69 Coherence: Network usage . . . . . . . . . . . . . . . . . . . . . . . . . . . . . . . 131
9.70 Terracotta: CPU usage . . . . . . . . . . . . . . . . . . . . . . . . . . . . . . . . . 132

9.71 Terracotta: Memory . . . . . . . . . . . . . . . . . . . . . . . . . . . . . . . . . . . 132
9.72 Terracotta: Network usage . . . . . . . . . . . . . . . . . . . . . . . . . . . . . . . 133
9.73 JBoss Data Grid: CPU usage . . . . . . . . . . . . . . . . . . . . . . . . . . . . . . 134
9.74 JBoss Data Grid: Memory . . . . . . . . . . . . . . . . . . . . . . . . . . . . . . . 134
9.75 JBoss Data Grid: Network usage . . . . . . . . . . . . . . . . . . . . . . . . . . . . 135
9.76 Coherence: CPU usage . . . . . . . . . . . . . . . . . . . . . . . . . . . . . . . . . 136
9.77 Coherence: Memory . . . . . . . . . . . . . . . . . . . . . . . . . . . . . . . . . . 136
9.78 Coherence: Network usage . . . . . . . . . . . . . . . . . . . . . . . . . . . . . . . 137
9.79 Terracotta: CPU usage . . . . . . . . . . . . . . . . . . . . . . . . . . . . . . . . . 138
9.80 Terracotta: Memory . . . . . . . . . . . . . . . . . . . . . . . . . . . . . . . . . . . 138
9.81 Terracotta: Network usage . . . . . . . . . . . . . . . . . . . . . . . . . . . . . . . 139
9.82 JBoss Data Grid: CPU usage . . . . . . . . . . . . . . . . . . . . . . . . . . . . . . 140
9.83 JBoss Data Grid: Memory . . . . . . . . . . . . . . . . . . . . . . . . . . . . . . . 140
9.84 JBoss Data Grid: Network usage . . . . . . . . . . . . . . . . . . . . . . . . . . . . 141
9.85 Coherence: CPU usage . . . . . . . . . . . . . . . . . . . . . . . . . . . . . . . . . 142
9.86 Coherence: Memory . . . . . . . . . . . . . . . . . . . . . . . . . . . . . . . . . . 142
9.87 Coherence: Network usage . . . . . . . . . . . . . . . . . . . . . . . . . . . . . . . 143
9.88 Terracotta: CPU usage . . . . . . . . . . . . . . . . . . . . . . . . . . . . . . . . . 144
9.89 Terracotta: Memory . . . . . . . . . . . . . . . . . . . . . . . . . . . . . . . . . . . 144
9.90 Terracotta: Network usage . . . . . . . . . . . . . . . . . . . . . . . . . . . . . . . 145
9.91 JBoss Data Grid: CPU usage . . . . . . . . . . . . . . . . . . . . . . . . . . . . . . 146
9.92 JBoss Data Grid: Memory . . . . . . . . . . . . . . . . . . . . . . . . . . . . . . . 146
9.93 JBoss Data Grid: Network usage . . . . . . . . . . . . . . . . . . . . . . . . . . . . 147
9.94 Coherence: CPU usage . . . . . . . . . . . . . . . . . . . . . . . . . . . . . . . . . 148
9.95 Coherence: Memory . . . . . . . . . . . . . . . . . . . . . . . . . . . . . . . . . . 148
9.96 Coherence: Network usage . . . . . . . . . . . . . . . . . . . . . . . . . . . . . . . 149
9.97 Terracotta: CPU usage . . . . . . . . . . . . . . . . . . . . . . . . . . . . . . . . . 150
9.98 Terracotta: Memory . . . . . . . . . . . . . . . . . . . . . . . . . . . . . . . . . . . 150
9.99 Terracotta: Network usage . . . . . . . . . . . . . . . . . . . . . . . . . . . . . . . 151
9.100JBoss Data Grid: CPU usage . . . . . . . . . . . . . . . . . . . . . . . . . . . . . . 152
9.101JBoss Data Grid: Memory . . . . . . . . . . . . . . . . . . . . . . . . . . . . . . . 152
9.102JBoss Data Grid: Network usage . . . . . . . . . . . . . . . . . . . . . . . . . . . . 153
9.103Coherence: CPU usage . . . . . . . . . . . . . . . . . . . . . . . . . . . . . . . . . 154
9.104Coherence: Memory . . . . . . . . . . . . . . . . . . . . . . . . . . . . . . . . . . 154
9.105Coherence: Network usage . . . . . . . . . . . . . . . . . . . . . . . . . . . . . . . 155
9.106Terracotta: CPU usage . . . . . . . . . . . . . . . . . . . . . . . . . . . . . . . . . 156

9.107Terracotta: Memory . . . . . . . . . . . . . . . . . . . . . . . . . . . . . . . . . . . 156
9.108Terracotta: Network usage . . . . . . . . . . . . . . . . . . . . . . . . . . . . . . . 157
9.109JBoss Data Grid: CPU usage . . . . . . . . . . . . . . . . . . . . . . . . . . . . . . 158
9.110JBoss Data Grid: Memory . . . . . . . . . . . . . . . . . . . . . . . . . . . . . . . 159
9.111JBoss Data Grid: Network usage . . . . . . . . . . . . . . . . . . . . . . . . . . . . 159
9.112Coherence: CPU usage . . . . . . . . . . . . . . . . . . . . . . . . . . . . . . . . . 160
9.113Coherence: Memory . . . . . . . . . . . . . . . . . . . . . . . . . . . . . . . . . . 160
9.114Coherence: Network usage . . . . . . . . . . . . . . . . . . . . . . . . . . . . . . . 161
9.115Terracotta: CPU usage . . . . . . . . . . . . . . . . . . . . . . . . . . . . . . . . . 162
9.116Terracotta: Memory . . . . . . . . . . . . . . . . . . . . . . . . . . . . . . . . . . . 162
9.117Terracotta: Network usage . . . . . . . . . . . . . . . . . . . . . . . . . . . . . . . 163
9.118Two nodes: SizeSmallTypeA Insert . . . . . . . . . . . . . . . . . . . . . . . . . . . 165
9.119Two nodes: SizeSmallTypeA Read . . . . . . . . . . . . . . . . . . . . . . . . . . . 165
9.120Two nodes: SizeSmallTypeA Update . . . . . . . . . . . . . . . . . . . . . . . . . . 166
9.121Four nodes: SizeBigTypeA Insert . . . . . . . . . . . . . . . . . . . . . . . . . . . . 167
9.122Four nodes: SizeBigTypeA Read . . . . . . . . . . . . . . . . . . . . . . . . . . . . 167
9.123Four nodes: SizeBigTypeA Update . . . . . . . . . . . . . . . . . . . . . . . . . . . 168
9.124Two nodes: SizeSmallTypeB Insert . . . . . . . . . . . . . . . . . . . . . . . . . . . 169
9.125Two nodes: SizeSmallTypeB Read . . . . . . . . . . . . . . . . . . . . . . . . . . . 169
9.126Two nodes: SizeSmallTypeB Update . . . . . . . . . . . . . . . . . . . . . . . . . . 170
9.127Four nodes: SizeSmallTypeB Insert . . . . . . . . . . . . . . . . . . . . . . . . . . 171
9.128Four nodes: SizeSmallTypeB Read . . . . . . . . . . . . . . . . . . . . . . . . . . . 171
9.129Four nodes: SizeSmallTypeB Update . . . . . . . . . . . . . . . . . . . . . . . . . . 172
9.130Two nodes: SizeBigTypeA Insert . . . . . . . . . . . . . . . . . . . . . . . . . . . . 173
9.131Two nodes: SizeBigTypeA Read . . . . . . . . . . . . . . . . . . . . . . . . . . . . 173
9.132Two nodes: SizeBigTypeA Update . . . . . . . . . . . . . . . . . . . . . . . . . . . 174
9.133Four nodes: SizeBigTypeA Insert . . . . . . . . . . . . . . . . . . . . . . . . . . . . 175
9.134Four nodes: SizeBigTypeA Read . . . . . . . . . . . . . . . . . . . . . . . . . . . . 175
9.135Four nodes: SizeBigTypeA Update . . . . . . . . . . . . . . . . . . . . . . . . . . . 176
9.136Two nodes: SizeBigtypeB Insert . . . . . . . . . . . . . . . . . . . . . . . . . . . . 177
9.137Two nodes: SizeBigtypeB Read . . . . . . . . . . . . . . . . . . . . . . . . . . . . 177
9.138Two nodes: SizeBigtypeB Update . . . . . . . . . . . . . . . . . . . . . . . . . . . 178
9.139Four nodes: SizeBigtypeB Insert . . . . . . . . . . . . . . . . . . . . . . . . . . . . 178
9.140Four nodes: SizeBigtypeB Read . . . . . . . . . . . . . . . . . . . . . . . . . . . . 179
9.141Four nodes: SizeBigtypeB Update . . . . . . . . . . . . . . . . . . . . . . . . . . . 179
10.1 Neo4j Architecture . . . . . . . . . . . . . . . . . . . . . . . . . . . . . . . . . . . 186

10.2 Titan Architecture . . . . . . . . . . . . . . . . . . . . . . . . . . . . . . . . . . . . 187
10.3 Sparksee Architecture . . . . . . . . . . . . . . . . . . . . . . . . . . . . . . . . . . 188

List of Tables
5.1 Transaction workload, keying time, think time and maximum response time (RT -all
times in seconds) . . . . . . . . . . . . . . . . . . . . . . . . . . . . . . . . . . . . 43
5.2 Number of rows in tables for three databases used in the experiments and database size 45
5.3 TPC-H Database Schema and Table Size . . . . . . . . . . . . . . . . . . . . . . . . 47
xi


Part I
INTRODUCTION


Chapter 1
Introduction
1.1 Motivation
All the work described in this thesis was conducted at the Distributed Systems Laboratory at Uni-
varsidad Politecnica de Madrid (UPM) under the guidance of Dr. Marta Patiño-Martínez. Prior to
joining UPM as a PhD candidate I worked as a Research Assistant in Politecnico di Bari, Italy for
one year in the field of Grid Computing. This was right after graduating from Master Program in
Electronics from Pune University India. This was my first encounter with distributed systems. After
finishing my research associate fellowship in Bari I wanted to pursue a carrier in research, especially
in the field of distributed systems. I was fortunate enough to find a place in UPM which is one of
the best universities in Spain, as a PhD candidate through Erasmus Mundus Fellowship. Also, the
opportunity to conduct research under the guidance of Dr. Marta Patinõ Martinez and Dr. Ricardo
Jiménez-Peris who are one of the leading researchers in the area of distributed systems was certainly
influential in making a decision to join UPM.
Furthermore, the research that I chose was based on my interests from previous work and oppor-
tunities that lay ahead in terms of changing world of human computer interaction. With the advent
of Big Data and Cloud Computing has brought many useful prospects in data analytic and business
enterprises. From social networks to e-commerce websites to Government Agencies, we directly or
indirectly interact with massive amounts of data on a daily basis. Providing optimum results to a user
is the key for businesses based on internet. They are collecting massive amount of user data to analyse
and deliver best results. Handling such data is not an easy task, especially moving this data swiftly
Rohit Madhukar Dhamane Comparison of Architectures and Performance of Database Replication Systems

4 CHAPTER 1. INTRODUCTION
while maintaining its integrity is foremost important aspect for any business. This is where Database
Management Systems come into picture.
They are hidden behind the applications and seamlessly integrated as one unit in the architecture, to-
tally invisible to a user. Database Management Systems take care of storing massive amounts of user
data. Many times this data is extremely important and maintaining integrity of the data is an absolute
priority, for example database of accounts in a bank. Hence it is vital that systems taking care of such
data perform to their best even in the case of failures.
As a part of this thesis I got an opportunity to explore the field of traditional Relational Database
Systems as well as new emerging technologies such as Data Grids. Hence to study some of the state
of the art technologies in data management systems in details and bring forward a necessary analysis
was a tempting proposition for learning and growing as a researcher.
1.2 Goals and Objectives
Data replication is important to ensure that applications can have access to relevant data at all
times. Traditional databases based on relational systems have been a popular choice for decades and
in last decades new type of data storage solutions like In-Memory Data Grids have been implemented
which provide rapid access to data and high scalability. These systems provide various types of repli-
cation methods to provide high availability of data. One type of data replication is eager replication,
where all data replicas are kept consistent. However, providing this type of replication can be detri-
mental to applications speed if the protocol is not efficient. Hence, the goal of this thesis was to
understand replication systems based on traditional relational database systems as well as newer In-
Memory Data Grids. We also study newer data stores, such as graph databases and how to provide
consistency to this kind of systems.
This thesis compares the architectures of three RDBMS replication systems, namely Middle-R
[PmJpKA05], C-JDBC [CMZ04b] and MySQL Cluster [MySb]. Middle-R and C-JDBC are aca-
demic prototypes on the other hand MySQL Cluster is a commercial product. It is very important
to understand the behaviour of these systems because in many cases they are backbone of a critical
system. As part of the research the goals were to understand the replication protocols implemented by
these systems. Objectives were to study and compare each systems architecture, replication protocol,
how these systems maintain data integrity when replication is done, and how they distribute workload
over multiple servers. These aspects of a replication system are very crucial for a robust system. Since
these systems try to perform the same tasks, i.e. replicate data over network to one or more servers it
Comparison of Architectures and Performance of Database Replication Systems Rohit Madhukar Dhamane
1.3. THESIS OUTLINE 5
is important to understand how it is accomplished. The goals and objectives were to understand this
process and find pros and cons of each system over each other. The procedure followed in this thesis
provides a framework for evaluation of data replication systems.
Furthermore, these systems were evaluated against state of the art industry standard benchmarks
such as TPC-C [TPC10] and TPC-W [TPC03]. The experiments were carried out using different
workloads to understand scalability issues related to these systems. The results were presented in
[DMVP14]. It is important to find out how far these systems can perform optimally.
In-Memory Data Grids have become popular in last decades. They provide high scalability and
performance. However, since these systems are still relatively new and growing as a part of this thesis
the objectives were set to analyse three types of Data Grids available in market today. These systems
were JBoss Data Grid [JDG], Oracle Coherence [Cohe] and Terracotta Ehcache [Ehcf]. All these
systems claim to have high scalability and performance however there has not been enough research
to compare these systems under one common ground.
The thesis objectives related to Data Grids were to analyse these systems based on their system
design, topology, how transactions are handled, what kind of storage option they support and API sup-
port for applications. We believe that this type of classification takes into account all the important
aspects of any data replication systems. As an experimental study we used an industry benchmark,
Yahoo! Cloud Serving Benchmark [YCS] to check how these systems scale under various work-
loads, understand their performance and fault tolerance behaviour. By understanding the architecture
of various replication systems and performance this thesis tries to provide a framework to evaluate
a database replication system. The procedures used to evaluate replication systems should provide
important aspects needs to be taken into consideration while choosing a data replication system.
Another goal of the thesis was the study of NoSQL data stores and their transactional capabili-
ties. We proposed a method to implement transactions providing snapshot isolation [BBG+95] as a
consistency criteria [PSJP+16].
1.3 Thesis outline
This thesis compares the architecture and evaluates the performance of three replication sys-
tems based on RDBMS (Relational Database Management Systems) and three systems based on
In-Memory Data Grids. The three replication systems based on RDBMS are called Middle-R, C-
JDBC and MySQL Cluster. For In-Memory Data Grids the three systems studied are JBoss Data
Rohit Madhukar Dhamane Comparison of Architectures and Performance of Database Replication Systems

6 CHAPTER 1. INTRODUCTION
Grid, Oracle Coherence and Terracotta Ehcache. This thesis provides in depth study of these systems
architecture and performance evaluation using state of the art benchmarks available in the industry
today.
The thesis is outlined as follows:
Chapter II provides basics of Relational Databases and In Memory Data Grid. Later it discusses
the basic terminologies and concepts of database replication.
Chapter III describes the research work in the area of RDBMS replication as well as In-Memory
Data Grids.
Chapter IV describes details of replication software based on relational systems. This section
evaluates Middle-R, C-JDBC and MySQL Cluster based on their architecture, replication protocol,
isolation level, fault tolerance and load balancing. This is a theoretical study of these three systems
based on information available in academic domain.
Chapter V discusses implementation of benchmarks, namely TPC-C and TPC-W which are widely
used for evaluating Middle-R, C-JDBC and MySQL Cluster performance. It also discusses the imple-
mentations of these benchmarks, EscadaTPC-C (TPC-C) and Java implementation of TPC-W which
are used for evaluation. It also briefly describes another benchmark from Transaction Processing
Council (TPC), called TPC-H. It also discusses some initial experiments done for evaluating Post-
greSQL 9.0 version of database and discusses how database tuning of shared buffers and cache could
play important role in performance improvement in RDBMS.
Chapter VI discusses evaluation of Middle-R, C-JDBC and MySQL Cluster using EscadaTPC-C
and Java implementation TPC-W. It provides detailed results for scalability and fault tolerance for
these three systems using both benchmarks.
Chapter VII describes the three In-Memory Data Grids, namely JBoss Data Grid, Oracle Coher-
ence and Terracotta Ehcache. It provides detailed study of these three systems based on their system
design, topology, transaction management, storage options and available APIs.
Chapter VIII discusses Yahoo! Cloud Serving Benchmark (YCSB) in detail and how it is used
for evaluation of In-Memory Data Grids described in Chapter VII.
Chapter IX discusses results obtained from experiments performed on In-Memory Data Grids us-
Comparison of Architectures and Performance of Database Replication Systems Rohit Madhukar Dhamane
1.3. THESIS OUTLINE 7
ing YCSB Benchmark. The results are provided for various types of workload as well as object sizes.
The scalability and fault tolerance behaviour is studied in minute details and outcome is discussed for
each experiment.
Chapter X describes graph databases such as Neo4j, Titan and Sparksee and presents the imple-
mentation of snapshot isolation in Neo4j.
Chapter XI Includes the summary and future work of the thesis.
Rohit Madhukar Dhamane Comparison of Architectures and Performance of Database Replication Systems

8 CHAPTER 1. INTRODUCTION
Comparison of Architectures and Performance of Database Replication Systems Rohit Madhukar Dhamane

Part II
Background


Chapter 2
Background
2.1 Databases
A database is a collection of information such as text, numeric, images etc that can be accessed,
managed and updated. Traditionally data is stored in a relational database. A relational database
stores data in multiple table format which can be accessed in multiple ways. Some of the common
examples of relational databases are [MySa], [Posb], [Ora] etc. A user can access a relational database
using Structured Query Language (SQL) [PL08]. One can form queries using SQL and retrieve a
relevant data from the database. Relational databases (RDBMS) are set of tables which contains
various types of data. Each table contains one or more columns where each column represents a
particular type of data type. For example, for a typical business database one can describe a table,
say Customer which could have many columns such as Name, Address, Phone Number etc. RDBMS
provide facility to obtain a view of database depending upon a users need. For example, an HR
manager of a company can get a list of employees that need to be paid.
So an RDBMS can be summarised as following:
• A single database can contain one or more tables which may relate to each other.
• Each table contains one or more columns with each column storing a particular type of data.
• Records from one column can relate to records from another column.
RDBMS also provide security for critical data because sharing is based on privacy settings. Ease of
use and functionalities has made RDBMS a useful part of computing world.
Rohit Madhukar Dhamane Comparison of Architectures and Performance of Database Replication Systems
12 CHAPTER 2. BACKGROUND
In past decade another type of database has become popular which is called as NoSQL (Not Only
SQL) Database. Relational databases have been popular for many decades but with the emergence
of big data, scalability has become an important aspect for databases. NoSQL does not use relational
model. NoSQL databases can be one of the following type of databases:
• Key-Value databases : It stores data in a key-value pair. A client gets a value for a key or put
a value for a key or delete a key from the data store. e.g. DynamoDB, Azure Table Storage,
Oracle NoSQL Database.
• Document Store : In this type documents are stored as data. A database can store documents in
various formats such as XML, JSON, BSON etc. The documents have a hierarchy with maps,
collections and values. Documents databases store documents in the value part of the key-value
store. e.g. Elasticsearch, ArangoDB, Couchbase Server
• Graph Database : Graph databases are useful for storing entities and relationship between
them. These entities are known as nodes and relations between nodes are known as edges. This
type of data storage allows user to interpret data in many ways based upon the relations. e.g.
Neo4J, Infinite Graph, HyperGraphDB.
Because of above mentioned abilities NoSQL databases have gained immense popularity in past
decade.
In the next section we will see database replication which is used to provide fault tolerance and
scalability for a database.
2.2 Database Replication
Replication is the process of copying and maintaining database objects in multiple replicas that
make up a distributed database system. Replication is used to improve the performance and availabil-
ity of data for applications. Using geographically closer location of data can increase the performance
of an application. For example, an application might normally access a local database rather than a
remote server to minimize network traffic and achieve maximum performance. Furthermore, if the
local server fails application still has access to remote servers, this way data availability can be main-
tained.
There are various types of replication [Rep]:
• Read-Only Replication : Data can only be read from the server (slave) where data is replicated.
Data can be updated only on Master server. The updates for data are propagated to slave server
after which latest data is available for reading from slave for an application.
Comparison of Architectures and Performance of Database Replication Systems Rohit Madhukar Dhamane

2.2. DATABASE REPLICATION 13
• Symmetric Replication : In this case data can be replicated on any server and updated data
from the server is propagated to all the other servers in the network. These updates can be
synchronous (data is updated right away) or asynchronous (updated after some time).
Database replication can be further classified into two categories: Synchronous and Asynchronous
Replication.
• Synchronous Replication : Synchronous replication writes data to the master and slave sites at
the same time so that the data remains consistent between two sites. Synchronous replication is
more expensive than other forms of replication, introduces latency that slows down the primary
application. With more distance the lag in synchronous replication can hamper the performance
of application. Synchronous replication is often used for disaster recovery purposes. It is
preferred for applications with low recovery time objectives that can’t tolerate data loss.
• Asynchronous Replication : In asynchronous replication data from master to slave is copied
after a delay. It can be scheduled for a particular time in a day or week. Application can access
master server for latest updates and change data there without worrying about when data will
be propagated to slave. Although this provides better performance for application in case of
master failure updates performed on master between the data updates to slave could be lost. It
is usually designed for longer distances. It can tolerate some degradation in connectivity.
When an application accesses database for data it performs several tasks on data like reading,
updating, inserting new data or deleting data. It is important to maintain the flow of queries as well
as make sure that all the queries are performed without any flaw. This task is called as a Transaction.
Transaction [Tra]: A transaction is a sequence of operations performed as a single logical unit of
work. A logical unit of work must exhibit four properties, called the atomicity, consistency, isolation,
and durability (ACID) properties, to qualify as a transaction.
So to perform a transaction without any flaw database must support ACID properties:
• Atomicity : In a transaction involving two or more discrete pieces of information, either all of
the pieces are committed or none are.
• Consistency : A transaction either creates a new and valid state of data, or, if any failure occurs,
returns all data to its state before the transaction was started.
• Isolation : A transaction in process and not yet committed must remain isolated from any other
transaction.
• Durability : Committed data is saved by the system such that, even in the event of a failure and
system restart, the data is available in its correct state.
Rohit Madhukar Dhamane Comparison of Architectures and Performance of Database Replication Systems

14 CHAPTER 2. BACKGROUND
In a distributed system, one way to achieve ACID is to use a two-phase commit (2PC) [2pc],
which ensures that all involved sites must commit to transaction completion or none do, and the
transaction is rolled back. A distributed transaction alters data on multiple databases and hence it be-
comes more complicated to coordinate the committing (save changes) or rolling back (undo changes)
in a transaction. i.e. Either a transaction is completed or entire transaction is aborted. This way data
integrity is assured.
Two-Phase Commit : Two-phase commit has two phases, prepare phase and commit phase. In the
prepare phase, the initiating node in the transaction asks the other participating nodes to promise to
commit or roll back the transaction. In commit phase, the initiating node asks other nodes to commit
the transaction. If this is not possible, then all nodes are asked to roll back.
Message Flow in two-phase commit :
Server1 Server2
. QUERY TO COMMIT
. ——————————–>
. VOTE YES/NO prepare*/abort*
. <——————————-
commit*/abort* COMMIT/ROLLBACK
. ——————————–>
. ACKNOWLEDGMENT commit*/abort*
. <——————————–
end
Synchronisation between multiple servers is difficult and one solution can not fit every use case.
Hence depending upon the need various solutions are proposed. Some of them are listed below:
• Shared Dis Failover : Shared disk fail over uses only one copy of data stored on a single disk
array shared by multiple servers. If primary server fails a backup server takes its place.
• Block Replication : It is a type of file system replication where changes on one file system are
copied to a file system on another server.
• Warm Standby Using Point-In-Time Recovery : It uses a stream of write-ahead log (WAL) and
if main server fails the log contains all the data changes which is used to make another server a
master.
• Data Partitioning : In this case database tables are split into two or more parts and stored on
different servers. Data can be modified by only one server and other servers can access it to
read the relevant data but cannot modify it.
Comparison of Architectures and Performance of Database Replication Systems Rohit Madhukar Dhamane

2.2. DATABASE REPLICATION 15
For an application it is very important to read data which is consistent throughout a transaction,
i.e. when a transaction is reading some data from a table(s) the data should not be modified by
other transaction. With replication this scenario is very important to take into consideration hence to
overcome such situation systems provide various locking mechanisms to lock a row or table when a
transaction working on it. One of the ways to accomplish this is to apply Snapshot Isolation. Snapshot
isolation guarantees when a transaction reads data it will see a consistent values (from last commit-
ted transaction). Database makes a snapshot of that data for transaction and if the transaction does
not conflicts with any other transaction then only it is allowed to commit the changes it made to the
data. Although it may mean sometimes transactions will be aborted and it will require more time to
execute the same task again, it makes sure that the data is consistent throughout and data integrity is
maintained.
Most databases provide various isolation guarantees. They are summarised below:
• READ UNCOMMITTED : User 1 will see changes made by User2. With this isolation level
dirty reads, i.e. inconsistent data reads are possible. The data may not be consistent with other
parts of the able or the query and it might not have been committed. This isolation guarantee
provides fast response since table blocking is not permitted.
• READ COMMITTED : User1 will not see the change made by User2. With this isolation
guarantee rows returned by a query will always consist committed data. Changes made by
other users are not shown to the query while transaction is still in progress.
• REPEATABLE READ : User1 will not see the change made by User2. It is a higher level iso-
lation than READ COMMITTED. It not only guarantees read committed level but also guar-
antees that any data read cannot change if the transaction reads the same data again. It reads
previously read data in place, unchanged and available to read.
• Serializable : Serializable isolation provides even more stronger guarantee in addition to RE-
PEATABLE READ guarantees by making sure that no new data can be seen by subsequent
read. Serializable isolation always blocks a concurrent transaction and provides a stronger
isolation guarantee.
These concepts have been incorporated into most RDBMS replication solutions. The newer data stor-
age solutions such as In-Memory Data Grids store data in main memory for faster access. The data
is partitioned and stored across multiple nodes in a cluster. The key factors of In-Memory Data Grids
are:
• Data is distributed over a cluster of servers.
Rohit Madhukar Dhamane Comparison of Architectures and Performance of Database Replication Systems

16 CHAPTER 2. BACKGROUND
• Object-oriented data model.
• Cluster can scale up or down as needed.
Hence it is vital for In-Memory Data Grids to store data in main memory to ensure scalability. IMDGs
offer multiple layers of data storage for efficient and reliable access to data. It can have client side
cache to store recently accessed objects, data distributed across multiple servers memory and persis-
tent storage as well. To replicate data through these various levels IMDGs use following functionali-
ties [Cac]:
• Read-Through Caching : When application asks for data it is checked in cache first if it is not
present there IMDG gets it from data store and puts it in cache for future use.
• Write through Caching : Data is updated in cache but operation is completed only when under-
lying data source is updated as well.
• Write Behind Caching : In this case operation does not wait for the updated data in cache to be
synchronised with data source. Data is updated asynchronously.
• Refresh Ahead Caching : Some IMDGs offer this functionality to automatically and syn-
chronously refresh recently accessed cache entries before it’s expiration.
In following chapters these techniques are discussed in details with respect to data grid solutions
relevant to this thesis. Choosing which replication technique suits best is based on requirement of
application and pros/cons of each technique.
In the next chapter we will look at related work for RDBMS replication and replication in In-
memory Data Grids.
Comparison of Architectures and Performance of Database Replication Systems Rohit Madhukar Dhamane

Part III
Related Work


Chapter 3
Related Work
3.1 RDBMS Data Replication
This thesis addresses problem of evaluation of various data replication systems across a broader
spectrum. Resource allocation, scalability, data integrity etc. are very important factors in data repli-
cation and conducting these studies and understanding the pros and cons of various system is very
crucial. With a plethora of data replication systems based on unique architecture and providing vari-
ous functionalities it is important to try to understand and evaluate them under a common ground.
Replication systems mainly provide either synchronous or asynchronous (or both) replication.
Kemmel et al. [KAKA00] provide algorithms to improve performance of data replication and main-
taining the data consistency and transactional semantics. They use a 1-copy-serializable protocol to
make sure that when a write set is received algorithm performs a conflict check for read/write with
the local transactions before committing or aborting a transaction. In paper [WPS+00] Wiesmann
et al. study replication protocols based on eager replication. They classify eager replication in three
direction: architecture (primary copy or update everywhere), update propagation (per operation/trans-
action) and transaction termination protocol.
Snapshot isolation based techniques have been proposed in paper [SFW05] by Elnikey et al. They
propose two implementations, first a generalised snapshot isolation where each transaction reads only
committed data (i.e. committed snapshot). this snapshot is taken before the transaction starts. Trans-
action which commits first is the winner and thereby maintains the data integrity. Second algorithm
Rohit Madhukar Dhamane Comparison of Architectures and Performance of Database Replication Systems

20 CHAPTER 3. RELATED WORK
they propose is called Prefix-consistent snapshot isolation, which proposes that when two transac-
tions are in same work flow and if second transaction commits first then first transactions snapshot
must contain second transactions recent updates. Similarly others have proposed various algorithms
for consistency [PMJPKA00, KA00, AT02, ALZ03, EDP06, RBSS02, CPR+07, DKS06, PCAO06,
HJA+02, PCVO05, NRP06, BGMEZP08, CBPS10, BPGG13, CPPW10, PAÖ08].
[KBB01] propose algorithms for database cluster reconfiguration. Amza et al. [ACZ05] discuss
conflict aware scheduling and load balancing techniques, and provide an evaluation based on TPC-W
benchmark [TPC03] . Milan-Franco et al [MFJPPnMK04] propose an adaptive replication solution
to maximize throughput and scalability. They discuss how load balancing techniques combined with
management of concurrent execution of number of transactions can improve response times and per-
formance of a system.
Core-based replication like Postgres-R [Posa] provide efficient multi-master replication for shared
nothing replication architecture. It uses group communicatio and provide eager replication. It is an
extension of PostgreSQL database system.
In paper [ADMnE+06] Armendariz et al propose an architecture called MADIS. This architec-
ture extends the original database schema and uses native JDBC interfaces (Consistency manager)
between application and database. The author argues that although the performance of such architec-
ture might not exceed to a core-based solution such a Postgres-R [Posa] but it can be easily portable
to different databases. In paper [MERFD+08] Munoz-Escoi et al highlight the situation of conflicts
that can happen due to integrity violation. They analyse how to deal with integrity support when a
database does not provide it and manage certain types of constrains related to that.
To evaluate a database system Transaction Processing Council has created many benchmarks, de-
pending upon the use case. As a part of this thesis TPC-C and TPC-W are important benchmarks.
There have been some studies on TPC-C benchmark as well. In paper [LD93] Leutenegger et al.
provide study for TPC-C benchmark and elaborate on differences with TPC-A benchmark. They pro-
vide detailed differences based on transaction types and data access skew. They also provide details
of experiments performed and comparative study. In paper [CAA+11] Chen et al show comparative
study between TPC-C and TPC-E benchmarks based on I/O access patterns.
In paper [Mar01] Marden et al show use of TPC-W implementation with java programming lan-
guage . They provide details of their implementation and explain how TPC-W can be implemented
as a collection of java servlets as well as study about memory system and architecture. Their results
show throughput improvements of 8% to 41% on a two context processor and 12% to 61% on a four
Comparison of Architectures and Performance of Database Replication Systems Rohit Madhukar Dhamane
3.2. IN-MEMORY DATA GRIDS 21
context processor compared to a single-thread processor.
In paper [KGH05] Kurz et al present method to characterize workload from a web server logfile
from a user perspective and use this data to create workload for TPC-W benchmark. In [ZRRS04]
Zhang et al show how workload characteristics affect system behaviour and operations. They iden-
tify the bottlenecks and how they affect system performance. They show performance degradation
is caused by interaction of database with storage system and highlight statistical correlation in the
distribution of dynamic page generation times under heavy load. In paper [OSL07] Oh et al study the
performance of databases using resource allocation and specific workload.They provide results based
on both TPC-C and TPC-W benchmarks to identify the resources that affect the performance of a
database system.
These studies have been useful in determining the goal of the thesis, i.e. to analyse various
replication protocols proposed in the last decades. Exploring the functionalities provided by these
protocols and evaluating them for the challenges proposed by cloud and big data platforms. It is
vital that these systems are evaluated in depth and under similar conditions to truly understand their
capabilities.
3.2 In-Memory Data Grids
Big Data and Cloud computing applications have brought new set of challenges to data replication
systems. Studies such as these [Cha] show that 67% respondents consider lack of real time capabil-
ities for their systems. Similarly high percentage of respondents are unsatisfied on the grounds of
usability (69%) and functionality of their systems. It is predicted that fifth of the clusters in the world
will be smaller than 10 or less nodes compared to half of all the clusters today. With such massive
clusters it is important to have data replication systems that can provide high scalability and avail-
ability. Similarly in survey [Biga] authors highlight that 80% of respondent indicate that Big Data
is important to them while 43% respondents say that it is mission critical. Considering the growth
of Big data and Cloud platforms these numbers can only go up. Another interesting criteria to look
at is that 60% of respondents use NoSQL data store and they require streaming big data and high
velocity. To support such massive scalability traditional RDBMS solutions fail considering that they
were never design to function over massive clusters. Hence new type of data stores are becoming
popular, some of them are In-Memory Data Grid. They can provide massive scalability since data is
stored on server memory, distributed over a cluster of machines. They provide persistent storage as
well as data backups for failover.
Rohit Madhukar Dhamane Comparison of Architectures and Performance of Database Replication Systems

22 CHAPTER 3. RELATED WORK
There are many commercial as well as open source IMDG products available today such as
Oracle Coherence [Cohe] , JBoss Data Grid [JDG], Terracotta Ehcache [Ehcf], GigaSpaces XAP
[Gig], VMware GemFire [Gem], Infinispan [Inf], Hazelcast [Haz], Apache Ignite [Igna] etc. Apart
from these some other products have been designed to support simpler interfaces such as Tenzing
[CLL+11], HIVE [Hiv] and HadoopDB [Had].
In the past couple of decades there has been a lot of research going on in developing faster data
access IMDGs are becoming popular hence it is important to study the approaches taken by vari-
ous research groups and companies. Some case studies have been published to improve the IMDG’s
such as [JWY+12] where they implement JPA compatible data accessing layer or Tenzing [CLL+11]
which supports SQL implementation.
GemFire [Gem] uses high concurrent main memory database structure. It uses peer to peer net-
work connection between cluster nodes with native serialization, smart buffering to propagate data
updates faster. It provides synchronous as well as asynchronous data replication with configurable
policy to minimize number of redundant copies for various data types.
Apache Ignite [Igna] provides APIs for predicate based scan queries, SQL queries and text
queries. It is an implementation of JCache [JCa] and supports dynamic sub-clusters, dynamic ForkJoin
tasks, clustered lambda executions and supports SQL99 with full ACID transactions.
GigaSpaces XAP [Gig] uses on board memory as well as SDD to store data. Using SDDs along
with RAM, known as XAP MemoryXtend it aims to handle speed and cost requirements. It supports
transactions and built-in synchroniztion for NoSQL as well as RDBMS type of databases.
Hazelcast [Haz] supports SQL-like features. One can use SQL clauses like WHERE, LIKE, IN,
BETWEEN. It provides in memory as well as persistent storage options. It can be configured to be
used like a cache when persistent storage option is used. Another feature provided by Hazelcast is
Multimap in a distributed environment.
Other notable solutions to mention in the NoSQL scenario are: ”The Apache Cassandra Project
develops a highly scalable second-generation distributed database, bringing together Dynamo’s fully
distributed design ColumnFamily-based data model.” [Cas]
"HBase is an open-source, distributed, versioned, column- oriented store modeled after Google’
Bigtable: A Distributed Storage System for Structured by Chang et al. Just as Bigtable leverages
the distributed data storage provided by the Google File System, HBase provides Bigtable-like capa-
Comparison of Architectures and Performance of Database Replication Systems Rohit Madhukar Dhamane

3.2. IN-MEMORY DATA GRIDS 23
bilities on top of Hadoop." [Hba]
In paper [] Tudorica et al. show a comparison between above mentioned two NoSQL databases and
MySQL. They briefly summaries their results on architectural differences and performance using
YCSB benchmark [CST+10]. However the scope of experiments is limited to checking throughput
of three systems for read/write workloads and not taking into consideration their scalability or fault
tolerance behaviour.
As one can see that there are many options to opt for when in comes to choosing an IMDG. Each
one provide various functionalities with varying degree. However there hasn’t been enough studies
to compare these functionalities under a common ground.
There are some studies like these [Ignb], [DRPQ14], [Coha] done to evaluate IMDGs but mostly
carried out by respective companies who wants to promote their version of IMDG and more often
than not it doesn’t explain the drawbacks associated with their version under many circumstances.
Hence it is important to judge these IMDGs under an independent study and this thesis strives to do
that based on architecture, functionalities and performance with three popular IMDGs available today
in market, namely Oracle Coherence, JBoss Data Grid and Terracotta Ehcache.
Rohit Madhukar Dhamane Comparison of Architectures and Performance of Database Replication Systems
24 CHAPTER 3. RELATED WORK
Comparison of Architectures and Performance of Database Replication Systems Rohit Madhukar Dhamane

Part IV
Relational Systems


Chapter 4
Relational Systems
4.1 Introduction
One of the most demanding needs in cloud computing is that of having scalable and highly avail-
able databases. Currently, databases are scaled by means of sharding [DBS]. Sharding implies to split
the database into fragments (shards). However, transactions are restricted to access a single fragment.
This means that the data coherence is lost across fragments. An alternative would be to leverage the
scalable database replication techniques developed during the last decade that were able to deliver
both scalability and high availability. In this thesis we evaluate some of the main scalable database
replication solutions to determine to which extent they can address the issue of scalability and avail-
ability.
Scalability might be achieved by using the aggregated computer power of several computers. Fail-
ures of computers are masked by replicating the data in several computers.
Many protocols have been proposed in the literature targeting different consistency[KAKA00, PMJPKA00,
KA00, WPS+00, SFW05, AT02, ALZ03, EDP06, RBSS02, CPR+07, DKS06, PCAO06, HJA+02,
PCVO05, NRP06, BGMEZP08, CBPS10, BPGG13, CPPW10, PAÖ08]. Two dimensions are used
to classify the protocols: when replicas (copies of the data) are updated (eager or lazy replication)
and which replicas can be updated (primary copy or update everywhere) [GHOS96]. All replicas
are updated as part of the original transaction with eager replication, while with lazy replication the
replicas are updated after the transaction completes. Therefore, replicas are kept consistent (with the
same values) after any update transaction completes with eager replication. Update everywhere is a
Rohit Madhukar Dhamane Comparison of Architectures and Performance of Database Replication Systems

28 CHAPTER 4. RELATIONAL SYSTEMS
more flexible model than primary copy, since an update transaction can be executed at any replica.
In [CCA08a] Cecchet et al. presented a state of the art analysis in the field of database replication
systems. The authors describe the generic architectures for implementing database replication sys-
tems and identify the practical challenges that must be solved to close the gaps between academic
prototypes and real systems.
Chapter IV, V and VI provides an detailed experimental analysis of the impact that architecture and
design decisions have on the performance of three eager database replication systems (two academic,
Middle-R and C-JDBC, and a commercial one, MySQL Cluster). The reason to choose these systems
was that all three systems try achieve the same goal of providing synchronous replication however
they are based on different architectures. Hence it was an interesting choice to compare these systems
architecture in-depth and also to see how that affects scalability and availability. Furthermore, many
papers propose protocols and compare themselves with at most other protocol using either one bench-
mark or an ad hoc benchmark. To this end, we run a complete performance evaluation of Middle-R,
C-JDBC and MySQL comparing the results of the two industrial benchmarks, TPC-C [TPC10] and
TPC-W [TPC03]. The evaluation also takes into account failures.
4.2 System Architecture
In this section we examine the architecture, replication protocol, fault-tolerance and load balanc-
ing features of Middle-R [PmJpKA05, JPKA02], C-JDBC [CCA08b] and MySQL Cluster [MySb].
Both Middle-R and C-JDBC are implemented as a middleware layer on top of non-replicated databases,
which store a full copy of the database. On the other hand, MySQL Cluster uses a different design:
data is in-memory, partitioned (each node stores a fraction of the database) and commits do not flush
data on disk. In case of Middle-R and C-JDBC the term "Replica" is used to represent a single node
of server where a complete database is replicated. MySQL Cluster officially uses term "Nodes" to
define a server where data is stored. Hence in case of MySQL Cluster the terminology of "nodes" is
maintained to represent a single independent machine throughout the paper.
4.2.1 Middle-R
Middle-R is a distributed middleware for database replication that runs on top of a non-replicated
database [PmJpKA05]. Replication is transparent to clients which connect to the middleware through
a JDBC driver. Since each replica (a node) stores a full copy of the database there is no centralized
component in Middle-R, there is no single point of failure.
Comparison of Architectures and Performance of Database Replication Systems Rohit Madhukar Dhamane

4.2. SYSTEM ARCHITECTURE 29
4.2.1.1 Architecture
An instance of Middle-R runs on top of a database instance (currently, PostgreSQL), this pair
is called a replica. Figure 4.1 shows a replicated database with three replicas. Since the replication
middleware is distributed, it does not become a single point of failure. Clients connect to the replicated
database using a JDBC driver, which is in charge of replica discovery. The driver will broadcast a
message for discovering the replicas of Middle-R. The replicas will answer to the JDBC driver, which
will contact one of the Middle-R replicas that replied to this message to submit transactions. The
replicas of Middle-R communicate among them using group communication [CKV01].
4.2.1.2 Replication Protocol
Each Middle-R replica submits transactions from connected clients to the associated replica. Read
only transactions are executed locally at a single replica. As soon as a read only transaction finishes,
the commit operation is sent to the database and the result sent back to the client. Write transactions
are also executed at a single replica (local replica) but, before the commit operation is submitted to
the database, the writeset is obtained (i.e. the changes applied by transaction) and multicast in total
order to all the replicas (remote replicas). The writeset of a transaction contains the changes the
transaction has executed. Total order guarantees that writesets are delivered in the same order by all
replicas, including the sender one. This order is used to commit transactions in the same order in all
replicas and therefore, keep all replicas consistent (exact replicas). Figure 4.2 shows the components
of each Middle-R instance. When the writeset is delivered at a remote replica, if the transaction does
not conflict with any other concurrent committed transaction, the writeset is applied and the commit
is submitted at the local database. If there is a conflict, the transaction is simply aborted at the local
database and the rest of the replicas discard the associated writeset. Since that process is executed in
the same order at all replicas, all the databases will commit the same set of transaction in the same
order.
Figure 4.1: Middle-R Architecture
Rohit Madhukar Dhamane Comparison of Architectures and Performance of Database Replication Systems

30 CHAPTER 4. RELATIONAL SYSTEMS
Figure 4.2: Middle-R Components
4.2.1.3 Isolation Level
Middle-R implements both snapshot isolation and serializability [BBG+95]. Depending on the
isolation level provided by the underlying database one of the two isolation levels can be used. Since
Middle-R runs on top of PostgreSQL and PostgreSQL provides snapshot isolation as the highest
isolation level (called serializable), this is the isolation level we will use in the evaluation.
4.2.1.4 Fault Tolerance
In Middle-R there is no centralized component. All the replicas work independently of each other
and hence in case of failure of one of the replicas the system availability is not compromised since
there is no single point of failure. If a database fails, the associated instance of Middle-R detects the
failure and it switches off itself. Clients connected to this replica will detect the failure (connections
are broken) and connect to another available replica. The rest of the Middle-R replicas will detect
the failure when a view change message is delivered by the group communication system. These
messages are delivered both when an instance of Middle-R fails and a new instance is included (a
new replica is added to the replicated database). Each Middle-R replica includes a log file. This file
records the writesets. The log file is used to transfer the missing changes to failed replicas when
they are available again. If a completely new replica is added, a dump of the database is sent to it
[JPPMA02].
4.2.1.5 Load Balancing
Clients are not aware of replication when using Middle-R. They use a JDBC driver to connect to
Middle-R. The driver internally broadcasts a multicast message to discover Middle-R replicas. Each
replica replies to this message and includes information about its current load. The JDBC driver at
Comparison of Architectures and Performance of Database Replication Systems Rohit Madhukar Dhamane

4.2. SYSTEM ARCHITECTURE 31
the client side decides which replica to connect to based on this information. A simple algorithm is
followed: The replica with lowest load is chosen.
4.2.2 C-JDBC
C-JDBC is also a middleware for data replication [CMZ04a]. Database replication is achieved by
a centralized replication component that sits in between the client component of the JDBC driver and
the database drivers. As shown in Figure 4.3, the client application uses the JDBC driver to connect to
the C-JDBC server. C-JDBC is configured for each database backend. It uses database specific driver
to connect with the database backend. If the three databases (DB1, DB2 and DB3) are different, the
divers will be different.
4.2.2.1 Architecture
Figure 4.3 shows the architecture of C-JDBC. The client interacts with the C-JDBC server (i.e.
database replication middleware) using a C-JDBC specific JDBC driver. C-JDBC server uses a
database specific JDBC driver to connect to various database backends. Hence, C-JDBC server acts
as single point of contact between the clients and database backends. Figure 4.4 shows the deploy-
ment of C-JDBC. C-JDBC exposes a single database view to the client called as “Virtual Database“
[CCA08b] [CMZ04a]. Each virtual database consists of an Authentication Manager, Request Man-
ager and Database backend.
4.2.2.2 Replication Protocol
The components of C-JDBC replication middleware are depicted in Figure 4.4 [CCA08b]. In
C-JDBC the request manager handles the queries coming from the clients. It consists of a scheduler,
a load balancer and two optional components, namely a recovery log and a query result cache. Sched-
ulers redirect queries to the database backend. The begin transaction, commit and abort operations are
sent to all the replicas, on the other hand reads are sent to only single replica. Update operations are
multicast in total order to all the replicas. There are two important differences with Middle-R: first,
Figure 4.3: C-JDBC Architecture
Rohit Madhukar Dhamane Comparison of Architectures and Performance of Database Replication Systems

32 CHAPTER 4. RELATIONAL SYSTEMS
Figure 4.4: C-JDBC Components
Middle-R is distributed, while C-JDBC is centralized. Second, Middle-R only sends one message per
write transaction, while C-JDBC sends a total order multicast message per write operation.
4.2.2.3 Isolation Level
The scheduler can be configured for various isolation levels. C-JDBC scheduler by default sup-
ports serializable isolation and also defines its own isolation levels (pass-through, optimisticTransac-
tion, pessimisticTransaction).
4.2.2.4 Fault Tolerance
C-JDBC is a centralized middleware. Failure of the request manager results in the system unavail-
ability due to inaccessible scheduler, load balancer and recovery log components. Upon restarting
the failed replica, recovery log is used to automatically re-integrate the failed replicas into a virtual
database. The recovery log records a log entry for each begin, commit, abort and update statement.
The recovery procedure consists in replaying the updates in the log. This is similar to Middle-R,
however C-JDBC records more operations.
4.2.2.5 Load Balancing
C-JDBC load balancing is limited to decide on which replica a read operation is executed, since
all write operations are executed at all replicas.
Comparison of Architectures and Performance of Database Replication Systems Rohit Madhukar Dhamane

4.2. SYSTEM ARCHITECTURE 33
Figure 4.5: MySQL Cluster.
4.2.3 MySQL Cluster
MySQL Cluster is based on shared nothing architecture to avoid a single point of failure. MySQL
Cluster integrates MySQL server with an in-memory storage engine called NDB (Network Database).
MySQL Cluster is an in-memory distributed database. This makes this system different to the previ-
ous ones, which are not in-memory databases.
4.2.3.1 Architecture
A MySQL Cluster consists of a set of nodes, each running either MySQL servers (for access to
NDB data), data nodes (for storing the data), and one or more management servers (Figure 4.5). NDB
nodes store the complete set of data in-memory. At least two NDB data nodes (NDBD) are required to
provide availability. The management node responsibility is to look after other nodes of the MySQL
Cluster. It provides the configuration data, and starting and stopping functionality.
4.2.3.2 Replication Protocol
To provide full redundancy and fault tolerance MySQL Cluster partitions and replicates data on
data nodes. Each data node is expected to be on a separate physical node. There are as many data
partitions as data nodes. Data nodes are grouped in node groups depending on the number of replicas.
The number of node groups is calculated as the number of data nodes divided by the number of
replicas. If there are 4 data nodes and 2 replicas, there will be 2 node groups (each with 2 data nodes)
and each one stores half of the data (Figure 4.6). At a given node group (Node group 0) one data node
(Node 1) is the primary replica for a data partition (Partition 0) and backup of another data partition
(Partition 1). The other node (Node 2) in the same node group is primary of Partition 1 and backup
of Partition 0. Although, there could be up to 4 replicas, MySQL cluster only supports 2 replicas.
Rohit Madhukar Dhamane Comparison of Architectures and Performance of Database Replication Systems

34 CHAPTER 4. RELATIONAL SYSTEMS
Figure 4.6: MySQL Cluster Partitioning
Tables are partitioned automatically by MySQL Cluster by hashing on the primary key of the table
to be partitioned. Although, user-defined partitioning is also possible in recent versions of MySQL
Cluster (based on the primary key). All the transactions are first committed to the main memory
and then flushed to the disk after a global checkpoint (cluster level) is issued. These two features
differentiate MySQL cluster from Middle-R and C-JDBC. Each replica in both systems stores a full
copy of the database (not a partition) and when a transaction commits, data is flushed to disk. There
are not durable commits on disk with MySQL Cluster. When a select query is executed on a SQL
node, depending on the table setup and the type of query, the SQL node issues a primary key look
up on all the data nodes of the cluster concurrently. Each of the data nodes fetches the corresponding
data and returns it back to the SQL node. SQL Node then formats the returned data and sends it back
to the client application. When an update is executed, the SQL node uses a round robin algorithm to
select a data node to be the transaction coordinator (TC). The TC runs a two-phase commit protocol
for update transactions. During the first phase (prepare phase) the TC sends a message to the data
node that holds the primary copy of the data. This node obtains locks and executes the transaction.
That data node contacts the backup replica before committing. The backup executes the transaction
in a similar fashion and informs the TC that the transaction is ready to commit. Then, the TC begins
the second phase, the commit phase. TC sends a message to commit the transaction on both nodes.
The TC waits for the response of the primary node, the backup responds to the primary, which sends
a message to the TC to indicate that the data has been committed on both data nodes.
4.2.3.3 Fault Tolerance
Since data partitions are replicated, the failure of a node hosting a replica is tolerated. If a failure
happens, running transactions will be aborted and the other replica will take over. A data partition
Comparison of Architectures and Performance of Database Replication Systems Rohit Madhukar Dhamane

4.2. SYSTEM ARCHITECTURE 35
is available as far as a node in a node group is available. MySQL Cluster performs logging of all
the database operations to help itself recover from total system failure. The log is stored on the file
system. All the operations are replayed to recover from the time of failure. In case of, a single node
failure the data node has to be brought up on-line again and MySQL Cluster will be aware of the new
data node coming on-line again. The data node will replicate/synchronize relevant data with other
data node in its node group and it will be ready again.
4.2.3.4 Isolation Level
MySQL Cluster only supports the read committed isolation level. This means that MySQL Clus-
ter provides a more relaxed isolation level than Middle-R and C-JDBC. More concretely, non repeat-
able reads and phantoms are possible [BBG+95].
4.2.3.5 Load Balancing
Various load balancing techniques such as MySQL proxy [MyS13] or Ultra Monkey [Ult] can be
deployed for load balancing the queries over MySQL nodes and the application clients
Rohit Madhukar Dhamane Comparison of Architectures and Performance of Database Replication Systems

36 CHAPTER 4. RELATIONAL SYSTEMS
Comparison of Architectures and Performance of Database Replication Systems Rohit Madhukar Dhamane
Part V
Benchmark Implementations


Chapter 5
Benchmark Implementations
5.1 Database Benchmarks
Database systems can be loosely divided into two types, Transactional and Analytical. Transac-
tional systems are classified as On-Line Transactional Processing or OLTP. These systems include
a number of short queries bundled in a transaction. The goal of OLTP systems is to provide very
fast query processing and maintaining data integrity. The results returned by these queries are often
very short. These transactions control and run tasks to accomplish a business goal. OLTP schema
is normalized. The operational data is usually very critical for business and loss of data can affect
business critically. Hence these systems are backed-up religiously.
On the other hand Analytical systems are known as On-Line Analytical Processing or OLAP. These
system are different from OLTP systems functionally. OLAP systems are deployed to do more com-
plex jobs. The number of transactions are typically lower than OLTP and queries can be quite complex
involving aggregation. OLAP use star. snowflake and constellation schemas. OLAP systems are used
widely in data mining techniques.
Following sections describe two OLTP benchmarks, namely TPC-C and TPC-W, and one OLAP
benchmark TPC-H. The systems studied in this thesis are mainly focussed on transactional process-
ing hence OLTP benchmarks are used for study in-depth over OLAP benchmark. Even though TPC-C
and TPC-W are both OLTP benchmarks there are some fundamental differences. While TPC-W uses
emulated browsers to run the workload, TPC-C does not. Instead it uses multiple terminals to run
workload. The differences in database schema, time constrains are different for both benchmarks. In
the following sections each benchmark is described in details with respect to their implementation
Rohit Madhukar Dhamane Comparison of Architectures and Performance of Database Replication Systems

40 CHAPTER 5. BENCHMARK IMPLEMENTATIONS
Figure 5.1: TPC-C Database Schema
used for this study.
5.2 TPC-C Benchmark
The TPC-C Benchmark [TPC10] is an on-line transaction processing (OLTP) benchmark. It sim-
ulates business tasks usually faced in an industry where managing and selling products or services
is important. It consists of five transactions that run concurrently. These transactions have different
complexity and focus on tasks such as reading/updating/inserting or deleting data. It provides multi-
ple terminal sessions which run in parallel. TPC-C tests database systems for ACID properties. The
database for TPC-C include nine tables with varying range of records and sizes. Figure 5.1 shows the
schema for TPC-C benchmark database.
Each warehouse serves ten districts and maintains stock for the 100,000 items. Each district serves
3,000 customers. Customers place new orders or ask for the status of an order. An order has an av-
erage of ten order lines. The number of warehouses is selected while populating the database. There
are five types of workloads described in TPC-C benchmark namely, New Order, Payment, Order Sta-
tus, Delivery and Stock-Level. These transactions perform tasks such as checking inventory, updating
user records, performing delivery updates etc. Each transaction is executed in certain percentage dur-
ing the course of experiment, which is described in workload Table 5.1. Details of transactions are
described in further detail in Workload Description section.
In this chapter we will discuss the two benchmark clients based on TPC-C Benchmark, EscadaTPC-
C 5.2.1 and BenchmarkSQL 5.2.3.
Comparison of Architectures and Performance of Database Replication Systems Rohit Madhukar Dhamane

5.2. TPC-C BENCHMARK 41
5.2.1 EscadaTPC-C Benchmark Client
EscadaTPC-C is a benchmark written in JAVA which closely resembles TPC-C standards [Esc08].
It supports databases such as MySQL, Derbv and PostgreSQL. The database schema of EscadaTPC-
C benchmark is very similar to the one defined by official TPC-C benchmark. We have used the
workload defined by official TPC-C benchmark, which is 43% Payment, 4% Stock Level, Delivery
and Order Status transactions. EscadaTPC-C provides a workload configuration file where one can
define various parameters such as number of clients, workload, number of warehouses, think time,
ramp up/down time, experiment time etc. For Middle-R we had to make some changes to the default
schema of the database since multiple primary keys are not supported by Middle-R. We converted
the multiple primary key variable in a table to a single primary key of string variable. To insert this
primary key into the table a string variable was added to the table schema as the only primary key for
that table. For example the following insert statement for order_line table was modified to insert a
single string primary key "id".
Statement = con.prepareStatement("insert into order_line (ol_o_id, ol_d_id, ol_w_id, ol_number,
ol_i_id, ol_supply_w_id, ol_delivery_d, ol_quantity, ol_amount, ol_dist_info) values (?,?,?,?,?,?,?,?,?,?)");
was converted to
String id = Integer.toString(ol_o_id)+"-"+ Integer.toString(ol_d_id)+"-"+Integer.toString(ol_w_id)+"-
"+Integer.toString(ol_number);
where ol_o_id, ol_d_id, ol_w_id, ol_number were the primary keys for order_line table by default.
Statement = con.prepareStatement("insert into order_line (id, ol_o_id, ol_d_id, ol_w_id, ol_number,
ol_i_id, ol_supply_w_id, ol_delivery_d, ol_quantity, ol_amount, ol_dist_info) values (?,?,?,?,?,?,?,?,?,?,?)");
Similar changes were applied to INSERT statements for New-Order table and Order table. Also
in History table an integer field, id was added to the schema as a primary key. By default History
table did not contain any primary keys but since Middle-R requires a table to have a primary key
when inserts are made this was a requirement. To populate the database similar changes were made
to Populate.java code for database schema and primary keys.
For tests with C-JDBC we have used same modified version of the Benchmark client as above men-
tioned. For MySQL Cluster we have used the default benchmark client.
5.2.2 Workload Description
There are five transactions in TPC-C. They are defined as follows:
(a) New-Order. This transaction performs a complete order and performs reads and writes. Its execu-
tion is frequent with strict response time requirements. This transaction performs updates on district,
stock tables and, inserts on new order, order and order line tables. The total number of New-Order
Rohit Madhukar Dhamane Comparison of Architectures and Performance of Database Replication Systems

42 CHAPTER 5. BENCHMARK IMPLEMENTATIONS
transactions completed during benchmark execution defines the throughput of the system.
(b) Payment. This transaction is also a read/write transaction that updates the customer balance. It
also performs district and warehouse statistics. It updates customer and district tables and also per-
forms insert operations on history table. It has a very high frequency of execution.
(c) Order-Status. This transaction performs tasks to query status of last order done by a customer. It
is a read only transaction which performs read queries over order, order line and customer tables. It
has a low frequency of execution.
(d) Delivery. This transaction processes a batch of 10 undelivered new orders. Each order is pro-
cessed as a read-write transaction. This transaction is executed in deferred mode through a queuing
mechanism. It performs updates on order, order line and customer tables and read and delete queries
on new order table.
(e) Stock-Level. This is a heavy read only transaction which finds for the 200 most recently sold
items, the items that are below a specified threshold. It performs read queries over stock, order line
and district tables. The execution of this transaction is very low and response time is not stringent.
The number of New-Order transactions performed over the testing period is used to calculate the
throughput in terms of tpmC (transactions per minute) to measure the system performance. The
workload is made by 45 % of New Order, 43 % of Payment, 4 % of Order Status, 4 % of Stock Level
and 4 % of Delivery transactions, which made a workload of 8% of read only transactions and 92% of
read-write transactions. In our evaluation we have used EscadaTPC-C [Esc08]. EscadaTPC-C is an
implementation of the TPC-C benchmark that supports PostgreSQL, MySQL and Derby databases.
The database population depends upon the number of warehouses. For experiments of this paper
the number of warehouses used for populating the database are 3, 5,10 and 15. Also, maximum
number of concurrent clients that each benchmark can run is defined as ten times the number of ware-
houses. Hence the maximum number of clients in each experiment varies from 30 (for number of
warehouses=3) to 150 (for number of warehouses=15). The databases were populated according to
the number of warehouses. With 3 warehouses the database size was 226MB, with 5 warehouses
the size was 612MB, with 10 warehouses the database size was 1210MB, and finally, for 15 ware-
houses it was 1812MB. Table 5.1 summarises the transaction workload, keying time, think time and
maximum response time for each type of transaction.
5.2.3 BenchmarkSQL Benchmark Client
BenchmarkSQL is an open source JDBC benchmark application closely resembling the TPC-C
standard for OLTP. BenchmarkSQL can be used with at many different databases. It’s a Java applica-
tion, hence it’s OS and platform unaware using database neutral drivers for database communication.
Comparison of Architectures and Performance of Database Replication Systems Rohit Madhukar Dhamane

5.3. TPC-W BENCHMARK 43
Table 5.1: Transaction workload, keying time, think time and maximum response time (RT -all timesin seconds)
Transaction Workload Keying Time Think Time 90th Percentile RT
New Order 45% 18 12 4.9Payment 43% 3 12 2.1
Order Status 4% 2 10 3.5Stock Level 4% 2 5 17.8
Delivery 4% 2 12 15.2
(a) Database Schema (b) Workload
Figure 5.2: TPC-W Database Schema and Workload
The result is a comparison based on the core SQL processing and transaction handling abilities of
the database. The BenchmarkSQL Client models a wholesale supplier managing orders. The test is
designed to impose a transaction load on a database and track the amount of new orders placed and
completed under this load. In addition to transaction processing, it puts together operations into large
transactions. Transactional and referential integrity is ensured throughout the duration of the test by
comparing transaction history with actual results. We ran this benchmark with Middle-R and MySQL
Cluster successfully however with C-JDBC we were unable to run the benchmark client properly
since C-JDBC did not properly support handling of SELECT...FOR UPDATE query used in New-
Order transaction of BenchmarkSQL. C-JDBC does not has a specific handling for ’select for update’
which means that the write lock will only be taken on one node. Due to this the transactions seems
to run into dead lock and eventually halt the benchmark client from completing the queries. Hence
we had to abandon the decision to use BenchmarkSQL to compare the three replication systems. So,
instead we have used EscadaTPC-C for our experiments.
5.3 TPC-W Benchmark
TPC-W [TPC03] benchmark exercises a transactional web system (internet commerce applica-
tion). It simulates the activities of web retail store (a book store). The TPC-W workload simulates
various complex tasks such as multiple on line browsing sessions (e.g., looking for books), placing
Rohit Madhukar Dhamane Comparison of Architectures and Performance of Database Replication Systems

44 CHAPTER 5. BENCHMARK IMPLEMENTATIONS
orders, checking the status of an order and administration of the web retail store. The benchmark
not only defines the transactions but, also the web site. Although both TPC-C and TPC-W are OLTP
benchmarks there are some major differences. TPC-W applies workload via emulated browsers un-
like TPC-C which generates multiple terminals to run workload. The basic TPC-W schema consists
of eight tables (Figure 5.2-a). The number of clients (emulated browsers) and the size of the bookstore
inventory (item) define the database size. The number of items should be scaled from one thousand
till ten million, increasing ten times in each step. In TPC-W there are two parameters: the number of
emulated browsers to be tested and the number of items in the bookstore.
5.3.1 TPC-W Java Benchmark Client
We have used a JAVA based TPC-W benchmark client [CRML01] for evaluation of replication
systems Middle-R, C-JDBC and MySQL Cluster. This benchmark client is designed to emulate the
web server and transaction processing system of a typical e-commerce web site. It uses JAVA servlets
to execute TPC-W interactions under a specific workload. The servlet API provides Java libraries
for receiving and responding to HTTP requests and maintaining state for each user session. This
benchmark client application defers from the TPC-W specifications in some ways: It does not use
secure socket layer for the buy confirm interaction and credit card authorization. Hence compared to
the specification it does less work while performing these operations. Although the amount of these
interactions is very less(around 2% to 10 %) hence it does affect the behaviour of the workload. For
our experiments with Middle-R we had to add the sequences to the default schema. These sequences
were unique for each replica. For each insert statement they incremented with a unique value for each
replica there by avoiding replicating the same data twice across the replicating nodes.
5.3.2 Workload Description
TPC-W specification defines three workloads by changing the ratio of browse to operations:
browsing, shopping and ordering. The browsing mix performs web actions which produce a read
intensive workload on the database (95% browse transactions, 5% order transactions). More than
50 % of transactions of this profile are searches. The shopping mix consists of 80% of browse
transactions and 20% of order transactions. The ordering profile produces a more write oriented
workload on the database (50% browse and 50% order transactions). Figure 5.2-b reports the per-
centage of transactions in the browse and order transactions along with 90th percentile transaction
response time constraints (Web interaction response time - WIRT). The most frequent operations for
these profiles are the SearchRequest, which returns a web page containing detailed information on
a selected item, and Shopping Cart, which updates the associated cart and always returns a web
page which displays the updated content of the user’s cart. We have used three sizes of databases
Comparison of Architectures and Performance of Database Replication Systems Rohit Madhukar Dhamane

5.4. TPC-H 45
Table 5.2: Number of rows in tables for three databases used in the experiments and database sizeDatabase EBS Items Customers Addresses Orders Size
Database-1 50 10,000 144,000 288,000 129600 228 MBDatabase-2 100 10,000 288,000 576,000 259200 530 MBDatabase-3 50 100,000 144,000 288,000 129600 850 MB
in our experiments. Using different number of emulated browsers (EBS) and Items we varied tables
composition in database. Table 5.2 summarises the number of rows in tables for each database used
for experiments and its size.
5.4 TPC-H
We performed TPC-H experiment on PostgreSQL-9.3 version of PostgreSQL Database. TPC
Council provides a tool named DBGEN to generate data and scripts to run TPC-H Benchmark.
Even though the DBGEN tool does not support PostgreSQL database out of the box, it is still quite
easy to make it work with PostgreSQL. For our experiment we did the following :
Download the TPC-H benchmark .zip file from TPC website and extracted in the home folder. [TPC]
Next step was to modify the Makefile before compiling the code as shown below -
CC = gcc
DATABASE = ORACLE
MACHINE = LINUX
WORKLOAD = TPCH
This compiled the DBGEN tool which we used to generate the data in a CVS format. We ran the
command ./dbgen− s1 to generate about 1GB of raw data. This gives us eight .tbl files with a CSV
format, each containing data for one table. By default this data is in such a format where each row
contains an extra |, which is not supported by the PostgreSQL database. Hence to remove this extra
|we ran the following command:
foriin‘ls ∗ .tbl‘; dosed′s/|$//′$i > $i/tbl/csv; echo$i; done;
and then after creating the table we loaded these files in to the database and finally ran the alter
queries to generate the foreign keys. The details of createtable and forignkeys can be found in the
appendix section 12.4 12.5.
TPC-H defines 22 queries or template stored in the query directory. Using the QGEN tool provided
in the package we can generate the required workload comprising of these queries (template). We
also modified the queries to use LIMIT instead of ROWCOUNT which is DB specific. Once
done that, we ran the following commands to generate the workload :
Rohit Madhukar Dhamane Comparison of Architectures and Performance of Database Replication Systems

46 CHAPTER 5. BENCHMARK IMPLEMENTATIONS
Figure 5.3: TPC-H Results
$DSS_QUERY = queries− pg./qgenx > workload− x.sql
The x was the number of template. We created 22 separate workloads (workload-1,-2,. up to .,-22)
for each template. We ran each workload individually over the TPC-H database and checked the
corresponding response time for each workload. Figure 5.3 shows results for the experiment. This
experiment was done to understand the working of another TPC benchmark (apart from TPC-C and
TPC-W which are main benchmarks used in the thesis). It can be seen that maximum response time
reported by a workload was around 4.5 seconds and minimum was around 1 second. Table 5.3 shows
the size of each table in database and it’s size. Total database size was 1667 MB.
• Table – The name of the table
• Size – The total size that this table takes
• External Size – The size that related objects of this table like indices take
5.4.1 Shared Buffers and Cache Tuning
One aspect of any database system that is very important to take into consideration is making sure
that DBMS is configure to optimum level for the application being used. One of the simplest way to
Comparison of Architectures and Performance of Database Replication Systems Rohit Madhukar Dhamane

5.4. TPC-H 47
Table 5.3: TPC-H Database Schema and Table SizeTable Size External Size Number of Rows
lineitem 1195 MB 258 MB 6001215orders 232 MB 26 MB 1500000
partsupp 165 MB 24 MB 800000part 35 MB 3544 kB 200000
customer 31 MB 2672 kB 150000supplier 2024 kB 224 kB 10000nation 24 kB 16 kB 25region 24 kB 16 kB 5
do that is to increase the shared buffers and cache memory in configuration. Figure 5.4 shows results
of TPC-H benchmark on PostgreSQL database using various sizes of shared and cache memory. As
it can be seen increasing the cache and shared memory together cuts the response times in almost
half for many workloads. This is because when there is more memory allocated to shared buffers
and cache, database can store recently fetched data there and reduces the use of disk I/O greatly in
subsequent fetches. We have followed similar strategies for tuning our database for experiments to
follow in following sections.
Figure 5.4: TPC-H Shared Memory Results
Rohit Madhukar Dhamane Comparison of Architectures and Performance of Database Replication Systems
48 CHAPTER 5. BENCHMARK IMPLEMENTATIONS
Comparison of Architectures and Performance of Database Replication Systems Rohit Madhukar Dhamane

Part VI
Database Replication SystemsEvaluation


Chapter 6
Database Replication SystemsEvaluation
6.1 Experiment Setup
We have used three experiment setups with two, four and six replicas for each replication system
under test to check the scalability of each system. All the machines used for the experiments are Dual
Core Intel(R) Pentium(R) D CPU 2.80GHz processors equipped with 4GB of RAM, and 1Gbit Ether-
net and a directly attached 0.5TB hard disk. All the machines run Ubuntu 8.04 32xOS. The versions
of the replication systems used in the experiments are: MySQL Cluster 5.1.51, PostgreSQL-7.2 for
Middle-R and C-JDBC 2.0.2. The benchmark clients (either TPC-C or TPC-W) are deployed on a
different node and each replica of the replicated database runs on a different node. The experiment
setup for two replicas is described in Figure 6.1. For experiments with four and six replicas additional
machines were added to the setup. Each replica contained a full copy of the database when using
Middle-R and C-JDBC. Figure 6.1-a shows a Middle-R deployment with two replicas. On each node
there is one replica: a PostgreSQL database and an instance of Middle-R. Both C-JDBC and MySQL
Cluster use one more node than Middle-R that acts as proxy/mediator for MySQL among the bench-
mark client and the middleware replicas or runs the C-JDBC server (it is a centralized middleware).
Each C-JDBC replica runs an instance of PostgreSQL database (Figure 6.1(b)). In MySQL Cluster,
each node runs both a MySQL server and a data node (like in Middle-R) and there is also a front end
node (like in C-JDBC) that runs a management server (to start/stop/monitor the cluster) and a proxy
for load balancing (Figure 6.1(c)). Since MySQL only supports up to two replicas when there more
Rohit Madhukar Dhamane Comparison of Architectures and Performance of Database Replication Systems

52 CHAPTER 6. DATABASE REPLICATION SYSTEMS EVALUATION
Figure 6.1: Two Replica Deployment. (a) Middle-R, (b) C-JDBC, (c) MySQL Cluster
Figure 6.2: TPC-C: Throughput
than two replica nodes, each replica node does not store a full copy of the database. The number of
node groups is the number of data nodes divided by the number of replicas (2). Therefore, there are
2 node groups and 4 partitions for the 4 replica setup and 3 node groups and 6 partitions for the 6
replica setup. Each node group stores the primary of a partition and a backup of another partition. We
ran each test for twenty minutes: five minutes for warm-up and cold down phases and a measurement
interval of ten minutes (steady state).
6.2 TPC-C Evaluation Results
Figures 6.2 and 6.3 show the throughput and response time of the three systems using EscadaTPC-
C. Exceptionally high response times for certain points have been omitted from the Response Time
graph in Figure 6.3 -(b),(c),(d),(h),(j),(k) so as not to loose details of lower values of Y-axis, which is
Comparison of Architectures and Performance of Database Replication Systems Rohit Madhukar Dhamane

6.2. TPC-C EVALUATION RESULTS 53
Figure 6.3: TPC-C: Average Response Time
the most important part. The results are shown for experiments with two (first row), four (second row)
and six nodes (third row) and varying number of warehouses (different columns). With two replicas
the systems show a similar throughput with small databases (up to 5 warehouses (WH)). MySQL
Cluster and C-JDBC behave slightly better than Middle-R when the database size increases (10 WH).
However, when the database does not fit in memory (15 WH), MySQL Cluster cannot be executed (it
is an in-memory database). Both C-JDBC and Middle-R were able to perform nicely upto the desired
100 clients (WH-10) and 150 clients (WH-15) limit with 2 replicas. From the results obtained for
experiments with two replica setup Middle-R performed best among three replication system.
The results are similar with four replicas. In this case the performance of C-JDBC and Middle-R drops
for 10 WH compared to 2 replicas. This lack of scalability is more noticeable when the database size
increases (15 WH). None of these systems were able to handle the maximum number of clients (150
clients). With six replicas, this is true with the database of 10WH. C-JDBC and MySQL Cluster
are able to handle maximum number of clients (100), Middle-R fails to handle the maximum load.
None of the systems were able to run with the largest database (15 WH) with six replicas. MySQL
Cluster performance is the best one when the database fits in memory. There are several reasons: it is
a commercial product (Middle-R is a research prototype), MySQL cluster implements read commit-
ted isolation, while the other two systems provide either snapshot isolation or serializability which
reduces the concurrency in the system. Finally, MySQL Cluster is an in-memory database and when
the database fits completely in the available memory it was able to perform well. Except for the
database with 15 warehouses, MySQL Cluster fulfilled the requirements to run maximum number of
clients that can be run for the selected database and number of nodes. Regarding the response time,
Rohit Madhukar Dhamane Comparison of Architectures and Performance of Database Replication Systems

54 CHAPTER 6. DATABASE REPLICATION SYSTEMS EVALUATION
all systems were able to fulfil maximum response time of benchmark for different transactions (5 sec-
onds for new order transaction). Response time for C-JDBC is the lowest among the three systems in
most of the experiments with small databases (Figure 6.3). It increases for both Middle-R an C-JDBC
when the database size increases. Only MySQL Cluster is able to keep the response time lower in
comparison even with bigger databases. For large databases like 10-WH and 15-WH, response time
for C-JDBC is highest among three replication systems.
The number of replicas is varied in the experiments with TPC-W in the same way as experiments
with TPC-C. We ran experiments with two, four and up to six replicas. The experiment setup for the
three replication systems was same as the one followed for TPC-C shown in Figure 6.1. Database on
each replica was populated using three databases shown in Table 5.2. Each experiment was run for
20 minutes (ten minutes for warm-up/cold-down and ten minutes steady state).
6.3 TPC-W Evaluation Results
Figures 6.4, 6.5 and 6.6 shows the results for Shopping workload, and Figures 6.7, 6.8 and 6.9
shows the results for Browse workload with Database-1, Database-2 and Database-3 respectively.
In Figure 6.4 the throughput increases linearly up to 450 clients for all configurations with two repli-
cas. However, it is observed that MySQL Cluster shows higher response time in comparison to other
two systems. For same workload, Middle-R and C-JDBC response times are similar and very low in
comparison to MySQL Cluster. This happens because in case of Middle-R and C-JDBC replicas store
a full replica of the database and therefore, they can be used to run more read requests in parallel.
For MySQL Cluster database is partitioned and distributed over many data nodes hence increasing
the response time for fetching the results.
In Figure 6.5 again the throughput increases linearly for all the systems, however closer inspection
of results in the range of 10 to 100 clients shows that the response times have increased considerably
in comparison to the tests with Database-1. Middle-R shows much higher response times in the
beginning but around 30 clients the response times are similar to that of other systems. MySQL
Cluster shows response times increasing with increase in number of data nodes. C-JDBC showed
similar response times as others but after 100 clients it was not able to finish the experiments in
stipulated time (20 minutes). For higher load Middle-R saturates at around 300 clients. In comparison
to Database-1 experiments the response times have increased to almost three times with Database-2.
The results from experiments with Database-3 are shown in the Figure 6.6. Database-3 is a database
with number of items in the population code increased from 10,000 to 100,000 compared to previous
two databases. Hence very high response times and lower throughout was expected. As we can see
from the Figure 6.6, the response times for all the systems are well over 10,000 milliseconds and drop
Comparison of Architectures and Performance of Database Replication Systems Rohit Madhukar Dhamane

6.3. TPC-W EVALUATION RESULTS 55
Figure 6.4: TPC-W: Throughput and Response Time (Shopping : Database-1)
in throughput is quite significant as well. For example, in case of 100 clients throughput achieved for
Database-1 and Database-2 with all experiment setups were around 15 WIPS, however for Database-3
throughput is dropped to less than 6 WIPS. Also from all the above experiments with shopping mix
workload, varying number of replicas does not show significant difference in throughput for any of
the three databases used.
Now we will look at the results from experiments browsing workload. This experiments goal was to
study the performance of three replication systems for read intensive workload.
Figure 6.7, shows results for Database-1 with browse workload. The throughput of all the systems
increases linearly. All the systems show similar throughputs. C-JDBC worked well up to 100 clients
with 4 and 6 replica setup but after that it was not able to finish the experiments in stipulated time
(20 minutes). MySQL Cluster was able to handle load upto 500 clients with 2 and 4 data nodes
setup although the response times were much higher in comparison to the other two systems. Here
Middle-R showed much lower response times with 2, 4 and 6 replica experiment setup. During the
experiments, the response times were between 40 to 80 millisecond for Middle-R, which was much
better than MySQL Cluster or C-JDBC.
Figure 6.8 shows the results for Database-2 with browse workload. We can see here that all three
replication systems increased response times compared to results form experiments with Database-1
in Figure 6.7. Also, the response times for Middle-R are much better than MySQL Cluster or C-
JDBC. The response times for Middle-R running with 6 replicas vary between 25 to 80 milliseconds
for 10 to 100 clients on the other hand MySQL Cluster for instance shows values ranging between 90
to 100 milliseconds. The reason we see better response times for Middle-R with higher number of
Rohit Madhukar Dhamane Comparison of Architectures and Performance of Database Replication Systems

56 CHAPTER 6. DATABASE REPLICATION SYSTEMS EVALUATION
Figure 6.5: TPC-W: Throughput and Response Time (Shopping : Database-2)
replicas is two folds -
(1) Unlike MySQL Cluster, Middle-R stores a complete set of database on each replica. MySQL
Cluster stores database in partitions across the data nodes as explained before in section 4.2.3.2.
(2) Since browse workload is read intensive, when the load is well balanced across replicas with very
little write requests queries are executed locally and results are sent back to the clients as soon as the
transaction finishes. In MySQL Cluster, due to partitioning data has to be fetched from different data
nodes which is more resource intensive and requires inter node communication which adds extra time
to complete the queries.
Figure 6.9 shows the results for Database-3 which is the largest database used in the experiments.
The throughput in this case for all the systems has reduced considerably and response times are
extremely high in the range of 17,000 to 19,000 milliseconds under moderate load of 10 to 100
clients. For higher number of replicas (4 and 6) we can see slight increase in throughput for three
systems. This was not observed for experiments with smaller database, Database-1 (Figure 6.7. This
behaviour is similar to experiments with shopping mix workload of Database-3 (Figure 6.6). In this
experiment C-JDBC with 6 replicas could not finish the test with more than 30 clients successfully
and for experiments with 2 and 4 replicas the response times were much higher than Middle-R.
Middle-R showed better response times when running with higher loads of 60 to 100 clients on the
6 replica setup. Only MySQL Cluster could perform transactions with more than 100 clients with
saturation point reaching at around 200 clients. Comparing results of both benchmarks, i.e. TPC-C
and TPC-W we have observed that average response time increases significantly in both cases with
bigger databases and more replicas (nodes).
Comparison of Architectures and Performance of Database Replication Systems Rohit Madhukar Dhamane

6.4. FAULT TOLERANCE EVALUATION 57
Figure 6.6: TPC-W: Throughput and Response Time (Shopping : Database-3)
6.4 Fault Tolerance Evaluation
The goal of this set of experiments is to evaluate the performance when there are failures in the
systems. More concretely, how long the system needs to recover from a failure. For this we shut
down one of the replicas and show the evolution of the response time before and after the failure. The
replication systems were deployed with two replicas as described in Figure 6.1. We ran experiments
using both benchmarks, TPC-C and TPC-W. Also, workload was chosen so as to make sure that none
of the systems were saturated during experiment.
6.4.1 TPC-C Fault Tolerance
Here, we show how the response time of TPC-C is affected when there is a failure. For this
we shut down one of the replicas when the system is in steady state. The database used for this
experiment was populated with 3 warehouses and number of clients used for running the benchmark
client were 30. After running the benchmark for sometime to reach a steady state we shut down one
of the replicas, for Middle-R the replica was killed at 800 seconds, for C-JDBC at 750 seconds and
for MySQL Cluster at 780 seconds. In Figure 6.10 the point where one of the two replicas is killed
is marked with a dotted vertical line. The graph after that point describes the response time for each
transaction with just one replica running.
When one of the replicas is killed during the experiment it is expected that the system will take
some time to stabilize from failure of the replica. When Middle-R looses one replica a sudden spike
in response time is observed. Although it does not take too long for Middle-R to stabilize after loss of
Rohit Madhukar Dhamane Comparison of Architectures and Performance of Database Replication Systems

58 CHAPTER 6. DATABASE REPLICATION SYSTEMS EVALUATION
Figure 6.7: TPC-W: Throughput and Response Time (Browse : Database-1)
one replica. Within a span of 10 seconds it is seen stabling and the response times are same as before
the loss of one replica.
For C-JDBC, when one of the replicas is killed it takes about 100 seconds for system to stabilize.
During that time the response times reported are much higher than the ones reported before the loss
of a replica. As the system stabilizes we see the repose times for transactions going down (after 860
seconds).
For MySQL Cluster the response times before the loss of one data node (a replica) is much higher
than the one reported after (replica failure at 780 seconds). MySQL Cluster takes hardly any time to
stabilize itself after the loss of one of the data nodes. This can be attributed to the fact that MySQL
Cluster is an In-memory distributed database and with just one replica left after the failure there is no
need for data synchronization. Hence from this experiment we found that MySQL Cluster is fastest
to recover from a replica failure and C-JDBC takes the longest. Middle-R also shows much better
recovery compared to C-JDBC.
6.4.2 TPC-W Fault Tolerance
In this Section we repeat the same experiment using the TPC-W benchmark with Database-1 in
Table 5.2. The benchmark was configured with 300 clients and two replicas. The initial size of the
database was the same one used for the evaluation without failures. Figure 6.11 shows the response
time. The vertical line at 690 seconds point on x-axis marks the point where one of the replica is
killed. The behaviour of these systems right after the fault occurs shows that for Middle-R to recover
Comparison of Architectures and Performance of Database Replication Systems Rohit Madhukar Dhamane

6.4. FAULT TOLERANCE EVALUATION 59
Figure 6.8: TPC-W: Throughput and Response Time (Browse : Database-2)
from the replica failure needs about 60 seconds while in case of C-JDBC it takes about 180 seconds.
The response time for Middle-R and C-JDBC before fault and after the recovery is about 30-35 ms.
That is, both systems are able to stabilize after some time.
The recovery time for MySQL Cluster is lower, about 5-10 seconds. MySQL Cluster with two
data nodes performance is not very good when executing TPC-W. The response time increases grad-
ually until the fault occurs. Right after the recovery, the response time is lower and much more stable
in comparison to the response time before the failure. This happens because the submitted load is
still far from saturating the system. MySQL is able to handle that load with a single data node (the
response time is stable and small after the failure) and since there are no replicas (only one data node),
MySQL performs the writes on only one data node and there is no need for synchronization, which
improves efficiency. Comparing TPC-W with the results of TPC-C, all three systems need longer time
to recover with TPC-W. This happens because the benchmark is organized as a set of web interactions
that encompasses several transactions. So, if one of these transactions aborts because of a failure, it is
resubmitted to avoid aborting the whole interaction. This processing is included in the response time
of those transactions.
Rohit Madhukar Dhamane Comparison of Architectures and Performance of Database Replication Systems

60 CHAPTER 6. DATABASE REPLICATION SYSTEMS EVALUATION
Figure 6.9: TPC-W: Throughput and Response Time (Browse : Database-3)
Figure 6.10: TPC-C Response Time
Comparison of Architectures and Performance of Database Replication Systems Rohit Madhukar Dhamane

6.4. FAULT TOLERANCE EVALUATION 61
Figure 6.11: TPC-W Response Time
Rohit Madhukar Dhamane Comparison of Architectures and Performance of Database Replication Systems

62 CHAPTER 6. DATABASE REPLICATION SYSTEMS EVALUATION
Comparison of Architectures and Performance of Database Replication Systems Rohit Madhukar Dhamane

Part VII
Data Grids


Chapter 7
Data Grids
7.1 Introduction
Traditional databases are designed for providing high durability of data. They provide good iso-
lation guarantees and data consistency although this is based on centralized design and requires high
disk I/O which makes them slow. To provide data consistency and isolation guarantees they employ
various multi tiered locking mechanisms at table, page or row level. The updated data needs to be
flushed to the disk frequently and the inherent limitations of the design makes these database system
scale very poorly. To make these systems scale better powerful hardware needs to be deployed (ver-
tical scalability). Vertical scaling is limited by the capacity of a single machine and it comes with an
upper limit, besides it also introduces downtime when systems are upgraded.
In-memory data grid (IMDG) manages data in the memory as the name suggests. Accessing data
primarily through memory makes the disk I/O redundant and improves the performance many folds.
IMDG uses replication and partitioning of data on multiple nodes to improve scalability. It make
sure that data is synchronously copied to other nodes whenever changes are made thereby provid-
ing consistency to data across the data grid . IMDGs offers caches to reduce latency of data access.
IMDGs servers are clustered and they keep track of each other constantly using various protocols.
The commonly used strategy to deploy a data grid is distributed cache. They offer better scaling,
low latency and better performance. IMDGs allows caching of most frequently used data to clients
and reduces the unnecessary access to data source. Any changes made to this data is synchronously
copied to other nodes in the cluster. They can also be configured to Asynchronously propagate
the changes to a persistent storage, i.e. write behind where updates across the grid are queued to
Rohit Madhukar Dhamane Comparison of Architectures and Performance of Database Replication Systems

66 CHAPTER 7. DATA GRIDS
transfer them in batches to the persistent store. The changes can also be propagated to the persistent
store synchronously and transaction consistent manner (write through). These features makes the
data grid Highly Available (HA). The features of In-Memory data grid can be summarized as:
• Distributed data on multiple server nodes
• Object-Oriented and non-relational data model
• Scalable according to the needs
• Rapid access to data and provide fail-over protection
• Highly Available
In this chapter we will discuss three data grid systems available today in the market, JBoss Data
Grid, Oracle Coherence and Terracotta Ehcache. We will discuss these solutions based on Sys-
tem Design, Topology, Transaction Management, Storage methods and APIs provided.
7.2 JBoss Data Grid
7.2.1 System Design
In this section we discuss the architecture of the JBoss Data Grid software. JBoss Data Grid [JDG]
is a distributed in-memory key-value data store designed to replicate data across multiple nodes. It is
based on Infinispan [Inf] which is the open source version of the data grid software. JBoss Data Grid
Cache architecture is shown in Figure 7.1. The Persistent Store is used for storing the cache instances
and entries permanently and they can be accessed using the Persistent Store Interfaces. This interface
provides both cache loader (read capability) and cache store (write capability). The Cache Manager
provides the mechanism to retrieve cache instances from persistence store and Level 1 Cache provides
the functionality to store the initially retrieved cache instances for future use. This obviates the remote
fetching of previously accessed entries and improves the performance. The cache instances retrieved
by the Cache Manager are then stored in the Cache and application can use Cache Interfaces to access
these instances using protocols such as Memcached [Mem], Hot Rod [Hot] or REST [RES].
7.2.2 Topology
JBoss Data Grid supports two usage modes Library Mode and Remote Client-Server mode. There
are certain advantages of using either of these modes and it depends on the application requirements.
The Library Mode provides users transactions and listeners/notification and it is possible to build
Comparison of Architectures and Performance of Database Replication Systems Rohit Madhukar Dhamane

7.2. JBOSS DATA GRID 67
Figure 7.1: JBoss Data Grid Cache Architecture
and deploy a custom runtime environment. The data grid node runs in the application process and
provides remote access to nodes hosted by other JVMs. On the other hand, the Remote Client-Server
Mode provides distributed, clustered data grid. It can be configured to run as a Standalone mode
where a single instance of JBoss Data Grid works in local node like a single-in-memory data cache. It
also provides a Clustered Mode where two or more servers can form a cluster. This can be distributed
cluster or a replicated cluster. In distributed cluster the data is stored on one server and at least
one copy of the data is stored on another server. This allows the cluster to scale linearly with the
performance depending upon the number of copies made by the cluster for each server. The more
the number of copies the lesser the performance. For Replicated mode, the data is replicated on all
nodes. Entries updated/added to one cache instance are replicated to all cache instances on other
JVMs. However, this kind of set up will perform well only with smaller number of cluster nodes. As
we increase the number of clusters for replication mode, the overhead of synchronizing updates to
cache instances will decrease the performance significantly.
7.2.3 Transaction Management
JBoss Data Grid supports JTA (Java Transaction API) compliant transactions and distributed
transactions (XA). For Standalone mode it provides a fully functional transaction manager based
on JBoss transactions. When transactions span across multiple cache instances, the data grid compo-
nents can be shard internally for optimization, this doesn’t have any effect on how caches interact with
Rohit Madhukar Dhamane Comparison of Architectures and Performance of Database Replication Systems

68 CHAPTER 7. DATA GRIDS
JTA manager. JBoss Data Grid can be configured to invalidate the old entries in cache instances and
JBoss Data Grid provides invalidation messages after every modification occurs. In case of batching
(or transaction) these messages are sent after a successful commit. This is advantageous since batch-
ing provides greater efficiency by transmitting bulk results thereby reducing the network traffic. It
can optimizes the two-phase-commit protocol with one-phase commit when only one other resource
is enlisted with the transaction (last-resource commit optimization [LRC]).
7.2.4 Storage
The data from a data grid needs to be stored off-grid for persistence in case the data grid is down.
JBoss Data Grid supports reading data from cache loader and writing data to cache store. The cache
store can be used to store data on a persistent file system or database. JBoss Data Grid supports
write-through persistence which means that the write call will wait until the data has been written to
the data grid as well as the cache store. This is a synchronous operation. For asynchronous operation
it supports write-behind operation, which returns the write call once the entry has been written to
the data grid. Applications using data grids can have very large heaps and they can put strain on the
garbage collector. A fully operational garbage collector can pause the threads in the JVM and this
results in lower performance. According to the JBoss Enterprise Application Platform’s performance
tuning guide [JEA], choosing the right garbage collector depends on whether one expects higher
throughput or more predictable response times. Concurrent Mark and Sweep (CMS) garbage collector
(-XX:+UseLargePages -XX:USEParNewGC -XX:+UseConcMarkSweepGC) is more useful for for
predictable response times while Throughput Collector (-XX:+UseLargePages -XX:+UseParallelOldGC)
is optimized for delivering highest throughput.
7.2.5 API
JBoss Data Grid supports Memcached, Hot Rod, REST protocols for remote access to the data
grid. It also provides various programmable APIs such as Cache API for adding/fetching/removing
the entries. It supports atomic mechanisms using JDK’s ConcurrentMap interface [Con], Batching
API for transactions involving only the JBoss Data Grid cluster. The batching API can not be used
in JBoss Data Grid ’s Remote Client-Server mode. Grouping API provides functionality to use hash
of the group instead of hash of the key to determine the node to house the entry, CacheStore and
ConfigurationBuilder API offers read-through/write-through functions, Externaizable API offers se-
rialization/deserialization in JBoss Data Grid , Notification/Listener API for events notifications and
Asynchronous API for non-blocking operations in JBoss Data Grid .
Comparison of Architectures and Performance of Database Replication Systems Rohit Madhukar Dhamane

7.3. ORACLE COHERENCE 69
7.3 Oracle Coherence
7.3.1 System Design
Oracle Coherence [Cohe] is another JAVA based in-memory data grid. Oracle Coherence cluster
consists of multiple JVM processes running Coherence, which communicate with each other using
Tangosol Cluster Management Protocol (TCMP) [TCM]. As shown in Figure 7.2, applications re-
quests data queries to data grid instead of directly accessing it from persistent storage (database). The
data grid loads the data across the cluster servers when it is started. The data has synchronous backup
to at least one more server on the data grid . The servers monitor the failure of other servers and in
case of failure of one of the servers they assume the responsibility of the failed server. The data grid
provides synchronous updates to avoid data loss. The read/write operations are managed by the node
that owns the data in the data grid. The modifications to the data are asynchronously copied to the
data source. From the applications point of view the cluster is a single system image.
Figure 7.2: Oracle Coherence Data Grid Architecture
Rohit Madhukar Dhamane Comparison of Architectures and Performance of Database Replication Systems

70 CHAPTER 7. DATA GRIDS
7.3.2 Topology
Coherence provides various mechanisms to deploy the data grid. It provides various configuration
options for the cluster such as Distributed Cache and Replicated Cache. The Distributed Cache par-
titions the data evenly between the cluster servers. To provide fail over protection the data is copied
to at least one more server on the cluster. The changes made to the primary copy are synchronously
replicated on the backup replica. Access between different cache nodes is over the network so if there
are n cluster nodes, (n - 1) / n operations go over the network. The Figures 7.3 and 7.4 shows the
cluster configured with Distributed Cache environment. During the put operation, the data is first sent
Figure 7.3: Oracle Coherence - Distributed Cache (Get/Put Operations)
to the primary cluster node and then to backup node. In this example we have one backup node for
fail over. The number of backup nodes can be greater than one. The cache updates are not guaranteed
until the acknowledgement notification from all the nodes is received. This decreases the performance
but it provides data consistency in case of a cluster node fails unexpectedly.
Figure 7.4: Oracle Coherence - Distributed Cache - Fail over in Partitioned ClusterLocal Cache
From Figure 7.4 we can see that when the primary node fails, the first backup becomes the primary
and the second back up becomes the first backup. When the server fails, the information regarding
Comparison of Architectures and Performance of Database Replication Systems Rohit Madhukar Dhamane

7.3. ORACLE COHERENCE 71
locks is retained except in case of where locks for failed nodes are automatically released. On the
other hand, the Replicated Cache configuration replicates the entire set of data across all the servers
in the cluster synchronously. This provides fail over guarantees although the performance of the
data grid suffers due to data being replicated synchronously on all the servers for every modification.
Other caching options provided by Coherence are Optimistic Cache, which is similar to Replicated
cache implementation except it does not provide any concurrency control. It provides higher write
throughput than Replicated cache. Local Cache, which provides a highly concurrent, thread safe
cache supporting automatic expiration of cached entries. It resides on a local node and supports local
on-heap caching for non-clustered caching. A hybrid cache, called Near Cache which combines local
cache with remote partitioned cache and is supposed to provide performance like local caching and
scalability like distributed caching. Although it depends upon the trade-off between synchronization
guarantees and performance.
7.3.3 Transaction Management
For a data grid it is very important that it supports concurrent access to data, locking and trans-
action processing. Coherence provides Explicit locking using ConcurrentMap interface [Con] which
is an extended by the NamedCache interface [Nam]. Although it guarantees data concurrency, it
does not guarantee atomic operations. Coherence provides Coherence Transaction Framework API,
a connection based API. This API provides read consistency and atomic guarantees across the cluster
nodes, but it has some known limitations such as lack of support for database integration, no support
for eviction/expiry in transaction caches, no support for Pessimistic/Explicit locking (ConcurrentMap
interface), no Synchronous Listener and no support for custom key. It is used as a backing map in the
replicated and partitioned cache and as the front cache for the near-cache and continuous-query-cache.
partitioning strategy for transactional cache [Cohd]. For consistency and concurrency isolation levels
are very important. Coherence supports READ_ COMMITTED isolation by default. It also supports four
more isolation levels, STMT_ CONSISTENT_ READ, STMT_ MONOTONIC_ CONSISTENT_ READ, TX_ CONSISTENT_ READ
and TX_ MONOTONIC_ CONSISTENT_ READ. The STMT_CONSISTENT_READ and STMT_ MONOTONIC_ CONSISTENT_
READ are statement-scoped isolation levels. STMT_ CONSISTENT_ READ provides guarantees a consistent
read version of the data for a single operation, although the data might not be the most recent. STMT_
MONOTONIC_ CONSISTENT_ READ provides same isolation level as STMT_ CONSISTENT_ READ with guarantee
of being read monotonic, which guarantees the most recent version of the data. TX_ CONSISTENT_ READ
and TX_ MONOTONIC_ CONSISTENT_ READ are transaction-scoped isolation levels. These isolation levels
perform similar operations as STMT_ CONSISTENT_ READ and STMT_ MONOTONIC_ CONSISTENT_ READ but their
scope is transaction wide. For the monotonic read guarantee in TX_ MONOTONIC_ CONSISTENT_ READ and
STMT_ MONOTONIC_ CONSISTENT_ READ transaction has to wait for the most recent version of the data and
hence it might be blocked until the most recent version is available.
Rohit Madhukar Dhamane Comparison of Architectures and Performance of Database Replication Systems

72 CHAPTER 7. DATA GRIDS
7.3.4 Storage
Storage options are very important for any data grid and like most data grids available today co-
herence provides mechanisms to store data locally (e.g. on-heap) or externally (e.g. NIO-memory)
[CDS]. Local Cache provides on-heap storage for fastest access to the data. It is used as the front
cache for the near-cache and continuous-query-cache, and as a backup map for the replicated and
partitioned cache. NIO-Ram and NIO-Disk are other storage options for storing data in the mem-
ory but outside of heap (NIO-RAM) or using memory-mapped files (NIO-Disk). The advantage is
of course more space for data storage albeit at the cost of performance. Other available options are
Journal and File-based storage. While File-based storage uses a Berkeley Database JE storage system
[BDB], Journal is a hybrid of RAM and Disk Storage optimized for Solid State Disks (SSD) requiring
serialization/deserialization of data. The performance of Coherence can be hampered without taking
garbage collection into account. Oracle Coherence provides guidelines to properly configure data
grid for optimal use of garbage collection without causing performance issues [OCG]. As the amount
of live data in the heap increases, the pause time also increases hence it is advised that the amount
of live data (including primary data, backup data, indexes, and application data) should not exceed to
more than 70% of the heap size. For garbage collection it is best to use Concurrent Mark and Sweep
GC or JRockit’s Deterministic garbage collector.
7.3.5 API
Coherence does not support MEMCACHED protocol [Mem], instead it uses it’s proprietary Co-
herence Extend protocol [Cohb] or the Coherence REST API [Cohc]. It does provide support for
cross-platform clients over TCP/IP using the same wire protocol. Apart from JAVA it also provides
support to C# and .NET clients.
7.4 Terracotta Ehcache
7.4.1 System Design
The system architecture of Terracotta Ehcache working in tandem with Terracotta servers is shown
in Figure 7.5 [EMG]. The multi-tiered architecture application uses Ehcache to cache data. The
Terracotta distributed Ehcache plug-in makes the distributed cache available to all the instances of the
application. As shown in Figure 7.5, The data is stored on both Ehcache node (L1) and Terracotta
Server Array (TSA). L1 cache (TSA) can hold limited amount of data, while L2 holds the entire
data store. L1 acts as the cache with recently used data thereby reducing the latency to minimum.
Terracotta Ehcache library is present on every application node. L2 has connections with one or more
Comparison of Architectures and Performance of Database Replication Systems Rohit Madhukar Dhamane

7.4. TERRACOTTA EHCACHE 73
Terracotta servers arranged in pairs (mirror groups) for high availability. The TSA is a collection of all
the terracotta server instances in a cluster. All the data in the cluster is partitioned equally among the
Terracotta Server instances. A single unit of TSA is known as Stripe. Each Stripe, is a mirror group
(as shown in Figure 7.6) which consists of one active Terracotta Server and at least one hot standby
server for fail over within the mirror group. The standby server replicates all the data managed by
the active server. The Mirror Groups automatically selects one of the Terracotta server instance as an
Figure 7.5: Terracotta Ehcache Architecture
Active instance and one as the backup instance. In every Mirror Group, there is always only one active
instance at any time. Ehcache can be configured for multiple standby instances, although the obvious
drawback of this would be decrease in the performance since active instance will have more backups
to synchronize. The limitation of mirror groups is that they do not replicate each other and hence do
Figure 7.6: Terracotta Server Array Mirror Groups
not provide fail over for each other. If all the instances, active and standby in one of the mirror groups
go down that would mean the partition of the data stored in that group will be inaccessible. In this
case the cluster has to be paused until the instances in the failed mirror group are up and the shared
data is available again.
Rohit Madhukar Dhamane Comparison of Architectures and Performance of Database Replication Systems

74 CHAPTER 7. DATA GRIDS
7.4.2 Topology
Ehcache provides three types of clustered caching topologies, Replicated, Distributed and Stan-
dalone [EDe]. The functionality of these caching modes is similar to most data grid topologies. The
Replicated mode allows data to be copied to all the cluster nodes. The replication can be configured
to be synchronous or asynchronous. The replication is carried out without locks and it porvides weak
consistency. Ehcache offers replication caching with RMI, JGroups and JMS. The Distributed mode
configuration holds the data in the TSA and the subset of recently used data is stored in the application
cache nodes. It provides Strong [Ehcd] and Eventual Consistency [Ehcc]. Ehcache supports several
common access patterns for using cache such as cacheaside, cacheassor (sor stands for system-of-
record), readthrough, writethrough, writebehind [Ehce]. For Standalone Cache, the data is stored in
the application node and every application node is independent of each other. Although, in case of
multiple application nodes using same application Standalone Cache provides weak consistency.
7.4.3 Transaction Management
Transaction support is also provided by Ehcache and when cache is configured for that all the
operations are carried out within a transaction context or else an exception is thrown. Ehcache pro-
vides only READ_COMMITTED isolation level and supports full two-phase commit when used as
an XAResource. The changes are visible to other transaction in local JVM or across the cluster until
the commit has been successfully executed. The reads on Ehcache do not block and show until the
transaction is committed other transactions can only view the old data. Ehcache allows configuration
for cache event listeners. That allows implementers to register callback methods for various cache
events such as when an element has been put, updated, removed or expires. The callback to these
methods has to be safely handled by the implementer to avoid performance issues and thread safety
since these methods are synchronous and unsynchronized. For cluster the events are propagated re-
motely as well as locally by default but Ehcache offers configuration for event propagation for either
of them if needed.
7.4.4 Storage
Ehcache offers three different types of storage options, a Memory Store - a thread safe cache
component which is always enabled and provides the extended LinkedHashMap [Lin] memory store.
Since all the data resides in the memory it is the fastest storage option. Second storage option is
OffHeapStore called Bigmemory [Bigb] for enterprise version of Ehcache. It allows Ehcache to store
objects outside of the object heap. It is significantly faster than the DiskStore with large storage
space and is not subject to JAVA GC (Garbage Collection). However there are certain constrains
regarding data storage with this option such as only serializable cache keys and values can be stored
Comparison of Architectures and Performance of Database Replication Systems Rohit Madhukar Dhamane

7.4. TERRACOTTA EHCACHE 75
and serialization/deserialization is necessity for putting/getting the data from the store. The last stor-
age option is DiskStore which is optional. It is significantly slower than the Memory Store and
requires serialization/deserialization of data. Since data is stored on the disk it turns out to be the
slowest storage option for data access. Large heap storage size can put strain on the performance
when Garbage Collection pauses the JVM threads. Ehcache recommends to use these options with
JAVA : -XX:+DisableExplicitGC -XX:+UseConcMarkSweepGC -XX:NewSize={1/4 of total heap
size} -XX:SurvivorRatio=16 [Ehcb]. Also to avoid running full garbage collection each minute when
distributed caching is enabled it recommended to increase the interval for garbage collection.
7.4.5 API
Ehcache provides various APIs [Ehca] such as Enterprise Ehcache Search API for clustered Caches
queries, Enterprise Ehcache Cluster Events for cluster events and topology, Bulk-Load API for transaction
batching and no locks, API for Unlocked Reads for Consistent Caches when consistent and optimized
read of cached data is required and API for Explicit Locking which offers key-based locking providing
concurrency along with cluster-wide consistency.
Rohit Madhukar Dhamane Comparison of Architectures and Performance of Database Replication Systems

76 CHAPTER 7. DATA GRIDS
Comparison of Architectures and Performance of Database Replication Systems Rohit Madhukar Dhamane

Part VIII
YCSB Benchmark


Chapter 8
YCSB Benchmark
In past decade many NoSQL data management systems such as BigTable, Dynamo, Cassandra etc
have been developed. The rise of such systems means it is important to formalise a strategy for eval-
uation. It is important to understand which system is most stable and mature? Which system has best
performance? Which system has best fault tolerance? Obviously, OLTP benchmarking techniques
such as TPC-C and TPC-W are not built for studying these new systems. Unlike RDBMS where
SQL is used to access data, NoSQL data management systems uses key-value pair to access data.
The schema for NoSQL databases are flexible, i.e. unlike SQL databases where schema has to be
predefined before an application can access data, in NoSQL there is no predefined schema.
Most NoSQL data management systems support replication and they can perform automated fail
over and recovery. Due to these differences between RDBMS and NoSQL data management systems
it is necessary to evaluate NoSQL systems using a standard benchmark specifically designed taking
above mentioned differences into consideration. For studying performance of Data Grids studied in
this thesis we have used Y ahoo! Cloud Serving Benchmark (Y CSB). Just like OLTP bench-
marks it also looks at query latencies and overall system throughput, although the queries are very
different.
Y ahoo! Cloud Serving Benchmark (Y CSB) [CST+10] [YCS] is a benchmark consisting of
a workload generating client and a package of standard workloads used for assessing the performance
of cloud systems. It is implemented in JAVA and it can be used to benchmark virtually any storage
system with a JAVA API. YCSB provides a straightforward way to benchmark data store systems
Rohit Madhukar Dhamane Comparison of Architectures and Performance of Database Replication Systems

80 CHAPTER 8. YCSB BENCHMARK
because the core engine is completely decoupled from the data store. Using a data store specific
driver we can configure the YCSB benchmark to run with various data stores. This can be done by
using the DB abstract class shown in Code Snippet 1.
Listing 1: Abstract Class com.yahoo.ycsb.DB
package com.yahoo.ycsb;
public abstract class DB
{
public void init() throws DBException{}
public void cleanup() throws DBException{}
public abstract int read(String table, String key,
Set<String> fields, HashMap<String,ByteIterator> result);
public abstract int scan(String table, String startkey,
int recordcount, Set<String> fields, Vector<HashMap<String,
ByteIterator>> result);
public abstract int update(String table, String key,
HashMap<String, ByteIterator> values);
public abstract int insert(String table, String key,
HashMap<String,ByteIterator> values);
public abstract int delete(String table, String key);
}
Figure 8.2 shows a conceptual view of the YCSB system.
Figure 8.1: Yahoo! Cloud Serving Benchmark: Conceptual View
YCSB provides a core set of workloads. Each workload consists of a particular mix of read/writes,
data size and request distribution type. Figure 8.2 shows the three request distribution types that can
be used with YCSB benchmark. The horizontal axes in the figure represent the items that may be cho-
sen (e.g. records) in order of insertion, while the vertical bars represent the probability that the item is
chosen. One can select the type of distribution depending upon his requirements, like one can choose
the database records with equal possibility with Uniform distribution or Use Zipfian distribution
Comparison of Architectures and Performance of Database Replication Systems Rohit Madhukar Dhamane

81
Figure 8.2: Yahoo! Cloud Serving Benchmark: Probability Distribution
where some records (head of distribution) are more popular than others (tail of distribution) or use
Latest distribution which is similar to Zipfian distribution except most recently inserted records are
kept in the head of the distribution. The benchmark client tool is programmed with JAVA. It creates
multiple client threads to run the selected workload. The rate at which requests are generated are
controlled by the client tool. The threads measure the latency and throughput of operations and at
the end of the experiment, the statistics module measures the 95th and 99th percentile latencies, and
either a histogram or time series of the latencies. A new class can be written to implement read, write,
update, delete or scan a new database backend. A user can define a new workload executor to replace
CoreWorkload by extending the Workload class of the YCSB framework. Workload object is shared
among the threads.
In our experiments we have tried to identify a data grid solution that could efficiently serve requests
made by web applications with high numbers of concurrent users. Typically, a web application needs
to keep track of customers data which can be as small as user identifications up to large data such as
the entire user sessions. Another important parameter of the web application load characterization is
the percentage of read and write operations that are executed on the storage system.
In the Y CSB workload file descriptors several parameters can be configured, as described in [CST+10].
In the experiments reported in this paper, the authors defined two kind of objects to be used in the
requests made against the storage systems. These objects are named Small and Big. Small objects
have 10 fields of 50 Bytes for a total size of 500 Bytes. Big objects are used to simulate the user
sessions and they have a size of 20 KiloBytes with 20 fields of 1.000 Bytes each. With regard the
Rohit Madhukar Dhamane Comparison of Architectures and Performance of Database Replication Systems

82 CHAPTER 8. YCSB BENCHMARK
percentage of read/write operations, the authors define two types of load. TypeA is a read-heavy
workload made of 90% of reads, 5% of inserts and 5% of updates. The other workload, named
TypeB, is more evenly distributed with a 50% of reads, 25% of inserts and 25% of updates.
Comparison of Architectures and Performance of Database Replication Systems Rohit Madhukar Dhamane

Part IX
Data Grids Evaluation


Chapter 9
Data Grids Evaluation
9.1 Introduction
This chapter evaluates and compares the performance of different Distributed objects caches (data
grids): Coherence (Oracle), JBoss Data Grid (JBoss) and Terracotta (Software AG). To do this we
used the most widely used benchmark key-value stores, Yahoo! Cloud Serving Benchmark (Ya-
hoo2010). This benchmark can define the type of load to run (workload, readings, changes and
writes), charging injected (number of operations per second), the number of threads that will send the
load, define the loading objects and distribution function to access the objects and the duration of the
experiment. The benchmark calculates the average response time per transaction and performance
(throughput).
In this work every product offering is measured with different workloads where the size of objects
and percentage of reads/writes is varied. The response time evolution of the operations and scalability
of each system, in addition to behaviour when one of the computers where the cache is installed fails.
To measure maximum performance with a given configuration the benchmark runs with increasing
burden while the injected charge (target throughput) is equal to the total processed (Average through-
put), which is measured as transactions per second (events per second). When processed feedstock is
injected below the load, the system is saturated and no longer capable of processing higher loads.
In tests there are always two copies of each object in instances other than those caches, provided
there are no faults. Two copies are considered to offer sufficient availability. The scalability measures
Rohit Madhukar Dhamane Comparison of Architectures and Performance of Database Replication Systems

86 CHAPTER 9. DATA GRIDS EVALUATION
how the cache behaves when new instances are added. So if a cache is processing ’X’ operations on a
single machine and another machine is added, in theory it would be able to process ’2X’ operations.
In this case, it is said that the cache scale linearly. In practice, due to the coordination needed between
different machines scalability is lower.
Another measure of interest is the behaviour of the cache when there are failures. This paper
measures changes in response time when there are failures and the time it takes the system offer
similar response times to those that occurred before the failure.
9.2 Evaluation Setup
Small Data Size
• Object size: 500 bytes, 10 fields of 50 bytes.
• Number of objects: 1,000,000 objects are loaded in warm-up phase.
Big Data Size
• Object size: 20 Kbytes, 20 fields of 1 Kbytes.
• Number of Objects: 150,000 objects are loaded in warm-up phase
Workload A Proportions of operations is as following:
• Read: 90%
• Write: 5%
• Update: 5%
Workload B Proportions of operations is as following:
• Read: 50%
• Write: 25%
• Update: 25%
Common Parameters Common parameters for all the experiments were as following:
• Number of thread per client: 200
• Number of clients: 4,8 and 10
Comparison of Architectures and Performance of Database Replication Systems Rohit Madhukar Dhamane

9.2. EVALUATION SETUP 87
• Number of cache nodes: 2 (1 backup node for each object)
• JAVA Heap Space: 6 GB
Environment Description The experiments were run on a cluster of machines:
• Quad-core Intel Xeon [email protected]
• Cache: 4096 KB
• RAM: 8GB
• Opearting System: Ubuntu 10.04
• 1 Gigabit LAN connection
In these experiment performance of three products was measured:
• JBoss Data Grid Server 6.1.0.ER8.1 (JDG):
– Each node in the grid or configured with a HEAP of 6144 MB
– Each client configured with standard HEAP size of the JVM.
– Experiments performed with two and four nodes with replicated data (for each object
exists a replica on another node). Each node is active and can be served with both read
and write requests.
• Oracle Coherence 3.7.1.3
– Each grid node configured with a HEAP of 6144 MB.
– Each client is configured with a HEAP of 512 MB.
– The client has a near cache.
– Experiments performed with two and four nodes, with data replicated(for each object
there was a replica on another node). Each node is active and can serve read as well as
write requests.
• Terracotta 3.7.0
– Each node configured with a HEAP of 2 GB and a BigMemory of 4 GB.
– Each client configured with a HEAP of 2GB and a BigMEmory of 4 GB.
– Experiments performed with one and two stripes. Each stripe is formed of two nodes, one
serves as a primary and serves all requests from clients. Other node acts like a passive
replica (backup) which only updates data with changes sent from primary. It does not
serve the clients.
Rohit Madhukar Dhamane Comparison of Architectures and Performance of Database Replication Systems

88 CHAPTER 9. DATA GRIDS EVALUATION
• Terracotta 3.7.0
– Each client configured with a HEAP of 0.5 GB and BigMemory of 0.5 GB
Operations modifying the data reads from the cache and if the key is not in the cache it is
inserted into the cache.
Method The experiments were performed in two phases:
• Load Phase: The objects are loaded into the cache.
• Implementation Phase: The experiments were performed with a particular configuration. this
phase lasts five minutes. In the experiments with fault tolerance, the machine running the cache
is turned off at 360 seconds mark from the start.
• The experiments were performed with different number of instances of the benchmark (cus-
tomers). The results are shown for the best result for a particular configuration.
Comparison of Architectures and Performance of Database Replication Systems Rohit Madhukar Dhamane

9.3. PERFORMANCE EVALUATION 89
9.3 Performance Evaluation
The objective of these experiments is to measure the performance of different products as well
as the scalability of the same. For this purpose the benchmark is run with each product, object size,
workload type, number of nodes and varying the load until the system is saturated. This happens
when system is unable to process the injected load. Average throughput as the injected load (target
throughput) is measured in transactions per second.
9.3.1 Workload:SizeSmallTypeA
9.3.1.1 Throughput
Figure 9.1 shows the best performance with each product obtained using two and four nodes for
this cache configuration. As shown in the figure 9.1, Terracotta offers lower performance than JDG
and Coherence. Moreover the system does not scale, that is almost no performance increase when
going from two to four nodes. Best performance was shown by Coherence which was able to process
nearly 300,000 operations per second with four nodes. Almost double that of two nodes. It scales
almost linearly from two to four nodes. JDG performs less than Coherence, although significantly
higher than Terracotta. JDG also scales with more nodes but not as much as Coherence.
Figure 9.1: Average Throughput / Target Throughput: SizeSmallTypeA
Rohit Madhukar Dhamane Comparison of Architectures and Performance of Database Replication Systems

90 CHAPTER 9. DATA GRIDS EVALUATION
9.3.1.2 Response Time: Two Nodes
Figure 9.2: Two nodes latency: SizeSmallTypeA Insert
Figures 9.2, 9.3, 9.4 shows the response time for different loads per transaction (insert, read,
update). For JDG two results are shown, with four (jdg_4c) and eight (jdg_8c) customers. For Coher-
ence experiments were performed with eight and ten clients, whereas for Terracotta four customers
were used, for which the best results were obtained. JDG has a very different return depending on the
numbers of customers.
The throughput gets to half from eight customers to four customers. Coherence obtained a very sim-
Figure 9.3: Two nodes latency: SizeSmallTypeA Read
ilar performance with four and ten clients. Coherence is also more stable when it reaches saturation.
Even though response time rises, it was able to maintain the injected load. JDG and Terracotta were
more unstable as they approached saturation. All the systems give response times below 3.4 ms when
Comparison of Architectures and Performance of Database Replication Systems Rohit Madhukar Dhamane

9.3. PERFORMANCE EVALUATION 91
not approaching saturation. When terracotta and JDG were not able to support the load Coherence
was able to support it with higher response times.
Figure 9.4: Two nodes latency: SizeSmallTypeA Update
9.3.1.3 Response Time: Four Nodes
Figure 9.5,9.6, 9.7 shows results with four nodes.
Figure 9.5: Four nodes latency: SizeSmallTypeA Insert
In Coherence the sensitivity with four nodes and number of customers is more evident. Coher-
ence with eight clients offer much lower response time compared with four (difference of 20 ms). In
addition it is possible to process more load.
Rohit Madhukar Dhamane Comparison of Architectures and Performance of Database Replication Systems

92 CHAPTER 9. DATA GRIDS EVALUATION
Figure 9.6: Four nodes latency: SizeSmallTypeA Read
Figure 9.7: Four nodes latency: SizeSmallTypeA Update
Response times take longer to degrade from two to four nodes. Compared to JDG, Coherence can
take almost double the burden with two nodes, which is logical since there are twice as many cache
nodes. In Terracotta this effect is small.
Comparison of Architectures and Performance of Database Replication Systems Rohit Madhukar Dhamane
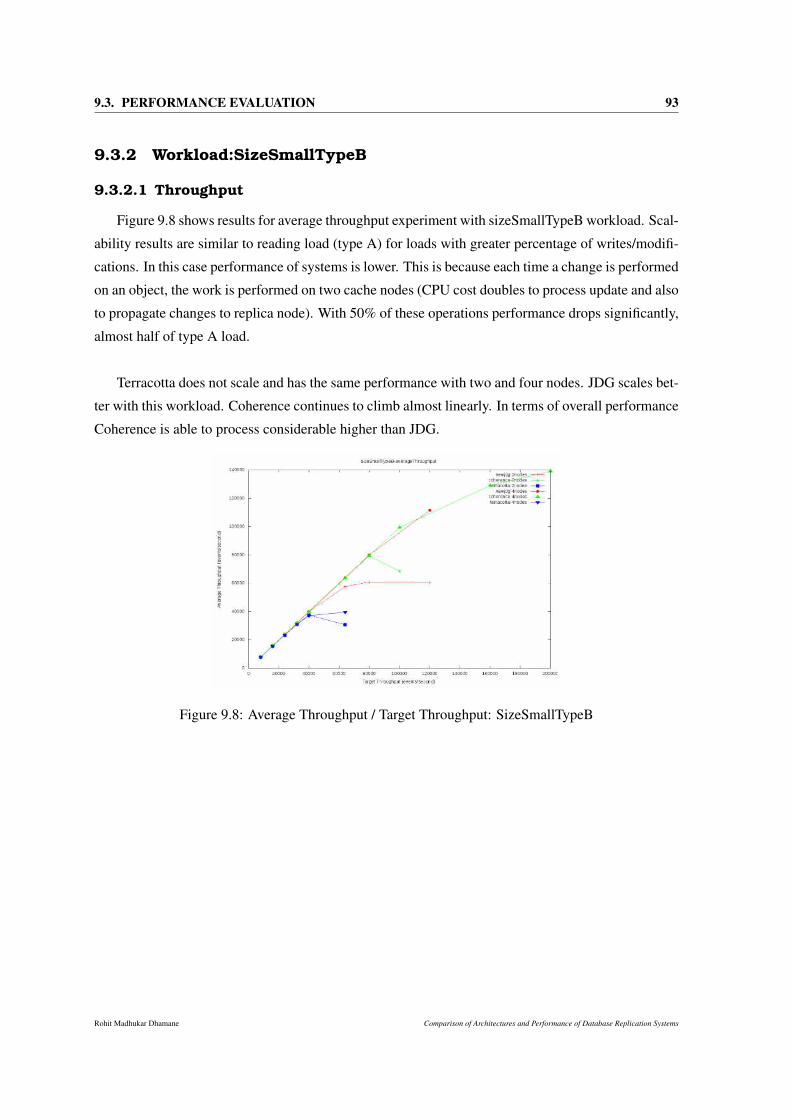
9.3. PERFORMANCE EVALUATION 93
9.3.2 Workload:SizeSmallTypeB
9.3.2.1 Throughput
Figure 9.8 shows results for average throughput experiment with sizeSmallTypeB workload. Scal-
ability results are similar to reading load (type A) for loads with greater percentage of writes/modifi-
cations. In this case performance of systems is lower. This is because each time a change is performed
on an object, the work is performed on two cache nodes (CPU cost doubles to process update and also
to propagate changes to replica node). With 50% of these operations performance drops significantly,
almost half of type A load.
Terracotta does not scale and has the same performance with two and four nodes. JDG scales bet-
ter with this workload. Coherence continues to climb almost linearly. In terms of overall performance
Coherence is able to process considerable higher than JDG.
Figure 9.8: Average Throughput / Target Throughput: SizeSmallTypeB
Rohit Madhukar Dhamane Comparison of Architectures and Performance of Database Replication Systems

94 CHAPTER 9. DATA GRIDS EVALUATION
9.3.2.2 Response Time: Two Nodes
Figures 9.9, 9.10, 9.11.
Again with two nodes JDG is quite sensitive to many customers. When the number of customers is
Figure 9.9: Two nodes latency: SizeSmallTypeB Insert
duplicated (4 to 8), latency of operations is increased by 50%.
Figure 9.10: Two nodes latency: SizeSmallTypeB Read
Comparison of Architectures and Performance of Database Replication Systems Rohit Madhukar Dhamane

9.3. PERFORMANCE EVALUATION 95
Figure 9.11: Two nodes latency: SizeSmallTypeB Update
Latency with Coherence is also sensitive to the number of customers as it approaches saturation
however it performs better with fewer customers (unlike what happened with reading load).
Rohit Madhukar Dhamane Comparison of Architectures and Performance of Database Replication Systems
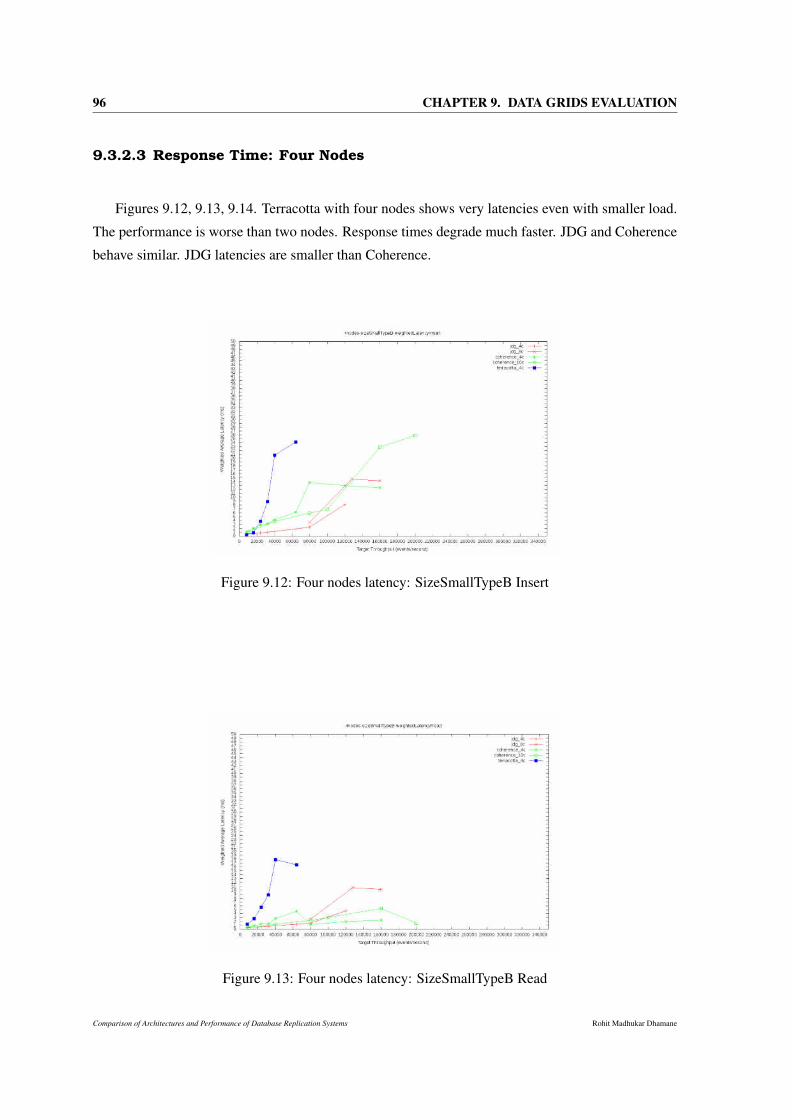
96 CHAPTER 9. DATA GRIDS EVALUATION
9.3.2.3 Response Time: Four Nodes
Figures 9.12, 9.13, 9.14. Terracotta with four nodes shows very latencies even with smaller load.
The performance is worse than two nodes. Response times degrade much faster. JDG and Coherence
behave similar. JDG latencies are smaller than Coherence.
Figure 9.12: Four nodes latency: SizeSmallTypeB Insert
Figure 9.13: Four nodes latency: SizeSmallTypeB Read
Comparison of Architectures and Performance of Database Replication Systems Rohit Madhukar Dhamane

9.3. PERFORMANCE EVALUATION 97
Figure 9.14: Four nodes latency: SizeSmallTypeB Update
For read load, when four nodes are used instead of two the response time increases significantly
with more load. Although in this case the load is double compared to the load with two nodes.
Rohit Madhukar Dhamane Comparison of Architectures and Performance of Database Replication Systems
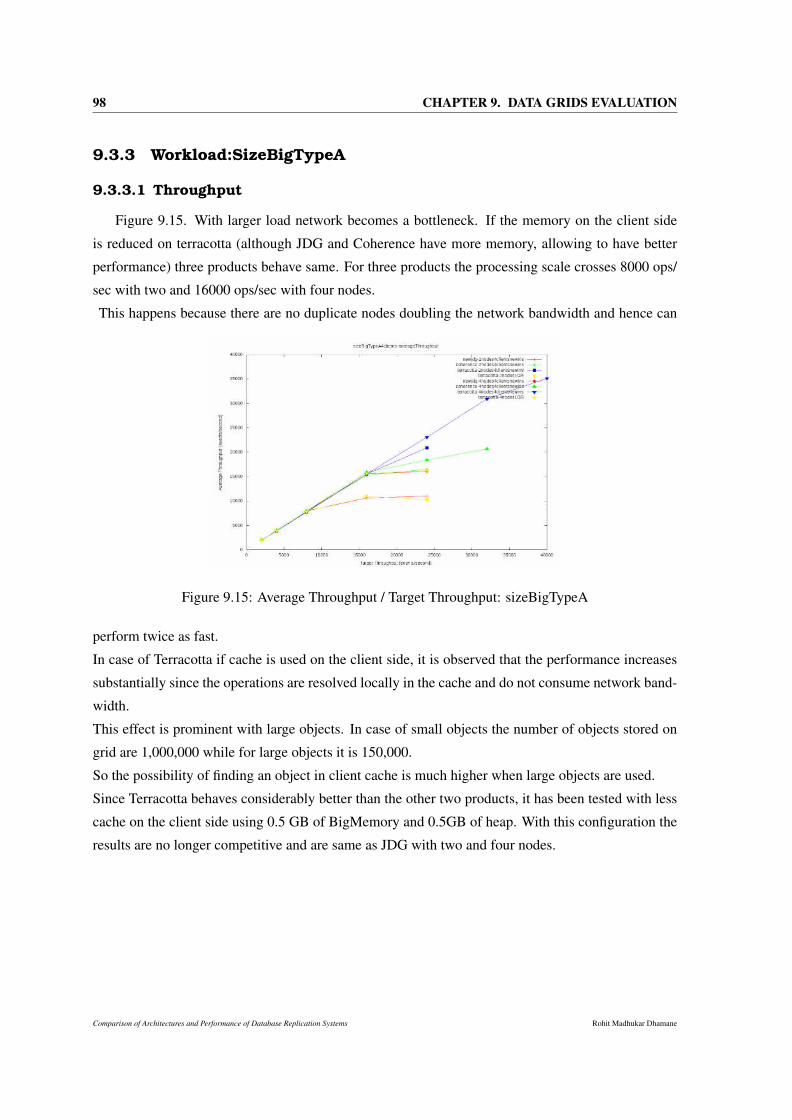
98 CHAPTER 9. DATA GRIDS EVALUATION
9.3.3 Workload:SizeBigTypeA
9.3.3.1 Throughput
Figure 9.15. With larger load network becomes a bottleneck. If the memory on the client side
is reduced on terracotta (although JDG and Coherence have more memory, allowing to have better
performance) three products behave same. For three products the processing scale crosses 8000 ops/
sec with two and 16000 ops/sec with four nodes.
This happens because there are no duplicate nodes doubling the network bandwidth and hence can
Figure 9.15: Average Throughput / Target Throughput: sizeBigTypeA
perform twice as fast.
In case of Terracotta if cache is used on the client side, it is observed that the performance increases
substantially since the operations are resolved locally in the cache and do not consume network band-
width.
This effect is prominent with large objects. In case of small objects the number of objects stored on
grid are 1,000,000 while for large objects it is 150,000.
So the possibility of finding an object in client cache is much higher when large objects are used.
Since Terracotta behaves considerably better than the other two products, it has been tested with less
cache on the client side using 0.5 GB of BigMemory and 0.5GB of heap. With this configuration the
results are no longer competitive and are same as JDG with two and four nodes.
Comparison of Architectures and Performance of Database Replication Systems Rohit Madhukar Dhamane

9.3. PERFORMANCE EVALUATION 99
9.3.3.2 Response Time: Two Nodes
Figure 9.16, 9.17, 9.18 shows the latency graphs for sizeBigTypeA workload and two nodes setup.
Figure 9.16: Two nodes latency: sizeBigTypeA Insert
Figure 9.17: Two nodes latency: sizeBigTypeA Read
The latencies with large objects are more than small objects because it takes longer to process
workload in terms of CPU and also it takes longer to be send data over the network.
Rohit Madhukar Dhamane Comparison of Architectures and Performance of Database Replication Systems

100 CHAPTER 9. DATA GRIDS EVALUATION
Figure 9.18: Two nodes latency: sizeBigTypeA Update
When saturation point is not reached they are below 10 ms. Terracotta is the clear winner sup-
porting higher loads. Coherence behaves slightly better than JDG in terms of latency.
Comparison of Architectures and Performance of Database Replication Systems Rohit Madhukar Dhamane

9.3. PERFORMANCE EVALUATION 101
9.3.3.3 Response Time: Four Nodes
Figures 9.19, 9.20, 9.21. Here we can see that Terracotta is able to process twice the load with four
Figure 9.19: Four nodes latency: sizeBigTypeA Insert
nodes as compared with two nodes with reasonable time, unlike what happened with small objects.
This effect does not happen with double load on Coherence and JDG, although they process more
load with less time with four nodes than two.
Figure 9.20: Four nodes latency: sizeBigTypeA Read
Rohit Madhukar Dhamane Comparison of Architectures and Performance of Database Replication Systems

102 CHAPTER 9. DATA GRIDS EVALUATION
Figure 9.21: Four nodes latency: sizeBigTypeA Update
JDG behaviour is lower than Coherence in terms of latency with high loads. In short, terracotta
scales linearly and Coherence, JDG do not scale.
Comparison of Architectures and Performance of Database Replication Systems Rohit Madhukar Dhamane

9.3. PERFORMANCE EVALUATION 103
9.3.4 Workload:SizeBigTypeB
9.3.4.1 Throughput
Figure 9.22 shows results for experiment with SizeBigTypeB workload. This workload is limited
by network like load A. The tree systems perform equally in this test.All three scale linearly for the
same reason as with load A from 4000-8000 ops. If the client side cache is used in Terracotta then
improvement is less than with load A, as the cache only benefits read operations. Hence it loses much
of its benefit with a high percentage of updates.The overall number of operations is reduced due to
burden of updating two copies of each object. Again, we have reduced the size of cache in client side
in Terracotta and evaluated their behaviour with 1GB of memory. Again the results show decrease in
performance for reading. In this case it is still better than other two products with two nodes (cached
on client side) and equal to four nodes.
Figure 9.22: Average Throughput / Target Throughput: sizeBigTypeB
Rohit Madhukar Dhamane Comparison of Architectures and Performance of Database Replication Systems

104 CHAPTER 9. DATA GRIDS EVALUATION
9.3.4.2 Response Time: Two Nodes
Figures 9.23, 9.24, 9.25 show latencies for sizeBigTypeB type of workload. In this experiment
Figure 9.23: Two nodes latency: sizeBigTypeB Insert
Terracotta shows lower latencies than JDG and Coherence. This is not well understood because the
updates have the same cost in the three systems. Only reason this can be accredited to Terracotta is
that read operations are largely resolved in the cache of the client, which takes longer to saturate.
Figure 9.24: Two nodes latency: sizeBigTypeB Read
Comparison of Architectures and Performance of Database Replication Systems Rohit Madhukar Dhamane

9.3. PERFORMANCE EVALUATION 105
Figure 9.25: Two nodes latency: sizeBigTypeB Update
9.3.4.3 Response Time: Four Nodes
Figures 9.26, 9.27, 9.28 shows latency graphs for sizeBigTypeB workload with four node setup.
Figure 9.26: Four nodes latency: sizeBigTypeB Insert
Here, JDG and Coherence have better behaviour and it is very similar to Terracotta latencies when
not near saturation. In this graph we can see that all three systems scale linearly and have significantly
lower latencies compared to two nodes with high load.
Rohit Madhukar Dhamane Comparison of Architectures and Performance of Database Replication Systems

106 CHAPTER 9. DATA GRIDS EVALUATION
Figure 9.27: Four nodes latency: sizeBigTypeB Read
Figure 9.28: Four nodes latency: sizeBigTypeB Update
Here we conclude the discussion about latencies.
Comparison of Architectures and Performance of Database Replication Systems Rohit Madhukar Dhamane

9.3. PERFORMANCE EVALUATION 107
9.3.5 Productivity Histograms
Figures 9.29, 9.30 show a summary of results for productivity. The first figure shows the produc-
tivity for two nodes with both load and data sizes. As shown in the figure, the type of load plays a
decisive role in performance. For JDG and Coherence performance is half when moved from a high
load reading (type A) to a load with more writes (type B).
Figure 9.29: Throughput Comparison per Workload : Two Nodes
Figure 9.30: Throughput Comparison per Workload : Four Nodes
The size of objects still has a great impact on performance. By multiplying the size of objects by
forty, performance is reduced to 12 in JDG, for 10 in Coherence and for 3, 9 in case of Terracotta for
Rohit Madhukar Dhamane Comparison of Architectures and Performance of Database Replication Systems

108 CHAPTER 9. DATA GRIDS EVALUATION
Type A load. For load type B the reductions is for higher values 14,13 and 15 respectively. In case of
four nodes the behaviour is similar.
Figure 9.31: Scalability: sizeBigTypeA
Figures 9.31 9.32 shows the scalability by load type and size of objects. It is seen that for JDG
and Coherence it is increased when moved from two to four nodes for small load. Coherence shows
better scalability. In case of big load the scalability of JDG is maintained however it is reduced for
Coherence.The performance reduces dramatically with large data. This is because the network be-
comes a bottleneck.
Figure 9.32: Scalability: sizeBigTypeB
Terracotta behaviour is different. For small data there is no scalability. Terracotta is not designed
Comparison of Architectures and Performance of Database Replication Systems Rohit Madhukar Dhamane

9.3. PERFORMANCE EVALUATION 109
as a distributed cache, but as a centralized cache to run on one machine. However, when the data is
large it shows better behaviour than JDG and Coherence.
The reason is that on one hand the customer avoids cache hits to remote servers. There is higher
probability of finding large objects in local cache since they are smaller in number compared to small
objects. For reads (Type A), this effect makes Terracotta process twice the JDG operations and slightly
less than twice for Coherence with four nodes. When the load is of type B (50 % reads) this effect is
still playing an important role, although lower than with type A. Terracotta performance is compared
to JDG is 1.6 times with two nodes and 1.3 times with four nodes. Terracotta performance compared
to Coherence is 1.16 time with both two and four nodes.
9.3.5.1 Different Object Sizes
Figure 9.33 shows the performance for reading loads (type A) with two nodes by varying the size
of objects. Objects of 10 Kb ( half the size of large objects) the performance is twice that of large
objects. When the size of objects (6 KB) is reduced to something less than a third of large objects (20
KB), the performance of Coherence and JDG increases in proportion.
Figure 9.33: Type A 2 Nodes
Rohit Madhukar Dhamane Comparison of Architectures and Performance of Database Replication Systems

110 CHAPTER 9. DATA GRIDS EVALUATION
Resource Consumption with object of 6 KB Figures 9.349.359.369.379.389.39 shows resource
consumption with object size of 6 KB. For objects of 6 KB the network is a bottleneck. It is noted
that neither JDG nor Coherence have a high consumption of CPU, but both have a stable network
traffic throughout the experiment.
Figure 9.34: JDG CPU Statistics: sizeMediumTypeA
Figure 9.35: JDG Network Statistics: sizeMediumTypeA
Resource consumption is higher in both cases for Coherence which is performing more operations
Comparison of Architectures and Performance of Database Replication Systems Rohit Madhukar Dhamane

9.3. PERFORMANCE EVALUATION 111
than JDG.Terracotta has a higher CPU consumption than other products because it performs many
more operations per second.
Figure 9.36: Coherence CPU Statistics: sizeMediumTypeA
The network consumption is lower (outgoing traffic from the primary server) than other products,
but more operations are performed. This is due to the use of client cache that makes many read
operations on the client to avoid request to the server.
Figure 9.37: Coherence Network Statistics: sizeMediumTypeA
Rohit Madhukar Dhamane Comparison of Architectures and Performance of Database Replication Systems

112 CHAPTER 9. DATA GRIDS EVALUATION
x
Figure 9.38: Terracotta CPU Statistics: sizeMediumTypeA
Figure 9.39: Terracotta Network Statistics: sizeMediumTypeA
Comparison of Architectures and Performance of Database Replication Systems Rohit Madhukar Dhamane

9.3. PERFORMANCE EVALUATION 113
Resource Consumption with object of 10KB Figures 9.409.419.429.439.449.45 shows resource
consumption with objects of size 10KB. Again the network is a bottleneck for 10KB object size. The
results show similar behaviour as with 6KB of object size.
Figure 9.40: JDG CPU Statistics: sizeMediumTypeA
Figure 9.41: JDG Network Statistics: sizeMediumTypeA
Figure 9.40 and 9.41 show CPU and network statistics for JDG. As it can be seen CPU usage is
moderate around 30 - 40% however network is getting close to saturation. This was also observed in
experiments with 6KB object size.
Rohit Madhukar Dhamane Comparison of Architectures and Performance of Database Replication Systems

114 CHAPTER 9. DATA GRIDS EVALUATION
Figure 9.42: Coherence CPU Statistics: sizeMediumTypeA
[H]
Figure 9.43: Coherence Network Statistics: sizeMediumTypeA
Comparison of Architectures and Performance of Database Replication Systems Rohit Madhukar Dhamane

9.3. PERFORMANCE EVALUATION 115
Figure 9.44: Terracotta CPU Statistics: sizeMediumTypeA
Figure 9.45: Terracotta Network Statistics: sizeMediumTypeA
Rohit Madhukar Dhamane Comparison of Architectures and Performance of Database Replication Systems

116 CHAPTER 9. DATA GRIDS EVALUATION
9.4 Analysis of Resource Consumption: Two Nodes
In this section resource consumption is shown in terms of CPU, memory and network traffic while
running expriment with a given load. In case of CPU and memory consumption blade38 is a client
node and nodes 39 and 40 are corresponding nodes where cache is executed. The graphs show the
network traffic outgoing (red) and incoming (green) in one of the cache nodes.
9.4.1 Workload:SizeSmallTypeA
9.4.1.1 JBoss Data Grid: 120,000 operations per second
Figure 9.46. The customer has a 50% consumption of CPU while one node is running the cache
is 90 %. This means that node is substantially saturated and the CPU of one of the cache nodes is the
bottleneck. The other cache node has a lower CPU consumption. This means that load balancing in
JDG is not as good as it should be. This may be due to consistent hashing used to distribute data is
not doing the job optimally.
Figure 9.46: JBoss Data Grid: CPU usage
Figure 9.47. Memory consumption in client is less in JDG (there is no local cache like Terracotta).
Memory consumption increases as number of insert increases.
Comparison of Architectures and Performance of Database Replication Systems Rohit Madhukar Dhamane

9.4. ANALYSIS OF RESOURCE CONSUMPTION: TWO NODES 117
Figure 9.47: JBoss Data Grid: Memory
Figure 9.48. Network traffic is on average 60 MB/s. i.e. the network is not the bottleneck in
this configuration. As the figure shows outbound traffic from cache node is significantly higher than
input. This is because the load is primarily a read load (type A).
Figure 9.48: JBoss Data Grid: Network usage
Rohit Madhukar Dhamane Comparison of Architectures and Performance of Database Replication Systems

118 CHAPTER 9. DATA GRIDS EVALUATION
9.4.1.2 Coherence: 160,000 operations per second
Figure 9.49. Coherence has a low CPU usage on the client like JDG.However, unlike JDG cache
nodes consumption is not very high. This means that there’s no contention at any point in cache when
the system is not saturated.
Figure 9.49: Coherence: CPU usage
Figure 9.50: Coherence: Memory
Comparison of Architectures and Performance of Database Replication Systems Rohit Madhukar Dhamane

9.4. ANALYSIS OF RESOURCE CONSUMPTION: TWO NODES 119
For evaluation with different numbers of clients it appears that this contention is due to the man-
agement of competition in proxy client. Figure 9.50 shows memory consumption. It is again very
similar to what we observed in JDG.
Figure 9.51: Coherence: Network usage
Figure 9.51 shows network traffic consumption. Outgoing network traffic is higher than incoming.
This again is quite similar to JDG.
Rohit Madhukar Dhamane Comparison of Architectures and Performance of Database Replication Systems

120 CHAPTER 9. DATA GRIDS EVALUATION
9.4.1.3 Terracotta: 80,000 operations per second
Figure 9.52: Terracotta: CPU usage
Figure 9.53: Terracotta: Memory
Figure 9.52 shows Terracotta CPU consumption when experiment was run with 80,000 ops/sec.
We can see here that Terracotta client has higher CPU consumption compared with Coherence and
Comparison of Architectures and Performance of Database Replication Systems Rohit Madhukar Dhamane
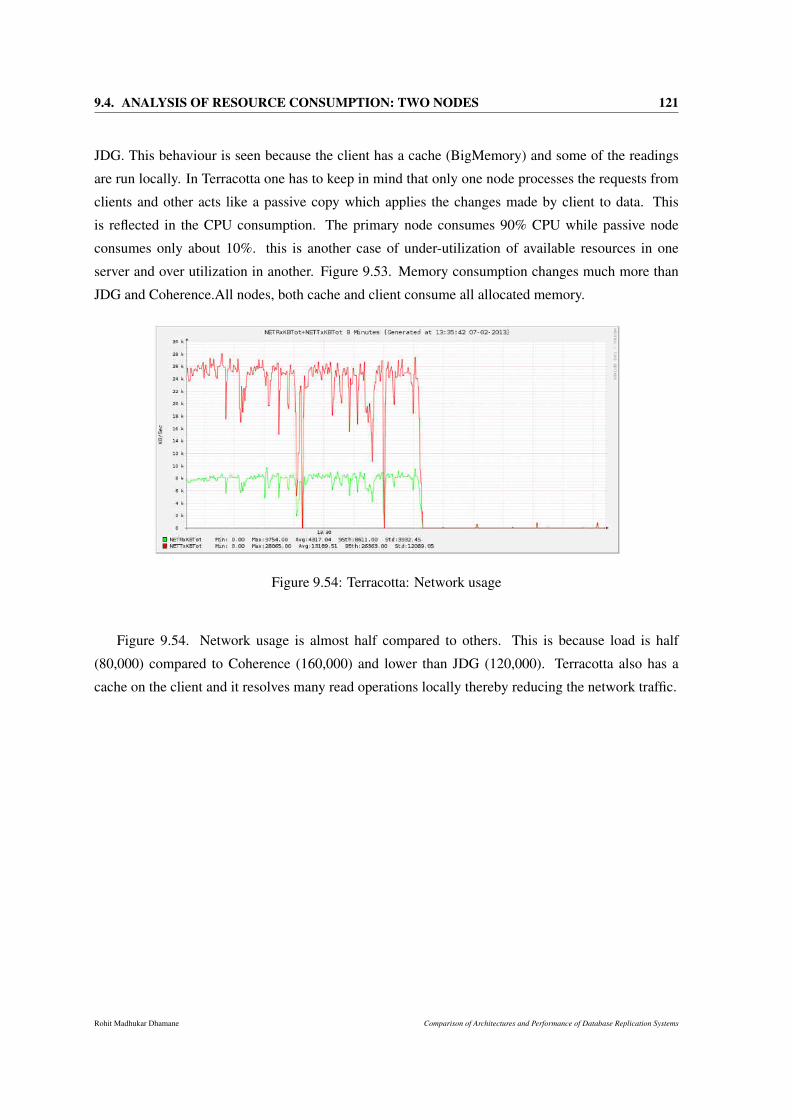
9.4. ANALYSIS OF RESOURCE CONSUMPTION: TWO NODES 121
JDG. This behaviour is seen because the client has a cache (BigMemory) and some of the readings
are run locally. In Terracotta one has to keep in mind that only one node processes the requests from
clients and other acts like a passive copy which applies the changes made by client to data. This
is reflected in the CPU consumption. The primary node consumes 90% CPU while passive node
consumes only about 10%. this is another case of under-utilization of available resources in one
server and over utilization in another. Figure 9.53. Memory consumption changes much more than
JDG and Coherence.All nodes, both cache and client consume all allocated memory.
Figure 9.54: Terracotta: Network usage
Figure 9.54. Network usage is almost half compared to others. This is because load is half
(80,000) compared to Coherence (160,000) and lower than JDG (120,000). Terracotta also has a
cache on the client and it resolves many read operations locally thereby reducing the network traffic.
Rohit Madhukar Dhamane Comparison of Architectures and Performance of Database Replication Systems

122 CHAPTER 9. DATA GRIDS EVALUATION
9.4.2 Workload:SizeSmallTypeB
For this object size (small) and load (type B) have been measured at the same point for Terracotta
and JDG (40,000). JDG is not saturated at this point but Terracotta is saturated (CPU usage is 90% in
primary node). Coherence was evaluated at 80,000 operations per second.
9.4.2.1 JBoss Data Grid: 40,000 operations per second
Figure 9.55: JBoss Data Grid: CPU usage
Figure 9.55. In JDG with half load the utilization is reaching 50%. It is noteworthy that on the
client side CPU utilization reaches 40% on average. This shows that with JDG the load is distributed
equally among both nodes.
Comparison of Architectures and Performance of Database Replication Systems Rohit Madhukar Dhamane
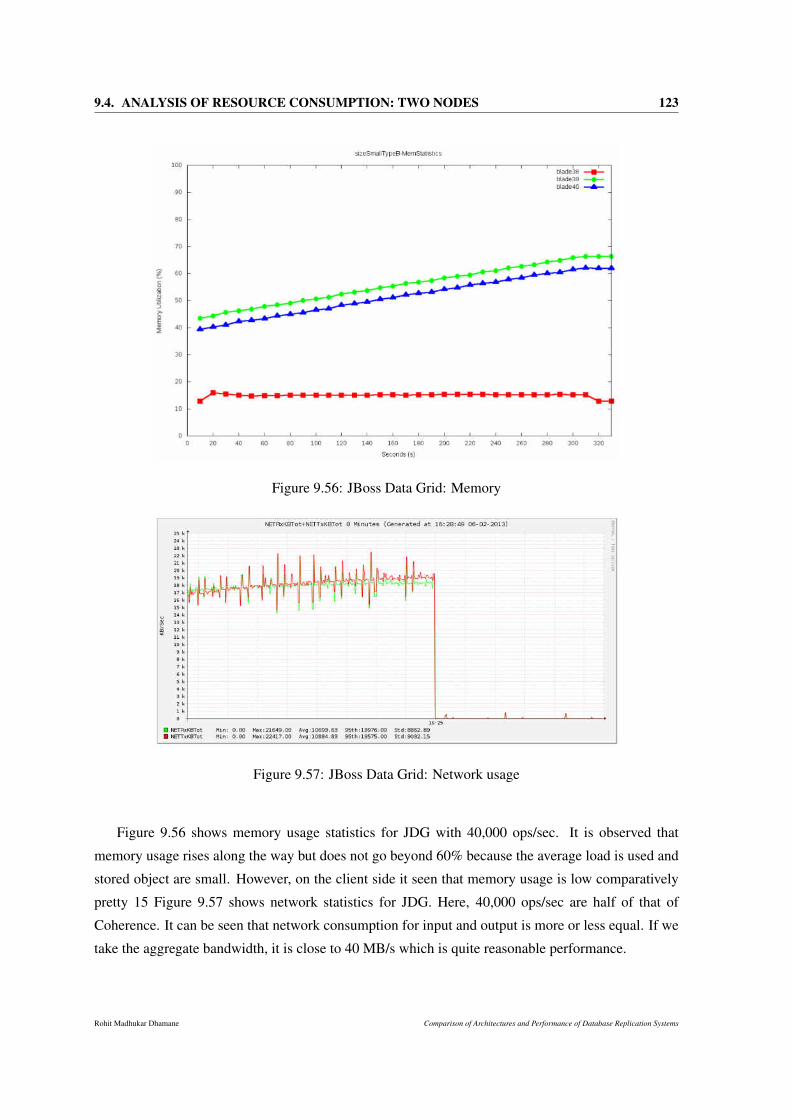
9.4. ANALYSIS OF RESOURCE CONSUMPTION: TWO NODES 123
Figure 9.56: JBoss Data Grid: Memory
Figure 9.57: JBoss Data Grid: Network usage
Figure 9.56 shows memory usage statistics for JDG with 40,000 ops/sec. It is observed that
memory usage rises along the way but does not go beyond 60% because the average load is used and
stored object are small. However, on the client side it seen that memory usage is low comparatively
pretty 15 Figure 9.57 shows network statistics for JDG. Here, 40,000 ops/sec are half of that of
Coherence. It can be seen that network consumption for input and output is more or less equal. If we
take the aggregate bandwidth, it is close to 40 MB/s which is quite reasonable performance.
Rohit Madhukar Dhamane Comparison of Architectures and Performance of Database Replication Systems

124 CHAPTER 9. DATA GRIDS EVALUATION
9.4.2.2 Coherence: 80,000 operations per second
Figure 9.58: Coherence: CPU usage
Figure 9.59: Coherence: Memory
Figure 9.58 show CPU statistics for Coherence. In this experiment Coherence was run with
80,000 ops/sec which is twice as that of JDG. Despite having double the amount of operations to
Comparison of Architectures and Performance of Database Replication Systems Rohit Madhukar Dhamane

9.4. ANALYSIS OF RESOURCE CONSUMPTION: TWO NODES 125
process compared to JDG, CPU utilization has not doubled. For Coherence we can see that CPU
consumption is around 70% while for JDG with half the number of ops/sec it was 50%. Hence we
can say that Coherence is much more efficient at processing operations than JDG.
Figure 9.60: Coherence: Network usage
Figure 9.59 shows memory statistics for Coherence. Memory consumption on servers rises lin-
early as the experiment progresses, which was expected. It comes to near 90%. the usage which is
higher than JDG. the reason for that is, Coherence is processing twice the amount of load. On the
client side it is modest. Figure 9.60 shows network statistics for Coherence. Since we were running
80,000 ops/sec in this experiment we expected to have high network usage. We can see that it is
around 70MB/s which is higher than JDG. Coherence is processing a higher load resulting in sending
more objects over network.
Rohit Madhukar Dhamane Comparison of Architectures and Performance of Database Replication Systems

126 CHAPTER 9. DATA GRIDS EVALUATION
9.4.2.3 Terracotta: 40,000 operations per second
Figure 9.61: Terracotta: CPU usage
Figure 9.62: Terracotta: Memory
Figure 9.61. Terracotta has a very irregular CPU utilization. The primary server node is nearing
saturation limit, about 90% of CPU. However the secondary node is underutilized at 20%. In addition,
Comparison of Architectures and Performance of Database Replication Systems Rohit Madhukar Dhamane

9.4. ANALYSIS OF RESOURCE CONSUMPTION: TWO NODES 127
the customer has substantial load of 50% due to requests that are served from the local cache.
Figure 9.63: Terracotta: Network usage
Figure 9.62. Terracotta uses all available memory on both server and client. This is a handicap
to client as it competes with users application cache. Figure 9.63. In Terracotta network traffic, in
and out is not the same because the local cache server avoids doing reads. Aggregate for this reaches
around 36 MB/s.
Rohit Madhukar Dhamane Comparison of Architectures and Performance of Database Replication Systems

128 CHAPTER 9. DATA GRIDS EVALUATION
9.4.3 Workload:SizeBigTypeA
9.4.3.1 JBoss Data Grid: 8,000 operations per second
Figure 9.64: JBoss Data Grid: CPU usage
Figure 9.65: JBoss Data Grid: Memory
Figure 9.64. For JDG CPU utilization is low, about 20% because of the bottleneck in network
which is explained later. Figure 9.65. Memory usage is high since these are large items. It occupies
around 80% of servers and 25-30% on client side. Figure 9.66. The network is almost saturated
reaching more than 90MB/s near the border that are 100 MB/s. Note that at this point (8000 ops) is
still not saturated. This means that the bottleneck is the network load for such large objects.
Comparison of Architectures and Performance of Database Replication Systems Rohit Madhukar Dhamane

9.4. ANALYSIS OF RESOURCE CONSUMPTION: TWO NODES 129
Figure 9.66: JBoss Data Grid: Network usage
Rohit Madhukar Dhamane Comparison of Architectures and Performance of Database Replication Systems

130 CHAPTER 9. DATA GRIDS EVALUATION
9.4.3.2 Coherence: 8,000 operations per second
Figure 9.67. Like JDG, in Coherence the bottleneck is the network. Here as well CPU usage is
around 20% on server side and 40% on client side. JDG is more efficient on client side compared to
Coherence.
Figure 9.67: Coherence: CPU usage
Figure 9.68: Coherence: Memory
Comparison of Architectures and Performance of Database Replication Systems Rohit Madhukar Dhamane

9.4. ANALYSIS OF RESOURCE CONSUMPTION: TWO NODES 131
Figure 9.68. Server memory fills to around 90% at the end of the experiment. On client side it
is around 20%. Figure 9.69. Coherence uses about 70% MB/s of network. It is close to saturation
but still has some margin. It is more efficient than JDG. At this point (8000 ops) it is still far from
saturating due not being able to process the data.
Figure 9.69: Coherence: Network usage
Rohit Madhukar Dhamane Comparison of Architectures and Performance of Database Replication Systems

132 CHAPTER 9. DATA GRIDS EVALUATION
9.4.3.3 Terracotta: 16,000 operations per second
Figure 9.70: Terracotta: CPU usage
Figure 9.71: Terracotta: Memory
Figure 9.70. Terracotta is twice as fast. The reason is due to cache used on the client side. Yet
the bottleneck is network. CPU usage o the primary server runs at 40% and 40% on client side.
Comparison of Architectures and Performance of Database Replication Systems Rohit Madhukar Dhamane

9.4. ANALYSIS OF RESOURCE CONSUMPTION: TWO NODES 133
Secondary server uses only 10% CPU, being totally underutilized. Figure 9.71. Here we can see that
Terracotta consumes all the available memory on both server and client side. This behaviour becomes
a bottleneck in performance.
Figure 9.72: Terracotta: Network usage
Figure 9.72. Network utilization is about 100 MB/s which is the available bandwidth. So the
bottleneck for this is network. It should be noted that consumption of resources has been evaluated
twice (16000 ops) with JDG and (8000 ops) Coherence. Although Terracotta consumes more network,
this consumption is not proportional to the load handled by cache on the client.
Rohit Madhukar Dhamane Comparison of Architectures and Performance of Database Replication Systems

134 CHAPTER 9. DATA GRIDS EVALUATION
9.4.4 Workload:SizeBigTypeB
9.4.4.1 JBoss Data Grid: 4,000 operations per second
Figure 9.73: JBoss Data Grid: CPU usage
Figure 9.74: JBoss Data Grid: Memory
Figure 9.73 shows CPU usage for JDG with 4,000 ops/sec. CPU consumption is quite low, around
30%. Figure 9.74. The memory runs out on server, fully occupying half of the experiment. on the
client side it uses around 20%.
Comparison of Architectures and Performance of Database Replication Systems Rohit Madhukar Dhamane

9.4. ANALYSIS OF RESOURCE CONSUMPTION: TWO NODES 135
Figure 9.75: JBoss Data Grid: Network usage
Figure 9.75 shows network statistics for JDG. Similar to load A, the network is the bottleneck.
Input and output aggregates to maximum 100 MB/s.
Rohit Madhukar Dhamane Comparison of Architectures and Performance of Database Replication Systems

136 CHAPTER 9. DATA GRIDS EVALUATION
9.4.4.2 Coherence: 4,000 operations per second
Figure 9.76: Coherence: CPU usage
Figure 9.77: Coherence: Memory
Figure 9.76,9.77, 9.78. The results for Coherence are very similar to JDG. The main difference is
that like with load A Coherence uses lesser traffic, around 80MB/s than JDG which is 100MB/s. This
Comparison of Architectures and Performance of Database Replication Systems Rohit Madhukar Dhamane

9.4. ANALYSIS OF RESOURCE CONSUMPTION: TWO NODES 137
Figure 9.78: Coherence: Network usage
indicates that Coherence is more efficient.
Rohit Madhukar Dhamane Comparison of Architectures and Performance of Database Replication Systems

138 CHAPTER 9. DATA GRIDS EVALUATION
9.4.4.3 Terracotta: 16,000 operations per second
Figure 9.79: Terracotta: CPU usage
Figure 9.80: Terracotta: Memory
Figure 9.79 show CPU usage. Average CPU usage on primary server is between 60% to 70%.
Secondary server consumes only 20% and it has to perform updates to the data. The client has lesser
Comparison of Architectures and Performance of Database Replication Systems Rohit Madhukar Dhamane
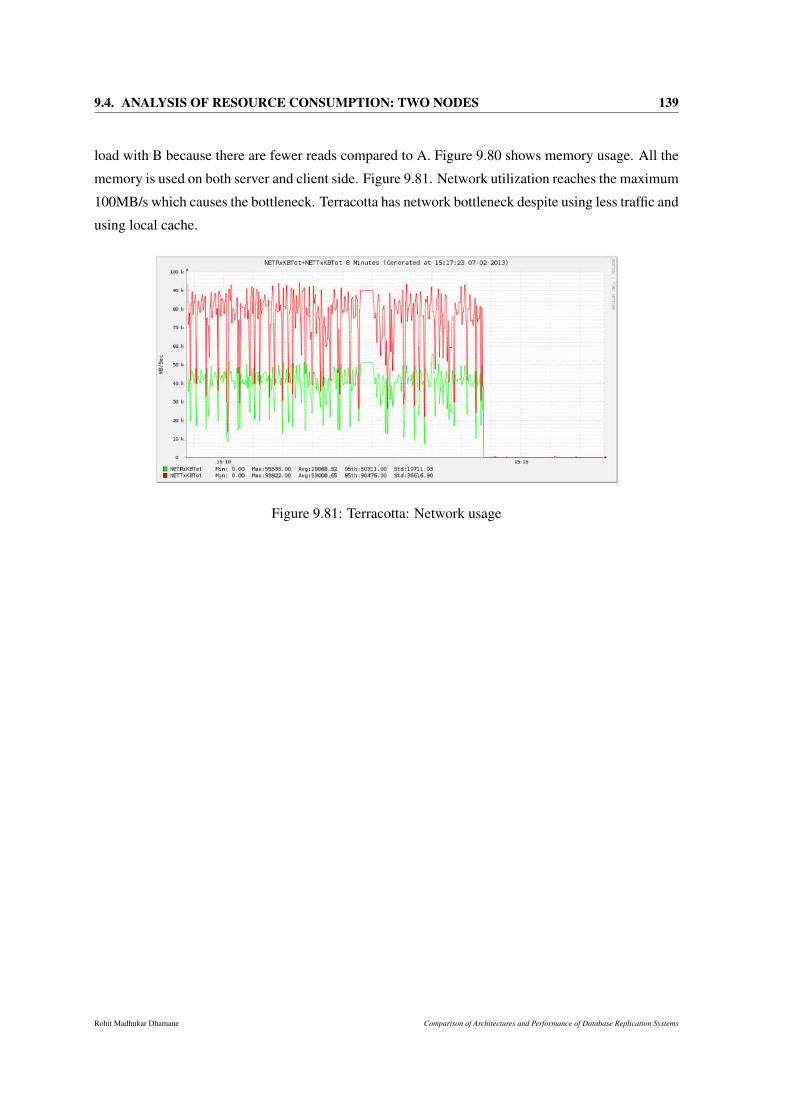
9.4. ANALYSIS OF RESOURCE CONSUMPTION: TWO NODES 139
load with B because there are fewer reads compared to A. Figure 9.80 shows memory usage. All the
memory is used on both server and client side. Figure 9.81. Network utilization reaches the maximum
100MB/s which causes the bottleneck. Terracotta has network bottleneck despite using less traffic and
using local cache.
Figure 9.81: Terracotta: Network usage
Rohit Madhukar Dhamane Comparison of Architectures and Performance of Database Replication Systems

140 CHAPTER 9. DATA GRIDS EVALUATION
9.5 Analysis of Resource Consumption: Four Nodes
In this section resource consumption with four nodes for both load types and objects is presented.
For each cache node (blade39-42) and client node (blade38) CPU usage , Memory and Network
utilization is reported.
9.5.1 Workload:SizeSmallTypeA
9.5.1.1 JBoss Data Grid: 200,000 operations per second
Figure 9.82: JBoss Data Grid: CPU usage
Figure 9.83: JBoss Data Grid: Memory
Figures 9.82, 9.83, 9.84. CPU usage is similar to experiments with two nodes. For client node
CPU usage is 50%, one of the cache nodes is saturated (90%). Memory usage is relatively more than
Comparison of Architectures and Performance of Database Replication Systems Rohit Madhukar Dhamane

9.5. ANALYSIS OF RESOURCE CONSUMPTION: FOUR NODES 141
experiments with two nodes. With four nodes the number of operations are 80,000 hence more insert
operations and higher memory usage.
Figure 9.84: JBoss Data Grid: Network usage
Rohit Madhukar Dhamane Comparison of Architectures and Performance of Database Replication Systems

142 CHAPTER 9. DATA GRIDS EVALUATION
9.5.1.2 Coherence: Target 300,000
Figures 9.85, 9.86, 9.87. Coherence shows similar behaviour as JDG.
Figure 9.85: Coherence: CPU usage
Figure 9.86: Coherence: Memory
Comparison of Architectures and Performance of Database Replication Systems Rohit Madhukar Dhamane

9.5. ANALYSIS OF RESOURCE CONSUMPTION: FOUR NODES 143
Figure 9.87: Coherence: Network usage
Rohit Madhukar Dhamane Comparison of Architectures and Performance of Database Replication Systems

144 CHAPTER 9. DATA GRIDS EVALUATION
9.5.1.3 Terracotta: Target 80,000
Figure 9.88: Terracotta: CPU usage
Figure 9.89: Terracotta: Memory
Figure 9.88, 9.89, 9.90. For terracotta resource usage is measures at the same point with two
and four cache nodes because maximum load is processed with both configuration. Client node CPU
Comparison of Architectures and Performance of Database Replication Systems Rohit Madhukar Dhamane
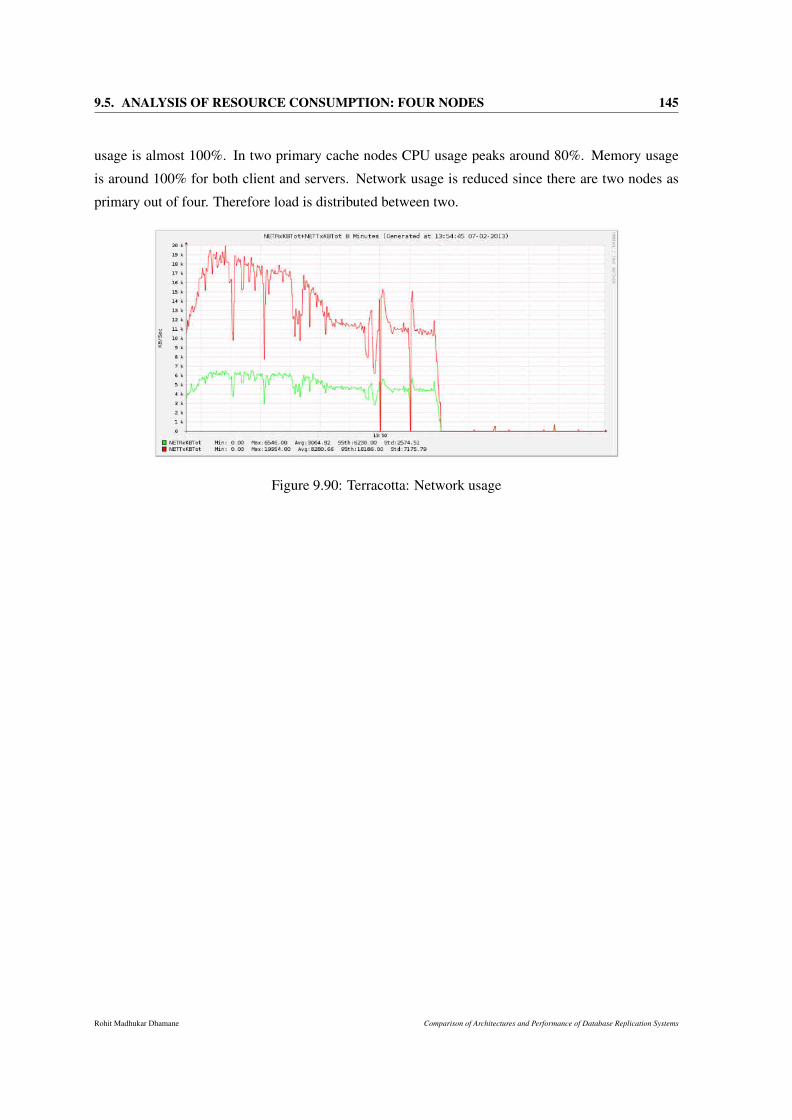
9.5. ANALYSIS OF RESOURCE CONSUMPTION: FOUR NODES 145
usage is almost 100%. In two primary cache nodes CPU usage peaks around 80%. Memory usage
is around 100% for both client and servers. Network usage is reduced since there are two nodes as
primary out of four. Therefore load is distributed between two.
Figure 9.90: Terracotta: Network usage
Rohit Madhukar Dhamane Comparison of Architectures and Performance of Database Replication Systems

146 CHAPTER 9. DATA GRIDS EVALUATION
9.5.2 Workload:SizeSmallTypeB
9.5.2.1 JBoss Data Grid: Target 64,000
Figure 9.91: JBoss Data Grid: CPU usage
Figure 9.92: JBoss Data Grid: Memory
Figures 9.91, 9.92, 9.93. With this load almost all cache nodes have similar CPU consumption
(around 80%). the client consumes 30% CPU, slightly less than with two nodes. Memory consump-
tion is uniform across cache nodes.
Comparison of Architectures and Performance of Database Replication Systems Rohit Madhukar Dhamane

9.5. ANALYSIS OF RESOURCE CONSUMPTION: FOUR NODES 147
Figure 9.93: JBoss Data Grid: Network usage
Rohit Madhukar Dhamane Comparison of Architectures and Performance of Database Replication Systems

148 CHAPTER 9. DATA GRIDS EVALUATION
9.5.2.2 Coherence: Target 120,000
Figure 9.94: Coherence: CPU usage
Figure 9.95: Coherence: Memory
Figures 9.94, 9.95, 9.96. In Coherence CPU consumption does not go beyond 60% and it is
uniform across cache nodes. With four nodes it consumes less memory than two nodes since the data
is split between four nodes.
Comparison of Architectures and Performance of Database Replication Systems Rohit Madhukar Dhamane
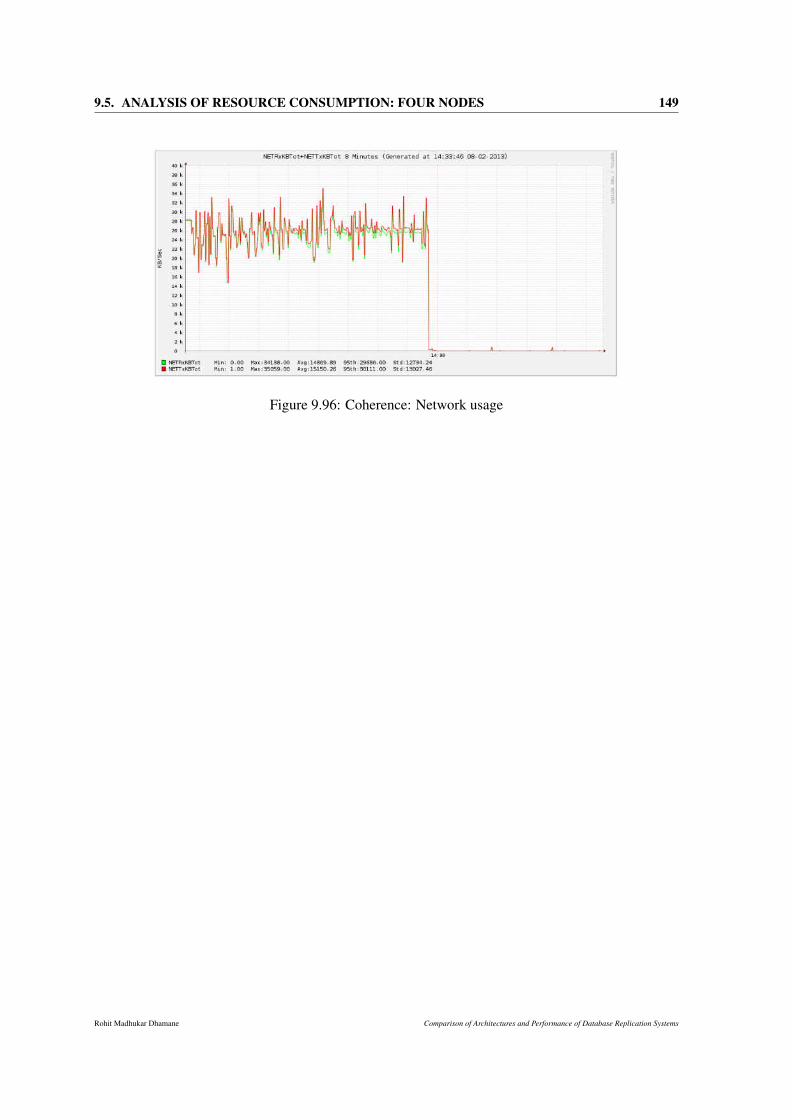
9.5. ANALYSIS OF RESOURCE CONSUMPTION: FOUR NODES 149
Figure 9.96: Coherence: Network usage
Rohit Madhukar Dhamane Comparison of Architectures and Performance of Database Replication Systems

150 CHAPTER 9. DATA GRIDS EVALUATION
9.5.2.3 Terracotta: Target 40,000
Figure 9.97: Terracotta: CPU usage
Figure 9.98: Terracotta: Memory
Figures 9.97,9.98,9.99. For Terracotta resource consumption was evaluated using same load as
with two nodes (40,000 ops). Client CPU usage is very high, reaching 100% at times. Two primary
cache nodes use 70% CPU. The memory usage is 100% on all nodes. The network usage is reduced
by having four nodes, since the data is distributed between two primary nodes.
Comparison of Architectures and Performance of Database Replication Systems Rohit Madhukar Dhamane

9.5. ANALYSIS OF RESOURCE CONSUMPTION: FOUR NODES 151
Figure 9.99: Terracotta: Network usage
Rohit Madhukar Dhamane Comparison of Architectures and Performance of Database Replication Systems

152 CHAPTER 9. DATA GRIDS EVALUATION
9.5.3 Workload:SizeBigTypeA
9.5.3.1 JBoss Data Grid: Target 16,000
Figure 9.100: JBoss Data Grid: CPU usage
Figure 9.101: JBoss Data Grid: Memory
Figures 9.100,9.101,9.102. With four nodes, when JDG reaches saturation it shows similar CPU
usage as it showed with two cache nodes setup. To process double the amount of load it consumes
twice the amount of memory than with two cache nodes. The network again remains the bottleneck,
however the saturation happens later.
Comparison of Architectures and Performance of Database Replication Systems Rohit Madhukar Dhamane

9.5. ANALYSIS OF RESOURCE CONSUMPTION: FOUR NODES 153
Figure 9.102: JBoss Data Grid: Network usage
Rohit Madhukar Dhamane Comparison of Architectures and Performance of Database Replication Systems

154 CHAPTER 9. DATA GRIDS EVALUATION
9.5.3.2 Coherence: Target 16,000
Figure 9.103: Coherence: CPU usage
Figure 9.104: Coherence: Memory
Figures 9.103,9.104,9.105. Coherence shows similar behaviour as JDG with four nodes.
Comparison of Architectures and Performance of Database Replication Systems Rohit Madhukar Dhamane

9.5. ANALYSIS OF RESOURCE CONSUMPTION: FOUR NODES 155
Figure 9.105: Coherence: Network usage
Rohit Madhukar Dhamane Comparison of Architectures and Performance of Database Replication Systems
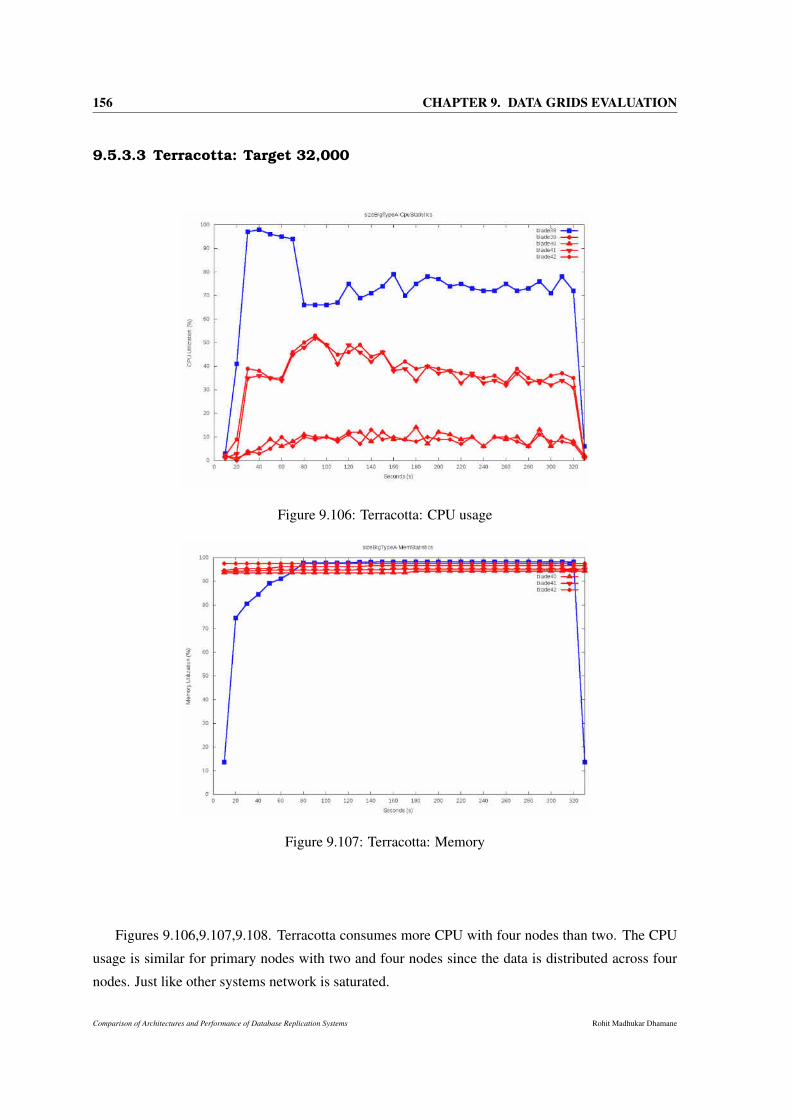
156 CHAPTER 9. DATA GRIDS EVALUATION
9.5.3.3 Terracotta: Target 32,000
Figure 9.106: Terracotta: CPU usage
Figure 9.107: Terracotta: Memory
Figures 9.106,9.107,9.108. Terracotta consumes more CPU with four nodes than two. The CPU
usage is similar for primary nodes with two and four nodes since the data is distributed across four
nodes. Just like other systems network is saturated.
Comparison of Architectures and Performance of Database Replication Systems Rohit Madhukar Dhamane

9.5. ANALYSIS OF RESOURCE CONSUMPTION: FOUR NODES 157
Figure 9.108: Terracotta: Network usage
Rohit Madhukar Dhamane Comparison of Architectures and Performance of Database Replication Systems
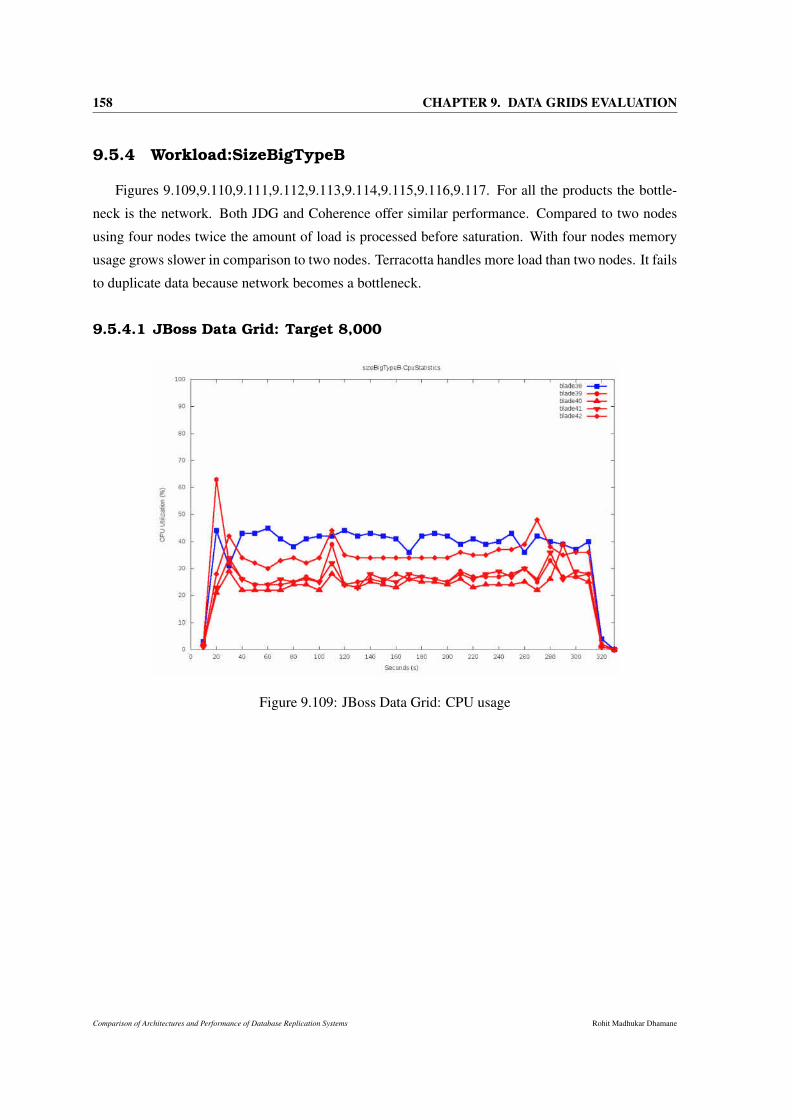
158 CHAPTER 9. DATA GRIDS EVALUATION
9.5.4 Workload:SizeBigTypeB
Figures 9.109,9.110,9.111,9.112,9.113,9.114,9.115,9.116,9.117. For all the products the bottle-
neck is the network. Both JDG and Coherence offer similar performance. Compared to two nodes
using four nodes twice the amount of load is processed before saturation. With four nodes memory
usage grows slower in comparison to two nodes. Terracotta handles more load than two nodes. It fails
to duplicate data because network becomes a bottleneck.
9.5.4.1 JBoss Data Grid: Target 8,000
Figure 9.109: JBoss Data Grid: CPU usage
Comparison of Architectures and Performance of Database Replication Systems Rohit Madhukar Dhamane

9.5. ANALYSIS OF RESOURCE CONSUMPTION: FOUR NODES 159
Figure 9.110: JBoss Data Grid: Memory
Figure 9.111: JBoss Data Grid: Network usage
Rohit Madhukar Dhamane Comparison of Architectures and Performance of Database Replication Systems

160 CHAPTER 9. DATA GRIDS EVALUATION
9.5.4.2 Coherence: Target 8,000
Figure 9.112: Coherence: CPU usage
Figure 9.113: Coherence: Memory
Figures 9.112 show CPU usage for Coherence with target of 8,000 ops.sec. Similarly 9.113
memory statistics and 9.114 shows network statistics.
Comparison of Architectures and Performance of Database Replication Systems Rohit Madhukar Dhamane

9.5. ANALYSIS OF RESOURCE CONSUMPTION: FOUR NODES 161
Figure 9.114: Coherence: Network usage
Rohit Madhukar Dhamane Comparison of Architectures and Performance of Database Replication Systems

162 CHAPTER 9. DATA GRIDS EVALUATION
9.5.4.3 Terracotta: Target 12,000
Figure 9.115: Terracotta: CPU usage
Figure 9.116: Terracotta: Memory
Figure 9.115 shows CPU statistics for Terracotta with target of 12,000 ops/sec. Figure 9.116
shows memory statistics and figure 9.117 show network statistics
Comparison of Architectures and Performance of Database Replication Systems Rohit Madhukar Dhamane

9.5. ANALYSIS OF RESOURCE CONSUMPTION: FOUR NODES 163
Figure 9.117: Terracotta: Network usage
Rohit Madhukar Dhamane Comparison of Architectures and Performance of Database Replication Systems

164 CHAPTER 9. DATA GRIDS EVALUATION
9.6 Fault Tolerance
This section provides the results obtained from the fault tolerance experiment. The aim of this
study was to see what happens when one of the nodes in cache fails suddenly. In all the experiments
one of the cache nodes is killed after 6 minutes (360 sec) of run time. The number of operations per
second dent depends on the type of load and size of objects.
• SizeSmallTypeA: 80,000 ops/s with 10 clients. For Terracotta and two nodes, 48,000 ops/s
with six clients.
• SizeSmallTypeB: 40,000 ops/s with 10 clients. For Terracotta and two nodes, 24,000 ops/s with
six clients.
• SizeBigTypeA: 8,000 ops/s with four clients.
• SizeBigTypeB: 4,000 ops/s with four clients.
Comparison of Architectures and Performance of Database Replication Systems Rohit Madhukar Dhamane

9.6. FAULT TOLERANCE 165
9.6.1 Workload:SizeSmallTypeA
9.6.1.1 Two Nodes
Both Terracotta and JDG offer very high response time when a failure occurs. In case of Terracotta
it takes more than a minute to stabilize the response time. JDG take seven more time (2 mins) to
stabilize. In contrast for Coherence response times show almost no increase after failure.
Figure 9.118: Two nodes: SizeSmallTypeA Insert
Figure 9.119: Two nodes: SizeSmallTypeA Read
Rohit Madhukar Dhamane Comparison of Architectures and Performance of Database Replication Systems

166 CHAPTER 9. DATA GRIDS EVALUATION
Figure 9.120: Two nodes: SizeSmallTypeA Update
Comparison of Architectures and Performance of Database Replication Systems Rohit Madhukar Dhamane

9.6. FAULT TOLERANCE 167
9.6.1.2 Four Nodes
With four nodes JDG behaviour improves substantially. It takes about 40 seconds to stabilize. For
two node setup when a failure occurs, all the work is done by single remaining node hence we see
longer time to stabilize. For Terracotta the behaviour is much worse compared to two nodes. Since
most of the read operations are done locally and inserts are propagated to all the nodes. Coherence
again shows no effect of failure on response times.
Figure 9.121: Four nodes: SizeBigTypeA Insert
Figure 9.122: Four nodes: SizeBigTypeA Read
Rohit Madhukar Dhamane Comparison of Architectures and Performance of Database Replication Systems

168 CHAPTER 9. DATA GRIDS EVALUATION
Figure 9.123: Four nodes: SizeBigTypeA Update
Comparison of Architectures and Performance of Database Replication Systems Rohit Madhukar Dhamane

9.6. FAULT TOLERANCE 169
9.6.2 Workload:SizeSmallTypeB
9.6.2.1 Two Nodes
The results for write load are similar to previous results with two nodes. Terracotta takes longer
time to recover from failure.
Figure 9.124: Two nodes: SizeSmallTypeB Insert
Figure 9.125: Two nodes: SizeSmallTypeB Read
Rohit Madhukar Dhamane Comparison of Architectures and Performance of Database Replication Systems

170 CHAPTER 9. DATA GRIDS EVALUATION
Figure 9.126: Two nodes: SizeSmallTypeB Update
Comparison of Architectures and Performance of Database Replication Systems Rohit Madhukar Dhamane

9.6. FAULT TOLERANCE 171
9.6.2.2 Four Nodes
The results obtained for write load on JDG seems to be much worse than those for reading. Re-
sponse times when fault occurs are very high and take about 40 seconds to stabilize. Compared with
two nodes it shows no significant improvement.
Terracotta fails to retrieve the response times obtained before failure in case of insert and it’s two
magnitude higher than before failure. The remaining operations have lower response times than two
nodes.
Figure 9.127: Four nodes: SizeSmallTypeB Insert
Figure 9.128: Four nodes: SizeSmallTypeB Read
Rohit Madhukar Dhamane Comparison of Architectures and Performance of Database Replication Systems

172 CHAPTER 9. DATA GRIDS EVALUATION
Figure 9.129: Four nodes: SizeSmallTypeB Update
Comparison of Architectures and Performance of Database Replication Systems Rohit Madhukar Dhamane

9.6. FAULT TOLERANCE 173
9.6.3 Workload:SizeBigTypeA
9.6.3.1 Two Nodes
With large data read operations JDG is unable to cope with failure. Terracotta takes about 30
seconds to retrieve the response time and during this period response times don’t exceed over 200 ms.
Coherence show somewhat higher response times after failure for the first time although highest
response time is about 40 ms which is still lower in comparison.
Figure 9.130: Two nodes: SizeBigTypeA Insert
Figure 9.131: Two nodes: SizeBigTypeA Read
Rohit Madhukar Dhamane Comparison of Architectures and Performance of Database Replication Systems

174 CHAPTER 9. DATA GRIDS EVALUATION
Figure 9.132: Two nodes: SizeBigTypeA Update
Comparison of Architectures and Performance of Database Replication Systems Rohit Madhukar Dhamane

9.6. FAULT TOLERANCE 175
9.6.3.2 Four Nodes
With four nodes both JDG and Terracotta improve compared to setup with two nodes. JDG is
able to process the workload after failure (with three nodes).
Response times after failure for Terracotta are somewhat smaller than with two nodes. Coherence
shows similar results as with two nodes.
Figure 9.133: Four nodes: SizeBigTypeA Insert
Figure 9.134: Four nodes: SizeBigTypeA Read
Rohit Madhukar Dhamane Comparison of Architectures and Performance of Database Replication Systems

176 CHAPTER 9. DATA GRIDS EVALUATION
Figure 9.135: Four nodes: SizeBigTypeA Update
Comparison of Architectures and Performance of Database Replication Systems Rohit Madhukar Dhamane

9.6. FAULT TOLERANCE 177
9.6.4 Workload:SizeBigtypeB
9.6.4.1 Two Nodes
Here JDG shows higher response times than other two systems. Response times improve after
failure because with only one node left there is no need to send updates to other nodes. Terracotta has
higher response times than reading load. For Coherence again there is small increment in response
time but it is quite small in comparison.
Figure 9.136: Two nodes: SizeBigtypeB Insert
Figure 9.137: Two nodes: SizeBigtypeB Read
Rohit Madhukar Dhamane Comparison of Architectures and Performance of Database Replication Systems

178 CHAPTER 9. DATA GRIDS EVALUATION
Figure 9.138: Two nodes: SizeBigtypeB Update
9.6.4.2 Four Nodes
Here all the products improve their performance after failure and response times affect less to all
products.
Figure 9.139: Four nodes: SizeBigtypeB Insert
Comparison of Architectures and Performance of Database Replication Systems Rohit Madhukar Dhamane
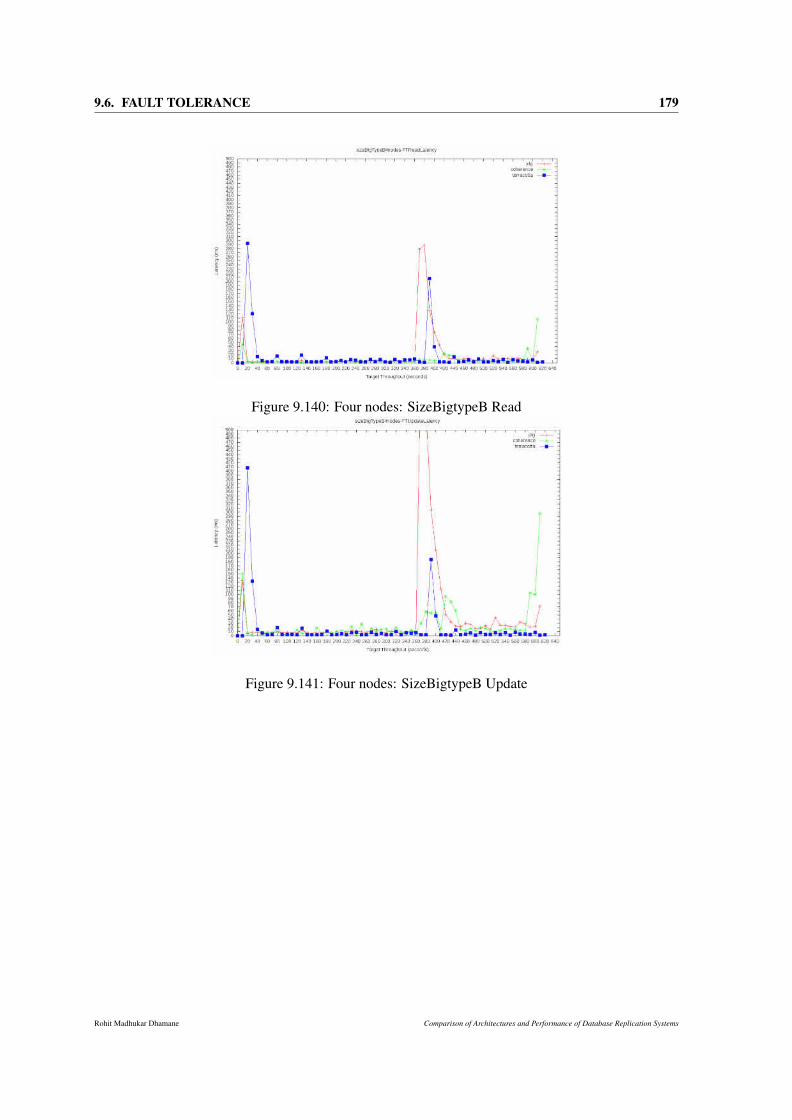
9.6. FAULT TOLERANCE 179
Figure 9.140: Four nodes: SizeBigtypeB Read
Figure 9.141: Four nodes: SizeBigtypeB Update
Rohit Madhukar Dhamane Comparison of Architectures and Performance of Database Replication Systems

180 CHAPTER 9. DATA GRIDS EVALUATION
9.6.5 Fault Tolerance: Conclusion
The product which handles the failure best is Coherence. The response times are not affected with
small objects and very large objects show very little increase (40 to 90 ms). Both JDG and Terracotta
take considerable time to recover from a failure.
Terracotta behaviour worsens with more nodes and small objects, unlike JDG, which was expected to
perform better with more nodes.
Terracotta results improve with larger objects. It should be noted that the number of transactions sent
were considerably lower (6 times less than Terracotta) and effect of cache is greater with small objects
and this is reflected in both productivity and time to recover from fault.
Comparison of Architectures and Performance of Database Replication Systems Rohit Madhukar Dhamane

9.7. CONCLUSION 181
9.7 Conclusion
The best performance was shown by Coherence after analysing the overall behaviour. It has a
higher throughput, scalability and excellent fault tolerance behaviour. The failures are handled much
better compared to other two products.
Terracotta has some disadvantages compared to competitors. The replication model makes at
least one cache node idle therefore the hardware of that node is underutilized most of the time. On the
other hand, Terracotta cache model is based on having a machine having lots of memory instead of
using memory of several machines. Therefore if one wants to process more transactions per unit time
of time then model to follow is to expand the memory and performance of the machine rather than
adding more nodes. terracotta cache has advantage in certain situations when probability of object
being in client cache is high. However it requires higher memory on client side as well which may
restrict clients configuration, e.g. if the client has an application server then it might happen that there
won’t be any memory left for server when Terracotta client cache is running. By reducing the client
cache advantage mentioned before is lost.
JDG is an open source alternative to Coherence. Although its benefits are lower than those of Coher-
ence and no limitations of Terracotta.
When using any product we should take into account the bottlenecks in the system. The type of
load to run and size of objects in the cache, CPU and Network usage. In particular for large objects
the bottleneck is the network, requiring more servers to use available bandwidth with a given work
load.
Rohit Madhukar Dhamane Comparison of Architectures and Performance of Database Replication Systems

182 CHAPTER 9. DATA GRIDS EVALUATION
Comparison of Architectures and Performance of Database Replication Systems Rohit Madhukar Dhamane

Part X
Graph Databases


Chapter 10
Introduction
10.1 Graph Databases
A graph can be defined as collection of nodes and relationships between those nodes. This type
of data model is very useful to discover an entity (node) and its relationship with various objects. A
simple way to understand this is to imagine social networks. In social networks like twitter, face-
book users follow other users and they can track each others profile updates. In this scenario we can
imagine users as nodes and relationship as time-line of messages between users. Using this data it is
possible to get messages shared during certain time period between users. On a social media platform
relationships between users are more complex and by applying this model one can get many types of
relationships. To accomplish this a Graph Database is used. Graph Databases are data management
systems that uses graph data model and can perform create, read, update, delete functions over stored
data and efficient traversals of the graph.
Efficient traversals of the graph is the main advantage of graph databases compared to relational
databases. Operations such as finding friends of a friend which are connected at a given depth are
efficiently implemented by graph databases however, the same operation using a relational data base
implies executing several join operations on a table which is very expensive in terms of response
time. In contrast to traditional databases, graph databases do not include transactions or offer limited
consistency. In this chapter we will present architecture and transactional properties of three Graph
Databases: Neo4j [Neo], Titan [Tit] and Sparksee [Spa], and propose how to implement transactions
providing snapshot isolation [PSJP+16].
Rohit Madhukar Dhamane Comparison of Architectures and Performance of Database Replication Systems

186 CHAPTER 10. INTRODUCTION
10.1.1 Neo4j
Neo4j [Neo] is a graph database which provides high availability with ACID transactional sup-
port. Nodes and relationships can have properties. Each node is often used to represent an entity and
relationships are used to connect these nodes. Every relationship has a start and end node. Neo4j also
supports properties and labels, for nodes and relationships. Figure 10.1 shows architecture for Neo4j
graph database. The architecture consists of a persistent store, object cache, similar to traditional
Figure 10.1: Neo4j Architecture
databases. The transactional management is optimized for graph data model. It provides traversal
API to go through data graph. It uses Cypher query language [cyp] for accessing data. Cypher gen-
erates the execution plan, finds start node, traverse through relationships and retrieves the results.
Compared to SQL queries Cypher provides much simpler queries since it does not require complex
table joins like relational databases do. Neo4j keeps nodes in a file with node identifier. The position
stores ID of first relationship and property ID. The information of source node and destination node
of a relationship is stored in another file. Neo4j also provides indexes. For nodes it provides two
indexes, one for labels and another for properties to map them with associated nodes. Also, index for
relationships provide mapping properties to nodes holding those properties.
Neo4j offers high availability by adding additional machines to existing ones. It runs under
master-slave replication model however unlike traditional master-slave replication model applica-
tion can write to any machine (master or slaves). The updates are propagated to master to guarantee
consistency. However, Neo4j uses optimistic consistency, i.e. transactions does not wait for slaves to
complete updates from master. Once master completes a transaction the updates are eventually prop-
Comparison of Architectures and Performance of Database Replication Systems Rohit Madhukar Dhamane
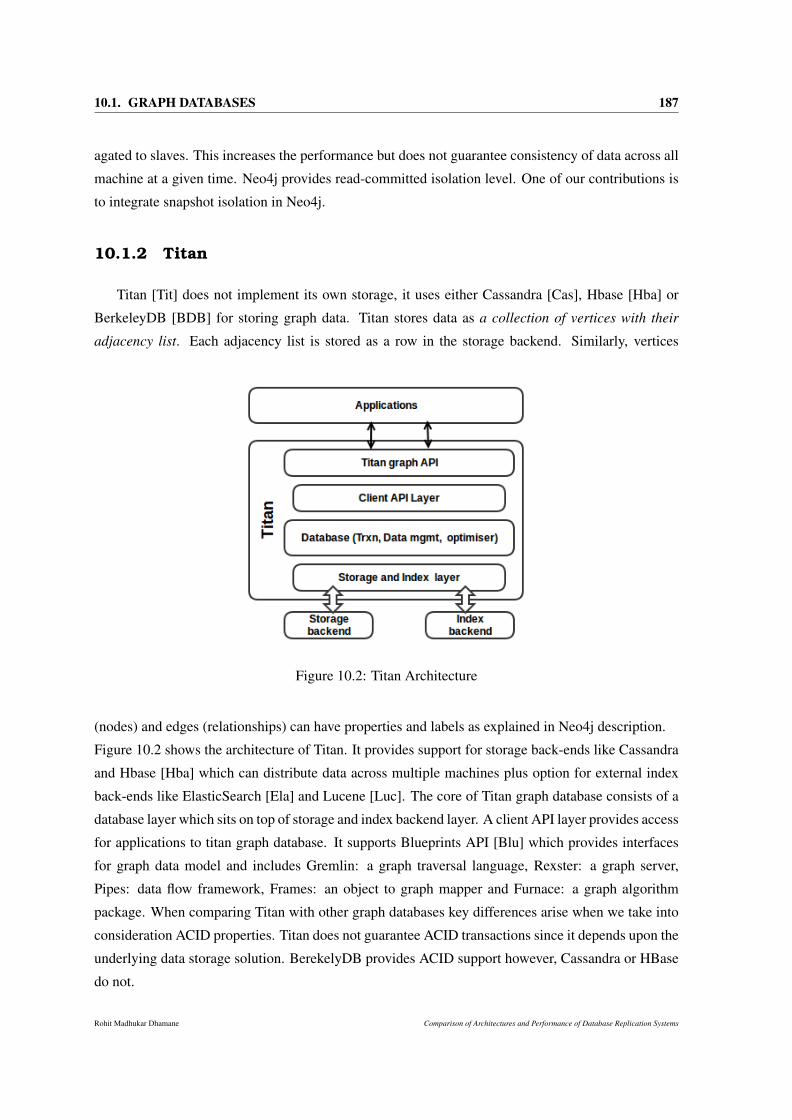
10.1. GRAPH DATABASES 187
agated to slaves. This increases the performance but does not guarantee consistency of data across all
machine at a given time. Neo4j provides read-committed isolation level. One of our contributions is
to integrate snapshot isolation in Neo4j.
10.1.2 Titan
Titan [Tit] does not implement its own storage, it uses either Cassandra [Cas], Hbase [Hba] or
BerkeleyDB [BDB] for storing graph data. Titan stores data as a collection of vertices with their
adjacency list. Each adjacency list is stored as a row in the storage backend. Similarly, vertices
Figure 10.2: Titan Architecture
(nodes) and edges (relationships) can have properties and labels as explained in Neo4j description.
Figure 10.2 shows the architecture of Titan. It provides support for storage back-ends like Cassandra
and Hbase [Hba] which can distribute data across multiple machines plus option for external index
back-ends like ElasticSearch [Ela] and Lucene [Luc]. The core of Titan graph database consists of a
database layer which sits on top of storage and index backend layer. A client API layer provides access
for applications to titan graph database. It supports Blueprints API [Blu] which provides interfaces
for graph data model and includes Gremlin: a graph traversal language, Rexster: a graph server,
Pipes: data flow framework, Frames: an object to graph mapper and Furnace: a graph algorithm
package. When comparing Titan with other graph databases key differences arise when we take into
consideration ACID properties. Titan does not guarantee ACID transactions since it depends upon the
underlying data storage solution. BerekelyDB provides ACID support however, Cassandra or HBase
do not.
Rohit Madhukar Dhamane Comparison of Architectures and Performance of Database Replication Systems

188 CHAPTER 10. INTRODUCTION
10.1.3 Sparksee
Sparksee (DEX formerly) [Spa] is another graph database solution available in the market. Spark-
see uses a technique called virtual edge, where nodes having same values for a given attribute are
connected together. It uses bitmaps to store nodes and relationships of a certain type. Figure 10.3
shows basic architecture of sparksee graph database. It provides native APIs for applications written
in languages other than C++. An interface layer called SWIG provides wrappers for those APIs. The
core of Sparksee platform implements a buffer pool, data structure layer and a graph engine which
stores the data in to graph database (GDB). Sparksee core manages the graph queries and APIs are
used to provide application connectivity and retrieve results.
Sparksee provides horizontal scalability. It is optimized for higher read type of workload rather than
Figure 10.3: Sparksee Architecture
write. Sparksee uses master-slave replication technique similar to Neo4j. The master receives updates
from a slave and directs it towards other slaves. The master uses history log with serialized writes
to accomplish updating slaves. All the updates are based on eventual consistency hence chances of
different data on two machines at a given time is quite possible. It provides full ACID support for
transactions.
Comparison of Architectures and Performance of Database Replication Systems Rohit Madhukar Dhamane

10.1. GRAPH DATABASES 189
10.1.4 Snapshot Isolation for Neo4j
This section describes the implementation of snapshot isolation in Neo4j graph database [PSJP+16].
As explained earlier by default Neo4j supports read-committed isolation. The problem with read com-
mitted isolation is that under certain circumstances it is possible to get unrepeatable reads or phantom
reads. What that means is that a path traversed by a transaction might not exists when tried to go
through again. To overcome such scenarios, isolation guarantee like snapshot isolation [BBG+95]
is quite useful. Snapshot isolation provides isolation guarantee very similar to serializability while
avoiding read-write conflicts. It can be implemented by enforcing two rules:
The read rule: Transaction should observe the most recent committed data at the time of start of a
transaction.
The write rule: Transaction should be committed only if no two transactions can make concurrent
update to the same data.
To implement snapshot isolation in Neo4j we have added a commit timestamp property to both
nodes and relationships. Another property was added to check if the data was deleted or not. Al-
though the deleted items are kept until no previous versions can be read by an active transaction. This
mechanism is called as tombstone versions. These versions of data are kept in the Object Cache of
Neo4j. Each object whether it is for node or relationship keeps multiple versions. This way a trans-
action reading a node can access the correct version by traversing the list of versions. Neo4j queries
return answer by using an iterator which traverses through graph to find a persistent state of data. We
provide the same iterator ability to go through multiple versions of data kept in cache and guarantee
that a transaction will read its own writes. Hence this guarantees that uncommitted versions of data
are kept private to respective transaction and not accessible to other transaction.
Another modification to Neo4j was removal of short read locks since they are not needed for
snapshot isolation. The long write locks have been modified to implement first-updater commits
transaction in case of write conflicts to same data.
Similar strategy was implemented for indexes as well. Neo4j never deletes the properties and
relationships even if no nodes are using them. When a property or label has been created by a trans-
action with a higher timestamp than the start timestamp of the reader transaction, it can simply discard
them. If the timestamp is equal or lower than the start timestamp of the reading transaction then the
list of associated nodes/relationships is traversed. The nodes/relationships are tagged with the commit
timestamp of the transaction that associated the label/property to the node/relationship. In this way, it
is possible to discard those nodes/relationships that do not correspond to the snapshot to be observed
by the transaction (those with a higher commit timestamp than the start timestamp of the reading
Rohit Madhukar Dhamane Comparison of Architectures and Performance of Database Replication Systems

190 CHAPTER 10. INTRODUCTION
transaction).
Although multi-versioning guarantees strong isolation level it can come at the cost of loosing
efficiency. One such inefficiency is garbage collection process. For example in PostgreSQl garbage
collection is known as vacuum process and during this time processing is stopped for a while. This
is due to necessity to traverse through all the pages in the persistent storage and rewriting them after
removing obsolete versions. In this implementation of Neo4j, all the versions are stored in object
cache of Neo4j and only the most recent committed versions of data items are stored in persistent
storage. Hence, this reduces the extra overhead of accessing persistent storage and make system han-
dle garbage collection more efficiently. This implementation of snapshot isolation in Neo4j provided
better isolation guarantee for transactions without compromising on efficiency.
10.1.5 Conclusions
In this chapter we briefly discussed the basic differences between traditional databases and graph
databases. From the architecture of three graph databases studied, Neo4j, Titan and Sparksee it can
be said that graph databases provide more efficient and simpler query processing. However, graph
databases either do not provide transactions or they provide loose transaction isolation guarantees
such as read-committed which is prone to inconsistent data reads. To overcome such issues we pro-
vided an implementation of snapshot isolation in Neo4j graph database. This implementation not only
provides stronger isolation guarantee but also by efficiently handling garbage collection provides a
more robust solution for Neo4j.
Comparison of Architectures and Performance of Database Replication Systems Rohit Madhukar Dhamane

Part XI
Summary and Conclusions


Chapter 11
Summary and Conclusions
This thesis aspires to evaluate data replication systems based on traditional Relational Systems and
newer In Memory Data Grids. As described in Chapter I 1.1 the aim of this thesis was to study
the architecture and replication behaviour of Middle-R, C-JDBC and MySQL Cluster on relational
database management systems. Chapter IV 9 explained in detail architecture of these three systems
as well as replication protocol, isolation guarantees and load balancing for optimum distribution of
workload. To summarise on this point Middle-R provides a very well round distributed replication
system with no single point of failure on the other hand C-JDBC server can become a single point of
failure. MySQL Cluster is a commercial product and it provides a very robust architecture to provide
data availability and failure protection.
Experimental analysis using state of the art TPC-C and TPC-W benchmarks 5 showed that under
moderate workload all three system can handle the scaling from two to six nodes. As we increased
the workload size the performance of all systems dropped. Since MySQL Cluster stores all the data in
memory, when database was unable to fit into available memory for each data node ( 2GB) it could not
run the TPC-C benchmark. For all systems average respose times increased with larger database sizes.
For TPC-W experiments again as the database size increased the performance of replication sys-
tems decreased. We found out that Middle-R performs well for read transactions on the other hand for
MySQL Cluster this was a bit of bottleneck with high read probability since data is always partitioned
across cluster and fetching requisite data over network adds overhead. Just like TPC-C we observed
that as database size increases the response times increases as well.
Rohit Madhukar Dhamane Comparison of Architectures and Performance of Database Replication Systems

194 CHAPTER 11. SUMMARY AND CONCLUSIONS
For fault tolerance experiments with TPC-C Middle-R showed excellent recovery times while C-
JDBC was worse. MySQL performed relatively well. Experiments with TPC-W benchmark showed
MySQL Cluster improving its recovery time while Midle-R still performed well. C-JDBC on the
other hand did not do any better. Hence our conclusion is that Middle-R and MySQL cluster have
excellent fault tolerance capabilities, with MySQl Cluster winning because of TPC-W fault tolerance
results.
Similarly, we also showed architectural differences between In-Memory Data Grids in Chapter
7. We discussed in details how cache can improve the performance of a system. We evaluated the
transaction management for each system and discussed various storage options provided by them.
Each systems support many APIs but not all of them support the same APIs. For example JBoss sup-
ports popular memcached protocol while Oracle Coherence does not instead it provides a proprietary
protocol. Similar to RDBMS replication systems we performed experiments on Data Grids using a
industry standard benchmark 12. The experiments were run using four type of workloads. The exten-
sive study of scalability and fault tolerance show that Coherence performed much better compared to
JBoss Data Grid and Terracotta Ehcache. It gives higher throughput and excellent fault tolerance.
We provide reason for system behaviour, such as Terracotta performance is not upto the par with
other since its replication model makes at least one node highly under utilized while one node is over
utilized. However, its cache at client side gives advantage in certain situations when data does not
need to be rad from the remote sever.
This thesis tried to take into consideration all the important aspects of a replication system and put
forward a detailed study of their behaviour under various types of workloads. It provides reasonable
explanations for system performance and pros and cons of each system based on circumstances.
11.1 Contributions
This thesis contributes in-depth study and comparison of architecture of replicated data manage-
ment systems. It provide a framework to understand and evaluate OLTP and In-Memory Data Grid
systems. For a business which depends on a robust data management system it is critical to choose
the best possible solution and using the procedures followed in this thesis one can evaluate the per-
formance, scalability and fault-tolerance of replicated data management systems.
Comparison of Architectures and Performance of Database Replication Systems Rohit Madhukar Dhamane

11.2. FUTURE DIRECTIONS 195
Thesis deals primarily to study most important aspects of relational database replication system
such as architecture and features. It also provides comparison of benchmarks for OLTP processing.
The methods used in this thesis can be applied to study the scalability and fault tolerance of relational
database systems.
Similarly, second part of the thesis on In-Memory Data Grids provides the understanding of var-
ious architectures and features of data grids. It provides detailed evaluation on scalability and fault
tolerance of replicated in-memory data grids. The methodology followed in this thesis could be ap-
plied to understand pros and cons of various replication solutions in In-Memory Data Grids.
Thesis also briefly discusses graph databases architecture and transaction processing. It presents
the research work done on implementing snapshot isolation in one of the graph databases studied,
Neo4j.
11.2 Future Directions
In future I would like to explore more into NoSQL databases and perform experiments for evalu-
ation. I would like to explore possibility to experiment with graph databases as well. Implementing a
benchmark to explore these new data storage systems would be very useful as well.
Rohit Madhukar Dhamane Comparison of Architectures and Performance of Database Replication Systems

196 CHAPTER 11. SUMMARY AND CONCLUSIONS
Comparison of Architectures and Performance of Database Replication Systems Rohit Madhukar Dhamane

Part XII
APPENDICES


Chapter 12
Appendices
12.1 Middle-R Installation
To install Middle-R on a node we need to first install the Postgresql-7.2 version of PostgreSQl
database which was modified to work with Middle-R. The process to install the PostgreSQL database
is straight forward. First cd to location where you have Postgresql-7.2 source code and then execute
the following commands.
1. ./configure –prefix=/Path/to/PostgreSQL/installation/directory
Possible problem here could be error: storage size of ’peercred’ isn’t known. If this is the case the
following lines need to be added to the file ./src/include/libpq/hba.h:
struct ucred {
unsigned int pid;
unsigned int uid;
unsigned int gid;
}
2. sudo make
3. sudo make install
4. sudo adduser postgres
5. cd PostgreSQL location
6. mkdir data
7. sudo chown postgres /data
8. sudo su - postgres
Rohit Madhukar Dhamane Comparison of Architectures and Performance of Database Replication Systems

200 CHAPTER 12. APPENDICES
9. ./bin/initdb -D ./data
10. ./bin/postmaster -D ./data/ -p 6551 -i
11. ./bin/createdb test (replace test with your desired database name)
12. ./bin/psql test
After this next step is to install Ocaml and Ensemble packages. Ocaml is needed for proper func-
tioning of ensemble. It is important that the proper versions are installed, so using apt-get is not
advised. Version used of Ensemble is 1.42 and the compatible version of Ocaml with this one is 3.06.
After Ocaml is installed, the enviroment variables stated in INSTALL.htm should be defined:
ENS_MACHTYPE=i386
export ENS_MACHTYPE
ENS_OSTYPE=linux
export ENS_OSTYPE
OCAMLLIB="ocaml-installation-dir/lib/ocaml"
export OCAMLLIB
PATH=$PATH:ocaml-installation-dir/bin
export PATH
To test that ocaml run:
ocamlc -v
The outupt shoud be this one:
The Objective Caml compiler, version 3.06
Standard library directory: /cloudcache/mr/ocaml/lib/ocaml
Now to install Ensemble following commands need to be executed in the ensemble folder.
make depend
make all
NOTE: You might need to create symbolic link for gmake to make, with the following command:
sudo ln -s /usr/bin/make /usr/bin/gmake
However, make all may not run smoothly. Please note that the following line is only if all the
components of ensemble need to be compiled. In order for middleware to work ONLY hot library
is sufficient. In order for make all to work, additional blank spaces might need to be added in ./ce/-
Makefile in line 179: # Put C outboard objects into one library
$(ENSLIB)/libceo$(SO): $(OUTBOARD_OBJ)
Comparison of Architectures and Performance of Database Replication Systems Rohit Madhukar Dhamane
12.1. MIDDLE-R INSTALLATION 201
$(MKSHRLIB) $(MKSHRLIBO)$(ENSLIB)/libceo$(SO)
$(OUTBOARD_OBJ)
$(CE_LINK_FLAGS)
and in line 194:
$(ENSROOT)/lib/$(PLATFORM)/libsock$(ARC)
newline $(OCAML_LIB)/libunix$(ARCS)
newline $(MLRUNTIME)
newline $(CE_LINK_FLAGS) $(CE_THREAD_LIB)
However, in order for ensamble to work properly, the correction above can be skipped and ONLY
./hot needs to be build issuing the command:
First issue following commands in the ./ensemble folder
1. make clean
2. make depend
3. make all
After the errors appear go to ./hot/ directory and issue the above commands in the same order again
to compile the hot library in ensemble.
Next step is to build middleware. Before that, the Makefile in middleware folder needs to be checked
for the correct paths of PGLIB, PGINCLUDE, ENS_HOTINCLUDE, ENS_HOTLIB. It is done with
the command:
make -k clean all
In order to start middleware, postgresql needs to be running. Starting middleware is done with:
./middlesip-globalseq <ExperimentID> <MyID> <path to N”MyID”.config> Where MyID is the
Node ID. The first node to start is 0, then 1, and so on.
If any errors happens it is most likely because of the environment variables. Hence make sure you
have set them correctly. Following example of environment variables ca be helpful.
export ENS_MACHTYPE=i386
export ENS_OSTYPE=linux
export OCAMLLIB=/home/ubuntu/mr/ocaml/lib/ocaml
export NUM_MEMBERS=2
export CHECKPOINT_DIR=/home/ubuntu/mr/checkpoint/FULL/1/5
export NUM_DB_CONNECTIONS=100
export NUM_DB_THREADS=100
export MPL=100
export NUM_WS_CONNECTIONS=25
Rohit Madhukar Dhamane Comparison of Architectures and Performance of Database Replication Systems

202 CHAPTER 12. APPENDICES
export DBUSER=postgres
export LOCAL=/home/ubuntu/mr/cfgs
export PARTITION_MATRIX_FILE=/home/ubuntu/mr/middle-r/config/WAN/4nodes/2edges/schema/Full
export PARTITION_MATRIX=Full
export REPLICATION_SCHEMA=Full
export REPLICATION_DEGREE=1
export RECOVERY=no
export NUM_RECOVERERS=1
export RECOVERY_WRITESETS_WINDOW=30
export LD_LIBRARY_PATH=<posgresql compiled>/lib
export JAVA_HOME=/home/ubuntu/mr/j1.4
export JRE_HOME=/home/ubuntu/mr/j1.4
export SCHEMA_NAME=FULL
export SCRIPTS_DIR=/home/ubuntu/mr/middle-r/scripts
export LANG=C
12.2 C-JDBC Installation
C-JDBC installation is very straight forward. We can use Java graphical installer or use the
binary distribution of C-JDBC. For binary distribution we need to set the CJDBCHOME environ-
ment variable. On Unix/Linux systems using following commands will set the correct variable for
C-JDBC.
bash> mkdir -p /usr/local/c-jdbc
bash> cd /usr/local/c-jdbc
bash> tar xfz /path-to-c-jdbc-bin-dist/c-jdbc-x.y-bin.tar.gz
bash> export CJDBC_HOME=/usr/local/c-jdbc
Once the CJDBC_HOME variable is set we can proceed to configure the C-JDBC controller. The
most important point to configure the C-JDBC controller is using correct configuration for V irtual
database. C-JDBC connects to each database backend on a unique port, hence it is important to start
each database backend with a unique port number. Following example of virtual database settings for
our two-database backend cluster shows how this can be done.
<C-JDBC>
<VirtualDatabase name="tpcw">
<AuthenticationManager>
Comparison of Architectures and Performance of Database Replication Systems Rohit Madhukar Dhamane

12.2. C-JDBC INSTALLATION 203
<Admin>
<User username="postgres" password=""/>
</Admin>
<VirtualUsers>
<VirtualLogin vLogin="postgres" vPassword=""/>
</VirtualUsers>
</AuthenticationManager>
<DatabaseBackend name="remote" driver="org.postgresql.Driver"
driverPath="/home/rohit/Software/c-jdbc-2.0.2-bin/drivers/postgresql-8.0.309.jdbc3.jar"
url="jdbc:postgresql://192.168.164.136:6552/tpcw"
connectionTestStatement="select now()">
<ConnectionManager vLogin="postgres" rLogin="postgres" rPassword="">
<VariablePoolConnectionManager initPoolSize="10" minPoolSize="5"
maxPoolSize="50" idleTimeout="30" waitTimeout="10"/>
</ConnectionManager>
</DatabaseBackend>
<DatabaseBackend name="remote" driver="org.postgresql.Driver"
driverPath="/home/rohit/Software/c-jdbc-2.0.2-bin/drivers/postgresql-8.0.309.jdbc3.jar"
url="jdbc:postgresql://192.168.164.137:6551/tpcw"
connectionTestStatement="select now()">
<ConnectionManager vLogin="postgres" rLogin="postgres" rPassword="">
<VariablePoolConnectionManager initPoolSize="10" minPoolSize="5"
maxPoolSize="50" idleTimeout="30" waitTimeout="10"/>
</ConnectionManager>
</DatabaseBackend>
<RequestManager>
<RequestScheduler>
<RAIDb-1Scheduler level="passThrough"/>
</RequestScheduler>
<RequestCache>
<MetadataCache/>
<ParsingCache/>
<ResultCache granularity="table"/>
</RequestCache>
<LoadBalancer>
<RAIDb-1>
Rohit Madhukar Dhamane Comparison of Architectures and Performance of Database Replication Systems

204 CHAPTER 12. APPENDICES
<WaitForCompletion policy="first"/>
<RAIDb-1-LeastPendingRequestsFirst/>
</RAIDb-1>
</LoadBalancer>
</RequestManager>
</VirtualDatabase>
</C-JDBC>
As we can see that in the DatabaseBackend section of the configuration file each database backend
has a unique port number (6552 and 6551). We also define other parameter for the virtual database
such as pool size for connection pooling, load balancing technique i.e. RAIDb1-Scheduler and result
cache granularity.
12.3 MySQL Cluster Installation
For high availability and failover protection MySQL Cluster requires to use at least two data
nodes and one one server for Management Server. The basic procedure to install a MySQL Cluster
with two data nodes and two SQL nodes is explained below. Management Node 1. Download and
untar mysql cluster tar file in $HOME folder (mysql-cluster-gpl-7.1.15a-linux-i686-glibc23.tar.gz) 2.
mkdir $HOME/mysql/mysql-cluster
3. vim $HOME/mysql/mysql-cluster/config.ini
Enter following in the config.ini file and save it. Make appropriate changes.
[ndbd default]
NoOfReplicas=3
DataMemory=80M
IndexMemory=18M
[tcp default]
[ndb_mgmd]
hostname=192.168.1.108 # Hostname or IP address of MGM node
datadir=$HOME/mysql/mysql-cluster # Directory for MGM node log files
[ndbd]
hostname=192.168.1.109 # Hostname or IP address of Data Node
datadir=$HOME/mysql_cluster/data # Directory for this data node’s data files
[ndbd]
hostname=192.168.1.110 # Hostname or IP address of Data Node
datadir=$HOME/mysql_cluster/data # Directory for this data node.s data files
Comparison of Architectures and Performance of Database Replication Systems Rohit Madhukar Dhamane

12.3. MYSQL CLUSTER INSTALLATION 205
#[mysqld] for each SQL node.
[mysqld]
hostname=192.168.1.109 # Hostname or IP address for MySQL Server (Same as data node in this
example. It can be different.)
[mysqld]
hostname=192.168.1.110 # Hostname or IP address for MySQL Server (Same as data node in this
example. It can be different.)
4. ln -s mysql-cluster-gpl-7.1.15a-linux-i686-glibc23 mysqlc
5. export PATH=$PATH:$HOME/mysqlc/bin
6. echo "export PATH=$PATH:$HOME/mysqlc/bin" » $HOME/.bashrc
7. ndb_mgmd -f config.ini –initial –configdir=$HOME/mysql/mysql-cluster/ #Start management server
8. ndb_mgm #Monitor Data/SQL Nodes
Data/SQL Nodes
1. mkdir $HOME/mysql_cluster $HOME/mysql_cluster/data $HOME/mysql_cluster/conf
2. ln -s mysqlcluster-gpl-7.1.15a-linux-i686-glibc23 mysqlc (download and untar mysql in $HOME
folder before this)
3. vim mysql_cluster/conf/my.cnf
4. Enter Following in the my.cnf file
[mysqld]
ndbcluster
# IP address of the cluster management node
ndb-connectstring=192.168.1.108
[mysql_cluster]
# IP address of the cluster management node
ndb-connectstring=192.168.1.108
Save and close my.cnf
5. cd mysqlc
6. scripts/mysql_install_db –no-defaults –basedir=$HOME/mysqlc/ –datadir=$HOME/mysql_cluster/data/
–tmpdir=$HOME/mysql_cluster/tmp/
7. bin/ndbd –initial #Start ndbd service. –initial ONLY for the first time start
8. bin/mysqld_safe –defaults-file=$HOME/mysql_cluster/conf/my.cnf –datadir=$HOME/mysql_cluster/data/
&
To check if everything is installed correctly, go to management server and type
bin/neb_mgm -e
> show
Rohit Madhukar Dhamane Comparison of Architectures and Performance of Database Replication Systems

206 CHAPTER 12. APPENDICES
This will show you if all the data nodes and SQL nodes are running or not.
12.4 TPC-H - Table Schema
CREATE TABLE PART (
P_PARTKEY SERIAL PRIMARY KEY,
P_NAME VARCHAR(55),
P_MFGR CHAR(25),
P_BRAND CHAR(10),
P_TYPE VARCHAR(25),
P_SIZE INTEGER,
P_CONTAINER CHAR(10),
P_RETAILPRICE DECIMAL,
P_COMMENT VARCHAR(23)
);
CREATE TABLE SUPPLIER (
S_SUPPKEY SERIAL PRIMARY KEY,
S_NAME CHAR(25),
S_ADDRESS VARCHAR(40),
S_NATIONKEY BIGINT NOT NULL,
– references N_NATIONKEY
S_PHONE CHAR(15),
S_ACCTBAL DECIMAL,
S_COMMENT VARCHAR(101)
);
CREATE TABLE PARTSUPP (
PS_PARTKEY BIGINT NOT NULL,
– references P_PARTKEY
PS_SUPPKEY BIGINT NOT NULL,
– references S_SUPPKEY
PS_AVAILQTY INTEGER,
PS_SUPPLYCOST DECIMAL,
PS_COMMENT VARCHAR(199),
Comparison of Architectures and Performance of Database Replication Systems Rohit Madhukar Dhamane

12.4. TPC-H - TABLE SCHEMA 207
PRIMARY KEY (PS_PARTKEY, PS_SUPPKEY)
);
CREATE TABLE CUSTOMER (
C_CUSTKEY SERIAL PRIMARY KEY,
C_NAME VARCHAR(25),
C_ADDRESS VARCHAR(40),
C_NATIONKEY BIGINT NOT NULL,
– references N_NATIONKEY
C_PHONE CHAR(15),
C_ACCTBAL DECIMAL,
C_MKTSEGMENT CHAR(10),
C_COMMENT VARCHAR(117)
);-
CREATE TABLE ORDERS (
O_ORDERKEY SERIAL PRIMARY KEY,
O_CUSTKEY BIGINT NOT NULL,
– references C_CUSTKEY
O_ORDERSTATUS CHAR(1),
O_TOTALPRICE DECIMAL,
O_ORDERDATE DATE,
O_ORDERPRIORITY CHAR(15),
O_CLERK CHAR(15),
O_SHIPPRIORITY INTEGER,
O_COMMENT VARCHAR(79)
);
CREATE TABLE LINEITEM (
L_ORDERKEY BIGINT NOT NULL,
– references O_ORDERKEY
L_PARTKEY BIGINT NOT NULL,
– references P_PARTKEY (compound fk to PARTSUPP)
L_SUPPKEY BIGINT NOT NULL,
– references S_SUPPKEY (compound fk to PARTSUPP)
L_LINENUMBER INTEGER,
Rohit Madhukar Dhamane Comparison of Architectures and Performance of Database Replication Systems

208 CHAPTER 12. APPENDICES
L_QUANTITY DECIMAL,
L_EXTENDEDPRICE DECIMAL,
L_DISCOUNT DECIMAL,
L_TAX DECIMAL,
L_RETURNFLAG CHAR(1),
L_LINESTATUS CHAR(1),
L_SHIPDATE DATE,
L_COMMITDATE DATE,
L_RECEIPTDATE DATE,
L_SHIPINSTRUCT CHAR(25),
L_SHIPMODE CHAR(10),
L_COMMENT VARCHAR(44),
PRIMARY KEY (L_ORDERKEY, L_LINENUMBER)
);
CREATE TABLE NATION (
N_NATIONKEY SERIAL PRIMARY KEY,
N_NAME CHAR(25),
N_REGIONKEY BIGINT NOT NULL,
– references R_REGIONKEY
N_COMMENT VARCHAR(152)
);
CREATE TABLE REGION (
R_REGIONKEY SERIAL PRIMARY KEY,
R_NAME CHAR(25),
R_COMMENT VARCHAR(152)
);
12.5 TPC-H Foreign Keys
ALTER TABLE SUPPLIER ADD FOREIGN KEY (S_NATIONKEY)
REFERENCES NATION(N_NATIONKEY);
ALTER TABLE PARTSUPP ADD FOREIGN KEY (PS_PARTKEY)
REFERENCES PART(P_PARTKEY);
Comparison of Architectures and Performance of Database Replication Systems Rohit Madhukar Dhamane

12.5. TPC-H FOREIGN KEYS 209
ALTER TABLE PARTSUPP ADD FOREIGN KEY (PS_SUPPKEY)
REFERENCES SUPPLIER(S_SUPPKEY);
ALTER TABLE CUSTOMER ADD FOREIGN KEY (C_NATIONKEY)
REFERENCES NATION(N_NATIONKEY);
ALTER TABLE ORDERS ADD FOREIGN KEY (O_CUSTKEY)
REFERENCES CUSTOMER(C_CUSTKEY);
ALTER TABLE LINEITEM ADD FOREIGN KEY (L_ORDERKEY)
REFERENCES ORDERS(O_ORDERKEY);
ALTER TABLE LINEITEM ADD FOREIGN KEY (L_PARTKEY,L_SUPPKEY)
REFERENCES PARTSUPP(PS_PARTKEY,PS_SUPPKEY);
ALTER TABLE NATION ADD FOREIGN KEY (N_REGIONKEY)
REFERENCES REGION(R_REGIONKEY);
CREATE INDEX l_shipdate_idx ON LINEITEM(L_SHIPDATE);
Rohit Madhukar Dhamane Comparison of Architectures and Performance of Database Replication Systems

210 CHAPTER 12. APPENDICES
Comparison of Architectures and Performance of Database Replication Systems Rohit Madhukar Dhamane

Bibliography
[2pc] Two-phase commit mechanism. https://docs.oracle.com/cd/
B28359_01/server.111/b28310/ds_txns003.htm. Accessed:
2015-12-4.
[ACZ05] Cristiana Amza, Alan L. Cox, and Willy Zwaenepoel. A comparative evaluation of
transparent scaling techniques for dynamic content servers. In Proc. International
Conference on Data Engineering (ICDE’05), pages 230–241, 2005.
[ADMnE+06] J. E. Armendáriz, H. Decker, F. D. Muñoz Escoí, L. Irún-Briz, and R. de Juan-
Marín. A middleware architecture for supporting adaptable replication of enter-
prise application data. In Proceedings of the 31st VLDB Conference on Trends in
Enterprise Application Architecture, TEAA’05, pages 29–43, Berlin, Heidelberg,
2006. Springer-Verlag.
[ALZ03] C. Amza, A. L.Cox, and W. Zwaenepoel. Distributed versioning: Consistent repli-
cation for scaling back-end databases of dynamic content web sites. In Proceedings
of the ACM/IFIP/USENIX 2003 International Conference on Middleware. Springer,
2003.
[AT02] Yair Amir and Ciprian Tutu. From total order to database replication. In Pro-
ceedings of the 22 Nd International Conference on Distributed Computing Systems
(ICDCS’02), ICDCS ’02, pages 494–, Washington, DC, USA, 2002. IEEE Com-
puter Society.
[BBG+95] Hal Berenson, Phil Bernstein, Jim Gray, Jim Melton, Elizabeth O’Neil, and Patrick
O’Neil. A critique of ansi sql isolation levels. In Proceedings of the 1995 ACM
SIGMOD International Conference on Management of Data, SIGMOD ’95, pages
1–10, New York, NY, USA, 1995. ACM.
[BDB] Oracle berkeley db java edition. http://www.oracle.com/us/
products/database/berkeley-db/je/overview/index.html.
Accessed: 2015-12-4.
Rohit Madhukar Dhamane Comparison of Architectures and Performance of Database Replication Systems

212 BIBLIOGRAPHY
[BGMEZP08] J.M. Bernabe-Gisbert, F.D. Munoz-Escoi, V. Zuikeviciute, and F. Pedone. A prob-
abilistic analysis of snapshot isolation with partial replication. In Symposium on
Reliable Distributed Systems (SRDS). IEEE Computer Society, 2008.
[Biga] Big data survey. http://www.gigaspaces.com/sites/default/
files/product/BigDataSurvey_Report.pdf. Accessed: 2015-10-4.
[Bigb] Bigmemory. http://terracotta.org/products/bigmemory. Ac-
cessed: 2015-12-4.
[Blu] Blueprints. http://blueprints.tinkerpop.com/. Accessed: 2015-12-
4.
[BPGG13] C.E. Bezerra, F. Pedone, B. Garbinato, and C. Geyer. Optimistic atomic multi-
cast. In Distributed Computing Systems (ICDCS), 2013 IEEE 33rd International
Conference on, pages 380–389, July 2013.
[CAA+11] Shimin Chen, Anastasia Ailamaki, Manos Athanassoulis, Phillip B. Gibbons, Ryan
Johnson, Ippokratis Pandis, and Radu Stoica. Tpc-e vs. tpc-c: Characterizing the
new tpc-e benchmark via an i/o comparison study. SIGMOD Rec., 39(3):5–10,
February 2011.
[Cac] Read-through, write-through, write-behind, and refresh-ahead caching.
https://docs.oracle.com/cd/E15357_01/coh.360/e15723/
cache_rtwtwbra.htm#COHDG199. Accessed: 2015-10-4.
[Cas] Apache cassandra. http://cassandra.apache.org. Accessed: 2015-12-
4.
[CBPS10] Bernadette Charron-Bost, Fernando Pedone, and André Schiper, editors. Replica-
tion: Theory and Practice. Springer-Verlag, Berlin, Heidelberg, 2010.
[CCA08a] Emmanuel Cecchet, George Candea, and Anastasia Ailamaki. Middleware-based
database replication: the gaps between theory and practice. In ACM SIGMOD
International Conference on Management Of Data, 2008.
[CCA08b] Emmanuel Cecchet, George Candea, and Anastasia Ailamaki. Middleware-based
database replication: The gaps between theory and practice. In Proceedings of the
2008 ACM SIGMOD International Conference on Management of Data, SIGMOD
’08, pages 739–752, New York, NY, USA, 2008. ACM.
Comparison of Architectures and Performance of Database Replication Systems Rohit Madhukar Dhamane

BIBLIOGRAPHY 213
[CDS] Oracle coherence - implementing storage and backing maps. http:
//docs.oracle.com/middleware/1212/coherence/COHDG/
cache_back.htm#BJFHHFHF. Accessed: 2015-12-4.
[Cha] The challenge of big data. http://www.gigaspaces.com/sites/
default/files/product/BigDataSurvey_Report.pdf. Accessed:
2015-10-4.
[CKV01] Gregory Chockler, Idit Keidar, and Roman Vitenberg. Group communication spec-
ifications: a comprehensive study. ACM Computing Surveys, pages 427–469, 2001.
[CLL+11] Biswapesh Chattopadhyay, Liang Lin, Weiran Liu, Sagar Mittal, Prathyusha
Aragonda, Vera Lychagina, Younghee Kwon, and Michael Wong. Tenzing a sql
implementation on the mapreduce framework. In Proceedings of VLDB, pages
1318–1327, 2011.
[CMZ04a] CEmmanuel Cecchet, Julie Marguerite, and Willy Zwaenepoel. Raidb: Redundant
array of inexpensive databases. In ISPA, volume 3358, pages 115–125. Springer,
2004.
[CMZ04b] Emmanuel Cecchet, Julie Marguerite, and Willy Zwaenepoel. C-jdbc: Flexi-
ble database clustering middleware. In USENIX Annual Technical Conference,
FREENIX Track, pages 9–18. USENIX, 2004.
[Coha] Amp cache performance tests - jboss cache and oracle coherence cache.
[Cohb] Coherence extend. http://coherence.oracle.com/display/
COH35UG/Coherence+Extend. Accessed: 2015-12-4.
[Cohc] Coherence rest. http://docs.oracle.com/cd/E24290_01/coh.371/
e22839/rest_intro.htm. Accessed: 2015-12-4.
[Cohd] Coherence transaction locks. http://docs.oracle.com/cd/E24290_
01/coh.371/e22837/api_transactionslocks.htm#BEIBACHA.
Accessed: 2015-12-4.
[Cohe] Oracle coherence. http://www.oracle.com/technetwork/
middleware/coherence/overview/index.html. Accessed: 2015-10-
4.
[Con] Jdk - concurrentmap. http://docs.oracle.com/javase/7/docs/
api/java/util/concurrent/ConcurrentMap.html. Accessed: 2015-
12-4.
Rohit Madhukar Dhamane Comparison of Architectures and Performance of Database Replication Systems

214 BIBLIOGRAPHY
[CPPW10] L. Camargos, F. Pedone, A. Pilchin, and M. Wieloch. On-demand recovery in
middleware storage systems. In Reliable Distributed Systems, 2010 29th IEEE
Symposium on, pages 204–213, Oct 2010.
[CPR+07] A. Correia, J. Pereira, L. Rodrigues, N. Carvalho, R.Oliveira R. Vilaca, and
S.Guedes. Gorda: An open architecture for database replication. In Network Com-
puting and Applications (NCA), 2007.
[CRML01] H.W. Cain, R. Rajwar, M. Marden, and M.H. Lipasti. An architectural evaluation of
java tpc-w. In High-Performance Computer Architecture, 2001. HPCA. The Seventh
International Symposium on, pages 229–240, 2001.
[CST+10] Brian F. Cooper, Adam Silberstein, Erwin Tam, Raghu Ramakrishnan, and Russell
Sears. Benchmarking cloud serving systems with ycsb. In Proceedings of the 1st
ACM symposium on Cloud computing, SoCC ’10, pages 143–154, New York, NY,
USA, 2010. ACM.
[cyp] Cypher query language. http://neo4j.com/docs/stable/
cypher-getting-started.html. Accessed: 2015-12-4.
[DBS] Database sharding white paper. http://dbshards.com/dbshards/
database-sharding-white-paper/. Accessed: 2015-03-19.
[DKS06] Daudjee, Khuzaima, and Kenneth Salem. Lazy database replication with snapshot
isolation. In International Conference on Very Large Data Bases (VLDB), 2006.
[DMVP14] Rohit Dhamane, Marta Patiño Martínez, Valerio Vianello, and Ricardo Jiménez
Peris. Performance evaluation of database replication systems. In Proceedings of
the 18th International Database Engineering & Applications Symposium, IDEAS
’14, pages 288–293, New York, NY, USA, 2014. ACM.
[DRPQ14] Diego Didona, Paolo Romano, Sebastiano Peluso, and Francesco Quaglia. Transac-
tional auto scaler: Elastic scaling of replicated in-memory transactional data grids.
ACM Trans. Auton. Adapt. Syst., 9(2):11:1–11:32, July 2014.
[EDe] Ehcache developers guide. http://ehcache.org/files/
documentation/EhcacheUserGuide.pdf. Accessed: 2015-12-4.
[EDP06] Elnikety, S. G. Dropsho, and F. Pedone. Tashkent: Uniting durability with transac-
tion ordering for high-performance scalable database replication. In ACMSIGOP-
S/EuroSys European Conference on Computer Systems, 2006.
Comparison of Architectures and Performance of Database Replication Systems Rohit Madhukar Dhamane

BIBLIOGRAPHY 215
[Ehca] Ehcache - apis. http://terracotta.org/documentation/3.7.4/
enterprise-ehcache/api-guide#28129. Accessed: 2015-12-4.
[Ehcb] Ehcache - tuning garbage collection. http://ehcache.org/
documentation/operations/garbage-collection. Accessed:
2015-12-4.
[Ehcc] Ehcache eventual consistency. http://ehcache.org/documentation/
get-started/consistency-options#eventual-consistency.
Accessed: 2015-12-4.
[Ehcd] Ehcache strong consistency. http://ehcache.org/documentation/
get-started/consistency-options#strong-consistency. Ac-
cessed: 2015-12-4.
[Ehce] Ehcache write-through and write-behind caching. http://ehcache.org/
documentation/apis/write-through-caching. Accessed: 2015-12-
4.
[Ehcf] Terracotta ehcache. http://terracotta.org/products/
enterprise-ehcache. Accessed: 2015-10-4.
[Ela] Elasticsearch. https://www.elastic.co/. Accessed: 2015-12-4.
[EMG] Ehcache architecture. http://ehcache.org/documentation/2.4/
terracotta/architecture. Accessed: 2015-12-4.
[Esc08] Escada tpc-c. https://github.com/rmpvilaca/EscadaTPC-C, 2008.
Accessed: 2015-10-21.
[Gem] Vmware gemfire. https://www.vmware.com/products/
vfabric-gemfire/overview. Accessed: 2015-10-4.
[GHOS96] Jim Gray, Pat Helland, Patrick E. O’Neil, and Dennis Shasha. The Dangers of
Replication and a Solution. In ACM SIGMOD International Conference on Man-
agement of Data, 1996.
[Gig] Gigaspace xap. http://www.gigaspaces.com/
xap-in-memory-caching-scaling/datagrid. Accessed: 2015-
10-4.
[Had] Hadoopdb. http://db.cs.yale.edu/hadoopdb/hadoopdb.html. Ac-
cessed: 2015-12-4.
Rohit Madhukar Dhamane Comparison of Architectures and Performance of Database Replication Systems

216 BIBLIOGRAPHY
[Haz] Hazelcast. https://hazelcast.com/. Accessed: 2015-10-4.
[Hba] Hbase. http://hbase.apache.org. Accessed: 2015-12-4.
[Hiv] Apache hive. https://hive.apache.org/. Accessed: 2015-10-21.
[HJA+02] Holliday, J., Agrawal, D., and A. El Abbadi. Partial database replication using
epidemic communication. In International Conference on Distributed Computing
Systems (ICDCS), 2002.
[Hot] Hot rod. http://www.jboss.org/jdf/quickstarts/
jboss-as-quickstart/jdg-quickstarts/hotrod-endpoint/.
Accessed: 2015-12-4.
[Igna] Apache ignite. https://ignite.apache.org/. Accessed: 2015-10-4.
[Ignb] Benchmarking data grids: Apache ignite (tm) (incu-
bating) vs hazelcast. http://www.gridgain.com/
benchmarking-data-grids-apache-ignite-vs-hazelcast-part-1/.
Accessed: 2015-10-4.
[Inf] Infinispan. http://infinispan.org/. Accessed: 2015-10-4.
[JCa] Jcache jsr 107. https://jcp.org/en/jsr/detail?id=107. Accessed:
2015-10-4.
[JDG] Jboss data grid. http://www.redhat.com/products/
jbossenterprisemiddleware/data-grid/. Accessed: 2015-10-
4.
[JEA] Jboss enterprise application platform - garbage collection and performance
tuning. https://access.redhat.com/site/documentation/
en-US/JBoss_Enterprise_Application_Platform/5/html/
Performance_Tuning_Guide/sect-Performance_Tuning_
Guide-Java_Virtual_Machine_Tuning-Garbage_Collection_
and_Performance_Tuning.html. Accessed: 2015-12-4.
[JPKA02] Ricardo Jiménez-Peris, Marta Patiño-Martínez, Bettina Kemme, and Gustavo
Alonso. Improving the scalability of fault-tolerant database clusters. In ICDCS,
pages 477–484, 2002.
[JPPMA02] Ricardo Jiménez-Peris, Marta Patiño-Martínez, and Gustavo Alonso. Non-
intrusive, parallel recovery of replicated data. In SRDS, pages 150–159, 2002.
Comparison of Architectures and Performance of Database Replication Systems Rohit Madhukar Dhamane

BIBLIOGRAPHY 217
[JWY+12] Shuping Ji, Wei Wang, Chunyang Ye, Jun Wei, and Zhaohui Liu. Constructing a
data accessing layer for in-memory data grid. In Proceedings of the Fourth Asia-
Pacific Symposium on Internetware, Internetware ’12, pages 15:1–15:7, New York,
NY, USA, 2012. ACM.
[KA00] Bettina Kemme and Gustavo Alonso. Don’t be lazy, be consistent: Postgres-r, a new
way to implement database replication. In Proceedings of the 26th International
Conference on Very Large Data Bases, VLDB ’00, pages 134–143, 2000.
[KAKA00] B. Kemme, G. Alonso, Bettina Kemme, and Gustavo Alonso. A new approach to
developing and implementing eager database replication protocols. ACM Transac-
tions on Database Systems, 25:2000, 2000.
[KBB01] B. Kemme, A. Bartoli, and O. Babaoglu. Online reconfiguration in replicated
databases based on group communication. In Dependable Systems and Networks,
2001. DSN 2001. International Conference on, pages 117–126, July 2001.
[KGH05] Christian Kurz, Carlos Guerrero, and Günter Haring. Extending tpc-w to allow
for fine grained workload specification. In Proceedings of the 5th International
Workshop on Software and Performance, WOSP ’05, pages 167–174, New York,
NY, USA, 2005. ACM.
[LD93] Scott T. Leutenegger and Daniel Dias. A modeling study of the tpc-c benchmark. In
Proceedings of the 1993 ACM SIGMOD International Conference on Management
of Data, SIGMOD ’93, pages 22–31, New York, NY, USA, 1993. ACM.
[Lin] Linkedhashmap. http://docs.oracle.com/javase/6/docs/api/
java/util/LinkedHashMap.html?is-external=true. Accessed:
2015-12-4.
[LRC] Last resource commit optimization (lrco). https://access.redhat.com/
site/documentation/en-US/JBoss_Enterprise_Application_
Platform/5/html/Administration_And_Configuration_Guide/
lrco-overview.html. Accessed: 2015-12-4.
[Luc] Apache lucene. https://lucene.apache.org/core/. Accessed: 2015-
12-4.
[Mar01] Morris Marden. An architectural evaluation of java tpc-w. In Proceedings of the
7th International Symposium on High-Performance Computer Architecture, HPCA
’01, pages 229–, Washington, DC, USA, 2001. IEEE Computer Society.
Rohit Madhukar Dhamane Comparison of Architectures and Performance of Database Replication Systems

218 BIBLIOGRAPHY
[Mem] Memcached. http://www.jboss.org/jdf/
quickstarts/jboss-as-quickstart/jdg-quickstarts/
memcached-endpoint/. Accessed: 2015-12-4.
[MERFD+08] F.D. Muñoz-Escoí, M.I. Ruiz-Fuertes, H. Decker, J.E. Armendáriz-Íñigo, and
J.R.González de Mendívil. Extending middleware protocols for database repli-
cation with integrity support. In Robert Meersman and Zahir Tari, editors, On the
Move to Meaningful Internet Systems: OTM 2008, volume 5331 of Lecture Notes
in Computer Science, pages 607–624. Springer Berlin Heidelberg, 2008.
[MFJPPnMK04] Jesús M. Milan-Franco, Ricardo Jiménez-Peris, Marta Patiño Martínez, and Bet-
tina Kemme. Adaptive middleware for data replication. In Proceedings of the
5th ACM/IFIP/USENIX International Conference on Middleware, Middleware ’04,
pages 175–194, New York, NY, USA, 2004. Springer-Verlag New York, Inc.
[MySa] Mysql database. https://www.mysql.com/. Accessed: 2015-12-4.
[MySb] Reference guide mysql cluster database. http://docs.oracle.com/cd/
E17952_01/refman-5.1-en/refman-5.1-en.pdf. Accessed: 2015-
12-09.
[MyS13] Mysql proxy guide. http://downloads.mysql.com/docs/
mysql-proxy-en.pdf, 2013. Accessed: 2015-10-21.
[Nam] Namedcache interface. http://download.oracle.com/otn_hosted_
doc/coherence/330/com/tangosol/net/NamedCache.html. Ac-
cessed: 2015-12-4.
[Neo] Neo4j grap database. http://neo4j.com/. Accessed: 2015-12-4.
[NRP06] Schiper Nicolas, Schmidt Rodrigo, and Fernando Pedone. Brief announcement:
Optimistic algorithms for partial database replication. In Shlomi Dolev, editor,
Distributed Computing. Springer Berlin Heidelberg, 2006.
[OCG] Oracle coherence - best practices. http://coherence.oracle.com/
display/COH35UG/Best+Practices. Accessed: 2015-12-4.
[Ora] Oracle database. https://www.oracle.com/database/index.html.
Accessed: 2015-12-4.
[OSL07] Jeong Seok Oh, Hyun Woong Shin, and Sang Ho Lee. The selection of tunable
dbms resources using the incremental/decremental relationship. In Proceedings
Comparison of Architectures and Performance of Database Replication Systems Rohit Madhukar Dhamane

BIBLIOGRAPHY 219
of the Joint 9th Asia-Pacific Web and 8th International Conference on Web-age
Information Management Conference on Advances in Data and Web Management,
APWeb/WAIM’07, pages 366–373, Berlin, Heidelberg, 2007. Springer-Verlag.
[PAÖ08] Christian Plattner, Gustavo Alonso, and M. Tamer Özsu. Extending dbmss with
satellite databases. VLDB J., 17(4):657–682, 2008.
[PCAO06] Plattner, Christian, Gustavo Alonso, and M. Tamer Özsu. Dbfarm: a scalable clus-
ter for multiple databases. In Proceedings of the ACM/IFIP/USENIX 2006 Interna-
tional Conference on Middleware. Springer-Verlag New York, Inc., 2006.
[PCVO05] Esther Pacitti, Cédric Coulon, Patrick Valduriez, and M. Tamer Özsu. Preventive
replication in a database cluster. Distributed and Parallel Databases, 2005.
[PL08] Philip J. Pratt and Mary Z. Last. A Guide to SQL. Course Technology Press, Boston,
MA, United States, 8th edition, 2008.
[PMJPKA00] Marta Patiño-Martínez, Ricardo Jiménez-Peris, B. Kemme, and G. Alonso. Scal-
able replication in database clusters. In International Conference on Distributed
Computing (DISC). Springer, 2000.
[PmJpKA05] Marta Patiño-martínez, Ricardo Jiménez-peris, Bettina Kemme, and Gustavo
Alonso. Middle-r: Consistent database replication at the middleware level. ACM
Trans. Comput. Syst, 23:2005, 2005.
[Posa] Postgres-r. http://www.postgres-r.org/. Accessed: 2015-12-09.
[Posb] Postgresql database. http://www.postgresql.org/. Accessed: 2015-12-
4.
[PSJP+16] Marta Patiño, Diego Sancho, Ricardo Jiménez-Peris, Iv’an Brondino, Valerio
Vianello, and Rohit Dhamane. Snapshot isolation for neo4j. 2016.
[RBSS02] U. Rohm, K. Bohm, H.J. Schek, and H. Schuldt. (FAS) - A Freshness-Sensitive
Coordination Middleware for a Cluster of OLAP Components. In International
Conference on Very Large Data Bases (VLDB), 2002.
[Rep] What is replication? https://docs.oracle.com/cd/A58617_01/
server.804/a58227/ch_repli.htm. Accessed: 2015-12-4.
[RES] Rest. http://www.jboss.org/jdf/quickstarts/
jboss-as-quickstart/jdg-quickstarts/rest-endpoint/.
Accessed: 2015-12-4.
Rohit Madhukar Dhamane Comparison of Architectures and Performance of Database Replication Systems

220 BIBLIOGRAPHY
[SFW05] Elnikety S., Pedone F., and Zwaenepoel W. Database replication using generalized
snapshot isolation. In Symposium on Reliable Distributed Systems (SRDS). IEEE
Computer Society, 2005.
[Spa] Sparksee. http://sparsity-technologies.com/. Accessed: 2015-12-
4.
[TCM] Tangosol cluster management protocol. http://docs.oracle.com/cd/
E15357_01/coh.360/e15723/cluster_tcmp.htm. Accessed: 2015-
12-4.
[Tit] Titan grap database. http://s3.thinkaurelius.com/docs/titan/1.
0.0/arch-overview.html. Accessed: 2015-12-4.
[TPC] Transaction propcessing performance council. http://www.tpc.org/tpch/
default.asp. Accessed: 2014-10-4.
[TPC03] Tpc benchmark w. http://www.tpc.org/tpcw/spec/tpcwv2.pdf,
2003. Accessed: 2015-10-21.
[TPC10] Tpc benchmark c. http://www.tpc.org/tpcc/spec/tpcc_current.
pdf, 2010. Accessed: 2015-10-21.
[Tra] Database transactions. https://technet.microsoft.com/en-us/
library/aa213068%28v=sql.80%29.aspx. Accessed: 2015-12-4.
[Ult] Ultra monkey. http://www.ultramonkey.org/. Accessed: 2015-10-21.
[WPS+00] M. Wiesmann, F. Pedone, A. Schiper, B. Kemme, and G. Alonso. Database repli-
cation techniques: a three parameter classification. In Reliable Distributed Sys-
tems, 2000. SRDS-2000. Proceedings The 19th IEEE Symposium on, pages 206–
215, 2000.
[YCS] Yahoo! cloud serving benchmark. https://github.com/
brianfrankcooper/YCSB. Accessed: 2015-10-4.
[ZRRS04] Qi Zhang, Alma Riska, Erik Riedel, and Evgenia Smirni. Bottlenecks and their
performance implications in e-commerce systems. In In WCW, pages 273–282,
2004.
Comparison of Architectures and Performance of Database Replication Systems Rohit Madhukar Dhamane