comparison of beach bacterial water quality indicator...
TRANSCRIPT

COMPARISON OF BEACH BACTERIAL WATER QUALITYINDICATOR MEASUREMENT METHODS
RACHEL T. NOBLE1*, STEPHEN B. WEISBERG2, MOLLY K. LEECASTER3
CHARLES D. MCGEE4, KERRY RITTER2, KATHY O. WALKER5, AND PATRICIA M. VAINIK6
1University of North Carolina at Chapel Hill, Institute for Marine Sciences, Morehead City, NC, USA;2Southern California Coastal Water Research Project, Westminster, CA, USA;
3Idaho National Engineering and Environmental Laboratories, Idaho Falls, ID, USA;4Orange County Sanitation District, Fountain Valley, CA, USA; 5Sanitation Districts of Los Angeles County,
Carson, CA, USA; 6City of San Diego Metropolitan Wastewater Department, San Diego, CA, USA;*(author for correspondence, e-mail: [email protected])
Abstract. Three methods (membrane filtration, multiple tube fermentation, and chromogenic sub-strate technology kits manufactured by IDEXX Laboratories, Inc.) are routinely used to measureindicator bacteria for beach water quality. To assess comparability of these methods, quantify within-laboratory variability for each method, and place that variability into context of variability amonglaboratories using the same method, 22 southern California laboratories participated in a series ofintercalibration exercises. Each laboratory processed three to five replicates from thirteen samples,with total coliforms, fecal coliforms or enterococci measured depending on the sample. Results weregenerally comparable among methods, though membrane filtration appeared to underestimate theother two methods for fecal coliforms, possibly due to clumping. Variability was greatest for themultiple tube fermentation method. For all three methods, within laboratory variability was greaterthan among laboratories variability.
Keywords: microbiology, intercalibration, variability, bacterial indicators, beach water quality
1. Introduction
Coastal beaches are the subject of extensive water quality monitoring to detectfecal contamination from human activities, such as wastewater discharge, indus-trial input, and surface runoff. Included in many of these monitoring programs ismeasurement of indicator bacteria, such as total coliforms, fecal coliforms, andenterococci. While indicator bacteria are not necessarily pathogenic, they are foundabundantly in human wastes, where pathogenic organisms may exist. Bacterialindicators are used in preference to direct tests for pathogens because bacteriaindicator measurements are less expensive and correlate with the incidence of ill-ness in swimmers (Cabelli, 1983; Haile et al., 1999).
Indicator bacteria have historically been measured using either membrane fil-tration (MF) or multiple tube fermentation (MTF), though chromogenic substratemethods, such as those manufactured by IDEXX Laboratories, Inc. (IDEXX), haverecently been gaining popularity. The three methods each are based upon measur-ing different products of bacterial growth. MF enumerates bacterial colonies on aspecific growth substrate. MTF measures metabolic activity as determined by fer-mentation and the production of gas. Chromogenic methods measure the ability oforganisms to metabolize a specific labeled substrate, thereby releasing a chro-mogen. These differences in analytical endpoint provide the potential for differingresults among methods.
Environmental Monitoring and Assessment 81: 301–312, 2003.c©2003 Kluwer Academic Publishers. Printed in the Netherlands.

302 NOBLE, WEISBERG, LEECASTER, MCGEE, RITTER, WALKER, AND VAINIK
There have been a number of studies comparing the response of MF and MTF,but only a few studies have compared these methods to IDEXX (Edberg et al.,1990; Stasiak and Cheng, 1991; Green et al., 1997; Eckner, 1998; Francy andDarner 2000). No study has quantified response among all three methods, norplaced differences among methods into context of variability among laboratoriesthat use the same methods. Furthermore, no study has compared measurementprecision among the three methods. IDEXX kits have the advantages of being lessexpensive and faster than the historically used methods, but these advantages areof little value if the results produced by IDEXX are not comparable to that fromthe historic methods.
Here we present a series of intercalibration studies that were conducted among22 southern California laboratories. We use these studies to assess comparabilityof results among the three bacterial indicator measurement methods, quantify withinlaboratory variability for each method and place that variability into context ofvariability among laboratories using the same method.
2. Methods
Thirteen experiments were conducted on five separate occasions (Table 1). Thefirst set of experiments involved quantification of total coliforms in transport me-dia at three bacterial indicator concentrations. The second set of experiments in-volved quantification of fecal coliforms [or Escherichia coli (E. coli), to which theIDEXX method, Colilert®, is specific] in transport media at three bacterial indica-tor concentrations. The third set of experiments involved quantification of entero-cocci in transport media at three bacterial indicator concentrations. The fourth setof experiments involved quantification of total coliforms and fecal coliforms (orE. coli) at a single concentration in seawater and fecal coliforms (or E. coli) intransport medium. The fifth set of experiments involved quantification of fecalcoliforms (or E. coli) from natural seawater spiked with treated wastewater efflu-ent (Table 1).
Ten of the thirteen experiments were performed by seeding 24 hour-old stockcultures of E. coli (ATCC 75922) or Enterococcus faecalis (ATCC 29212) into 10-liter carboys of NYSDH-1 transport medium (Toombs and Conner 1980). Trans-port media was prepared prior to the day of the experiment in two-liter volumesand sterilized. Carboys were sterilized separately. Bacteria were added to the trans-port media and mixed for twenty minutes on a magnetic mixer prior to dispensingthe first sample. Targeted concentrations were 100–1,000 (low), 1,000–10,000 (me-dium) and 10,000–100,000 bacteria/100 mL (high, Table 1). The amount of stockculture necessary to achieve the target concentrations was based on MF analysesfrom the preceding day.
In experiments 5 and 10, stock cultures of E. coli (ATCC 75922) were used toinoculate natural seawater collected from Palos Verdes, California. In experiment

BEACH BACTERIAL WATER QUALITY INDICATOR MEASUREMENT METHODS 303
Table 1. Median bacterial indicator count and standard deviation in each experiment. Numbers withthe same letter code are not significantly different. MF = Membrane Filtration; and MTF = MultipleTube Fermentation.
1 04/21/98 Fecal Coliforms Bacterial Culture Transport Media MF 306b 55a
MTF 967a 431a
IDEXX 996ab 1,131a
2 04/21/98 Fecal Coliforms Bacterial Culture Transport Media MF 340b 115b
MTF 2,610a 1,652a
IDEXX 3,964a 1,626ab
3 04/21/98 Fecal Coliforms Bacterial Culture Transport Media MF 65,400b 9,422a
MTF 173,750a 45,066a
IDEXX 160,000ab 35,777a
4 06/09/98 Fecal Coliforms Bacterial Culture Seawater MF 696b 125a
MTF 1,945a 1,306b
IDEXX 1,601ab 407a
5 06/09/98 Fecal Coliforms Bacterial Culture Transport Media MF 848b 124b
MTF 1,928a 2,454a
IDEXX 1,528ab 379ab
6 06/23/98 Fecal Coliforms Effluent Wastewater Seawater MF 764a 195a
MTF 1,093a 1,389a
7 03/31/98 Total Coliforms Bacterial Culture Transport Media MF 179a 74a
MTF 265a 231a
IDEXX 172a 51a
8 03/31/98 Total Coliforms Bacterial Culture Transport Media MF 1,797a 280a
MTF 2,088a 1,638a
IDEXX 1,613a 318a
9 03/31/98 Total Coliforms Bacterial Culture Transport Media MF 21,920a 3,098a
MTF 19,564a 13,061a
IDEXX 16,680a 6,202a
10 06/09/98 Total Coliforms Bacterial Culture Seawater MF 1,676a 230a
MTF 2,617a 2,325b
IDEXX 1,601a 47a
11 04/28/98 Enterococci Bacterial Culture Transport Media MF 177a 29a
MTF 246a 164a
IDEXX 164a 39a
12 04/28/98 Enterococci Bacterial Culture Transport Media MF 2,600a 773a
MTF 2,540a 1,792a
IDEXX 1,967a 506a
13 04/28/98 Enterococci Bacterial Culture Transport Media MF 28,571a 10,260a
MTF 41,600a 23,249a
IDEXX 18,429a 3,742a
Experiment Median StandardNumber Date Indicator Matrix Method Count Deviation

304 NOBLE, WEISBERG, LEECASTER, MCGEE, RITTER, WALKER, AND VAINIK
6, filtered primary-treated wastewater from the Orange County Sanitation DistrictPlant #1 was added to natural seawater (collected from Newport Beach, California,Table 1). Before inoculating the seawater sample, the primary treated wastewater wasfiltered through Whatman Grade 415 filter paper to remove fine particulates.
On the morning of each experiment, the contents of the carboys were aliquottedinto subsamples, which were packed in ice and distributed to the participatinglaboratories. All laboratories began their analyses at the same time, approximatelyfive hours after the stock sample was prepared. The originating laboratory ana-lyzed the first and last sample dispensed from each carboy by MF and MTF tovalidate homogeneity of samples aliquotted from the carboy.
Each laboratory used its own standard operating procedures. Methods used by par-ticipants included 9221B, C and E, 9222B and D, 9230B and C in Standard Methodsfor the Examination of Water and Wastewater, APHA, AWWA, WEF, 19th edition,1995 and EPA method 1600 (APHA 1995). Colilert® and Enterolert™ (IDEXX Labo-ratories, Inc, Westbrook, ME) were used in both 15-tube MTF format (only onelabortory) and 51 well Quanti-Tray® format. Three to five replicates were performedfor each indicator at each concentration. Several laboratories used more than one ana-lytical method, which resulted in more than 22 sets of results for some experiments.
To test the hypothesis that the median within-laboratory values were the sameamong methods, we performed an ANOVA on ranks, separately for each experi-ment (Conover and Iman, 1981). A Bonferoni adjustment to significance level wasused to account for pair-wise testing of methods. Similar analyses were performedto test for difference in within-laboratory variance among methods.
To assess uncertainty for individual laboratories reporting counts based on asingle sample, 60% and 95% confidence limits were estimated using data from alllaboratories, pooled across experiments. After log transforming the data, leastsquares regression was used to model the within laboratory variances as a functionof within laboratory means. Confidence intervals were then back-transformed tooriginal scale. Separate regressions were performed for each indicator.
3. Results
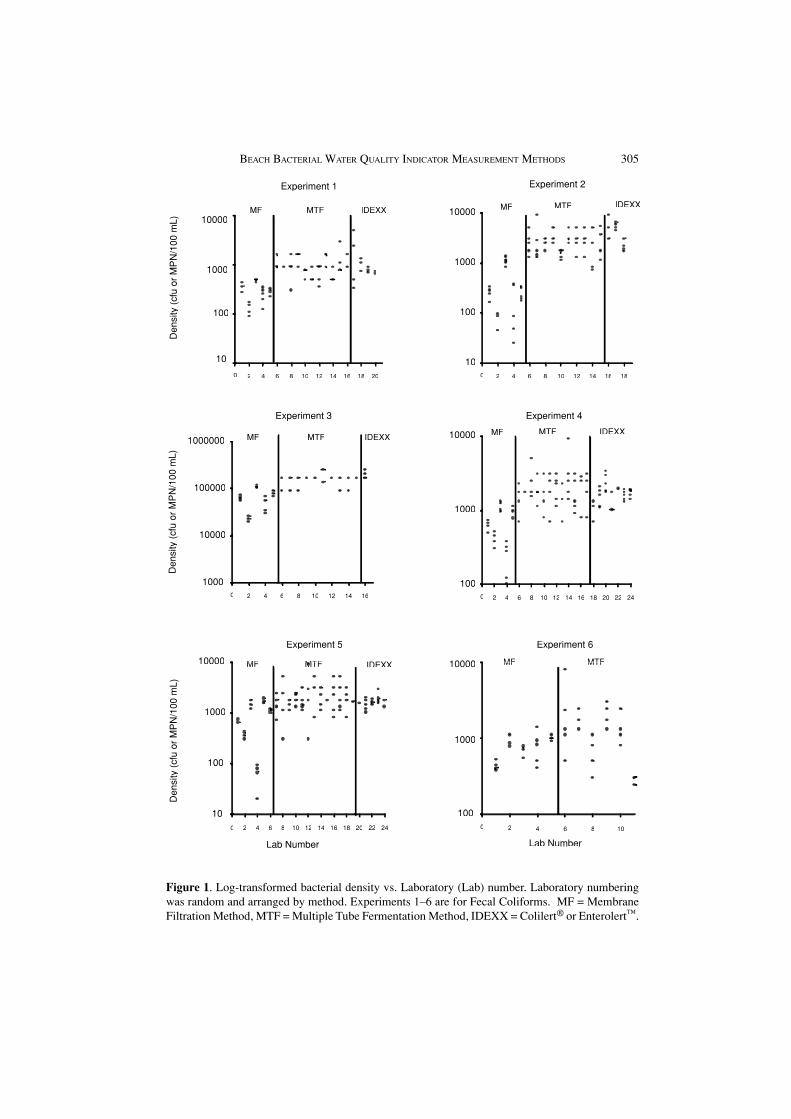
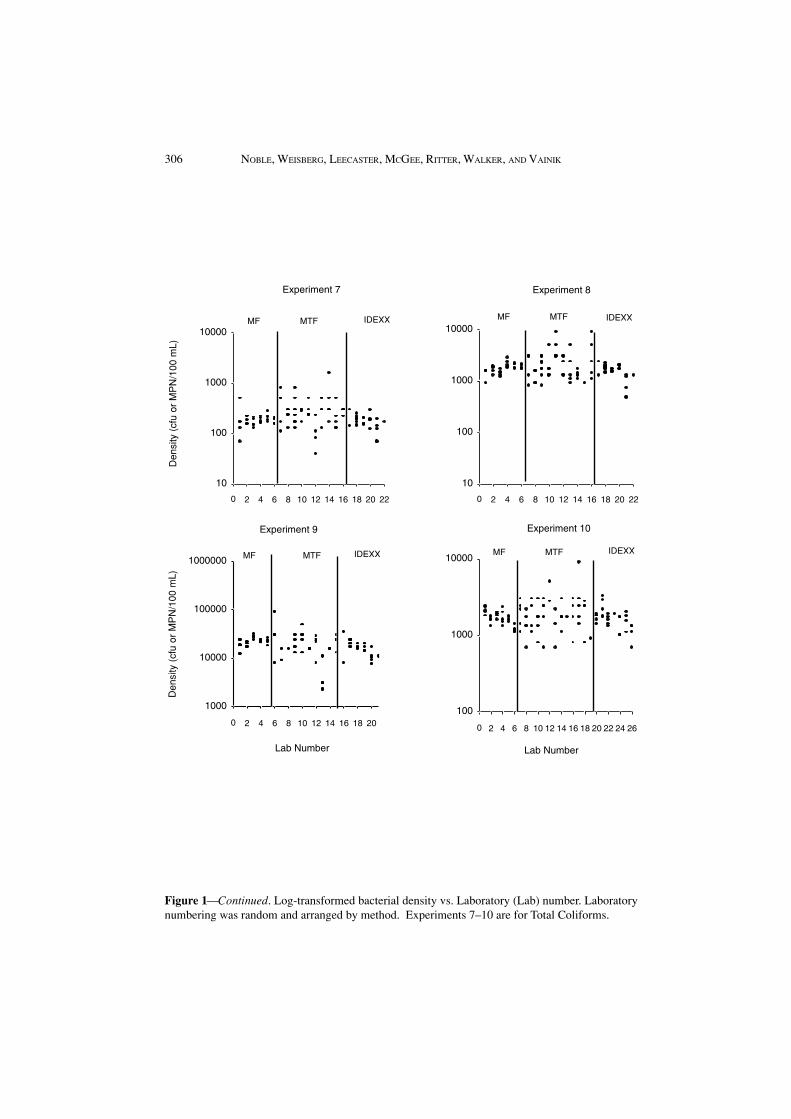
Comparability of bacterial densities measured among methods was indicator spe-cific (Figure 1; Table 1). For enterococci and total coliforms, we saw no signifi-cant differences among methods in any of the individual experiments, though wedid observe that MTF results were higher in five of the seven experiments. We alsoobserved that IDEXX yielded the lowest median count in all three of the experi-ments conducted with enterococci. For fecal coliforms, MF produced the lowestcounts in all six tests, and in several experiments the median count was less than50% of the other methods. MF results were significantly lower than MTF resultsin many of the individual tests, but differed significantly from results from IDEXXonly in experiment 2.
BEACH BACTERIAL WATER QUALITY INDICATOR MEASUREMENT METHODS 305
Figure 1. Log-transformed bacterial density vs. Laboratory (Lab) number. Laboratory numberingwas random and arranged by method. Experiments 1–6 are for Fecal Coliforms. MF = MembraneFiltration Method, MTF = Multiple Tube Fermentation Method, IDEXX = Colilert® or Enterolert™.
02 4 6 8 10 12 14 16 18 20
Den
sity
(cf
u or
MP
N/1
00 m
L)
100
1000
10000
02 4 6 8 10 12 14 16 18
10
100
1000
10000
10000
1000
100
02 4 6 8 10 12 14 16
10000
1000000
100000
1000
Lab Number
02 4 6 8 10 12 14 16 18 20 22 24
100
1000
10000
02 4 6 8 10 12 14 16 18 20 22 24
10000
1000
100
10
Den
sity
(cf
u or
MP
N/1
00 m
L)D
ensi
ty (
cfu
or M
PN
/100
mL)
02 4 6 8 10
Lab Number
MF MTF IDEXX MF MTFIDEXX
MF MTF IDEXXMF MTF IDEXX
MFMFMF MTFMTFMTFMMMIDEXXIDEXIDEX MFMFMF MTFMTFMTF
Experiment 1 Experiment 2
Experiment 3 Experiment 4
Experiment 6Experiment 5
10
306 NOBLE, WEISBERG, LEECASTER, MCGEE, RITTER, WALKER, AND VAINIK
Figure 1—Continued. Log-transformed bacterial density vs. Laboratory (Lab) number. Laboratorynumbering was random and arranged by method. Experiments 7–10 are for Total Coliforms.
Den
sity
(cf
u or
MP
N/1
00 m
L)D
ensi
ty (
cfu
or M
PN
/100
mL)

BEACH BACTERIAL WATER QUALITY INDICATOR MEASUREMENT METHODS 307
Figure 1—Continued. Log-transformed bacterial density vs. Laboratory (Lab) number. Laboratorynumbering was random and arranged by method. Experiments 11–13 are for Enterococci.
02 4 6 8 10 12 14 16
Den
sity
(cf
u or
MP
N/1
00 m
L)
10
100
1000
10000
02 4 6 8 10 12 14
10
100
1000
10000
0 2 4 6 8 10 12 14
1000
10000
100000
1000000
Lab Number
Den
sity
(cf
u or
MP
N/1
00 m
L)
MF MTF IDEXXMF MTFIDEXX
MF MTF IDEXX
Experiment 11 Experiment 12
Experiment 13
308 NOBLE, WEISBERG, LEECASTER, MCGEE, RITTER, WALKER, AND VAINIK
Variability was consistently highest for MTF, and in several cases was almostan order of magnitude higher (Table 1). The variability associated with MF wasgenerally a little lower than that with IDEXX, but not significantly different in anyof the individual experiments. The coefficient of variation appeared to be indepen-dent of which bacterial indicator was measured.
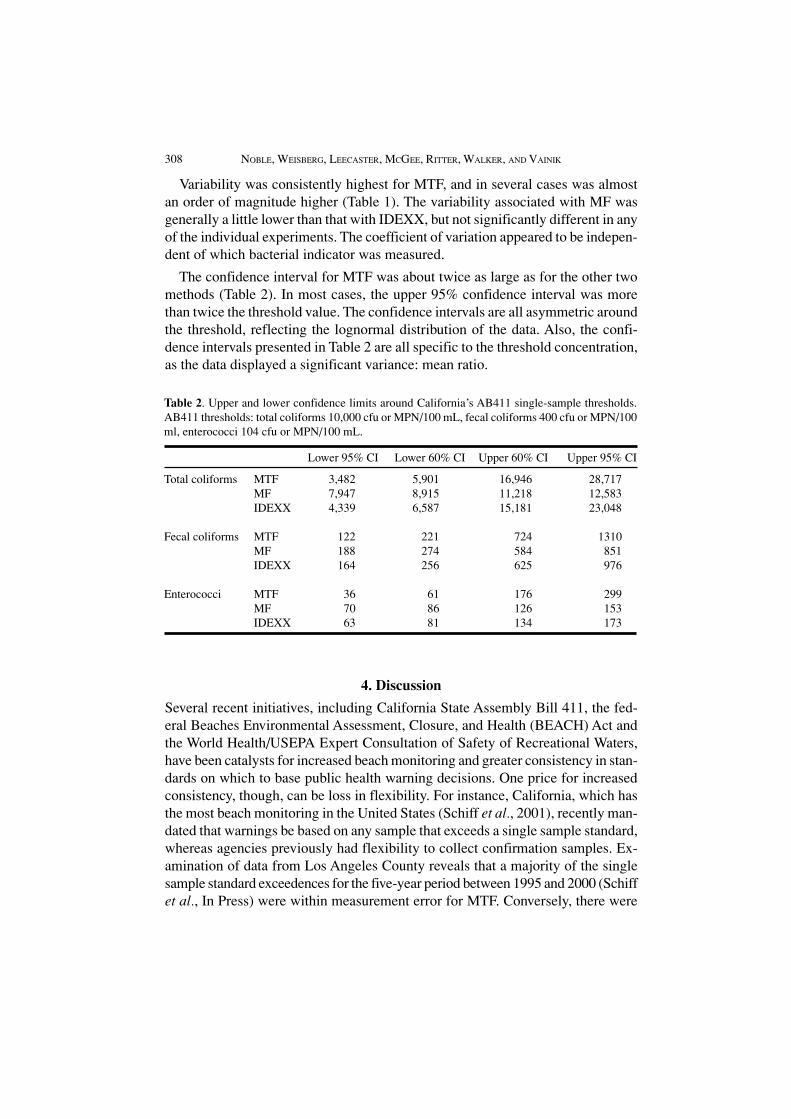
The confidence interval for MTF was about twice as large as for the other twomethods (Table 2). In most cases, the upper 95% confidence interval was morethan twice the threshold value. The confidence intervals are all asymmetric aroundthe threshold, reflecting the lognormal distribution of the data. Also, the confi-dence intervals presented in Table 2 are all specific to the threshold concentration,as the data displayed a significant variance: mean ratio.
4. Discussion
Several recent initiatives, including California State Assembly Bill 411, the fed-eral Beaches Environmental Assessment, Closure, and Health (BEACH) Act andthe World Health/USEPA Expert Consultation of Safety of Recreational Waters,have been catalysts for increased beach monitoring and greater consistency in stan-dards on which to base public health warning decisions. One price for increasedconsistency, though, can be loss in flexibility. For instance, California, which hasthe most beach monitoring in the United States (Schiff et al., 2001), recently man-dated that warnings be based on any sample that exceeds a single sample standard,whereas agencies previously had flexibility to collect confirmation samples. Ex-amination of data from Los Angeles County reveals that a majority of the singlesample standard exceedences for the five-year period between 1995 and 2000 (Schiffet al., In Press) were within measurement error for MTF. Conversely, there were
Table 2. Upper and lower confidence limits around California’s AB411 single-sample thresholds.AB411 thresholds: total coliforms 10,000 cfu or MPN/100 mL, fecal coliforms 400 cfu or MPN/100ml, enterococci 104 cfu or MPN/100 mL.
Lower 95% CI Lower 60% CI Upper 60% CI Upper 95% CI
Total coliforms MTF 3,482 5,901 16,946 28,717MF 7,947 8,915 11,218 12,583IDEXX 4,339 6,587 15,181 23,048
Fecal coliforms MTF 122 221 724 1310MF 188 274 584 851IDEXX 164 256 625 976
Enterococci MTF 36 61 176 299MF 70 86 126 153IDEXX 63 81 134 173
BEACH BACTERIAL WATER QUALITY INDICATOR MEASUREMENT METHODS 309
similar numbers of measurements that were less than the standard, but within thelower confidence bounds. These findings suggest there is a great deal of uncer-tainty associated with warnings based on a single sample standard.
The magnitude of our variability estimates, as well as our finding of highervariability for MTF, is consistent with that of previous studies (Fleisher, 1990).MTF is a most probable number technique, which is a statistical estimate based onthe percentage of test tubes eliciting a positive response to the presence of bacte-ria. As the estimate is based on a binomial distribution, its variance is primarily afunction of the number of tubes used. IDEXX methods are also based on a mostprobable number technique, but they employ a prepackaged 51-well tray that islogistically easier to use than test tubes. As a result of the greater number of wells,this method yielded a variance similar to that of MF.
Although our variability estimates were similar to that of previous studies, ourfinding of lower fecal coliform values using MF differed from previous studieswhich generally have found comparable results for MF and MTF. It also differsfrom our finding of similar results for total coliforms and enterococci using thetwo methods. Several laboratories reported filtration difficulty and colony growththat was extremely patchy, suggesting clumping of the bacteria. This could be anartifact of our using a laboratory strain inoculated into transport media. To investi-gate this possibility, we used a seawater matrix in experiment four and effluent asan inoculant in experiment six. We saw the same pattern of lower MF values inexperiment four, but method differences were not apparent when using effluent asthe inoculant. While use of a laboratory strain might increase the likelihood ofclumping, discussions with our participating laboratories revealed that they looselyfollow the standard method protocol which calls for shaking the sample at least 25times to enhance homogeneity, instead typically shaking the sample only aboutfive times. As a plating method, MF is more susceptible to clumping and our re-sults emphasize the need for strict adherence to quality control guidelines regard-ing shaking and sample dilution.
Many environmental assessments require compilation of data from multiple labo-ratories, either to extend temporal records for trends assessment or to enhance geo-graphic scale to accomplish regional/national assessments. Such data compilationsassume a degree of comparability among laboratories, even though analytical person-nel, methods, and instrumentation may vary. Our study suggests that differences amongmethods are small relative to inherent measurement error, though our results withfecal coliform suggest that this could be of concern if laboratory procedures are notfollowed precisely. We also found that differences among laboratories using the samemethods were generally small and less than the normal variability encountered usinga single method in a single laboratory (Figure 1). Overall, the increase in variabilityamong measurements from pooled data was only about 30% higher than that obtainedusing a single analytical method performed at a single laboratory.
310 NOBLE, WEISBERG, LEECASTER, MCGEE, RITTER, WALKER, AND VAINIK
Our study also included participation by volunteer monitoring organizationswhich are becoming an increasingly large component of beach monitoring in someareas. The volunteer organizations involved in this study produced data compa-rable to that of the certified professional laboratories. While the volunteers in-volved in our study were more experienced than most, having conducted their ownmonitoring activities for many years and having benefited from EPA-sponsoredtraining, our study demonstrates that data from properly trained volunteer organi-zations can be an equal addition to beach quality assessments.
The use of IDEXX kits has become increasingly popular in the past few yearsbecause they are less expensive and require less formal training than historicallyused methods. The use of IDEXX kits requires minimal space and equipment,making them ideal for volunteer organizations or for agencies without microbiol-ogy laboratories. Our study is among the first to compare this method to othersand is the first test to quantify its variability. We found it to be an acceptable, andperhaps preferable, method. The median values were similar to that produced byMTF, without evidence of the clumping that seemed to compromise the MF mea-surements. Moreover, measurement variability was considerably less than MTF,which can be partially attributed to the use of the Quanti-Tray® 51-well formatcompared to the MTF procedure which typically involves a 15-tube format. Mea-surement variability for IDEXX was comparable to that of MF. While these find-ings support the use of IDEXX for marine water quality testing, they are not com-prehensive. The bacteria measured in all but one of our experiments were labora-tory strains, with no background bacteria to compete or interfere with the analy-ses. While we saw little difference in results between our experiments using labo-ratory cultures and wastewater effluent as inoculant, our experiments were alsoconducted on samples that contained low levels of suspended solids, which canpotentially interfere with colony growth. Side-by-side testing of samples from thenatural environment, particularly during high turbidity conditions, is a logical nextstep in evaluating these methods.
Acknowledgements
The authors thank all of the participants in the study who spent laboratory timeand also attended the many meetings in preparation for the exercises; AlgalitaMarine Research Foundation, Aliso Water Management Authority and SoutheastRegional Reclamation Authority, Aquatic Bioassay and Consulting Laboratories,City of Long Beach Department of Health & Human Services, City of Oceanside,City of Oxnard, City of Los Angeles Environmental Monitoring Division, City ofSan Diego, City of Santa Barbara, City of Ventura, Encina Wastewater Authority,Goleta Sanitation District, Instituto de Investigaciones Oceanalogicas (UABC),Los Angeles County Department of Health Services, County Sanitation Districtsof Los Angeles County, Orange County Public Health Laboratory, Orange CountySanitation District, San Diego County Department of Environmental Health, San

BEACH BACTERIAL WATER QUALITY INDICATOR MEASUREMENT METHODS 311
Elijo Joint Powers Authority, Santa Barbara Health Care Services, Southern Cali-fornia Marine Institute, and Surfrider Foundation. We especially thank the CountySanitation Districts of Los Angeles County and the Orange County Sanitation Dis-trict for preparing the samples.
ReferencesAmerican Public Health Association, Standard Methods for the Examination of Water and Wastewater:
1995, 18th ed, Eaton, A.D., Clesceri, L.S., and Greenberg, A.E. (eds.), Washington, D.C.
APHA. See American Public Health Association.
Conover, W.J., and Iman, R.L.: 1981, ‘Rank Transform as a Bridge Between Parametric and Non-parametric Statistics,’ The American Statistician 35, 125.
Cheung, W.H.S., Chang, K.C.K., and Hung, R.P.S.:1991, “Variations in microbial indicator densi-ties in beach waters and health-related assessment of bathing water quality,’ Epidemiol.Infect. 106, 329–344.
Eckner, K.F.: 1998, ‘Comparison of membrane filtration and multiple-tube fermentation by the Colilertand Enterolert methods for detection of waterborne coliform bacteria, Escherichia coli,and enterococci used in drinking and bathing water quality monitoring in southern Swe-den,’ Appl. Environ. Microbiol. 64, 3079–3083.
Edberg, S.C., Allen, M.J. Smith, D.B. and Kriz, N.J.: 1990, ‘Enumeration of total coliforms andEscherichia coli from source water by the defined substrate technology,’ Appl. Environ.Microbiol. B, 366–369.
Fleisher, J.M.: 1990, ‘The effects of measurement error on previously reported mathematical rela-tionships between indicator organism density and swimming-associated illness: a quanti-tative estimate of the resulting bias,’ Internat. J. of Epidemiol. 19, 1100–1106.
Francy, D.S. and Darner, R.A.: 2000, ‘Comparison of methods for determining Escherichia coliconcentrations in recreational waters’ Wat. Res. 24, 2770–2778.
Green, B.L., Clausen, E.M. and Litsky, W.: 1977, ‘Two-temperature membrane filter method forenumerating fecal coliform bacteria from chlorinated effluents’, Appl. Environ. Microbiol.33, 1259–1264.
Haile, R.W., J.S. Witte, M. Gold, R. Cressey, C. McGee, R.C. Millikan, A. Glasser, N. Harawa, C.Ervin, P. Harmon, J. Harper, J. Dermand, J. Alamillo, K. Barrett, M. Nides and Wang, G.:1999, ‘The health effects of swimming in ocean water contaminated by storm drain run-off,’ Epidemiol. 10, 355–363.
Messer, J.W., and Dufour, A.P.: 1998, ‘A rapid, specific membrane filtration procedure for enumera-tion of enterococci in recreational water,’ Appl. Environ. Microbiol. 64, 678–680.
Natural Resources Defense Council.: 1998, ‘Testing the waters, Has your vacation beach cleaned upits act?’ Vol. 8. p. 145. New York, NY.
Schiff, K.C., Weisberg, S.B. and Dorsey, J.H.: 2001, ‘Microbiological monitoring of marine recre-ational waters in southern California,’ Environ. Management. 27:149–157.
Schiff, K.C., Morton, J. and Weisberg, S.B.: In press, ‘Retrospective evaluation of shoreline waterquality along Santa Monica Bay beaches,’ Mar. Env. Res.
Stasiak, M.C., and Cheng, S.H.: 1991, ‘Coliform detection using membrane filtration and Colilert,and E. coli detection using nutrient AGAR Plus MUG and EC Plus MUG,’ pp. 741–748 in:Proceedings of the Water Quality Technology Conference, Orlando. American Water WorksAssociation, Denver, CO.

312 NOBLE, WEISBERG, LEECASTER, MCGEE, RITTER, WALKER, AND VAINIK
Toombs, R.W., and Conner, D.A.: 1980, ‘Proficiency test sample media for single and mixed purecultures of water pollution indicator bacteria,’ Appl. Environ. Microbiol. 40, 883–887.