comparison of capacity levels between locally and ...repository.um.edu.my/27985/1/comparison...
TRANSCRIPT
Standard Journal of Education and Essay Vol 1(1) pp. 1 – 13, January 2013 Available online http://standresjournals.org/journals/SJERE/index.html
Copyright ©2013 Standard Research Journals Accepted 16 January, 2013
Research Article
Comparison of capacity levels between locally and internationally educated faculty members in a public university in Malaysia Muhammad Faizal A. Ghani1*, Mohd Helmee Firdaus Saifudin1, Zuraidah Abdullah1 and Muhammad
Jawad Tajuddin2
1University of Malaya, Kuala Lumpur, Malaysia. 2Indiana University, Bloomington, Indiana, USA.
*Corresponding author. E-mail: [email protected]
Abstract
This research aims to develop a competency model for faculties of higher education institutions in Malaysia. The model involves the listing of the main features and implementation strategy for the development of academic competence. Specifically, this research aims to answer the following questions: a) is there any significant difference between locally and internationally educated faculties in terms of capacities? b) Is there any significant correlation between the following demographics and levels of capacity? i) teaching experience, and ii) academic position; and c) What is the level of capacity effectiveness among faculties? This research applies a quantitative methodology through survey research. The sample includes 120 students in a public university evaluating 10 faculties; 5 locally educated and 5 internationally educated. The instruments involve a modified questionnaire from an original instrument by Tengku Noorainun Tengku Shahdan (2011) The data analysis will use both statistical descriptive analysis – mean and standard deviation – and statistical inference analysis – Spearman’s r correlation and Mann-Whitney U. This research found that there is no significant difference between locally and internationally educated faculties in terms of capacities when p = 0.267 (p > 0.05). For the second research question, this research found that there is no significant correlation between teaching experience with capacity level when p = 0.314. On the other hand, there is a significant correlation between academic position with capacity level when p = 0.032. For the third research question, this research found that both locally and internationally educated faculties have a high level of effectiveness and satisfactory when the overall mean score is more than 3.80. The implication of this research is faculties must pay more attention to developing themselves through scholarly works.
Keywords: Comparison, capacity, locally educated faculty members, internationally educated faculty members, public university.
Stand.J.Edu.Res.Essay 2 Ghani et al INTRODUCTION
After the Industrial Revolution in the 1900‟s, an organization is evaluated based on its performance. One major contributing factor towards high performance is manpower with capacity. This matter is mentioned by Askling (2002) that many studies found that there is a correlation between the effectiveness of an organization with the high capacity of its manpower. Moreover, employers tend to look at the end product rather than at the process that includes capacities (Townsend, 2001).
In Malaysia, research on manpower is still limited. Marzuki (2004) portrayed the statement by arguing that research on manpower is only limited to university students doing their masters and doctorates which only involve a small sample size. The same goes to research on capacities, in which most scholars tend to prefer capacities of private university faculties over public ones (Shahdan, 2011).
Based on the above phenomenon, this research aims to evaluate capacities among public university faculties in enhancing manpower performance. The result of this study will benefit policymakers in setting up professional development programs. Problem statement
In recent years, output is assumed as a better indicator of an organization‟s success rather than the process that was implemented to achieve the success. Mahmod (2008) agrees with the statement by adding that organizations that are task-oriented overlook the process that includes the welfare of their employees. In fact, they put higher priority on achieving the objectives through the output standard that was set up (Abdullah, 2007).
Since the focus was on output rather than on the process, the welfare of faculties are pushed more to the side. The implication of this situation is that the performance of organizations decline. This echoes the statement made by Nordin (2011) in which he argued that government investment in education achieve lower than targeted goals in terms of producing faculties with high capacities. The faculties in turn are demotivated from attending professional development programs (Abdullah, 2007).
Moreover, the phenomenon becomes more serious when universities promote faculty based on capacity levels rather than teaching experience. This situation discourages faculty from excelling (Hussin, 2004) and decreases the performance of universities (Nordin, 2011). To take an example, capacity levels of faculties are low because public universities stress on publications and researches instead of professional development (Siraj, 2003). In other words, universities only look at output of faculties and neglecting their process in performing their tasks.
Based on the above phenomenon, there is a need to do a research that stresses the importance of capacity among faculties in public universities. The results of this research can benefit universities to change their current policy to focus on both task and human-oriented. Theoretical framework Mulder et al. (2009) in their research argued that the concept of competency is always used in education. They said that competency consists of a set of capability integration, knowledge collection, skills, task performance, ability to solve problems, and effective competency to a certain standard (Figure 1). Research purpose This research aims to develop a competency model for faculties of higher education institutions in Malaysia. The model involves the listing of the main features and implementation strategy for the development of academic competence. Research objective This research aims to achieve the following objectives:

3
Figure 1. Relationship between competency and competent with performance. Resource:
Young and Dulewicz (2005). Linking Competency and Competence to Performance.
a) To identify whether there is any significant difference between locally and internationally educated faculties in terms of capacities. b) To identify whether there is any significant correlation between the following demographics and levels of capacity: (i) Teaching experience; (ii) Academic position. c) To identify the level of capacity effectiveness among faculties. LITERATURE REVIEW The field of comparative education on national level, at least in Malaysia, deals primarily with the notion of capacity building. Only by understanding the different types of capacity building available will one be able to go through the different models promoted by different scholars that will ultimately help one to understand the education policies especially in Malaysia. There are several types of capacity building, with each giving a slightly different name in front of the word capacity. Definitions of capacity
The first definition is Innovation Capacity which can be summarized as innovation being flexible new ideas for product or service advance with improved features. Then, the word capacity can refer to the dimensions of innovation on a time line. Thus, innovation capacity refers to “a continuous improvement of the overall capability of firms to generate innovation for developing new products to meet market needs” (Szeto, 2000). What this means is that a few seminars will not be sufficient for one to develop capacity in innovation because there is a need to do follow-up on the beginning step until one is able to reach the next level where the needs of the market, or in the context of this paper, the students.
Along similar lines, Sullivan proposes his idea of Collaborative Capacity which involves „Theories of change‟ where one form of the theory-driven approach is used to evaluate complex public policies. This „theories of change‟ requires education policies to explain the collaborative nature of the „process–outcome‟ interactions within a „whole systems‟ approach to education. The theory focuses attention both on the means available to “realize the partnership activities and the appropriateness of the organizational framework to support collaborative activity” (Sullivan, 2002). By linking both Innovation and Collaborative Capacity, one will find that both suggests changes to occur within the people involved so that they will produce better students that satisfy the needs of each specific audience.
Self-development
• Who are they?
Academic knowledge
• What can they do?
Institutional ethics
• What do they need to do?
Competency
Performance
• What can they achieve?

4
However, one may need to be reminded that the phrase capacity-building may have become so “all-encompassing a
term as to be „useless‟ from an analytical and practical point of view” (Potter, 2004). For this very purpose, this paper tries to be very precise on what capacity-building should mean. This paper agrees with Potter‟s recommendation through his own Systemic Capacity which emphasizes the creation or reinforcing of capacity for program implementation independent of the durability of an institution. Systemic Capacity refers to the creation, expansion or progression of a stock of wanted qualities and features called capabilities that could be frequently drawn upon over time. The focus of capacity building therefore tends to be on refining the stock rather than on handling whatever is available (Potter, 2004).
This definition of capacity building is supported by United Nations which adds that this kind of capacity building needs to be addressed at three inter-related levels: individual, institutional and societal. What it means is that it could also be described as being integrative across levels instead of independent of each other.
Rehman et al. (1988) called capacity building as Competency Validation in his 1988 research. This paper has a questionnaire that used the keyword competency instead of capacity because most Malaysian scholars of capacity building uses the keyword competency to better suit Malaysian customs of understanding capacity as a horizontal measure rather than vertical. Competency (Capacity) Validation is the process of forming the need or lack of need of a specific competency. Validation can be done by those who have appropriate insight to be able to judge the relevance and need of a competency in a professional perspective, at the moment or in the future. According to Rehman et al. (1988), validation can be performed by in-depth content analysis or by a brief investigation conducted by experts. The validation process identifies specific competencies as acceptable norms for future direction.
Now that the definition of capacity-building has been agreed upon for the purpose of this paper, we now turn to look at some aspects of Malaysian education in both lower and higher institution to see the connection between the two in terms of native and foreign languages before going through several different models that has been suggested and will be used in this paper. METHODOLOGY Research design
A research design is a precise planning for data collection and data analysis (Zikmund, 2003). According to Sekaran (2000), research design involves the process of decision and selection based on research objective, research location, unit of analysis, sampling method, data collection and analysis. In short, research method is used to answer the research questions.
This research uses an edited version of an original questionnaire that has been validated and certified. Questionnaire is chosen as the main method because through administration, unbiased student evaluation can be obtained. Further elaboration is available in the Data Collection. Besides that, it is the easiest method to obtain data from a big sample size (Othman, 2002; Barbie, 2000; Gay and Airasian, 2000; Mitchell and Jolley, 2004; Frankel and Wallen, 2006). Research subject
Research subjects are chosen based on the topic and research questions set by the researcher during planning. However, the main component of choosing them adheres to the research ethics that are based on their willingness to participate in this research. Frankel and Wallen (2006), Gay and Airasian (2000) and Patton (2002) all agree with the mentioned component which is their willingness of participate. On top of that, both Patton (2002) and Van Dalen (2001) suggest that researcher also considers the following: (a) research scope, (b) amount of data to be collected and analyzed, (c) interpretation and inference of collected data, and (d) time, expenses and energy used to complete collection and analysis. Therefore, the researcher has decided on the research subjects based upon the following: Location
A specific public university is chosen as the location for this research that is easily accessible through contact persons since the researcher is not in Malaysia at the time of research. This aligns with the opinion of Spradley (1980) and Taylor and Bogdon (2000) which explains that the researcher has his own reason for choosing that particular location.

5
Furthermore, Marshall and Rossman (2001) suggest seven aspects as guide on deciding a location for research sampling; easily accessible, has an environment that is full of process (related with research issue), subject Besides that, the researcher also takes into consideration Snelbecker‟s opinion (1974) in which he stated that the implication of choosing a good location will provide a good model and able to become a reference in the future. Population and sample
Research population consists of students from two classes that are taught by the researcher‟s contact person inside the public university. The two classes are “Early Childhood Leadership and Management” (60 students) and “Societies, Career and Education” (60 students). Students are chosen as research respondents because they are considered as the people who receive direct input by the faculty members. Besides that, students can give an accurate picture of the capacity levels of the faculty members (McNulty et al., 2005).
To decide the number of needed samples, Krejcie and Morgan (1970) and Sekaran (2003) is referred to as guidance. According to Sekaran (2003), a sample size between 30 to 500 people is enough to make an observation. Therefore, 94 students are enough to represent the whole department if not the university. Meanwhile, Haase and Nilson (1998) which is quoted by Baharom (2004), argues that the sample size needs to be more than the minimum to get significant findings. A higher number of students will lead to a more accurate finding. Research instrument
Data regarding research instrument is a very important component in determining a research design for the purpose of collecting data (Cresswell, 1994). A research instrument will be able to help the researcher to collect the data needed in order to answer the proposed research questions. One can build it oneself, use an already existing instrument, or edit and combine the already existing one (Cresswell, 1994).
This research uses a questionnaire that is modified from a questionnaire by Tengku and Tengku (2011) because it is as follows: a) based on Malaysian context; and b) developed by 15 experts in the higher educational field. Questionnaire is used because of its quantitative nature and involves a big sample. The instrument for this questionnaire has two parts. The first part is the demographics of the evaluated faculty members which has four items: gender, years of teaching in university, highest academic achievement, and position within department. The second part has three types of capacity levels: self-development, academic knowledge, and institutional ethics. Student perception of faculty members‟ capacity levels is evaluated using a 5-point Likert scale as follows: (1) Never, (2) Seldom, (3) Sometimes, (4) Often, and (5) Very Often.
Then, the reliability of this instrument is 0.92 according to the Cronbach score while its content validity is evaluated by three experts in this field of organizational management. Specifically, each of the three capacity dimensions is in Table 1.
Table 1. Interpretation of mean score for capacity effectiveness level.
Mean score Effectiveness level Interpretation
1.00 to 2.49 Low Less satisfactory
2.50 to 3.79 Average Average
3.80 to 5.00 High Satisfactory
Resource: Gay, L. (1996). Educational Research: Competencies for Analysis and Application. 5
th Ed. Upper Saddle River, NJ: Prentice Hall.
Data collection procedure
Before field work is done, the researcher gets permission from many parties. At the first level, the researcher asks for permission through email from the dean of the department that supervises the students who are the respondents. After
6
receiving the dean‟s permission, the researcher asks permission from a contact person who is teaching the students in the two classes to distribute the questionnaires during class.
The contact person gives the students 30 min to complete the survey and hand it in. On the first day, students evaluate locally educated faculty members. The 84 students were divided into 5 groups and were assigned 5 different faculty members. On the next day, the same procedure is repeated for internationally educated faculty members. To make assorting easier, the front page of questionnaires for locally educated faculty members are colored blue while for the internationally educated ones are colored green. Data analysis procedure
The data analysis will use both statistical descriptive analysis and statistical inference analysis. According to Fink (1995), to test the data, the type of data needs to be identified first whether it is nominal, ordinal, range or ratio. Accordingly, this research uses ordinal data because of the Likert scale from 1 to 5. Statistical descriptive analysis
Statistical descriptive analysis involves a comprehensive explanation about the different demographics. In this research, demographics include gender, years of teaching in university, highest academic achievement, and position within department. In answering the first research question, mean score analysis is used. To evaluate levels of mean scores, the researcher follows the interpretation as provided by Nunally and Bernstein (1994); 1.00 to 2.00 indicates a very low mean score, 2.00 to 3.00 shows a low mean score, 3.00 to 4.00 illustrates a high mean score, and 4.00 to 5.00 demonstrates a very high mean score. To evaluate the level of effectiveness and its interpretation, this research uses Gay‟s suggestion for determining the level of effectiveness and its interpretation as shown in Table 1. Statistical inference analysis
Statistical inference analysis is used to find any significant correlation between the demographics of the faculty members and the evaluation of their three dimensions of capacity levels (self-development, academic knowledge and institutional ethics). Before testing out the hypothesis, the data needs to be determined whether it has a normal bell curve or not. Tan Soo Yin (1999) quotes Cohen and Cohen (1993) by arguing that if the data is not normal, then a transformation should be done to only use median ranges of 25 to 75%. The researcher discovers that there are no abnormal data being collected. For that reason, two statistical inference analyses are used to answer the remaining research questions: Spearman‟s r and Mann-Whitney U test. Spearman’s r
According to Hair et al. (1998), Spearman‟s r is used to test the difference in mean scores between two ordinal sample groups. Since this research has ordinal groups, Spearman‟s r is best to be used. Mohd Majid (1990) and Tabachnik and Fidell (2001) argue that Spearman‟s r can be used if the variables have two categories. For that reason, this research uses Spearman‟s r to analyze the difference in mean scores of capacity levels between locally and internationally educated faculty members. To evaluate the power of correlation, this research uses Gay‟s suggestion for determining the power as shown in Table 2. Mann-Whitney U
Mann-Whitney U is a non-parametric test to analyze the difference between two groups that use ordinal scales. This test is used in this research to determine the correlation between capacity levels of locally and internationally educated faculty members. According to Chua (2008), a normal t-Test is not suitable to be used in this type of research because it does not use a mean score with a range or ratio score.
7
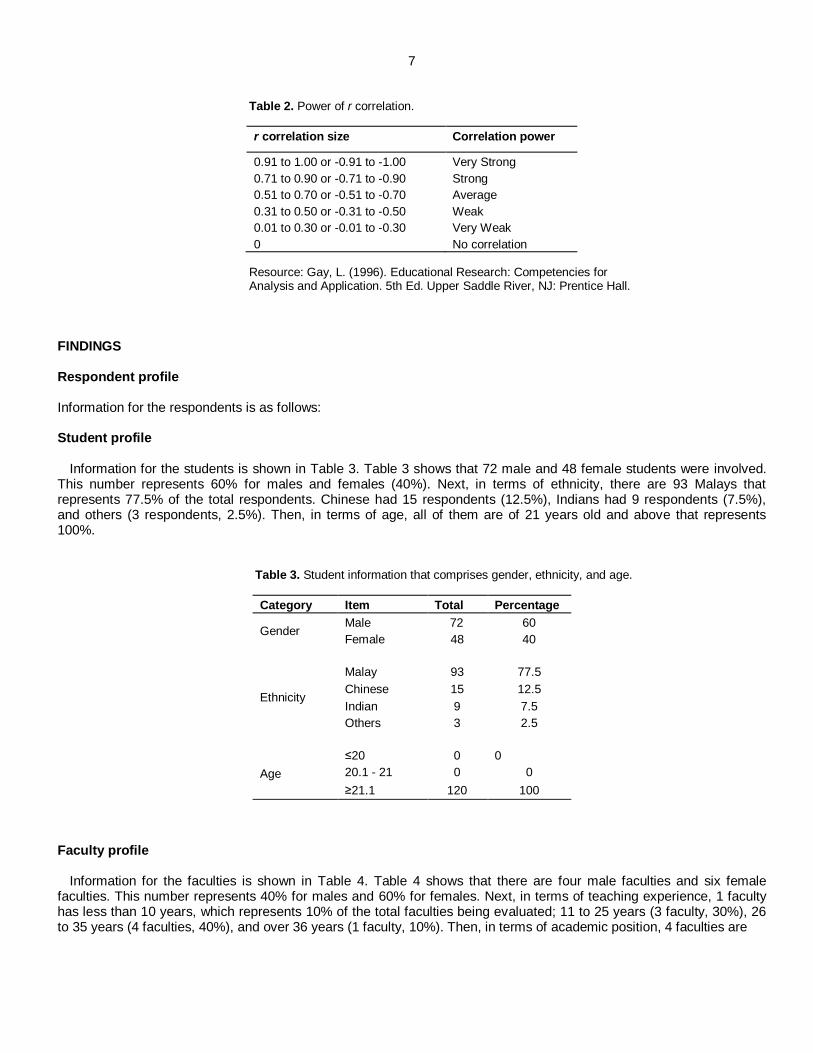
Table 2. Power of r correlation.
r correlation size Correlation power
0.91 to 1.00 or -0.91 to -1.00 Very Strong
0.71 to 0.90 or -0.71 to -0.90 Strong
0.51 to 0.70 or -0.51 to -0.70 Average
0.31 to 0.50 or -0.31 to -0.50 Weak
0.01 to 0.30 or -0.01 to -0.30 Very Weak
0 No correlation
Resource: Gay, L. (1996). Educational Research: Competencies for Analysis and Application. 5th Ed. Upper Saddle River, NJ: Prentice Hall.
FINDINGS Respondent profile Information for the respondents is as follows: Student profile
Information for the students is shown in Table 3. Table 3 shows that 72 male and 48 female students were involved. This number represents 60% for males and females (40%). Next, in terms of ethnicity, there are 93 Malays that represents 77.5% of the total respondents. Chinese had 15 respondents (12.5%), Indians had 9 respondents (7.5%), and others (3 respondents, 2.5%). Then, in terms of age, all of them are of 21 years old and above that represents 100%.
Table 3. Student information that comprises gender, ethnicity, and age.
Category Item Total Percentage
Gender Male 72 60
Female 48 40
Ethnicity
Malay 93 77.5
Chinese 15 12.5
Indian 9 7.5
Others 3 2.5
Age
≤20 0 0
20.1 - 21 0 0
≥21.1 120 100
Faculty profile
Information for the faculties is shown in Table 4. Table 4 shows that there are four male faculties and six female faculties. This number represents 40% for males and 60% for females. Next, in terms of teaching experience, 1 faculty has less than 10 years, which represents 10% of the total faculties being evaluated; 11 to 25 years (3 faculty, 30%), 26 to 35 years (4 faculties, 40%), and over 36 years (1 faculty, 10%). Then, in terms of academic position, 4 faculties are

8
Table 4. Faculty information that comprises gender, teaching experience, and academic position.
Category Item Total Percentage
Gender Male 4 40
Female 6 60
Teaching experience
<10 years 1 10
11-25 years 3 30
26-35 years 4 40
>36 years 2 20
Academic position
Professor 4 40
Associate professor 2 20
Senior lecturer 2 20
Lecturer 1 10
Tutor 1 10
professors which represent 40% of the total. Associate professors (2 faculties, 20%), senior lecturers (2 faculties, 20%), lecturer (1 faculty, 10%), and tutor (1 faculty, 10%). Difference of capacity between locally and internationally educated faculties
This part is to answer the first research question. To answer the question, data was collected among 120 students to evaluate 4 male faculties (2 local and 2 international) and six female faculties (3 local and 3 international). The data was analyzed using Mann-Whitney U at a confidence interval of 0.05 or 5%. Overall findings are shown in Table 5.
Table 5. Overall findings for locally and internationally educated faculties.
Overall Category Ranking mean z value Sig.
Competency Local 41.26
-1.459 p = 0.267 International 45.46
Note: * = significant at confidence interval p < 0.05 two tails Table 5 shows that there is no significant difference between locally and internationally educated faculties in terms of
capacities when p = 0.267 (p > 0.05). However, capacity levels of internationally educated faculty are higher than that of locally educated when mean score for international is 45.46 and local is 41.26. Detailed findings of the difference between locally and internationally educated faculties in terms of capacities are shown in Table 6.
Table 6 shows each dimension of the competencies. For the first element of self-development competency, self-control, there is no significant difference between locally and internationally educated faculties when p = 0.110 (p > 0.05). However, capacity levels of internationally educated faculty are higher than that of locally educated when mean score for local is 41.26 and international is 49.93. For the second element of self-development competency, internal emotion, there is no significant difference between locally and internationally educated faculties when p = 0.231 (p > 0.05). However, capacity levels of internationally educated faculty are higher than that of locally educated when mean score for local is 41.80 and international is 49.37. For the third element of self-development competency, psychological influence, there is no significant difference between locally and internationally educated faculties when p = 0.278 (p > 0.05). However, capacity levels of internationally educated faculty are higher than that of locally educated when mean score for local is 42.35 and international is 50.62.
For the first element of academic competency, skill, there is a significant difference between locally and internationally educated faculties when p = 0.049 (p < 0.05). However, capacity levels of internationally educated faculty are higher

9
Table 6. Detailed findings for locally and internationally educated faculties.
Dimension and element Category Mean z value Sig.
Self-development competency
Self-control Local 41.26
-1.639 p = 0.110 International 49.93
Internal emotion Local 41.80
-1.819 p = 0.231 International 49.37
Psychological influence Local 42.35
-1.427 p = 0.278 International 48.89
Academic competency
Skill Local 40.60
-2.638 *p = 0.049 International 50.62
Knowledge Local 42.22
-1.831 p = 0.232 International 48.94
Understanding Local 43.89
-0.854 p = 0.523 International 47.18
English Competency Local 33.99
-4.367 *p = 0.000 International 57.54
Institutional competency
Vision Local 43.60
-0.699 p = 0.485 International 47.38
Institutional culture Local 42.04
-1.165 p = 0.291 International 49.11
Coordination Local 43.44
-1.176 p = 0.502 International 47.65
Note: * = significant at confidence interval p < 0.05 two tails.
than that of locally educated when mean score for local is 40.60 and international is 49.93. For the second element of academic competency, knowledge, there is no significant difference between locally and internationally educated faculties when p = 0.232 (p > 0.05). However, capacity levels of internationally educated faculty are higher than that of locally educated when mean score for local is 42.22 and international is 48.94. For the third element of academic competency, understanding, there is no significant difference between locally and internationally educated faculties when p = 0.523 (p > 0.05). However, capacity levels of internationally educated faculty are higher than that of locally educated when mean score for local is 43.89 and international is 47.18. For the fourth element of academic competency, English, there is a significant difference between locally and internationally educated faculties when p = 0.000 (p < 0.05). However, capacity levels of internationally educated faculty are higher than that of locally educated when mean score for local is 33.99 and international is 57.94.
For the first element of workplace competency, vision, there is no significant difference between locally and internationally educated faculties when p = 0.485 (p > 0.05). However, capacity levels of internationally educated faculty are higher than that of locally educated when mean score for local is 43.60 and international is 47.38. For the second element of academic competency, institutional culture, there is no significant difference between locally and internationally educated faculties when p = 0.291 (p > 0.05). However, capacity levels of internationally educated faculty

10
are higher than that of locally educated when mean score for local is 42.94 and international is 49.11. For the third element of academic competency, coordination, there is no significant difference between locally and internationally educated faculties when p = 0.502 (p > 0.05). However, capacity levels of internationally educated faculty are higher than that of locally educated when mean score for local is 43.44 and international is 47.65.
To conclude the above findings, the majority of elements from the three dimensions have no significant difference between locally and internationally educated faculties when p > 0.05. There are self-control (p = 0.110), internal emotion (p = 0.231), psychological influence (p = 0.278), knowledge (p = 0.232), understanding (p = 0.523), vision (p = 0.485), institutional culture (p = 0.291), and coordination (p = 0.502). Meanwhile, there are two elements that have a significant difference between locally and internationally educated faculties when p < 0.05. There are skill (p = 0.049) and English competency (p = 0.000). Correlation between teaching experience and academic position with capacity levels
This part is to answer the second research question. To answer the question, data was collected among 120 students to evaluate 4 male faculties (2 local and 2 international) and six female faculties (3 local and 3 international). The data was analyzed using statistical inferential analysis Spearman‟s r correlation at a confidence interval of 0.05 or 5%. The research findings are explained with regards to the related demographics as follows and are shown in Table 7.
Table 7. Correlation between teaching experience and academic position with capacity level.
Item Capacity
r correlation size Sig. Power
Teaching experience r = 0.101 p = 0.314 Very Weak
Academic position r = -0.160 *p = 0.032 Very Weak
Note: * = significant at confidence interval p < 0.05 two tails.
Table 7 explains as follows:
a) Teaching experience: There is no significant correlation between teaching experience with capacity level when p = 0.314 (p > 0.05). However, its power is very weak. b) Academic position: There is a significant correlation between academic position with capacity level when p = 0.032 (p < 0.05). However, its power is very weak. In conclusion, there is no significant correlation between teaching experience with capacity level when p = 0.314. On the other hand, there is a significant correlation between academic position with capacity level when p = 0.032. Level of capacity effectiveness among faculties
This part is to answer the third research question. To answer the question, data was collected among 120 students to evaluate 4 male faculties (2 local and 2 international) and six female faculties (3 local and 3 international). The data was analyzed using statistical descriptive analysis which is mean and standard deviation. Overall findings for the level of effectiveness and its interpretation are presented with regards to the faculties‟ educational background as follows: Locally educated faculties: Overall findings for the level of effectiveness and its interpretation are shown in Table 8. Table 8 shows that all of the capacity dimensions have a high level of effectiveness and satisfactory when the overall mean score is 4.13 and its standard deviation is 0.68. Based on each dimension, personal competency dimension has a high level of effectiveness and satisfactory when the overall mean score is 4.21 and its standard deviation is 0.67. Next, academic competency dimension has a high level of effectiveness and satisfactory when the overall mean score is 3.96 and its standard deviation is 0.71. Likewise, workplace competency dimension has a high level of effectiveness and satisfactory when the overall mean score is 4.21 and its standard deviation is 0.66.

11
Internationally educated faculties: Overall findings for the level of effectiveness and its interpretation are shown in Table 9. Table 9 shows that all of the capacity dimensions have a high level of effectiveness and satisfactory when the overall mean score is 4.37 and its standard deviation is 0.65. Based on each dimension, personal competency
Table 8. Interpretation of mean score for capacity effectiveness level for locally educated faculty.
Competency Mean Standard deviation Level Interpretation
Personal 4.21 0.67 High Satisfactory
Academic 3.96 0.71 High Satisfactory
Workplace 4.21 0.66 High Satisfactory
Total 4.13 0.68 High Satisfactory
dimension has a high level of effectiveness and satisfactory when the overall mean score is 4.42 and its standard deviation is 0.63. Next, academic competency dimension has a high level of effectiveness and satisfactory when the
Table 9. Interpretation of mean score for capacity effectiveness level for internationally educated faculty.
Competency Mean Standard deviation Level Interpretation
Personal 4.42 0.63 High Satisfactory
Academic 4.34 0.67 High Satisfactory
Workplace 4.34 0.64 High Satisfactory
Total 4.37 0.65 High Satisfactory
overall mean score is 4.34 and its standard deviation is 0.67. Likewise, workplace competency dimension has a high level of effectiveness and satisfactory when the overall mean score is 4.34 and its standard deviation is 0.65. To recap, both locally and internationally educated faculties have a high level of effectiveness and are satisfactory when the overall mean score is more than 3.80. DISCUSSION
National revenue emanates from income taxes which consist of individual and company taxes. If a company has higher revenue, it can make a larger contribution through tax charges. However, higher revenue can only be achieved when its manpower has high level of capacity effectiveness (OECD 2000). This statement agrees with the models created by Mulder et al. (2009) and Olawale (2010). Their models stress the importance of capacity in order to create a good product.
This research found that there is no significant difference between locally and internationally educated faculties in terms of capacities. This finding has its connection with the recruitment policy being adopted by most public universities in Malaysia. The policy requires applicants who wish to become a faculty in universities to have a high academic performance in both undergraduate and graduate level. Sullivan et al. (2002) portrayed the statement through faculty recruitment policy as not just looking at academic performance; it also takes into consideration personal criteria and previous working experience. The implication of this policy is that an organization‟s productivity increases with employees‟ higher capacity level (Horowitz, 1989).
From the discussion of recruitment policies as above, university is successful in earning high performance faculties. Therefore, the process of promotion for faculties is also based on their capacity levels (Szeto, 2000). By comparing some of the demographics, this research found that teaching experience has no significant correlation with capacity levels while academic position has. This finding contradicts with Abdullah‟s opinion (2007) which states that teaching experience has a correlation with capacity levels in educational institutions. This contradiction meets with Baharom (2004) which argues that capacity level increases with teaching experience because of facing different challenges throughout those years. However, this research is based on student perspectives towards their faculties compared to Abdullah (2007) and Baharom‟s (2004) opinion which are from the perspectives of the faculties.

12
Despite the significantly different demographics between faculties, this research found that both locally and internationally educated faculties have high level of capacity effectiveness which is satisfactory. A sound reason for this situation is that high performance faculties are attracted to incentives made by universities in terms of academic position and financial support. This statement is supported by data from Ministry of Education in 2007 that reports at least 11 school teachers transferring into universities after earning their doctorates throughout Malaysia (MOE, 2007). The implication of this situation is that schools lose their best teachers by mobilizing into universities with attractive incentives (Mahmod, 2008).
To sum up, this research found that capacity levels of faculties are important to increase the performance of organizations. Therefore, to ensure that capacity levels are of high priority for the faculties, universities make it as an indicator for promotions such as academic positions. CONCLUSION
To recap, the objectives of this research were to find any significant differences between capacity levels of locally and internationally educated faculties, to find any significant correlation between capacity levels with both teaching experience and academic position, and find the level of capacity effectiveness among faculties. It turns out that there is no significant difference between locally and internationally educated faculties. Although there is no significant correlation between capacity levels and teaching experience, there is a significant correlation between capacity levels and academic position. Both locally and internationally educated faculties have high and satisfactory level of capacity effectiveness. REFERENCES Abdullah, Abdul Shukor. (2007). “Creating Effective Schools: School-Based Management, Teacher Empowerment and Leadership Training as
Strategies and Policy Initiatives”. Journal of Principalship Institute, 04, 9-21. Askling, B. (2002). Higher education and academic staff in a period of policy and system change. Higher Education, 41, 157-181. Baharom, Mohamad. (2004). Teachers' Perception of Instructional Leadership in Computer Literacy in Schools in Johor State. Doctoral PhD Thesis.
Universiti Kebangsaan Malaysia. Not published. Barbie, E. (2000). Survey Research Methods. California: Wordsworth. Chua Y. P. (2008). Basic Research Statistics: Ordinal Scale and Nominal ScaleData Analysis. Kuala Lumpur: McGraw-Hill (Malaysia) Pte. Ltd.
Cresswell, J. W. (1994). Research Design: Qualitative & Quantitative Approaches. Thousand Oaks: Sage Publications. Fink, A. (1995). The Survey Handbook. Volume 1. Thousand Oaks, CA: Sage. Frankel, J., & Wallen, T. (2006). Cross-cultural on Organizational Commitment: A Further Review and Application of Hofstede’s Value Survey Module .
Journal of International Business and Entrepreneurship. 10.1 pp: 1-26. Gay, L. R., & Airasian, P. (2000). Educational research: Competencies for analysis and application (6th edition). New Jersey: Merrill. Hair, J., Anderson, R., Tatham, R., & Black, W. (1998). Multivariate Data Analysis. 5
th Ed. New Jersey: Prentice Hall.
Horowitz, Donal L. (1989) Cause and Consequence in Public Policy Theory: Ethnic Policy and System Transformation in Malaysia. Policy
Sciences 22.3/4 pp: 249-87. Hussin, Sufean (2004). Educational Development policy in Malaysia: Theory and Analysis. 2
nd edition.Kuala Lumpur: Dewan Bahasa dan Pustaka.
Krejcie, R., & Morgan, D. (1970). Determining Sample Size for Research Activities. Educational and Psychology Measurement. 30.3 pp: 607-610. Mahmod, Hussein (2008). LeadershipandSchoolEffectiveness. Kuala Lumpur: Dewan Bahasa dan Pustaka. Marshall, C., & Rossman, G. B. (2001). Designing qualitative research (2
nd ed.). London: Sage.
Marzuki, Shahril (2004). Creation of a theoretical framework for brilliant schools.Educational Problems, 27, 23-39. McNulty, B., Waters, T., & Marzano, R. (2005). School Leadership that Works: From Research to Results. Virginia: Association for Supervision and
Curriculum Development. Ministry of Higher Education (2007). Highereducationstrategic plan. Ministry of Higher Education. Mitchell, M., & Jolley, J. (2004). Research Design Explained. 5
th Ed. New York: Thompson Learning.
Mohd Majid, Konting. (1990). Education Research Methodology. Kuala Lumpur. Dewan Bahasa dan Pustaka.
Mulder, M., Gulikers, J., Biemans, H., & Wesselink, R. (2009). The new competence concept in higher education: error or enrichment? Journal of European Industrial Training. 33.8/9. 775-770.
Nordin, Mohamed Khaled. (2012, March 20). Towards transformation. The talk was presented in the Auditorium of Higher Education, Kuala Lumpur,
Malaysia. Olawale, Sunday G., Emmanuel O. Adeniyi, and OpeOluwa I. Olubela. (2010). Creativity Fostering Behaviour as an Index of Productivity and Capacity
Building among Lecturers in Selected Universities in Ogun and Oyo States.Educational Research and Review 5.5 pp: 257-62.
Organisation for Economic Co-Operation and Development (2000). Literacy in theInformation Age. Paris: OECD Publications. Othman, Norasmah. (2002). Evaluation of Youth Entrepreneurship Program in Secondary Schools. Doctoral PhD Thesis. Universiti Putra Malaysia.
Not published. Patton, M. Q. (2002). Qualitative research and evaluation methods.London: Sage Publications. Potter, Christopher, and Richard Brough. (2004) Systemic Capacity Building: A Hierarchy of Needs.Health Policy and Planning, Oxford University
Press 19.5 pp: 336-45. Rehman, Sajjad Ur, Shaheen Majid, and Ahmad Bakeri Abu Baker. (1988) Competency Definition and Validation for Library and Information
Professionals in Malaysia. Journal of Education for Library and Information Science 39.2 pp: 100-17. Sekaran, U. (2000). Research Methods for Business. 3
rd Ed. New York: John Wiley and Sons.

13
Sekaran, U. (2003). Research Methods for Business:A Skill Buildings Approach. 4
th Ed. New York: John & Wiley.
Siraj, Saedah&Siraj, Fadzilah (2003). Documentation of Hidden Curriculum in Higher Education. Journal of Educational Issue, 26,Faculty of Education,
University of Malaya, 3-13. Snelbecker, D. (1974). Learning theory, instructional theory and psycho-educational design. New York: Nichols Spradley, J. S. (1980). Participant observation.New York: Holt, Rineland & Winston. Sullivan, Helen, Marian Barnes, and Elizabeth Matka. (2002) Building Collaborative Capacity through 'Theories of Change' : Early Lessons from the
Evaluation of Health Action Zones in England.Evaluation 8.2 pp: 205-26. Szeto, Elson. (2000) Innovation Capacity: Working Towards A Mechanism For Improving Innovation Within An Inter-Organizational Network. TQM
Magazine, 12.2 pp: 149-158. Tan Soo Yin. (1999). Relationship of School Counselors’ Perceptions of Superv ision Needs with Job Performance and Job Involvement. Doctoral PhD
Thesis. Universiti Putra Malaysia. Not published. Taylors, S. J., & Bogdan, R. (2000). Introduction to qualitative research method (4th edition). New York: Wiley.
Tengku Shahdan, Tengku Noorainun (2011). Developing best practices for capacity leadership of private instituation, PhD Proposal, University of Malaya.
Townsend, T. (2001). Satan or Savior? Reflection and future of school effectiveness and school improvement research.Research presented in the
International Congress for school effectiveness and school improvement, Monash University, Australia. Van Dalen, D. (2001). Understanding educational research: An introduction (7
th edition).New York: McGraw-Hill Book Company.
Young, M., & Dulewicz, V. (2005). A model of command, leadership and management competency in the British Royal Navy. Leadership organization
Development Journal. Vol. 26 No. 3 pp. 228-241. Zikmund, W. (2003). Business Research Method. 7
th Ed. Ohio: Thompson Learning.