comparison of cycling hospitalization rates in ... - carsp.ca · causal pathway? •drivers more...
TRANSCRIPT

Kay Teschke, Mieke Koehoorn, Hui Shen, Jessica DennisSchool of Population & Public Health
& Department of Medical Genetics
University of British Columbia
Comparison of cycling
hospitalization rates
in Canadian provinces
with different
helmet laws &
bike commuting
Photo: Ken Ohrn

Photo Flickr: Café Mama
North America3-6 deaths/100 million km
• helmets & laws common
• bike traffic separation rare
• mode share low
Holland, Denmark1-2 deaths/100 million km
• bike traffic separation common
• mode share high
• helmets rare
Photos: Flickr, WD Vanlue; The Alternative Department for Transport
Source: Buehler & Pucher, TR News 2012: Teschke et al. CJPH 2013

Comparisons within Canada
transport systems & laws consistent

Photo: Ken Ohrn
HospitalizationsCanadian Institute for Health Information
Cycling trips Canadian Community Health Survey
Hospitalization
Rates=
2006 to 2011
3690 hospitalizations/year
593 million trips/year
633 hospitalizations/100 million trips

0
200
400
600
800
1000
1200
1400
0 0.5 1 1.5 2
All injury hospitalizations per 100 million trips
Mode Share: % of commute trips by bike
Each province … 4 hospitalization ratesadult male, adult female, youth male, youth female

Hospitalization rates vary.
A lot.
Why?

0
200
400
600
800
1000
1200
1400
0 0.5 1 1.5 2
All injury hospitalizations per 100 million trips
Mode Share: % of commute trips by bike
Does sex make a difference?
Female vs. MaleOR = 0.45 95% CI: 0.37, 0.53

Photo: Ken Ohrn
Photo: Ken OhrnPhoto: Ken Ohrn
Females much
lower injury rate
than males
Less risk-taking• ride more slowly
• less likely to ride on major
streets without bike
infrastructure
Photo: Ken Ohrn

No helmet law
Child only law
All ages law
2006 – 2011
study period:
no change in
helmet laws
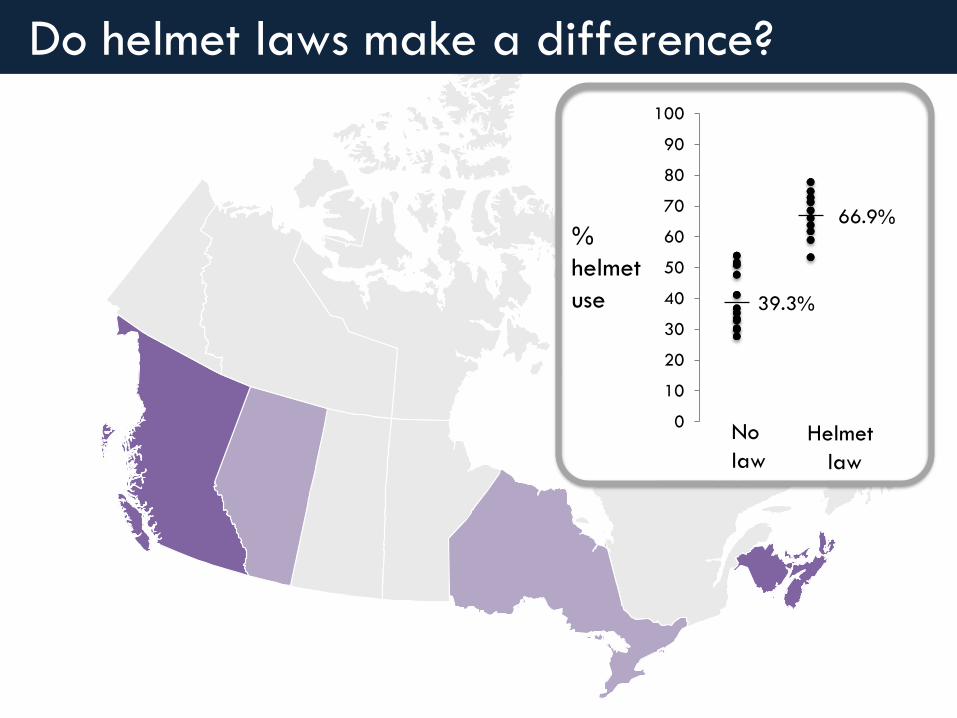
Do helmet laws make a difference?
No helmet law
Child only law
All ages law
2006 – 2011
study period:
no change in
helmet laws
Do helmet laws make a difference?
%
helmet
use
0
10
20
30
40
50
60
70
80
90
100
No
law
Helmet
law
66.9%
39.3%

0
100
200
300
400
500
0 0.5 1 1.5 2
Mode Share: % of commute trips by bike
Brain, head,
scalp, skull, face
injury
hospitalizations
per 100 million
trips
Do helmet laws make a difference?
Helmet law vs. no law OR = 1.16 95% CI: 0.82, 1.65

Photo: Ken Ohrn
Helmet laws not
associated with
hospitalization rates
Potential explanations• other factors more important
• helmet wearers ride faster
• drivers pass closer to helmet
wearers
• helmets give permission for
more dangerous types of
riding (e.g., mountain biking)
Photo: Ken Ohrn

≥ 2
1.5 - 2
1 - 1.5
0.5 – 1
< 0.5
% of commute
trips by bike
(mode share)
Does "mode share" make a difference?

0
1000
2000
3000
4000
5000
0 0.5 1 1.5 2
Traffic injuryhospitalizations per 100 million trips to work or school
bike mode share (%)
Does "mode share" make a difference?
Rate per 1% increase in mode share
OR = 0.69 95% CI: 0.49, 0.97

Safety in numbers
Consistent pattern
Causal pathway? • drivers more alert to
cyclists
•more drivers are cyclists
• safer infrastructure
attracts more cycling
Photo: Dandyhorse

Policy implications

To reduce cycling injury
rates, focus on factors
related to increased
cycling & female
cycling choices.
Cycling routes
physically separated
from traffic or along
quiet streets fit both
these criteria & are
associated with lower
injury risk.
Photo: Google Streetview

Photo: Ken Ohrn
BMJ Open 2015
Cycling in Cities, UBC
@kteschke
Research on Canadian
hospitalization patterns
& infrastructure safety
support Dutch, Danish
policy choices


Adjusted odds ratios, helmet law vs. no law
Do helmet laws make a difference?

Cycling
Other, no helmet
Head, helmet
Head, no helmet
Most Studies: given injury, odds of head
injury vs. other injury, with & without
helmet use / law
No injury
Rare Evidence: given cycling, incidence of head injury, with & without helmet use / law
No helmet
Helmet
Other injury is surrogate for cycling exposure
Injury
Other, helmet

25%
40%
5%
24%
32%
Photo: Ken Ohrn
87% of
hospitalizations
involve body sites
other than head
…………………..
1 hospitalization
per 160,000 trips
1 head injury
hospitalization per
650,000 trips
What about injuries that aren’t mitigated by helmets?

Deaths / 100 million km travelled
5.5
1.11.5
United States Denmark The NetherlandsSource: Buehler & Pucher, TR News 2012