comparison of different loop bioreactors based on
TRANSCRIPT

Iran. J. Chem. Chem. Eng. Vol. 29, No. 4, 2010
37
Comparison of Different Loop Bioreactors
Based on Hydrodynamic Characteristics,
Mass Transfer, Energy Consumption
and Biomass Production from Natural Gas
Yazdian, Fatemeh; Shojaosadati, Seyed Abbas*+; Nosrati, Mohsen;
Vasheghani-Farahani, Ebrahim
Department of Biotechnology, Faculty of Chemical Engineering, Tarbiat Modares University
P.O. Box 14115-143 Tehran, I.R. IRAN
Mehrnia, Mohammad Reza
School of Chemical Engineering, College of Engineering, University of Tehran, Tehran, I.R. IRAN
ABSTRACT: The performance of a forced-liquid Vertical Tubular Loop Bioreactor (VTLB),
a forced-liquid Horizontal Tubular Loop Bioreactor (HTLB) and a gas-induced External Airlift
Loop Bioreactor (EALB) were compared for production of biomass from natural gas. Hydrodynamic
characteristics and mass transfer coefficients were determined as functions of design parameters,
physical properties of gases as well as operational parameters. Moreover, energy consumption
for different gas and liquid flow rates was studied. In the EALB, kinematic viscosity (g) showed
its significant role on mixing time, gas hold-up and kLa and the diffusion coefficient of gas in water (Dg)
had a remarkable effect on kLa. It was observed from experimental results that the performance of
the VTLB was the best for biomass production. Furthermore, the volumetric mass transfer
coefficients for air and methane were determined at different geometrical and operational factors.
New correlations for mixing time, gas hold-up and kLa were obtained and expressed separately.
Also, the different ratios of methane and air were measured and compared for optimum growth
in the VTLB, HTLB and EALB.
KEY WORDS: Forced-liquid vertical tubular loop bioreactor, Forced-liquid horizontal tubular
loop bioreactor, Gas-induced airlift loop bioreactor, Hydrodynamic, Mass transfer, Energy
consumption.
INTRODUCTION
In chemical industries, the production costs are
mainly influenced by chemical and other running costs.
The same hold true for the manufacture of
biotechnological costs [1]. In the case of production with
* To whom correspondence should be addressed.
+ E-mail: [email protected]
1021-9986/10/4/37 20/$/4.00

Iran. J. Chem. Chem. Eng. Yazdian F. et al. Vol. 29, No. 4, 2010
38
aerobic microorganism, the key factors are the costs of
chemicals and energy. Therefore, for the selection of
suitable bioreactors, their specific performance
(mass transfer efficiency and energy consumption) are
significant.
Loop bioreactors are characterized by a definitely
directed circulation flow which can be driven in fluid or
fluidized systems by propeller or jet drive and mainly
in gas-liquid systems by airlift drive or liquid pump [2].
They are especially appropriate for fluid systems
requiring high dispersion priority. On the other hand,
their simple constructions and operation result in low
investment and operational costs [3]. Also, loop
bioreactors have shown an acceptable performance for
the production of biomass from natural gas due to their
unique hydrodynamic characteristics [2-5].
However,
their optimal design and operation for large scale
production plants still require vast research.
A gas-induced airlift loop bioreactor is a device in which
a region of gassed liquid is connected to a region of
ungassed liquid; so that the difference in hydrostatic
pressure between the two regions results in circulation
of the liquid [6]. The forced-liquid bioreactors are constructed
with an outlook to provide low-compressed gas injection,
long residence time, low energy consumption, simple
design and good separation of gases and liquid.
Moreover, turbulence generated by forced circulation
reduces bubble size and prevents heterogeneous flow
from occurring at the maximum aeration velocity.
Without liquid circulation, higher aeration rates increase
bubble size, cause churn turbulent flow and lead
to reduce mass transfer efficiency [6,7].
Methanotrophic bacteria are a group of aerobic
bacteria that can use methane as their source of carbon
and energy [8]. The processed biomass extracted from
these species of microorganisms could be utilized as
a source of potential food [7-10]. Past investigations
on methane fermentation are mostly devoted to the
metabolic pathways of methane oxidation and the taxonomy
and physiology of methane-utilizing organisms [11-13].
Although loop bioreactors are employed in fermentation
of other carbon sources, and some technical data are
available in this regard [4,14-16], data have not been
provided and compared for significant factors such as design
and operational parameters for methane fermentation
in loop bioreactors.
In this research, the comparison of the VTLB, HTLB
and EALB and their performance are studied based on
hydrodynamic characteristics (i.e., mixing time and gas
hold-up), mass transfer efficiency (Em), energy
consumption as well as biomass production. Mixing time,
gas hold-up, and kLa are all correlated as responses of
operational and design parameters as well as gas phase
properties. Superficial gas and liquid velocity selected
as the most common operational factors whereas riser
(discharge) to downcomer (suction) cross sectional area
ratio (Ar/Ad), horizontal length to diameter ratio (L/D),
vertical length to diameter ratio (H/D) and volume of
gas-liquid separator (S) are defined as design parameters.
Furthermore, in the EALB, kinematic viscosity (g),
including viscosity (µ) and density (), and diffusion
coefficient of dissolved gas (Dg) are chosen and
considered as the parameters for gas properties, too.
Since the flow in VTLB and HTLB is because of
the force of pumps impose on the liquid, the investigation
of the effects of gas properties will be restricted and
could not be addressed to achieve into trustable results.
Therefore, the influence of gas properties such as gas
kinematic viscosity and gas diffusion coefficients
were studied only in the EALB.
EXPERIMENTAL SECTION
Microorganism and growth medium
The microorganism (Methylomonas spp.) used in
this work was isolated from an oil field in Iran during
the research work in our previous investigation on a bubble
column bioreactor [9]. The growth medium was a carbonless
salt broth medium named as Methane Salt Broth (MSB)
which has been optimized by Yazdian et al. [9].
Gas mixture
Five streams of mixed gases were used for evaluation
of biomass production. Inlet gas flow rates of air and
methane were adjusted so that it would provide mixtures
from 25 vol% to 75 vol% air (five streams with ten vol%
interval). When oxygen is present in a gas (such as air),
the proportion of methane to air is normally in the range
of 5 to 15 volumes of methane to 95 to 85 volumes of air
to form a flammable mixture [17] however, since gases
were spareged right after mixing and passed for single
time through the liquid phase, all experiments were
carried out safely. Moreover, in the rest of experiments

Iran. J. Chem. Chem. Eng. Comparison of Different Loop Bioreactors ... Vol. 29, No. 4, 2010
39
Table 1: Characteristics of the loop bioreactors used for mixing studies.
Reactor type Characteristics Unit
EALB VTLB HTLB
D m - - 0.03
Dd m 0.03 0.03 -
Dr m 0.03,0.06,0.09 0.03 -
Ds m 0.11,0.18,0.25 0.11,0.18 0.11,0.18
Ar/Ad - 1.00,4.00,9.00 1.00 1.00
hs m 0.10 0.10 0.10
H/D - - 45,67 -
L/D - - - 37,54
S=Vsu/Vdi - 0.61,1.65,3.11 0.61,1.65 0.61,1.65
N - 6 6 6
D0 mm 0.10 0.10 0.10
LP - - MP M
(for pure gases that are not combustible) air and methane
were used individually for the experiments.
Bioreactor
Three experimental loop bioreactors (laboratory scale
made of glass), which operated with air and water, were used.
The EALB and the VTLB configurations consisted of
two vertical columns connected at the top (separator) and
the base by horizontal piping. In addition there is a liquid
pump just the bottom of the downcomer in the VTLB.
The HTLB consists of two long horizontal parts, short
vertical downstream and upstream tubes, a top part which
is placed right above the upper end of the downstream
and a U-shape bend. The geometrical characteristics of
the devices are given in Table 1 and illustrated in Fig. 1.
The air was distributed by a perforated tube through a gas
pump in different zones of the loop bioreactors.
The difference in hydrostatic pressure between the two regions
in the EALB results in circulation of the liquid. However,
in the VTLB and HTLB, the liquid medium was circulated
by a liquid magnetic pump. All experiments were carried out
at 30 (±0.5) °C. This was done by a Temperature Loop
Controller (TLC) placed inside the dissolved methane
detector and connected to an electrical heater positioned at
the top of the loop bioreactors. Also, a cooling system was
used for removing the microbial heat produced during the
fermentation process.
Measurements
Dissolved methane
A dissolved methane sensor based on silicone tube
was implemented to determine methane concentration
during methane fermentation.The silicone tube diameter,
silicone tube length and helium flow rate (as the carrier gas
were 0.25 cm (inner diameter) and 0.35 cm (outer diameter),
0.1 m and 50 mL/min, respectively. A continuous stream
of helium was directed through the tubing, sweeping out
the dissolved methane which diffused through
the walls of the tubing from the fermentation broth.
The probe of the sensor was made of silicone rubber
tubing (NO 02502; Detakta Company). A semi-conductor
methane gas sensor (Figaro TGS 2611)-which is highly
sensitive and selective to methane gas-was used to
measure the dissolved methane continuously [61].
Mixing time
Mixing time (tm) was determined using tracer
response techniques when air was introduced. This
technique is based on the fact that if a pulse of tracer
(a dye) is injected to the flow, a decaying sinusoidal type
of response is detected at the downstream of the injection
point [3,18]. Tracer (0.5 ml, Brilliant Blue G, =595 nm)
was injected to the gas-liquid separating section. Values
of optical density were recorded in a spectrophotometer

Iran. J. Chem. Chem. Eng. Yazdian F. et al. Vol. 29, No. 4, 2010
40
Fig. 1: A schematic diagram of loop bioreactors (a: gas-induced EALB; b: forced−liquid VTLB; c: forced−liquid HTLB).
1. Condenser
2. Heater
3. Thermometer
4. Gas-liquid separator
5. Dissolved methane detector
6. Methane and Oxygen inlet
7. Gas pump
8. Flow meter
9. Cooler
10. Dissolved oxygen probe
11. Sampling port
12. Outlet gases (a); liquid pump (b,c)
13. Outlet gases (b,c)
Carrier gas Carrier gas
Discharge Discharge Suction Suction
Air
Methane Air
Methane
Carrier gas
Air
Methane

Iran. J. Chem. Chem. Eng. Comparison of Different Loop Bioreactors ... Vol. 29, No. 4, 2010
41
(VARIAN CARRY 50 CONC, Australia) until the response
of the pulse was completely damped (each experiment
was carried out in triplicate). Thereafter, mixing time
was determined after changing H/D, L/D, separator volume,
UsG and UsL and gas composition (only in EALB).
Gas hold-up and mass transfer coefficients (kLaO2 and kLaCH4)
In addition to methane detector, one probe of
dissolved oxygen (DO; with response time of four
seconds for 63 % saturation) was placed within the
vertical part. Overall gas hold-up (), kLaO2 and kLaCH4
were determined by the eminent methods of volume
expansion and dynamic gassing-out measurement
respectively [6,19]. For kLaO2 measurement, dissolved
oxygen was first removed from the bioreactor by
sparging with nitrogen until the dissolved oxygen
concentration fell down to nearly zero. The nitrogen flow
was then stopped and bubbles were allowed to separate
from the liquid. When the bioreactor had reached
a hydrodynamic steady state, the increase in DO was
measured with time until the fluid became nearly
saturated with oxygen. The mass balance of DO in the
bioreactor, then gives Eq. (1) [6]:
( )L *L L
dCd a C C
dt− (1)
where CL is the DO concentration, C* is saturated oxygen
concentration and t is time. Concentration of dissolved
methane was measured by methane detector and
its volumetric coefficient was determined by a simple
method presented previously [20,21]. Also, kLa (oxygen
and methane) and were determined after changing H/D,
L/D, separator volume, UsL and UsG and gas composition
(only in EALB) as well.
Power input
The total power input to a two-phase reactor (eT)
could be determined from contribution of each phase
in energy consumption. For forced-liquid tubular reactors,
four sources of power delivered to the reactor were
considered [6,22]: (1) isothermal expansion of gas as
it moves up the vessel, (2) the kinetic energy of gas
sparged, (3) the kinetic energy of the liquid, and
(4) energy lost in spargers. Eq. (2) shows the total specific
power delivered to the bioreactors.
m L L 2T m 0
L ts L
Q RT gHe ln 1 Q Mv
V P 2V
ρ Ω= + + +
(2)
s LL 2L sL
L L
P QQU
2V V
∆ρ +
The first, second, third and fourth terms on the
right−hand side of Eq. (2) represented power input due to
isothermal expansion of the gas, the kinetic energy of the
injected gas, the kinetic energy of the liquid entering the
reactor and the energy loss in the sparger or static mixer.
The efficiency factor was taken to be 1 [6].
RESULTS AND DISCUSSION
Comparison of loop bioreactors based on mixing
performance
The mixing characteristics of loop bioreactors of
different configurations can be compared by considering
the time required to achieve a certain degree of mixing
(in this study 95 %). The mixing time may also be used
as an operation and scale up parameter, its variation being
dependent on the operational and geometrical conditions.
To predict or compare the mixing times in the loop
bioreactors which were being designed or made,
as a function of the operating and geometry variables and
gas phase properties, the specific mixing time, denoted
as the mixing time per unit liquid volume (tm/V), is usually
used. These specific mixing time concept has also been
used previously by Rousseau & Bu’Lock [23], Popovic &
Robinson [24] and Gavrilescu & Tudose Radu [25].
We determine the mixing time with the same method and
define a geometrical parameter such as S to interpret
the effect of the volume of the separator, H/D to illustrate
the influence of VTLB height and L/D to present
the impression of HTLB length. H/D and L/D obtain
two values (see Table 1).
Like all the authors which investigated the influence
of the gas velocity, the same results have been observed
in this study. In all devices investigated, the mixing time
decreases with an increasing aeration rate. In the EALB,
two regimes of mixing time were observed. At low gas
velocities, mixing time decreased sharply, while at higher
velocities mixing time was almost constant (Fig. 2).
Especially in laboratory systems, the mixing time becomes
less efficient at higher gas velocities. These values of gas
velocity correspond to the transition from the circulating
to the turbulent regime. In the EALB, Fig. 2 shows when

Iran. J. Chem. Chem. Eng. Yazdian F. et al. Vol. 29, No. 4, 2010
42
kinematic viscosity (g) increased from 19.04×10⁻⁶
Pa.s
(for oxygen) to 27.54×10⁻⁶
Pa.s (for methane), mixing
time increased as well (i.e., mixing time changes directly).
Kinematic viscosity showed its role significantly on
mixing time when different gases (oxygen, methane and
their mixtures) were used.
Mixing time decreased with increasing values of both
gas and liquid flow rates in the VTLB and HTLB, too.
Our experiments showed that there are two zones of the
dependency of mixing time on gas velocity (Figs. 3 and 4).
For different values of gas velocity (in this study),
mixing time was sensitive at low liquid velocities; while
at higher liquid velocities, mixing time was less affected
by high values of aeration rates. In the VTLB, at low gas
velocities mixing time was highly sensitive to different
amounts of liquid circulation rates. However, in the
HTLB, mixing time was sensitive to low gas velocity
especially at low liquid flow rates.
Figs. 2 to 4 show that when the amount of Ar/Ad, L/D
and H/D decreased from 4 to 1; 54 to 37 and 67 to 45,
respectively, the mixing time decreased, too. These are
expectable and also have been shown by many
investigators that observed a decrease in the mixing time
with decrease of known geometrical parameters such as
Ar/Ad, L/D and H/D ratio [26-29]. Also, no discernible
effect of the separator volumes on mixing time was
observed (0.61 and 1.65 for S). However, in the EALB,
separator volume showed its role considerably in compare
to the VTLB and HTLB. It is necessary to find
the minimum critical value of S for optimum operation
of the mentioned loop bioreactors in further studies.
The effect of design factors on mixing time in the
investigated loop bioreactors (particularly in the EALB)
can therefore be attributed mainly to the effect of design
parameters (e.g., Ar/Ad) on the recirculation of liquid
velocity, which proves to be the physical parameter
which most strongly affects the recirculation rates in the
none-forced liquid loop bioreactors. Therefore, the
mixing time can be considered as a measure of the
macro-scale mixing by convective mechanisms [6].
Based on our experimental results, some new correlations
for normalized mixing time (tm/V) were presented in
Eqs. (3) to (5) [30].
( )2
0.430.460.42 gm r0.70
sGd N
t A1.11U 1 1 S
V A
−− υ
= × + × + × υ (3)
Fig. 2: Normalized mixing time versus superficial gas velocity
in the EALB (the error-bars-shapes given in Fig. 2 are related
to the effects made by the gas separator size).
Fig. 3: Normalized mixing time versus superficial oxygen
velocity in the HTLB (the error-bars-shapes given in Fig. 3
are related to the effects made by the gas separator size).
Fig. 4: Normalized mixing time versus superficial gas velocity
in the VTLB (the error-bars-shapes given in Fig. 4 are related
to the effects made by the gas separator size).
0.01 0.02 0.03 0.04 0.05 0.06 0.07
UsG / m.s-1
110
90
70
50
30
10
t m /
s.L
-1
0 0.01 0.02 0.03 0.04 0.05
UsG / m.s-1
90
80
70
60
50
40
30
20
10
0
t m /
s.L
-1
0 0.01 0.02 0.03 0.04 0.05
UsG / m.s-1
80
70
60
50
40
30
20
10
0
t m /
s.L
-1
Ar/Ad=1, oxygen
Ar/Ad=1, methane
Ar/Ad=4, oxygen
Ar/Ad=4, methane
Ar/Ad=9, oxygen
Ar/Ad=9, methane
L/D=54, UsL=0.47 m.s-1 L/D=54, UsL=0.35 m.s-1 L/D=54, UsL=0.24 m.s-1 L/D=54, UsL=0.12 m.s-1 L/D=37, UsL=0.47 m.s-1 L/D=37, UsL=0.35 m.s-1 L/D=37, UsL=0.24 m.s-1 L/D=54, UsL=0.12 m.s-1
H/D=67, UsL=0.47 m.s-1 H/D=67, UsL=0.35 m.s-1 H/D=67, UsL=0.24 m.s-1 H/D=67, UsL=0.12 m.s-1 H/D=45, UsL=0.47 m.s-1 H/D=45, UsL=0.35 m.s-1 H/D=45, UsL=0.24 m.s-1 H/D=45, UsL=0.12 m.s-1
Iran. J. Chem. Chem. Eng. Comparison of Different Loop Bioreactors ... Vol. 29, No. 4, 2010
43
In addition to operational and design parameters,
the effect of physical properties of the gases were combined
and considered in Eq. (3). We entered the kinematic
viscosity (g=µ/) of the gas as a physical property which
causes the changes in the mixing time, circulation time,
gas hold-up, and gas volumetric mass transfer coefficient (kLa).
The term of normalized gas density (g/l) is another
interesting alternative for allocating the effect of gas type
on hydrodynamic and mass transfer characteristics.
However, since the density of the gases is very small,
it provides a very small value in the correlation too, and
naturally causes constant coefficient to be tremendously
increased. The physical property of g was normalized
by its dividing by the property of an inert gas such
as nitrogen (g/N2). Since we considered the effect
of the type of the gas, our correlation provides a new
contribution compared with the other correlations [23,29].
The range of applicability for Eq. (3) is 0.02 to 0.06 m.s-1
for superficial gas velocity. The value of Ar/Ad is 1 to 9.
Also, the ratio of separator volume to downcomer
volume is 0.61 to 3.11. Moreover, the g/N2 value is
1.12 to 1.62. Values estimated with Eq. (3) agreed with
the experimentally measured data with less than
14% error.
Depending on the gas velocity range, the exponent for
UsG has the values from -0.075 to -0.60 [25,31,32].
The exponent of UsG in our correlation is however next
to the range previously reported by other researchers.
The influence of Ar/Ad on hydrodynamic characteristics
in external loop bioreactors was investigated experimentally
by Bello et al. [33]. Their results showed that mixing time
increased with the increase of this ratio (Ar/Ad), with
an exponent of 0.26. Joshi et al. [34] theoretically predicted
the value of 0.37 for the exponent. The trend of our
results (effect of Ar/Ad on mixing time) is similar to that
observed by others. Weiland [26] found that gas-liquid
separator volume had strong influence on mixing time.
His results presented as tm versus gas-liquid separator
volume gave the slope of -0.39 (the exponent of third
variable in Eq. (3) is next to Weiland's).
The dependence of the mixing time on the operational
and geometrical velocities expressed by the following
equation in the HTLB, too [7]:
( )0.35
0.15m 0.40 0.56sG sL
t L1.17U U 1 S
V D
−− − = ⋅ ⋅ ⋅ +
(4)
Eq. (4) determines mixing time by four simple
parameters in horizontal loop bioreactors. Its range of
applicability is between 0.01-0.05 m.s-1 and 0.12-0.47 m.s
-1
for superficial gas and liquid velocities respectively.
L/D is between 37-54. Also, S is 0.61 to 1.65. Eq. (4)
correlated 90% of the data with less than 20% error. This
maximum deviation only states in which ranges
the measured and calculated data cover each other. The unit
of normalized mixing time is time to volume (for
example s/L).
On the basis of our experimental results in the VTLB,
a new correlation for normalized mixing time (tm/V)
is presented by Eq. (5) [35]:
( )0.28
0.09m 0.34 0.59sG sL
t H1.37U U 1 S
V D
−− − = ⋅ ⋅ ⋅ +
(5)
Eq. (5) determines mixing time by four simple
parameters in forced-liquid vertical loop bioreactors.
Estimated values by Eq. (5) agreed with the experimentally
measured data with less than 18% error. The range of
applicability for eq 5 is 0.01 to 0.06 m.s-1
for superficial
gas velocity. The value of H/D is 45 to 67. Also, the ratio
of separator volume to discharge side volume is 0.61 to 1.65.
Moreover, the liquid flow rate is 0.1 to 0.6 m.s-1
.
The exponent of UsG in our correlation is next to the
range reported by Yazdian et al. [7] for forced−liquid
loop bioreactors. Dependence of mixing time on gas and
liquid flow rates was studied in forced-liquid loop
bioreactors by Chisti et al. [36], Fadavi & Chisti [37]
and Fadavi & Chisti [38] as well. They concluded that
mixing time decreased with increasing values of both gas
and liquid flow rates (both gas and liquid velocities
contributed to promoting mixing in the bioreactor).
Moreover, the effect of liquid flow rate on mixing time
has the same consequence in comparison with Yazdian’s
results (the exponent of UsL are 0.56 and 0.59). The influence
of design factor on hydrodynamic characteristics
in forced-liquid loop bioreactors was investigated
experimentally by Yazdian et al. [7], too. Their results
showed that mixing time increased with the increase of
geometry parameters, with an exponent of 0.35. The trend
of our results (effect of H/D on mixing time) is similar to
that observed by others [26-29]. Yazdian et al. [7] found
that gas-liquid separator volume had no big influence on
mixing time. Their results presented as tm versus
gas-liquid separator volume gave the slope of -0.15

Iran. J. Chem. Chem. Eng. Yazdian F. et al. Vol. 29, No. 4, 2010
44
Table 2: Comparison of mixing time correlations for different loop bioreactors.
characteristics correlation R2
gas−induced EALB ( )2
0.430.46
0.42 gm r0.70
sG
d N
t A1.11U . 1 . .
V A1 S
−−υ
+υ
= +
0.92
forced−liquid HTLB ( )0.35
0.15m 0.40 0.56
sG sL
t L1.17U .U . . 1 S
DV
−− −= +
0.90
forced−liquid VTLB ( )0.28
0.09m 0.34 0.59
sG sL
t H1.37U .U . . 1 S
DV
−− − +
=
0.90
Fig. 5: Comparisons of mixing time versus superficial gas
velocity for loop bioreactors: forced–liquid VTLB; ---forced-
liquid HTLB; … gas-induced EALB.
(the exponent of fourth variable in Eq. (5) is next to
Yazdian’s). Furthermore, Papagianni et al. [39] used
Verlaan’s equation to estimate mixing time. The mixing
times calculated with the equation of Verlaan et al. [40]
were very close to those obtained with experimental data
in forced−liquid tubular loop bioreactor. They suggested
that the relative mixing (tm/tc) time is a parameter that
can be used with confidence in characterization of mixing
in the forced-liquid TLBs.
Fig. 5 illustrates the comparison of mixing time
versus superficial gas velocity for different loop bioreactors.
The shortest mixing time was achieved in the VTLB.
In the HTLB, tm was more than in the forced-liquid VTLB.
However, mixing times in the HTLB and VTLB were
less than in the EALB; because of the increased liquid
velocity in the forced−liquid loop bioreactors. Therefore,
the experimental results showed that the greatest
mixing times were obtained in the EALB. According to
experimental outcomes, the forced−liquid circulation
(in the VTLB and HTLB) led to a shortening in the
mixing time about 30% compared to the EALB.
This behavior indicated that mixing processes was
predominately controlled by the macro-circulation of the
liquid phase within the loops and to a lesser extent by the
axial dispersion due to ascending bubbles [25]. Due to
the presented data, a region (it was shown in gray color
in Fig. 5) that was independent on bioreactor type
was explored that occurred in gas superficial velocity that
ranged between 0.015 m.s-1
to 0.047 m.s-1
. In that zone,
mixing time was not reliant on bioreactor variety and
changed with variation of operational and design
parameters, only. The comparison of experimental results
for mentioned loop bioreactors (based on correlations)
are compared in Table 2.
Comparison of loop bioreactors based on gas hold-up
Gas hold-up versus superficial gas velocity in the
EALB for different gases and Ar/Ad are illustrated in Fig. 6.
It can be seen when kinematic viscosity increased from
19.04×10⁻⁶
Pa.s (for oxygen) to 27.54×10⁻⁶
Pa.s (for
methane), gas hold−up decreased, too. Gas hold-up for
different gases (oxygen, methane, and their mixtures)
changed with g indirectly; whereas it increased directly
as gas velocity enhanced. In the mentioned loop
bioreactors, gas hold-up increased as oxygen velocity
increased. However, the dependence of on superficial
gas velocity became slightly weak at high gas flow rates
(more than 0.04 m.s-1
). However, in the HTLB and
VTLB, at any constant value of the oxygen velocity,
the overall gas hold−up increased by increasing the liquid
velocity (Figs. 7 to 9). Increasing liquid flow rate reduced
bubble size of the gas stream and consequently increased
hold-up. It is, however, expectable; because turbulent
liquid movements create eddies those hit the bubbles
sharply and make them smaller and avoid their easy
escape from the top of the reactor. A significant
enhancement in gas hold-up occurred at the liquid
velocity of 0.47 m.s-1
which resulted in a gas hold-up of
0.005 0.015 0.025 0.035 0.045 .055
UsG / m.s-1
110
100
90
80
70
60
50
40
30
20
10
t m /
s.L
-1

Iran. J. Chem. Chem. Eng. Comparison of Different Loop Bioreactors ... Vol. 29, No. 4, 2010
45
Fig. 6: Gas hold−up versus superficial air velocity in
the EALB (the error-bars-shapes given in Fig. 6 are related to
the effects made by the gas separator size).
Fig. 7: Gas hold−up versus superficial air velocity in
the HTLB (the error-bars-shapes given in Fig. 7 are related to
the effects made by the gas separator size).
0.1 (in the HTLB). In the suction side of the VTLB,
as could be seen in Fig. 8, the amount of gas hold-up
increased significantly even at low liquid velocities.
Increasing of liquid flow rate reduced bubble size of
the gas stream and consequently increased hold-up (to 0.14)
only up to a liquid velocity of 0.35 m.s-1
. A further
increase in liquid velocity to 0.47 m.s-1
hardly had any
effect on the suction gas hold-up. The bubble columns
and airlift reactors do not generally exceed an overall gas
hold−up value of 0.1 in air-water systems [6,36-38].
In contrast, the forced circulation operation at a
relatively low liquid velocity of 0.24 m.s-1
attained a gas
hold-up (in suction part of the VTLB) around 0.10. Here,
bubble flow regime persisted to a gas hold-up
achieve 0.14 during the forced circulation operation.
Fig. 8: Gas hold−up versus superficial air velocity in the
suction side of the VTLB (the error-bars-shapes given in Fig. 8
are related to the effects made by the gas separator size).
Fig. 9: Gas hold-up versus superficial air velocity in
the discharge side of the VTLB (the error-bars-shapes given
in Fig. 9 are related to the effects made by the gas separator size).
The discharge gas hold-up changed with the gas
and liquid velocities as shown in Fig. 9 as well.
During operation at lower values of liquid injection
rate, little gas bubbles were dragged into the discharge
zone. Consequently, there was hardly any gas bubble
to be held in the discharge part under these conditions
(Fig. 9). A significant number of bubbles began
to be dragged into the discharge once the velocity
of gas in the suction part exceeded 0.035 m.s-1
in low liquid flow rates. Although an increase
of forced flow liquid velocity from 0.35 m.s-1
to 0.47 m.s-1
did not increase the suction gas hold−up (Fig. 8),
it significantly enhanced the discharge gas hold-up as more
bubbles were dragged in the discharge zone because
of a high flow rate of liquid.
0.01 0.02 0.03 0.04 0.05 0.06 0.07
UsG / m.s-1
0.06
0.05
0.04
0.03
0.02
0.01
0
εε εε /
-
0 0.01 0.02 0.03 0.04 0.05
UsG / m.s-1
0.13
0.11
0.09
0.07
0.05
0.03
0.01
εε εε /
-
0.01 0.02 0.03 0.04 0.05
UsG / m.s-1
0.01 0.02 0.03 0.04 0.05
UsG / m.s-1
0.11
0.1
0.09
0.08
0.07
0.06
0.05
0.04
0.03
εε εε /
-
0.15
0.14
.013
0.12
0.11
0.1
0.09
0.08
0.07
0.06
0.05
0.04
εε εε /
-
Ar/Ad=1, oxygen
Ar/Ad=1, methane
Ar/Ad=4, oxygen
Ar/Ad=4, methane
Ar/Ad=9, oxygen
Ar/Ad=9, methane
L/D=54, UsL=0.47 m.s-1
L/D=54, UsL=0.35 m.s-1
L/D=54, UsL=0.24 m.s-1
L/D=54, UsL=0.12 m.s-1
L/D=37, UsL=0.47 m.s-1
L/D=37, UsL=0.35 m.s-1
L/D=37, UsL=0.24 m.s-1
L/D=54, UsL=0.12 m.s-1
H/D=67, UsL=0.47 m.s-1 , H/D=67, UsL=0.35 m.s-1 H/D=67, UsL=0.24 m.s-1, H/D=67, UsL=0.12 m.s-1 H/D=45, UsL=0.47 m.s-1, H/D=45, UsL=0.35 m.s-1
H/D=45, UsL=0.24 m.s-1 H/D=45, UsL=0.12 m.s-1
H/D=67, UsL=0.47 m.s-1; H/D=67, UsL=0.35 m.s
-1
H/D=67, UsL=0.24 m.s-1; H/D=67, UsL=0.12 m.s
-
H/D=45, UsL=0.47 m.s-1; H/D=45, UsL=0.35 m.s
-1
H/D=45, UsL=0.24 m.s-1; H/D=45, UsL=0.12 m.s
-1

Iran. J. Chem. Chem. Eng. Yazdian F. et al. Vol. 29, No. 4, 2010
46
The influence of the geometrical parameter (Ar/Ad) on
is clearly sketched in Fig. 6 (in the EALB). Decrease
in Ar/Ad ratio led to an increase in . The increase in gas
hold-up with decreasing Ar/Ad, resulted from reduced
liquid circulation due to the increasing resistance of the
liquid circulation path. Some investigators proposed their
empirical correlations for gas hold-up with UsG and Ar/Ad
[23,41,42]. But in their correlations the effect of separator
volume has not been studied. Kawase et al. [43] presented
his non-Newtonian correlation for gas hold-up with the
geometrical parameter Ar/Ad, too. In the HTLB, a decrease
in L/D ratio led to an increase in . The increase of gas hold-up
with decreasing L/D ratio resulted from generation of
small bubbles due to increase of the bubble velocity.
In the VTLB, increase in H/D ratio led to a slight increase
in . Increasing gas hold-up as a direct result of H/D ratio,
enhances the hydrostatic pressure and also generation of
small bubbles due to the increase of bubble velocity.
We presented our correlation for gas hold−up in riser
(discharge) side of the EALB for the experimented gases
(oxygen, methane, and gas mixtures) by Eq. (6) [30]:
( )2
0.520.620.58 gr1.43
di sGd N
A13.19U 1 1 S
A
−−−
υ ε = ⋅ + ⋅ + ⋅ υ
(6)
As is obvious, we preserved the dependency of our
correlation to geometrical characteristic (Ar/Ad),
separator volume, superficial gas velocity, and gas
properties again. The resulting correlation is simple and
hence usable for fermentation. Its range of applicability
is 0.02 to 0.06 m.s-1 for superficial gas velocity. The value
of Ar/Ad is 1 to 9. Also, the ratio of separator volume to
downcomer volume is 0.61 to 3.11. Moreover, the g/N2
value is 1.12 to 1.62. Estimated values by Eq. (6) agreed
with the experimentally measured data with less than
15% error. The effect of separator volume on gas
hold−up could be seen clearly although its affects is
less than Ar/Ad. Separator volume showed its role slightly
when g and Ar/Ad increased (the error-bars-shapes given
in Fig. 6 are related to the effects made by the gas
separator size). However, separator volume demonstrated
its effect significantly while g and Ar/Ad decreased.
For all experiments in our research work, gas hold-up
was also measured in the downcomer (suction). Gas hold-up
measurement revealed that a linear correlation between
di and su. Eq. (7) explains the data fit with 98%
agreement for the EALB [30]:
su di0.47ε = ε (7)
Depending on the gas velocity range, the exponent for
UsG has the values from 0.50 to 1.50 [31,44,45].
The exponent of UsG in our correlation is in this range.
Popovic & Robinson [23] reported an exponent of -1 for
the term (1+Ar/Ad) in their work. The exponent of
(1+Ar/Ad) in Eq. (6) is however next to Popovic and
Robinson’s. However, the dependency of gas hold−up on
(1+Ar/Ad) by Chisti et al. [46] is weaker than that in the
proposed correlation.
The correlation for oxygen hold−up in the HTLB
was presented by Eq. (8) [7]:
( )0.18
0.070.41 0.55sG sL
L1.1U U 1 S
D
−−
ε = ⋅ ⋅ ⋅ +
(7)
Depending on the gas velocity range, the exponent for
UsG has the values from 0.50 to 1.50 [31,44,45].
The exponent of UsG in our correlation is in this range.
Popovic & Robinson [23] reported an exponent of -1
for the term (1+Ar/Ad) in their work. The exponent of
(1+Ar/Ad) in Eq. (6) is however next to Popovic and
Robinson’s. However, the dependency of gas hold-up on
(1+Ar/Ad) by Chisti et al. [46] is weaker than that in the
proposed correlation.
The correlation for oxygen hold-up in the HTLB was
presented by Eq. (8) [7]:
( )0.18
0.070.41 0.55sG sL
L1.1U U 1 S
D
− ε = ⋅ ⋅ ⋅ +
(8)
As is obvious, this correlation again depends on
geometrical characteristic (L/D and S), superficial gas
and liquid velocity. The range of applicability of gas
hold−up is between 0.01-0.05 m.s-1
and 0.12-0.47 m.s-1
for superficial gas and liquid velocities respectively.
L/D is between 37-54. Also, S is 0.61 to 1.65. Gas hold-up
is dimensionless. Eq. (8) correlated 93% of the data
with less than 20% error. This maximum deviation only
states in which ranges the measured and calculated
data cover each other. The effect of separator volume on
gas hold−up was less; however, it is necessary to find
its minimum critical value for optimum operation
of the HTLB in other studies (the error-bars-shapes given
in Fig. 7 are related to the effects made by the gas
separator size).

Iran. J. Chem. Chem. Eng. Comparison of Different Loop Bioreactors ... Vol. 29, No. 4, 2010
47
The correlation for air hold-up in suction and
discharge parts of the VTLB was presented by Eqs. 9 and 10,
respectively [35]:
( )0.13
0.070.31 0.50su sG sL
H0.31U U 1 S
D
− ε = ⋅ ⋅ ⋅ +
(9)
( )0.13
0.070.32 0.30di sG sL
H0.21U U 1 S
D
− ε = ⋅ ⋅ ⋅ +
(10)
These correlations rely on geometrical characteristic
(H/D and S) and superficial gas and liquid velocity.
Eq. (9) correlated 92% of the data with less than 15% error.
Also, estimated values by Eq. (9) agreed with the
experimentally measured data with less than ±12% error.
Eq. (10) shows that liquid flow rate and gas flow almost
have the same effect on gas hold-up in discharge section.
The range of applicability for Eqs. 9 and 10 is
0.01 to 0.06 m.s-1
for superficial gas velocity. The value
of H/D is 45 to 67. Also, the ratio of separator volume
to discharge side volume is 0.61 to 1.65. Moreover,
the liquid flow rate is 0.1 to 0.6 m.s-1. The error-bars-shapes
given in Figs. 8 and 9 are related to the effects made by
the gas separator size.
Depending on the gas velocity range, the exponent for
UsG has the values from 0.3 to 0.9 in forced-liquid loop
bioreactors [7,36-38]. Fadavi & Chisti [38] showed an
exponent of 0.9 for this variable. The exponent of UsG in
our correlation is in the mentioned range. Chisti et al. [36],
Fadavi & Chisti [37], and Fadavi & Chisti [38]
concluded that mixing time decreased with increasing
values of both gas and liquid flow rates in forced-liquid
loop bioreactors. Eqs. (8) to (10) show that gas-liquid
separator volume had the same influence on gas hold-up
like Yazdian’s results (the exponent of fourth variable
in mentioned equations are 0.07) [7].
Fig. 10 illustrates the comparison of gas hold-up
versus superficial gas velocity for different loop
bioreactors. The shortest gas hold-up was achieved in the
EALB. In the VTLB, gas hold-up was more than in the
forced−liquid HTLB. However, gas hold-ups in the
HTLB and VTLB were more than in the EALB
obviously; because of the increased liquid velocity in the
forced-liquid loop bioreactors. Therefore, the
experimental results showed that the biggest gas hold-ups
were obtained noticeably in the VTLB. According to
experimental outcomes, the forced-liquid circulation
Fig. 10. Comparisons of gas hold−up versus superficial gas
velocity for loop bioreactors: forced–liquid VTLB; ---
forced-liquid HTLB; … gas-induced EALB.
(in the VTLB and HTLB) led to an extension in the gas
hold-up about 66% compared to the EALB. Due to the
presented data, a region (it was shown in gray color
in Fig. 10) that was independent on bioreactor type
(HTLB and VTLB) was explored that occurred in superficial
gas velocity that ranged between 0.015 m.s-1 to 0.047 m.s
-1.
In that zone, gas hold-up was not reliant on bioreactor
variety (HTLB and VTLB) and changed with variation of
operational and design parameters, only. The comparison
of experimental results for mentioned loop bioreactors
(based on correlations) are compared in Table 3 as well.
Comparison of loop bioreactors based on mass transfer
coefficients
Fig. 11 shows the experimental gas volumetric liquid
mass transfer coefficients (kLa) in discharge side of the
EALB versus superficial gas velocity for different gases
and Ar/Ad. kinematic viscosity (g) showed its significant
role on kLa when different gases (oxygen, methane and
their mixtures) were used. When kinematic viscosity
increased from 19.04×10⁻⁶
Pa.s (for oxygen) to
27.54×10⁻⁶
Pa.s (for methane), kLa reduced. Moreover,
kLa increased when diffusion coefficient increased from
1.8×10⁻⁹
m2/s (for methane) to 2.51×10
−9 m
2/s (for
oxygen). It was revealed that diffusion coefficient of gas
in water (Dg) has remarkable effect on kLa. In addition,
changes in the amount of Ar/Ad in Fig. 11 resulted
in same effects as shown in Fig. 6 for gas hold-up
(because the hold-up is the main factor that influences the
gas-liquid interfacial area). It was shown that separator
volume had a more effective contribution on
0.005 0.015 0.025 0.035 0.045 0.055
UsG / m.s-1
0.14
0.12
0.1
0.08
0.06
0.04
0.02
0
εε εε /
-

Iran. J. Chem. Chem. Eng. Yazdian F. et al. Vol. 29, No. 4, 2010
48
Tahle 3: Comparison of gas hold-up correlations for different loop bioreactors.
characteristics correlation R2
( )2
0.520.62
0.58 gr1.43
di sG
d N
A13.19U 1 1 S
A.
−−
− υε ⋅ + ⋅ +
υ
=
0.90 gas−induced EALB
su di0.47ε = ε 0.98
forced−liquid HTLB ( )0.18
0.070.41 0.55
sG sL
L1.1U U 1 S
D
−−
ε = ⋅ ⋅ ⋅ +
0.93
( )0.13
0.070.31 0.50
su sG sL
H0.31U U 1 S
D
−
ε = ⋅ ⋅ ⋅ +
0.92
forced−liquid VTLB
( )0.13
0.070.32 0.30
di sG sL
H0.21U U 1 S
D
−
ε = ⋅ ⋅ ⋅ +
0.93
Fig. 11: Mass transfer coefficient versus superficial air
velocity in the EALB (the error-bars-shapes given in Fig. 11
are related to the effects made by the gas separator size).
Fig. 12: Mass transfer coefficient versus superficial air
velocity in the HTLB (the error-bars-shapes given in Fig. 12
are related to the effects made by the gas separator size).
mass transfer coefficient when g and Ar/Ad decreased
(the error-bars-shapes given in Fig. 11 are related to the
effects made by the gas separator size). As is predictable,
kLa values were enhanced as a result of gas flow rates
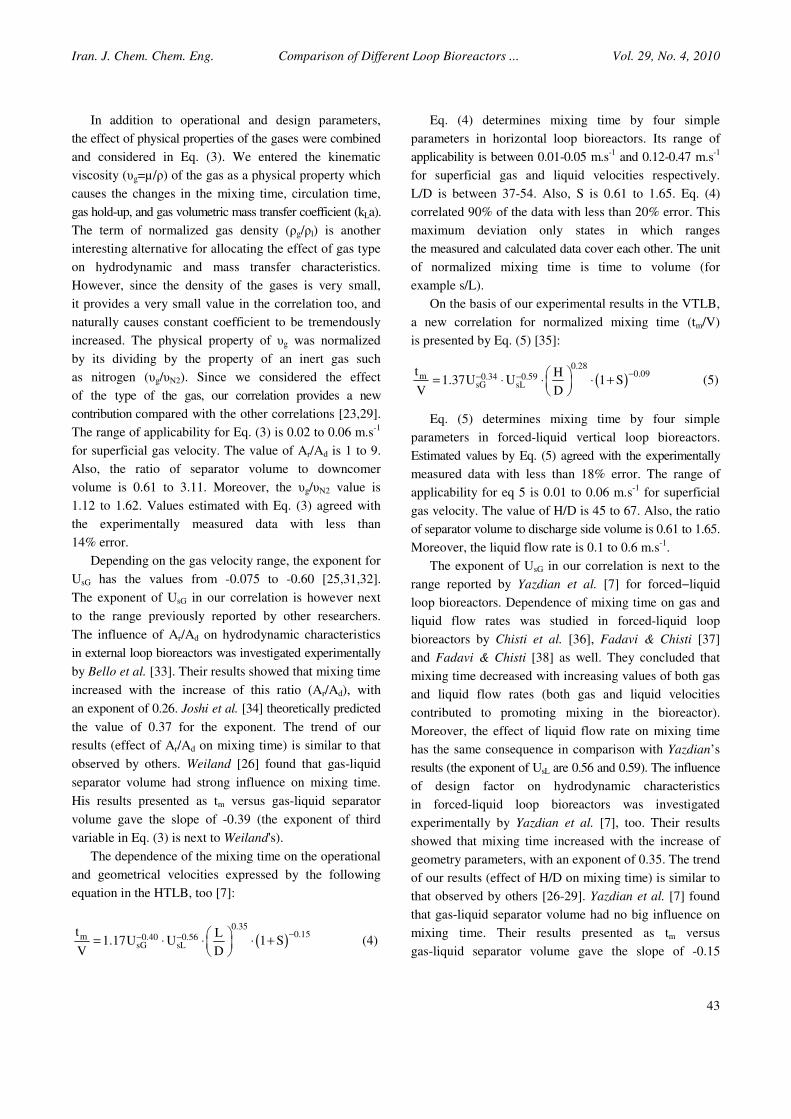
increase. Figs. 12 to 14 show the experimental oxygen
volumetric liquid mass transfer coefficients (kLaO2) in the
HTLB and VTLB versus the same parameters shown
in Figs. 7 to 9. Similar to gas hold-up, changes in the
amount of L/D and H/D resulted in the same effects for
kLa. In addition, like the mixing time and gas hold-up,
separator volume does not have any more effective
contribution on mass transfer coefficient. Predictably, kLa
values were enhanced by increasing gas flow rates.
The liquid flow mainly influences kLa by affecting the bubble
size and gas-liquid interfacial area “a”. In the suction of
VTLB, increasing liquid flow rate reduced bubble size of
the gas stream and, therefore, increased kLa (to 0.034 s-1
)
only up to a liquid velocity of 0.35 m.s-1
. A further
increase in liquid velocity to 0.47 m.s-1
barely had any
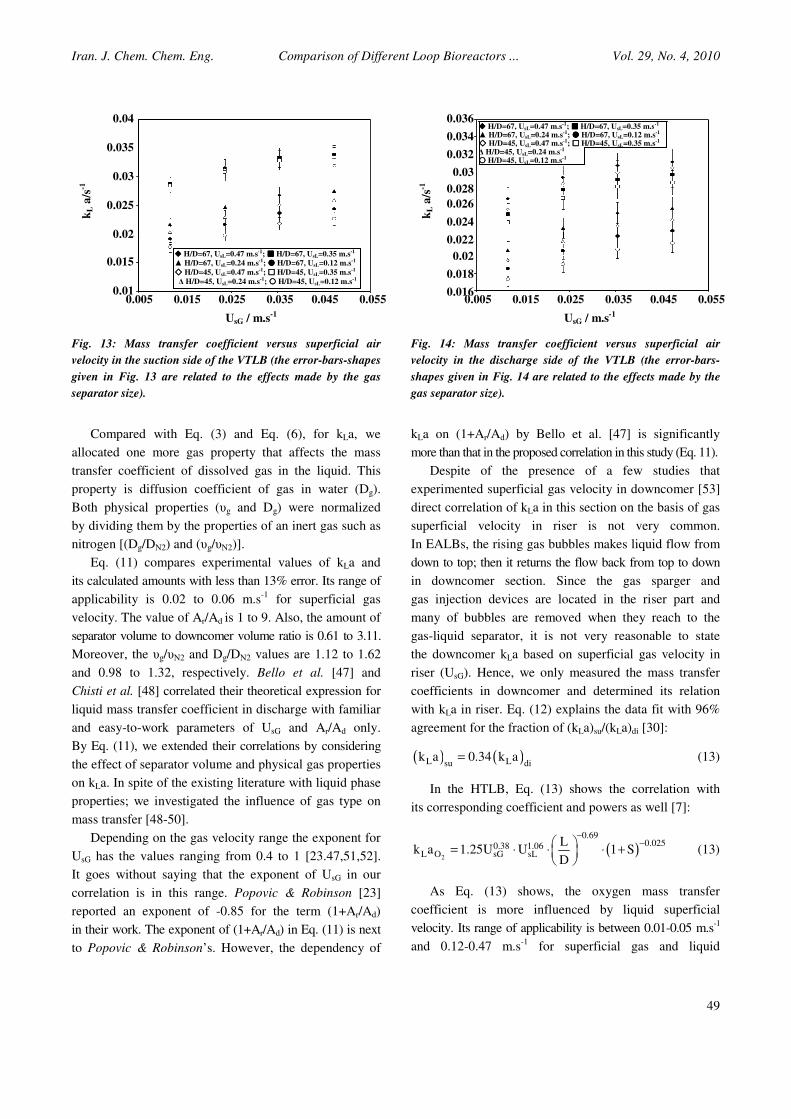
effect on the suction zone kLa. In spite of mass transfer
coefficient in suction zone, the amount of kLa
in discharge zone is sensitive to high liquid circulation
rate. At high H/D ratios, significant enhancement in kLa
occurred in the liquid velocity of 0.47 m.s-1
which
resulted in a kLa of 0.03 s-1
.
Eq. (11) shows the correlation with its corresponded
coefficient and powers for the tested gases (oxygen,
methane and their mixtures) [30]:
( ) ( )0.63
0.61r0.46L sGdi
d
Ak a 0.097U 1 1 S
A
−−
= ⋅ + ⋅ + ⋅
(11)
2 2
0.91 1.12
g g
N N
D
D
− υ
⋅ υ
0.005 0.015 0.025 0.035 0.045 0.055
UsG / m.s-1
0.018
0.016
0.014
0.012
0.01
0.008
0.006
0.004
0.002
0
kL a
/s-1
0.01 0.02 0.03 0.04 0.05 0.06 0.07
UsG / m.s-1
0.012
0.01
0.008
0.006
0.004
0.002
0
kL a
/s-1
Ar/Ad=1, oxygen; Ar/Ad=1, methane
Ar/Ad=4, oxygen; Ar/Ad=4, methane
Ar/Ad=9, oxygen, Ar/Ad=9, methane
L/D=54, UsL=0.47 m.s-1; L/D=54, UsL=0.35 m.s-1
L/D=54, UsL=0.24 m.s-1; L/D=54, UsL=0.12 m.s-1
L/D=37, UsL=0.47 m.s-1; L/D=37, UsL=0.35 m.s-1
L/D=37, UsL=0.24 m.s-1; L/D=54, UsL=0.12 m.s-1
Iran. J. Chem. Chem. Eng. Comparison of Different Loop Bioreactors ... Vol. 29, No. 4, 2010
49
Fig. 13: Mass transfer coefficient versus superficial air
velocity in the suction side of the VTLB (the error-bars-shapes
given in Fig. 13 are related to the effects made by the gas
separator size).
Fig. 14: Mass transfer coefficient versus superficial air
velocity in the discharge side of the VTLB (the error-bars-
shapes given in Fig. 14 are related to the effects made by the
gas separator size).
Compared with Eq. (3) and Eq. (6), for kLa, we
allocated one more gas property that affects the mass
transfer coefficient of dissolved gas in the liquid. This
property is diffusion coefficient of gas in water (Dg).
Both physical properties (g and Dg) were normalized
by dividing them by the properties of an inert gas such as
nitrogen [(Dg/DN2) and (g/N2)].
Eq. (11) compares experimental values of kLa and
its calculated amounts with less than 13% error. Its range of
applicability is 0.02 to 0.06 m.s-1
for superficial gas
velocity. The value of Ar/Ad is 1 to 9. Also, the amount of
separator volume to downcomer volume ratio is 0.61 to 3.11.
Moreover, the g/N2 and Dg/DN2 values are 1.12 to 1.62
and 0.98 to 1.32, respectively. Bello et al. [47] and
Chisti et al. [48] correlated their theoretical expression for
liquid mass transfer coefficient in discharge with familiar
and easy-to-work parameters of UsG and Ar/Ad only
By Eq. (11), we extended their correlations by considering
the effect of separator volume and physical gas properties
on kLa. In spite of the existing literature with liquid phase
properties; we investigated the influence of gas type on
mass transfer [48-50].
Depending on the gas velocity range the exponent for
UsG has the values ranging from 0.4 to 1 [23.47,51,52].
It goes without saying that the exponent of UsG in our
correlation is in this range. Popovic & Robinson [23]
reported an exponent of -0.85 for the term (1+Ar/Ad)
in their work. The exponent of (1+Ar/Ad) in Eq. (11) is next
to Popovic & Robinson’s. However, the dependency of
kLa on (1+Ar/Ad) by Bello et al. [47] is significantly
more than that in the proposed correlation in this study (Eq. 11).
Despite of the presence of a few studies that
experimented superficial gas velocity in downcomer [53]
direct correlation of kLa in this section on the basis of gas
superficial velocity in riser is not very common.
In EALBs, the rising gas bubbles makes liquid flow from
down to top; then it returns the flow back from top to down
in downcomer section. Since the gas sparger and
gas injection devices are located in the riser part and
many of bubbles are removed when they reach to the
gas-liquid separator, it is not very reasonable to state
the downcomer kLa based on superficial gas velocity in
riser (UsG). Hence, we only measured the mass transfer
coefficients in downcomer and determined its relation
with kLa in riser. Eq. (12) explains the data fit with 96%
agreement for the fraction of (kLa)su/(kLa)di [30]:
( ) ( )L Lsu dik a 0.34 k a= (13)
In the HTLB, Eq. (13) shows the correlation with
its corresponding coefficient and powers as well [7]:
( )2
0.690.0250.38 1.06
L O sG sL
Lk a 1.25U U 1 S
D
−−
= ⋅ ⋅ ⋅ +
(13)
As Eq. (13) shows, the oxygen mass transfer
coefficient is more influenced by liquid superficial
velocity. Its range of applicability is between 0.01-0.05 m.s-1
and 0.12-0.47 m.s-1
for superficial gas and liquid
0.005 0.015 0.025 0.035 0.045 0.055
UsG / m.s-1
0.036
0.034
0.032
0.03
0.028
0.026
0.024
0.022
0.02
0.018
0.016
kL a
/s-1
0.005 0.015 0.025 0.035 0.045 0.055
UsG / m.s-1
0.04
0.035
0.03
0.025
0.02
0.015
0.01
kL a
/s-1
H/D=67, UsL=0.47 m.s-1; H/D=67, UsL=0.35 m.s-1
H/D=67, UsL=0.24 m.s-1; H/D=67, UsL=0.12 m.s-1
H/D=45, UsL=0.47 m.s-1; H/D=45, UsL=0.35 m.s-1
H/D=45, UsL=0.24 m.s-1; H/D=45, UsL=0.12 m.s-1
H/D=67, UsL=0.47 m.s-1; H/D=67, UsL=0.35 m.s-1
H/D=67, UsL=0.24 m.s-1; H/D=67, UsL=0.12 m.s-1
H/D=45, UsL=0.47 m.s-1; H/D=45, UsL=0.35 m.s-1 H/D=45, UsL=0.24 m.s-1 H/D=45, UsL=0.12 m.s-1

Iran. J. Chem. Chem. Eng. Yazdian F. et al. Vol. 29, No. 4, 2010
50
velocities respectively. L/D is between 37-54. Also,
S is 0.61 to 1.65. The unit of kLa is time reverse (s-1). Eq. (13)
correlated 95% of the data with less than 15% error.
This maximum deviation only states in which ranges
the measured and calculated data cover each other.
The volumetric gas liquid mass transfer coefficient was
also determined for methane. Concentration of dissolved
methane was measured by methane detector and its
volumetric coefficient determined by a simple method
addressed previously. Here, methane correlation, is given
in Eq. (14) [7]:
( )4
0.670.0230.34 1.05
L CH sG sL
Lk a 0.87U U 1 S
D
−−
= ⋅ ⋅ ⋅ +
(14)
On average, mass transfer coefficients of oxygen are
near to 1.4 folds of that of methane’s. Mass transfer
coefficient of oxygen with respect to methane has been
determined by other researchers and their results are close
to the ones obtained in this study (1.12 to 1.43) [54-56].
Also, in other approach, in which mixtures of methane
and ethane were examined, an amount of 2.1 has been
reported for kLaO2/kLaCH4 [57].
The correlation for air kLa in suction part of the
VTLB is presented by Eq. (15) [35]:
( ) ( )2
0.130.020.13 0.35
L O sG sLsu
Hk a 0.038U U 1 S
D
− = ⋅ ⋅ ⋅ +
(15)
Separator volume demonstrates more sensible effect
compared to previous correlations. For any combination
of gas and liquid flow rates, the measured and calculated
kLa values in the suction part agreed on maximum ±14%.
Eq. (16) shows the correlation in discharge side [35]:
( ) ( )2
0.120.030.14 0.30
L O sG sLdi
Hk a 0.036U U 1 S
D
− = ⋅ ⋅ ⋅ +
(16)
As Eq. (16) shows, the oxygen mass transfer
coefficient is more influenced by liquid superficial
velocity. Eq. (16) correlated 96% of the data with
less than 10% error.
The volumetric gas liquid mass transfer coefficient
was also determined for methane. Here, methane
correlation in suction side was given in Eq. (17) [35]:
( ) ( )4
0.120.030.14 0.34
L CH sG sLsu
Hk a 0.021U U 1 S
D
− = ⋅ ⋅ ⋅ +
(17)
On average, mass transfer coefficients of oxygen are
equal to 1.85 folds of that of methane’s in the suction zone.
Mass transfer coefficient of oxygen with respect to methane
has been determined by other researchers and their results
are close to those obtained in this study (1.43 to 2.1) [54-57].
The range of applicability for Eqs. (15) to (17) are 0.01 to
0.06 m.s-1
for superficial gas velocity. The value of H/D
is 45 to 67. Also, the ratio of separator volume
to discharge side volume is 0.61 to 1.65. Moreover,
the liquid flow rate is 0.1 to 0.5 m.s-1
.
Depending on the gas velocity range the exponent for
UsG has the values ranging from 0.13 to 0.60 [7,36,37].
Chisti et al. [36], Fadavi & Chisti [37] and Yazdian et al. [7]
determined the exponent of UsG in values of 0.4, 0.54 and
0.38, respectively. It goes without saying that the exponent
of UsG in our correlation is in this range. Chisti et al. [36]
and Fadavi & Chisti [37] involved the power input and
the volume of the bioreactor to determine the mass
transfer coefficient. Yazdian et al. [7] reported
an exponent of -0.025 for the term (S) in their work.
The exponent of (S) in eqs 15 to 17 is next to Yazdian’s.
Fig. 15 illustrates the comparison of mass transfer
coefficient versus superficial gas velocity for different
loop bioreactors. The lowest mass transfer coefficient
was achieved in the EALB. In the VTLB, mass transfer
coefficient was more than in the forced−liquid HTLB.
However, mass transfer coefficients in the HTLB and
VTLB were more than in the EALB; because of the increased
liquid velocity in the forced-liquid loop bioreactors.
Therefore, the experimental results showed that the greatest
mass transfer coefficients were obtained significantly
in the VTLB. According to experimental outcomes,
the forced-liquid circulation (in the VTLB) led to an extension
in the mass transfer coefficient about 72% compared
to the EALB. However, the forced-liquid flow rates in the
HTLB resulted to an extension in values of kLa about
41% compared to the EALB. Due to the presented data,
a region (it was shown in gray color in Fig. 15) that was
independent on bioreactor type (HTLB and EALB)
was explored that occurred in superficial gas velocity that
ranged between 0.015 m.s-1
to 0.047 m.s-1
. In that zone
mass transfer coefficient was not reliant on bioreactor
variety (HTLB and EALB) and changed with variation of
operational and design parameters only. The comparison
of experimental results for mentioned loop bioreactors
(based on correlations) are compared in Table 4 as well.

Iran. J. Chem. Chem. Eng. Comparison of Different Loop Bioreactors ... Vol. 29, No. 4, 2010
51
Table 4: Comparison of mass transfer correlations for different loop bioreactors.
characteristics correlation R2
( ) ( )2 2
0.91 1.120.63
0.61 g gr0.46
sGL di
d N N
DAk a 0.097U 1 1 S
A D
−−
−
⋅υ
= + + ⋅υ
⋅ ⋅
0.94
Gas-induced EALB
( ) ( )L Lsu dik a 0.34 k a= 0.96
( )2
0.69
0.0250.38 1.06
L O sG sL
Lk a 1.25U U 1 S
D
−
−= ⋅ ⋅ ⋅ +
0.95
Forced-liquid HTLB
( )4
0.670.023
0.34 1.05
L CH sG sL
Lk a 0.87U U 1 S
D
−−
= ⋅ ⋅ ⋅ +
0.95
( ) ( )2
0.130.02
0.13 0.35
sG sLL Osu
Hk a 0.038U U . 1 S
D
−
= ⋅ ⋅ +
0.90
( ) ( )2
0.120.030.14 0.30
sG sLL Odi
Hk a 0.036U U 1 S
D
−⋅ ⋅= +
⋅
0.96 Forced-liquid VTLB
( ) ( )4
0.12
0.14 0.34
sG sLL CHsu
H 0.03k a 0.021U U 1 S
D⋅ ⋅
−= +
⋅
0.90
Fig. 15: Comparisons of mass transfer coefficient versus
superficial gas velocity for loop bioreactors (forced-liquid
VTLB, forced-liquid HTLB and gas-induced EALB):
forced–liquid VTLB; forced-liquid HTLB;
gas-induced EALB.
Comparison of loop bioreactors based on mass transfer
efficiency
Mass transfer efficiency Em is defined as Eq. (17) [5,36]:
Lm
T
k aE
e= (18)
By multiplying the Em−value with the steady−state
driving force for oxygen transfer (i.e. C* − CL), we can
obtain the amount of oxygen transferred per unit of
energy supplied. Mass transfer efficiencies for various
levels of power input in three loop bioreactors are shown
in Fig. 16. For the entire range of liquid flow rates,
highest amounts of Em were obtained only in the VTLB.
It is obvious that at low power input (50 to 120 w.m-3
);
the VTLB is the most efficient bioreactor.35
However,
in the HTLB, highest values were obtained at specific power
input values between 30 to 70 w.m-3
when the forced
circulation rate was 0.24 m.s-1
. High values of forced
circulation rates reduced mass transfer efficiency [36-38].
Also, in the EALB, experimental results show that higher
mass transfer efficiency was obtained while UsG0.04 m.s-1.
Comparison of loop bioreactors based on biomass
production
Due to compare the performance of the EALB, VTLB
and HTLB in terms of biomass production, kLa and Em
data, five experiments were designed. In all experiments
UsG, UsL, S, Ar/Ad, L/D and H/D were adjusted to the
values which resulted the highest mass transfer
coefficients in each bioreactor. Fig. 17 demonstrates the
scenario of five biomass growth based on the results of
optical density at 600 nm for different gas mixtures in the
loop bioreactors. All experiments were started by 7
volume percent inoculum of active Methylomonas culture
0.005 0.015 0.025 0.035 0.045 0.055
UsG / m.s-1
0.04
0.035
0.03
0.025
0.02
0.015
0.01
0.005
0
Kj,
a/s
-1

Iran. J. Chem. Chem. Eng. Yazdian F. et al. Vol. 29, No. 4, 2010
52
Table 5: Comparison of different loop bioreactors for biomass production in optimum conditions.
characteristics Oxygen to methane ratio
(vol%) (kLa)O2
(s-1) Em
Optical density
(-) Dry cell weight
(g/L) Doubling time
(min)
gas-induced EALB 75 to 25 0.0074 4 0.94 1.02 155
forced-liquid HTLB 50 to 50 0.016 6 1.20 2.45 104
forced-liquid VTLB 60 to 40 0.034 15 3.00 2.97 96
Fig. 16: Comparison of mass transfer efficiency (Em)
in different loop bioreactors.
and carried out in triplicate. Fig. 17 and Table 5 show
that a gas mixture of 25 vol% methane and 75 vol%
oxygen gives the best biomass production in the EALB
(maximum optical density: 0.94; doubling time: 155 min).
Although 75 vol% methane provides the best kLa (0.0041 s−1
),
it resulted in the worst biomass growth. Moreover,
a gas mixture of 50 vol% air and 50 vol% methane gives the
best biomass production (maximum optical density: 1.2;
doubling time: 104 min) in the HTLB and a gas mixture
of 40 vol% methane and 60 vol% air provides the best
biomass production (maximum optical density: 3;
doubling time: 96 min) in the VTLB. These explain that
in methane fermentation, despite of the greater value of
kLa for oxygen, the rate of oxygen transfer may be more
critical than that of methane. This fact has been
investigated by other studies and presented in other ways
[5,58-60].
CONCLUSIONS
For comparison of the performance of different loop
bioreactors (EALB, HTLB and VTLB), different specific
power input, aeration rates and liquid flow rates
were employed to obtain reliable results. Gas-liquid
mass transfer was distinguished in the three kinds of loop
Fig. 17: Optical density of MSB culture versus time at 600 nm
for different gas mixtures in the VTLB, HTLB and EALB.
bioreactors for various combinations of design and
operational parameters as well as gas phase properties for
production of biomass from natural gas. The results
presented in this work indicated the values of mass
transfer coefficients and gas hold−ups in the VTLB was
higher than those of HTLB and EALB. Moreover,
experimental results showed that higher mass transfer
efficiency (Em) for the entire range of liquid flow rates
was obtained in the VTLB, as well. The shortest mixing
time was achieved in the VTLB. The VTLB, not only
affords a forced liquid flow, but also provides
a countercurrent contact between gas and liquid flow.
The horizontal loop bioreactor circulates the bubbles by the
force of pumped liquid too; however, since it makes
bubbles flow in horizontal direction, it creates a moderate
mixing time. Generally, those that circulate liquid
resulted in lesser (better) mixing time. The conventional
EALB, in this comparison, demonstrated the poorest
mixing time performance. To show the maximum
difference, as Fig. 5 shows, the VTLB can perform
a mixing time around 30 percent better than EALB.
According to mixing time data, a region that was
independent on bioreactor type was explored. In that
zone, mixing time was not reliant on bioreactor variety
20 120 220 320 420 520 620
eT / W.m-3
40
35
30
25
20
15
10
5
0
Em
×10
5/m
3j-1
10 15 20 25 30 35 40
t / h
3.5 3
2.5 2
1.5 1
0.5 0
OD
/ -
Forced-liquid VTLB
--- Forced-liquid HTLB
… Gas-induced EALB
UsL=0.47 m.s-1
UsL=0.35 m.s-1
UsL=0.24 m.s-1
UsL=0.12 m.s-1
UsG=0.05 m.s-1
UsG=0.04 m.s-1
UsG=0.02 m.s-1
UsG=0.01 m.s-1
Forced–liquid VTLB
--- Forced-liquid HTLB
… Gas-induced EALB

Iran. J. Chem. Chem. Eng. Comparison of Different Loop Bioreactors ... Vol. 29, No. 4, 2010
53
and varies with variation of operational and design
parameters, only. In addition, the lowest gas hold-up
was achieved in the EALB. The experimental results
showed that the biggest gas hold−ups were obtained
noticeably in the VTLB; because of the increased liquid
velocity in the forced−liquid loop bioreactors. According
to experimental outcomes, the forced−liquid circulation
(in the VTLB and HTLB) led to an extension in the gas
hold−up about 66% compared to the EALB. Due to the
presented data, a region that was independent on
bioreactor type (HTLB and VTLB) was determined.
In that region, gas hold-up was not dependent on bioreactor
selection (HTLB and VTLB) and changed with variation
of operational and design parameters, only. This scenario,
however, holds true for mass transfer coefficients, too.
The lowest mass transfer coefficient was achieved in the
EALB. In the VTLB, mass transfer coefficient was more
than in the forced−liquid HTLB, as well. However, mass
transfer coefficients in the HTLB and VTLB were more
than in the EALB. Therefore, the greatest mass transfer
coefficients were obtained significantly in the VTLB.
Based on experimental results, the forced-liquid
circulation (in the VTLB) led to an extension in the mass
transfer coefficient about 72% compared to the EALB.
However, the forced-liquid flow rates in the HTLB
resulted to an extension in values of kLa about 41%
compared to the EALB. A region that was not dependent
on bioreactor kind was considered. In that part, mass
transfer coefficients changed only with differences of
operational and design factors. This research has been
devoted to covering mentioned variables to obtain
generally applicable equations for the loop bioreactors
design in order to produce biomass from natural gas in
optimum conditions. Based on hydrodynamic and mass
transfer data, the best biomass production occurred in the
forced-liquid VTLB for a gas mixture of 40 vol%
methane and 60 vol% air.
Acknowledgment
This investigation was supported by National Iranian
Oil Company (NIOC) and National Iranian Gas Company
(NIGC).
Notations
Ar/Ad Riser (discharge) to downcomer (suction)
cross sectional area ratio, Dimensionless
Bo Bodenstein number, Dimensionless
C* Saturated oxygen concentration, ppm
CL DO concentration, ppm
D0 Holes size in sparger, mm
Ddi Discharge diameter, m
Dg Diffusion coefficient, m2.s
-1
Dsu Suction diameter, m
Ds Separator diameter, m
eT Total power input per unit volume, W.m-3
g Gravitational acceleration, m.s-2
hb Bioreactor height, m
hs Liquid level in separator, m
Hd Downcomer height, m
Hr Riser height, m
H/D Vertical length to diameter/ dimensionless
kLaCH4 Volumetric methane mass transfer
coefficient, s−1
kLaO2 Volumetric oxygen mass transfer coefficient, s−1
L/D Horizontal length to diameter, dimensionless
M Molar mass, kg.kmol-1
N Number of holes in distributor, dimensionless
PM Power input due to agitator, W
Pts Pressure at top section, Pa
QL Volumetric liquid flow rate, m3.h
-1
Qm Molar gas flow rate, kmol.s-1
R Universal gas constant, J.kmol-1
.K-1
t Time, h
UsG Superficial gas velocity in riser, m.s-1
UsL Superficial liquid velocity, m.s-1
v0 Gas velocity through the sparger hole, m.s-1
VL Liquid velocity, m.s-1
Abbreviations
DO Dissolved oxygen, ppm
EALB External airlift loop bioreactor
HTLB Horizontal tubular loop bioreactor
LP Liquid pump
MP Magnetic pump
TLC Temperature loop controller
VTLB Vertical tubular loop bioreactor
OD Optical density, dimensionless
Greek letters
Gas hold-up, dimensionless
di Gas hold-up in discharge, dimensionless
su Gas hold-up in suction, dimensionless
Iran. J. Chem. Chem. Eng. Yazdian F. et al. Vol. 29, No. 4, 2010
54
L Liquid density, kg.m-3
Efficiency factor
g Kinematic gas viscosity, Pa.s
N2 Kinematic nitrogen viscosity, Pa.s
Received : Jan 5, 2010 ; Accepted : March 1, 2011
REFERENCES
[1] Schüger S., Comparison of Different Loop
Bioreactors, Bioproc. Eng., 9, p. 215 (1993).
[2] Larsen E. B., U-Shape and/or Nozzle U-Loop
Fermentor and method of carrying out a
Fermentation Process, US. Pat. 6492135B1 (2002).
[3] Blenke H., Loop Reactors, Adv. Biochem. Eng., 13,
p. 121 (1979).
[4] Lars J., Method and Means for the Production of a
Microorganism Cell Mass, EP. Pat. 0306466A2
(1989).
[5] Kurt S., Lars J., Henrik E., Method of Fermentation,
WO. Pat. 016460A1 (2003).
[6] Chisti Y., "Airlift Bioreactors", Elsevier, London,
(1989).
[7] Yazdian F., Shojaosadati S.A., Nosrati M., Mehrnia M.R.,
Vasheghani-Farahani E., Study of Geometry and
Pperational Conditions on Mixing time, Gas Hold
up, Mass Transfer, Flow Regime and Biomass
Production from Natural Gas in a Horizontal
Tubular Loop Bioreactor, Chem. Eng. Sci., 64, p. 540
(2009).
[8] Koffas M., Odom J.M., Schenzle A., High Growth
Methanotrophic Bacterial Strains, WO. Pat.
0220728A2 (2002).
[9] Yazdian F., Hajizadeh S., Shojaosadati S.A.,
Khalilzadeh R., Jahanshahi M., Nosrati M.,
Production of Single Cell Protein from Natural Gas:
Parameter Optimization and RNA Evaluation,
Iranian J. Biotech., 3, p. 235 (2005).
[10] Yazdian F., Pesaran Hajiabbas M., Shojaosadati S.A.,
Nosrati M., Mehria M., Vasheghani-Farahani E.,
Evaluation of Gas Hold-Up and Mixing Time in
Loop Bioreactors During Production of SCP from
Natural Gas, The Second International Conference
on Environmental, Industrial and Applied
Microbiology, Seville, Spain (2007).
[11] Whittenbury R., Phillips K.C., Wilkinson J.F.,
Enrichment, Isolation and Some Properties of
Methane Utilizing Bbacteria, J. Gen. Microbiol., 61,
p. 205 (1970).
[12] Dalton H., The Leeuwenhoek Lecture 2000 The
Natural and Unnatural History of Methane-
Oxidizing Bacteria, Philosophical Transactions of
the Royal Society B: Biological Sciences, 360,
p. 1207 (2005).
[13] Urmann K., Norina E.S., Schroth M.H., Zeyer J.,
Methanotrophic Activity in a Diffusive Methane/
Oxygen Counter-Gradient in an Unsaturated Porous
Medium, J. Contam. Hydrol., 94, p. 126 (2005).
[14] Ziegler H., Meister D., Dunn I.J., The Tubular Loop
Fermentor: Oxygen Transfer, Growth Kinetics, and
Design, Biotech. Bioeng., XIX, p. 507 (1977).
[15] Papagianni M., Matty M., Kristiansen B., Design of
a Tubular Loop Bioreactor for Scale-Up and Scale-
Down of Fermentation Processes, Biotech. Prog.,
19, p. 1498 (2003).
[16] Wen J., Chen Y., Chen D., Jia X., Removal of Ethyl
Acetate in Air Streams Using a Gas-Liquid-Solid
Three-Phase Flow Airlift Loop Bioreactor, Biochem.
Eng. J., 24, p. 135 (2005).
[17] White E.A., Improvement in or Relating to
Fermentation Processes for Converting Methane into
Proteinaceous Material, UK. Patent, 1463295 (1977).
[18] Papagianni M., Matty M., Kristiansen B., Citric Acid
Production and Morphology of Aspergillus niger as
Functions of the Mixing Intensity in a Stirred Tank
and a Tubular Loop Bioreactor, Biochem. Eng. J., 2,
p. 197 (1998).
[19] Taweel A.M., Yan J., Azizi F., Odedra D., Gomma H.G.,
Using in-Line Static Mixers to Identify Gas-Liquid
Mass Transfer Processes, Chem. Eng. Sci., 60, p. 6378
(2005).
[20] Sheehan B.T., Johnson M.J., Production of Bacterial
Cells from Methane, Appl. Microbiol., 21, p. 511
(1971).
[21] Lamb S.C., Garver J.C., Batch- and Continuous-
Culture Studies of a Methane-Utilizing Mixed
Culture, Biotech. Bioeng., 22, p. 2097 (1980).
[22] Coulson J.M., Richardson J.F., Backhurst J.R.,
Harker J.H., "Chemical Engineering", Pergamon,
Oxford, (1990).

Iran. J. Chem. Chem. Eng. Comparison of Different Loop Bioreactors ... Vol. 29, No. 4, 2010
55
[23] Popovic M., Robinson C.W., Mixing Characteristics
of External Loop Airlifts: Non-Newtonian Systems,
Chem. Eng. Sci., 45, p. 1405 (1993).
[24] Rousseau J., Bu’Lock J.D., Mixing Characteristics
of A Simple Airlift, Biotech. Lett., 2, p. 475 (1980).
[25] Gavrilescu M., Tudose R.Z., Mixing Studies in
External-Loop Airlift Reactors, Chem. Eng. J., 66,
p. 97 (1997).
[26] Weiland P., Influence of Draft Tube Diameter on
Operation Behavior of Airlift Loop Reactors,
Ger. Chem. Eng., 7, p. 374 (1984).
[27] Chisti M.Y., Kasper M., Moo-Young M., Mass
Transfer in External Loop Airlift Bioreactors Using
Static mixers, Canadian J. Chem. Eng., 68, p. 45
(1990).
[28] Choi K.H., Han B.H., Lee W.K., Effect of Horizontal
Connection Pipe Length on Gas Hold up and
Volumetric Oxygen Transfer Coefficient in External
Loop Airlift Reactor, HWAHAK KONGHAK, 28,
p. 220 (1990).
[29] Petrovi D.Lj., Pošarac D., Prediction of Mixing
Time in Airlift Reactors, Chem. Eng. Comm., 133,
p. 1 (1995).
[30] Yazdian F., Shojaosadati S.A., Nosrati M., Pesaran
HajiAbbas M., Vasheghani-Farahani E., Investigation
of Gas Properties, Design, and Operational Parameters
on Hydrodynamic Characteristics, Mass Transfer,
and Biomass Production from Natural Gas in an
External Airlift Loop Bioreactor, Chem. Eng. Sci.,
64, p. 2455 (2009).
[31] Lu X., Ding J., Wang Y., Shi J., Comparison of the
Hydrodynamics and Mass Transfer Characteristics
of a Modified Square Airlift Reactor with Common
Airlift Reactors, Chem. Eng. Sci., 55, p. 2257
(2000).
[32] Mirón S.A., García C.M.C., Camacho G.F., Grima
M.E., Chisti Y., Mixing in Bubble Column and
Airlift Reactors, Chem. Eng. Res. Des., 82, p. 1367
(2004).
[33] Bello R.A., Robinson C.W., Moo-Young M., Liquid
Circulation and Mixing Characteristics of Airlift
Contactors, Canadian J. Chem. Eng., 62, p. 573 (1984).
[34] Joshi J.B., Ranade V.V., Gharat S.D., Lele S.S.,
Sparged Loop Reactors, Canadian J. Chem. Eng.,
68, p. 705 (1990).
[35] Yazdian F., Shojaosadati S.A., Nosrati M.,
Vasheghani-Farahani E., Study of Hydrodynamic,
Mass Transfer, Energy Consumption and Biomass
Production from Natural gas in a Forced-Liquid
Vertical Tubular Loop Bioreactor, Biochem. Eng. J.,
49, p. 192 (2009).
[36] Chisti M.Y., Jauregui-Haza U.J., Oxygen Transfer
and Mixing in Mechanically Agitated Airlift
Bioreactors, Biochem. Eng. J., 10, p. 143 (2002).
[37] Fadavi A., Chisti Y., Gas-Liquid Mass Transfer in a
Novel Forced Circulation Loop Reactor, Chem. Eng. J.,
112, p. 73 (2005)
[38] Fadavi A., Chisti Y., Gas Hold Up and Mixing
Characteristics of a Novel Forced Circulation Loop
Reactor, Chem. Eng. J., 131, p. 105 (2007).
[39] Papagianni M., Matty M., Kristiansen B., Citric Acid
Production and Morphology of Aspergillus Niger as
Functions of the Mixing Intensity in a Stirred Tank
and a Tubular Loop Bioreactor, Biochem. Eng. J., 2,
p. 197 (1998).
[40] Verlaan P., Van E.A.M.M., Tramper J., Van’t R.K.,
Luyben K.Ch.A.M., Estimation of Axial Dispersion
in Individual Sections of an Airlift-Loop Reactor,
Chem. Eng. Sci., 44, p. 1139 (1989).
[41] Bello R.A., Robinson C.W., Moo-Young M., Gas
Hold-up and Volumetric Mass Transfer Coefficient
in Airlift Contactors, Biotech. Bioeng., 27, p. 369
(1985a).
[42] Chisti M.Y., Halard B., Moo-Young M., Liquid
Circulation in Airlift Reactors, Chem. Eng. Sci., 43,
p. 451 (1988).
[43] Kawase Y., Tsujimura M., Yamaguchi T., Gas Hold
Up in External Loop Airlift Bioreactors, Bioproc.
Biosys. Eng., 12, p. 21 (1995).
[44] Akita K., Yoshida F., Gas Hold-Up and Volumetric
Mass Transfer Coefficient in Bubble Columns,
Ind. Eng. Chem. Proc. Des. Dev., 12, p. 76 (1973).
[45] Schumpe A., Deckwer W.D., Viscous Media in
Tower Bioreactor: Hydrodynamic Characteristics
and Mass Transfer Properties, Bioproc. Eng., 2, p. 79
(1987).
[46] Chisti M.Y., Fujimoto K., Moo-Young M.,
Hydrodynamic and Oxygen Mass Transfer Studies
in Bubble Columns and Airlift Bioreactors, Paper
117a presented at AICHE Annual Meeting, Miami
Beach (1986).

Iran. J. Chem. Chem. Eng. Yazdian F. et al. Vol. 29, No. 4, 2010
56
[47] Bello R.A., Robinson C.W., Moo-Young M.,
Prediction of the Volumetric Mass Transfer
Coefficient in Pneumatic Contactor, Chem. Eng.
Sci., 40, p. 53 (1985b).
[48] Chisti M.Y., Halard B., Moo-Young M., Liquid
Circulation in Airlift Reactors, Chem. Eng. Sci., 43,
p. 451 (1988).
[49] Schumpe A., Die Chemische Bestimmung von
Phasengrenzflächen in Blasensäulen Bei
Uneinheitlichen Blasengrößen, Dr. Thesis,
Universität Hannover (1981).
[50] Deckwer W.D, Nguyen-Tien K., Schumpe A.,
Serpemen Y., Oxygen Mass Transfer into Aerated
CMC Solutions in a Bubble Column, Biotech.
Bioeng., 24, p. 461 (1982).
[51] Mohanty K., Dasb D., Biswas M.N., Mass Transfer
Characteristics of a Novel Multi-Stage External
Loop Airlift Reactor, Chem. Eng. J., 133, p. 257
(2007).
[52] Nikakhtari H., Hill G.A., Hydrodynamic and
Oxygen Mass Transfer in an External Loop Airlift
Bioreactor with a Packed Bed, Biochem. Eng. J., 27,
p. 138 (2005).
[53] Choi K.H., Circulation of Gas and Liquid Phases in
External Loop Airlift Reactors, Chem. Eng. Comm.,
160, p. 103 (1997).
[54] Sheehan B.T., Johnson M.J., Production of Bacterial
Cells from Methane, Appl. Microbiol., 21, p. 511
(1971).
[55] Lamb S.C., Garver J.C., Batch- a nd Continuous-
Culture Studies of a Methane-Utilizing Mixed
Culture, Biotech. Bioeng., 22, p. 2097 (1980).
[56] Yinghao Y., Ramsay J.A., Ramsay B.A., On-Line
Estimation of Dissolved Methane Concentration
During Methanotrophic Fermentations, Biotech.
Bioeng., 95, p. 788 (2006).
[57] Volesky B., Zajic J.E., Batch Production of Protein
from Ethane and Ethane-Methane Mixtures, Appl.
Microbiol., 21, p. 614 (1971).
[58] Vary P.S., Johnson M.J., Cell Yields of Bacteria
Grown on Methane, Appl. Microbiol., 15, p. 1473
(1967).
[59] House A., Place E., Improvement in or Relating to
the Fermentation of Methane Utilizing Microorganism,
GB. Patent, 1270006 (1972).
[60] Harrison E.F., Doddema H.J., P rocess for the
Production of Micro-Organisms, US. Patent
4042458 (1977).
[61] Yazdian F., Shojaosadati S.A., Nosrati M., Malek
KH., Mehrnia M.R., On-Line Measurement of
Dissolved Methane Concentration During Methane
Fermentation in a Loop Bioreactor, Iran. J. Chem. &
Cehm. Eng., 28, p. 85 (2009).