comparison of existing cpt- correlations with canterbury...
TRANSCRIPT
Paper Number O13
Comparison of existing CPT- correlations with
Canterbury-specific seismic CPT data
2014 NZSEE Conference
C.R. McGann, B.A. Bradley, M. Cubrinovski & M.L. Taylor
Dept. Civil and Natural Resources Engineering, University of Canterbury, Christchurch, New Zealand.
L.M. Wotherspoon
Dept. of Civil and Environmental Engineering, University of Auckland, Auckland, New Zealand.
ABSTRACT: The abundance of cone penetration test (CPT) data from subsurface explorations in Christchurch and the surrounding areas provides a useful source of information for a characterization of the near surface shear wave velocity ( ) profile for the region. A portion of the investigations were conducted using seismic CPT, enabling the comparison of measured shear wave velocity with CPT data, and subsequently the evaluation of existing CPT- correlations for applicability to Canterbury-specific soils. The existing correlations are shown to be biased, generally over-predicting the observed with depth, thus demonstrating the need for a Canterbury-specific CPT- correlation.
1 INTRODUCTION
A detailed characterization of the subsurface shear wave velocity profile for the Canterbury region is an essential tool to aid in identifying and understanding the physical processes resulting in the strong ground motions observed in the 2010-2011 Canterbury earthquakes. While in-situ measurement of shear wave velocity is impractical on the scale necessary for a full characterization of the region, measurements made at selected sites can be used to establish a relationship between shear wave velocity and penetration resistance that is most appropriate for the region. When combined with the large existing local CPT data set, such a correlation can be used to produce the desired description of the near surface shear wave velocity profile. To this purpose, data obtained using seismic CPT devices (Robertson et al. 1986) at 86 sites throughout Christchurch and the surrounding area are used to establish the need for a Canterbury-specific shear wave velocity correlation by evaluating the suitability of several existing empirical correlations developed elsewhere.
Substantial research has been conducted with regard to the development and evaluation of correlations between shear wave velocity, , and CPT data. Such efforts can be divided into three categories based on the considered soil type: (1) correlations for cohesive soils (e.g. Mayne & Rix 1993); (2) correlations for cohesionless soils (e.g. Sykora & Stokoe 1983; Baldi et al. 1989); and (3) general soil correlations that consider both cohesive and cohesionless soil sites (e.g. Hegazy & Mayne 1995, 2006; Andrus et al. 2007; Robertson 2009). Of these three categories, the general soil correlations are the most appealing as they are simpler to apply and have been shown to perform similar to soil type-specific correlations in predicting for general soil profiles (Wair et al. 2012).
The suitability of three general soil correlations for describing the relationship between shear wave velocity and penetration resistance suggested by the seismic CPT data in Canterbury is evaluated in terms of the bias between the predicted and measured shear wave velocities. It is determined that all three correlations are biased in predicting the of Canterbury soil deposits, tending to overestimate the measured values. This prediction bias demonstrates the need for a Canterbury-specific correlation between and CPT data.
2 REVIEW OF SELECTED SHEAR WAVE VELOCITY CORRELATIONS
Three recently developed general soil CPT- correlations based on relatively independent data sets are considered herein (Andrus et al. 2007; Hegazy & Mayne 2006; Robertson 2009). The correlations applicable to this study from each work are presented in the discussion below along with a brief summary of the characteristics of their underlying database.
2
Andrus et al. (2007) considered 72 Holocene-age pairs of and CPT measurement data from general soil sites as part of a larger study on the effects of deposit age on and developed the correlation:
(1)
where is the corrected cone tip resistance (Campanella et al. 1982) in kPa, is the soil behaviour type index (Robertson & Wride 1998), and is the depth below the ground surface in metres. Seismic CPT measurements were used to determine the in-situ for most of the data pairs; crosshole and suspension logger measurements were used at some of the sites. The Holocene-age sites had an range of 1.19–4.0, with all of the data pairs at depths m. Data pairs at depths m were omitted.
Hegazy & Mayne (2006) developed a CPT- correlation based on 558 data pairs taken from a combined database comprised of the 31 clay sites of Mayne & Rix (1993), the 30 general soil sites of Hegazy & Mayne (1995), and 12 additional general soil sites. The presented correlation is written in terms of the normalized shear wave velocity, . When rearranged to solve for , the resulting correlation is:
(
)
(2)
where is the atmospheric pressure, is the vertical effective stress, is the normalized cone tip
resistance (Robertson & Wride 1998; Zhang et al. 2002), and is the natural exponent. The data pairs used in this correlation had values in the range of 1.0–4.8 and the in-situ shear wave velocity measurements were made using a variety of techniques including seismic CPT, downhole tests, crosshole tests, and spectral analysis of surface waves (SASW).
Robertson (2009) developed a CPT- correlation based on 1035 data pairs from predominantly Holocene and Pleistocene-age general soil sites of the form:
[ ( ) ( ) ⁄ ]
(3)
where all of the terms are previously defined and it can be seen that the correlation is a function of and a dimensionless net cone resistance term. The normalized cone tip resistances, , for the data set ranged from 0.67–577 with a mean of 57, the friction ratios, (Robertson 1990), for the data set ranged from 0.15–13.13% with a mean of 3.13%, and the vertical effective stresses ranged from 19–580 kPa with a mean of 190 kPa. Information is not provided in Robertson (2009) on the techniques used to measure the in-situ at these sites; it is likely that various techniques were used for this purpose.
3 CANTERBURY SEISMIC CPT DATABASE
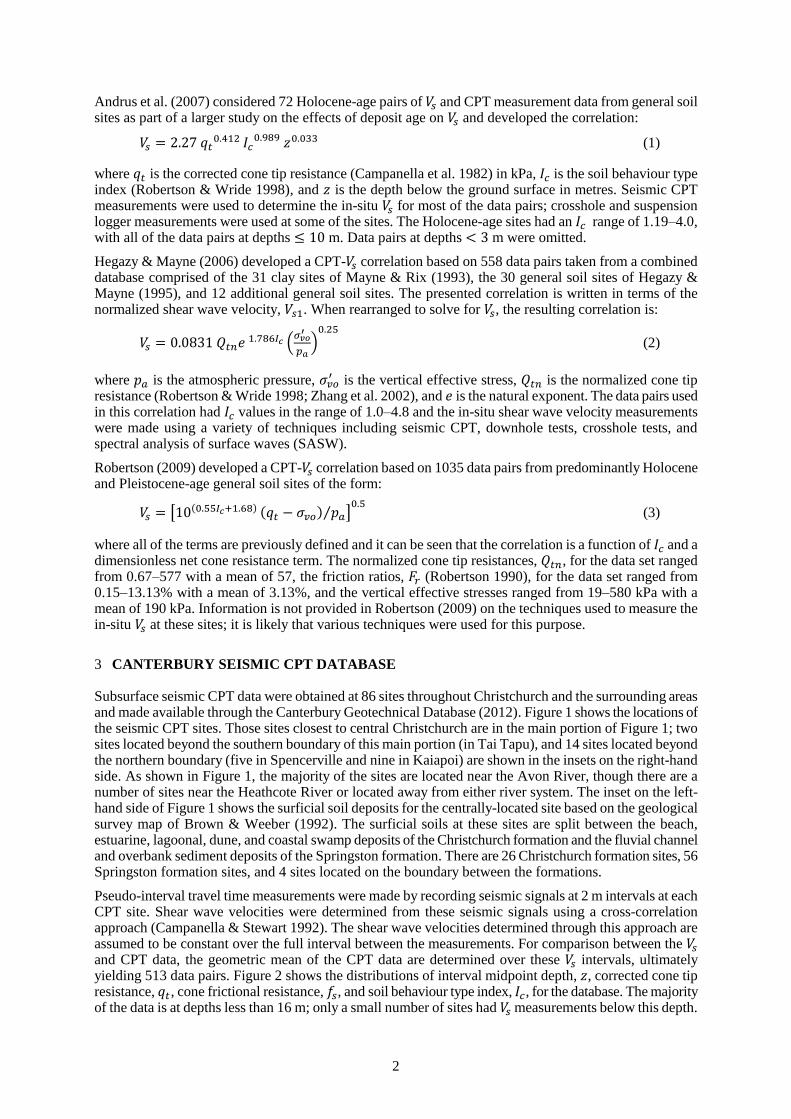
Subsurface seismic CPT data were obtained at 86 sites throughout Christchurch and the surrounding areas and made available through the Canterbury Geotechnical Database (2012). Figure 1 shows the locations of the seismic CPT sites. Those sites closest to central Christchurch are in the main portion of Figure 1; two sites located beyond the southern boundary of this main portion (in Tai Tapu), and 14 sites located beyond the northern boundary (five in Spencerville and nine in Kaiapoi) are shown in the insets on the right-hand side. As shown in Figure 1, the majority of the sites are located near the Avon River, though there are a number of sites near the Heathcote River or located away from either river system. The inset on the left-hand side of Figure 1 shows the surficial soil deposits for the centrally-located site based on the geological survey map of Brown & Weeber (1992). The surficial soils at these sites are split between the beach, estuarine, lagoonal, dune, and coastal swamp deposits of the Christchurch formation and the fluvial channel and overbank sediment deposits of the Springston formation. There are 26 Christchurch formation sites, 56 Springston formation sites, and 4 sites located on the boundary between the formations.
Pseudo-interval travel time measurements were made by recording seismic signals at 2 m intervals at each CPT site. Shear wave velocities were determined from these seismic signals using a cross-correlation approach (Campanella & Stewart 1992). The shear wave velocities determined through this approach are assumed to be constant over the full interval between the measurements. For comparison between the and CPT data, the geometric mean of the CPT data are determined over these intervals, ultimately yielding 513 data pairs. Figure 2 shows the distributions of interval midpoint depth, , corrected cone tip resistance, , cone frictional resistance, , and soil behaviour type index, , for the database. The majority of the data is at depths less than 16 m; only a small number of sites had measurements below this depth.
3
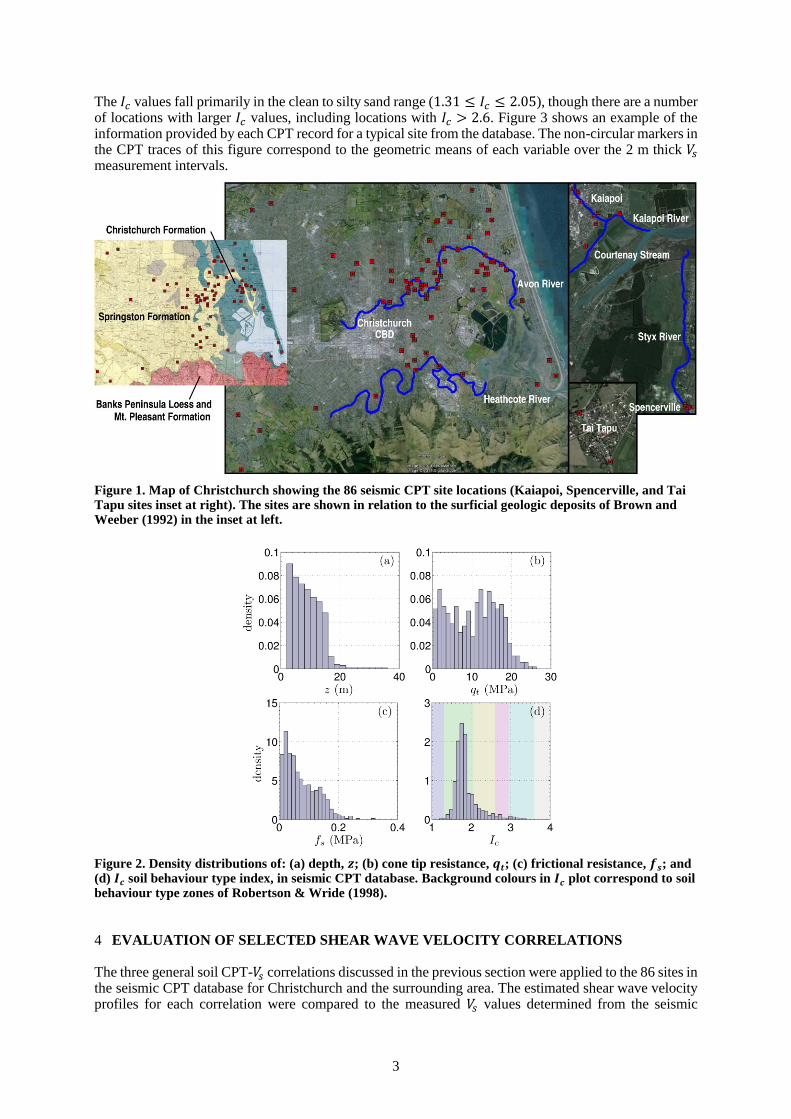
The values fall primarily in the clean to silty sand range ( ), though there are a number of locations with larger values, including locations with . Figure 3 shows an example of the information provided by each CPT record for a typical site from the database. The non-circular markers in the CPT traces of this figure correspond to the geometric means of each variable over the 2 m thick measurement intervals.
Figure 1. Map of Christchurch showing the 86 seismic CPT site locations (Kaiapoi, Spencerville, and Tai Tapu sites inset at right). The sites are shown in relation to the surficial geologic deposits of Brown and Weeber (1992) in the inset at left.
Figure 2. Density distributions of: (a) depth, ; (b) cone tip resistance, ; (c) frictional resistance, ; and (d) soil behaviour type index, in seismic CPT database. Background colours in plot correspond to soil behaviour type zones of Robertson & Wride (1998).
4 EVALUATION OF SELECTED SHEAR WAVE VELOCITY CORRELATIONS
The three general soil CPT- correlations discussed in the previous section were applied to the 86 sites in the seismic CPT database for Christchurch and the surrounding area. The estimated shear wave velocity profiles for each correlation were compared to the measured values determined from the seismic
4
soundings recorded at each site. Figure 3 includes an illustrative comparison between the estimated and measured profiles for a typical site from the database. As shown, the existing correlations tend to overestimate the measured values to varying degrees, though the essential form of the profile suggested by the measured values (an increase of with depth) appears to be captured reasonably well by all three correlations. The trend between the measured and estimated values for the site shown in Figure 3 is representative of the full database.
Figure 3. Example CPT sounding from seismic CPT database with comparison of measured and estimated profiles. Markers for the CPT data and estimated plots represent geometric mean over the 2 m thick measurement intervals.
In order to quantify the applicability of each existing correlation to Canterbury soil deposits, the shear wave velocity prediction bias is defined in terms of the ratio of the estimated value to the measured value at each data point, i.e.
( )
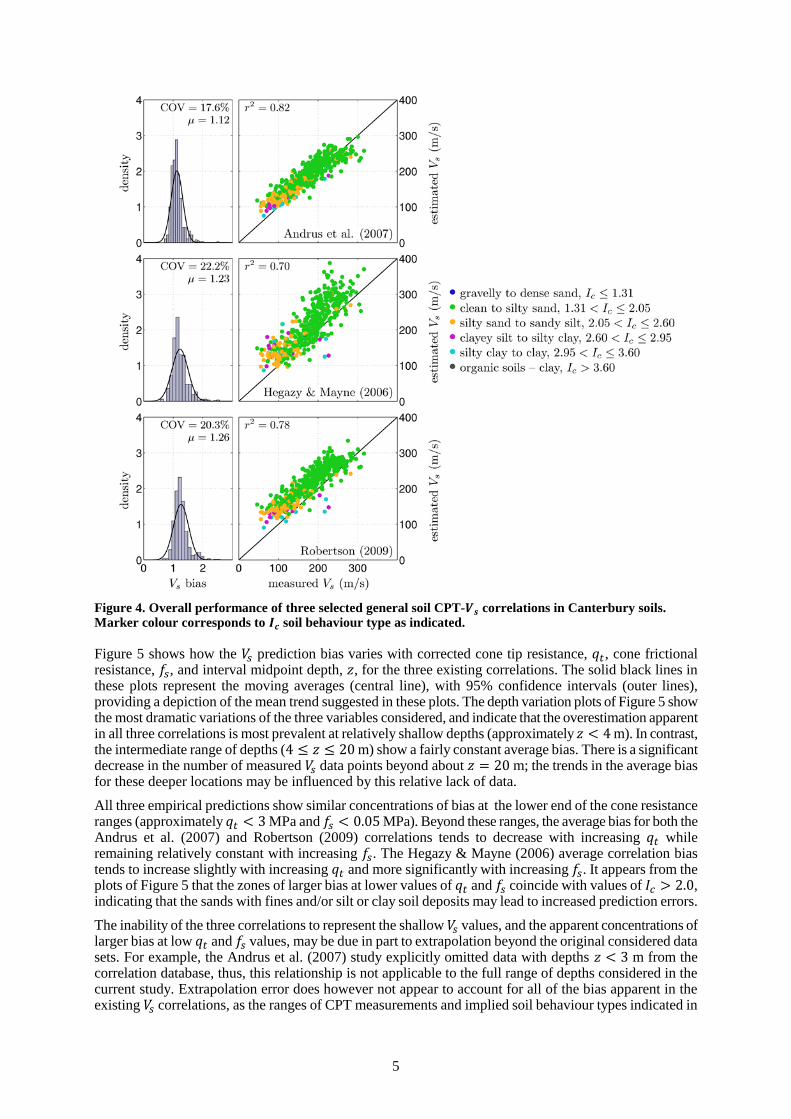
When defined in this manner, a bias larger than 1.0 represents an overestimation of the measured , and a bias less than 1.0 represents an underestimation. Figure 4 summarizes the general performance of the three considered shear wave velocity correlations for the Canterbury seismic CPT data set. The left-hand plots in Figure 4 show the distribution of the bias for each correlation and provide the mean, , and coefficient of variation, COV, of fitted normal distributions. The right-hand plots in Figure 4 compare the measured and estimated shear wave velocities and provide the coefficient of determination, , values for each case.
The Andrus et al. (2007) correlation appears to be most applicable to the current data set by all measures presented in Figure 4, though this correlation still overestimates the measured values on average. The mean bias for the Andrus et al. (2007) correlation, , is the closest to 1.0, the 17.6% COV of the bias is the smallest, and the coefficient of determination, , is the largest of the three cases. The Hegazy & Mayne (2006) correlation appears to be the least applicable to the Canterbury soils, with a mean bias , bias , and , this correlation displays the most spread of the three empirical models and most poorly represents the measured data set. The Robertson (2009) correlation returns a narrower range of estimated , but systematically overestimates the measured values, leading to the largest mean bias of .
While Figure 4 provides a useful summary of the performance of each correlation, it does not provide the means to evaluate how the predictions perform across the full range of CPT resistance variables present in the Canterbury data set. To further assess the applicability of the three selected shear wave velocity correlations to the soil deposits typical of the Canterbury region, it is of interest to evaluate how the bias varies with the depth, corrected cone tip resistance, frictional resistance, and the soil behaviour type index of each data pair. These terms were used by the previous researchers to correlate the CPT data to shear wave velocities, therefore, determining the ranges of these terms that display concentrations of high and low bias can aid in understanding why the correlations may or may not be applicable to the current soil deposits, and can help determine which of these terms are important to consider in a Canterbury-specific correlation.
5
Figure 4. Overall performance of three selected general soil CPT- correlations in Canterbury soils. Marker colour corresponds to soil behaviour type as indicated.
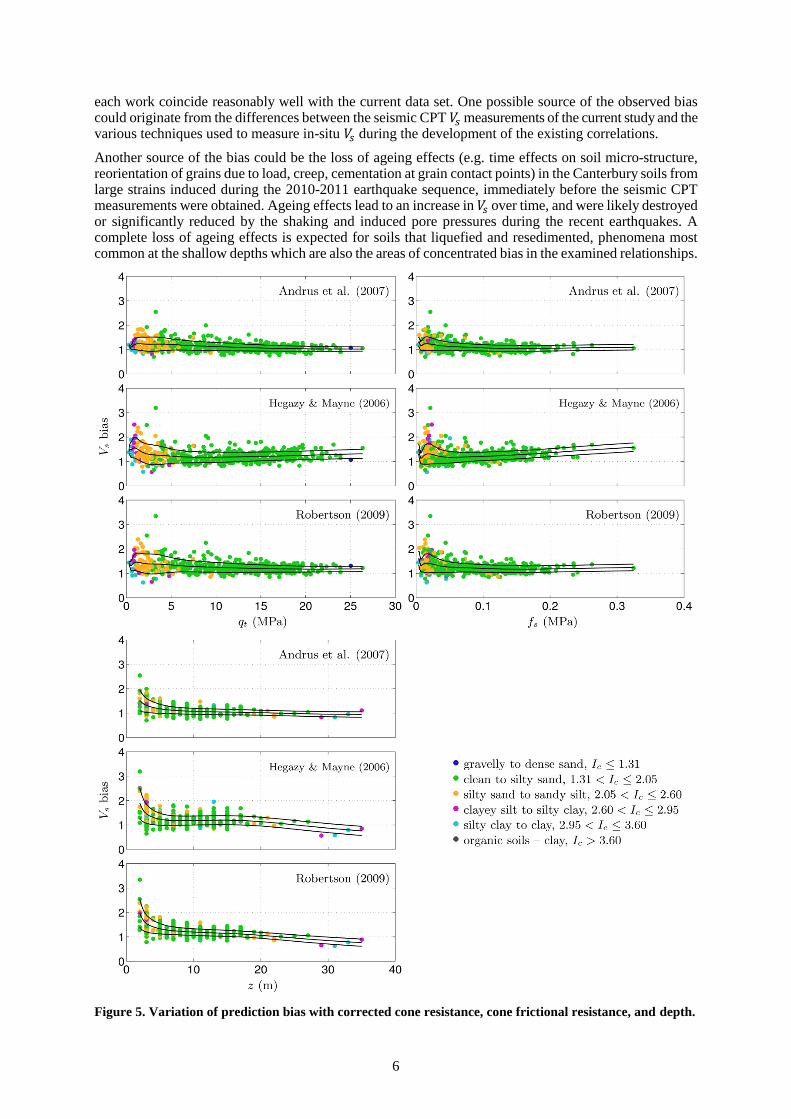
Figure 5 shows how the prediction bias varies with corrected cone tip resistance, , cone frictional resistance, , and interval midpoint depth, , for the three existing correlations. The solid black lines in these plots represent the moving averages (central line), with 95% confidence intervals (outer lines), providing a depiction of the mean trend suggested in these plots. The depth variation plots of Figure 5 show the most dramatic variations of the three variables considered, and indicate that the overestimation apparent in all three correlations is most prevalent at relatively shallow depths (approximately m). In contrast, the intermediate range of depths ( m) show a fairly constant average bias. There is a significant decrease in the number of measured data points beyond about m; the trends in the average bias for these deeper locations may be influenced by this relative lack of data.
All three empirical predictions show similar concentrations of bias at the lower end of the cone resistance ranges (approximately MPa and MPa). Beyond these ranges, the average bias for both the Andrus et al. (2007) and Robertson (2009) correlations tends to decrease with increasing while remaining relatively constant with increasing . The Hegazy & Mayne (2006) average correlation bias tends to increase slightly with increasing and more significantly with increasing . It appears from the plots of Figure 5 that the zones of larger bias at lower values of and coincide with values of , indicating that the sands with fines and/or silt or clay soil deposits may lead to increased prediction errors.
The inability of the three correlations to represent the shallow values, and the apparent concentrations of larger bias at low and values, may be due in part to extrapolation beyond the original considered data sets. For example, the Andrus et al. (2007) study explicitly omitted data with depths m from the correlation database, thus, this relationship is not applicable to the full range of depths considered in the current study. Extrapolation error does however not appear to account for all of the bias apparent in the existing correlations, as the ranges of CPT measurements and implied soil behaviour types indicated in
6
each work coincide reasonably well with the current data set. One possible source of the observed bias could originate from the differences between the seismic CPT measurements of the current study and the various techniques used to measure in-situ during the development of the existing correlations.
Another source of the bias could be the loss of ageing effects (e.g. time effects on soil micro-structure, reorientation of grains due to load, creep, cementation at grain contact points) in the Canterbury soils from large strains induced during the 2010-2011 earthquake sequence, immediately before the seismic CPT measurements were obtained. Ageing effects lead to an increase in over time, and were likely destroyed or significantly reduced by the shaking and induced pore pressures during the recent earthquakes. A complete loss of ageing effects is expected for soils that liquefied and resedimented, phenomena most common at the shallow depths which are also the areas of concentrated bias in the examined relationships.
Figure 5. Variation of prediction bias with corrected cone resistance, cone frictional resistance, and depth.
7
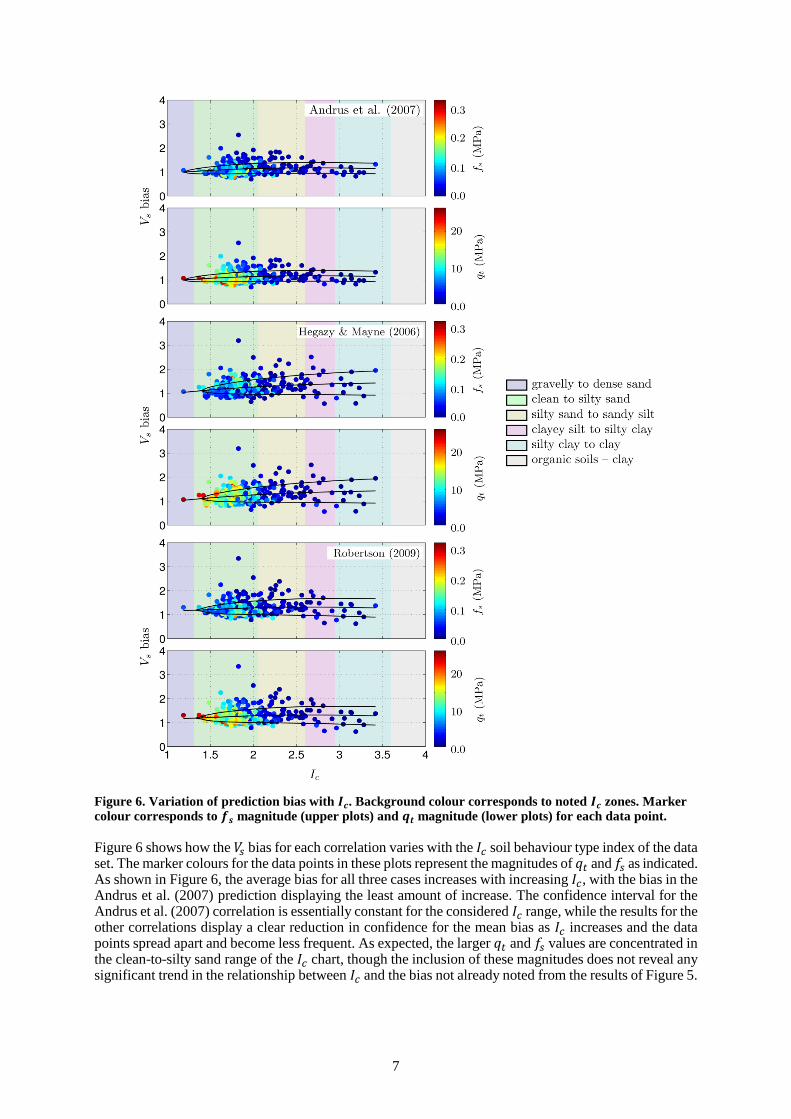
Figure 6. Variation of prediction bias with . Background colour corresponds to noted zones. Marker colour corresponds to magnitude (upper plots) and magnitude (lower plots) for each data point.
Figure 6 shows how the bias for each correlation varies with the soil behaviour type index of the data set. The marker colours for the data points in these plots represent the magnitudes of and as indicated. As shown in Figure 6, the average bias for all three cases increases with increasing , with the bias in the Andrus et al. (2007) prediction displaying the least amount of increase. The confidence interval for the Andrus et al. (2007) correlation is essentially constant for the considered range, while the results for the other correlations display a clear reduction in confidence for the mean bias as increases and the data points spread apart and become less frequent. As expected, the larger and values are concentrated in the clean-to-silty sand range of the chart, though the inclusion of these magnitudes does not reveal any significant trend in the relationship between and the bias not already noted from the results of Figure 5.
8
5 CONCLUSIONS
A large Canterbury-specific seismic CPT data set was compiled and utilized to assess the suitability of three existing CPT- correlations for describing the relationship between CPT data and in-situ shear wave velocity for soil deposits in Christchurch and the surrounding areas. It was determined that all three correlations produce biased estimates when applied to the CPT soundings of the database, with each existing correlation tending to overestimate the in-situ to varying degrees. The correlation of Andrus et al. (2007) was found to be the most applicable to the soils of the Canterbury region, displaying the smallest degree of overestimation (12% on average) and the best representation of the current data. These findings suggest that the development of a Canterbury-specific correlation will be beneficial to future research efforts and provide evidence supporting the Andrus et al. (2007) functional form, or something similar, for this purpose. Further studies for developing a Christchurch-specific CPT- relationship are underway.
6 ACKNOWLEDGEMENTS
Funding for this work was provided by the New Zealand Earthquake Commission (EQC) and the Natural Hazards Research Platform (NHRP). The authors would also like to thank the Canterbury Geotechnical Database and Perry Drilling Ltd. for providing data used in this study.
REFERENCES
Andrus, R.D., Mohanan, N.P., Piratheepan, P., Ellis, B.S., & Holzer, T.L. 2007. Predicting shear-wave velocity from cone penetration resistance. Proc. 4
th International Conference on Earthquake Geotechnical Engineering,
Thessaloniki, Greece, June 25-28, Paper No. 1454.
Baldi, G., Belloti, R., Ghionna, V.N., Jamiolkowski, M., & Lo Presti D.C.F. 1989. Modulus of sands from CPTs and DMTs. Proc. 12
th International Conference on Soil Mechanics and Foundation Engineering, Vol. 1, Rio de
Janeiro, 165–170.
Brown, L.J. & Weeber, J.H. 1992. Geology of the Christchurch urban area. Institute of Geological and Nuclear Sciences Ltd., Lower Hutt, New Zealand.
Canterbury Geotechnical Database 2012. https://canterburygeotechnicaldatabase.projectorbit.com
Campanella, R.G., Gillespie, D. & Robertson, P.K. 1982. Pore pressures during cone penetration testing. Proc. 2nd
European Symposium on Penetration Testing, ESPOT II, Amsterdam, May 24-27, 507-512.
Campanella, R.G. & Stewart, W.P. 1992. Seismic cone analysis using digital signal processing for dynamic site characterization. Canadian Geotechnical Journal, Vol 29(3): 477–486.
Hegazy, Y.A. & Mayne, P.W. 1995. Statistical correlations between Vs and cone penetration data for different soil types. Proc. CPT ’95, Vol. 2, Swedish Geotechnical Society, Linköping, Sweden, 173–178.
Hegazy, Y.A. & Mayne, P.W. 2006. A global statistical correlation between shear wave velocity and cone penetration data. Proc. GeoShanghai, Site and Geomaterial Characterization (GSP 149), ASCE, Reston, VA, 243–248.
Mayne, P.W. & Rix, G.J. 1993. – relationships for clays. Geotechnical Testing Journal, Vol 16(1): 54–60.
Robertson, P.K. 1990. Soil classification using the cone penetration test. Canadian Geotechnical Journal, Vol 27(1): 151–158.
Robertson, P.K. 2009. Interpretation of cone penetration tests – a unified approach. Canadian Geotechnical Journal, Vol 46(11): 1337–1355.
Robertson, P.K., Campanella, R.G., Gillespie, D., & Rice, A. 1986. Seismic CPT to measure in-situ shear wave velocity. Journal of Geotechnical Engineering, ASCE, Vol 112(8): 791–804.
Robertson, P.K. & Wride, C.E. 1998. Evaluating cyclic liquefaction potential using the cone penetration test. Canadian Geotechnical Journal, Vol 35(3): 442–459.
Sykora, D.E. & Stokoe K.H., II. 1983. Correlations of In-situ Measurements in Sands and Shear Wave Velocity. Geotechnical Engineering Report GR83-33, The University of Texas at Austin, Austin, TX.
Wair, B.R., DeJong, J.T., & Shantz, T. 2012. Guidelines for Estimation of Shear Wave Velocity Profiles. PEER Report No. 2012/08, Pacific Earthquake Engineering Research Center, University of California, Berkeley.
Zhang, G., Robertson, P.K., & Brachman, R.W.I. 2002. Estimating liquefaction-induced ground settlements from CPT for level ground. Canadian Geotechnical Journal, Vol 39(5): 1168–1180.