comparison of experiments and calculations of void ... · comparison of experiments and...
TRANSCRIPT

PHYSOR 2010 - Advances in Reactor Physics to Power the Nuclear RenaissancePittsburgh, Pennsylvania, USA, May 9-14, 2010, on CD-ROM, American Nuclear Society, LaGrange Park, IL (2010)
Comparison of Experiments and Calculations of Void Fraction Distributionsin Randomly Stacked Pebble Beds
G. J. Auwerda, J. L. Kloosterman, A. J. M. Winkelman, J. Groen, V. van DijkDelft University of Technology
Department of Radiation, Radionuclides and ReactorsPhysics of Nuclear Reactors
Mekelweg 15, 2629 JB Delft, [email protected]; [email protected]
ABSTRACT
In pebble bed reactors the fuel forms a randomly stacked pebble bed with non-uniform fueldensities, affecting neutronics (streaming) and thermodynamics (wall channeling). To investigatethese effects, computational tools are needed capable of generating realistic pebble beds, andexperimental results to validate these tools. Using gamma-ray scanning the absoluteε0 and radialvoid fraction profileεr(r) of a randomly stacked pebble bed was measured. Results were used tovalidate three different methods: Discrete Elements Method (DEM), Monte Carlo (MC) rejectionmethod, and expanding system method. The bed consisted of 5457 acrylic pebbles with a diameterd = 12.7 mm in an acrylic cylinder with diameterD = 229 mm (D/d = 18.0), and had an averagevoid fractionε0 = 0.395. The radial void fraction profile showed large, dampened oscillations nearthe wall extending up to five pebble diameters into the pebble bed, with a minimum void fraction of0.22 half a pebble diameter away from the wall. The MC rejection method resulted in aε0 muchhigher than measured, and could not reproduce well the oscillations inεr observed in theexperiment. Both the DEM and expanding system method showed excellent agreement with theexperiment for bothε0 andεr, with the expanding system method having the benefit of creatingpebble beds with no overlapping pebbles, suitable for exact pebble bed models in other codes.
Key Words:Pebble bed, void fraction, HTR, DEM
1. INTRODUCTION
In pebble bed type HTR’s the fuel is contained within graphite pebbles, which form a randomlypacked bed inside a graphite-walled cylindrical cavity. As a result there is no a priori knowledgeof the exact location of the pebbles, and thus of the fuel. It has been shown that such a randomdistribution will exhibit non-uniform fuel densities, especially near the reflector wall [1]. Theeffect of the non-uniform pebble distribution can be significant for both neutronics, due to neutronstreaming for example [2], as well as thermodynamics, for example due to the wall channelingeffect of the coolant flow [3]. To facilitate research on these effects, computational tools capableof generating randomly stacked beds of hard spheres are needed, and experimental results tovalidate these tools.
Over the years several experiments have been performed to measure void fractions in packedbeds. Benenati and Brosilow [4] poored uniformly sized spherical lead shot into a container andthen filled up the interstices with a liquid epoxy resin. Upon curing of the resin, the solid cylinderwas machined in stages to successively smaller diameters and the weight and diameter of thecylinder was measured after each machining. In this manner the mean density of each annular
G. J. Auwerda, J. L. Kloosterman, A. J. M. Winkelman, J. Groen, V. van Dijk
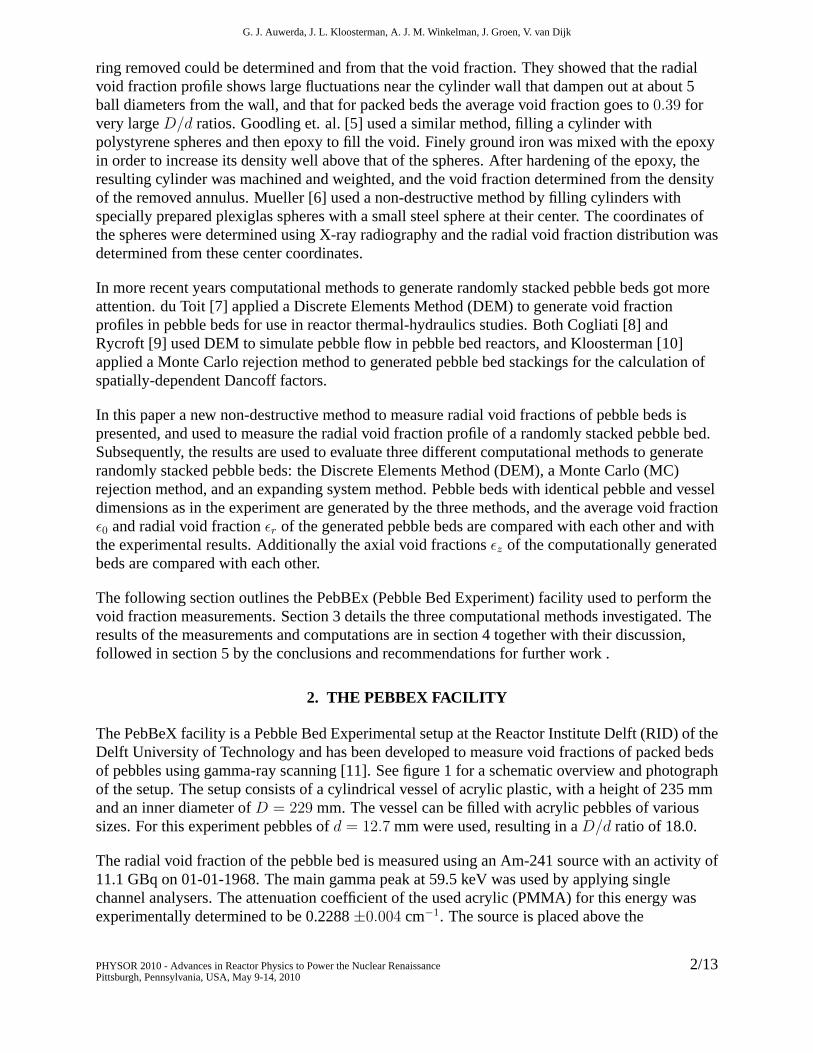
ring removed could be determined and from that the void fraction. They showed that the radialvoid fraction profile shows large fluctuations near the cylinder wall that dampen out at about 5ball diameters from the wall, and that for packed beds the average void fraction goes to0.39 forvery largeD/d ratios. Goodling et. al. [5] used a similar method, filling a cylinder withpolystyrene spheres and then epoxy to fill the void. Finely ground iron was mixed with the epoxyin order to increase its density well above that of the spheres. After hardening of the epoxy, theresulting cylinder was machined and weighted, and the void fraction determined from the densityof the removed annulus. Mueller [6] used a non-destructive method by filling cylinders withspecially prepared plexiglas spheres with a small steel sphere at their center. The coordinates ofthe spheres were determined using X-ray radiography and the radial void fraction distribution wasdetermined from these center coordinates.
In more recent years computational methods to generate randomly stacked pebble beds got moreattention. du Toit [7] applied a Discrete Elements Method (DEM) to generate void fractionprofiles in pebble beds for use in reactor thermal-hydraulics studies. Both Cogliati [8] andRycroft [9] used DEM to simulate pebble flow in pebble bed reactors, and Kloosterman [10]applied a Monte Carlo rejection method to generated pebble bed stackings for the calculation ofspatially-dependent Dancoff factors.
In this paper a new non-destructive method to measure radial void fractions of pebble beds ispresented, and used to measure the radial void fraction profile of a randomly stacked pebble bed.Subsequently, the results are used to evaluate three different computational methods to generaterandomly stacked pebble beds: the Discrete Elements Method (DEM), a Monte Carlo (MC)rejection method, and an expanding system method. Pebble beds with identical pebble and vesseldimensions as in the experiment are generated by the three methods, and the average void fractionε0 and radial void fractionεr of the generated pebble beds are compared with each other and withthe experimental results. Additionally the axial void fractionsεz of the computationally generatedbeds are compared with each other.
The following section outlines the PebBEx (Pebble Bed Experiment) facility used to perform thevoid fraction measurements. Section 3 details the three computational methods investigated. Theresults of the measurements and computations are in section 4 together with their discussion,followed in section 5 by the conclusions and recommendations for further work .
2. THE PEBBEX FACILITY
The PebBeX facility is a Pebble Bed Experimental setup at the Reactor Institute Delft (RID) of theDelft University of Technology and has been developed to measure void fractions of packed bedsof pebbles using gamma-ray scanning [11]. See figure 1 for a schematic overview and photographof the setup. The setup consists of a cylindrical vessel of acrylic plastic, with a height of 235 mmand an inner diameter ofD = 229 mm. The vessel can be filled with acrylic pebbles of varioussizes. For this experiment pebbles ofd = 12.7 mm were used, resulting in aD/d ratio of 18.0.
The radial void fraction of the pebble bed is measured using an Am-241 source with an activity of11.1 GBq on 01-01-1968. The main gamma peak at 59.5 keV was used by applying singlechannel analysers. The attenuation coefficient of the used acrylic (PMMA) for this energy wasexperimentally determined to be 0.2288±0.004 cm−1. The source is placed above the
PHYSOR 2010 - Advances in Reactor Physics to Power the Nuclear RenaissancePittsburgh, Pennsylvania, USA, May 9-14, 2010
2/13

Comparison of Experiments and Calculations of Void Fractions in Pebble Beds
experiment, followed by a collimator with a diameter of 1 mm, creating a narrow beamdownwards through the pebble bed. Below the pebble bed the intensity of the beam is measuredusing a NaI(TI) scintillation detector, topped by a second collimator. From the measured intensityof the beam the amount of acrylic in the path of the gamma beam can be calculated. The vesselitself can be rotated and moved sideways using two motors. By measuring the void fraction whilerotating the vessel the (average) radial void fraction at a certain distance from the wall can bemeasured. Moving the vessel sideways in between the radial void fraction measurements in smallsteps allows measuring the void fraction at various radial positions.
Source
Collimator
Detector
Translational movement
Rotational movement
Gamma beam
Collimator
Figure 1. Schematic overview and photograph of the PebBEx facility.
To fill the vessel, pebbles were quickly poured in until it was filled almost to the top, after whichthe last pebbles were carefully placed at the top. To make sure the pebble bed height was asuniform as possible a plate was slowly pushed over the top of the pebble bed. The surplus ofspheres which could not find a place were removed from the pebble bed. Care was taken to keepthe pressure at a minimum to maintain a pebble bed stacking with a free upper surface. Filling thecylinder in this way required 5457±10 pebbles [12].
3. COMPUTATIONAL METHODS
The literature on the computational generation of randomly packed pebble beds can be divided intwo approaches. One approach is to use rigorous algorithms that simulate pebble flow asaccurately as possible based on physics laws [7, 13, 14]. The other approach is based on synthetictechniques [14–16], such as a rain model in which a pebble is randomly dropped in the vesseluntil it reaches another pebble, after which a Monte Carlo shaking routine is used to increase thepacking fraction of the bed, or a method in which pebbles are randomly extracted from a regularlypacked bed. The first approach is expected to give realistic packing fractions and porosityprofiles, while the second is not. However, in the second category of methods overlap of pebbles
PHYSOR 2010 - Advances in Reactor Physics to Power the Nuclear RenaissancePittsburgh, Pennsylvania, USA, May 9-14, 2010
3/13

G. J. Auwerda, J. L. Kloosterman, A. J. M. Winkelman, J. Groen, V. van Dijk
is easily avoided, whereas for the rigorous methods this is much more difficult. For example, in apacked bed of 5-cm pebbles within a nuclear reactor, it is reported [7] that the average overlap forthe rigorous method is 1%, with a maximum of 20%.
To computationally generate randomly stacked pebble beds, three simulation methods wereinvestigated. The first method, the Discrete Elements Method (DEM), is a rigorous method. Theother two methods, a Monte Carlo rejection method, and an expanding system method in whichthe pebble size was increased in several steps, are synthetic methods.
3.1. Discrete Elements Method
The Discrete Elements Method (DEM) is a family of numerical methods for computing themotion of a large number of particles like molecules or grains of sand. It consists essentially ofintegrating the equations of motion of the system numerically. The fundamental assumption ofthe method is that the material consists of discrete particles whose trajectories are studiedseparately. At each time step all the forces working on each particle are calculated, from whichthe resulting acceleration of each particles is calculated using Newton’s second law, which is thentime-integrated to find the new particle positions. This process is repeated until the end of thesimulation time is reached.
The DEM code used in the current work was written by Abreu [17]. The model takes into accountrotational and translational motions of the particles and uses the gravitational force on theparticles as well as inter-pebble and pebble-wall contact forces to simulate particle motion.Friction is taken into account through Coulomb’s law, using coefficients of friction forpebble-pebble and pebble-wall interactions. The magnitude of the forces pebbles exert on eachother depends on their relative velocities and the amount of overlap they have. The magnitude ofthe normal force between particles in contact depends on the amount of overlap through aspring-like force based on the stiffness of the particles. The energy dissipated during collisions istaken into account by means of normal and tangential coefficients of restitution. After calculatingthe resulting accelerations, using the initial speed and acceleration of the particles, the equationsof motion are solved using the Adams-Bashforth-Moulton predictor-corrector model.
3.2. Monte Carlo Rejection Method
The Monte Carlo Rejection Method used by Kloosterman [10] is a synthetic technique forcreating a pebble bed. First a large collection of random points is generated, up to 100,000 timesthe number of pebbles that fit into the vessel. Then, starting at the bottom of the vessel, eachrandom point is checked as to whether it is suitable as a pebble center coordinate. If a pebble atthat coordinate would overlap with other pebbles or structures in the core, it is rejected; otherwiseit is accepted, and a pebble is located at that position. Besides some problems that need to beavoided, such as integer overflows, this algorithm is extremely simple to program. Furthermore,overlap of pebbles is easily avoided, whereas for the rigorous methods this is much more difficult.However, as may be expected from the discussion above, no physics are simulated in the model,and the resultant pebble-bed packing does not necessarily reflect all characteristics of a realpacked bed.
PHYSOR 2010 - Advances in Reactor Physics to Power the Nuclear RenaissancePittsburgh, Pennsylvania, USA, May 9-14, 2010
4/13
Comparison of Experiments and Calculations of Void Fractions in Pebble Beds
3.3. Expanding System Code
The third method is based on a method described by Mrafko [18] to generate a random closepacking of hard spheres. After randomly generating the initial coordinates of the pebbles, thepebble radius is increased inN steps to its desired radiusRpeb, while in each step the algorithmeliminates overlap among the spheres by moving them apart.
In the initialization step the pebble coordinates of theNpeb pebbles are generated randomly insidethe cylinder containing the pebble bed, disregarding overlap. The volume in which the pebblesare initialized has a diameter equal to that of the cylinder, and is located at its bottom, but theheight is chosen such that the volume in which the pebbles are initialized is equal to that of theNpeb pebbles at their initial radiusRini.
The pebble radius is increased inN steps from its initial valueRini to the desired final pebbleradiusRpeb. The initial radiusRini is typically chosen to be2
3of Rpeb. The pebble radius is
increased in ever smaller steps to increase the sensitivity of the method in each step, following alogarithmic interpolation between initial and final radius
Ri = Rini + (Rpeb −Rini) log(1 + 9i− 1
N − 1) (1)
with Ri the pebble radius in stepi.
In each step overlaps between pebbles are removed by moving the pebbles apart. A loop is runover all pebbles, and for each pebble it is checked if it overlaps with a wall or the closestneighboring pebble. If the pebble intersects with a wall it is moved perpendicular to the wall untilit touches the wall. If the pebble intersects with its nearest neighbor, both pebbles are moved anequal distance apart along their line of intersection, until they are touching. When moving thepebbles it is allowed to create new overlaps. If there are no more overlaps, the loop is exited andthe pebble radius can be increased again, starting the next iteration.
4. RESULTS AND DISCUSSION
As was mentioned in section 2, the PebBEx facility was filled using 5457±10 pebbles up to itsfull height of 235 mm, with a flattened horizontal top surface of the pebble bed.
The DEM code would normally create a pebble bed by letting the pebbles fall by gravity on top ofeach other. This would create an irregular upper surface with possibly a little ’bump’ in themiddle. To generate a flat upper surface of the pebble bed, additional pebbles were simulated, andafter calculations were finished all pebbles (partly) above 235 mm were removed. In the DEMcalculation 5700 pebbles were simulated for a total simulation time of 25 seconds. The density ofthe pebbles was set to1.19 g/cm3, the density of acrylic. The coefficient of friction for acrylic wasnot exactly known, and a value of0.3 was chosen for the normal and tangential coefficients offriction based on values for polyethylene and polystyrene of0.2 and0.5 [19]. Although the valueof the coefficients of friction can have an effect on the void fraction, this effect is small, up to0.01, as was show by Webbe [20]. No significant effect on the packing fraction was observed forthe normal and tangential coefficient of restitution. However, they do influence calculation times,as they are the only way of energy to leak away from the system. A lower coefficient of restitution
PHYSOR 2010 - Advances in Reactor Physics to Power the Nuclear RenaissancePittsburgh, Pennsylvania, USA, May 9-14, 2010
5/13
G. J. Auwerda, J. L. Kloosterman, A. J. M. Winkelman, J. Groen, V. van Dijk
will result in faster dampening of the system, thus reducing the time that has to be simulatedbefore the pebbles stop moving. A value of0.5 was taken for the coefficients of restitution. Arealistic value for the stiffness of the acrylic pebbles would be of the order of107 N/m. However,this would lead to extremely long computation times, as the time step of the DEM simulation isdirectly proportional to the stiffness of the materials. Also, when the stiffness is set to values of105 and above, the probability of the simulations becoming unstable increases, leading to pebblesmoving through walls or shooting away. Thus the stiffness was set to a relatively low value of104
N/m.
As there is no gravity in the expanding system model, the ’pressure’ of the pebbles near the top ofthe cylinder on those below have to take on this role. To make sure the upper part of the pebblebed is still well packed and does not contain any ’floating’ pebbles balancing on only one or twoother pebbles, a significant amount of extra pebbles have to be simulated to interact downwards.In the expanding system model 8500 pebbles were simulated forN = 5 number of steps. Just aswith the DEM code, all pebbles not completely below 235 mm were removed.
The MC rejection method always puts the pebbles at the lowest available point, so no tricks withextra pebbles were needed. The simulation terminated as soon as no more points were availablebelow 228.65 mm (235 minus the pebble radius). The simulation was run with a density for therandom points of 50,000 points per cm3.
4.1. Average Void Fractionε0
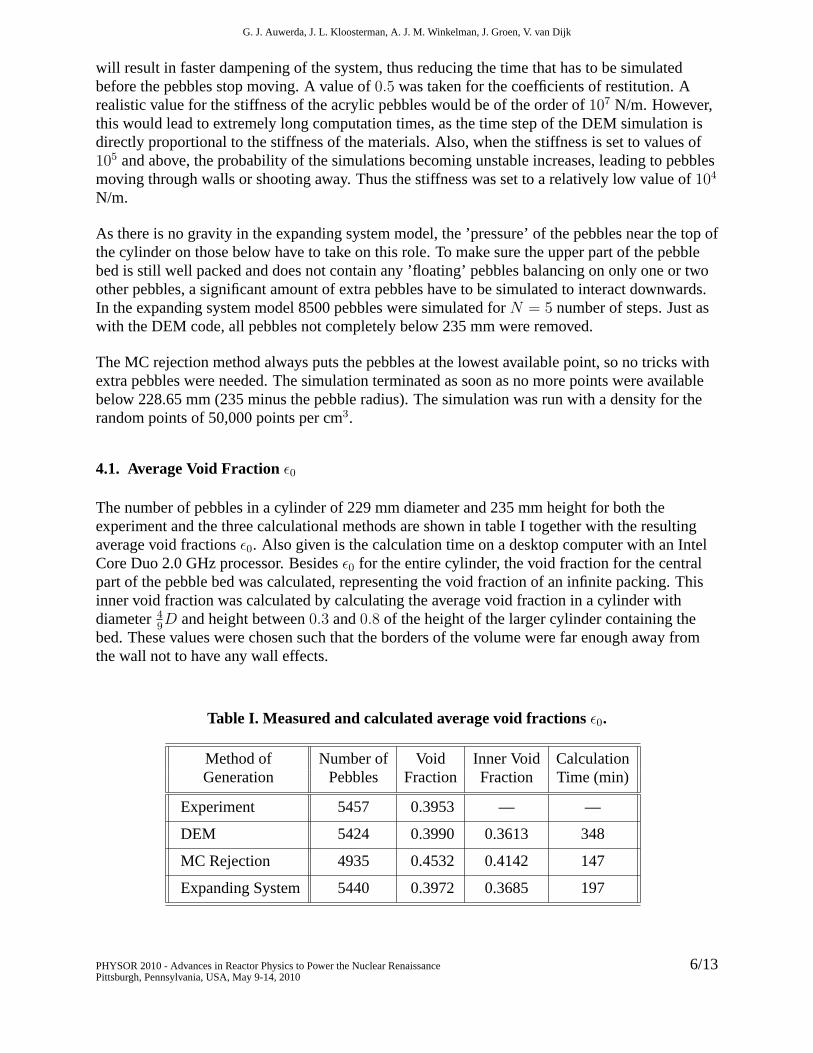
The number of pebbles in a cylinder of 229 mm diameter and 235 mm height for both theexperiment and the three calculational methods are shown in table I together with the resultingaverage void fractionsε0. Also given is the calculation time on a desktop computer with an IntelCore Duo 2.0 GHz processor. Besidesε0 for the entire cylinder, the void fraction for the centralpart of the pebble bed was calculated, representing the void fraction of an infinite packing. Thisinner void fraction was calculated by calculating the average void fraction in a cylinder withdiameter4
9D and height between0.3 and0.8 of the height of the larger cylinder containing the
bed. These values were chosen such that the borders of the volume were far enough away fromthe wall not to have any wall effects.
Table I. Measured and calculated average void fractionsε0.
Method of Number of Void Inner Void CalculationGeneration Pebbles Fraction Fraction Time (min)
Experiment 5457 0.3953 — —
DEM 5424 0.3990 0.3613 348
MC Rejection 4935 0.4532 0.4142 147
Expanding System 5440 0.3972 0.3685 197
PHYSOR 2010 - Advances in Reactor Physics to Power the Nuclear RenaissancePittsburgh, Pennsylvania, USA, May 9-14, 2010
6/13

Comparison of Experiments and Calculations of Void Fractions in Pebble Beds
The experimental void fraction for the PebBEx setup isε0 = 0.3953 ±0.11, which is in excellentagreement with other experimental results. Benenati [4] found forD/d = 14.1 an average voidfraction ofε0 = 0.395 and for the HTR-10 pebble bed reactor with aD/d ratio of 30 an averagevoid fraction ofε0 = 0.391 is reported [21].
The MC rejection method generated a pebble bed with a void fraction over 10% larger than theexperimental value. Generating the random points for placement of the pebbles at a higherdensity did not result in a significantly higher packing fraction,ε0 = 0.4499 for 300, 000 pointsper cm3, but did increase the calculation time to 807 minutes. Both the DEM and the expandingsystem method generated pebble beds with void fractions in good agreement with theexperimental value. One should consider however, that these packing fractions are for a stackingwith exactly touching pebbles in the expanding system method, while the stacking generated byDEM did include overlaps of the pebbles. On average the overlap of the pebbles with the walls oreach other was∼ 1% of the pebble radius, with a maximum overlap of 0.12 mm on a pebbleradius of 6.35 mm. This overlap could be reduced by increasing the stiffness of the pebbles in theinput, but this causes a large increase in computation time. The presence of these overlaps notonly causes an artificial decrease in void fraction, it also results in problems in using DEMcreated stackings to generate exact models of pebble beds for other computer simulations, such asMonte Carlo type neutronics calculations, due to multiple defined volumes.
The inner void fraction is a representation of the void fraction for an infinite randomly stackedpebble bed without boundary effects. Scott [22] found for the void fraction of an infinite randomlystacked pebble bed a value of0.3634 by extrapolating experimental results. Comparing this valuewith those in table I, we see excellent agreement with the inner void fractions for the DEM andExpanding System method. Again the MC Rejection method shows a larger void fraction,although the difference is slightly smaller than for the average void fraction of the entire cylinder.
Calculation times were of comparable order for all three methods, with the DEM method roughlytwice as slow as the other two methods. For the generation of larger pebble beds, calculationtimes for the MC rejection method scale linearly with the number of pebbles. For DEMcalculations the increase in calculation time is slightly higher than linear, but still far fromquadratic, due to the fact that only immediate neighbors interact with each other, and the usage ofa neighboring list [8]. The expanding system method however scales quadratic with the numberof pebbles, because overlaps near the bottom of the pebble bed have to propagate through theentire bed before being removed from the system. Thus the number of overlaps that have to beremoved in each step until no more overlaps remain increases quadratically with the size of thepebble bed, making the expanding system method unsuitable for the generation of pebble beds oflarge reactors with hundreds of thousands of pebbles.
4.2. Radial Void Fraction εr
The radial void fractionεr(r) of the PebBeX setup was measured in steps of 0.5 mm. At eachposition the vessel was rotated two to four times during the measurement. The number ofrotations depended on the count rate at the detector, with count rates ranging from3.1 counts persecond half a pebble diameter from the wall to8 cps just next to the wall. At low count rates,measurement times were increased to make sure the uncertainty was kept uniform, and thus thevessel was rotated more often. Measurements were corrected for background, with a background
PHYSOR 2010 - Advances in Reactor Physics to Power the Nuclear RenaissancePittsburgh, Pennsylvania, USA, May 9-14, 2010
7/13

G. J. Auwerda, J. L. Kloosterman, A. J. M. Winkelman, J. Groen, V. van Dijk
of 2.51± 0.02 cps. As calibration measurements for the empty and full cylinder measurementsoutside the cylinder for a void fraction ofεr = 1 and through the wall of the vessel for a voidfraction ofεr = 0 were used. The final uncertainty in the measurements of the void fraction ateach point was between 0.5% and 3%, depending on the local count rate, with higher uncertaintyat positions with a lower void fraction. Due to the width of the gamma beam, locating the exactposition and boundaries of the cylinder wall from the measured results is difficult. Instead, thecenter of the pebble bed was located by continuing measuring the void fraction profile afterreaching the center of the pebble bed, and mirroring the profile at the center. The center waschosen at the point for which the mirrored measurements had the highest correlation with themeasurements just before the center. The measuredεr(r) profile including uncertainty bars isplotted in figure 2. The uncertainty in the distance from the wall is negligible due to the highprecision of the step motor used to move the cylinder.
0 1 2 3 4 5 6 7 8 90
0.1
0.2
0.3
0.4
0.5
0.6
0.7
0.8
0.9
1
Distance From Wall (Pebble Diameters)
Rad
ial V
oid
Frac
tion
ε r(r)
Void Fraction Measurements
Figure 2. Measured radial void fraction profile εr(r) with uncertainty bars.
Although the uncertainty per point is significant, the oscillating behavior ofε0r is very clear dueto the large number of measuring points. The oscillations are quite large near the wall, with aminimum void fraction of 0.22 half a pebble diameter from the wall. The oscillations dampen outfurther away from the wall and disappear at about 5 pebble diameters from the wall, just as wasobserved in previous experiments [4–6]. At the wall one would expect the void fraction to go tounity, instead a slight drop is observed in the measurements less than 0.5 mm away from the wall.This is caused by the finite width of the gamma beam used to measure the void fraction, createdby the 1 mm wide collimator. Near the wall, part of the beam will go through the wall itself,causing additional attenuation and a lower measured void fraction. At the other end of themeasured range, at the center, a drop in void fraction can be observed. This is caused by thestochastic nature of the experiment itself. Near the center of the pebble bed, the path length overwhich the void fraction is measured becomes very small, and thusεr is measured over a small
PHYSOR 2010 - Advances in Reactor Physics to Power the Nuclear RenaissancePittsburgh, Pennsylvania, USA, May 9-14, 2010
8/13
Comparison of Experiments and Calculations of Void Fractions in Pebble Beds
surface. Thus the measurements approach that of a local point, causing larger fluctuations due tolocal variations in void fraction in the pebble bed. Other measurements showed a slight rise invoid fraction, or any other form of irregular behavior near the center of the pebble bed. Averagingthe void fraction near the center over multiple experiments using different realizations of thepebble bed would result in a smooth behavior ofεr.
0 1 2 3 4 5 6 7 8 90
0.1
0.2
0.3
0.4
0.5
0.6
0.7
0.8
0.9
1
Distance From Wall (Pebble Diameters)
Rad
ial V
oid
Frac
tion
ε r(r)
ExperimentDEMMC RejectionExpanding System
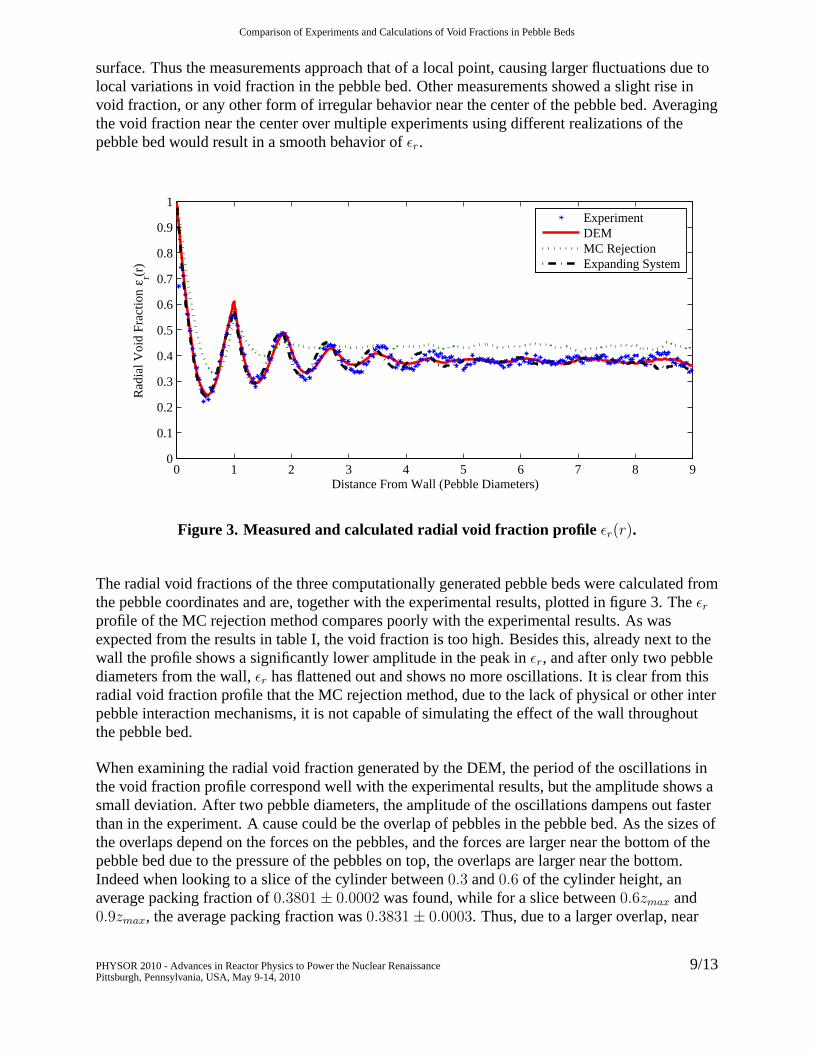
Figure 3. Measured and calculated radial void fraction profileεr(r).
The radial void fractions of the three computationally generated pebble beds were calculated fromthe pebble coordinates and are, together with the experimental results, plotted in figure 3. Theεr
profile of the MC rejection method compares poorly with the experimental results. As wasexpected from the results in table I, the void fraction is too high. Besides this, already next to thewall the profile shows a significantly lower amplitude in the peak inεr, and after only two pebblediameters from the wall,εr has flattened out and shows no more oscillations. It is clear from thisradial void fraction profile that the MC rejection method, due to the lack of physical or other interpebble interaction mechanisms, it is not capable of simulating the effect of the wall throughoutthe pebble bed.
When examining the radial void fraction generated by the DEM, the period of the oscillations inthe void fraction profile correspond well with the experimental results, but the amplitude shows asmall deviation. After two pebble diameters, the amplitude of the oscillations dampens out fasterthan in the experiment. A cause could be the overlap of pebbles in the pebble bed. As the sizes ofthe overlaps depend on the forces on the pebbles, and the forces are larger near the bottom of thepebble bed due to the pressure of the pebbles on top, the overlaps are larger near the bottom.Indeed when looking to a slice of the cylinder between0.3 and0.6 of the cylinder height, anaverage packing fraction of0.3801± 0.0002 was found, while for a slice between0.6zmax and0.9zmax, the average packing fraction was0.3831± 0.0003. Thus, due to a larger overlap, near
PHYSOR 2010 - Advances in Reactor Physics to Power the Nuclear RenaissancePittsburgh, Pennsylvania, USA, May 9-14, 2010
9/13
G. J. Auwerda, J. L. Kloosterman, A. J. M. Winkelman, J. Groen, V. van Dijk
the bottom the period of the oscillations will be shorter than near the top. This results in a slightvariation in the period of the oscillations over the axial length of the cylinder, damping theoscillations in theεr profile averaged over the cylinder height, with the effect being morepronounced further away from the wall.
The profile generated using the expanding system method does not have this problem. Theoscillations dampen out just as fast as those in the measured profile. However, the period of theoscillations is shorter than that of the experiment. Although for the first two oscillations, up totwo pebble diameters from the wall, the difference is very small, after about five pebble diametersthe shift in the radial position of the peaks is significant. The absence of gravity could be thecause of this effect. As the pebbles form a close packing, they are pressed together and against thewalls with no bias to any direction. In reality, pebbles are also pulled downwards by gravity.Since the wall is solid, pebbles can only move down by moving away from the wall, thus slightlyincreasing the period of oscillations inεr in the radial direction.
4.3. Axial Void Fraction εz
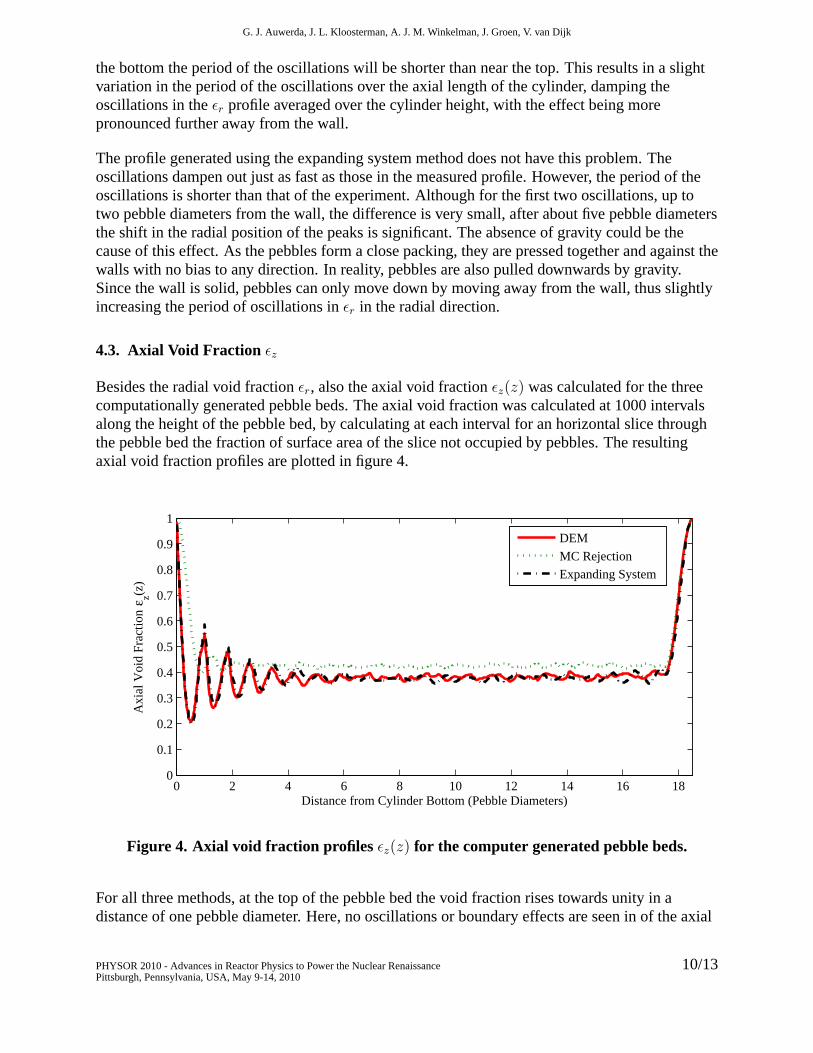
Besides the radial void fractionεr, also the axial void fractionεz(z) was calculated for the threecomputationally generated pebble beds. The axial void fraction was calculated at 1000 intervalsalong the height of the pebble bed, by calculating at each interval for an horizontal slice throughthe pebble bed the fraction of surface area of the slice not occupied by pebbles. The resultingaxial void fraction profiles are plotted in figure 4.
0 2 4 6 8 10 12 14 16 180
0.1
0.2
0.3
0.4
0.5
0.6
0.7
0.8
0.9
1
Distance from Cylinder Bottom (Pebble Diameters)
Axi
al V
oid
Frac
tion
ε z(z)
DEM
MC Rejection
Expanding System
Figure 4. Axial void fraction profiles εz(z) for the computer generated pebble beds.
For all three methods, at the top of the pebble bed the void fraction rises towards unity in adistance of one pebble diameter. Here, no oscillations or boundary effects are seen in of the axial
PHYSOR 2010 - Advances in Reactor Physics to Power the Nuclear RenaissancePittsburgh, Pennsylvania, USA, May 9-14, 2010
10/13
Comparison of Experiments and Calculations of Void Fractions in Pebble Beds
profile, as is expected, since the upper boundary is a free boundary, which imposes no restraintson the locations of the pebbles.
From the bottom of the cylinder upwards, the axial void fraction of the MC rejection methoddrops off much slower than for the other two methods. By placing the pebbles at randomcoordinates, pebbles are not pushed against each other, resulting in large gaps in between thepebbles forming the bottom layer of the bed. As a result the void fraction drops off a lot slowerthan for the other two cases. Additionally, as the bottom layer of pebbles has a loose packing, thenext layer of pebbles is less restricted to certain heights as in reality, resulting inεz showingalmost no periodic behavior.
The DEM and expanding system methods generated pebble beds with very similarεz profiles.Both show oscillations in the void fraction due to the wall comparable to those seen inεr, both inmagnitude and period. Again after about 5 pebble diameters the oscillations due to the walldisappear and the void fraction profile stays almost flat, besides random fluctuations. In contrastwith theεr profiles in figure 3, the oscillations inεz of the expanding system method show aslightly larger period than those of the DEM, starting to be noticeable three to four pebblediameters from the bottom of the pebble bed. The reason could be similar as to why theεr profilefor the expanding system method showed a smaller period than in the experimental and DEMpebble beds. The DEM includes gravity, pushing pebbles tightly together in the axial direction.This force, and thus this bias in direction, is lacking in the expanding system method, and thus thepacking is less tightly pushed together in the axial direction than for DEM, resulting in a slightlylarger period over which the axial void fraction oscillates. The second contribution to the smallerperiod in DEM could be due to overlapping pebbles. As the forces on the pebbles are largest nearthe bottom of the cylinder, due to the pressure of the pebble bed above, here the overlap betweenpebbles would be largest, and pebbles are pressed into each other. This results in a smallereffective pebble radius, and thus a shorter oscillation period in the axial direction.
5. CONCLUSIONS AND FURTHER WORK
With the PebBEx facility an experimental setup is available with which precise and reliable radialvoid fraction measurements can be performed on pebble beds in a non-destructive manner. It wasconfirmed that the average void fractionε0 approaches 0.39 for randomly stacked pebble beds in alarge cylinder, withε0 = 0.395 for a pebble bed withD/d = 18.0. The radial and axial voidfractions in such beds show large oscillations near the wall and floor of the cylinder, with aminimum void fraction of 0.22 half a pebble diameter away from the wall. The oscillationsdampen out towards the center, extending up to 5 pebble diameters into the pebble bed.
The Monte Carlo rejection method was found to be unsuitable to create realistic randomly stackedpebble beds. The resulting pebble beds average void fractionε0 = 0.45, significantly higher thanin the experiment, and the oscillations in the radial and axial void fraction profiles damp out attwo pebble diameters away from the wall. Both DEM and the expanding system method generatepebble beds with absolute and radial void fraction in good agreement with experimental values.Both show small differences in the radial void fraction profiles compared to measurements,starting a few pebble diameters away from the wall. But near the wall, where the oscillations inradial void fraction are large and their effects are most important, there is an excellent agreementwith experimental values. Both models are well suited for the generation of density profiles in
PHYSOR 2010 - Advances in Reactor Physics to Power the Nuclear RenaissancePittsburgh, Pennsylvania, USA, May 9-14, 2010
11/13

G. J. Auwerda, J. L. Kloosterman, A. J. M. Winkelman, J. Groen, V. van Dijk
pebble beds. Additionally, DEM can be used to simulate pebble movement through a pebble bed.However, when an exact model of the pebbles in a pebble bed is needed for use in a subsequentcode, the expanding system model is better suited, as pebble beds generated by DEM will includeoverlapping pebbles, which can cause errors in the geometry of such codes. For small pebblebeds, up to ten thousand pebbles, the expanding system method is also faster than DEM.However, for large beds of hundreds of thousands of pebbles, calculation times using theexpanding system method will become extremely long, and DEM is expected to be much faster.
Measurements have already been performed with the PebBEx facility on pebble beds withmultiple pebble sizes, and on shaken beds [12]. Further experiments should includemeasurements of the axial void fraction profile for further validation of computer codes. Also theeffect of different loading patterns on the void fraction should be investigated, as well as the effectof pressurizing the pebble bed. Another possibility with the PebBEx facility is measuring voidfraction profiles on an annular pebble bed, using an already available special insert.
ACKNOWLEDGEMENTS
A special thanks goes out to A. J. M. Winkelman MSc. for the design and realization of thePebBEx facility. Additional thanks for V. van Dijk for developing the measuring techniques and J.Groen for perfecting these techniques and performing the measurements. We also thank dr. C. R.A. Abreu for supplying the DEM code, and E. Webbe for attaining the code from dr. Abreu.
REFERENCES
[1] D. Bedenig, “Experimentelle Untersuchungen in Stromungsverhalten eines Kugelhaufensim Hinblick auf den Brennelementkreislauf im Core eines Kugelhaufenreactor,”Institut furReaktorentwickelung Kearnforschungsanlage, Julich, Germany (1962).
[2] J. Lieberoth and A. Stojadinovic, “Neutron Streaming in Pebble Beds,”Nuclear Scienceand Engineering, 76, pp. 336-344 (1980).
[3] W. W. Schertz and K. B. Bischoff, “Thermal and Material Transport in Non-isothermalPacked Beds,”AIChE Journal, 15, pp. 597 (1969).
[4] R. F. Benenati and C. B. Brosilow, “Void fraction distribution in beds of spheres,”AIChEJournal, 8, pp. 359-361 (1962).
[5] J. S. Goodling et al., “Radial Porosity Distribution in Cylindrical Beds Packed withSpheres,”Powder Technology, 35, pp. 23-29 (1983).
[6] G. E. Mueller, “Radial Void Fraction Distributions in Randomly Packed Fixed Beds ofUniformly Sized Spheres in Cylindrical Containers,”Powder Technology, 72, pp. 269-275(1992).
[7] C. G. Du Toit, “The Numerical Determination of the Variation in the Porosity of thePebble-Bed Core,”Proc. Int. Topl. Mtg. High Temperature Reactor Technology (HTR-TN2002), Petten, The Netherlands, April 22-24, 2002, High Temperature Reactor TechnologyNetwork (2002).
[8] J. J. Cogliati and A. M. Ougouag, “Pebbles: a Computer Code for Modeling Packing, Flowand Re-circulation of Pebbles in a Pebble Bed Reactor,”HTR2006, 3rd InternationalTopical Meeting on High Temperature Reactor Technology, Johannesburg, South-Africa,Oktober 1-4 (2006).
PHYSOR 2010 - Advances in Reactor Physics to Power the Nuclear RenaissancePittsburgh, Pennsylvania, USA, May 9-14, 2010
12/13
Comparison of Experiments and Calculations of Void Fractions in Pebble Beds
[9] C. H. Rycroft et al., “Analysis of granular flow in a pebble-bed nuclear reactor,”PhysicalReview E, 74 (2006).
[10] J. L. Kloosterman and A. M. Ougouag, “Comparison and Extension of Dancoff Factors forPebble-Bed Reactors,”Nuclear Science and Engineering, 157, pp. 16-29 (2007).
[11] V. van Dijk, “Radial Void Fraction Measurements of the Pebble-Bed inside a Pebble-BedReactor,”Bsc. Thesis, TU Delft, The Netherlands (2008).
[12] J. Groen, “Radial Void Fraction Measurement of a Random Multisized Pebble Stacking,”Bsc. Thesis, TU Delft, The Netherlands (2009).
[13] P. L. Spedding and R. M. Spencer, “Simulation of Packing Density and Liquid Flow inFixed Beds,”Comput. Chem. Eng., 19(1), pp. 43-73 (1995).
[14] H. Freund et al., “Numerical Simulations of Single Phase Reacting Flows in RandomlyPacked Fixed-Bed Reactors and Experimental Validation,”Chem. Eng. Sci., 58, pp. 903(2003).
[15] W. Soppe, “Computer Simulation of Random Packings of Hard Spheres,”PowderTechnology, 62, pp. 189-196 (1990).
[16] R. Julien, A. Pavlovitch and P. Meakin, “Random Packings of Spheres Build withSequiential Models,”J. Phys. A: Math. Gen., 25, pp. 4103 (1992).
[17] C. R. A. Abreu, “Simulacao Computacional de Sistemas Granulares: Aplicacao dosMetodos de Monte Carlo e de Elementos Distintos,”PhD thesis, Universidade Federal doRio de Janeiro, UFRJ, Brasil, (2004).
[18] P. Mrafko, “Homogeneous and Isotropic Hard Sphere Model of Amorphous Metals,”Journal de Physique Colloques, 41, pp. 322-325 (1980).
[19] ”Coefficient of Friction”, inCRC Handbook of Chemistry and Physics, 89th Edition(Internet Version 2009), David R. Lide, ed., CRC Press/Taylor and Francis, Boca Raton,Fl., USA (2009).
[20] E. Webbe, “Multi Sized Pebble Stacking,”Bsc. Thesis, TU Delft, The Netherlands (2009).
[21] Zongxin Wu, Dengcai Lin, Daxin Zhong, “The Design Features of the HTR-10,”NuclearEngineering and Design, 218, pp. 25-32 (2002).
[22] G. D. Scott and D. M. Kilgour, “The Density of Random Close Packing of Spheres,”Journal of Physics D: Applied Physics, 2, pp. 863-866 (1969).
PHYSOR 2010 - Advances in Reactor Physics to Power the Nuclear RenaissancePittsburgh, Pennsylvania, USA, May 9-14, 2010
13/13