comparison of interconnection networks - semantic …€¦ · comparison of interconnection...
TRANSCRIPT

Department of Information Technology
CT30A7001 – Concurrent and parallel computing
Document for seminar presentation
Comparison of interconnection networks
Otso Lonka Student ID: 0279351 [email protected] Andrey Naralchuk Student ID: B0331697 [email protected]
Lappeenranta, 2008
1

2
TABLE OF CONTENTS
1. Introduction........................................................................................................................................... 3
1.1. Background knowledge ................................................................................................................. 3
1.2. Goals and limitations ..................................................................................................................... 3
1.3. The structure of the work ............................................................................................................... 3
2. Interconnect network architectures ....................................................................................................... 4
2.1. Main concept.................................................................................................................................. 4
2.2. Different interconnection networks in general............................................................................... 5
3. Comparison of interconnection networks ............................................................................................. 7
3.1. In the scientific publications before 1994...................................................................................... 7
3.1. In the scientific publications after 1994 till nowadays ................................................................ 10
4. TOP500.org statistics .......................................................................................................................... 19
5. Summary ............................................................................................................................................. 22
References............................................................................................................................................... 23

3
1. Introduction
1.1. Background knowledge
This document is a seminar presentation for a course Concurrent and Parallel Computing. The topic of
the presentation is Comparison of interconnection networks. Our task is to compare interconnection
network solutions. The comparison is done based on scientific publications that were available.
1.2. Goals and limitations
The key question in this work is to gain information of interconnection networks and report the results
of comparison. We will overview interconnect networks and clarify which features of interconnection
network are needed for supercomputing. We will also introduce some interconnection networks as an
example. There are many interconnection networks available and this paper will not consider all of
them.
1.3. The structure of the work
The first part of the document considers of architectures of interconnection networks at general level.
The second chapter consists of the comparison of interconnection networks based on scientific articles
and it will also explain why it is difficult to compare different interconnection networks. The fourth
chapter will introduce statistics and charts from top500.org and explain them. At the last chapter, we
will summarize what we did and what we discovered of interconnection networks.

2. Interconnect network architectures
2.1. Main concept
Parallel computer consists of processing units, memory banks and interconnection network. Processing
units are responsible of data processing and interconnection network is responsible of data transfer
between processing units and memory banks. [1]
Interconnection network provides connections between processing nodes in a parallel processing
system. Interconnection networks can be classified as static or dynamic Picture 1. A static network is a
point-to-point network between processing nodes. A processing node is connected to another
processing node without use of any external switching elements. Static interconnection network can be
also referred as direct interconnection network. Dynamic interconnection networks are built by using
switches and cables between processing elements. Network switches and connections form an
interconnection network and the processing units are separate from the network. Dynamic networks are
called as indirect networks. [1] Dynamic interconnection networks have scalability features in general.
Picture 1. Static and Indirect networks [1].
The links of an interconnection network can be either based on conducting material or fiber. [1] For the
links built of conducting material, there is always some amount of signal loss and noise. A capacitance
between a signal path and a ground limits the frequency range which can be used for data transfer. The
cable works itself as a low pass filter, which filters high frequencies. The longer the cable is, the more
capacitance it contains. [1] The higher frequencies are needed to achieve high data transfer rate. Thus
4

the length of the link limits the capacity of data transfer when using links based on conducting material.
For fiber cables there is no such a limitation as the signal is transferred in a non-electrical form. By
using fiber cables, the lengths of the links are not so critical and this is probably one of the reasons,
why clustering is so popular in modern supercomputers instead of using PCBs.
2.2. Different interconnection networks in general
Multistage crossbar is an interconnection network in which all input ports are directly connected to all
output ports without interference from messages from other ports. In a one-stage crossbar this has the
effect that for instance all memory modules in a computer system are directly coupled to all CPUs. This
is often the case in multi-CPU vector systems. In multistage crossbar networks the output ports of one
crossbar module are coupled with the input ports of other crossbar modules. In this way one is able to
build networks that grow with logarithmic complexity, thus reducing the cost of a large network [2].
A hypercube is the family of direct or indirect binary n-cubes is a special case of the family of k-ary n-
cubes with n dimensions and k nodes in each dimension. n-cube is used to denote the binary n-cube.
The n-dimensional hypercube is composed of nodes and has n edges per node. If unique n-bit
binary addresses are assigned to the nodes of the hypercube, then an edge connects two nodes if and
only if their binary addresses differ in a single bit [3].
n2
A mesh is the family of interconnection networks that are a special case of k-ary n-cube networks in
which the number of dimensions, n, is two.
Until recently Myrinet was the market leader in fast cluster networks and is still one of the largest. The
first Myrinet implementation as an alternative for Ethernet to connect the nodes in a cluster. Myrinet
uses cut-through routing for an efficient utilization of the network. Also RDMA is used to write to/read
from the remote memory of other host adaptor cards, called Lanai cards. These cards interface with the
PCI-X bus of the host they are attached to. The latest Myrinet implementation only uses fibers as signal
carriers.
Since the start of 2006 Myricom provides a multi-protocol switch (and adapters): The Myri-10G. Apart
from Myricom's own MX protocol it also supports 10 Gigabit Ethernet which makes it easy to connect
to external nodes/clusters. The specifications as given by Myricom are quite good: ≅ 1.2 GB/s for the
uni-directional theoretical bandwidth for both its MX protocol and about the same for the MX
5
6
emulation of TCP/IP on Gigabit Ethernet. According to Myricom there is no difference in bandwidth
between MX and MPI and also the latencies [4].
Infiniband has become rapidly a widely accepted medium for internode networks. The specification
was finished in June 2001. Infiniband is employed to connect various system components within a
system. Via Host Channel Adapters (HCAs) the Infiniband fabric can be used for interprocessor
networks, attaching I/O subsystems, or to multi-protocol switches like Gbit Ethernet switches. Because
of this versatility, the market is not limited just to the interprocessor network segment and so Infiniband
is expected to become relatively inexpensive because a higher volume of sellings can be realised. The
characteristics of Infiniband are rather nice.
Conceptually, Infiniband knows of two types of connectors to the system components, the Host
Channel Adapters (HCAs), already mentioned, and Target Channel Adapters (TCAs). Infiniband
defines a basic link speed of 2.5 Gb/s (312.5 MB/s) but also a 4× and 12× speed of 1.25 GB/s and 3.75
GB/s, respectively. Also HCAs and TCAs can have multiple ports that are independent and allow for
higher reliability and speed [5].
QsNet(Quadrics) is the main product of Quadrics, a company that initially started in the 1990s. The
network has effectively two parts: the ELAN interface cards, comparable to Infiniband Host Bus
Adaptors or Myrinet's Lanai interface cards, and the Elite switch, comparable to an Infiniband
switch/router or a Myrinet switch. The topology that is used is a (quaternary) fat tree. The ELAN card
interfaces with the PCI-X port of a host computer.
The second generation is QsNet II. The structure, protocols, etc., are very similar to those of the former
QsNet but much faster: where in a speed of 1.3 GB/s. In this case the PCI-X bus speed is a limiting
factor: it allows for somewhat more than about 900 MB/s. However, with the advent of PCI Express
this limitation may be over. Also the latency for short messages has improved from ≅ 5 µs.
Since early 2006 Quadrics also offers 10 Gbit Ethernet cards and switches under the name QSTenG.
These products capitalise on the experience obtained in the development of the two generations of
QsNet but they are not meant for inter-processor communication [6].
SCI, standing for Scalable Coherent Interface. SCI became by October 1992. It was born as a reaction
to the limitations that were encountered in bus-based multiprocessor systems.
In clusters SCI is always used as just an internode network. Because of the ring structure of SCI this

7
means that the network is arranged as a 1-D, 2-D, or 3-D torus. One of the SCI vendors provides
software to reconfigure the torus in such a way that the minimal number of nodes becomes unavailable.
Furthermore, it is not possible to add or remove an arbitrary number of nodes in the cluster because of
the torus topology.
Bandwidths are reported for the SCI-based clusters: up to about 320 MB/s for a Ping-Pong experiment
over MPI with very low latencies of 1—2 µs for small messages [7].
3. Comparison of interconnection networks
3.1. In the scientific publications before 1994
I have found some scientific article about problems to compare interconnection networks.
One of the problems is which metrics of the network should be determined. A sampling of some of the
metrics found in the literature include: message delay characteristics, permuting ability, partitionability,
fault tolerance, bisection width, graph theoretic measures, throughput, complexity of control, and cost-
effectiveness. In general, it is difficult to select the “important” metrics, because they may vary with the
intended application and operating assumptions. Basing design decisions on different sets of metrics
can result in different design choices [12].
Another difficulty in comparing two different network designs is determining if they are of equal
“cost”, so that the comparison will be “fair.” The “cost” should be defined in terms of hardware
required, rather than actual dollar cost [12].
In any way let’s to define what the tendency is to choice of type’s interconnection network. One of the
important characteristics of a supercomputer is a supercomputer cost. The customers look for a
supercomputer with high-performance and low cost of it. And a cost of interconnection networks plays
not the last role in the full cost of supercomputer. How are characteristics of supercomputers in part of
interconnections network been described in the publications?
One of the publications was about comparison bus and crossbar [11]. Authors said that traditionally, the
choice for interconnection architecture has been a bus. Buses are relatively simple and the hardware
cost is small. The drawback of a single bus is that only one agent can transmit at a time. One alternative

8
to bus-based architectures is a switched network that is described into a circuit-switched crossbar.
Crossbar is a low latency, non-blocking interconnection network for large data transfers. However, the
hardware cost of a crossbar is relatively large. One of the author opinions is to use hierarchical
structures where interconnection segments are connected with bridges (bus) or hierarchical switches
(crossbar) that was implemented in big supercomputer. Crossbar is relatively complex system
architecture. However, if the data transmissions are long and if they can be done in parallel, the
hardware complexity can be justified [11].
The publication about analysis of the network characteristics that was presented by Anant Agarwal [13]
is based on model. The model includes the effects of packet size, communication locality and other
characteristics.
Network analysis was made under various constraints. After comparison author found out that a
message length plays an important role in the tradeoff between low and high-dimensional networks.
Longer messages (such as those in message passing machines) make the relative effect of network
distance from source to destination less important, while the lower expected message lengths in shared
memory machines increase the relative influence of network distance, and tend to favor networks with
more dimensions.
Communication locality depends on several factors including the architecture of the multi processor,
the compiler and runtime systems, and the characteristics of parallel applications. If the communication
locality of parallel applications can be enhanced through better algorithms and systems architectures,
parallel machines with significantly higher performance can be built without incurring the high cost of
expensive networks [13].
One of the interesting publications is the performance analysis of the supercomputers with different
interconnection topologies [14]. It was actually in days when the article was written. Author measured
and grid topologies on the SUPRENUM supercomputer. Those measurements utilized the original 4-
ring interconnection topology.
Author presents the measured result in the Table 1. The table indicates the number of processors P, their
arrangement as a logical Px ×Py rectangular processor array, the computational domain size Mx ×My,
the resulting computational efficiency (comparison to P times the single node performance) and the
Mflops generated.

Each node contains a 32×1024 grid and the processors are arranged in a line parallel to the Y direction.
The peak performance is seen to be 1272 Mflops.
Table 1. Processor grid aligned with Y axis (double matrix) [14]
He compares the effect of varying the shape of the processor grid for 256 node computations Table 2.
The almost square 4096×2048 grid on a 128×2 processor array is seen to deliver 1042 Mflops.
Table 2. 256-node performance as function of processor grid (full connect) [14]
I can make conclusion of this research that a grid topology has different efficiency and performance
with different characteristics of the grid.
Also I meet articles about possibility to achieve high performance in a supercomputer. One of the
articles was presented by Sotirios G. Ziavras [15]. He said that the direct binary hypercube has been
one of the most popular interconnection networks because it provides small diameter, and is so robust
that it can simulate very efficiently a wide variety of other frequently used interconnection networks.
Newetheless, a major drawback of the hypercube is the dramatic increase in the total number of
communication channels with any increase in the total number of processors in the system.
9
This drawback has significant impact on the very large scale integration (VLSI) complexity of
hypercube systems. For this reason, existing commercial hypercube systems have either a large number

10
of primitive processors (for example, the Connection Machine system CM-2 has 65,536 simple
processors) or a relatively small number of powerful processors (for example, the nCUBE with 1,024
processors). These systems, however, cannot achieve 1 Teraflop performance; the development of
technologies for the construction of massively parallel systems with thousands of processors that could
achieve 1 Teraflop peak performance. This performance goal could be achieved in this decade only
with systems containing thousands of powerful processors [15].
In those days several hypercube variations have been proposed in the literature. Several of them were
developed to improve the topological properties of the hypercube. It is well-known that the hypercube
does have very good topological properties, therefore, the viability of the latter variations is
questionable; in fact, they often increase its already high VLSI complexity! Other variations employ
hypercube building blocks that contain a special communication processor. Building blocks are
connected together through their communication processors. Not only are such structures irregular but
for large building blocks the employment of the communication processors results in substantial
bottlenecks.
In contrast, author has introduced the family of reduced hypercube (RH) interconnection networks that
have smaller VLSI complexity than hypercubes with the same number of processors. RHs are produced
from regular hypercubes by a uniform reduction in the number of channels for each node [15].
Extensive comparison of RH interconnection networks with conventional hypercubes of the same size
has proven that they achieve comparable performance. It has been also shown that any RH can simulate
simultaneously in an optimal manner several popular cube-connected cycles interconnection networks.
Additionally, techniques have been developed for the efficient embedding of linear arrays,
multidimensional meshes, and binary trees into RHs. Finally, generalized reduced hypercube
interconnection networks have been introduced for even more versatility.
I have described opinion about most popular interconnection network till 1994 year. I will present
comparisons from 1994 till nowadays in the next subchapter.
3.1. In the scientific publications after 1994 till nowadays
The article [16] compares and evaluates the multicast performance of two System-Area Networks
(SANs), Dolphin’s Scalable Coherent Interface (SCI) and Myricom’s Myrinet. Both networks deliver

low latency and high bandwidth to applications, but do not support multicast in hardware. Authors
compared SCI and Myrinet in terms of their user level performance using various software-based
multicast algorithms under various networking and multicasting scenarios. The recent Dolphin SCI
networks are capable of achieving low latencies (smaller than 2µs) and high throughputs (5.3 Gbps
peak link throughput) over point-to-point links with cut-through switching. SCI architecture is
presented on the Picture 2. Using the unidirectional ringlets as a basic block, it is possible to obtain a
large variety of topologies, such as counter-rotating rings and unidirectional and bidirectional torus
[16].
Picture 2. Architectural block diagram of SCI NIC (2D) [16].
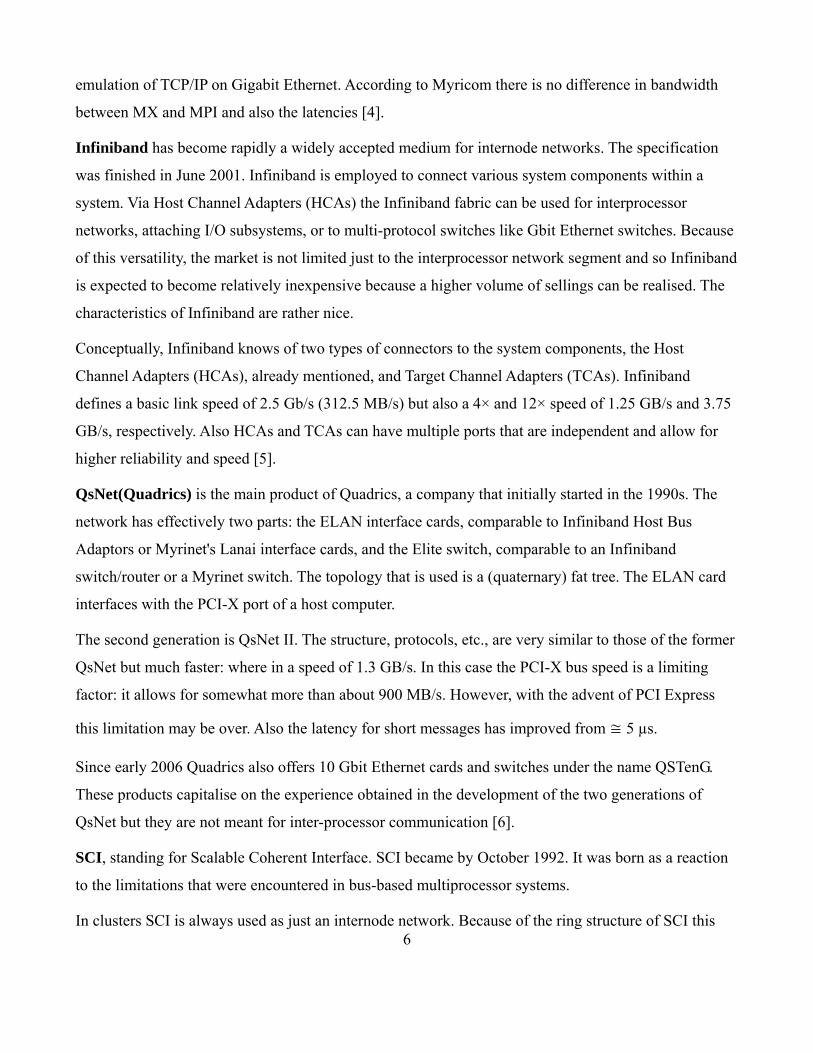
Myrinet provides low latencies (as low as about 6µs) and high data rates (up to 2.0 Gbps). Picture 3
shows the architectural block diagram of a PCI-based Myrinet NIC.
11
Picture 3. Architectural block diagram of Myrinet NIC [16].
For the Dolphin SCI experiments, Dolphin PCI-64/66/D330 SCI NICs with 5.3 Gb/s link speed are
used along with Scali’s SSP (Scali Software Platform) 3.0.1 communication software. The nodes are
interconnected to form a 4x4 unidirectional 2D torus using 2m cables. The Myrinet experiments are
performed using M2L-PCI64A-2 Myrinet NICs with a 1.28 Gb/s link speed along with Myricom’s
GM-1.6.4 communication software. The nodes are interconnected to form a 16-node star network using
16 3m Myrinet LAN cables and a 16-port Myrinet switch for the Myrinet experiments [16].
The result is shown on the Picture 4.
12

Picture 4. Large-message multicast completion latency.
The conclusion of the article is that the analysis of most widely deployed interconnects for cluster
computing takes different results. For example the SCI separate addressing algorithm is found to be the
best choice for small-message. For large messages, Dolphin’s SCI has a clear advantage compared to
Myricom’s Myrinet (i.e. 5.3 Gb/s of SCI vs. 1.28 Gb/s of Myrinet used in this experiment). Although
the newest Myrinet hardware features higher data rates (for example 2.0 Gb/s) than tested, these rates
are still significantly lower than SCI.
The article [17] also compared SCI and Myrinet. In their study, they concluded that, in terms of their
performance and robustness analyses, Myrinet is a better choice compared to SCI.
One of the articles was about bandwidth and latency analysis on a Cray XT4 system [18]. It is
registered with communication bandwidth point-to-point ≤ 7.6 GB/s and bisectional/cabinet 667 GB/s
into top500 list.
The Cray XT4 interconnection network is arranged in a 3-D mesh topology (some systems employ
wraparound links, producing a torus in some or all dimensions). Each node in the mesh is nominally
connected to its six nearest neighbors by point-to-point communication links. Normally, these links are
configured at boot time by the Cray route manager to operate at full speed. [18].
13

Picture 5. MPI ping-pong bandwidth and latency for the three supported link bandwidth modes [18].
Three degraded modes are supported: 1/4 bandwidth, 1/2 bandwidth, and 3/4 bandwidth. Picture 5
shows the resulting MPI uni-directional bandwidth and latency for the degraded modes, as well as full
bandwidth. The 3/4 and full link bandwidth results are limited by the compute node’s injection
bandwidth which is lower than the network link bandwidth. Based on the 1/4 bandwidth results, the
effective link bandwidth is approximately 3092 MB/s in each direction. Small-message MPI latency is
virtually unchanged for the degraded modes, indicating that link bandwidth can be controlled
independently of latency [18].
Picture 6 shows MPI ping-pong bandwidth and latency for the four tested HyperTransport link
configurations: 200-MHz 8-bit (400 MB/s per direction), 200-MHz 16-bit (800 MB/s), 400-MHz 16-bit
(1600 MB/s), and 800-MHz 16-bit (3200 MB/s)
Picture 6. MPI ping-pong bandwidth and latency for the four link configurations [18].
On the author’s opinion there were there several network interconnects in 2003 year that provide low
latency (less than 10µs) and high bandwidth (multiple Gbps). Two of the leading products are Myrinet
14
15
and Quadrics. In the high performance computing area, MPI has been the de facto standard for writing
parallel applications. To achieve optimal performance in a cluster, it is very important to implement
MPI efficiently on top of the cluster interconnect. Myrinet and Quadrics were designed for high
performance computing environments. As a result, their hardware and software are specially optimized
to achieve better MPI performance [19].
More recently, InfiniBand has entered the high performance computing market. Unlike Myrinet and
Quadrics, InfiniBand was initially proposed as a generic interconnect for inter-process communication
and I/O. However, its rich feature set, high performance and scalability make it also attractive as a
communication layer for high performance computing [19].
Authors present a comprehensive performance comparison of MPI implementations over InfiniBand,
Myrinet and Quadrics.
InfiniBand platform consisted of InfiniHost HCAs and an InfiniScale switch from Mellanox.
InfiniScale is a full wire-speed switch with eight 10 Gbps ports. The InfiniHost MT23108 HCA
connects to the host through PCIX bus. It allows for a bandwidth of up to 10 Gbps over its ports.
Myrinet network consists of Myrinet M3F-PCIXD-2 network interface cards connected by a Myrinet-
2000 switch. The link bandwidth of the Myrinet network is 2Gbps in each direction. The Myrinet-2000
switch is an 8-port crossbar switch. The network interface card has a 133MHz/64bit PCI-X interface. It
has a programmable LANai-XP processor running at 225 MHz with 2MB onboard SRAM. The LANai
processor on the NIC can access host memory via the PCI-X bus through the DMA controller.
Quadrics network consists of Elan3 QM-400 network interface cards and an Elite 16 switch. The
Quadrics network has a transmission bandwidth of 400MB/s in each link direction.
Picture 7 shows the MPI-level latency results. The test is conducted in a ping-pong fashion and the
latency is derived from round-trip time. For small messages, Quadrics shows excellent latencies, which
are around 4.6µs. The smallest latencies for InfiniBand and Myrinet are 6.8µs and 6.7µs, respectively.
For large messages, InfiniBand has a clear advantage because of its higher bandwidth [19].

Picture 7. MPI Latency across Three interconnects [19].
Picture 8 shows the bi-directional bandwidth results. We can see that InfiniBand bandwidth increases
from 841MB/s uni-directional to 900MB/s. Then it is limited by the bandwidth of the PCI-X bus.
Quadrics bandwidth improves from 308MB/s to 375MB/s. Myrinet shows even more improvement. Its
peak bandwidth increases from 235MB/s to 473MB/s. However, Myrinet bandwidth drops to less than
340MB/s when the message size is larger than 256KB.
Picture 8. MPI BI-Directional bandwidth [19].
Conclusion shows that although InfiniBand is able to deliver very good performance at the MPI level.
Results on the 8 node OSU cluster and 16 node Topspin cluster also show that InfiniBand has very 16

good scalability. InfiniBand can still outperform other interconnects if the application is bandwidth-
bound.
The article that was presented by DELL [20]. The lab set up a test environment that comprised a cluster
of 32 identically configured Dell PowerEdge 1750 servers inter connected with Gigabit Ethernet and
InfiniBand HCAs and switches.
Each PowerEdge 1750 server had two Intel Xeon processors running at 3.06 GHz with 512 KB level 2
(L2) cache, 1 MB level 3 (L3) cache, and 4 GB of DDR RAM operating on a 533 MHz front-side bus
(FSB). The chip set of the PowerEdge 1750 was the ServerWorks GC-LE, which accommodates up to
four registered DDR PC2100 (266 MHz) DIMMs with two-way interleaved memory architecture. Each
PowerEdge 1750 server was also equipped with two integrated Broadcom Gigabit2 Ethernet adapters,
dual 64-bit 133 MHz PCI-X slots for the interconnects, and the appropriate NICs. The 32 PowerEdge
1750 servers functioned as the compute nodes of the cluster. An Extreme Networks Summit 400-48t
switch with 48 non-blocking Gigabit Ethernet ports was used for Gigabit Ethernet tests. The InfiniBand
components consisted of two Topspin 120 InfiniBand switches and Topspin InfiniBand 10 Gbps PCI-X
HCAs. Each of the Topspin 120 switches was connected to 16 nodes and to each other with eight
interswitch links between the two switches.
Picture 9. Latency comparison between Gigabit Ethernet and InfiniBand [20].
17

Picture 10. Bandwidth comparison between Gigabit Ethernet and InfiniBand [20].
Picture 9 shows that the latency for the InfiniBand interconnect is fairly low compared to that of the
Gigabit Ethernet interconnect in this study. For a small message size, InfiniBand has a latency of
approximately 7 microseconds (μs) as compared to Gigabit Ethernet, which shows a latency of
approximately 65 μs for the same message size. Picture 10 shows the bandwidth obtained in this study.
Gigabit Ethernet peaks out at roughly 85 MB/sec to 90 MB/sec as compared to InfiniBand, which
shows a peak of approximately 700 MB/sec for large message sizes. The results in this study were
obtained using PCI-X interfaces for both InfiniBand and Gigabit Ethernet on separate PCI-X buses.
Another approach based on price of the supercomputer to achieve exact level of performance. The
result after testing is shown on the Table 3.
Table 3. Comparison between Gigabit Ethernet and InfiniBand Clusters from Nov2003 Top500 list of
Computers [21].
In this case, the price/performance equation is simple since InfiniBand switch ports, at less than $300
per port, are far more cost effective than buying servers costing several thousand dollars or more.
18

Table 4. Comparison of InfiniBand and GE / 10GE Switches
Table 4 shows that Gigabit Ethernet and 10 Gigabit Ethernet are more expensive interconnection
networks than Infiniband. At the same time, Infiniband provides more performance.
4. TOP500.org statistics
Top500.org has listed the most used interconnection families in 500 most powerful supercomputers in
the world. Table 1 describes interconnect family, count, percentual share, sum of maximum ranges, sum
of peak ranges and total amount processors which are connected to a interconnect network family.
Picture 11 and 12 present graphically percentual share of different interconnection networks listed in
top500.org.
Picture 11. Interconnect share for 11/2008 part 1.
19

Picture 12. Interconnect share for 11/2008 part 2.
The table reveals that Gigabit Ethernet and Infiniband are clearly the most popular interconnection
networks in current supercomputers. Over 50% of them are using Gigabit Ethernet and Infiniband’s
share is almost 30%. Table 3 shows a total performance for supercomputers based on used
interconnection family. [9] For an interconnection network comparison purposes, we will calculate
interconnects average performance in a system and interconnect network’s average performance per
processor.
Table 5. Average performance for supercomputers based on used interconnection family.
Interconnect family Rmax Sum/Count (GF/system)
Rpeak Sum/Count (GF/system)
Rmax Sum/Processor Sum
(GF/processor)
Rpeak Sum/Processor Sum
(GF/processor)
Average amount of processors in a system
Myrinet 35029 48893 6 8.64 5658
Quadrics 30555 36877 5.8 7 5260
Gigabit Ethernet 17565 34780 5.25 10.4 3344
Infiniband 46434 61833 7.8 10.4 5962
Crossbar 35860 40960 7 8 5120
Mixed 66567 82944 4.8 6 13824
NUMALink 40851 45875 5.7 6.4 7168
SP Switch 22954 27375 6.7 8 3420
20

Proprietary 98644 124853 3.7 4.7 26385
Cray Interconnect
59866 78245 4.9 6.4 12167
According to Table 5, it seems when Infiniband interconnection network have been used, have the best
average performance relative to number of processors been achieved. Average maximum performance
per system states that the computers that use Infiniband, are also quite powerful. Infiniband is used in
142 supercomputers and there are also smaller clusters included. Supercomputers that use Gigabit
Ethernet are less powerful at average but on the other hand, Gigabit Ethernet is currently the most used
interconnection network and probably quite popular solution for smaller clusters as well. Proprietary
interconnection networks are used in 42 supercomputers. They seem to be the most powerful at
average, but it is easy to understand that when some type of special solution is applied, the computer is
supposed to be expensive and powerful.
Table 4. Approximate bandwidths and latencies of interconnection networks [10].
Top500.org has listed approximate bandwidths and latencies of interconnection networks to Table 4.
Gigabit Ethernet is available with maximum theoretical bandwidth of 125 MB per second. Gigabit
Ethernet in-switch latencies are approximately 30-40 µs [10]. This could be suitable configuration for
some applications that are not latency-bound at all [10]. Otherwise network choice should be somewhat
different.
When using high bandwidth interconnection networks, should a processing computer be able to deliver
21

22
data as fast as the network. Available bandwidths of PCI lane are 110-480 MB/s. PCI-X supports
bandwidth of 1 GB/s and PCI-X v2 supports also bandwidths of 2 and 4 GB/s. The recent PCI-Express
has multiple data transfer lanes which bandwidths are 200MB/s. PCI-Express supports x2, x4, x8, x16
or x32 data lanes [10].
5. Summary
As a conclusion I can mark that there is two most used interconnection topologies: Infiniband and
Gigabit Ethernet in the supercomputer implementations. We can make this conclusion also based on
scientific articles. Gigabit Ethernet takes first place in utilization by virtue of the fact that it is cheaper
and simply to implement.

23
References
[1] Grama Ananth, Gupta Anshul, Karypis George, Kumar Vipin: Introduction to Parallel Computing,
Second Edition, Addison-Wesley, 2003, ISBN 0-201-64865-2
[2] http://www.top500.org/2007_overview_recent_supercomputers/glossary_terms, actually 20/11/2008
[3] Sotitios G. Ziavras, “RH: A Versatile Family of Reduced Hypercube Interconnection Networks”,
1994.
[4] http://www.top500.org/2007_overview_recent_supercomputers/myrinet, actually 20/11/2008
[5] http://www.top500.org/orsc/2006/infiniband, actually 20/11/2008
[6] http://www.top500.org/orsc/2006/qsnet, actually 20/11/2008
[7] http://www.top500.org/orsc/2006/sci, actually 20/11/2008
[9] http://www.top500.org/stats/list/32/connfam, Interconnect Family share for 11/2008, actually
21/11/2008
[10] http://www.top500.org/2007_overview_recent_supercomputers/networks, Overview of Recent
Supercomputers, actually 18/11/2008
[11] V. Lahtinen, E. Salminen, K. Kuusilinna, T. Hamalainen, “Comparison of synthesized bus and
crossbar interconnection architectures.”, Tampere, Finland.
[12] Howard Jay Siegel, “Panel 2:Is It Possible to Fairly Compare Interconnection Networks?”, USA.
[13] Anant Agarwal, “Limits on Interconnection Network Performance.”, USA.
[14] Oliver A. McBryan. “Perfomance of the SUPRENUM-1 supercomputer with the full bus
interconnection network.”, USA.
[15] Sotirios G. Ziavras, “Reduces hypercube interconnection networks for massively parallel
computers.”
[16] Sarp Oral and Alan D. George, “A User-level Multicast Performance Comparison of
Scalable Coherent Interface and Myrinet Interconnects.” USA.
[17] M. Fischer, U. Brüning, J. Kluge, L. Rzymianowicz, P. Schulz, and M. Waack, “ATOLL a new
24
switched, highspeed Interconnect in Comparison to Myrinet and SCI,”, Mexico, 2000.
[18] Kevin T. Pedretti, Courtenay Vaughan, K. Scott Hemmert, and Brian Barrett, “Application
Sensitivity to Link and Injection Bandwidth on a Cray XT4 System”, Finland, 2008.
[19] Jiuxing Liu, Balasubramanian, Chandrasekaran Jiesheng, Wu Weihang Jiang, “Performance
Comparison of MPI Implementations over InfiniBand, Myrinet and Quadrics”, 2003.
[20] Dell Power Solutions, “Exploring InfiniBand as an HPC Cluster Interconnect”, 2004.
[21] Mellanox Technologies Inc., “InfiniBand Clustering Delivering Better Price/Performance than
Ethernet”, USA