comparison of mpca stormwater benchmarks with historical industrial sector monitoring results
TRANSCRIPT

Caltha LLPCaltha LLPwww.calthacompany.com/?page_id=16
Industrial Stormwater BenchmarksIndustrial Stormwater Benchmarks ––Comparison of New Minnesota BenchmarkComparison of New Minnesota Benchmark
Concentrations To Historic IndustryConcentrations To Historic Industry--specificspecificTesting ResultsTesting Results
Loren J. LarsonManaging Partner
Caltha LLP, Minneapolis
Conference on the Environment | Brooklyn Park, Minnesota | November 9, 2010

Caltha LLPCaltha LLPwww.calthacompany.com/?page_id=16
OutlineOutlineOutline
• Background – Historical Context
• EPA Industrial Group Sampling
• Comparison of MPCA Benchmarks to PastData
• Projection of Future Results
• Summary
Caltha LLPCaltha LLPwww.calthacompany.com/?page_id=16
Key Historical EventsKey Historical EventsKey Historical Events
• 1972 Federal Water Pollution Control Act» NPDES permit program
• 1977-85 NURP Studies» Identified urban runoff as important factor impacting
water quality
• 1987 Amendment to Clean Water Act» Required stormwater discharge be addressed under
NPDES permitting program

Caltha LLPCaltha LLPwww.calthacompany.com/?page_id=16
Key Historical EventsKey Historical EventsKey Historical Events
• 1990 - EPA promulgates stormwater permit rules» Requires industrial facilities to be permitted by Sept. 1992
» Publishes Group Permit option
• 1990-1992 - General permits drafted by EPAand States
» 1991 MPCA publishes general permit
• 1992 – Most facilities permitted under State orEPA general permit
Caltha LLPCaltha LLPwww.calthacompany.com/?page_id=16
Group Permit OptionGroup Permit OptionGroup Permit Option
• Offered option to be covered under permitcustomized for industry sector
» Single company with multiple locations
» Multiple companies, trade associations
• EPA accepted Group Permit applications
• Applications required monitoring ofstormwater discharge from selected groupmembers
» Representative of group
» Wide geographic distribution

Caltha LLPCaltha LLPwww.calthacompany.com/?page_id=16
Typical Group Monitoring LocationTypical Group Monitoring LocationTypical Group Monitoring Location

Caltha LLPCaltha LLPwww.calthacompany.com/?page_id=16
Typical Group Monitoring LocationTypical Group Monitoring LocationTypical Group Monitoring Location
Caltha LLPCaltha LLPwww.calthacompany.com/?page_id=16
Typical Group Monitoring LocationTypical Group Monitoring LocationTypical Group Monitoring Location

Caltha LLPCaltha LLPwww.calthacompany.com/?page_id=16
Typical Group Monitoring LocationTypical Group Monitoring LocationTypical Group Monitoring Location

Caltha LLPCaltha LLPwww.calthacompany.com/?page_id=16
Typical Group Monitoring LocationTypical Group Monitoring LocationTypical Group Monitoring Location

Caltha LLPCaltha LLPwww.calthacompany.com/?page_id=16
Group Permit OptionGroup Permit OptionGroup Permit Option
• Selected facilities conducted monitoringand submitted data to EPA
• By 1992, most facilities in Groups hadState general permits available
» State permits were considerable less burdensome
• Ultimately Groups disbanded
• In Dec. 1995, EPA published Group dataand benchmarks in Federal Register
Caltha LLPCaltha LLPwww.calthacompany.com/?page_id=16
1995 Group Data1995 Group Data1995 Group Data
• Divided in similar sector designations (A–AC)still used today
» More subsectors
• Some parameters represented by most sectors» TSS, BOD, COD
• Some parameters represented by only a fewsectors
» TP, metals, toxic organics
• Range of number of results for each sector» 10 – 20, up to hundreds

Caltha LLPCaltha LLPwww.calthacompany.com/?page_id=16
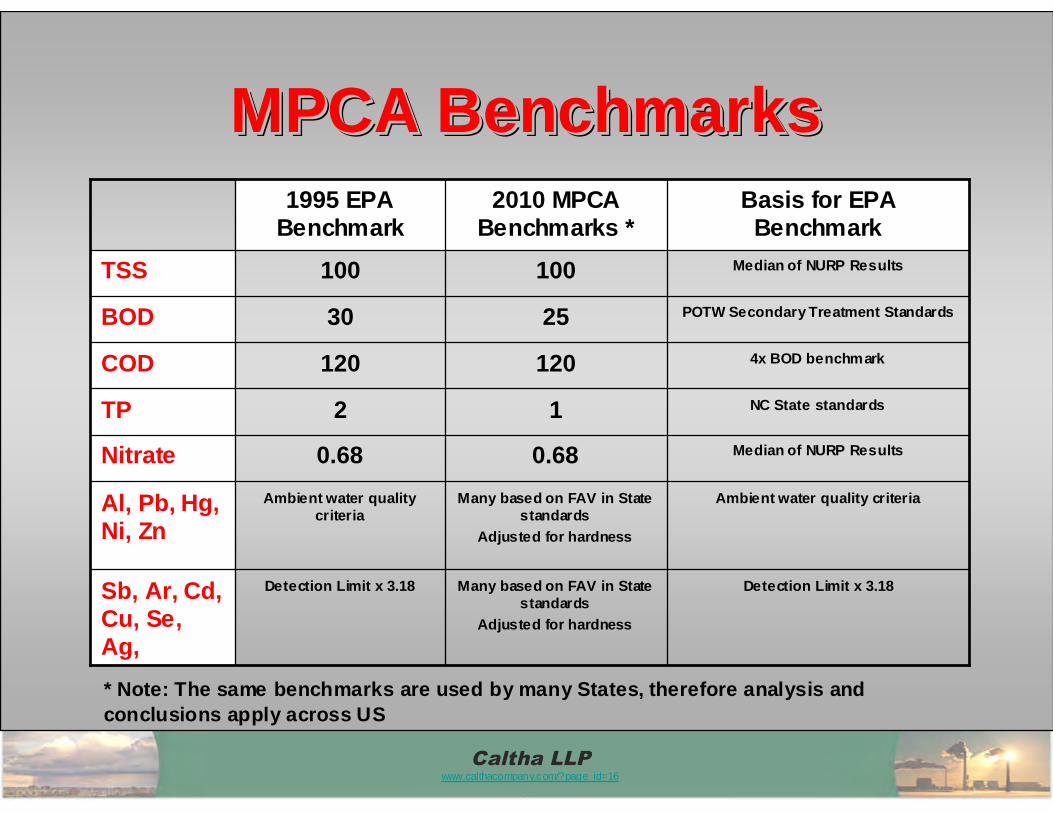
MPCA BenchmarksMPCA BenchmarksMPCA Benchmarks
• All industrial sectors have one or morebenchmarks
• All sectors have benchmark for TotalSuspended Solids (TSS)
Caltha LLPCaltha LLPwww.calthacompany.com/?page_id=16
MPCA BenchmarksMPCA BenchmarksMPCA Benchmarks
NC State standards12TP
Median of NURP Results0.680.68Nitrate
Many based on FAV in Statestandards
Adjusted for hardness
Many based on FAV in Statestandards
Adjusted for hardness
120
25
100
2010 MPCABenchmarks *
Sb, Ar, Cd,Cu, Se,Ag,
Al, Pb, Hg,Ni, Zn
COD
BOD
TSS
Detection Limit x 3.18Detection Limit x 3.18
Ambient water quality criteriaAmbient water qualitycriteria
4x BOD benchmark120
POTW Secondary Treatment Standards30
Median of NURP Results100
Basis for EPABenchmark
1995 EPABenchmark
* Note: The same benchmarks are used by many States, therefore analysis and
conclusions apply across US
Caltha LLPCaltha LLPwww.calthacompany.com/?page_id=16
Distribution of Data:Distribution of Data:Distribution of Data:
Caltha LLPCaltha LLPwww.calthacompany.com/?page_id=16
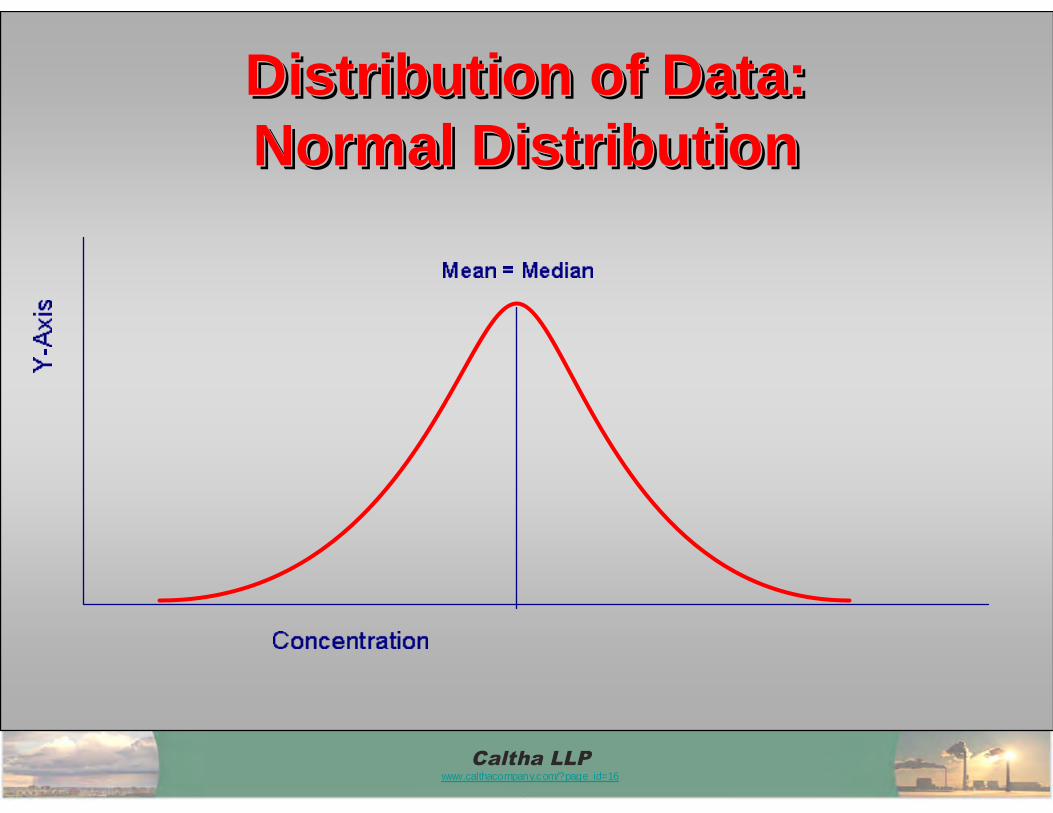
Distribution of Data:Normal DistributionDistribution of Data:Distribution of Data:Normal DistributionNormal Distribution
Caltha LLPCaltha LLPwww.calthacompany.com/?page_id=16
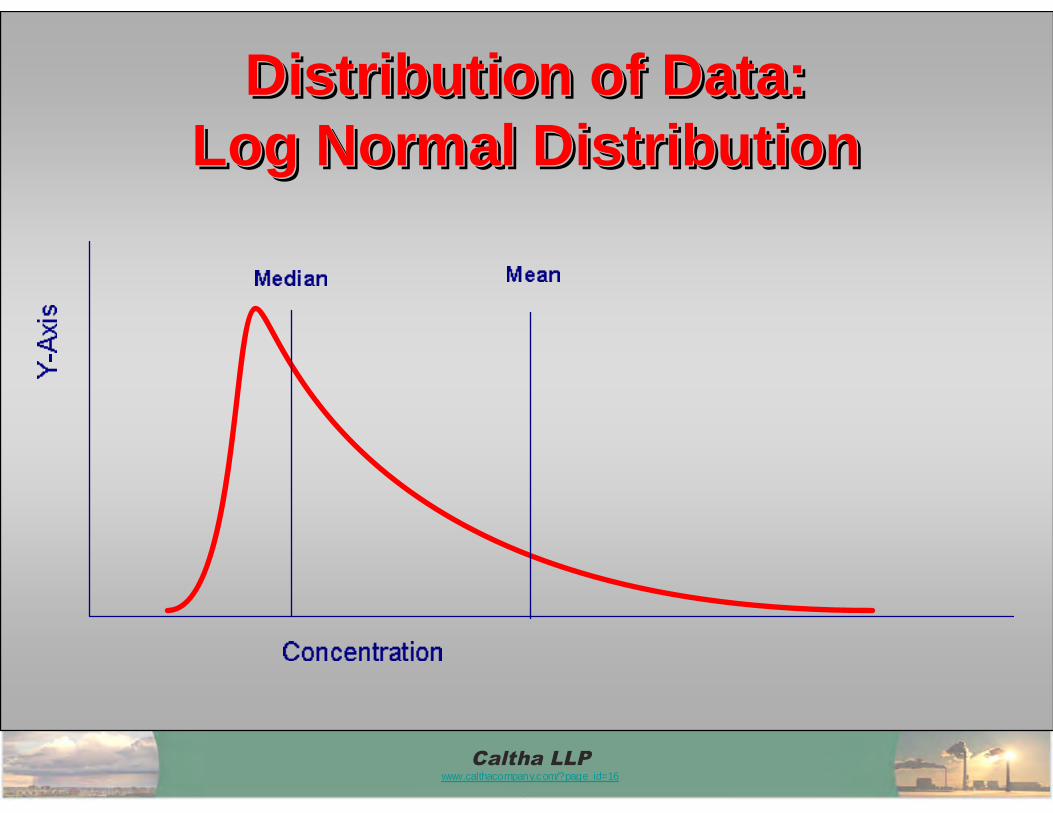
Distribution of Data:Log Normal Distribution
Distribution of Data:Distribution of Data:Log Normal DistributionLog Normal Distribution

Caltha LLPCaltha LLPwww.calthacompany.com/?page_id=16
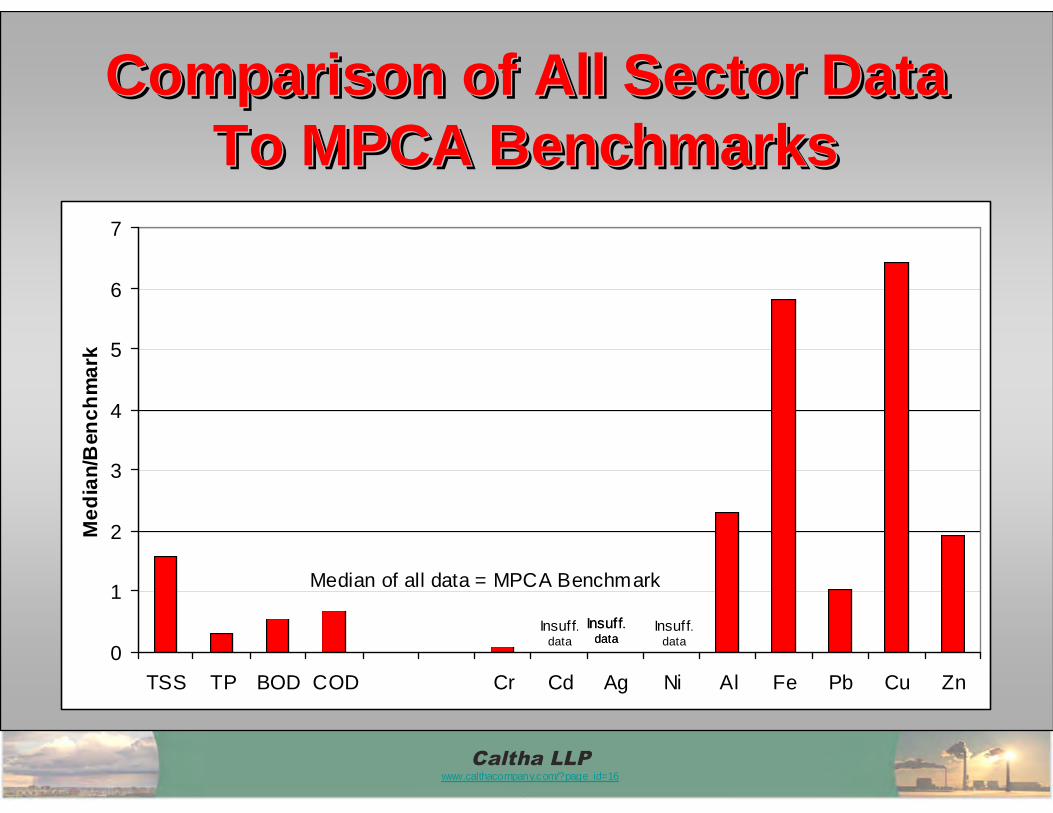
Comparison of All Sector DataTo MPCA Benchmarks
Comparison of All Sector DataComparison of All Sector DataTo MPCA BenchmarksTo MPCA Benchmarks
• Combine all 1995 industrial sectordata
• Compare MEDIAN to BenchmarkMedian (mg/L) / Benchmark (mg/L)
Caltha LLPCaltha LLPwww.calthacompany.com/?page_id=16
Comparison of All Sector DataTo MPCA Benchmarks
Comparison of All Sector DataComparison of All Sector DataTo MPCA BenchmarksTo MPCA Benchmarks
0
1
2
3
4
5
6
7
TSS TP BOD COD Cr Cd Ag Ni Al Fe Pb Cu Zn
Me
dia
n/B
en
ch
ma
rk
Median of all data = MPCA Benchmark
Insuff.data
Insuff.data
Insuff.data
Insuff.data

Caltha LLPCaltha LLPwww.calthacompany.com/?page_id=16
Individual Sector DataIndividual Sector DataIndividual Sector Data
• Conventional Wastewater Parameters» TSS, BOD, COD, TP
• Heavy metals» Fe, Zn
• Data expressed as “% of sector individualresults that exceed benchmark”
» e.g., probability that any one sample exceedsbenchmark
• Only presenting results for sectors that areassigned that chemical benchmark

Caltha LLPCaltha LLPwww.calthacompany.com/?page_id=16
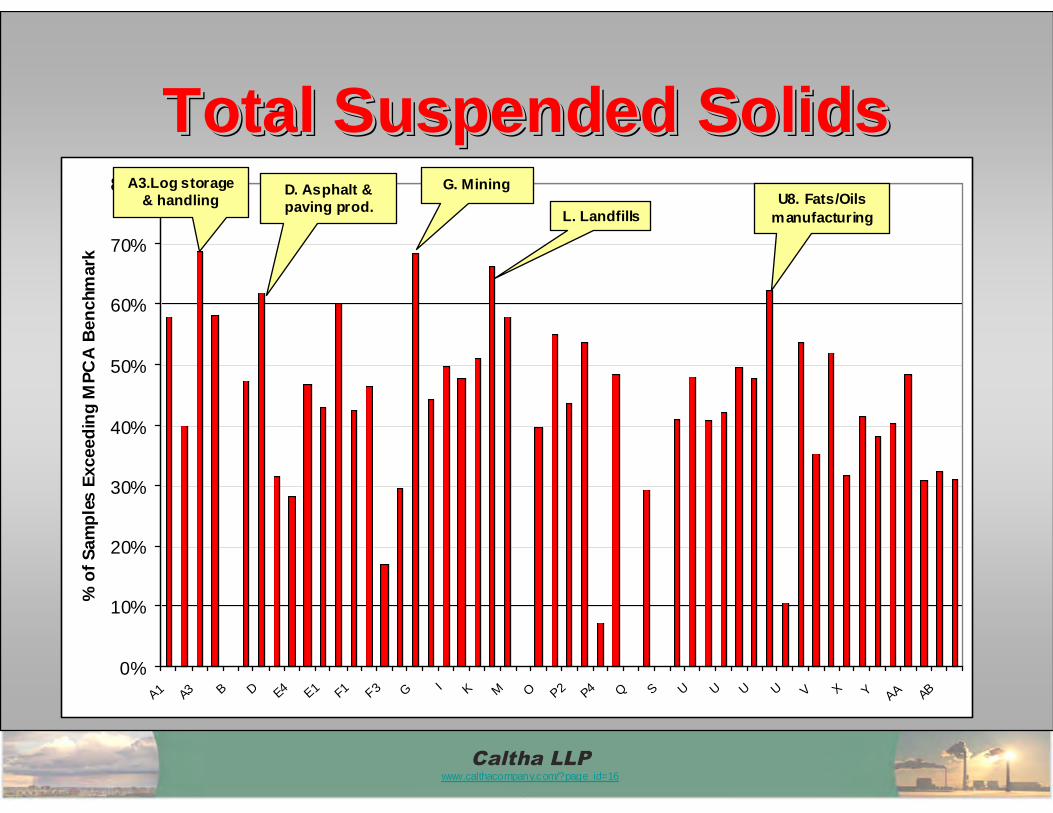
Total Suspended SolidsTotal Suspended SolidsTotal Suspended Solids
0%
10%
20%
30%
40%
50%
60%
70%
80%
A1 A3 B D E4 E1 F1 F3 G I K M O P2 P4 Q S U U U U V X Y AA AB
%o
fS
am
ple
sE
xceed
ing
MP
CA
Ben
chm
ark
Caltha LLPCaltha LLPwww.calthacompany.com/?page_id=16
Total Suspended SolidsTotal Suspended SolidsTotal Suspended Solids
0%
10%
20%
30%
40%
50%
60%
70%
80%
A1 A3 B D E4 E1 F1 F3 G I K M O P2 P4 Q S U U U U V X Y AA AB
%o
fS
am
ple
sE
xceed
ing
MP
CA
Ben
chm
ark
A3.Log storage& handling
D. Asphalt &paving prod.
G. Mining
L. LandfillsU8. Fats/Oils
manufacturing

Caltha LLPCaltha LLPwww.calthacompany.com/?page_id=16
Total Suspended SolidsTotal Suspended SolidsTotal Suspended Solids
0%
10%
20%
30%
40%
50%
60%
70%
80%
A1 A3 B D E4 E1 F1 F3 G I K M O P2 P4 Q S U U U U V X Y AA AB
%o
fS
am
ple
sE
xceed
ing
MP
CA
Ben
chm
ark
USPS

Caltha LLPCaltha LLPwww.calthacompany.com/?page_id=16
BODBODBOD
0%
20%
40%
60%
80%
A B D E E F F G I K M O P P Q S U U U U V X YAA AB
%o
fS
am
ple
sE
xc
eed
ing
MP
CA
Be
nch
mark

Caltha LLPCaltha LLPwww.calthacompany.com/?page_id=16
BODBODBOD
0%
20%
40%
60%
80%
A B D E E F F G I K M O P P Q S U U U U V X YAA AB
%o
fS
am
ple
sE
xc
eed
ing
MP
CA
Be
nch
mark
U8. Fats/Oils
manufacturing

Caltha LLPCaltha LLPwww.calthacompany.com/?page_id=16
CODCODCOD
0%
20%
40%
60%
80%
A C E E F H K N P P S U U U X Z AB
%o
fS
am
ple
sE
xce
ed
ing
MP
CA
Ben
ch
mark

Caltha LLPCaltha LLPwww.calthacompany.com/?page_id=16
CODCODCOD
0%
20%
40%
60%
80%
A C E E F H K N P P S U U U X Z AB
%o
fS
am
ple
sE
xce
ed
ing
MP
CA
Ben
ch
mark
U8. Fats/Oilsmanufacturing
A1. Saw Mills
Caltha LLPCaltha LLPwww.calthacompany.com/?page_id=16
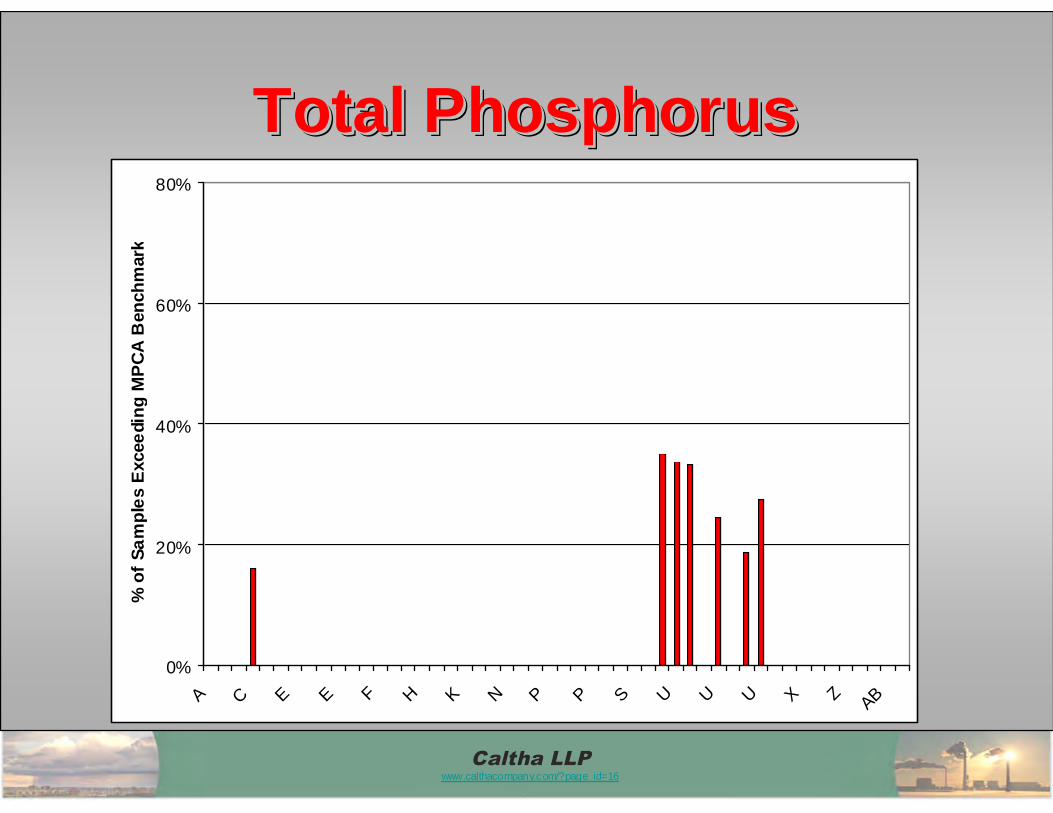
Total PhosphorusTotal PhosphorusTotal Phosphorus
0%
20%
40%
60%
80%
A C E E F H K N P P S U U U X ZAB
%o
fS
am
ple
sE
xcee
din
gM
PC
AB
en
ch
mark
Caltha LLPCaltha LLPwww.calthacompany.com/?page_id=16
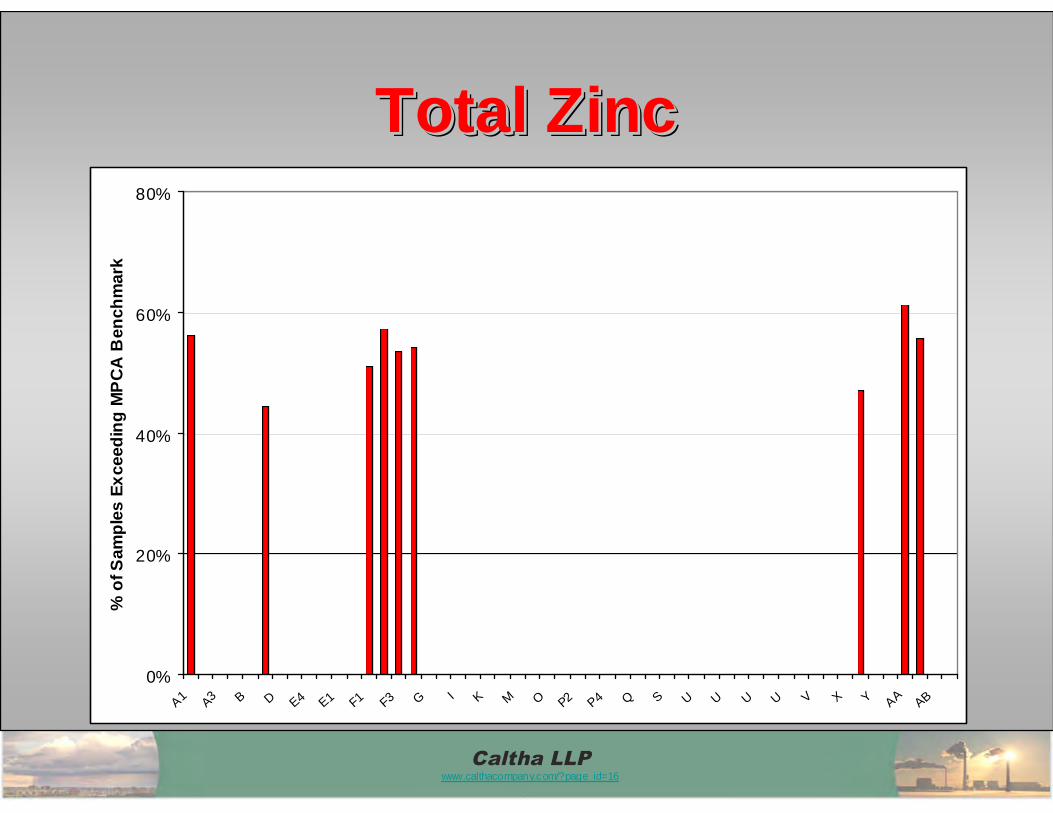
Total ZincTotal ZincTotal Zinc
0%
20%
40%
60%
80%
A1
A3 B D E4 E1 F1 F3 G I K M O P2 P4 Q S U U U U V X Y A
AAB
%o
fS
am
ple
sE
xceed
ing
MP
CA
Ben
ch
mark

Caltha LLPCaltha LLPwww.calthacompany.com/?page_id=16
Total IronTotal IronTotal Iron
0%
10%
20%
30%
40%
50%
60%
70%
80%
90%
100%
A C E E F H K N P P S U U U X Z AB
%o
fS
am
ple
sE
xce
ed
ing
MP
CA
Ben
ch
mark

Caltha LLPCaltha LLPwww.calthacompany.com/?page_id=16
Total IronTotal IronTotal Iron
0%
10%
20%
30%
40%
50%
60%
70%
80%
90%
100%
A C E E F H K N P P S U U U X Z AB
%o
fS
am
ple
sE
xce
ed
ing
MP
CA
Ben
ch
mark
M. Auto salvageF. Foundries
Caltha LLPCaltha LLPwww.calthacompany.com/?page_id=16
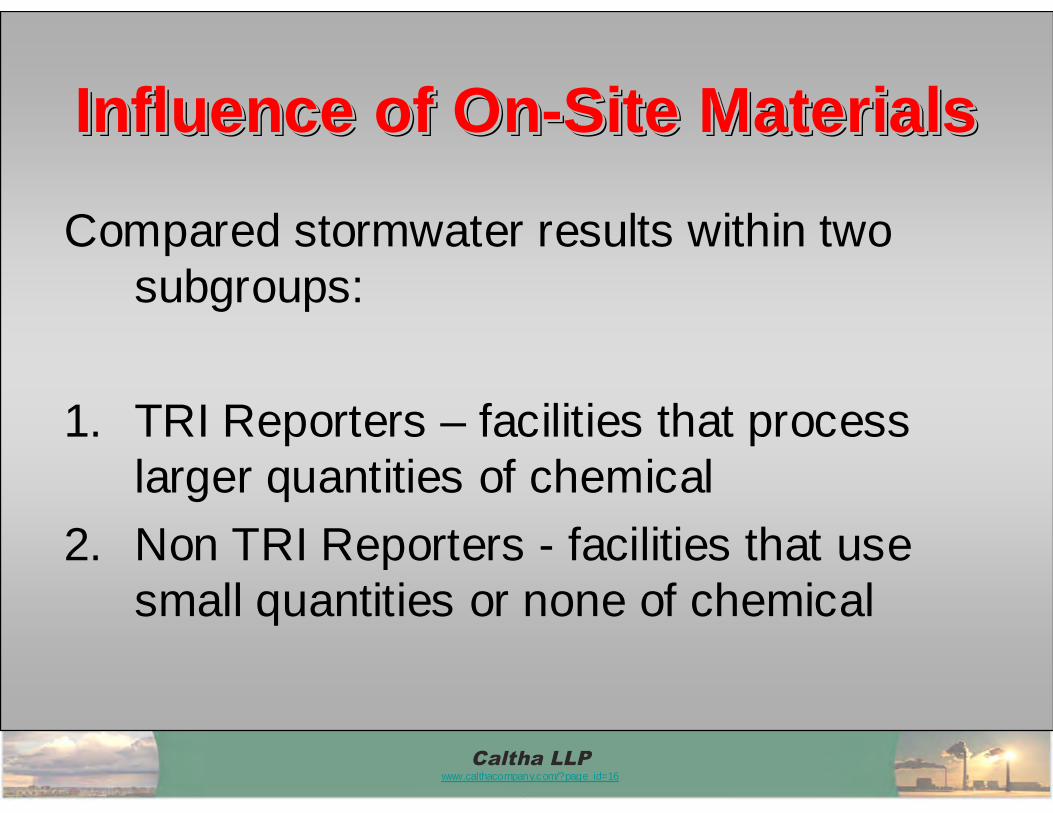
Influence of On-Site MaterialsInfluence of OnInfluence of On--Site MaterialsSite Materials
Compared stormwater results within twosubgroups:
1. TRI Reporters – facilities that processlarger quantities of chemical
2. Non TRI Reporters - facilities that usesmall quantities or none of chemical
Caltha LLPCaltha LLPwww.calthacompany.com/?page_id=16
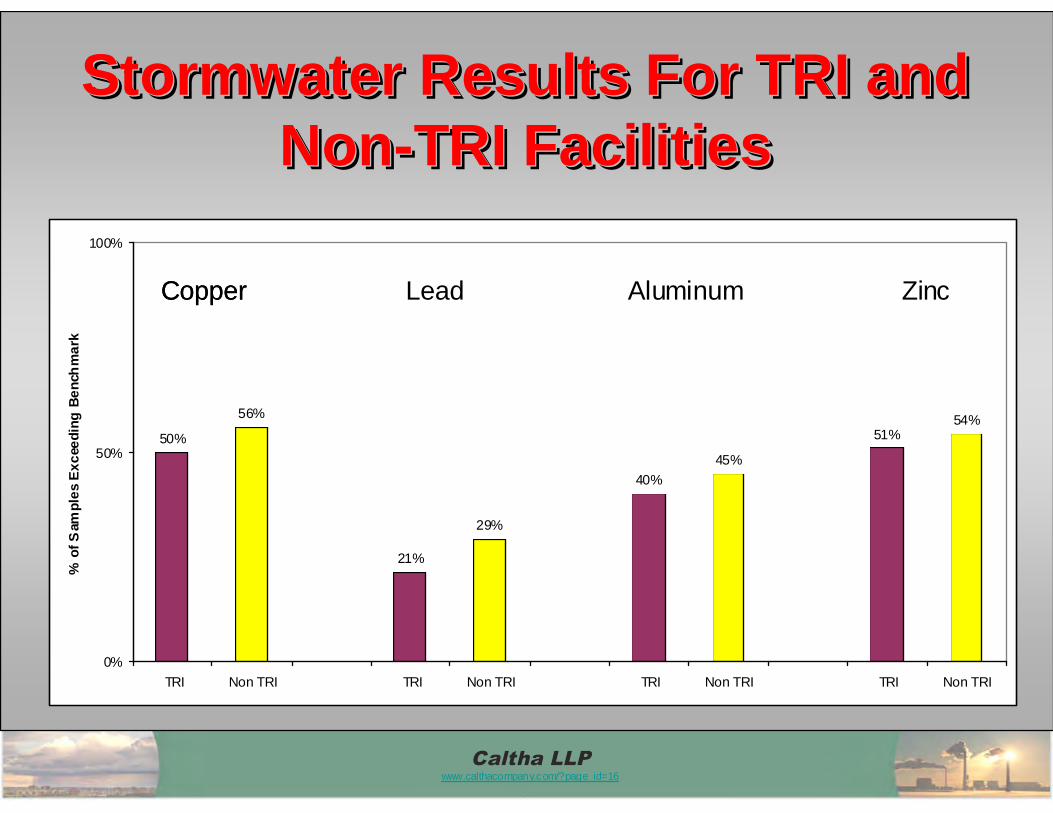
Stormwater Results For TRI andNon-TRI Facilities
Stormwater Results For TRI andStormwater Results For TRI andNonNon--TRI FacilitiesTRI Facilities
50%
56%
21%
29%
40%
45%
51%54%
0%
50%
100%
TRI Non TRI TRI Non TRI TRI Non TRI TRI Non TRI
%o
fS
amp
les
Ex
cee
din
gB
en
chm
ark
CopperCopper AluminumLead Zinc

Caltha LLPCaltha LLPwww.calthacompany.com/?page_id=16
What is the probability a facilitywill meet its benchmarks?
What is the probability a facilityWhat is the probability a facilitywill meet its benchmarks?will meet its benchmarks?
• Benchmarks are not compared to singlevalues
• Minimum of four quarterly samples arecollected
• Mean of all samples is compared tobenchmark concentration

Caltha LLPCaltha LLPwww.calthacompany.com/?page_id=16
Example 1995 Dataset: TSSSector P. Transportation/Warehousing
Example 1995 Dataset: TSSExample 1995 Dataset: TSSSector P. Transportation/WarehousingSector P. Transportation/Warehousing
Y-A
xis

Caltha LLPCaltha LLPwww.calthacompany.com/?page_id=16
Two Possible TSS BenchmarksTwo Possible TSS BenchmarksTwo Possible TSS BenchmarksY
-Axis
65 mg/LDischarges to
wetlands
100 mg/L
All other discharges
Caltha LLPCaltha LLPwww.calthacompany.com/?page_id=16
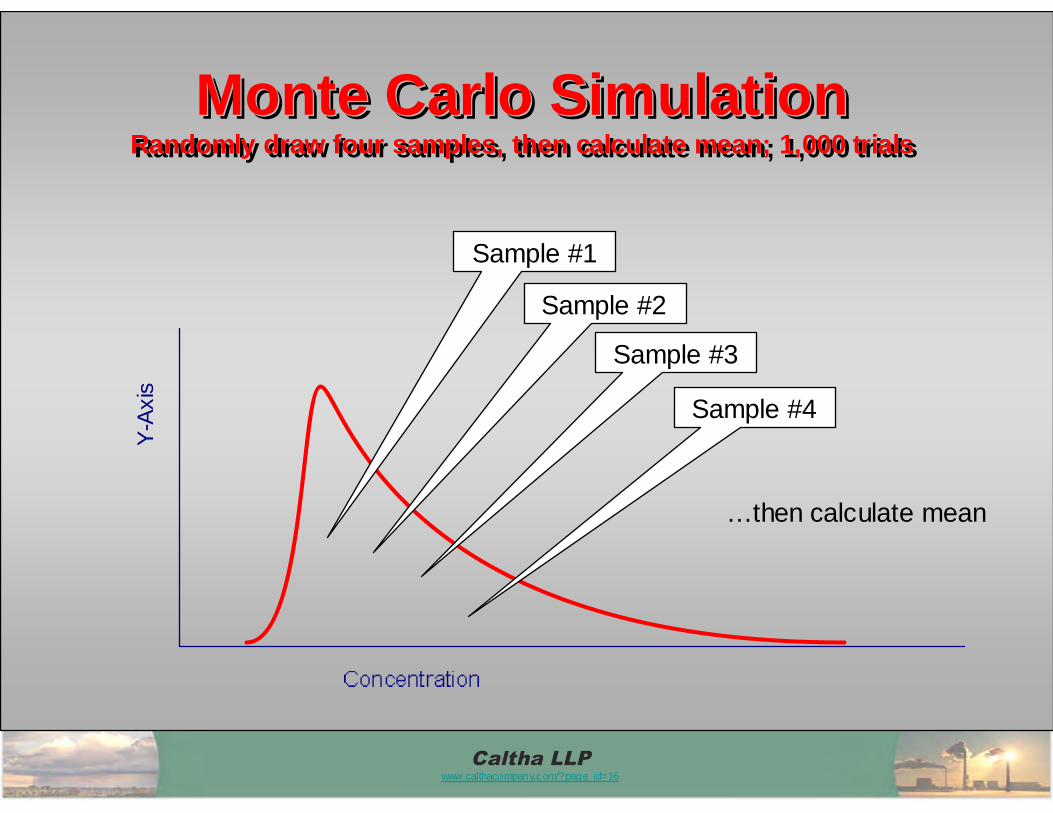
Monte Carlo SimulationRandomly draw four samples, then calculate mean; 1,000 trials
Monte Carlo SimulationMonte Carlo SimulationRandomly draw four samples, then calculate mean; 1,000 trialsRandomly draw four samples, then calculate mean; 1,000 trials
Y-A
xis
Sample #1
Sample #2
Sample #3
Sample #4
…then calculate mean

Caltha LLPCaltha LLPwww.calthacompany.com/?page_id=16
ResultsResultsResults
19%34%Existing data set
% facilities meeting
65 mg/L benchmark
% facilities meeting100 mg/L benchmark

Caltha LLPCaltha LLPwww.calthacompany.com/?page_id=16
Scenario 2: Cut-off HighConcentrations
Scenario 2: CutScenario 2: Cut--off Highoff HighConcentrationsConcentrations
Y-A
xis
Limithighestvalues to< 500mg/L

Caltha LLPCaltha LLPwww.calthacompany.com/?page_id=16
ResultsResultsResults
33%44%Limit high values(<500 mg/L)
19%34%Existing data set
% facilities meeting
65 mg/L benchmark
% facilities meeting100 mg/L benchmark

Caltha LLPCaltha LLPwww.calthacompany.com/?page_id=16
Scenario 3: ResampleTake two additional samples
Scenario 3: ResampleScenario 3: ResampleTake two additional samplesTake two additional samples
Y-A
xis
Sample #5
Sample #6

Caltha LLPCaltha LLPwww.calthacompany.com/?page_id=16
ResultsResultsResults
21%36%Two extra samples
33%44%Limit high values(<500 mg/L)
19%34%Existing data set
% facilities meeting
65 mg/L benchmark
% facilities meeting100 mg/L benchmark

Caltha LLPCaltha LLPwww.calthacompany.com/?page_id=16
ConclusionsConclusionsConclusions
• Benchmarks more likely to be exceededare:
» TSS
» Metals, especially iron
• All industrial sectors are equally likely toexceed benchmarks for TSS
• For toxic chemicals and metals, volumeof use or storage on-site is not a goodpredictor of meeting benchmarks
Caltha LLPCaltha LLPwww.calthacompany.com/?page_id=16
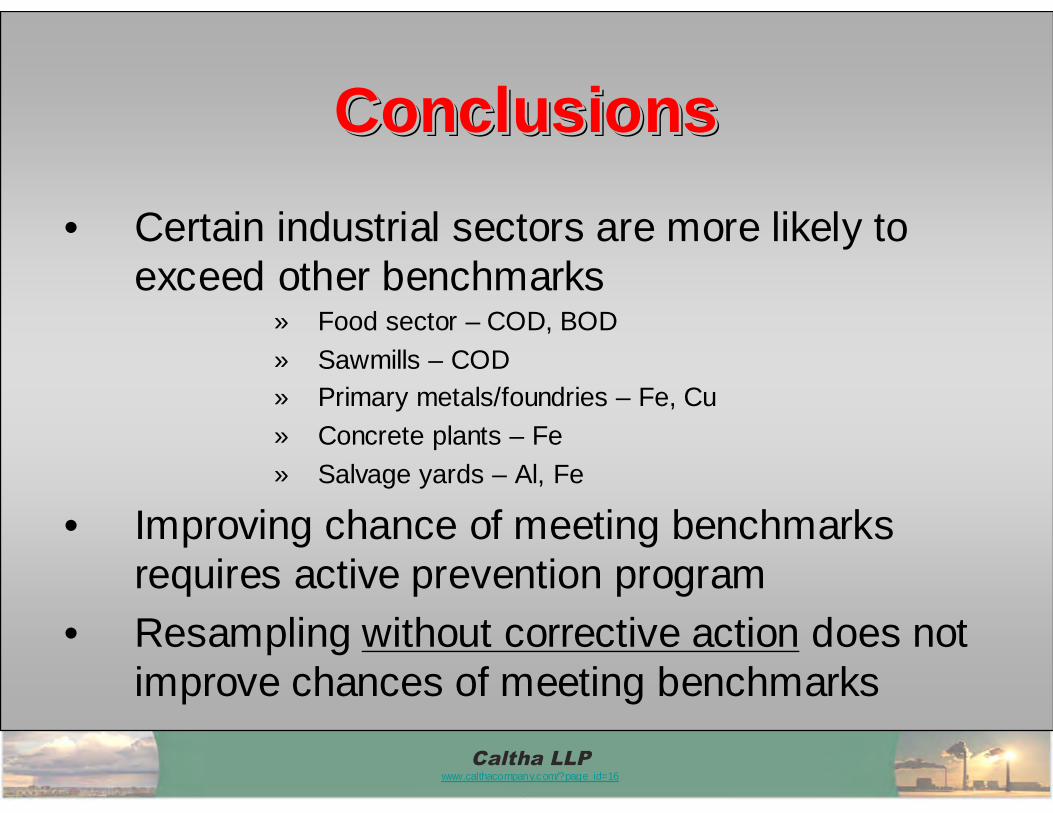
ConclusionsConclusionsConclusions
• Certain industrial sectors are more likely toexceed other benchmarks
» Food sector – COD, BOD
» Sawmills – COD
» Primary metals/foundries – Fe, Cu
» Concrete plants – Fe
» Salvage yards – Al, Fe
• Improving chance of meeting benchmarksrequires active prevention program
• Resampling without corrective action does notimprove chances of meeting benchmarks

Caltha LLPCaltha LLPwww.calthacompany.com/?page_id=16
QuestionsQuestionsQuestions
Loren LarsonCaltha LLP
Minneapolis, [email protected]
(763) 208-6430