comparison of network inference packages and methods for … · 2020-03-02 · other related...
TRANSCRIPT

Comparison of network inference packages andmethods for multiple networks inference
Nathalie Villa-Vialaneixhttp://www.nathalievilla.org
1ères Rencontres R - BoRdeaux, 3 Juin 2012
Joint work with Nicolas Edwards, Laurence Liaubet, NathalieViguerie & Magali SanCristobal
R for multiple networks inference (RR 2012) Nathalie Villa-Vialaneix BoRdeaux, 06/03/2012 1 / 17

From transcriptomic data to network
Plan
1 From transcriptomic data to network
2 Network inference and multiple networks inference using R
3 Simulations
R for multiple networks inference (RR 2012) Nathalie Villa-Vialaneix BoRdeaux, 06/03/2012 2 / 17

From transcriptomic data to network
Transcriptome
• DNA contains the genetic instructionsused in the development andfunctioning of living organims
• Molecular unit of the DNA, genes, arenot all identically expressed in a givencell: it is assessed by means of thequantity of the corresponding mRNA
• Genes expression can be measured bymicroarray, RT PCR...: transcriptomicdata
R for multiple networks inference (RR 2012) Nathalie Villa-Vialaneix BoRdeaux, 06/03/2012 3 / 17

From transcriptomic data to network
Modelling multiple interactions between genes with anetworkCo-expression networks
• nodes: genes
• edges: “direct” co-expressionbetween two genes
Co-expression networks
• nodes: genes
• edges: “direct” co-expression between two genes
Method:
“Correlations” Thresholding Graph
R for multiple networks inference (RR 2012) Nathalie Villa-Vialaneix BoRdeaux, 06/03/2012 4 / 17

From transcriptomic data to network
Modelling multiple interactions between genes with anetworkCo-expression networks
• nodes: genes
• edges: “direct” co-expression between two genes
Method:
“Correlations” Thresholding GraphR for multiple networks inference (RR 2012) Nathalie Villa-Vialaneix BoRdeaux, 06/03/2012 4 / 17

From transcriptomic data to network
Multiple networks inferenceTranscriptomic data coming from several different conditions.Examples:• genes expression from pig muscle in Landrace and Large white
breeds;• genes expression from obese humans after and before a diet.
• Assumption: Acommon functioningexists regardless thecondition;
• Which genes arecorrelatedindependentlyfrom/depending on thecondition?
R for multiple networks inference (RR 2012) Nathalie Villa-Vialaneix BoRdeaux, 06/03/2012 5 / 17

Network inference and multiple networks inference using R
Plan
1 From transcriptomic data to network
2 Network inference and multiple networks inference using R
3 Simulations
R for multiple networks inference (RR 2012) Nathalie Villa-Vialaneix BoRdeaux, 06/03/2012 6 / 17
Network inference and multiple networks inference using R
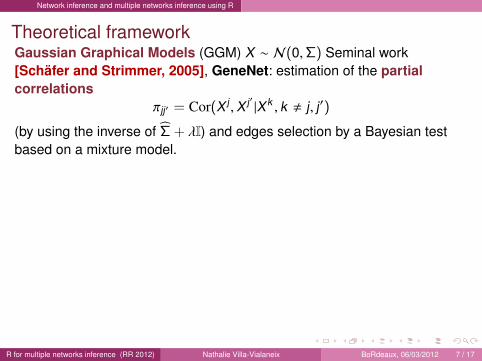
Theoretical frameworkGaussian Graphical Models (GGM) X ∼ N(0,Σ) Seminal work[Schäfer and Strimmer, 2005], GeneNet: estimation of the partialcorrelations
πjj′ = Cor(X j ,X j′ |Xk , k , j, j′)
(by using the inverse of Σ̂ + λI) and edges selection by a Bayesian testbased on a mixture model.
Edges selection by sparse penalty: graphicalLASSO [Meinshausen and Bühlmann, 2006, Friedman et al., 2008],glasso:
X j =∑k,j
βjk Xk + ε.
where (βjk )jk are estimated by
max(βjk )k,j
log MLj − λ∑k,j
|βjk |
.βjk is related to S = Σ−1 by βjk = −
SjkSjj
.Other related packages: parcor (different regularization methods forGGM, CV selection), GGMselect (network selection among a family): notused here
R for multiple networks inference (RR 2012) Nathalie Villa-Vialaneix BoRdeaux, 06/03/2012 7 / 17

Network inference and multiple networks inference using R
Theoretical frameworkGaussian Graphical Models (GGM) X ∼ N(0,Σ) Edges selection bysparse penalty: graphical LASSO[Meinshausen and Bühlmann, 2006, Friedman et al., 2008], glasso:
X j =∑k,j
βjk Xk + ε.
where (βjk )jk are estimated by
max(βjk )k,j
log MLj − λ∑k,j
|βjk |
.βjk is related to S = Σ−1 by βjk = −
SjkSjj
.
Other related packages: parcor (different regularization methods forGGM, CV selection), GGMselect (network selection among a family): notused here
R for multiple networks inference (RR 2012) Nathalie Villa-Vialaneix BoRdeaux, 06/03/2012 7 / 17

Network inference and multiple networks inference using R
Theoretical frameworkGaussian Graphical Models (GGM) X ∼ N(0,Σ) Edges selection bysparse penalty: graphical LASSO[Meinshausen and Bühlmann, 2006, Friedman et al., 2008], glasso:
X j =∑k,j
βjk Xk + ε.
where (βjk )jk are estimated by
max(βjk )k,j
log MLj − λ∑k,j
|βjk |
.βjk is related to S = Σ−1 by βjk = −
SjkSjj
.Other related packages: parcor (different regularization methods forGGM, CV selection), GGMselect (network selection among a family): notused here
R for multiple networks inference (RR 2012) Nathalie Villa-Vialaneix BoRdeaux, 06/03/2012 7 / 17

Network inference and multiple networks inference using R
Multiple networksIndependent estimations: if c = 1, . . . ,C are different samples (or“conditions”, e.g., breeds or before/after diet...)
max(βc
jk )k,j,c=1,...,C
∑c
log MLcj − λ
∑k,j
|βcjk |
.
Joint estimations: Additional tested approaches:• Use the fact that individuals are paired (if concerned) to compute the
partial correlations: X̂ci = 1/2Xc
i + 1/2Xi with Xi =∑
c X̂ci
(implemented with GeneNet and simone)• Combine the partial correlations instead of the correlations as in
Intertwined (implemented from independent estimations obtainedusing simone, called “therese”)
R for multiple networks inference (RR 2012) Nathalie Villa-Vialaneix BoRdeaux, 06/03/2012 8 / 17

Network inference and multiple networks inference using R
Multiple networksIndependent estimations: if c = 1, . . . ,C are different samples (or“conditions”, e.g., breeds or before/after diet...)
max(βc
jk )k,j,c=1,...,C
∑c
log MLcj − λ
∑k,j
|βcjk |
.Joint estimations:
Implemented in the package simone, [Chiquet et al., 2011]
GroupLasso Consensual network between conditions (enforces identicaledges by a group LASSO penalty)
CoopLasso Sign-coherent network between conditions (prevents edgesthat corresponds to partial correlations having differentsigns; thus allows one to obtain a few differences betweenthe conditions)
Intertwined In GLasso replace Σ̂c by 1/2Σ̂c + 1/2Σ where Σ = 1C∑
c Σ̂c
Additional tested approaches:• Use the fact that individuals are paired (if concerned) to compute the
partial correlations: X̂ci = 1/2Xc
i + 1/2Xi with Xi =∑
c X̂ci
(implemented with GeneNet and simone)• Combine the partial correlations instead of the correlations as in
Intertwined (implemented from independent estimations obtainedusing simone, called “therese”)
R for multiple networks inference (RR 2012) Nathalie Villa-Vialaneix BoRdeaux, 06/03/2012 8 / 17

Network inference and multiple networks inference using R
Multiple networksIndependent estimations: if c = 1, . . . ,C are different samples (or“conditions”, e.g., breeds or before/after diet...)
max(βc
jk )k,j,c=1,...,C
∑c
log MLcj − λ
∑k,j
|βcjk |
.Joint estimations: Additional tested approaches:• Use the fact that individuals are paired (if concerned) to compute the
partial correlations: X̂ci = 1/2Xc
i + 1/2Xi with Xi =∑
c X̂ci
(implemented with GeneNet and simone)• Combine the partial correlations instead of the correlations as in
Intertwined (implemented from independent estimations obtainedusing simone, called “therese”)
R for multiple networks inference (RR 2012) Nathalie Villa-Vialaneix BoRdeaux, 06/03/2012 8 / 17
Network inference and multiple networks inference using R
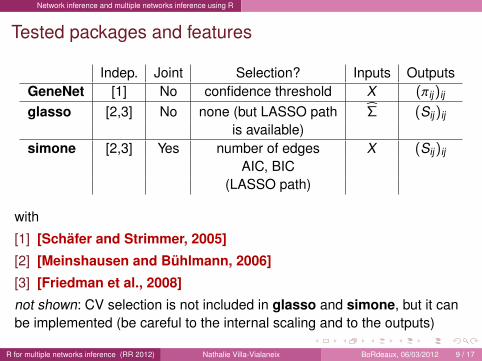
Tested packages and features
Indep. Joint Selection? Inputs OutputsGeneNet [1] No confidence threshold X (πij)ij
glasso [2,3] No none (but LASSO path Σ̂ (Sij)ij
is available)simone [2,3] Yes number of edges X (Sij)ij
AIC, BIC(LASSO path)
with
[1] [Schäfer and Strimmer, 2005]
[2] [Meinshausen and Bühlmann, 2006]
[3] [Friedman et al., 2008]
not shown: CV selection is not included in glasso and simone, but it canbe implemented (be careful to the internal scaling and to the outputs)
R for multiple networks inference (RR 2012) Nathalie Villa-Vialaneix BoRdeaux, 06/03/2012 9 / 17

Simulations
Plan
1 From transcriptomic data to network
2 Network inference and multiple networks inference using R
3 Simulations
R for multiple networks inference (RR 2012) Nathalie Villa-Vialaneix BoRdeaux, 06/03/2012 10 / 17

Simulations
Data
Datasets coming from
The ANR project “DéLiSus” (“caractérisationsgénétique et phénotypique fines de populations porcines françaises”,genetic and phenotypic variability of French pigs)
The pan-European project “DiOGenes” (Diet, Obesityand Genes: new insight on obesity problems and routes to prevention)
R for multiple networks inference (RR 2012) Nathalie Villa-Vialaneix BoRdeaux, 06/03/2012 11 / 17

Simulations
Datasets descriptionReal datasets
“DiOGenes” dataset:• variables: 39 variables (genes
expressions and clinical variables)
• conditions: before/after a diet (pairedindividuals: 204 obese women)
“DeLiSus” dataset:• variables: expression of 123 genes
• conditions: two breeds (33 “Landrace”and 51 “Large white”)
Simulated datasetTo compare methods, a dataset was simulated from a GGM (withsimone):• underlying network: 39 variables with 5 groups of preferential attachment and a
density equal to approximatly 3-4%.
• children networks: two networks obtained by randomly permuting 10% of theedges;
• variables: 2 × 204 observations of a GGM coming from these networks(observations are not pairwise).
R for multiple networks inference (RR 2012) Nathalie Villa-Vialaneix BoRdeaux, 06/03/2012 12 / 17

Simulations
Simulation results and conclusionsAll methods
Precision= tpp
Recall= tptp+fn
• glasso performs well(with very lowvariability) but no realsolution for tuning;
• simone performswell (especially jointmethods), with anautomatic tuning butlarge variability;
• “therese” has a lowvariability but no realsolution for tuning;
• GeneNet has a lowrecall and a lowvariability.
Numerical performances
Graph densitiesTrue density: 3.57% (on average)• GeneNet (automatic): 4.38%
• glasso (manual): 8.14%
• simone (indep, BIC): 6.65% and simone (joint, BIC): 5.87%
• “therese” (semi manual): 5.26%
Shared edges between conditionsTruth: 20.28% (on average)• GeneNet (automatic): 15.95%
• glasso (manual): 32.74%
• simone (indep, BIC): 26.69% and simone (joint, BIC): 31.15%
• “therese” (semi manual): 30.92%
R for multiple networks inference (RR 2012) Nathalie Villa-Vialaneix BoRdeaux, 06/03/2012 13 / 17

Simulations
Simulation results and conclusionsNumerical performances
Graph densitiesTrue density: 3.57% (on average)• GeneNet (automatic): 4.38%
• glasso (manual): 8.14%
• simone (indep, BIC): 6.65% and simone (joint, BIC): 5.87%
• “therese” (semi manual): 5.26%
Shared edges between conditionsTruth: 20.28% (on average)• GeneNet (automatic): 15.95%
• glasso (manual): 32.74%
• simone (indep, BIC): 26.69% and simone (joint, BIC): 31.15%
• “therese” (semi manual): 30.92%
R for multiple networks inference (RR 2012) Nathalie Villa-Vialaneix BoRdeaux, 06/03/2012 13 / 17

Simulations
“DiOGenes” dataset (39 variables, 204 obese women, fixed density 5%)
Density Transitivity % shared[1] GeneNet 0.06 0.22 0.68[2] GeneNet (paired) 0.09 0.24 0.84[3] simone (indep., Fried.) 0.05 0.52 0.76[4] simone, CoopLasso 0.06 0.30 1.00[5] simone, GroupLasso 0.06 0.30 1.00[6] simone, intertwined 0.05 0.37 0.97[7] simone, paired 0.04 0.52 0.94[8] “therese” 0.05 0.46 0.82
[1] [2] [3] [4] [5] [6] [7] [8][1] 1.00 0.98 0.45 0.61 0.61 0.53 0.42 0.42[2] 1.00 0.58 0.66 0.66 0.66 0.55 0.58[3] 1.00 0.79 0.79 0.84 1.00 0.92[4] 1.00 1.00 0.95 0.76 0.76[5] 1.00 0.95 0.76 0.76[6] 1.00 0.82 0.79[7] 1.00 0.97[8] 1.00
R for multiple networks inference (RR 2012) Nathalie Villa-Vialaneix BoRdeaux, 06/03/2012 14 / 17

Simulations
“DeLiSus” dataset (restricted dataset with 84 genes (51 pigs))
Density Transitivity % shared[1] GeneNet 0.00 0.71 0.46[2] simone, MB-AND 0.05 0.08 0.17[3] simone, Fried. 0.05 0.19 0.22[4] simone, intertwined 0.05 0.09 0.52[5] simone, CoopLasso 0.06 0.09 0.88[6] simone, GroupLasso 0.04 0.07 0.99[7] “therese” 0.05 0.17 0.66
[1] [2] [3] [4] [5] [6] [7]
[1] 1.00 0.00 0.00 0.00 0.00 0.00 0.00[2] 1.00 0.71 0.76 0.64 0.56 0.57[3] 1.00 0.67 0.55 0.53 0.78[4] 1.00 0.80 0.67 0.58[5] 1.00 0.84 0.60[6] 1.00 0.74[7] 1.00
R for multiple networks inference (RR 2012) Nathalie Villa-Vialaneix BoRdeaux, 06/03/2012 15 / 17

Simulations
Conclusion
• simulations: BIC is not always relevant⇒ target density, CV,GGMselect...? Joined methods produce more shared edges betweenconditions
• real life datasets• low dimension case: large consensus between methods; joined
methods are too similar (except maybe paired GeneNet and “therese”)• larger dimension case: methods are less consensual; GroupLasso
and CoopLasso still produce too much shared edges• very large dimension (not shown): 464 gene expressions for 51 + 33
pigs gave very bad performances: on real dataset, some methods wereunable to produce results (and BIC selected graphs with no edge);hence, on simulated datasets with the same sample size anddimension, the recall was always very low.
R for multiple networks inference (RR 2012) Nathalie Villa-Vialaneix BoRdeaux, 06/03/2012 16 / 17

References
CollaborationAny questions?...
Co-authors
Nathalie Villa-Vialaneix Nicolas Edwards Laurence Liaubet(SAMM, U. Paris 1) (LGC, INRA Tlse) (LGC, INRA Tlse)
Nathalie Viguerie Magali SanCristobal(ORL, INSERM) (LGC, INRA Tlse)
R for multiple networks inference (RR 2012) Nathalie Villa-Vialaneix BoRdeaux, 06/03/2012 17 / 17

References
Chiquet, J., Grandvalet, Y., and Ambroise, C. (2011).Inferring multiple graphical structures.Statistics and Computing, 21(4):537–553.
Friedman, J., Hastie, T., and Tibshirani, R. (2008).Sparse inverse covariance estimation with the graphical lasso.Biostatistics, 9(3):432–441.
Meinshausen, N. and Bühlmann, P. (2006).High dimensional graphs and variable selection with the lasso.Annals of Statistic, 34(3):1436–1462.
Schäfer, J. and Strimmer, K. (2005).An empirical bayes approach to inferring large-scale gene association networks.Bioinformatics, 21(6):754–764.
R for multiple networks inference (RR 2012) Nathalie Villa-Vialaneix BoRdeaux, 06/03/2012 17 / 17