comparison of p-t limit curves of opr-1000 and vver-1000 ... · -1000 reactor vessel is regulated...
TRANSCRIPT
Comparison of P-T Limit Curves of OPR-1000
and VVER-1000 RPV based on ASME Code Rule
Ihn Namgung1*, Nguyen Dang Dinh,2 Nuclear Power Plant Engineering Department
KEPCO International Nuclear Graduate School
Ulsan, South Korea
Abstract— The mechanical properties of reactor pressure
vessel (RPV) continuously changes after the start of NPP
operation mainly due to radiation irradiation. One of the
prominent effect is irradiation embrittlement and as time goes
by the material becomes more brittle. Because of this
embrittlement, the operation of reactor pressure vessel should
be carefully maneuvered to avoid brittle fracture. Hence the
rate of heatup and cooldown and associated pressure control,
which frequently repeated in plant operation, need to follow
certain operational guide lines called P-T limit curve. Depending
on the temperature of reactor vessel, the internal pressure shall
be limited to lower than certain level. For this reason, pressure
and temperature during heatup and cooldown processes should
follow allowed range of pressure and temperature to prevent
brittle fracture. Of all pressure boundary component of primary
coolant system of NPP, the welded region of reactor pressure
vessel degrade most due to the radiation embrittlement. The P-T
limit curves for OPR-1000 and VVER-1000 reactor pressure
vessel was investigated and compared. For OPR1000 family of
reactors including APR1400 reactor, P-T limit curves were
constructed following rules defined in KEPIC code (which is
based on the ASME Code) for safe operation NPP, whereas
VVER type reactors, it was constructed according to the rules of
Russian code. This study compares the P-T limit curves of OPR-
1000 and that of VVER 1000 reactor vessel according to
Appendix G of the ASME Boiler and Pressure Vessel Code
Section XI. Some of the significant differences are the minimum
boltup temperature and lowest service temperature (LST) of
OPR-1000 is 21.1°C and 77.8°C and those for VVER-1000 is
16.74°C and 30.6°C respectively. The lowest core critical
temperature for OPR-1000 is 77.8°C and that for VVER-1000 is
63.8°C and corresponding maximum allowable pressure for
OPR-1000 is 500 psi while that for VVER-1000 1200 psi.
Keywords— Radiation embrittlement, Pressure temperature
limit curve, prevention of nuclear reactor fracture, Operational
limit of pressurized water cooled raector, OPR-1000 reactor P-T
limit curve; VVER-1000 ractor P-T limit curve
I. INTRODUCTION
At high neutron fluences, material damage on
microstructural grain boundary and element transmutation
occurs causing swelling and embrittlement. The radiation
embrittlement of reactor pressure vessel of great concern in
the operation of NPP. Therefore strict guide lines are given
for the transient operation of reactor such as heat-up or cool-
down [1]. It is usually considered that welded region is more
susceptible to radiation embrittlement since the weld material
contain more trace element than base metal. Some of the
trace element cause adversely to the structural integrity of
RPV [2][3][4].
At low temperature reactor vessel material might exhibit
brittle behavior, and in order to prevent such event
happening, pressure should be lowered so that the postulated
crack at the vessel wall is within the limit of stress intensity
value at the temperature. On the other hand too low a
pressure may initiate nucleate boiling in the core which is
also limiting factor since it also causes inhibit proper heat
transfer to coolant and may cause damage to the fuel. Another
consideration is that the closure head stud bolts are tightly
fastened during operation and the bolting region is in higher
stress condition than other part of reactor pressure vessel. So
stud and surrounding region is much higher stress state and
that is susceptible to low temperature brittle fracture. These
are some major considerations in setting up pressure-
temperature limit curves [5].
During startup and shutdown as well as reactor trip, all
components in the reactor coolant system (RCS) have to
withstand all operating loads of temperature and pressure due
to NPP operation mode changes. In order to protect reactor
pressure vessel from brittle fracture, pressure - temperature (P
–T) limit curves is constructed to be used as operational
guideline of reactor operation and maintain NPP within safe
state. During the construction of P-T limit curves for OPR-
1000 and VVER-1000 reactor vessels, the beltline region
which is most critical part of reactor vessel due to the
susceptibility of brittle fracture. VVER-1000 reactor is
manufactured by beltline weld for form RPV. The fabrication
step of VVER-1000 reactor is shown in Figure 1. Although
OPR-1000 does not have welded part within core region, it is
conservatively assumed that the belt-line region of reactor is
welded connection of lower head and cylindrical shell [6][7].
II. IMPORTANT PARAMETERS OF OPR-1000 AND
VVER-1000 REACTOR VESSELS
A. RPV MATERIAL
OPR-1000 and VVER-1000 RPV are made from ferritic
steels, but their composition, standard designation, and
fabrication technique are differential. For example OPR-1000
specified American Society of Mechanical Engineers ASME
SA508 for vessel, meanwhile material of VVER pressure
vessel is 15Kh2NMFA [1].
Figure 1 shows the fabrication process of OPR-1000
reactor vessel and VVER-1000 reactor vessel where the
difference of irradiation sensitive core region of the tow
reactor is shown. In the figure, the beltline is the region of the
reactor vessel that directly surrounds the effective height of 1
International Journal of Engineering Research & Technology (IJERT)
ISSN: 2278-0181
www.ijert.orgIJERTV4IS090342
(This work is licensed under a Creative Commons Attribution 4.0 International License.)
Vol. 4 Issue 09, September-2015
545

active core and corresponding to highest neutron fluence
region [1].
Irradiation induced mechanical property changes of
SA508 for OPR-1000 and 15Kh2NMFA in case of VVER-
1000. The property change depends significantly upon the
amount of residual elements present in the compositions of
material such as copper, phosphorus, and nickel. Table 1
below shows typical value of chemical composition of SA-
508 and 15Kh2NMFA. The impurity contents are slightly
different from OPR-1000 to VVER-1000 RPV. It is note that
the copper and phosphorus are considered in nil ductility
temperature (NDT) evaluation and fracture toughness
prediction in Russian code whereas US.NRC guide includes
copper and nickel.
a) OPR1000 reactor vessel fabrication process and
weld locations
b) VVER-1000 reactor vessel fabrication process and
nozzle locations
Figure 1. Fabrication and assembly process of OPR1000 and VVER-1000
reactor vessel
Table 1 - Cu, Ni, and P constituents for OPR-1000 and
VVER-1000 reactor vessels
Constituent
OPR
reactor vessel base
metal
OPR
reactor vessel
weld metal
VVER
reactor vessel base
metal
VVER reactor
vessel
weld metal
Cu 0.03 0.03 0.07 0.04
Ni 1 0.1 1.11 1.71
P 0.012 0.012 0.012 0.012
B. NEUTRON ENERGY SPECTRUM AND NEUTRON
FLUENCES
The neutron exposure has to be determined from the
surveillance specimens. The calculation is focused on the
determination of the lead factor, which represents the ratio of
exposure of the surveillance specimen to the highest
anticipated exposure at the RPV wall. Fluence definition of
VVER-1000 and OPR-1000 is different. For VVER’s,
neutrons with energies greater than 0.5 MeV are considered to
form the fluence that is considered in vessel property change
correlations. For PWR this energy boundary is taken to be 1
MeV. Table 2 shows design operating lifetime fluence for
light water cooled reactors [8] [9].
TABLE 2. DESIGN OPERATING LIFETIME FLUENCE
FOR LIGHT WATER COOLED REACTORS
Reactor type
Flux
(n/m2s) (E > 1 MeV)
Lifetime fluence
(n/m2) (E > 1 MeV)
VVER-440 core weld 1.2×10¹⁵ 1.1 ×1024
VVER-440 maximum 1.5×10¹⁵ 1.6×1024
VVER-1000 3-4×10¹⁴ 3.7×10²³
PWR (OPR) 4×10¹⁴ 4×10²³
PWR (B&W) 1.2×10¹⁴ 1.2×10²³
BWR 4×10¹³ 4×10²²
C. REGULATORY APPROACHES FOR ∆RTNDT
The national regulatory documents in connection with
irradiation sensitivity of steels are defined in Regulatory
Guide 1.99 Revision 2 in the USA, and OPR-1000 is
regulated under similar rule that follows US regulations, and
VVER-1000 reactor vessel is regulated under PNAE-G-7-
002-86 in Russia. The main differences in regulatory
approaches come from neutron spectrum considered and steel
compositions. Russian code identifies copper and phosphorus
whereas the US identifies copper and nickel as significant in
analysis that will be basic to find chemistry factor for
calculation of ∆RTNDT [8][9].
Neutron fluence and chemical composition are the most
relevant factors in radiation embrittlement. The general
expression of ∆RTNDT may be reduced to the following [8]:
∆RTNDT = CF × FF
Where CF is the chemical factor, and FF is the fluence
factor (n) [8].
In the US, the fracture toughness curve is used to find
equivalent temperature T-∆RTNDT. ∆RTNDT is the reference
temperature for nil ductility transition and is defined in
International Journal of Engineering Research & Technology (IJERT)
ISSN: 2278-0181
www.ijert.orgIJERTV4IS090342
(This work is licensed under a Creative Commons Attribution 4.0 International License.)
Vol. 4 Issue 09, September-2015
546
ASME code. The increase in ∆RTNDT due to radiation
exposure is evaluated according to the Code of Federal
Regulations, Title 10, Part 50, Appendix G [8]. The predictive
formula is defined in US Regulatory Guide 1.99 Revision 2
[8].
In VVER reactors, the neutron irradiation effects on
mechanical properties are characterized by a shift of critical
temperature of brittleness, . The transition temperature, in
irradiated condition is determined directly from irradiated
Charpy V-notch test results, using the regulatory definition of
the transition temperature [9][10].
III. THE NORMAL OPERATION PRESSURE -
TEMPERATURE LIMIT CURVE CONSTRUCTION
PROCEDURE
For the safe normal operation of RPV, the operation
should follow certain operation path call P-T curve. This
curve is a result of consideration of material degradation due
to radiation exposure of RPV beltline. The most provable
failure mode fracture mode I, which is fast fracture failure due
to tensile stress. This condition is expressed as follows
[11][12]
KIC ≥ 2KIM + KIT (1)
Where KIC = Reference critical stress intensity factor
specified by Figure G-2210-1 [10]
KIM = Stress intensity factor for membrane stress
due to pressure, and is defined as KIM = 𝛔mMm
Mm = Membrane correction factor defined in G-
2214.1 to ASME Sec. XI [10]
𝛔m = (Pr)/t, membrane stress
P = Internal reactor vessel pressure, psia,
r = Inside reactor vessel radius, in.,
t = Reactor vessel wall thickness, in.
KIT = Stress intensity factor for thermal stress
defined in G-2214.3 to ASME Sec III [12].
The reference critical stress intensity factor is defined by
Figure G-2210-1 of ASME Section III App. G and it is
expressed in formula as below [11].
KIC =36.5+22.783e(0.036(T-RTNDT
)) (MPa√m) (2)
In equation (2), KIC is a function of T of RTNDT. The RTNDT is
determined by material chemical composition and
accumulated radiation fluence. The right side of eq. (1)
consists of the primary membrane stress and secondary
membrane stress denoted by KIM and KIT. The KIT is defined
as follows
KIT = 0.579×10⁻⁶×CR×t2.5 (MPa√m) (3-a)
KIT = 0.458×10⁻⁶×HU×t2.5 (MPa√m) (3-b)
Where CR is cooldown rate in °C/ hr
HU is Heatup rate in °C / hr
t is the thickness of vessel wall in mm
The KIT defined by eq. (3) corresponds to maximum
temperature difference between vessel inner-surface to outer-
surface throughout heatup or cooldown operation. Hence the
intermediate value corresponding to temperatures along the
operation shall be estimated proportionally. To do this
transient conduction heat transfer calculation is need to find
maximum through-wall temperature difference as well as the
prorated value temperature difference along the temperature
change. Hence KIT is fully defined for input temperatures.
The is defined by where is given in G-
2214.1 to ASME Sec. III, appendix G as follows, for vessel
thickness of 102 mm ≤ t ≤ 305 mm [10]
– for an inside axial surface flaw: Mm = 0.0293
– for an outside axial surface flaw: Mm = 0.0282
– for an inside or an outside circumferential surface flaw:
Mm = 0.0140
With this value, the remaining unknown is ,
since r is the ID of reactor vessel and t is the thickness of
reactor vessel, the pressure is the variable need to be
calculated.
IV. CALCULATION OF REFERENCE NIL-DUCTILITY
TRANSITION TEMPERATURE RTNDT
Since radiation degradation affects fracture toughness, it
need to be properly accounted in the assessment of reference
critical stress intensity factor. This critical stress intensity
factor is determined from adjusted reference nil ductility
transition temperature is defined in Regulatory Guide 1.99
(RG 1.99). The ART values of beltline material for weld metal
and base metal at ¼ thickness and ¾ thickness are given by
the following expression [11]:
ART = Initial RTNDT + ∆RTNDT + Margin (4)
Where
Initial RTNDT is the reference temperature for the
unirradiated material.
∆RTNDT is the measure of nil ductility transition
temperature change during the reactor operation
Margin is to compensate the uncertainties on both
initial RTNDT and ΔRTNDT.
A. The initial reference nil ductility transition temperature,
Initial RTNDT
The initial reference nil ductility transition temperature of
APR1400 and OPR1000 reactor was determined by actual test
of the material. VVER-1000 reactor’s initial reference nil
ductility transition temperature was assumed to be similar to
that of OPR-1000 reactor vessel [8].
B. The shift of initial nil ductility transition temperature
∆RTNDT is the mean value of the adjustment in reference
temperature caused by irradiation and is calculated as follows:
∆RTNDT = (CF)f(0.28-0.10lofg) (5)
The neutron fluence, f, at any depth in the vessel wall is
calculated using methods that conform to the guide lines of
RG 1.99 perform as follow [8]:
f = fsurf(e-0.24x) (6)
International Journal of Engineering Research & Technology (IJERT)
ISSN: 2278-0181
www.ijert.orgIJERTV4IS090342
(This work is licensed under a Creative Commons Attribution 4.0 International License.)
Vol. 4 Issue 09, September-2015
547

In substituting the radiation fluence in eq. (6), the unit of
1019n/cm2 is used, and the fluence include those of fast
neutron range (E>1 MeV). The calculated value of the
neutron fluence at the inner wetted surface of the vessel at the
location of the postulated defect is used in the calculation.
In eq. (5), CF stand for chemistry factor is defined RG
1.99. Base on the material used in reactor vessel beltline, the
chemistry factor of copper (Cu) and nickel (Ni) is determined
from table if RG 1.99. Since the material composition for
reactor vessel and beltline weld are different, the CF for
welds and vessel shell be determined separately.
C. Margin
According to RG 1.99, margin is quantity in temperature
unit, °C, that is to be added to obtain conservative, upper-
bound values of ART for the calculations required by
Appendix G to 10 CFR Part 50 [8][9][13].
Margin = 2 (7)
Where
- σI is standard deviation for the initial RTNDT.
- σΔ is the standard deviation of ΔRTNDT.
V. CALCULATION OF THROUGH WALL
TEMPERATURE GRADIENTS
P-T Limits curves for the core not critical and core critical
operating condition apply for both the 1/4t and 3/4t locations.
When combine pressure and thermal stress, it is usually
necessary to evaluate stresses at the 1/4t location (inside
surface flaw) and the 3/4t location (outside surface flaw) [12].
Analysis of heat up and cool-down rate from 10°C/hr to
design limit of 100°F/hr intervals are performed by using the
Finite Element Method (FEM) for thermal transient
simulation, using ANSYS general purpose FEM analysis
software. Locations at 1/4t and 3/4t are examined for the
heat-up and cooldown transient. The temperature gradient at
1/4 and 3/4t wall depth for heatup and cooldown is obtained.
The heat-up and cool-down rates vary from 10°C/hr to design
limit of 100°F/hr. An example of thermal analysis result is
shown in Figure 2 below [14].
Figure 2. Output results for heatup rate at 37.8°C/hr
This calculation is necessary to accurately assess the KIT in
Eq. (3), where KIT is maximum value. From the temperature
transient, the maximum temperature difference between inner
to outer surface corresponds to the Thermal Stress Intensity
Factor given in Eq. (3). Hence at each temperature rise during
heatup or temperature down during cooldown, the ratio from
the maximum is calculated and corresponding value of Stress
Intensity Factor is obtained.
VI. CALCULATION OF BELTLINE P-T LIMITS FOR
HEATUP AND COOLDOWN OPERATION
For the beltline analysis, during normal operations, the
following condition is maintained [12]:
KIC = 2KIm + KIt (8)
Where,
KIm = Mm x Pri/t (9)
KIt = Max KIt x ΔT/ Max ΔT (10)
KIC = 36.5 + 22.783e[T-ART] (11)
Or P= (12)
and
KIm: Stress intensity factor for membrane stress due
to pressure
KIt: Stress intensity factor for thermal stress
Mm: Membrane correction factor
P: internal reactor vessel pressure
r: inside reactor vessel radius
t: reactor vessel wall thickness
ΔT: Maximum steady-state temperature differential
across the reactor vessel wall.
: Function of temperature, T, and adjusted
reference temperature, ART, of the material at
the crack tip (1/4t or 3/4t)
In eq. (8), the eq. (1) is modified to calculate the maximum
allowable pressure for a given temperature. After substituting
all variables, eq. (12) will give maximum allowable pressure.
The overall procedure of obtaining P-T limit curve is shown in
Figure 3. This calculation should be carried out for heatup
and cooldown rate of 100°C, 80°C, 60°C, 40°C, 10°C, etc and
hydrostatic test conditions.
VII. DETERMINATION OF OTHER TEMPERATURE
LIMITS
A. Minimum Boltup Temperature of Reactor Vessel
Closure Head
Base on ASME Code, Section III, Division I, Appendix G,
Paragraph G-2222, the ASME Code requires that when the
flange and adjacent shell region are stressed by the full bolt
preload and by pressure shall not exceed 20% of the
preoperational system hydrostatic test pressure [8][12].
This PT limit is a straight vertical line at the minimum
boltup temperature (Tmin boltup). The minimum metal
temperature in the stressed region must be at least the initial
RTNDT plus any effects of irradiation.
TMIN_BOLTUP = ART + Initial RTNDT
Since reactor flange where bolt connections is located is
away from high radiation, the effect of irradiation
embrittlement is negligible and therefore the TMIN_BOLTUP is
set to the same as Initial RTNDT
International Journal of Engineering Research & Technology (IJERT)
ISSN: 2278-0181
www.ijert.orgIJERTV4IS090342
(This work is licensed under a Creative Commons Attribution 4.0 International License.)
Vol. 4 Issue 09, September-2015
548

Det
erm
inat
ion K
IC
Use
equat
ion (
8)
Det
erm
ine
tem
per
ature
dis
trib
uti
on (
in,¼
T, 3/4
T,o
ut)
Use
Ansy
s in
Sec
tion 3
.2
Det
erm
ine
Adju
sted
Ref
eren
ce T
emper
ature
(AR
T)
AR
T c
alcu
lati
on i
n S
ecti
on
3.1
Det
erm
ine
KIm
Use
equat
ion (
6)
Det
erm
inat
ion K
It
Use
equat
ion (
7)
Det
erm
ine
ΔT
fro
m
FE
M A
nal
ysi
s re
sult
s
Det
erm
ine
·
Max
KIt(i
nsi
de)
·
Max
KIt(o
uts
ide)
Use
equat
ion i
nto
AS
ME
Code,
Sec
tion I
II, G
-2124
.3
Det
erm
ine
Mem
bra
ne
corr
ecti
on f
acto
r M
m
Use
equat
ion i
nto
AS
ME
Code,
Sec
tion I
II, D
ivis
ion I
, G
-2214
.1
Det
erm
ine
All
ow
able
Pre
ssure
Use
equat
ion (
9)
Figure 3. Process of allowable pressure determination
B. Lowest Service Temperature (LST)
The lowest service temperature (LST) is defined by
paragraph NB-2332, Section III of the ASME Code, to be the
minimum allowable temperatue at pressures above 20% of
the preoperational hydrostatic test pressure. This limit when
enveloping all component, a more severe limit need to be
applied and that is for clouse NB-2332, and is given by
equation as follows [8]:
LST = RTNDT + 37.8°C (or 100°F)
C. Minimum Pressure Below Lowest Service Temperature
The minimum allowable pressure below the lowest
service temperature is defined by NB-2332, Section III of the
ASME Code, to be 20% of the pre-operation hydrostatic test
[8].
Pbelow_LST = 0.2Phydro_test
D. Core Critical Curve
The core critical curve is intended to provide additional
margins of safety during core operation. The limitation is
defined as 40°F above the minimum allowable temperature
for heatup or cooldown and nor lower than the minimum
temperature allowable for in-service hydrostatic test, in
accordance with paragraph IV.A.3 in Appendix G to 10 CFR
50 [10].
E. Hydrostatic Test Curves
According to G-2400 in Appendix G to Section III of the
ASME Code, Hydrostatic curve is to be performed by
applying safety factor of 1.5 to the stress intensity factor for
membrane stress due to pressure KIm [12].
VIII. PRESSURE-TEMPERATURE LIMIT CURVE
COMPARISON BETWEEN OPR-1000 AND VVER-
1000 REACTOR VESSELS
A. Pressure-Temperatue Limit Curves of OPR-1000 and
VVER-1000 Reactor Vessels
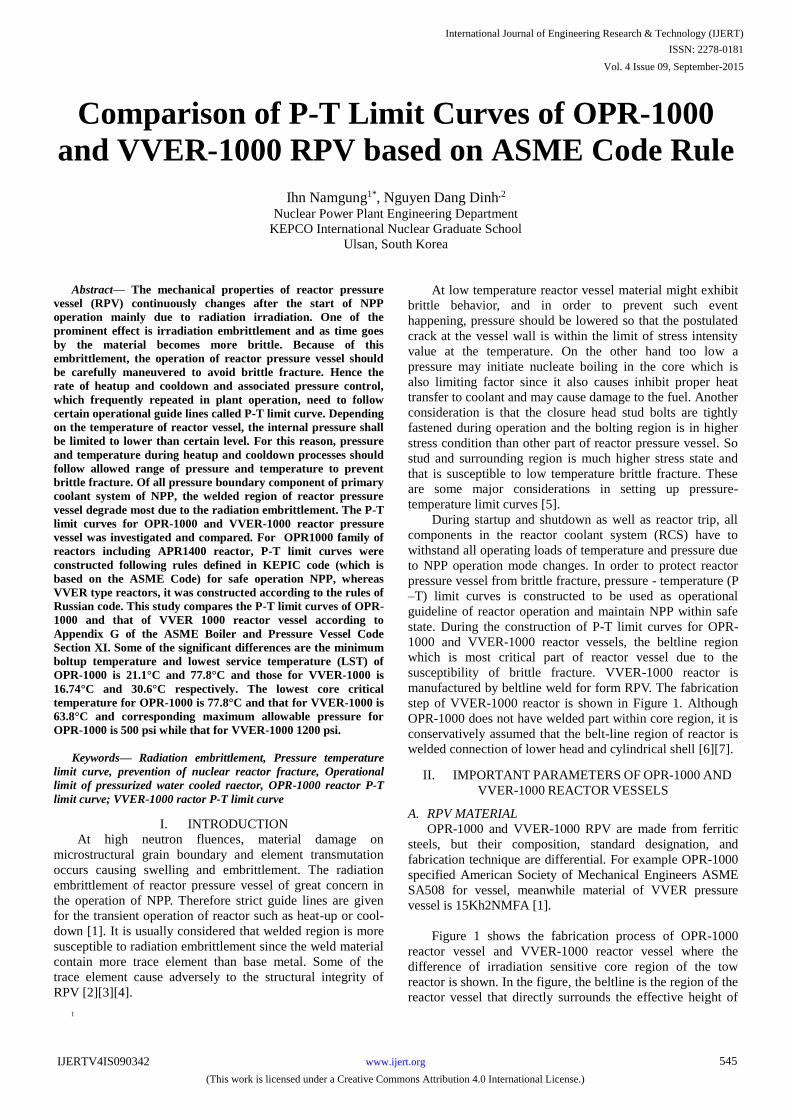
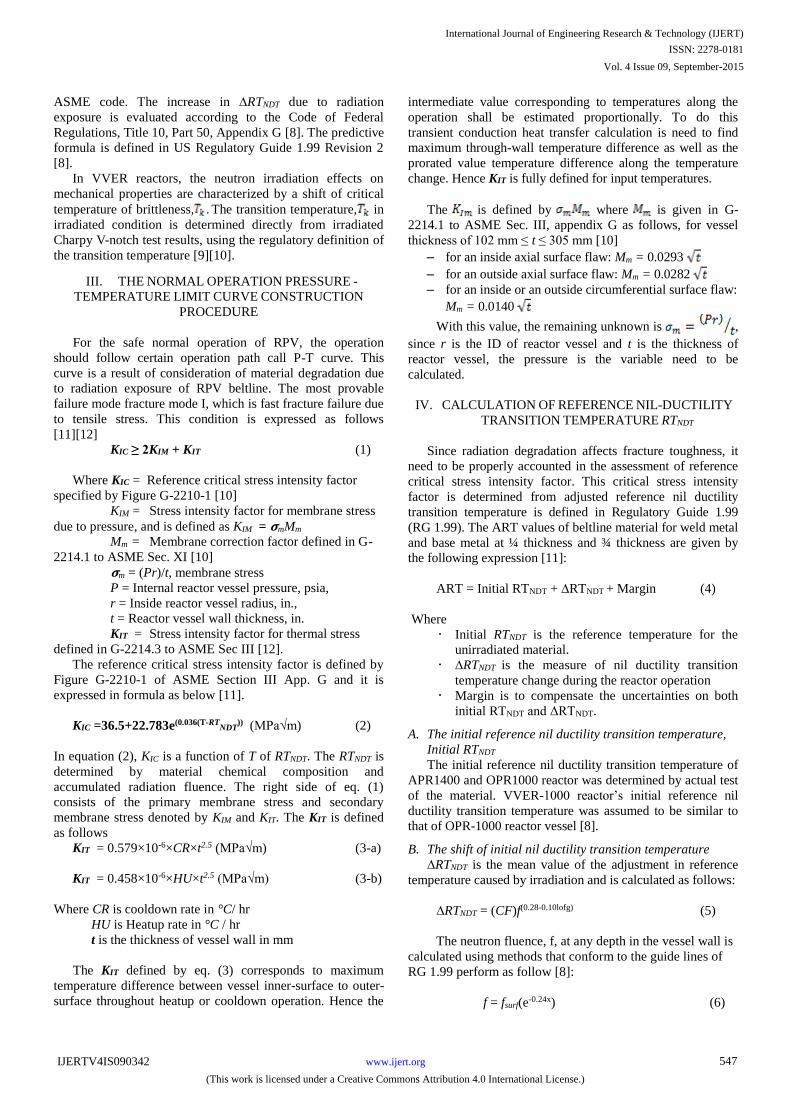
Construction of pressure-temperature limit curve at
beltline of OPR-1000 and VVER-1000 RPV are performed
for both heatup and cooldown condition for various
temperature gradients. Combined with other temperature
limits produces final pressure-temperature limits that should
be followed during reactor operation. The results of pressure-
temperature limit curve at beltline of OPR-1000 and VVER-
1000 RPV are shown in Figure 4.
B. Results and Evaluation
· It showed quite a difference of shape and margin of
VVER-1000 and OPR-1000 P-T limit curves. The
main differences are come from differences of material,
neutron flux, setpoint (hydrostatic test/normal
operation pressure), thickness of reactor vessel wall.
In order to eliminated computational error and
construct accurate P-T limit curves, the time steps were
set very small when doing the FEM analysis of
temperature distribution through the RPV wall.
International Journal of Engineering Research & Technology (IJERT)
ISSN: 2278-0181
www.ijert.orgIJERTV4IS090342
(This work is licensed under a Creative Commons Attribution 4.0 International License.)
Vol. 4 Issue 09, September-2015
549
a) P-T Limits Curve of OPR-1000 RPV
b) P-T Limit Curve of VVER-1000 RPV
Figure 4. P-T limit curves of OPR-1000 and VVER-1000 RPV
· The difference of ART and Initial RTNDT values of
OPR-1000 and VVER-1000 are also causes difference
for minimum boltup temperature and lowest service
temperature (LST). Specific margin of minimum
boltup temperature and lowest service temperature
(LST) of VVER-1000 is 62.14°F and 87°F respectively
whereas OPR-1000 is 70°F and 172°F.
· Hydrostatic pressure of VVER-1000 is less than OPR-
1000 that leads difference of maximum pressure below
lowest service temperature, specific value of VVER-
1000 is 713.584 psia and OPR-1000 is 500 psia.
· Hydrostatic pressure also affect to hydrostatic test
curve for both of VVER-1000 and OPR-1000 that have
Safety factor of 1.5 is applied to stress intensity factor.
· The minimum boltup temperature is principally
governed by Appendix G to Section III of the ASME
code that requires the flange and adjacent shell region
are stressed by the full bolt preload. Minimum boltup
temperature of two RPV is quite similar, VVER-1000
is 62.14°F and OPR-1000 is 70°F.
· The Lowest service temperature is minimum allowable
temperature at pressure above 20% of the
preoperational hydrostatic test pressure. There are
significant differences between LST of VVER-1000
(87°F) while LST of OPR-1000 (170°F).
One of the interesting point is that the lowest core critical
temperature for VVER-1000 and OPR-1000 are 146.761°F
and 172°F, but the maximum allowable pressure at that
temperature is different where for VVER-1000 is 1200 psi and
that for OPR-1000 is 500 psi.
IX. CONCLUSION
Pressure – Temperature (P-T) limit curve is generated to
control the limit of permissible operating envelope for VVER
1000/320 RPV during reactor operation. P-T limit curves are
also used by system designers in evaluating the consequences
of transients which challenge reactor vessel integrity. Plant
operating procedures guide operators to follow optimum
heatup and cooldown curves that do not violate the allowable
limits of P-T curve.
The P-T limit curves of the vessel of the belt-line region
of VVER-1000 reactor were obtained for a 100°F/hr heatup
and cooldown operation. The study was carried out by
applying Appendix G of the ASME Boiler and Pressure
Vessel Code, Section III, Appendix G to generate P-T limit
curves of VVER 1000/320. To determine the adjusted
reference temperature (ART) of the 15Kh2NMFA beltline
material of VVER 1000/320, ∆RTNDT was calculated based
on Cu and Ni values and neutron fluence. For obtaining
temperature through the thickness at inside surface, ¼t and
3/4t and outside surface of beltline region, FEM model of
VVER 1000/320 was created and simulated by using
transient thermal analysis module of ANSYS software 14.5.
Comparison of P-T limit curve for VVER-1000 and OPR-
1000 was made. It showed that the minimum bolt-up
temperature is quite similar but the minimum allowable LST
showed significant difference, in which LST for VVER-1000
was 87°F while that for OPR-1000 was 170°F. The lowest
core critical temperature also showed some difference where
it for VVER-1000 is 146.70°F and it for OPR-1000 is 172°F,
but the maximum allowable pressure at that temperature for
VVER-1000 is 1200 psi while it for OPR-1000 is 500 psi.
REFERENCES
[1] IAEA Nuclear Energy Series, No NP-T-3.11, 2009 “Integrity of
Reactor Pressure Vessel in Nuclear Power Plant : Assessment of Irradiation Embrittlement Effects in Reactor Pressure Vessel Steel”
[2] J.G. Collier, M.R. Hughes and L.M. Davies, 1983 “Fracture
Assessment of a PWR Pressure Vessel”, Vol.75, No.3, pp389-404, Nuclear Engineering and Design
International Journal of Engineering Research & Technology (IJERT)
ISSN: 2278-0181
www.ijert.orgIJERTV4IS090342
(This work is licensed under a Creative Commons Attribution 4.0 International License.)
Vol. 4 Issue 09, September-2015
550

[3] S.B. Fisher and J.T. Buswell, 1987 “A Model for PWR Pressure Vessel
Embrittlement”, Vol 27, No.2, Pp 91-135, International Journal of Pressure Vessels and Piping
[4] R.Ahlstrand, B. Margolin, et al., 2022 “TREG 2.01/00 project,
Validation of neutron embrittlement for VVER-1000 and 440/213 RPVs with emphasis on integrity assessment,” Vol 7, pp52-57,
Progress in Nuclear Energy
[5] Oya Ozdere Gijlol, Uner Colak, 2003 “Comparison of pressure vessel integrity analyses and approaches for VVER-1000 and PWR vessels for
PTS condition,” Nuclear Engineering and Design 226, pp231-241
[6] Hisming Pan, 1992 “The Generation of an Allowable P/T Curve of a Nuclear RPV Using a Display-Oriented System,” International Journal
of Pressure Vessel and Piping, Vol. 5 No.2, pp. 257-265
[7] Taek-Jin Lee, J.B. Choi, Y.J. Kim, Y.W. Park, 2002 “A parametric study on pressure-temperature limit curve using-3D finite element
analyses”. Nuclear Engineering and Design 214 (2002) pp.73-81
[8] NRC Regulatory Guide 1.99, May 1988 “Radiation Embrittlement of Reactor Vessel Materials”
[9] V.G. Vasiliev, Yu.V.Kopiev, 2007 “WWER pressure vessel life and
ageing and management for NPP long term operation in Russia”, IAEA-CN-155-056, Second International Symposium on Nuclear
Power Plant Life Management
[10] D.Araneo, G. Agresta, F.D’Auria, “Fracture Mechanical Analysis for VVER1000 Reactor Pressure Vessel,” The 7th International Conference
on Safety Assurance of NPP with WWER - 2011, Russia, May 17-20,
2011 [11] Appendix G to 10CFR50, “Fracture Toughness Requirements”, Title
10 Code of Federal Regulations of U.S.A.
[12] ASME Boiler and Pressure Vessel Code 2012 ed. Section XI, Appendix G, “Fracture Toughness Criteria for Protection against
Failure.”
[13] T.L.Dickson, W.J.McAfee, W.E.Penell, and PT Williams (ORNL), “Evaluation of Margins in the ASME Rules for defining the P-T Curve
for a RPV.” USNRC 26th Water Reactor Safety Meeting, Oct 26, 1998
[14] ANSYS V.14.1 – General Purpose FEM Analysis Software [15] KHNP, 2002, “Ulchin 5&6 Final Safety Analysis Report”
[16] ASME Boiler and Pressure Vessel Code 2012 ed. Section III,
Subsection NB Class 1 Components
International Journal of Engineering Research & Technology (IJERT)
ISSN: 2278-0181
www.ijert.orgIJERTV4IS090342
(This work is licensed under a Creative Commons Attribution 4.0 International License.)
Vol. 4 Issue 09, September-2015
551
