comparison of performance of different tool electrodes...
TRANSCRIPT

Indian Journal of Engineering & Materials Sciences Vol. 26, June-August 2019, pp. 186-199
Comparison of performance of different tool electrodes during electrical discharge machining
Anshuman Kumar Sahu* & Siba Sankar Mahapatra
Department of Mechanical Engineering, National Institute of Technology, Rourkela 769 008, India
Received 17 May 2018; Accepted 17 July 2019
In this work, performance of tool electrode prepared through selective laser sintering (SLS) process has been studied along with traditional copper and brass electrodes for electrical discharge machining (EDM) of AISI 1040 stainless steel. Performance measures like material removal rate (MRR), tool wear rate (TWR), radial over cut (ROC) and average surface roughness (Ra) of the machined surface have been considered. Multi-response optimization like technique for order preference through similarity to ideal solution (TOPSIS) method has been used to find out the best parametric setting of the EDM process for maximization of MRR and minimization of TWR, ROC and Ra. Scanning electron microscopic (SEM) images of the machined surface reveals that less surface crack density (SCD) has been formed on the machined surface by the use of AlSiMg RP tool electrode followed by brass and copper tool electrodes. Although MRR decreases with the use of AlSiMg tool electrode, good surface finish with less surface crack density on the machined surfaces has been observed as compared to other two tool electrodes. SEM and EDX analysis of the machined surfaces by different tool electrodes reveals presence of tool materials on the machined surfaces with increased carbon content. Therefore, it has been recommended that AlSiMg tool electrode can be conveniently adopted for finishing and semi-finishing operations.
Keywords: EDM, SLS, TOPSIS, MRR, TWR, ROC, Surface roughness
1 Introduction Electrical discharge machining (EDM) is a preferred
machining operation to produce intrinsic and complex geometry parts made of difficult-to-machine materials. EDM is a thermo-mechanical process where material removal occurs from the work piece by heat energy generated during the sparking between the work piece and tool electrode. The pulses used in EDM process are generated by a pulse power generator. The pulse power generators are like resistance capacitance types relax generator, transistor type generator, electronic pulse generator, rotary impulse generator and hybrid generator. To obtain a good machining performance the electrical pulses must include the characteristics like pulse shape, frequency, pulse-on-time, pulse-off-time etc. The pulses provide a potential difference between the tool and work piece gap and sparking is initiated. Due to the sparking very high temperature is generated in between the electrodes gap and it locally melt and vaporized tiny particles from the work piece and tool electrode surfaces leading material removal as well as tool wear.
In EDM, tooling is the most important subject because it influences the overall machining time and
production cost of the final product. Tooling in EDM is an expensive and time-consuming process due to the use of conventional and non-conventional machining processes to produce EDM tool electrodes. Rapid prototyping (RP) is a process of manufacturing prototype of a product in relatively short time period. By the use of rapid prototyping process, manufacturing of complex shaped prototypes becomes simpler with short production time. Selective laser sintering (SLS) is a RP process where parts are manufactured by sintering metal powders using laser. In SLS, parts are manufacture layer by layer by the use of laser beam to sinter the successive layer of powders. Powder material in SLS should be chosen in such a manner that it can be processed easily by SLS process having desirable characteristics to be used as EDM tool electrode. In this work, a newly developed RP tool electrode (AlSiMg) prepared through SLS process is used. The tool electrode obtained by the rapid prototyping method is new one and its performance is studied in comparison with the existing copper and brass tool electrodes. In fact, tool development time for machining a complex part using EDM is quite high when conventional route of tool fabrication method is adopted. By the use of RP process, tool development time can be substantially
––———— *Corresponding author (E-mail: [email protected])

SAHU & MAHAPATRA: COMPARISON OF PERFORMANCE OF DIFFERENT TOOL ELECTRODES DURING EDM
187
reduced. The performance of the newly developed electrode has been studied along with conventionally used copper and brass electrodes by using AISI 1040 stainless steel as work piece and EDM 30 oil as dielectric medium. The EDM parameters like pulse-on-time and discharge current have been varied along with tool electrodes during experimentation. Taguchi’s L9 orthogonal array is used to design the experiment to reduce the number of experiments. Various performance measures in EDM like material removal rate (MRR), tool wear rate (TWR), radial over cut (ROC) and surface finish (Ra) of the machined surface have been considered. Multi-response optimization technique like Technique for Order Preference through Similarity to ideal solution (TOPSIS) method is used to obtain the optimal setting of the EDM parameters.
Recently, application of rapid tooling (RT) in EDM has been emerged as a subject of extensive research. Various researchers1-3 have prepared RT based EDM tool electrodes and studied their performance. Materials like ZrB2-CuNi, Mo-CuNi, TiB2-CuNi, and ZrB2-CuNi are used to prepare electrodes by SLS process and their performance have been studied during EDM considering C45 steel and AISI H13 tool steel as work piece material. It is observed that wear of the SLS tool electrodes increases with increase in porosity of tool electrodes, pulse-on-time and peak current. Durr et al.4 have used materials like bronze-nickel with copper phosphate and steel with phosphate and polyester for preparing tool electrodes by SLS process. Electrical discharge machining has been carried out on C45 steel and X210Cr12 steel work pieces. It is observed that more tool wear occurs while cutting the relatively hard materials like X210Cr12 steel. Tang et al.5 have prepared an abrading tool using cement and epoxy resin as bonding material and silicon carbide and corundum as abrasive particles. The abrading tool is used to prepare the graphite tool electrode through abrading process. Then, graphite tool is used as tool electrode to produce steel mold by EDM process. Similarly, Ding et al.6 have used silicon carbide grinding stone as abrading die to cut graphite electrode and produce an accurate image of the stone on the graphite block by abrading process. The graphite tool electrode is used in EDM to produce steel mold. The manufacturing cost and time of mold making by this process is just 35-40% of the conventional steel mold making process. Arthur et al.7 have prepared RP parts
of epoxy by stereo lithography (SL) process. Then conductive silver paint is applied on the epoxy SL part followed by electroplating copper. The tool electrode is used for machining hardened tool steel by EDM process for semi finishing and finishing process. Dimla et al.8 have prepared EDM electrode by two different types of rapid prototype processes like stereo-lithography (SL) and direct metal laser sintering (DMLS). The tool electrode is prepared from SL part of SL7540 resin followed silver paint and electroplating of copper. Tool electrode is also prepared from a DMLS part of nickel-based bronze powder followed by electroplating of copper. It is observed that these electrodes are not suitable for industrial application because the tools are burnt out during machining due to insufficient copper deposition.
Ferreira et al.9 have prepared copper electrode by investment casting and its performance is studied considering tool steel AISI H13 as work piece material. The tool electrodes produce similar material removal rate like solid copper electrode with slightly more tool wear rate. Yarlagadda et al.10 have prepared a pattern by SL process. By using the SL pattern, silicone RTV rubber part is prepared by vacuum casting. Then, it is coated with copper by electroforming process. When it is used as tool electrode in EDM for machining of H13 hardened tool steel, rupture of the tool is observed due to the insufficient deposition of copper during the electroforming process. This electrode cannot be used for rough machining operation but can be recommended for semi- finishing and finishing process.
Performance of AISI 1040 stainless steel during machining through EDM and wire-EDM process has been studied by different researchers. Unses and Cogun11 have studied the machinability of Ti-6Al-4V alloy and AISI 1040 stainless steel using copper tool by graphite powder addition to the kerosene dielectric fluid during EDM. It is observed that higher MRR and surface roughness are obtained in case of AISI 1040 stainless steel while relative wear ratio is more in case of Ti-6Al-4V alloy. Gulcan et al.12 have studied the possibility of using Cu-Cr and Cu-Mo tools prepared by powder metallurgy (PM) route in electrical discharge machining of 1040 stainless steel. Patel and Power13 have compared MRR obtained through finite element modelling (FEM) analysis and experimental result during electrical discharge

INDIAN J ENG MATER SCI, JUNE-AUGUST 2019
188
machining of AISI 1040 steel using copper as tool electrode. Ozerkan14 has studied the effect of simultaneous machining and surface alloying of AISI 1040 steel in EDM process using copper tool with addition of boron oxide powders in kerosene dielectric fluid. Due to deposition of boron particles in form of oxides and carbides on work piece, micro-harness of the machined surfaces increases. Kohli et al.15 have performed electrical discharge machining of AISI 1040 stainless steel using copper tool and optimized the process by fuzzy logic.
In EDM process, various conflicting performance measures are simultaneously optimized to enhance the performance of the EDM process. The performance measures like material removal rate is to be maximized whereas tool wear rate, average surface roughness and radial over cut of the machined surface are to be minimized. Different types of optimization techniques have been used for the optimization of the EDM process. Technique for order preference through similarity to ideal solution (TOPSIS) and grey relational analysis (GRA) have been used to optimize the machining process in powder (chromium) mixed EDM of H-11 die steel16. Fuzzy TOPSIS is used to optimize the surface integrity and dimensional accuracy during machining of AISI P20 tool steel17. TOPSIS is used in the parametric optimization of wire EDM process18. Similarly, a combined approach of TOPSIS-AHP is used for non-traditional machining processes19. Taguchi based grey relational analysis method is used to optimize the various performance measures of EDM process during the machining of titanium alloy (Ti6Al4V)20. Grey relational analysis, TOPSIS and response surface methodology are used to optimize the surface roughness and tool wear during turning of magnesium alloy in dry condition using polycrystalline diamond (PCD) cutting tool21. Similarly, TOPSIS method is used to optimize the performance measures during different processes like drilling of Ti6Al4V alloy in cryogenic environment, milling of aluminum alloy (AlCu4MgSi) and gas tungsten arc welding of Incoloy 800HT22-24. 1.1 Technique for order preference through similarity to ideal solution (TOPSIS)
TOPSIS technique is developed for measurement of the extent of closeness of the ideal solution from the most suitable alternatives. The principle of the method is to select the criteria that is nearest from the positive best solution and farthest from the negative best solution and the finest solution is having most
relative closeness towards the ideal solution16,22. The details procedure of TOPSIS is well explained in literatures and is followed to calculate the single performance index and the EDM process is optimized by using TOPSIS method16,18,19,22.
1. Find out the decision matrix having m number of attributes and n number of alternatives as shown below:
11 12 13 1m
21 22 23 2m
31 32 33 3mm
n1 n2 n3 nm
x x x xx x x xx x x x
D
x x x x
. ... (1)
where, ijX is performance measures, i is number of experimental runs, j is number of performance measures and mD is decision matrix.
2. Calculate the normalized decision matrix ( ijr ) by using the following equation:
ijij n 2
iji 1
Xr ,i 1,2,......n, j 1,2.....m.
X
... (2)
where, ijr is normalized value of the ith experimental run with respect to jth performance measures.
3. Calculate the weighted normalized value matrix ( ) by multiplication of the normalized value into the weighted value as in the following equation:
... (3) where, and
jw = weightage for jth performance measures, here
equal weightage is considered for each performance measures.
4. For each experiment,t calculate the ideal experimental run that are the best (S+) and the worst (S-) experimental run performance as follows:
ij
'ij
S max(v ) j J or
min(v ) j J ,i 1,2,.....n
... (4)
ijv
ij j ijv w r
i 1,2,......n, j 1,2.....m jw 1

SAHU & MAHAPATRA: COMPARISON OF PERFORMANCE OF DIFFERENT TOOL ELECTRODES DURING EDM
189
ij
'ij
S min(v ) j J or
max(v ) j J ,i 1,2,.....n
... (5)
5. The performance of the responses are measured
by the best experimental run distance ( ) from the S+ values and the worst experimental run distance
( ) from the S- values as represented in the following equation:
... (6)
, ... (7)
where, i 1,2,.........m
6. The closeness coefficient (Ci) for each experimental run is calculated by the following equation:
i
i ii i
DC ,i 1,2,....n;0 C 1.D D
… (8)
The best experimental parameters are chosen from the basis of high value of closeness coefficient, which is close to the ideal solution. 2 Materials and Methods
In this work, AlSiMg RP electrode prepared by SLS process, copper and brass are used as tool electrode for the EDM of AISI 1040 stainless steel as work piece material. Commercial EDM 30 oil (specific gravity=0.763) is used as dielectric medium. The chemical composition of AISI 1040 stainless in weight percentage of the elemental component is given in Table 1. In the present work, RP machine (EOSINT M 280) is used to build the EDM tool electrode. Laser beam selectively melt and fuse the metallic powder (AlSiMg) to form the 3D metallic composite tool electrode. Copper and brass electrodes are prepared from solid circular rod by turning process having diameter of 12 mm. The three tool electrodes used in this experiment are shown in Fig. 1. The shape of these tool electrodes are stepped cylindrical having total length of 40 mm and machining diameter of 12 mm.
To study the effect of different types of tool electrodes like AlSiMg RP electrode, copper and brass electrodes on the output performance measures, the EDM process parameters like pulse-on-time (Ton) and discharge current (Ip) are varied during the EDM process. The values of these process parameters with different levels are listed in Table 2. The parameters used in EDM process are as follows.
a) Discharge current: It is the maximum current flow through the EDM system to generate electrical spark in the tool and work piece gap.
b) Pulse-on-time: It is the duration (per cycle) in which the current is allowed to flow through the system.
c) Tool material: The different type tool electrodes (AlSiMg RP, copper and brass) used during the EDM process.
To reduce the number of experiments, design of experiment (DOE) approach like Taguchi’s L9 orthogonal array has been used. In this work, 3-factor 3-level is used as shown in Table 2. Each experiment is run for 5 minutes. The experiments have been performed in a die sinking EDM (ELECTRA EMS 5535).
The experimental set up during machining is shown in Fig. 2. The output performance measures considered to assess the machining performance are material removal rate (MRR), tool wear rate (TWR), radial over cut (ROC) and average surface roughness (Ra) of the machined surface. The performance measures are optimized by the multi-response optimization method TOPSIS and best optimal setting
ijD
ijD
m2
ij ij ji 1
D (v S ) ,
m2
ij ij ji 1
D (v S )
Table 1 — Chemical composition of AISI 1040 stainless steel.
Element Mn C S P Fe Content (%) 0.75 0.4 0.04 0.03 Balance
Table 2 — Input parameters with different levels.
Parameters Unit Level-1 Level-2 Level-3 A-Tool - AlSiMg RP Copper Brass B-Pulse-on-time(Ton)
µs 100 200 300
C-Discharge current (Ip)
A 10 20 30
Fig. 1 — Tool electrodes.

INDIAN J ENG MATER SCI, JUNE-AUGUST 2019
190
is obtained to get better machining performance. The Taguchi’s L9 orthogonal array (OA) along with the performance measures are presented in Table 3. 2.1 Material removal rate (MRR)
Material removal rate (MRR) is defined as the rate at which material removal occurred from the surface of the work piece. The MRR can be determined by the weight loss criteria of the work piece as shown in Eq. (9).
… (9)
where, is initial weight of the work piece before machining, is final weight of the work piece after
machining, t is machining time and w is density of tool electrodes. 2.2 Tool wear rate (TWR)
Tool wear rate (TWR) is defined as the rate at which material loss occurred from the tool electrode. The TWR calculated by the weight loss criteria of the tool electrode as given in the Eq. (10). i f
w
(W W )MRR(t )
iW
fW
Fig. 2 — EDM process during experiment.
Table 3 — Taguchi’s L9 OA and output responses.
Sl. No. A-Tool Type B-Pulse-on-time (µs)
C-Discharge current (A)
MRR (mm3/min)
TWR (mm3/min)
ROC (mm) Ra (µm)
1 1 1 1 4.2218 0.61621 0.07880 6.6667 2 1 2 2 5.3231 1.41892 0.11150 7.9000 3 1 3 3 7.5258 1.71171 0.13035 9.6000 4 2 1 2 6.0574 0.22321 0.02350 12.0000 5 2 2 3 7.0109 0.35156 0.07050 13.6667 6 2 3 1 5.0478 0.20089 0.09000 10.3333 7 3 1 3 4.3340 1.75176 0.12150 9.3333 8 3 2 1 2.8043 0.88741 0.12645 9.0000 9 3 3 2 3.0593 1.46679 0.17500 11.0000
SAHU & MAHAPATRA: COMPARISON OF PERFORMANCE OF DIFFERENT TOOL ELECTRODES DURING EDM
191
… (10)
where, is initial weight of the tool electrode
before machining, is final weight of the tool
electrode after machining, t is machining time andis density of tool electrodes.
The densities of the tool electrodes and work piece are given in Table 4. The initial and final weight of the work piece and tool electrodes before machining and after machining are measured by a weighing machine having least count of 0.05 g. 2.3 Radial over cut (ROC)
Radial over cut is the deviation of the diameter of the machine cavity with respect to the diameter of the tool electrode. It is measured by using the following formula shown in Eq. (11).
… (11)
where, is diameter of the crater cavity and is diameter of the tool.
The diameter of the crater cavity of the on the work piece are measured by taking the optical images of the specimen with 10× magnification by an optical microscope (SAMSUNG SDC-314B). The least count of the optical microscope is 0.001 mm. The diameters of the optical images of the specimen are measured by the image viewer application available in MATLAB R2014a. Four different diameters
are measured and the average of these is considered as the diameter of the machined cavity. 2.4 Average surface roughness (Ra)
Average surface roughness is the arithmetic mean of the absolute height of the profiles (i.e. peak height and valley) over the sampling length. The average surface roughness of the EDM machined surface is measured by surface roughness measurement machine (Taylor-Hobson-PNEUNO-Suetronic 3+). The equation of average surface roughness is given in Eq. (12) as follows:
Average roughness, L
a0
1R y(x)dxL
… (12)
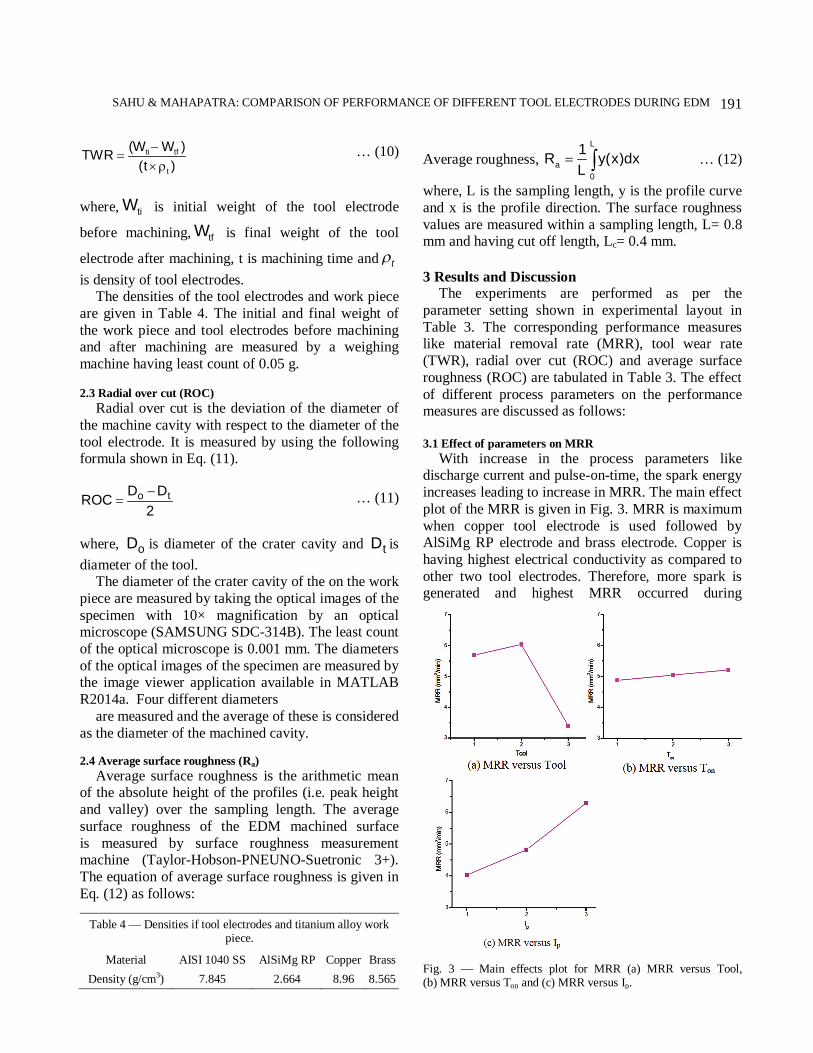
where, L is the sampling length, y is the profile curve and x is the profile direction. The surface roughness values are measured within a sampling length, L= 0.8 mm and having cut off length, Lc= 0.4 mm. 3 Results and Discussion
The experiments are performed as per the parameter setting shown in experimental layout in Table 3. The corresponding performance measures like material removal rate (MRR), tool wear rate (TWR), radial over cut (ROC) and average surface roughness (ROC) are tabulated in Table 3. The effect of different process parameters on the performance measures are discussed as follows: 3.1 Effect of parameters on MRR
With increase in the process parameters like discharge current and pulse-on-time, the spark energy increases leading to increase in MRR. The main effect plot of the MRR is given in Fig. 3. MRR is maximum when copper tool electrode is used followed by AlSiMg RP electrode and brass electrode. Copper is having highest electrical conductivity as compared to other two tool electrodes. Therefore, more spark is generated and highest MRR occurred during
ti tf
t
(W W )TWR(t )
tiW
tfW
t
o tD DROC2
oD tD
Table 4 — Densities if tool electrodes and titanium alloy work piece.
Material AISI 1040 SS AlSiMg RP Copper Brass Density (g/cm3) 7.845 2.664 8.96 8.565
Fig. 3 — Main effects plot for MRR (a) MRR versus Tool, (b) MRR versus Ton and (c) MRR versus Ip.

INDIAN J ENG MATER SCI, JUNE-AUGUST 2019
192
machining by the use of copper tool electrode. The analysis of variance (ANOVA) for MRR is presented in Table 5 with co-efficient of determination (R2) value of 96.1%. The ANOVA and main effect plot are generated by using statistical software MINITAB 16. From ANOVA, it is found that tool type has the highest influence followed by discharge current with percentage contribution of 58.01 % and 37.32 %, respectively. 3.2 Effect of parameters on TWR
With increase in discharge current and pulse-on-time, spark energy increases causing increase of
TWR. The copper tool has less TWR followed by AlSiMg RP and brass tool electrodes. The copper tool has higher melting point and good thermal conductivity as compared to other two electrodes. Therefore, copper tool electrode exhibit lower TWR as compared to the other tool electrodes. The main effect plot of the TWR is given in Fig. 4. The ANOVA for TWR is presented in Table 6 with R2 value of 95.5%. From ANOVA, it is found that tool type has the highest influence followed by discharge current and pulse-on-time with percentage contribution of 68.08 %, 23.52 %, and 3.89 %, respectively.
Table 5 — ANOVA for MRR.
Source DF Seq SS Adj SS Adj MS F P %Contribution A 2 12.3372 12.3372 6.16861 15.02 0.062 58.01 B 2 0.1733 0.1733 0.08667 0.21 0.826 0.81 C 2 7.9363 7.9363 3.96816 9.66 0.094 37.32
Error 2 0.8214 0.8214 0.41071 3.86 Total 8 21.2683 100
Fig. 4 — Main effects plot for TWR (a) TWR versus Tool, (b) TWR versus Ton and (c) TWR versus Ip.

SAHU & MAHAPATRA: COMPARISON OF PERFORMANCE OF DIFFERENT TOOL ELECTRODES DURING EDM
193
3.3 Effect of parameters on ROC The radial over cut (ROC) on the work piece
occurs due to the generation of radial sparks. Larger and wider crater are formed with increase in discharge current and pulse-on-time. Therefore, the ROC is increased with increase in discharge current and pulse-on-time. The copper tool has less ROC followed by AlSiMg RP and brass tool electrodes. The optical images of the crater cavity machined by three different tool electrodes are shown in Fig. 5 with 10× magnification. The main effect plot of the ROC is given in Fig. 6. The ANOVA for ROC is presented in Table 7 with R2 value of 97.2%. From ANOVA, it is found that tool type has highest effect followed by pulse-on-time with percentage contribution of 63.76 % and 32.64 %, respectively. 3.4 Effect of parameters on surface roughness
The EDMed surface consists of crater, globules of debris, pockmarks, cracks, voids and pores (Fig. 7). This forms unevenness on the machined surface. Better surface finish of the machined surface must be considered for accurate and precise use of the components in industries. Surface roughness is directly proportional to discharge current and pulse-on-time. With increase in these parameters, the crater
depth increases and average surface roughness become more (as shown in Fig. 8 (a & b)). The AlSiMg SLS tool produces good surface finish on the machined specimen as compared to other two tool electrodes. By the use of copper tool electrode, higher MRR is noted with increase in crater depth. Therefore, copper tool exhibit worst surface finish specimens and brass tool exhibit surface finish in between the other two electrodes. The main effect plot for the average surface finish is given in Fig. 8. The analysis of variance (ANOVA) for average surface finish is presented in Table 8 with R2 value of 92.5%. From ANOVA, it is found that tool type has highest effect followed by discharge current and pulse-on-time with percentage contribution of 65.81 %, 21.96 % and 4.78 %, respectively. 3.5 Optimization by TOPSIS method
In EDM process, it is desired to maximize material removal rate and simultaneously minimize the undesired performance measures like tool wear rate, radial over cut and average surface roughness of the machined surface. From the ANOVA tables (Tables 5-8), it is observed that machining parameters influence the different performance measures in different manner. To study all the performance measures concurrently,
Table 6 — ANOVA for TWR.
Source DF Seq SS Adj SS Adj MS F P %Contribution A 2 2.2275 2.2275 1.11377 15.07 0.062 68.08 B 2 0.1274 0.1274 0.06368 0.86 0.537 3.89 C 2 0.7695 0.7695 0.38474 5.21 0.161 23.52 Error 2 0.1478 0.1478 0.07389 4.51 Total 8 3.2721 100
Fig. 5 — Radial over cut of machined surface by different tool electrodes (a) AlSiMg RP, (b) Copper and (c) Brass.

INDIAN J ENG MATER SCI, JUNE-AUGUST 2019
194
multi-response optimization method (TOPSIS) is used. By following the procedure of the TOPSIS as explained in Eqs. (1-8), all the four performance measures are converted into the single performance index known as the closeness coefficient (Ci). The normalized decision matrix ( ), weighted normalized
value matrix ( ), best experimental run distance
( ), worst experimental run distance ( ) and closeness coefficient (Ci) are calculated and tabulated in Tables (9-11) as follows. During calculation of the weighted normalized value matrix ( ), equal
weightage (i.e. 0.25) is considered for each performance measures.
The ANOVA for the closeness coefficient (Ci) is tabulated in Table 12 with R2 = 97.9%. The main effect plots for the closeness coefficient (Ci) are plotted in Fig. 9. From the ANOVA (Table 12), the type of tool is found to be the most significant parameter followed by pulse-on-time and discharge current with percentage contribution of 78, 11.64 and 8.26, respectively. The best parametric setting for simultaneous optimization of four performance measures is obtained when discharge current and pulse on time are set at their low level along with the
ijr
ijv
ijDijD
ijv
Fig. 6 — Main effects plot for ROC (a) ROC versus Tool, (b) ROC versus Ton and (c) ROC versus Ip.
Table 7 — ANOVA for ROC.
Source DF Seq SS Adj SS Adj MS F P %Contribution A 2 0.009582 0.009582 0.004791 22.93 0.042 63.76 B 2 0.004905 0.004905 0.002453 11.74 0.079 32.64 C 2 0.000123 0.000123 0.000061 0.29 0.773 0.82
Error 2 0.000418 0.000418 0.000209 2.78 Total 8 0.015028 100

SAHU & MAHAPATRA: COMPARISON OF PERFORMANCE OF DIFFERENT TOOL ELECTRODES DURING EDM
195
use of copper electrode. The optimal parametric setting is shown in response table for closeness coefficient (Table 13). To obtain high MRR, low
TWR and less ROC, copper tool electrode should be used. However, AlSiMg RP electrode should be used to obtain better surface finish. 3.6 SEM and EDX analysis
The scanning electron microscopic image of the machined surfaces by different tool electrodes and their EDX analysis are done by the scanning electron microscope (SEM) (model: JEOL JSM-6480LV). The SEM image of the machined surface by the use of AlSiMg RP tool and at parametric setting of Ip=10A and Ton=100µs is shown in Fig. 10. Corresponding EDX analysis same machine surface is presented in Fig. 11. From the EDX analysis it is found that there is present of tool materials like Al, Si and Mg on the machined surface, which is transferred from the tool to the work piece during machining. The weight percentage of carbon present on the machined surface is also increased. These carbon particles dissociated from the dielectric fluid, and combined with the metallic elements form the metallic carbides in form of the white layers.
Fig. 7 — EDM machined surface with AlSiMg tool electrode at Ton=100 µs and Ip=10 A.
Fig. 8 — Main effects plot for Ra (a) Ra versus Tool, (b) Ra versus Ton and (c) Ra versus Ip.

INDIAN J ENG MATER SCI, JUNE-AUGUST 2019
196
Similarly, the SEM image and EDX analysis of machined surface by the use of copper tool and at parametric setting of Ip=20A and Ton=100µs is shown in Fig. 12 and Fig. 13, respectively. Here, also it is found that the tool element cooper is transferred to the machined surface. The dissociated carbon elements during sparking are deposited on the machined surface in form of metallic carbides.
Therefore, the carbon content of the machined surface increased.
The SEM image and EDX analysis of machined surface by the use of brass tool and at parametric setting of Ip=30A and Ton=300µs is shown in Fig. 14 and Fig. 15, respectively. Here, also it is found that the tool element cooper and zinc are transferred to the machined surface. Combine with the metal particles the dissociated carbon elements of the dielectric fluid during machining deposits on the machined surface in form of metallic carbides. Therefore, the carbon content of the machined surface increased.
3.7 Surface crack density of machined surface In EDM, due to successive sparks, thermal stresses
is generated on the machined surfaces and due to that reason, surface cracks are formed. The scanning electron micrograph of the machined surface by three different types of tool electrodes is taken by scanning electron microscope (SEM) with 1000× magnification. The total crack length of the machined surface is measured by pdf xchange viewer software. The total crack length divided by total micrograph area is given the surface crack density (SCD). It is found that by the use of AlSiMg RP electrode less surface crack density is found followed by brass and copper electrode. The SEM micrograph of the machined surface after the measurement of the SCD is shown in Fig. 16.
Table 12 — ANOVA for closeness coefficient (Ci)
Source DF Seq SS Adj SS Adj MS F P %Contribution A 2 0.267433 0.267433 0.133716 37.28 0.026* 78.00 B 2 0.039909 0.039909 0.019954 5.56 0.152 11.64 C 2 0.028331 0.028331 0.014166 3.95 0.202 8.26
Error 2 0.007174 0.007174 0.003587 2.10 Total 8 0.342847 100
*Significant parameters at 95% confidence interval
Table 8 — ANOVA for Ra.
Source DF Seq SS Adj SS Adj MS F P % Contr- ibution
A 2 23.463 23.463 11.7314 8.82 0.102 65.81 B 2 1.703 1.703 0.8515 0.64 0.610 4.78 C 2 7.829 7.829 3.9144 2.94 0.254 21.96
Error 2 2.659 2.659 1.3293 7.45 Total 8 35.653 100
Table 9 — Normalized decision matrix ( )
Sl. No. (MRR) (TWR) (ROC) (Ra)
1 0.2669 0.1814 0.2370 0.2191 2 0.3366 0.4176 0.3352 0.2597 3 0.4759 0.5038 0.3919 0.3155 4 0.3830 0.0657 0.0707 0.3944 5 0.4433 0.1035 0.2120 0.4492 6 0.3192 0.0591 0.2706 0.3396 7 0.2740 0.5156 0.3653 0.3068 8 0.1773 0.2612 0.3801 0.29588 9 0.1934 0.4317 0.5261 0.36158
Table 10 — Weighted normalized value matrix ( ijv ).
Sl. No. ijv (MRR) ijv (TWR) ijv (ROC) ijv (Ra)
1 0.0667 0.0453 0.0592 0.0548 2 0.0841 0.1044 0.0838 0.0649 3 0.1190 0.1260 0.0980 0.0789 4 0.0958 0.0164 0.0177 0.0986 5 0.1108 0.0259 0.0530 0.1123 6 0.0798 0.0148 0.0676 0.0849 7 0.0685 0.1289 0.0913 0.0767 8 0.0443 0.0653 0.0950 0.0740 9 0.0484 0.1079 0.1315 0.0904
Table 11—Best experimental run distance ( ijD ), worst
experimental run distance (i jD ) and closeness coefficient (Ci).
Sl. No. Di+ Di
- Ci 1 0.0734 0.1266 0.6329 2 0.1171 0.0819 0.4115 3 0.139242069 0.0884 0.3884 4 0.0496 0.1687 0.7727 5 0.0689 0.1456 0.6789 6 0.0703 0.1382 0.6629 7 0.1465 0.0589 0.2867 8 0.1203 0.0827 0.4075 9 0.1670 0.0306 0.1548
ijr
ijr ijr ijr ijr

SAHU & MAHAPATRA: COMPARISON OF PERFORMANCE OF DIFFERENT TOOL ELECTRODES DURING EDM
197
4 Conclusions
Fig. 9 — Main effects plot for closeness coefficient (Ci) (a) Ci versus Tool, (b) Ci versus Ton and (c) Ci versus Ip.
Fig. 11— EDX spectra of the machined surface at parametric setting A1B1C1.
Fig. 12 — SEM image of machined surface at parametric setting A2B1C2.
Fig. 10 — SEM image of machined surface at parametric setting A1B1C1.
Table 13 — Response table for means of closeness
coefficient (Ci).
Level A B C 1 0.4776 0.5641* 0.5678* 2 0.7048* 0.4993 0.4463 3 0.2830 0.4021 0.4513
Delta 0.4218 0.1620 0.1214 Rank 1 2 3
*Optimal level of parametric setting

INDIAN J ENG MATER SCI, JUNE-AUGUST 2019
198
4 Conclusions In the present work, electrical discharge machining
(EDM) of AISI 1040 stainless steel has been investigated by using AlSiMg tool electrode prepared via SLS process, copper and brass tool electrodes. The design of experiment approach i.e. Taguchi’s L9 orthogonal array has been used to conduct the experiment by varying the controllable parameters like tool type, pulse-on-time (Ton) and discharge current (Ip). The EDM performance like material removal rate (MRR), tool wear rate (TWR), radial over cut (ROC) and average surface roughness of machined surfaces (Ra) have been evaluated and the effect of the process parameters on these performance measures have been studied. To obtained best EDM performance, TOPSIS method has been used to get best parametric setting. From this experimental work following conclusion can be drawn. (i) Better EDM performance can be achieved by
decreasing discharge current and pulse-on-time and with the use of copper tool electrode. The optimal EDM parameter setting obtained are tool= Copper tool electrode, Ton= 100µs and Ip= 10A to maximize MRR and minimize TWR, ROC and Ra concurrently.
(ii) The MRR increased with the increase discharge current and pulse-on-time. By the use of copper tool electrode, maximum MRR can be achieved followed by AlSiMg RP electrode and brass tool electrode.
(iii) Similarly, the TWR increased with the increase in discharge current and pulse-on-time. By the use of copper tool electrode, minimum TWR can be achieved followed by AlSiMg RP electrode and brass tool electrode.
(iv) The ROC increased with the increase in discharge current and pulse-on-time. By the use of copper tool electrode, minimum ROC can be
Fig. 13 — EDX mapping of machined surface at parametric setting A2B1C2.
Fig. 14 — SEM image of machined surface at parametric setting A3B1C3.
Fig. 15 — EDX spectra of the machined surface at parametric setting A3B1C3.
Fig. 16 — Surface crack density of machined surface by use of different tool electrodes (a) AlSiMg RP, SCD=0.007407µm/µm2, (b) Copper, SCD=0.012037µm/µm2 and (c) Brass, SCD=0.009259µm/µm2.
Fig. 14 — SEM image of machined surface at parametric setting A3B1C3.

SAHU & MAHAPATRA: COMPARISON OF PERFORMANCE OF DIFFERENT TOOL ELECTRODES DURING EDM
199
obtained followed by AlSiMg RP electrode and brass tool electrode.
(v) A better surface finish of the EDM machined surface can be obtained with lower parametric setting of discharge current, pulse-on-time and with the use of AlSiMg RP tool electrodes during machining. With increase in discharge current and pulse-on-time, the Ra value of the machined surface also increased. Better surface finish can be achieved by using AlSiMg RP electrode followed by brass and copper tool electrodes.
(vi) The EDX analysis of the machined surface revealed the presence of tool materials on the machined surfaces. These tool materials migrated from the tool electrode surface and deposited on the work piece surface and combine with the carbon elements of dielectric fluid with the formation of metallic carbides.
(vii) The SCD of the machined surfaces is lowest by the use of AlSiMg RP tool electrode followed by brass and copper tool electrodes.
References 1 Zhao J, Li Y, Zhang J, Yu C & Zhang Y, J Mater Proces
Technol, 138 (2003) 475. 2 Czelusniak T, Amorim F L, Higa C F & Lohrengel A,
Int J Adv Manuf Technol, 72 (2014) 1503. 3 Czelusniak T, Amorim F L, Lohrengel A & Higa C F,
Int J Adv Manuf Technol, 72 (2014) 905. 4 Durr H, Pilz R & Eleser N S, Comput Ind, 39 (1999) 35.
5 Tang Y, Hong J, Zhou H & Lu B, J Mater Process Technol, 166 (2005) 199.
6 Ding Y, Lan H, Hong J & Wu D, Robot Comput Integr Manuf, 20 (2004) 281.
7 Arthur A, Dickens M P & Cobb R C, Rapid Prototyping J, 2 (1996) 4.
8 Dimla D E, Hopkinson N & Rothe H, Int J Adv Manuf Technol, 23 (2004) 249.
9 Ferreira J C, Mateus A S & Alves N F, Int J Adv Manuf Technol, 34 (2007) 1133.
10 Yarlagadda P K D V, Christodoulou P & Subramanian V S, J Mater Process Technol, 89 (1999) 231.
11 Unses E & Cogun C, J Mech Eng, 61 (2015) 409. 12 Gulcan O, Uslan I, Usta Y & Cogun C, Mach Sci Technol,
20 (2016) 523. 13 Patel I & Powar P, Int Res J Eng Technol, 05 (2018) 1332. 14 Ozerkan H B, J Mech Sci Technol, 32 (2018) 4357. 15 Kohli A, Wadhwa A, Virmani T & Jain U, Int J Mech
Mechatronics Eng, 6 (2012) 2839. 16 Tripathy S & Tripathy D K, Eng Sci Technol, Int J, 19 (2016)
62. 17 Dewangan S, Gangopadhyay S & Biswas C K, Measurement,
63 (2015) 364. 18 Gadakh V S, Adv Prod Eng Manage, 7 (2012) 157. 19 Chakladar N D & Chakraborty S, Proc Institution Mech Eng,
Part B: J Eng Manuf, 222 (2008) 1613. 20 Sahu A K, Mohanty P P & Sahoo S K, Advances in 3D
Printing & Additive Manufacturing Technologies, (Springer Science+Business Media Singapore) 2017, 65.
21 Ramesh S, Viswanathan R & Ambika S, Measurement, 78 (2016) 63.
22 Ahmed L S & Kumar M P, J Mech Sci Technol, 30 (2016) 1835.
23 Peng C, Du H & Liao T W, Robot Comput Integr Manuf, 43 (2017) 96.
24 Srirangan A K & Sathiya P, Mater Today: Proc, 4 (2017) 2031.