comparison of physiological consequences of head-loading
DESCRIPTION
Women in Africa carry heavy loads of water, firewood or vegetables on their heads, seemingly effortlessly. But, is this wise? This brief document investigates the consequences of this practice.TRANSCRIPT

A comparison of the physiological consequences of
head-loading and back-loading for African and European
women
R. Lloyd1*, B. Parr2, S. Davies2, T.Partridge1 and C. Cooke3
1Division of Sport and Exercise Sciences, University of Abertay Dundee, Dundee, DD1 1HG, UK
2 Department of Sports Management, Cape Peninsula University of Technology
3Carnegie Research Institute, Leeds Metropolitan University, Leeds, LS6 3QS, UK
* Author for correspondence – [email protected]
Abstract: Aim: to quantify the physiological cost of head-load carriage and to examine the
'free ride' hypothesis for head-load carriage in groups of women differing in their experience of headloading.
Method: Twenty four Xhosa women (13 experienced head-loaders (EXP), 11 with no experience of head-
loading (NON)) attempted to carry loads of up to 70% of body mass (BM) on both their heads and backs whilst
walking on a treadmill at a self selected walking speed. Expired air was collected throughout. In a second study
nine women, members of the British Territorial Army (TA), carriedsimilar loads, again at a self selected speed.
Results: Maximum load carried was greater for the back than the head (54.7±15.1% v 40.8±13.2% BM,
P<0.0005). Considering study one, head-loading required a greater oxygen rate than back-loading (10.1±2.6
ml.kgbodymass-1.min-1 v 8.8±2.3 ml.kgbodymass-1.min-1, P=0.043, for loads 10-25%BM) regardless of previous
head-loading experience (P=0.333). Percentage changes in oxygen consumption associated with head-loading
were greater than the proportional load added in both studies but were smaller than the added load for the
lighter loads carried on the back in study 1. Allother physiological variables were consistent with changes in
oxygen consumption.
Conclusion: The data provides no support for the 'free ride' hypothesis for head-loading although there is some
evidence of energy saving mechanisms for back-loading at low speed/load combinations. Investigating the
large individual variation in response may help in identifying combinations of factors that contribute to
improved economy.

2
1. Introduction
The necessity to transport relatively heavy loads remains an important
occupational task for many people, including school students and the military.
Consequently much attention has been paid to load carriage with a number of
different approaches evident in the literature. The analytical perspectives
employed include: kinematics (e.g. Sharpe et al, 2008; LaFiandra et al, 2003),
kinetics (e.g. Chow et al, 2005; Birrell et al, 2007), electromyography (e.g.Al-
Khabbaz et al, 2008; Bobet and Norman, 1984) and subjective perceptual
responses (e.g. Birrell and Hooper, 2007; Mackie and Legg, 2008). By far the
most prevalent approach, however, has been an examination of the physiological
consequences of carrying loads (e.g. Bastien et al, 2005a; Abe et al, 2004). For
the most part these analyses have considered the energetic consequences of load
carriage through an examination of oxygen consumption.
One particular area that has been explored in some detail is that of the effect of
load placement and load carrying method on energy expenditure. Taylor et al
(1980) demonstrated, across a range of species, that, for loads carried on the back,
the increase in energy expenditure associated with a given load was directly
proportional to the relative increase in mass i.e. an additional load of 10% body
mass evokes a 10% increase in energy expenditure. This result has been replicated
in numerous human studies (e.g.Quesda et al, 2000; Rorke, 1990). Studies
examining the effect of load placement on energy expenditure have generally
shown significant advantages for load placements close to the trunk as opposed to
loads carried more distally, in the hands or on the feet (e.g. Soule and Goldman

3
1969). There are, however, either only small or no advantages for particular
loading methods when the methods compared all involve loading of the trunk (e.g.
Kirk and Schneider, 1992; Holewijn, 1990). Datta and Ramanathan (1971) and
Legg and Mahanty (1985) both compared a range of loading conditions and found
small advantages for double pack systems, where the load was carried split
between the back and the front of the trunk, over back-loading alone. These
findings were supported by Lloyd and Cooke (2000a). Stuempfle et al (2004)
reported a significant advantage for loads carried high on the back compared to
loads carried in a low position. Similarly, Obusek et al (1997) examined the
effect of the location of the centre of mass of a backpack on energy cost. They
found a significant linear relationship between the position of the centre of mass
and energy cost with positions close to the body and high on the back being
associated with lower metabolic cost.
In the developing world heavy loads are regularly carried over long distances as a
necessary part of daily routine. Most commonly the method employed is some
form of head-loading, either with the load carried on the back but supported by a
forehead strap (e.g. Nepalese porters) or directly on the head (e.g. African
women). It has been argued that both of these methods represent particularly
economical solutions to the problem of carrying loads in these environments
(Maloiy et al, 1986; Charteris et al (1989 a,b);Bastien et al, 2005b). The head
strap method has received some recent attention. Minetti et al (2006) concluded
that the remarkable capabilities of the Himalayan porters could only partially be
explained by metabolic efficiency whilst Malville et al (2001) argued that a
combination of pacing strategy and metabolic efficiency contribute to the load
carrying abilities of the commercial porters in Eastern Nepal. Both studies seem

4
to support the early findings of Nag et al (1979) who reported this method as
being particularly economical when heavy loads are carried at relatively slow
speeds.
The data for direct head-loading are more inconsistent. Maloiy et al (1986)
reported a phenomenon whereby African women could carry loads of up to 20%
body mass with no additional energy expenditure, with a linear relationship
thereafter (i.e. loads of 30% body mass required a 10% increase in energy
expenditure). This ability to carry loads of up to 20% body mass with no
additional energy expenditure above that required for unloaded walking has
become known as the ‘free ride’ hypothesis (Charteris et al, 1989). The findings
of Maloiy et al (1986) were particularly interesting as they suggested that both
direct head-loading and the forehead strap method were exceptionally economical
regardless of the method employed. The study involved a total of five women
from two different ethnic groups, each of which employed a different head-
loading method. The Luo women (n=3) carried the loads directly on their heads
whilst the Kikuyu women (n=2) carry the loads on their backs, supported by a
head strap. Charteris et al (1989) provide support for the ‘free ride hypothesis’
based on a study involving six Xhosa women who were direct head-loaders.
Jones et al (1987) suggested that the existence of a ‘free ride’ was predicated on
the relative contribution of body fat to the overall load. Of the eight Mandinka
women they assessed, all employing the direct head-loading method, four
appeared to follow the patterns indicated by Maloiy et al (1986) whilst the
remainder demonstrated the more typical proportional response. The defining
characteristic of the two groups was body composition and Jones et al (1987)
concluded that African women could be extremely economical load carriers only

5
if they were lean. They suggested that any external load and body fat
combination up to 140% fat free mass could be carried, directly on the head, with
no additional energy expenditure.
In contrast to Maloiy et al (1986), Jones et al (1987) and Charteris et al (1989),
the earlier studies of Soule and Goldman (1969), Datta and Ramanathan (1971)
and Datta et al (1973) all suggest that the energy cost of direct head-loading is
broadly in line with the proportional increase associated with back-loading. Thus,
it is striking that there has been no systematic investigation into the
generalisability of the free-ride hypothesis. Rather the subsequent literature has
sought to biomechanically explain the phenomenon and has been based around
reinterpretation and analysis of the physiological data from Maloiy (1986) (e.g.
Heglund et al, 1995). No contemporary physiological data exists for head-loading
in African women. The purpose of this study was, therefore, to provide a more
comprehensive description of the physiological consequences of head-loading for
both experienced and not experienced participants than currently exists in the
literature and, via comparison with back-loading, provide a more systematic
investigation of the ‘free ride’ hypothesis.
2. Methods
2.1 Participants
Twenty four Xhosa women, thirteen with at least ten years experience of head
load carriage (EXP) and eleven with no experience of head load carriage (NON)
6
were recruited to take part in study 1, whilst nine British women, all members of
the Territorial Army with no experience of head load carriage but significant
experience of back-loading, took part in study 2 (TA). All participants gave
informed consent for their participation in the studies. Both studies had received
ethical approval through standard institutional review procedures at both the
University of Abertay Dundee and Cape Peninsula University of Technology.
The women in all three groups were of similar age (22.5±2.1, 21.2±2.4 and
21.8±1.8 years for EXP, NON and TA respectively, P=0.765 ) and body mass
(66.0±12.8, 66.8±14.5 and 67.4±8.4 kg for EXP, NON and TA respectively,
P=0.967). The TA group were, however, significantly taller than either the EXP
or NON groups (165±5.4 cm v 159±5.1cm and 158±5.3 cm respectively,
P=0.011)
2.2 Study 1
2.2.1 Experimental Procedures
The women each attended the Human Performance Laboratory at Cape Peninsula
University of Technology on three separate occasions. On the first occasion
participants were screened for any potential contraindications to exercise, stature
and mass were assessed, and questionnaires were completed relating to load
carriage history. The women were then habituated to the experimental protocol
and the equipment to be used. A typical habituation session lasted between
twenty and thirty minutes and involved the women walking on the treadmill at

7
various speeds both with and without a face mask. In addition they also tried out
the two load carrying devices, a standard 45l backpack (Karrimor, SA) for back
loading and a plastic crate for head loading (the crate placed either directly on the
head or on a small piece of rolled cloth to provide some cushioning), with and
without loads. At the end of the session the women were asked to walk on the
treadmill at a speed that they felt would be comfortable when carrying a heavy
load. The chosen walking speed of each participant was noted and used for the
subsequent experimental trials.
On arrival at the laboratory at the next visit each participant chose at random, via
the picking of a piece of paper (marked with either ‘H’ or ‘B’) from a hat, the
loading method for the first experimental trial. This involved walking, at the
previously determined speed, for four minutes unloaded and then, after a one
minute rest, a load of 10% body mass was added. This load was then carried for a
further four minutes. After a further rest of one minute the load was increased to
15% and carried for four minutes. This pattern was repeated with loads of 20%,
25%, 30%, 40%, 50%, 60% and 70% of body mass or until pain and discomfort
led to voluntary cessation of the session. Workloads of four minutes duration
were employed based on pilot work which showed that steady state oxygen
consumption was achieved within this time. This is consistent with previous
studies in the area (e.g. Lloyd et al 2000a) The load was calculated based on the
body mass at the habituation session and was made up of the mass of the actual
carrying device plus appropriate weightlifting plates, (between 2.5 kg and 10 kg),
and 100g sandbags, which allowed the load to be adjusted to within 50g of the
required load. Each participant attended the laboratory one week later to repeat
the experiment with the other loading device.
8
2.2.2 Data collection and analysis
All participants were fitted with a face mask and expired air was collected
throughout the protocol by means of an on-line gas analysis system (Quark b2,
Cosmed, Rome). The system was calibrated prior to each test in accordance with
manufacturer’s instructions using gases of known concentration (16% O2, 4%
CO2) and room air. Participants were also fitted with a heart rate monitor (Polar,
Finland). All measured cardiorespiratory variables (oxygen consumption, minute
ventilation, carbon dioxide production, breathing frequency, tidal volume and
heart rate) were subsequently averaged over the final minute of each workload.
These were then analysed using an ANOVA with repeated measures (SPSS,
v16.0). All multiple comparisons were accomplished after use of a Bonferroni
correction. Percentage changes over unloaded walking were calculated for key
variables and compared via a repeated measures group x method ANOVA. In
study 1 all women carried at least 25% BM in both conditions whilst in study 2 all
women carried at least 30% BM in both conditions. The analysis will reflect this
with, for study 1 data, method x group x load ANOVAs for 0-25% BM and
method x load ANOVAs for loads of 0 -30% BM for study 2. For study 1 a
further method x group ANOVA will be used to analyse data at 30% BM (n=10
for both NON and EXP) and a simple ANOVA comparing method will be
performed to analyse data at 40% BM (n=12, 8 EXP, 4 NON) and 50% BM (n=7,
5 EXP, 2 NON.)
Maximum load carried was recorded and compared between the groups and
9
conditions by means of a further ANOVA with repeated measures. Univariate
ANOVA was used to assess differences in physical characteristics and walking
speed between the three groups.
2.3 Study 2
The second study took place at the Human Performance Laboratory of the
University of Abertay Dundee and differed from study 1 only in respect of: the
loads to be carried (0, 10%, 20%, 30%, 40%, 50% 60% and 70% BM), the online
gas analysis system which was a Metalyzer 3b (Cortex, Germany), the backpack
used was a standard British Army issue Bergen and the walking speed was 4.33 ±
0.19 km.h
-1, significantly faster than either the EXP or the NON groups in study 1
(P<0.0005).
3. Results
3.1 Chosen walking speed
The walking speeds chosen by the women in study 1 were not significantly
different (3.15±0.45 and 3.00±0.30 km.h
-1 for EXP and NON respectively,
P=0.607). These speeds were, however, significantly slower than the walking
speed chosen by the TA women (4.33±0.19 km.h
-1, P<0.0005)
3.2 Load carried

10
Considering study 1, significantly greater load was carried on the back than on the
head (P=0.014), with the average maximum load associated with head-carriage
being 41.5 ± 14.4% BM versus 51.5 ± 15.8% BM for back load carriage. These
equate to absolute loads of 26.8 ± 8.6 kg and 33.2 ± 9.4 kg respectively. There
was no significant difference between the groups overall (P=0.308) and the
response was consistent between the two groups (P=0.845) with mean differences
were 5.9 kg and 6.8 kg for the EXP and NON groups respectively. Two of the
EXP group and four of the NON group carried more on their head than on their
back, five EXP carried the same in both conditions whilst six EXP and seven
NON carried more on their backs than on their heads. Considering the TA group
the load carried on the back, 63.3±8.7% BM, was significantly greater than the
load carried on the head (P=.001), 38.9±9.3% BM. These equate to absolute loads
of 43.1±10.0 kg and 25.9±5.3 kg respectively. One of the TA group carried the
same load in both conditions whilst the rest carried more on their backs.
3.3 Oxygen Consumption
Considering study 1, unloaded oxygen consumption (ml.kg-1
.min-1
) was not
different between the successive measurements in each of the two conditions (8.3
± 2.1 ml.kg-1
.min-1
v 7.7 ± 1.8 ml.kg-1
.min-1
for head- and back-loading
respectively, P= 0.261). Considering all loads 10-25% BM oxygen consumption
was greater than the unloaded condition (P<0.0005) and, moreover, the average
oxygen consumption across all loads associated with head-loading was
significantly greater than that associated with back-loading (10.1 ± 2.6 ml.kg-
1.min
-1 v 8.8 ± 2.3 ml.kg
-1.min
-1 respectively, P=0.043). The pattern of response
between the groups was consistent (method x group interaction, P=0.333, figure 1

11
and table 1) as was the pattern across increasing loads (method x load interaction
P=0.120). There was also a significantly greater oxygen consumption associated
with the head loading condition at the 30% BM load (11.4 ± 3.3 ml.kg-1
.min-1
v
9.6 ± 2.9 ml.kg-1
.min-1
for head- and back-loading respectively, P=0.041, n=15)
but not at either 40% BM (11.6 ± 3.1 ml.kg-1
.min-1
v 10.4 ± 3.6 ml.kg-1
.min-1
, P=
0.249, n=11) or 50% BM (12.2 ± 2.9 ml.kg-1
.min-1
v 11.3 ± 4.2 ml.kg-1
.min-1
, P =
0.247, n=7). Again the pattern of response was consistent across the groups with
group by method interactions of P=0.780 at 30% BM and P= 0.280 at 40% BM.
0
2
4
6
8
10
12
14
16
Head Back Head Back Head Back Head Back Head Back
Unloaded 10% 15% 20% 25%
Method and Load
Ra
te o
f O
xy
ge
n C
on
su
mp
tio
n (
ml. k
g-1
. min
-1) EXP
NON
Fig 1 Mean (+s) Oxygen Consumption (ml.kg-1
.min-1
) for each group at loads of 10-25% BM in
each condition for study 1
Considering study 2, unloaded oxygen consumption (ml.kg-1
.min-1
) was not
different between the two successive measurements in each of the two conditions
(11.6 ± 1.4 ml.kg-1
.min-1
v 11.3 ± 1.3 ml.kg-1
.min-1
for head- and back-loading
12
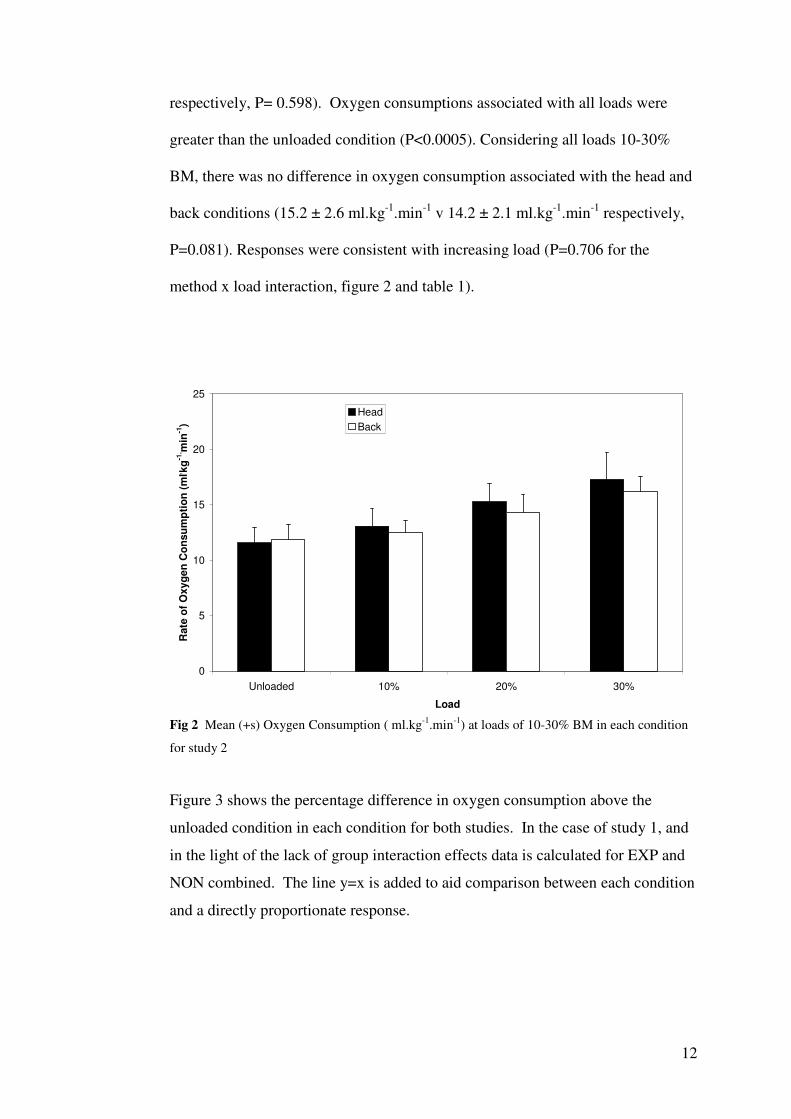
respectively, P= 0.598). Oxygen consumptions associated with all loads were
greater than the unloaded condition (P<0.0005). Considering all loads 10-30%
BM, there was no difference in oxygen consumption associated with the head and
back conditions (15.2 ± 2.6 ml.kg-1
.min-1
v 14.2 ± 2.1 ml.kg-1
.min-1
respectively,
P=0.081). Responses were consistent with increasing load (P=0.706 for the
method x load interaction, figure 2 and table 1).
0
5
10
15
20
25
Unloaded 10% 20% 30%
Load
Rate
of
Ox
yg
en
Co
ns
um
pti
on
(m
l. kg
-1. m
in-1
)
Head
Back
Fig 2 Mean (+s) Oxygen Consumption ( ml.kg-1
.min-1
) at loads of 10-30% BM in each condition
for study 2
Figure 3 shows the percentage difference in oxygen consumption above the
unloaded condition in each condition for both studies. In the case of study 1, and
in the light of the lack of group interaction effects data is calculated for EXP and
NON combined. The line y=x is added to aid comparison between each condition
and a directly proportionate response.

13
0
5
10
15
20
25
30
35
40
45
50
55
0 5 10 15 20 25 30 35 40 45 50 55
Load (% Body Mass)
Mean
Pere
cn
tag
e C
han
ge in
Rate
of
Oxyg
en
Co
nsu
mp
tio
n A
bo
ve U
nlo
ad
ed
(%
)
Head Study 1
Head Study 2
Back Study 1
Back Study 2
y=x
Fig 3 Mean percentage difference in oxygen consumption in each of the loading conditions for all
participants in both study 1 and study 2
3.4 Other Cardiorespiratory variables
The lack of interaction effects involving group for study 1 (EXP and NON) was
consistent across the rest of the variables measured. Consequently Table 1
contains combined data for both groups in study 1. The data in table 1 suggest
that the pattern of response for all other variables measured is similar to that for
the oxygen consumption data. This is summarized in figure 4 which shows a
summary of percentage differences, calculated as increase above back-load
condition for head-loading, presenting mean values across 10-25% BM loads for
study 1 and 10-30% BM loads for study 2, for each variable.
Table 1. Mean ± s for participants in study 1 and study 2 at each load for all variables. Data for
30%BM represents 20 participants for study 1 (10 EXP and 10 NON). * and bold indicates
significant difference (P<0.05) between loading conditions whilst ‘b’ indicates a trend for
difference (0.05<P<0.10) between loading conditions.

14
10% BM 15% BM 20% BM 25% BM 30% BM
Head Back Head Back Head Back Head Back Head Back
All 9.8 ± 2.6* 8.0 ± 2.2* 9.8 ± 2.4b 8.6 ± 2.1b 10.3 ± 2.4 9.2 ± 2.3 10.5 ± 3.0b 9.3 ± 2.3b 11.5 ± 3.3* 9.6 ± 2.9*
EXP 8.8 ± 1.8c 7.7 ± 2.7c 9.2 ± 1.4c 7.9 ± 2.4c 9.5 ± 19c 8.8 ± 2.6c 9.6 ± 2.4 9.1 ± 2.6 10.8 ± 2.7 9.2 ± 3.6
NON 11.0 ± 1.8c 8.4 ± 2.9c 10.6 ± 1.4c 9.3 ± 2.5c 11.2 ± 1.9c 9.7 ± 2.7c 11.6 ± 2.4 9.6 ± 2.7 12.0 ± 2.8 9.9 ± 3.8
2oV&
(ml.kg-1.min-1) TA 13.1 ± 1.3 12.5 ± 1.1 15.3 ± 1.7 14.3 ± 1.6 17.3 ± 2.4 16.2 ± 1.3
All 21.0 ± 5.6* 17.9 ± 4.8* 21.4 ± 5.3* 19.3 ± 5.1* 22.2 ± 5.8* 20.3 ± 5.0* 23.1 ± 6.5b 21.4 ± 5.6b 23.5 ± 6.7* 20.8 ± 5.3*
EXP 18.2 ± 4.1 17.3 ± 6.0 19.3 ± 4.0 18.5 ± 5.9 19.7 ± 5.5 19.9 ± 5.4 20.6 ± 6.3 20.6 ± 6.2 21.0 ± 5.8 20.2 ± 6.6
NON 24.4 ± 5.0* 18.7 ± 6.4* 23.7 ± 4.1b 20.2 ± 6.2b 25.2 ± 5.2* 20.7 ± 5.7* 26.0 ± 6.5b 22.4 ± 6.4b 25.9 ± 5.9 21.5 ± 6.7
eV&
(l.min-1)
TA 23.1 ± 4.4 22.3 ± 4.6 26.7 ± 4.8* 22.5 ± 4.1* 29.6 ± 8.1 25.7 ± 4.6
All 538 ± 182* 457 ± 146* 541 ± 179* 490 ± 156* 566 ± 187 530 ± 171 593 ± 203b 539 ± 182b 610 ± 218* 523 ± 167*
EXP 450 ± 149a 432 ± 192a 473 ± 132c 458 ± 184c 484 ± 164 512 ± 194 515 ± 191 523 ± 215 536 ± 200 501 ± 208
NON 643 ± 150a 487 ± 202a 621 ± 138c 529 ± 194c 664 ± 171 550 ± 204 685 ± 200 558 ± 226 684 ± 211 546 ± 220
2coV&
(ml.min-1)
TA 734 ± 84 665 ± 123 855 ± 96* 681 ± 80* 963 ± 226* 799 ± 73*
All 763 ± 217* 678 ± 177* 743 ± 182 688 ± 176 759 ± 189 710 ± 186 764 ± 220b 705 v 206b 765 ± 211b 690 ± 213b
EXP 661 ± 216a 639 ± 228a 671 ± 168a 644 ± 214a 674 ± 197a 660 ± 226a 671 ± 237a 652 ± 252a 676 ± 208 652 ± 261
NON 884 ± 218a,c 724 ± 234a,c 827 ± 160a 739 ± 217a 858 ± 198a 769 ± 223a 874 ± 230a 767 ± 247a 854 ± 217 728 ± 267
TV
(ml)
TA 971 ± 228 882 ± 131 1011 ± 146 841 ± 81 1054 ± 248 918 ± 56
All 28.2 ± 6.1* 26.7 ± 4.7* 29.2 ± 5.4 28.3 ± 4.9 29.8 ± 6.5 29.2 ± 5.7 31.0 ± 7.0 31.5 ± 7.6 31.2 ± 6.3 31.3 ± 7.5
EXP 27.8 ± 7.9 27.2 ± 6.0 28.9 ± 6.9 28.9 ± 5.7 29.3 ± 8.6 30.3 ± 7.0 30.8 ± 9.1 32.0 ± 9.9 31.0 ± 7.8 31.8 ± 9.7
NON 28.7 ± 6.4 26.2 ± 5.6 29.6 ± 5.8 27.6 ± 5.5 30.5 ± 6.8* 27.8 ± 5.3* 31.1 ± 7.3 30.8 ± 6.8 31.5 ± 6.8 30.8 ± 7.1
BF
(breaths.min-1)
TA 25.9 ± 7.1 26.6 ± 3.3 27.8 ± 5.1 27.9 ± 4.3 29.4 ± 7.5 29.0 ± 5.7
All 108 ± 12* 101 ± 11* 111 ± 12* 104 ± 11* 112 ± 13* 106 v 12* 115 ± 14* 110 ± 13* 119 ± 13* 111 ± 13*
EXP 107 ± 11 101 ± 13 109 ± 12 105 ± 14 109 ± 14 106 ± 15 112 ± 15 110 ± 15 118 ± 13 112 ± 15
NON 111 ± 12 101 ± 13 113 ± 13b 103 ± 14b 116 ± 15* 107 ± 15* 119 ± 16 110 ± 16 120 ± 13 111 ± 15
HR
(beats.min-1)
TA 114 ± 17* 96 ± 15* 120 ± 18* 104 ± 16* 127 ± 25* 114 ± 16*
All 0.88 ± 0.11 0.87 ± 0.07 0.88 ± 0.12 0.87 ± 0.08 0.88 ± 0.09 0.87 ± 0.08 0.88 ± 0.10 0.88 ± 0.07 0.86 ± 0.06 0.86 ± 0.08
EXP 0.87 ± 0.09 0.87 ± 0.09 0.87 ± 0.08 0.89 ± 0.09 0.87 ± 0.08 0.89 ± 0.09 0.87 ± 0.09 0.89 ± 0.09 0.84 ± 0.06 0.88 ± 0.10
NON 0.89 ± 0.10 0.86 ± 0.09 0.89 ± 0.08 0.85 ± 0.10 0.90 ± 0.07b 0.85 ± 0.09b 0.90 ± 0.10 0.87 ± 0.09 0.89 ± 0.06 0.84 ± 0.10 RER
TA 0.83 ± 0.04 0.83 ± 0.08 0.84 ± 0.04 0.84 ± 0.07 0.84 ± 0.06 0.85 ± 0.05

15
-5
0
5
10
15
20
25
V02 Ve VCO2 TV BF HR RER
Variable
Pe
rce
nta
ge
Dif
fere
nc
e
Study 1
Study 2
Fig 4 Overall percentage difference, calculated as increase above back-load condition, between
back-loading and head-loading in cardiorespiratory variables across 10-25% BM loads (Study 1)
and 10-30% BM loads (study 2)
4. Discussion
The chosen walking speed in study 1, 3.08 ± 0.39 km.h
-1, was similar to the speed
employed in previous studies, in particular it is very close to the ≈ 3.0 km.h
-1
defined as an optimal speed by Maloiy et al (1986). The speed chosen in study 2,
4.33±0.19 km.h
-1, was significantly greater than that chosen in study 1 and
presumably reflected the participants habituation to military marching speeds. As
a consequence of this difference in locomotion speed, as well as factors such as
fitness and load carriage history, no direct quantitative comparisons will be made

16
in respect of cardiorespiratory parameters. Any comparisons between the two
studies will be restricted to similarity or difference in pattern of response.
The data for oxygen consumption associated with the back-loading condition in
study 1 were, at least for the higher loads, consistent with previous studies,
displaying a proportional increase in oxygen consumption with increasing load as
reported by Taylor et al (1980). Mean percentage increases over the unloaded
condition were 19.9% and 23.3% at loads of 20% and 25% BM respectively. At
the lower loads, 10% and 15% BM, the mean percentage changes were 3.4% and
11.3%. These were lower than might have been predicted but they were
consistent with the data of Abe et al (2004) who reported a less than expected
increase in energy expenditure for back-loading when relatively light loads were
carried at slow speeds. In particular, they reported that loads of 6 kg, 9 kg and 12
kg carried at speeds of 3.0 and 3.6 km.h
-1 were associated with significantly
reduced energy cost of walking per unit distance when compared to unloaded
walking. These speeds and load combinations are similar to those employed in
study 1 where the average walking speed was 3.05 km.h
-1 and the average loads at
10% and 15% BM were 6.6 kg and 9.9 kg respectively. Abe et al (2004) argued
that this phenomenon was a consequence of the interaction between increased
‘rotative torque’, presumably associated with the forward lean that accompanies
back-loading (Lloyd and Cooke 2000b), and load on the lower limbs. The
absence of this phenomenon for head-loading at first seems to provide some
support for this idea. However, in the present study, the changes in oxygen
consumption for the 10% and 15% BM loads associated with head-loading were
19.6% and 20.3% respectively. Given that forward lean is not present during
head-loading, it would be reasonable to assume that the increased ‘rotative torque’
is absent. The data from study 2, where the reduction in energy cost was absent

17
(mean percentage changes of 8.9%, 21.0% and 37.5% for loads of 10%, 20% and
30% BM respectively), provides further support for the data of Abe et al (2004) as
the walking speed for these participants was much greater (4.3 ± 0.2 km.h
-1).
More research is required to tease out the precise mechanisms for the energy
saving phenomenon that seems to exist in certain conditions and, in particular,
why it is both speed and load dependent.
In terms of other variables reported in the results which are either directly or
indirectly related to oxygen consumption, such as minute ventilation, tidal
volume, breathing frequency and heart rate, they are consistent with the patterns
of response shown for oxygen consumption across the two studies. As expected,
when oxygen consumption is greater then so is the minute ventilation and heart
rate. The tendency for tidal volume to be greater during head loading could
possibly be explained by postural differences and any possible chest restriction
associated with wearing a backpack, especially since the tendency for a greater
tidal volume was consistent with increasing loads. This is consistent with previous
studies that have reported impaired abilities to increase tidal volume with
increasing backpack load as a consequence of compromise to the respiratory
muscles (Li et al, 2003; Lloyd and Cooke, 2000b). The increase in breathing
frequency with loading is to be expected, given the increased energy demands and
consistency of tidal volume for each loading condition, as it explains the
associated increase in minute ventilation. Overall, the results for other
cardiorespiratory variables support the pattern of response shown for oxygen
consumption. This provides confidence in the interpretation of differences and
similarities between the loading conditions and subject groups in terms of energy
expenditure.

18
Overall the data for oxygen consumption provide little support for the ‘free ride
hypothesis’, with the head-loading being associated with significantly greater
oxygen consumption than back-loading across the 10%-25% BM loads in study 1
and with a tendency for the same across the 10%-30% loads in study 2. Figure 4
clearly shows that, on average, the percentage increase in oxygen consumption for
the head-loading condition consistently lies above the line y=x for both study 1
and study 2. If a ‘free ride’ for head-loading exists as a generalisable phenomena
then the percentage increases for head-loading should lie below this line and
indeed, should move further below the line with loads between 10 and 20%. This
was not the case for either of the groups studied. Considering study 1, it was
anticipated that the EXP group would exhibit greater economy than the NON
group when head-loading. The tendency for difference between the groups
(P=0.069) and the lack of interaction between group and loading method
(P=0.333) would suggest that, whilst the EXP group were generally more efficient
load carriers than the NON group they were also more efficient whilst back-
loading than head-loading. Again this was a somewhat unexpected finding and
stands in contrast to the seminal works in this area (Maloiy et al, 1986; Charteris
et al, 1989a, Charteris et al, 1989b). One possible explanation for this is that the
participants in these early studies were considerably more experienced head-
loaders than those used here. It is certainly the case that the six participants in the
studies by Charteris et al (1989a, 1989b) were older and more experienced, age
33.7 ± 9.4 years and head-loading experience 22.5 ± 8.9 years, than the
participants in the EXP group in the present study, who had at least ten years
head-loading experience and were aged 22.5 ± 2.1. Maloiy et al (1986) provide
no data in relation to age or experience, although the participants were

19
characterised as experienced head-loaders. It would appear from these data that,
although the participants in the present study had not been head-loaders for as
long as those in the Charteris (1989a, b) studies, they had begun head-loading at
approximately ten years of age, the same age as those in previous studies. It
therefore seems unlikely that the differences in responses reported here can be
explained by length of habituation. A more likely explanation lies in the
variability of the data reported in the present study and the sample sizes of the
earlier studies.
Examination of individual results in study 1 indicates that it would be possible to
select a subset of women who did achieve remarkable levels of economy, in line
with the previously reported data. Given the small sample sizes in most of the
previous studies on head-loading this is not altogether unexpected but suggests
that the ‘free ride’ hypothesis is not a generalisable finding, when tested with
larger more representative samples of African women. Considering the oxygen
consumption data across the 10-20% BM loads, five women demonstrated the
‘free ride’ phenomenon for head-loading (odds of selection 1:42504), with
average increases above the unloaded condition of less than 0.5 ml.kg
-1, whilst
seven demonstrated the same phenomenon for back-loading. Only two of the
women feature in both subsets, one from each group. Remarkably, four of the five
most economical head-loaders were women with no experience of head-load
carriage. This would seem to indicate that structural changes to the spine
associated with early and prolonged exposure to head loading are unlikely to
provide explanations for such efficiency in individuals as previously speculated
(Maloiy et al 1986). Conversely, six of the seven most economical back-loaders
were from the EXP group. This was somewhat less unexpected as all of the

20
women in the EXP group had experience of back-loading, as it is the traditional
method for carrying young children, and were generally more experienced load
carriers, regardless of method, than their counterparts in the NON group.
It has also been argued that body composition influences load carriage economy
(Lyons et al. 2005) and that the explanation for the remarkable economy observed
in some head-load carriers is a consequence of their low body fat (Jones et al
1987), with the extent of the ‘free ride’ being determined by the combination of
fat and external load up to 140% of Fat Free Mass (FFM). Whilst this is helpful in
untangling some of the issues relating to the ‘free ride’ hypothesis it does not
provide support for the hypothesis as has been suggested. It would only provide an
explanation if all extremely economical load carriers are relatively lean – in the
present study the mean ± sd BMI for the eleven women exhibiting some form of
free ride for either carrying method was 24.0 ± 5.1 kg.m
-2, implying that these
women were, in general, not particularly lean. It might also be expected that if the
size of the load relative to FFM is the determinant of economy then there would
be a strong relationship between economy across different load carriage methods.
However, in the present study it was apparent that economy in one method of
carrying a load was not an indicator of economy in the other method (r=0.128, P =
0.552). This lack of association between economy and load carriage method is an
important finding. It suggests that cause and effect relationships between
economy and load carriage are not likely to be explained by a common set of
factors for different forms of load carriage in the same individuals, whether or not
they are experienced in either or both forms of load carriage under investigation.
This suggests that future research, and evaluations of previously completed
studies in load carriage, should focus on the mechanisms responsible for the
economy of individuals rather than expecting one or more mechanism to explain

21
the observed variation within a particular method. This shift in focus, with a view
to understanding how particular individuals carry loads more economically than
others and why particular methods are more economical for some individuals than
others, may provide a better understanding of the interactive effects of factors
related to different forms of load carriage. There have been a number of
explanations proposed for the greater economy of head-load carriage. Heglund et
al. (1995) and Cavagna et al (2002) have argued, based on an analysis of the five
participants in the original Maloiy et al (1986) study, that it is a consequence of
improved energy exchange between gravitational potential energy and kinetic
energy. Minetti et al. (2006), based on five experienced head-loaders carrying
loads uphill but with no direct measurement of unloaded walking, suggested that
balancing the loaded segment above the hip was an important mechanism. Abe et
al. (2004) and Abe et al. (2008) reported an energy saving phenomenon at some
load-speed interactions for back-loading and argued that this was a consequence
of the interaction between ‘rotative torque’ and the burden on the lower limbs. In
light of the data presented here it may be that such mechanisms are best examined
on a case by case basis, attempting to account for individual difference rather than
seeking general explanations. This may have implications for both military and
recreational applications as it is likely to be the case that either the optimum load
carriage system may be specific to an individual or that particular carrying
methods require different techniques. Clearly individualisation of load carriage
strategies may be impossible for most applications, although in some particularly
sensitive cases it may be worthwhile. Nevertheless, an understanding of the
factors that lead to improved economy in particular individuals, rather than pooled
results, may well provide a useful way forward in the design and customisation of
load carriage systems.
22
5. Conclusion
The data presented here suggest that the ‘free ride hypothesis’ for head-loading is
not a generalisable finding. The proportional increases in energy consumption
are generally greater than the proportional increases in external load for both
African and British women, regardless of head-loading experience. There was,
however, some evidence of an energy saving effect when light loads were carried
on the back at low speeds, further work is required to establish the mechanisms
responsible for such a phenomenon. The data also revealed significant variation
in load carrying economy, regardless of method, suggesting that there may not be
a single set of factors determining load carriage economy but rather that different
factors may align in individuals to influence economy. Further work is required to
establish the nature of these factors and how they interact in individuals. Such
information may well be useful when minimizing the energetic cost of load
carriage is particularly important.
Acknowledgements.
This work was funded by:
The Carnegie Trust for Higher Education in Scotland
The School of Social and Health Sciences, University of Abertay Dundee
The Department of Sport Management, Cape Peninsula University of Technology
23
References
Abe, D., Muraki, S. and Yasukouchi, A. (2008) Ergonomic effects of load carriage on energy cost
of gradient walking. Applied Ergonomics 35: 329-335
Abe, D., Yanagawa, K. and Niihata, S. (2004). Effect of load carriage, load position, and walking
speed on energy cost of walking. Applied Ergonomics 35: 329-335
Al-Khabbaz YS, Shimada T, Hasegawa M. (2008). The effect of backpack heaviness on trunk-
lower extremity muscle activities and trunk posture. Gait Posture. 28(2):297-302.
Bastien, GJ. Willems, PA, Schepens, B. and Heglund NC. (2005a) Effect of load and speed on the
energetic cost of human walking. European Journal of Applied Physiology 94: 76-83
Bastien, GJ, Schepens, P, Willems, PA and Heglund NC. (2005b) Energetics of load carrying in
Nepalese porters. Science 308: 1755
Birrell SA and Hooper RH (2007). Initial subjective load carriage injury data collected with
interviews and questionnaires. Military Medicine. 172(3):306-11.
Birrell, SA, Hooper, RH and Haslam, RA. (2007) The effect of military load carriage on ground
reaction forces. Gait and Posture, 26: 611-614
Bobet J and Norman RW (1984). Effects of load placement on back muscle activity in load
carriage. European Journal of Applied Physiology and Occupational Physiology. 53(1):71-5.
Cavagna, G.A., P. A. Willems, P.A,. Legramandi M. A and Heglund N. C. (2002) Pendular energy
transduction within the step in human walking Journal of Experimental Biology 205: 3413-3422
Charteris, J., Nottrodt, J.W. and Scott, P.A. (1989a) The ‘free ride’ hypothesis: a second look at
the efficiency of African women headload carriers. South African Journal of Science 85:68-71
Charteris, J., Scott, P.A. and Nottrodt, J.W. (1989b) Metabolic and kinematic responses of African
women headload carriers under controlled conditions of load and speed. Ergonomics 32:1539-
1550
Chow, HK, Kwok, M, Au-Yanf, A, Holmes, A, Cheng, J, Yao, F and Wong, MS. The effect of
backpack load on the gait of normal adolescent girls. Ergonomics 6: 642-656
Datta, S.R. and Ramanathan, N.L. (1971) “Ergonomic comparison of seven modes of carrying
loads on the horizontal plane.” Ergonomics 14(2):269-278
Datta SR, Chatterjee BB, Roy BN (1973). The relationship between energy expenditure and pulse
rates with body weight and the load carried during load carrying on the level. Ergonomics.
16(4):507-13.
Heglund, N.C., Willems, P.A., Penta, M. and Cavagna, G.A. (1995) Energy saving gait mechanics
with head-supported loads. Nature 375: 52-54
Holewijn M (1990). Physiological strain due to load carrying. European Journal of Applied
Physiology and Occupational Physiology. 61(3-4):237-45
Jones, C.D.R., Jarjou, M.S., Whitbread, R.G. and Jequier, E. (1987) Fatness and the energy cost of
carrying loads in African women The Lancet 12: 1331-1332
Kirk J and Schneider DA (1992). Physiological and perceptual responses to load-carrying in
female subjects using internal and external frame backpacks. Ergonomics. 35(4):445-55.

24
LaFiandra, M, Wagenaar, RC, Holt, KG and Obusek, JP (2003). How do load carriage and
walking speed influence trunk coordination and stride parameters? Journal of Biomechanics 36:
87-95
Legg, S.J. and Mahanty, A. (1985) Comparison of five modes of carrying a load close to the trunk.
Ergonomics 28: 1653-1660
Li, J.X., Hong, Y. and Robinson, P.D. (2003) The effect of load carriage on movement kinematics
and respiratory parameters in children during walking. European Journal of Applied Physiology
and Occupational Physiology. 90: 35-43
Lloyd, R. and Cooke C.B. (2000a) "The oxygen consumption associated with unloaded walking
and load carriage using two different backpack designs." European Journal of Applied Physiology
and Occupational Physiology. 81 (6) pp 486-492
Lloyd, R. and Cooke, C.B. (2000b) Relationships between physiological and postural adjustments
to load carriage for rucksack designs. Journal of Sports Science 18: 25-26
Lyons, J., Allsopp, A. and Bilzon, J. (2005) Influences of body composition upon the relative
metabolic and cardiovascular demands of load carriage. Occupational Medicine 55: 380-384
Mackie, HW and Legg, SJ (2008). Postural and subjective responses to realistic schoolbag
carriage. Ergonomics 51(2) 217-231
Maloiy, G.M., Heglund, N.C., Prager, L.M., Cavagna, G.A. and Taylor, C.R. (1986) Energetic
costs of carrying loads: have African women discovered an economic way? Nature 319 668-669
Malville, N.J., Burns, W.C., LimHa and Basnyat, R. (2001) Commercial porters of Eastern Nepal:
health status, physical work capacity and energy expenditure. American Journal of Human
Biology 13: 44-56
Minetti, A.E., Formenti, F. and Ardigo, L.P. (2006) Himalayan porter’s specialization: metabolic
power, economy, efficiency and skill. Proceedings of the Royal Society B. 273: 2791-2797
Myles WS and Saunders PL (1979). The physiological cost of carrying light and heavy loads.
European Journal of Applied Physiology and Occupational Physiology. 42(2):125-31
Nag PK, Sen RN, and Ray US (1979). Cardio-respiratory performance of porters carrying loads on
a treadmill. Ergonomics. 22(8):897-907
Quesada PM, Mengelkoch LJ, Hale RC, Simon SR (2000). Biomechanical and metabolic effects
of varying backpack loading on simulated marching. Ergonomics. 43(3):293-309
Rorke, S.L. (1990) Selected factors influencing the “optimum” backpack load for hiking. South
African Journal of Research in Sport Physical Education and Recreation 13: 31-45
Sharpe, SR, Holt, KG, Saltzman, E, and Wagenaar, RC (2008). Effects of hip belt on transverse
plane trunk coordination and stability during load carriage. Journal of Biomechanics 41: 968-976
Soule, R.G. and Goldman, R.F. (1969) Energy costs of loads carried on the head, hands or feet.
Journal of Applied Physiology 27 687-690
Stuempfle, KJ, Drury, DG and Wilson, AL. (2004). Effect of load position on physiological and
pereceptual responses during load carriage with an internal frame backpack. Ergonomics 47(7):
784-789
Taylor, C.R., Heglund, N.C., McMahon, T.A. and Looney, T.R. (1980) Energetic cost of
generating muscular force during running. Journal of Experimental Biology 86 9-18