comparison of point intercept and image analysis for .... cagney et...comparison of point intercept...
TRANSCRIPT

Comparison of Point Intercept and Image Analysis for Monitoring Rangeland TransectsJ. Cagney,1 S. E. Cox,2 and D. T. Booth3
Authors are 1Northwest Colorado District Manager, US Dept of the Interior, Bureau of Land Management, Grand Junction, CO 81506, USA; 2BiologicalScience Technician, US Dept of Agriculture, Agricultural Research Service, Otis Floyd Nursery Research Center, McMinnville, TN 38581, USA; and3Rangeland Scientist, US Dept of Agriculture, Agricultural Research Service, High Plains Grasslands Research Station, 8408 Hildreth Rd, Cheyenne,
WY 82009, USA.
Abstract
There is global recognition that sustainable land use requires monitoring that will detect change on a scale that protects theresource. That fundamental necessity is threatened where labor-intensive methods and high labor costs cause samplingdeficiencies and increased Type-II error rates (false negatives). Ground-based imaging is a monitoring method that reducesmonitoring labor costs. Nadir (vertical) images acquired with common digital cameras can be manually analyzed for cover usingfree software. We used an innovative field protocol to acquire standardized, freehand, nadir images (samples) of rangeland, thencompared point intercept (PI) and image-analysis techniques. Between methods, precision (repeatability) across users wasequivalent; cover measurements were often different, and the image-analysis technique took only a third as long to complete.Image analysis has several advantages over PI besides the reduced labor cost: Images are permanent resource records availablefor reanalysis if data are questioned, if software improves, or if management objectives change; and image analysis is less biasedby moving vegetation, moving pointing devices, and bright vegetation color.
Resumen
Existe el reconocimiento mundial que la utilizacion sostenible del suelo requiere una supervision que pueda detectar el cambioen una escala que proteja el recurso. La necesidad principal esta en peligro cuando los metodos de labor intensivos y los altoscostos de trabajo causan deficiencias en el muestreo y se incrementa la posibilidad de cometer el error Tipo-II (negativo falso).La proyeccion de imagenes terrestres es un metodo de supervision que reduce los costos de la supervision del trabajo. Lasimagenes verticales adquiridas con camaras digitales comunes pueden analizar la cobertura manualmente utilizando programasgratuitos. El estudio siguio un protocolo original de campo para adquirir las imagenes (muestras) del pastizal y despues secompararon a un punto de intercepto (PI) y a las tecnica de analisis de las imagenes. Entre los metodos, la precision (capacidadde repeticion) a traves de los usuarios fue equivalente, las medidas de cobertura fueron diferentes, y la tecnica del analisis de laimagen se llevo solamente un tercio del tiempo para realizarse. El analisis de las imagenes tiene varias ventajas sobre el PIademas de la reduccion el costo de mano de obra, las imagenes son expedientes permanentes del recurso disponibles para ser re-analizadas si los datos se cuestionan, y si los programas se mejoran. Asimismo, son una ventaja si los objetivos de manejocambian, y el analisis de las imagenes tiene menos sesgos por el movimiento de la vegetacion, movimiento de los dispositivos desenalamiento y el color brillante de la vegetacion.
Key Words: cover measurement, land management, SamplePoint, Type-II error risk, vegetation sampling
INTRODUCTION
Natural resource monitoring is a vital aspect of sustainableresource management in all parts of the world (Levy andMadden 1933; Wilson 1963; Walker 1970; Glatzle et al. 1993;Stohlgren et al. 1998; Grabherr et al. 2000; Diaz et al. 2001).The specific goals for monitoring programs around the globemay differ, but generally they seek ‘‘…to provide the basis forconsistent, uniform, and standard vegetation attribute sampling
that is economical, repeatable, statistically reliable, andtechnically adequate’’ (ITT 1996). Many programs use thepoint-intercept (PI) method when measuring ground cover toassess erosion risk or other key ecological parameters. PIpopularity results from its speed relative to plot charting(Heady et al. 1959), simplicity, and repeatability (ITT 1996).Though faster than charting, it is a labor-intensive method. Incountries where labor costs are high, the continued use of PI forlandscape-scale assessments is impractical (West 1999)—contributing to inadequate sampling, high Type-II error risk,and large data variance when data are collected by differentpeople in different years (Vittoz and Guisan 2007) or throughperiods of phenological change. Less expensive, more reliabledata-collection methods are needed. Half a century ago, Schultzet al. (1961) wrote that it would be ‘‘presumptuous to thinkthat all conceivable break-throughs in sampling methodologyhave now been made.’’ It follows that researchers shouldalways seek to improve sampling method accuracy, precision,and economy (see also Stohlgren et al. 1998). Numerous
Research was funded by the US Dept of the Interior, Bureau of Land Management, and US Dept
of Agriculture, Agricultural Research Service.
Mention of proprietary products does not constitute a guarantee or warranty of products by USDI,
USDA, or the authors, and does not imply approval to the exclusion of other suitable products.
At the time of research, Cagney was Field Office Manager, US Dept of the Interior, Bureau of Land
Management, Lander Field Office, Lander, WY 82520, USA; and Cox was Agricultural Science
Technician, US Dept of Agriculture, Agricultural Research Service, High Plains Grasslands
Research Station, 8408 Hildreth Rd, Cheyenne, WY 82009, USA.
Correspondence: Jim Cagney, USDI-BLM, Grand Junction, CO 81506, USA. Email: jcagney@
blm.gov
Rangeland Ecol Manage 64:309–315 | May 2011 | DOI: 10.2111/REM-D-10-00090.1
RANGELAND ECOLOGY & MANAGEMENT 64(3) May 2011 309

authors have reported the utility of image analysis forvegetation cover measurements (a partial list might includeCooper 1924; Pierce and Eddleman 1973; Harris et al. 1996;Bennet et al. 2000; Louhaichi et al. 2001). Benefits of imageanalysis include 1) a permanent record of rangeland condition,2) fast field-season acquisition with later analysis, and 3) abilityto reanalyze with new techniques or if cover data arequestioned. Booth et al. (2006a) reported that ground covermodeled on flat population posters was measured more quicklywith the use of SamplePoint (SP) software than with PI, butmethod-time requirements had not been field tested. Despite itsadvantages, image analysis remains underutilized. Some haveobjected to carrying a camera stand or tripod in the field. Here,we tested an innovative, freehand protocol for obtaining nadir(vertical) images of the ground in a rangeland-monitoring casestudy that compared PI and SP methods for cover-measurementagreement, precision, and time. We also examined usercovariables affecting the data.
METHODS
Site DescriptionThe study site was in the Red Desert southwest of Rawlins,Wyoming, USA, at lat 41u439300N, long 107u269400W, on aSandy High Plains Southeast ecological site characterized bydeep, fine sandy loam and a big sagebrush/shortgrass plantcommunity (Natural Resources Conservation Service 2009).Annual precipitation is 180–290 mm.
Monitoring MethodsA 100-m tape was run between permanent posts to mark atransect used for both PI and SP data collection. All fieldworkwas conducted between 9 and 12 June 2008. Fourteen usersgenerated PI and SP data from the same transect.
Point Intercept (PI). Wire survey flags (pointers) with 1.6 mmwire diameter were lowered vertically next to a 100-m tape at20-cm intervals (500 points) following the method reviewed byHerrick et al. (2005). Multiple canopy hits were recorded toground level and to the following groups: cool-seasonbunchgrass, rhizomatous, and bluegrass (Poa L.), uplandgrass-like, broadleaf forb, cushion forb, annual forb, cactus,shrubs by species, alyssum (Alyssum desertorum Stapf),cheatgrass (Bromus tectorum L.), lichen (XanthoparmeliaHale), rock, bare ground, and unknowns (Natural ResourcesConservation Service [NRCS-ESD] 2009). The 14 usersrecorded PI data on paper forms. Seven transect readings weremade by observer/recorder pairs, and seven were read andrecorded by the same observer. For time accounting, where twopeople collaborated on reading, time-on-transect was doubled.Only aerial (first hit) cover was obtained from images;therefore, we used only PI first hits for comparing methods.
Image Collection. Fourteen users collected their own 20 nadirimages (samples) at 5-m intervals along each transect with theuse of a digital camera (Olympus E510, Olympus E330,Olympus SP-560UZ or Kodak P880; see Booth et al. 2005a).Resulting image resolution was camera-dependent, rangingfrom 0.23 to 0.26 mm ground-sample distance (GSD), the
length of coverage for a single pixel. Users stood north oftransects and photographed the south side to avoid shadows.Cameras were held at chest height, so the 100-m tape spannedthe bottom of the LCD real-time display (Fig. 1A). All camerashad a 4:3 aspect ratio. For constant scale among users withoutthe need for a tripod or stand, two white 2 3 3 3 20-cmmarkers were placed 82 cm apart, the first marker placed at the5-m interval and the second 82 cm further (i.e., at 25 and25.82 m; Fig. 1A). Users adjusted the lens until the tape, andthe markers placed perpendicular to it, were just visible beforeacquiring the image. This created a 0.5-m2 (82 3 61.5-cm) fieldof view (Fig. 1B). By adjusting the field of view to fit the
Figure 1. A, Technician acquiring nadir digital image along a stretchedtransect tape for later analysis with SamplePoint (SP). Good images willbe nadir, shadow-free, in good focus, and taken when plant phenologyallows easiest plant type or species detection. The use of two shortsticks laid perpendicular along the tape at 82-cm intervals allows usersof different heights to capture equal-sized fields of view without acamera stand by using the sticks to frame the scene. The inlay shows thecommon mistake of ‘‘short-arming’’ the shot and taking the image off-nadir. B, Screenshot of a project image being analyzed in SP. Note thatthe classification area is a single pixel in the image, and is the centerpixel of a nine-pixel array outlined by the crosshair. When the point inquestion is magnified 323, the pixel is unquestionably representingrabbitbrush.
310 Rangeland Ecology & Management
markers, constant camera height above ground level, andconstant lens focal length, were not required. Most observersrecorded images as RAW format (Olympus Imaging Corpora-tion 2007), and later converted to Tagged Image File Format(TIFF) for image analysis. However two observers took theinitial images in TIFF and made no subsequent conversions.
SamplePoint (SP). SamplePoint software facilitates manual,pixel-based, image analysis from nadir digital images of anyscale, and automatically records data to a spreadsheet (Booth etal. 2006a; SamplePoint 2009; Fig. 1B). Fourteen SP usersmeasured cover from images at 25 points/image to yield500 points/transect with the use of the same cover classes asused for the 500 PI points/transect. All users recorded PIcollection times; times for image collection, PI, and SP analysistimes were recorded only by the three authors.
AnalysisMethod cover-measurement means were compared for dis-agreement with the use of paired t tests with Bonferonni’s alphacorrection for family-wise comparison. Because neither methodis known to be more accurate, method agreement was assessedfor each cover category by calculating limits of agreement(LOA; Bland and Altman 1986). A repeatability coefficient(RC), defined as 2 standard deviations (SD) of pairs ofobservation differences by method (Bland and Altman 1986)was computed with the use of Proc Mixed in SAS v7 (SASInstitute, Nashville, TN) with syntax based on Carstensen et al.(2008) for exchangeable replicates where y 5 cover measure-ment, item 5 class (grass, forb, shrub, litter, soil, rock),method 5 SP or PI, replicate 5 users 1–14. This model ran-domly paired the 14 users within each class to achieve the pairsof observations required for the RC calculation.
User-age bias was examined by regressing measurementswith user age for both PI and SP and incorporatingBonferonni’s alpha correction, and by t tests of measurementsfor user groups split at 40 and 50 yr of age. Images (20) fromthree users were converted to high-quality Joint PhotographicExperts Group (JPEG) format and analyzed the same as TIFFimages to test the hypothesis of no difference in measurementdue to format. As a control, data partially published in Booth etal. (2006a) on SamplePoint repeatability were used to createLOA for repeat analysis of 20 TIFF images, acquired in asimilar way as above, by three users.
RESULTS
Image AcquisitionThere were no significant problems encountered with the use ofthe freehand method. The most common errors were holdingthe camera too close to the chest so that the image was oblique,failing to set shutter speed appropriately to eliminate handshake or compensate for wind, or not checking the bottom ofthe LCD display. The latter resulted in capturing area below thetape, including the photographer’s shoes. These problems areresolved with practice.
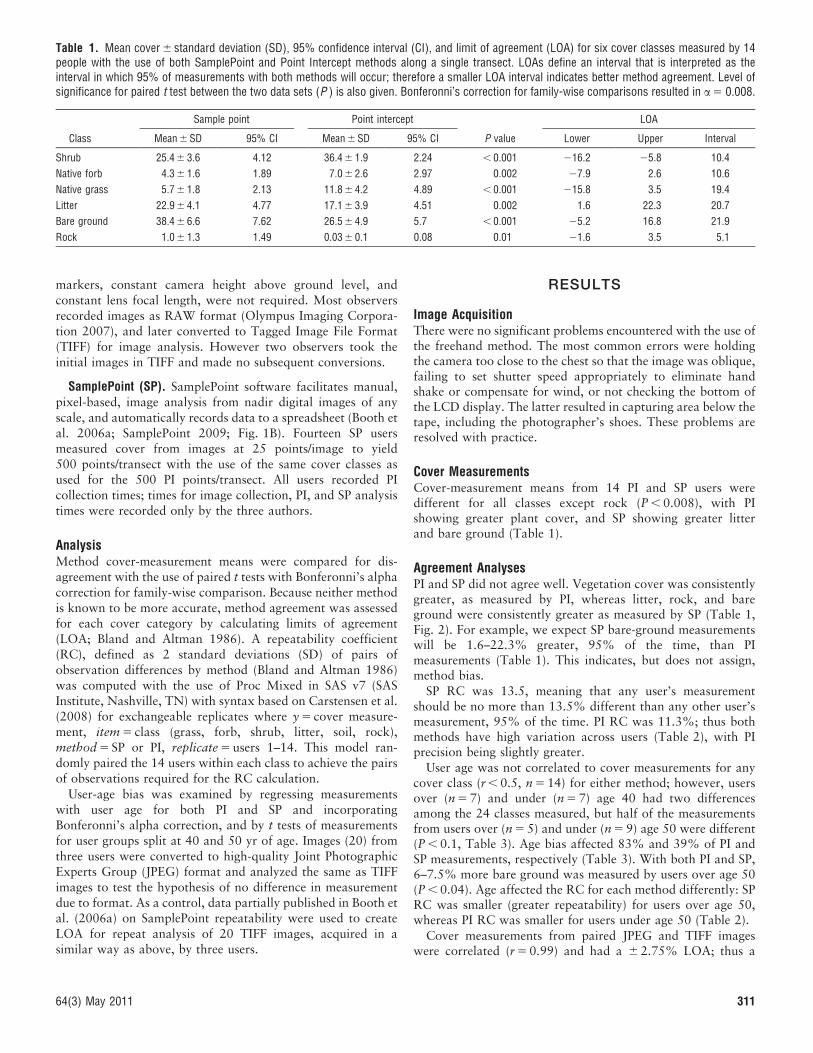
Cover MeasurementsCover-measurement means from 14 PI and SP users weredifferent for all classes except rock (P , 0.008), with PIshowing greater plant cover, and SP showing greater litterand bare ground (Table 1).
Agreement AnalysesPI and SP did not agree well. Vegetation cover was consistentlygreater, as measured by PI, whereas litter, rock, and bareground were consistently greater as measured by SP (Table 1,Fig. 2). For example, we expect SP bare-ground measurementswill be 1.6–22.3% greater, 95% of the time, than PImeasurements (Table 1). This indicates, but does not assign,method bias.
SP RC was 13.5, meaning that any user’s measurementshould be no more than 13.5% different than any other user’smeasurement, 95% of the time. PI RC was 11.3%; thus bothmethods have high variation across users (Table 2), with PIprecision being slightly greater.
User age was not correlated to cover measurements for anycover class (r , 0.5, n 5 14) for either method; however, usersover (n 5 7) and under (n 5 7) age 40 had two differencesamong the 24 classes measured, but half of the measurementsfrom users over (n 5 5) and under (n 5 9) age 50 were different(P , 0.1, Table 3). Age bias affected 83% and 39% of PI andSP measurements, respectively (Table 3). With both PI and SP,6–7.5% more bare ground was measured by users over age 50(P , 0.04). Age affected the RC for each method differently: SPRC was smaller (greater repeatability) for users over age 50,whereas PI RC was smaller for users under age 50 (Table 2).
Cover measurements from paired JPEG and TIFF imageswere correlated (r 5 0.99) and had a 6 2.75% LOA; thus a
Table 1. Mean cover 6 standard deviation (SD), 95% confidence interval (CI), and limit of agreement (LOA) for six cover classes measured by 14people with the use of both SamplePoint and Point Intercept methods along a single transect. LOAs define an interval that is interpreted as theinterval in which 95% of measurements with both methods will occur; therefore a smaller LOA interval indicates better method agreement. Level ofsignificance for paired t test between the two data sets (P ) is also given. Bonferonni’s correction for family-wise comparisons resulted in a5 0.008.
Class
Sample point Point intercept
P value
LOA
Mean 6 SD 95% CI Mean 6 SD 95% CI Lower Upper Interval
Shrub 25.4 6 3.6 4.12 36.4 6 1.9 2.24 , 0.001 216.2 25.8 10.4
Native forb 4.3 6 1.6 1.89 7.0 6 2.6 2.97 0.002 27.9 2.6 10.6
Native grass 5.7 6 1.8 2.13 11.8 6 4.2 4.89 , 0.001 215.8 3.5 19.4
Litter 22.9 6 4.1 4.77 17.1 6 3.9 4.51 0.002 1.6 22.3 20.7
Bare ground 38.4 6 6.6 7.62 26.5 6 4.9 5.7 , 0.001 25.2 16.8 21.9
Rock 1.0 6 1.3 1.49 0.03 6 0.1 0.08 0.01 21.6 3.5 5.1
64(3) May 2011 311

measurement from a JPEG-format image is expected to bewithin 2.75% of the measurement from the same scene in TIFFformat, 95% of the time. Repeat SP measurements of TIFFimages (data from Booth et al. 2006a) were also correlated(r 5 0.995) with a 6 3.10% LOA, meaning that any measure-ment made by User A on day 1 is expected to be within 3.10%of measurements made by User A on any other day.
Time RequirementsPI time included reading and transcribing paper data tospreadsheet. SP time included photo acquisition, download,analysis, and summary. PI transects were completed, onaverage, by single users and duos in 167 min (n 5 5; two usersdidn’t record time) and 99 min (n 5 7) or 198 person-min,respectively. For all users, PI data transcription from paper tospreadsheet (separate from transect reading time), took anaverage of 110 min. Image acquisition took 20 min (n 5 3).Downloading images and converting from RAW to TIFFrequired approximately 35 min, but these are automated
processes that do not take user attention for the full 35 min.SP image classification averaged 62 min/transect with a fewadditional minutes for statistics generation within the software.Average time from start of transect to data in a spreadsheet was296 min for PI and 108 min for SP (n 5 3).
DISCUSSION
Cover MeasurementsSmaller point sampling device contact areas increase accuracy(Wilson 1963, Cook and Stubendieck 1986, Booth et al.2006c); but, because contact area is never zero, PI tends toovervalue standing cover (Cook and Stubendieck 1986). In thisstudy, PI pointer-tip area was 2.01 mm2. Our finding that PIusers recorded greater plant cover, and SP users recordedgreater litter, rock, and bare ground (Table 1), is similar togreater plant-cover PI measurements obtained in methodcomparisons by Brakenhielm and Qinghong (1994), Korb et
Figure 2. Bland–Altman plots of the difference between SamplePoint (SP) and Point Intercept (PI) method cover measurements (SP 2 PI; y axis)against the measurement average of the two methods (x axis) for 14 users. The dashed line shows the mean measurement difference betweenmethods, while the dotted lines show the upper and lower limits of agreement (6 2 SD of the difference mean). Perfect agreement between themethods would be shown by all data points aligned along the dashed line. Difference means above zero indicate higher SP measurements. Vegetation(left plots) was almost always measured higher with PI, whereas litter, rock, and bare ground (right plots) were almost always measured higherwith SP.
312 Rangeland Ecology & Management

al. (2003), Laliberte et al. (2007), Symstad et al. (2008), and isin agreement with an earlier report (Booth et al. 2005a). SP alsohas a contact area (one pixel) greater than zero, but onedependent on camera resolution: a 10-megapixel camera usedin this study had a sample area of 0.05 mm2, which is 40 timessmaller than the contact point used for the PI method; a 21-megapixel camera (Canon USA, Lake Success, NY) would havea sample area of 0.01 mm2, 201 times smaller than the PIpointer-tip area. As camera resolution continues to improve,the SP method comes ever closer to the ideal zero-area contactpoint. Herrick et al. (2006) reviewed evidence that PI is moreprecise (repeatable) than plot-based methods, but they andStohlgren et al. (1998) found transect methods inadequate forearly detection of invasive and rare species. Wind makes PI usemore difficult (ITT 1996), often forcing users to makejudgments about pinpoint contact. Booth et al. (2006c)described bright color bias in classification, a bias surelyexacerbated by judgments made in high wind. SP classificationpoints, however, are fixed, as are the plants in the images (evenin wind, sufficient shutter speed can ‘‘freeze’’ plants in motion);therefore, color and other biases are less of a factor.
PI and SP showed equivalent 98% accuracy when tested on a2D simplified vegetation-population poster, but this studysuggests a difference when the methods are applied to 3D, real-world vegetation (Booth et al. 2006c); for example, PI bareground averaged 12% less than SP bare ground (Table 1). SPalways uses a 2D image for classification; thus there is noreason to suspect a change in accuracy from that reported byBooth et al. (2006c). Though bare ground is more or less 2D ina PI analysis, the context is 3D, usually green, vegetation. Abright-color-user bias has been reported (Booth et al. 2006a,2006c) and likely leads users to undercount bare ground. Weconclude that SP, even though it is a plot method, is moreaccurate in a 3D world; but we concede there is no acceptedstandard for establishing real-world cover (Limb et al. 2007).Yet, given the findings of this study and those reviewed byCook and Stubbendieck (1986), one may logically questionwhether PI-measured bare ground is being chronically under-reported.
We report pixel coverage as a single number (0.05 mm2), butthis value is only exact in the center of the image, whereasactual coverage increases linearly in all directions from centerat a rate dictated by lens barrel distortion, an artifact of thecurved lens. Normal-angle lenses exhibit greater barreldistortion than telephoto lenses, but in this study, the effect ismoderated by 1) a normal focal length of , 42u and, 2)relatively short vegetation. Cover is a relative measurementunchanged by barrel distortion except where the vegetationheight variation is significant relative to the camera heightabove ground (see Booth et al. 2006b for detailed discussion ofbarrel distortion in image analysis). We don’t regard the effect
of barrel distortion as significant in this study, and note that ifpresent, such an effect would result in greater vegetation coverfrom SP, which was not the case. Nevertheless, users should beaware that longer focal-length lenses reduce barrel distortionand are thus preferred, and in tall vegetation the use of a framethat can elevate a camera to 2 m above the ground will reducethe distortion effect (Booth 2005a, 2005b).
SP cannot measure cover for subcanopy. However, obtainingthis level of detail via PI is very expensive relative to datautility. Many land managers use only first-hit PI data and aquadrat-based measure of species diversity. Image analysis candeliver foliar cover (or herbaceous basal cover if imaging occursbefore canopy development), bare ground, a permanentphotographic record of species composition, and greatersample numbers over a much larger sampling area than PI—and in about a third of the time. Fiscal prudency dictatescollection only of data that will be used. Multicanopy PI datahave value, but if it is not utilized effectively—includingstatistically adequate sampling—why allocate resources tocollect it?
Agreement AnalysesIt is tempting to compare new methods to a traditional‘‘standard’’ method and judge suitability on agreement withthe standard. But if the standard method has high variance,such as PI (RC 5 11.3%), it would be surprising if the twomethods did agree. Method repeatability limits the amount ofagreement possible (Bland and Altman, 1986). Reluctance toembrace new methods often stems from a desire to maintain‘‘data continuity,’’ but if repeatability is low, does datacontinuity exist?
Our agreement analyses (Fig. 2) are evidence of biases andother factors reducing PI accuracy in a 3D world. The CIs andRCs for both methods likely result from differences in eitherspecies identification or user-perceived ground rules for coverclassification. For example, User A may consider any deadplant material to be litter, whereas User B may considerattached, standing dead to be the plant to which it is stillattached. Thus, litter cover can change drastically from year toyear because of classification, not biology. Traditionally,temporal PI data established trend, and most often wascollected by different people using their personal understandingof ground rules. Consider the potential error inherent in thisprotocol when it is known that PI cover measurements can vary
Table 2. Repeatability coefficients (RC) for SamplePoint (SP) and PointIntercept (PI) for all users, users under age 50, and users over age 50. Alower RC indicates higher method precision.
Age SP PI n
All users 13.5 11.3 168
Under age 50 14.2 6.2 108
Over age 50 5 10.8 60
Table 3. Levels of significance (P values) for t tests of cover measuredby users over (n 5 5) and under (n 5 9) age 50 for both SamplePoint(SP) and Point Intercept (PI) methods. The measurement differencerelative to the , 50 age group is shown (D).
Class
SP PI
P D P D
Shrub 0.08 23.5 0.07 21.9
Native forb 0.01 22.1 0.02 23.1
Native grass 0.22 ns 0.01 25.5
Litter 0.48 ns 0.02 4.7
Bare ground 0.03 7.5 0.03 5.9
Rock 0.41 ns 0.29 ns1ns indicates not significant.
64(3) May 2011 313

6 11.3% between users, even when those users have beenbriefed on the classification ground rules. If temporal PI datafrom different users are compared, any differences must besuspected of existing, at least in part and possibly in whole,because of low repeatability. Perceptive range managers fearthis situation to the extent that they are often unwilling to relyon field data when faced with controversial decisions such asstocking rate changes. That fear can keep trend-monitoringdata from being used, and optimum decision making iscorrespondingly affected. Such ground-rule problems can beeliminated by a single user classifying multiyear image sets atonce, as is possible with SP.
SP does not correct for user bias, and in this study hadcomparable precision (RC 5 13.5%); but it does work off of apermanent image record that can be reanalyzed at any time. Iftransect images taken 10 yr ago and 1 yr ago are available, theycan be analyzed by a single user to eliminate user bias.Temporal differences seen in this latter analysis are much morelikely to be due to biology. Thus, data verifiability and thecapability to significantly increase sampling, are key advantag-es of image-based monitoring.
Users over 50 yr old consistently measured more bare groundwith SP, and even more with PI. The SP finding affirms the agebias first reported by Booth et al. (2005b). This is the firstreport that age bias influences PI data.
Because the LOA between low-compression JPEG and TIFFimage analysis was 2.75%, and the LOA between replicationsof TIFF images was 3.10%, we conclude that there is noadvantage to using TIFF images with SP because the dataindicate user inconsistency accounts for all of the observeddifference. High-compression JPEG images might yield differ-ent results, and TIFF imagery is likely still the best choice forautomated analysis.
Time RequirementsBecause the largest cost of monitoring is transportation(Stohlgren et al. 1998), gathering more data per field tripreduces cost. Image acquisition in this study took only 1/8 thetime of PI data collection (20 min vs. 167 min), suggestingabout eight times more image data can be acquired per tripwith SP. Additionally, time from transect to data spreadsheet isfaster with SP. For equivalent time, not counting travel-timesavings, almost three times more data can be generated with SPrelative to PI (108 min vs. 296 min/transect for full analysis).The difference is reduced if 1) only PI first hits are recorded and2) digital devices are used for field data collection, eliminatingthe need for paper-to-spreadsheet transcription, though thisoption is often not practical because of required additionalsoftware, expense, training, and rapid device obsolescence.Rangeland professionals and ranchers have identified lack oftime as the principle obstacle to monitoring (Fernandez-Gimenez et al. 2005), emphasizing the benefit of time-efficientmethods.
Error Risk (Types I and II)A primary responsibility of professional rangeland managers,particularly those in the public sector where sustainabilitymonitoring is required by nine national environmental lawspassed between 1969 and 1988, is to test for change in plant
communities to assess the effects of weather and managementon resource condition and trend. The null hypothesis (H0) inthese tests is that of no ecologically important change overtime. The risk of Type-I error—a false positive—(rejecting H0
when it should be accepted) is controlled by using theappropriate probability level (usually P 5 0.05 in resourcemanagement). Type-II error—a false negative—is accepting H0
when it should be rejected; that is, in concluding there is nochange when ecologically important change has, in fact,occurred. Type-II error is controlled by sample numbers anddistribution. If these are inadequate to represent the resourceand its variations, then the false-negative risk of Type-II errorincreases. This is the usual case in rangeland management forthe reasons noted in the Introduction. Use of PI and otherconventional, time-intensive sampling methods worsen thetendency toward undersampling and sampling through periodsof phenological incomparability, thereby increasing the Type-IIerror/false-negative risk. Conversely, the greater sampling ratepossible with image-based monitoring makes false-negative riskreduction more practical.
IMPLICATIONS
This study demonstrated 1) the utility of freehand nadir-imageacquisition, 2) that PI vegetation cover values were consis-tently greater than comparable SP values (when consideredwith the reviewed literature, this is a finding that implies bareground is often undervalued in PI-based assessments), 3) thatPI repeatability is slightly better, but comparable to that of SP,4) that user age affects PI data to a greater extent than SP data,5) that low-compression JPEG and TIFF images give equiva-lent results, and 6) that SP is more time efficient than PI.Though our results are from one area, the important factors ofthe study are not unique to any one ecological site, and wepredict our enumerated findings are applicable everywhere.Freehand nadir image acquisition is a viable alternative tousing a camera stand for general field monitoring. The utilityand time savings of ground imaging and analysis methods arean opportunity for monitoring entities to increase sampling,reduce their Type-II error risk, and increase data comparabilityby obtaining same-phenology samples and same-persontemporal analyses. Because the ability for a single user toaccess the permanent photographic record and to essentially‘‘go back in time’’ and monitor rangeland plots from years pastis so significant, and the method by which this is accomplishedis both quicker and gives approximately equal precision acrossusers relative to PI, we recommend that land managers adoptnadir plot image collection and digital analysis. Managersshould be aware that accumulating evidence indicates that theage of the observer will affect the data, with older observerstending to identify more bare ground. Potential PI under-valuing of bare ground could serve to further erode the utilityof low-sample-density PI data. Sustainable resource usedepends on accurate measurements of key ecological indica-tors and on a full consideration of data legitimacy with regardto sampling method, timing, intensity, distribution, and biases;it requires recognizing the risk of, and guarding against, false-negative conclusions that could result in continued resourcedegradation.
314 Rangeland Ecology & Management

ACKNOWLEDGMENTS
We thank the users from the US Department of the Interior, Bureau of Land
Management; US Department of Agriculture (USDA), Natural ResourceConservation Service; and the University of Wyoming who assisted in data
collection: M. Astle, E. Bainter, L. Bindell, M. Calton, C. Fifield, M.
Gilbert, S. Karl, J. Likins, M. Murry, T. J. Murry, C. Newberry, C.
Newman, C. Otto, M. Scott, H. Shultz, M. Smith, C. Strom, M. Vasquez,and A. Warren. R. Allen, Bureau of Land Management, provided input on
statistical analysis. R. Limb, Department of Natural Resource Ecology and
Management, Oklahoma State University, C. Moffet, USDA, Agricultural
Research Service, N. Webb, Australia Commonwealth Science andResearch Organization, L. K. VanAmburg, US Forest Service, and
anonymous reviewers provided helpful manuscript reviews.
LITERATURE CITED
BENNET, L. T., T. S. JUDD, AND M. A. ADAMS. 2000. Close-range vertical photographyfor measuring cover changes in perennial grasslands. Journal of RangeManagement 53:675–678.
BLAND, J. M., AND D. G. ALTMAN. 1986. Statistical methods for assessing agreementbetween two methods of clinical measurement. Lancet i:307–310.
BOOTH, D. T., S. E. COX, AND R. D. BERRYMAN. 2006a. Point sampling digital imagerywith ‘‘SamplePoint.’’ Environmental Monitoring and Assessment 123:97–108.
BOOTH, D. T., S. E. COX, AND R. D. BERRYMAN. 2006b. Precision measurements fromvery-large scale aerial digital imagery. Environmental Monitoring andAssessment 112:293–307.
BOOTH, D. T., S. E. COX, C. FIFIELD, M. PHILLIPS, AND N. WILLIAMSON. 2005a. Imageanalysis compared with other methods for measuring ground cover. Arid LandResearch and Management 19:91–100.
BOOTH, D. T., S. E. COX, AND D. E. JOHNSON. 2005b. Detection-threshold calibrationand other factors influencing digital measurements of ground cover.Rangeland Ecology & Management 58:598–604.
BOOTH, D. T., S. E. COX, T. W. MEIKLE, AND C. FITZGERALD. 2006c. The accuracy of groundcover measurements. Rangeland Ecology & Management 59:179–188.
BRAKENHIELM, S., AND L. QINGHONG. 1994. Comparison of field methods in vegetationmonitoring. Water, Air and Soil Pollution 79:75–87.
CARSTENSEN, B., J. SIMPSON, AND L. C. GURRIN. 2008. Statistical models for assessingagreement in method comparison studies with replicate measurements.International Journal of Biostatistics 4(1):Article 16.
COOK, C. W., AND J. STUBENDIECK. 1986. Range research: basic problems andtechniques. Denver, CO, USA: Society for Range Management. 317 p.
COOPER, W. S. 1924. An apparatus for photographic recording of quadrats. Journalof Ecology 12:317–321.
DIAZ, S. A., I. NOY-MEIR, AND M. CABIDO. 2001. Can grazing response of herbaceousplants be predicted from simple vegetative traits? Journal of Applied Ecology38:497–508.
FERNANDEZ-GIMENEZ, M. E., G. RUYLE, AND S. J. MCCLARAN. 2005. An evaluation ofArizona Cooperative Extension’s rangeland monitoring program. RangelandEcology & Management 58:89–98.
GLATZLE, A., A. MECHEL, AND M. E. VAZ LOURENCO. 1993. Botanical components ofannual Mediterranean grassland as determined by point-intercept and clippingmethods. Journal of Range Management 46:271–274.
GRABHERR, G., M. GOTTFRIED, AND H. PAULI. 2000. GLORIA: A global observationresearch initiative in alpine environments. Mountain Research and Develop-ment 20(2):190–191.
HARRIS, N. R., S. H. SHARROW, AND D. E. JOHNSON. 1996. Use of low-level remotesensing to understand tree/forage spatial interactions in agroforests. GeocartoInternational 11(3):81–92.
HEADY, H. F., R. P. GIBBENS, AND R. W. POWELL. 1959. Comparison of charting, lineintercept, and line point methods of sampling shrub types of vegetation.Journal of Range Management 12:180–188.
HERRICK, J. E., J. W. VAN ZEE, K. M. HAVSTAD, L. M. BURKETT, AND W. G.WHITFORD. 2005. Monitoring manual for grassland, shrubland and savannaecosystems. Volume I: Quick start. Tucson, AZ, USA: The University ofArizona Press. 36 p.
HERRICK, J. E., G. E. SCHUMAN, AND A. RANGO. 2006. Monitoring ecological pro-cesses for restoration projects. Journal for Nature Conservation 14:161–171.
INTERAGENCY TECHNICAL TEAM (ITT). 1996. Sampling vegetation attributes, InteragencyTechnical Reference, Report BLM/RS/ST-96/002. Denver, CO, USA: US Deptof the Interior, Bureau of Land Management–National Applied ResourcesScience Center. 164 p.
KORB, J. E., W. W. COVINGTON, AND P. Z. FULE. 2003. Sampling techniques influenceunderstory plan trajectories after restoration: An example from ponderosapine restoration. Restoration Ecology 11:504–515.
LALIBERTE, A. S., A. RANGO, J. E. HERRICK, E. L. FREDRICKSON, AND L. BURKETT. 2007. Anobject-based image anlaysis approach for determining fractional cover ofsenescent and green vegetation with digital plot photography. Journal of AridEnvironments 69:1–14.
LEVY, E. B., AND E. A. MADDEN. 1933. The point method of pasture analysis. NewZealand Journal of Agriculture 46:267–269.
LIMB, R. F., K. R. HICKMAN, D. M. ENGLE, J. E. NORLAND, AND S. D. FUHLENDORF. 2007.Digital photography: reduced investigator variation in visual obstructionmeasurements for southern tallgrass prairie. Rangeland Ecology & Manage-ment 60:548–552.
LOUHAICHI, M., M. M. BORMAN, AND D. E. JOHNSON. 2001. Spatially located platformand aerial photography for documentation of grazing impacts on wheat.Geocarto International 16(1):63–68.
NATURAL RESOURCES CONSERVATION SERVICE. 2009. Ecological site descriptions.Available at: http://esis.sc.egov.usda.gov. Accessed 18 June 2009.
OLYMPUS IMAGING CORPORATION. 2007. E-510 digital camera instruction manual.Tokyo, Japan: Olympus Imaging Corp. 140 p.
PIERCE, W. R., AND L. E. EDDLEMAN. 1973. A test of stereophotographic sampling ingrasslands. Journal of Range Management 26:148–150.
SAMPLEPOINT. 2009. USDA Agricultural Research Service products and services. Availableat http://www.ars.usda.gov/services/software/download.htm?softwareid5246.Accessed 18 June 2009.
SCHULTZ, A. M., R. P. GIBBENS, AND L. DEBANO. 1961. Artificial populations forteaching and testing range techniques. Journal of Range Management14:236–242.
STOHLGREN, T. J., K. A. BULL, AND K. A. OTSUKI. 1998. Comparison of rangelandvegetation sampling techniques in the central grasslands. Journal of RangeManagement 51:164–172.
SYMSTAD, A. J., C. L. WIENK, AND A. D. THORSTENSON. 2008. Precision, repeatability,and efficiency of two canopy-cover estimate methods in northern Great Plainsvegetation. Rangeland Ecology & Management 61:419–429.
VITTOZ, P., AND A. GUISAN. 2007. How reliable is the monitoring of permanentvegetation plots? A test with multiple observers. Journal of Vegetation Science18:413–422.
WALKER, B. H. 1970. An evaluation of eight methods of botanical analysis ongrasslands in Rhodesia. Journal of Applied Ecology 7(3):403–416.
WILSON, J. W. 1963. Errors resulting from thickness of point quadrats. AustralianJournal of Botany 11:178–188.
WEST, N. E. 1999. Accounting for rangeland resources over entire landscapes. In:D. Eldridge and D. Freudenberger [EDS.]. Proceedings of the VI InternationalRangeland Congress; 19–23 July 1999; Aitkenvale, Queensland, Australia. p.726–736.
64(3) May 2011 315