comparison of predicted and observed flood flows in
TRANSCRIPT
University of New MexicoUNM Digital Repository
Water Resources Professional Project Reports Water Resources
12-12-2008
Comparison of Predicted and Observed FloodFlows in Pajarito Canyon Following the 2000Cerro Grande FireJake Meadows
Follow this and additional works at: https://digitalrepository.unm.edu/wr_sp
This Technical Report is brought to you for free and open access by the Water Resources at UNM Digital Repository. It has been accepted for inclusionin Water Resources Professional Project Reports by an authorized administrator of UNM Digital Repository. For more information, please [email protected].
Recommended CitationMeadows, Jake. "Comparison of Predicted and Observed Flood Flows in Pajarito Canyon Following the 2000 Cerro Grande Fire."(2008). https://digitalrepository.unm.edu/wr_sp/96

UNCLASSIFIED LA-UR 08-07183
Comparison of Predicted and Observed Flood Flows in Pajarito Canyon Following the
2000 Cerro Grande Fire
Jake Meadows
Committee
Dr. Bruce Thomson, P.E. (Committee Chair)
Dr. Julie Coonrod, P.E.
Steven Rae, P.E.
Dr. William Turney, P.E.
A Professional Project Submitted in Partial Fulfillment of the Requirements for the Degree of
Master of Water Resources
Water Resources Program
The University of New Mexico
Albuquerque, New Mexico
November 4, 2008

1
Committee Approval
The Master of Water Resources Professional Project Report of Jake Meadows, entitled “Comparison of Predicted and Observed Flood Flows in Pajarito Canyon Following the 2000 Cerro Grande Fire” is approved by the committee:
Bruce Thomson, Ph.D, P.E.
Chair Signature Date
Julie Coonrod, Ph.D, P.E.
Signature Date
Steven Rae, P.E.
Signature Date
William Turney, Ph.D, P.E.
Signature Date

2
Abstract
In May 2000, the Cerro Grande fire devastated lands in and around Los Alamos National
Laboratory (LANL) in northern New Mexico and dramatically increased stormwater runoff
from the impacted areas. The purpose of this paper is to demonstrate the recovery of burned
lands and the corresponding decrease in flood flows and floodplains over a 7-year period in
Pajarito Canyon near Los Alamos. A secondary purpose was to evaluate the applicability of
the U.S. Army Corps of Engineers hydrologic modeling tool, Hydrologic Engineering
Center–Hydrologic Modeling System (HEC-HMS) in Pajarito Canyon by comparing
computed runoff to stream gage runoff in Pajarito Canyon. An initial study completed by
Wright Water Engineers for LANL in 2001 predicted increased flood flows and floodplains
under post-Cerro Grande fire conditions on LANL lands and surrounding property.
Rainfall runoff calculations were made using the Natural Resources Conservation Service’s
curve number (CN) method. For calibration, a hydrograph output from HEC-HMS was
compared to hydrographs from two gaging stations in Pajarito Canyon. The model predicted
an average of 42 percent of the peak discharge in upper Pajarito Canyon and 24 percent of
the total volume discharge for three calibration simulations. For the same calibrations it
predicted 37 percent of the peak discharge and 18 percent of the volume discharge in
Twomile Canyon. While underestimated, these values may have been skewed by
precipitation measurements. To demonstrate the watershed’s recovery through CN
modification, a design storm with an average recurrence interval (ARI) of 100-year was used
to model the watershed’s response for conditions representative of both year 2000 and 2007.
The model consistently under-predicted the hydrograph peak and discharge volume for the
calibration simulations and given the magnitude of the underestimation it was expected that
the design storm predictions were underestimated as well. Through evaluation of the
variability of the model’s predictions and the intense data requirements associated with HEC-
HMS it was determined that HEC-HMS has limited applicability within Pajarito Canyon.

3
Acknowledgements
The completion of this project would not have been possible without the support and
encouragement of a long list of people. I would like to start by thanking my committee
for the countless hours they committed to helping me and for their encouragement and
sage advice whether in a meeting or over a cup of coffee. Dr. Bruce Thomson chaired my
committee and always made time to meet with me and review my work. Dr. Julie
Coonrod provided GIS expertise and experience with HEC modeling programs. LANL
staff members Steven Rae and William Turney volunteered their time to assist me from
the very beginning. I am honored to have worked with them and to have them as friends.
Mike Saladen, my team leader at LANL, provided support and assistance throughout my
time in graduate school. My mentor at LANL, Robin Reynolds, not only introduced me
to the Water Resources Program but also offered all available resources and time to help
me successfully complete it. Brad McKown helped with GIS data acquisition. Without
his ability to answer my countless questions related to GIS I may never have finished.
Greg Kuyumjian helped me understand many hydrologic concepts and gather stream
gage data. Jeff Walterscheid and Sam Loftin assisted with field work and provided
background information on the canyons and volunteered their experience gained from
working on the Cerro Grande fire rehabilitation.
I would also like to thank my parents, Bill and Helen Meadows, for their support and for
teaching me to always complete what I start.

4
Acronyms and Abbreviations
ARI average recurrence interval
BAER Burned Area Emergency Rehabilitation
BART Burned Area Rehabilitation Tracking
BMP best management practice
CN curve number
DEM digital elevation model
HEC-HMS Hydrologic Engineering Center–Hydrologic Modeling System
HSG hydrologic soil group
LANL Los Alamos National Laboratory
MET Meteorologic Tower (LANL site)
NOAA National Oceanic and Atmospheric Administration
NRCS Natural Resources Conservation Service
PFRS Pajarito Flood Retention Structure
SCS Soil Conservation Service
TA technical area
USACE United States Army Corps of Engineers
USDA United States Department of Agriculture
WWE Wright Water Engineers
5
Definitions
ArcMap – Geographic Information System application used for analyzing data and generating maps.
Cubic feet per second (cfs) – the rate of discharge representing a volume of 1 cubic foot passing a given point during 1 s and is equivalent to 7.48 gal. per s, 448.8 gal. per min, or 0.2832 cubic meters per s.
Discharge – the volume or water (or more broadly, the volume of fluid including suspended sediment) that passes a given point within a given period of time.
Drainage area – the area of a stream at a specified location, measured in a horizontal plane and enclosed by a topographic divide, from which direct surface runoff from precipitation normally drains by gravity into the stream above the specified point.
Ephemeral stream – surface water that flows only in direct response to precipitation or snowmelt in the immediate locality.
Froude number – a dimensionless parameter used to describe flow conditions. An index to the influence of gravity in flow situations where there is a liquid-gas interface.
Gaging station – a particular site on a stream, canal, lake, or reservoir where systematic observations of hydrologic data are obtained.
HEC-geoHMS – a software package for use with the ArcView Geographic Information System to develop a number of hydrologic modeling inputs.
Hydraulic radius – flow area divided by wetted perimeter of a stream channel.
Hydrology – the science dealing with the properties, distribution, and circulation of natural water systems.
Hyetograph – a graph depicting precipitation versus time.
Initial Abstraction – all the water losses occurring before runoff begins, including interception, evaporation, and infiltration.
Runoff curve numbers – a factor used to calculate runoff, based on land cover and soils.
Stream flow – the discharge that occurs in a natural channel.
Thalweg – imaginary line connecting the lowest points of streambed elevation in a channel.
Time lag – The standard lag is defined as the length of time between the centroid of precipitation mass and the peak flow of the resulting hydrograph.
Time of concentration – time it takes runoff to travel from the hydraulically most distant point in the watershed to a design point or point of discharge.
Total excess – excess precipitation subject to direct runoff.

6
Travel time (Tt) – time it takes runoff to travel from one point to another point down slope along a hydraulic segment in a watershed.
Water year – the 12-mo period, October 1 through September 30. The water year is designated by the calendar year in which it ends.
Definitions were adapted from Buckley et al. (2005), LANL (2006), SCS (1986), USACE (2001), and USACE (2006).

7
Table of Contents
1.0 Introduction 10
2.0 Background 11
3.0 Modeling Approach 16
4.0 Hydrologic Model Simulation Methods 21
5.0 Hydrologic Model Calibration 25
5.1 August 29, 2007 Precipitation Event Calibration 27
5.2 September 28-29, 2005 Precipitation Event Calibration 31
5.3 August 25, 2006 Precipitation Event Calibration 35
6.0 Hydrologic Model Design Storm Results 39
7.0 Discussion 43
8.0 Conclusions 47
9.0 Future Work 49
10.0 Literature Cited 50
List of Figures
Figure 1: Pajarito Canyon and surrounding areas 12
Figure 2: Cerro Grande fire burn area 13
Figure 3: Precipitation gages 15
Figure 4: CN Ratio versus Watershed Recovery Period 19
Figure 5: Sub-basins for HEC-HMS Pajarito Canyon model 23
Figure 6: View of PFRS outlet 25
Figure 7: Sub-basins for calibrating upper Pajarito Canyon 26
Figure 8: Sub-basins for calibrating Twomile Canyon 27
Figure 9: August 29, 2007 Precipitation distribution 28
Figure 10: Discharge hydrograph for upper Pajarito Canyon 29
Figure 11: Discharge hydrograph for Twomile Canyon 30

8
Figure 12: September 28-29, 2005 Precipitation distribution 32
Figure 13: Discharge hydrograph for upper Pajarito Canyon 33
Figure 14: Discharge hydrograph for Twomile Canyon 34
Figure 15: August 25, 2006 Precipitation distribution 36
Figure 16: Discharge hydrograph for upper Pajarito Canyon 37
Figure 17: Discharge hydrograph for Twomile Canyon 38
Figure 18: Upper Pajarito Canyon design storm hydrograph 42
Figure 19: Twomile Canyon computed design storm hydrograph 43
List of Tables Table 1: NOAA precipitation frequency estimates for
Los Alamos, NM 16
Table 2: WWE’s Estimated CNs for Los Alamos Watersheds 21
Table 3: Area-Weighted CNs for Pajarito Canyon 21
Table 4: Hydrologic Input Parameters for Pajarito Canyon 24
Table 5: August 29, 2007 Observed and Computed Discharge Data 31
Table 6: September 28-29, 2005 Observed and Computed Discharge Data 35
Table 7: August 25, 2006 Observed and Computed Discharge Data 39
Table 8: Design Storm Intensities 40
Table 9: Modeled Discharges for 2000 and 2007 Conditions 41
List of Appendices
Appendix A: Cerro Grande Fire Burn Intensities 52
Appendix B: Cerro Grande Fire BART Units 53
Appendix C: BART Unit 2 Photographs 54
Appendix D: Vegetation and Watershed Photographs 57

9
Appendix E: Gaging Station Information 60
Appendix F: Design Storm Distribution 62
Appendix G: Soil Types in Pajarito Canyon 63
Appendix H: 8/29-8/30/2007 Pajarito Canyon stream gage data 64
Appendix I: 8/29/2007 TA-06 precipitation data 72
Appendix J: 9/28-9/29/2005 Pajarito Canyon stream gage data 73
Appendix K: 9/28-9/29/2005 TA-06 precipitation data 89
Appendix L: 8/25/2006 Pajarito Canyon stream gage data 92
Appendix M: 8/25/2006 TA-06 precipitation data 100

10
1.0 Introduction
Los Alamos is located in northern New Mexico at the top of Pajarito Plateau near the Jemez
Mountains. Los Alamos is the site of Los Alamos National Laboratory (LANL) and was
heavily impacted by the Cerro Grande fire of May 2000. Following the fire, the burned
landscape around LANL was susceptible to potential floods that also impacted areas
downslope of the burned areas. Extensive rehabilitation efforts were completed to help
protect the land and structures. Studies were completed to analyze the potential effect of
floods in the area. Initially, all canyons surrounding Los Alamos were modeled using
computer software representing post-fire conditions to determine the estimated floodplain
and flood velocities for 6-hr duration precipitation events with an average recurrence interval
(ARI) of 2, 25, and 100-years. The purpose of this study is to demonstrate that modeling the
hydrology of post-precipitation runoff from a 6-hr 100-year storm in Pajarito Canyon 7 years
after the Cerro Grande fire will show reduced discharge at stream gages, reduced runoff
velocities, and reduced floodplains, thus demonstrating hydrologic recovery resulting from
the watershed’s natural recovery and response to rehabilitation. This study encompassed a re-
creation and evaluation of predicted and observed flood flows to determine the applicability
and accuracy of modeling software for investigating hydrologic recovery of a post-burn
watershed in New Mexico.
The study objectives were to
• research previous hydrologic and hydraulic modeling of stormwater runoff at Los
Alamos,
• review literature on the Natural Resources Conservation Service’s (NRCS) curve
number (CN) method and investigate its applicability for runoff calculations,
• compare HEC-HMS predictive modeling results to observed runoff to determine the
model’s applicability to Pajarito Canyon,
• model hydrology of runoff and evaluate the results for 6-hr / 100-year design storm in
Pajarito Canyon immediately after the Cerro Grande fire and after recovery (7 years),
and
• discuss the results of this study to make recommendations for future work.

11
In May 2000, the Cerro Grande fire burned 47,650 acres in and around LANL. Following the
fire, the potential was realized for greatly increased flood and debris flows in the burned sub-
basins posing a variety of concerns to downstream areas and LANL’s infrastructure (Buckley
et al. 2005). For 5 years following the Cerro Grande fire, LANL staff members reported post-
fire monitoring of rehabilitation. In 2001, a team of LANL and Wright Water Engineers
(WWE) personnel combined their data with available runoff reports for input parameters for
the hydrologic model. The modeling was completed in 2001 and employed U.S. Army Corps
of Engineers’ Hydrologic Engineering Center (HEC) modeling software. The purpose of this
floodplain analysis was to model the floodplain under post-Cerro Grande fire conditions on
LANL property. In this report, the initial hydrologic simulations were re-created and
accompanied with new data to calculate post-precipitation flood flows for Pajarito Canyon
that are representative of 2007 field conditions. Calibration runs were completed for three
separate storms as well to determine the accuracy of the model’s calculations when compared
to gaged runoff.
2.0 Background
Hydrology is the study of the occurrence and movement of water on and beneath the surface
of the earth. Hydrologic modeling focused on stormwater runoff and was completed with the
intent of generating a hydrograph, including a peak discharge and volume discharge.
Hydrologic Engineering Center–Hydrologic Modeling System (HEC-HMS) is a program
developed by the U.S. Army Corps of Engineers to model hydrologic behavior of watersheds.
HEC-HMS (Version 3.1.0) was used to complete hydrologic modeling of Pajarito Canyon.
Pajarito Canyon was selected for analysis because of the severity of the burn within its
drainage and the availability of accurate stream-gage data. Pajarito Canyon heads on the
flanks of the Sierra de los Valles on U.S. Forest Service lands. Figure 1 shows LANL and
Los Alamos County lands with Pajarito Canyon highlighted in green. The canyon crosses the
central part of LANL before entering Los Alamos County lands near White Rock (LANL
2006). During the Cerro Grande fire, upper Pajarito Canyon experienced at least 50% high-
severity burn, 10% moderate-severity burn, and 30% to 40% low-severity burn (WWE 2003).

12
Figure 1. Pajarito Canyon and surrounding areas. Map shows New Mexico, Los Alamos County, and Los Alamos National Laboratory, and surrounding drainages. Pajarito Canyon and its tributaries are demarcated in green and purple, respectively.

13
Figure 2 shows the Cerro Grande burn area, and Appendix B presents a map with the burn intensities.
Figure 2. Cerro Grande fire burn area. The burn perimeter is highlighted in red.
The landscape in Pajarito Canyon has changed considerably since 2000. Much of the area has
been revegetated, and the soils have more capacity to retain water than they did following the
fire. It is widely accepted that rainfall runoff increases after a fire event because of the
hydrophobic nature of burned soils, resulting in increased hydrograph peaks (McLin 2001).
The intent of creating a hydrologic model within HEC-HMS was to depict the current
3

14
hydrology of Pajarito Canyon and to reflect changes in rainfall-runoff relationships and
changing landscape conditions.
Climate dynamics of Los Alamos contribute to a complex hydrologic modeling environment.
The seasonal distribution as well as the intensity of precipitation events leads to rapid flows
in many of the ephemeral streams. Yearly precipitation at Los Alamos averages 18.9 in., with
45% distributed between July and September in the form of intense afternoon and evening
thunder showers from 1971-2000. The distribution and intensity of precipitation in the area
cause sharp-peaked hydrographs and potential for flooding of low-lying areas. Understanding
how the watersheds behave in the post-fire environment is important for managing
stormwater and making decisions concerning development.
The probability for exceeding a specific precipitation event has been found to remain
relatively constant with topographic relief and east to west movement in Los Alamos
(Reneau et al. 2003). Reneau et al. (2003) also found that the probability of exceeding
specific 15- or 30-min. rainfall amounts was similar across Los Alamos, regardless of east to
west direction or elevation. While the probability of exceeding a specific amount of
precipitation may remain the same, actual precipitation measurements for an individual event
can vary greatly across observation stations located a few miles apart due to the nature of
summer thunderstorms, the principle source of precipitation in summer months.
Figure 3 demonstrates the variability of precipitation across LANL and surrounding Los
Alamos County and Forest Service lands. The storm depicted occurred on August 4, 2008
and precipitation distribution is shown in in. for each gaging station. The storm dropped 3.05
in. of rain at Technical Area-49 (TA-49) while only 0.03 in. at station e245.5. According to
the National Oceanic and Atmospheric Administration (NOAA) Atlas 14, the 3.05 in.
recorded at TA-49 corresponds to an ARI of approximately 190 years. Table 1 shows
NOAA’s precipitation frequency estimates for Los Alamos for storms ranging from an ARI
of 1 to 100-years with durations ranging from 5 min. to 7 days.
There are 24 precipitation gages across LANL and surrounding lands. The stations have been
divided by Thiessen polygons to help track precipitation. The polygons are also depicted in
Figure 3. The Thiessen polygon method associates precipitation gages with a spatial area to
allow for the collection of more refined precipitation data. The gages are equipped with 5

15
min. tipping buckets connected to existing runoff gaging stations which are equipped with
data loggers. While there are now several precipitation gages in Pajarito Canyon for the
storms used to calibrate the model in this study the only available source for precipitation
data was the TA-06 Meteorological Tower (MET).
Figure 3. Precipitation gages. Thiessen polygons with precipitation recorded on August 4, 2008. Pajarito Canyon runs from left to right through the TA-06 MET.

16
Table 1. NOAA precipitation frequency estimates for Los Alamos, NM. From Bonnin et al. (2006).
Precipitation Frequency Estimates (inches)
ARI 5 min
10 min
15 min
30 min
60 min
120 min
3 hr
6 hr
12 hr
24 hr
48 hr
4 day
7 day (years)
1 0.21 0.33 0.4 0.54 0.67 0.79 0.9 1 1.14 1.37 1.59 1.89 2.28 2 0.28 0.42 0.52 0.7 0.87 1.01 1.1 1.3 1.44 1.71 1.99 2.36 2.85 5 0.37 0.56 0.7 0.94 1.17 1.33 1.4 1.6 1.81 2.14 2.46 2.92 3.5
10 0.44 0.67 0.83 1.12 1.39 1.59 1.7 1.9 2.1 2.47 2.85 3.37 4.01 25 0.54 0.82 1.01 1.37 1.69 1.94 2 2.2 2.51 2.92 3.36 3.97 4.71 50 0.61 0.93 1.15 1.55 1.92 2.22 2.3 2.5 2.82 3.27 3.76 4.44 5.23
100 0.69 1.05 1.3 1.75 2.17 2.52 2.6 2.8 3.15 3.63 4.16 4.92 5.76 200 0.77 1.17 1.45 1.96 2.42 2.84 3 3.2 3.49 3.99 4.57 5.4 6.29 500 0.88 1.34 1.66 2.23 2.77 3.27 3.4 3.6 3.95 4.48 5.12 6.05 6.99 1000 0.97 1.47 1.83 2.46 3.05 3.62 3.8 3.9 4.31 4.85 5.54 6.54 7.52
3.0 Modeling Approach
According to the NRCS’s “Urban Hydrology for Small Watersheds” (1986), seven factors
affect runoff: precipitation, soil permeability, watershed area, ground cover, antecedent
moisture, watershed storage, and time parameters (time of concentration and travel time).
Three of the factors can be affected by anthropogenic means: soil permeability, ground cover,
and the time parameters. All the other factors are fixed but must still be considered in any
watershed analysis. Consistent with the idea of being able to alter soil permeability and
ground cover is the idea of modeling post-fire runoff. This study used an application of
composite CNs representative of field conditions to analyze the changes in runoff
characteristics following the Cerro Grande fire.
The NRCS hydrograph method was originally developed from observed data collected in
small agricultural watersheds. The data were generalized as dimensionless hydrographs, and
a best-approximate hydrograph was developed for general application.

17
Runoff CNs are a factor used to determine runoff based on land cover and soils. Multiple
tables provide CNs for various cover types on different soils. Soils are classified into
hydrologic soil groups (HSG) that indicate the minimum rate of infiltration obtained for bare
soil after prolonged wetting. The HSGs are one element used in determining CNs. As
determined by Wright Water Engineers (WWE 2003), all soils within Pajarito Canyon fell
under HSG C. Field work by WWE in 2003 revealed that the high hydrophobic character of
the soil in Pajarito Canyon had disappeared in the 3 years after the fire, thus reducing the risk
associated with high runoff potential following the Cerro Grande fire. The soils were mostly
sandy with a high percentage of silt (WWE 2003).
The following text describes the method used by HEC-HMS for CN based runoff calculation,
and the equations are from Chapter 5 of the HEC-HMS technical reference manual (USACE
2000).
The SCS Curve Number (CN) model estimates precipitation excess as a function of
cumulative precipitation, soil cover, land use, and antecedent moisture, using the
following equation:
Pe= ( P - Ia)2
P-Ia + S (5-3)
Where Pe = accumulated precipitation excess at time t; P = accumulated rainfall depth
at time t; Ia = the initial abstraction (initial loss); and S = potential maximum
retention, a measure of the ability of a watershed to abstract and retain storm
precipitation. Until the accumulated rainfall exceeds the initial abstraction, the
precipitation excess, and hence the runoff, will be zero.
From analysis of results from many small experimental watersheds, the SCS
developed an empirical relationship for Ia and S:
Ia = 0.2 S (5-4)
Therefore, the cumulative excess at time t is:
Pe= ( P – 0.2 S)2
P + 0.8 S (5-5)

18
Incremental excess for a time interval is computed as the difference between the
accumulated excess at the end of and beginning of the period. The maximum
retention, S, and watershed characteristics are related through an intermediate
parameter, the curve number (commonly abbreviated CN) as:
S ={ (1000 – 10 CN)/CN (25400–254CN)/CN
Since the sub-basins in Pajarito Canyon had spatially varying hydrologic properties both pre-
and post-fire composite CNs were calculated by WWE to account for multiple soil types and
varying vegetative cover. In 2003, WWE computed pre- and post-fire CNs for sub-basins in
the Los Alamos area and used these as input to HEC-HMS to estimate potential increase in
flood discharges for all areas affected by the Cerro Grande fire. In consideration of these CN
determinations, sub-basins were identified to reflect as uniform a burn severity as practical.
The pre-fire CNs were based on rainfall-runoff analysis by LANL for those sub-basins where
data existed. Post-fire CNs were initially determined by area weighting the burn severity in
each sub-basin using criteria specified by WWE (2003).
According to the WWE report, the objective of post-fire recovery is to return to the “natural”
condition rather than “pre-fire” condition. The “pre-fire” condition—as represented by the
pre-fire CN—does not equate to the “natural” condition. The “pre-fire” condition of the
watershed contained dense vegetation which was susceptible to carrying a high intensity fire
such as the Cerro Grande. Thus, the hydrologic characteristics have changed by varying
degrees, resulting in an “unnatural’ hydrologic condition. In the specific case of the Cerro
Grande fire, the overgrown pre-fire landscape is not expected to be the future condition
because of recent changes in forest management practices and philosophy (WWE 2003).
The following approach for estimating post-fire CN was developed by WWE (2003): sub-
basin recovery was based on a ratio of post-fire CN to pre-fire CN. With recovery of the
watershed and in the absence of subsequent disturbances, such as another wildfire or a
significant change in land use, this ratio decreases over time. As re-vegetation and other
variables change, the sub-basin hydrology gradually moves its hydrologic response towards
its “natural” condition (CN=1.1, which represents the pre-fire CN ratio of 1.0 plus 10%)
(WWE 2003). Figure 4 demonstrates a graphic of the post-fire to pre-fire CN ratio. It is from
}(SI) (foot-pound system)
(5-6)

19
WWE (2003) and shows the “natural condition” as 1.1 times the pre-fire CN. More intense
burn results in a higher post-fire CN ratio. With a high post-fire CN ratio, a longer recovery
time to a “natural condition” can be expected. The curved lines provide a general
representation of recovery.
Figure 4. CN Ratio versus Watershed Recovery Period. From WWE (2003).
The sub-basins modeled in McLin et al. (2001) compared favorably to those generated
through ArcMap calculations. When the sub-basins and associated data were used, it became
possible to modify the CN in an attempt to demonstrate hydrologic recovery throughout
Pajarito Canyon. The first step was to modify CNs for all sub-basins with high-burn intensity.
In October 2007, the author spent 2 days in the field to gather vegetative cover data from

20
high-intensity Burned Area Rehabilitation Tracking (BART) units. The areas selected were
the focus of intense rehabilitation efforts and were in areas that could potentially contribute to
high stormwater runoff volumes and velocities. The areas of interest were selected through
review of the Cerro Grande fire reports and consultation with LANL staff involved with the
Burned Area Emergency Rehabilitation (BAER) efforts. BART units were established by the
BAER team, which is composed of U.S. Forest Service professionals who assist with land
stabilization following a natural disaster such as wildfire on Forest Service lands.
In 2007, BART Units 2, 6, and 34 were selected for this study because of their proximity to
the stream channel and were the focus of BAER efforts. To assist composite CN calculations,
percent vegetative cover was measured at four randomly selected plots in each of the burn
units. The percent cover was then averaged to represent the entire unit.
To further justify the CNs, previously used photographic monitoring locations were located
and photographed to the maximum extent practicable. Transitions in personnel led to
difficulties in locating all the photo points. To determine whether the areas were the same as
previously used in photo documentation, staff walked through the area to locate the markers.
Instances when the exact photo point could not be located, a close approximation was
utilized.
The condition of Pajarito Canyon streambed is documented in the photographs in Appendix
D. It should be noted that the vegetative cover varied greatly. Rehabilitated areas showed
vegetation ranging from 15% to 80%. Unburned areas in the canyon bottom often had
100% vegetative cover. Different cover types were also evident. Previous research by Grove
et al. (1998) has documented complications associated with using a composite CN to
represent vastly different hydrologic conditions within the same sub-basin. A composite CN
was generated with the understanding that it may not accurately reflect actual runoff
conditions but was the best option given data gathering limitations.
The observations from the 2003 WWE report further documented the complex terrain and
associated difficulties with developing a composite CN. Table 2 contains CNs for burned and
unburned areas on and around LANL estimated by WWE. Wright Water Engineers found
rock cover on steep slopes within Pajarito Canyon to be as great as 60%. In burned areas
there was no canopy. A result of the change from canopy and vegetative litter to grass, the

21
predominant cover type in areas of severe burn, has changed to one representative of
herbaceous cover rather than the pre-fire cover type of piñon-juniper woods. Area-weighted
3-year post-fire CNs were calculated by WWE. The CN for upper Pajarito Canyon was 76 in
2003. Values calculated in 2007 and based on field observations combined with WWE’s
approach are presented in Table 3. Figure 5 contains a map of the sub-basins, each of the
CNs were assigned to their specific sub-basin for calibration as well as year 2000 and year
2007 simulations.
Table 2. WWE’s Estimated CNs for Los Alamos Watersheds
Burn Severity Estimated
CN Unburned 55–75 Low 80–83 Moderate, without hydrophobic soils 87 Moderate, with hydrophobic soils 89 High, without hydrophobic soils 92 High, with hydrophobic soils 95
Table 3. Area-Weighted CNs for Pajarito Canyon
Sub-basin Original
CN
Post Cerro
Grande CN
2007 Modified
CN 1 52 77 65 2 62 70 65
3 (A and B) 61 69 64 4 70 65 63 5 67 65 63 6 72 72 72 7 73 73 73
Note: The 2000 values were developed by WWE and the 2007 values were based on data gathered during the 2007 field season.
4.0 Hydrologic Model Simulation Methods
HEC-HMS contains multiple components, each with separate data requirements to represent
the watershed being modeled. HEC-HMS simulations were carried out under two separate
circumstances, first to determine its accuracy through calibration and then to analyze the

22
results from a design storm. Section 5.0 details the model calibration when run with actual
precipitation data and compared to stream gage data. Section 6.0 contains the design storm
simulations and comparisons of runoff changes from year 2000 versus year 2007 conditions.
The primary components of HEC-HMS are the basin model, the meteorologic model, control
specifications, time-series data, and paired data. The basin model captures hydrologic
properties of the watershed. For this study, Pajarito Canyon was divided into sub-basins
calculated in ArcMap. The meteorologic model associates precipitation data with the basin
model to represent precipitation within the sub-basins and facilitate runoff calculations.
Time-series data was linked with the meteorologic model. For calibration, TA-06 MET data
was entered in 15 min. intervals and for the design storm separate meteoroligic models were
developed for each sub-basin. Paired data was used to model the Pajarito Flood Retention
Structure (PFRS).
Figure 5 shows a schematic of the hydrologic model and its tributaries, including Twomile
Canyon and Threemile Canyon. The following bullets provide a physical description of the
basin locations within Pajarito Canyon. An additional area was included in sub-basin 3B to
represent runoff from a 12.8 acre development within TA-03. This area is a tributary to
Twomile Canyon and is gaged by a 12 in. Parshall flume at station E243.5.
• Sub-basin 1 is Pajarito above NM 501
• Sub-basin 2 is Pajarito below NM 501
• Sub-basin 3A is Twomile Canyon above Pajarito
• Sub-basin 3B is Twomile Canyon below Pajarito
• Sub-basin 4 is Pajarito between Twomile and Threemile Canyons
• Sub-basin 5 is Threemile Canyon
• Sub-basin 6 is Pajarito Canyon at White Rock
• Sub-basin 7 is Pajarito Acres

23
Figure 5. Sub-basins for HEC-HMS Pajarito Canyon model. Each sub-basin is outlined in red.
The data listed in Table 4 were entered manually into HEC-HMS. The sub-basin
characteristics were consistent with those proposed by McLin (2001) for sub-basins 2
through 7. Rainfall runoff calculations were made using the NRCS’s CN method described
previously. Lag times for each sub-basin and channel routing methods followed previous
research by McLin and WWE. Precipitation and gaging-station data verified the time lag
input parameters. The hydrologic inputs for sub-basins 6 and 7 remained unchanged because
they did not burn. Channel routing was completed using the Muskingum method with
components derived from McLin (2001).
PFRS

24
Table 4 Hydrologic Input Parameters for Pajarito Canyon
Sub-basin CN Area
(square mi.)
Lag Time (min.)
Impervious Area (%)
1 65 1.99 45 22 2 65 2.57 96 22
3A 64 1.29 30 16 3B 64 1.99 99 35 4 63 0.67 107 38 5 63 1.70 128 49 6 72 1.15 172 12 7 73 2.24 80 3
Challenges arose with manually entered model inputs because of the limited ways to
represent culverts and other flow-altering devices (i.e., debris, logs) and erosion control best
management practices (BMPs) (i.e., straw wattles). The impervious area was calculated from
United States Department of Agriculture (USDA) soil surveys conducted in Pajarito Canyon.
The impervious area was incorporated into the composite CN calculations. HEC-HMS also
requires inputs for percent impervious areas – the values used in this model were urbanized
areas and calculated from aerial photographs. Appendix G contains specific information on
the soils for each of the sub-basins and their relative percent compositions.
The PFRS, as shown in Figure 6, was the primary flow control structure modeled in Pajarito
Canyon. The PFRS was constructed following the Cerro Grande fire to mitigate the velocity
of precipitation runoff. The PFRS rises to 69 ft above ground surface (total height is 118 ft)
and has a 42-in. corrugated-metal pipe, allowing for a peak flow of 500 cubic feet per second
(cfs). The PFRS was modeled as a reservoir and discharge-area tables from McLin (2001)
facilitated function within HEC-HMS.

25
Figure 6. View of PFRS outlet
5.0 Hydrologic Model Calibration
Three separate calibration runs were completed to determine the model’s accuracy in
calculating peak discharge, discharge volume, and the general shape of the hydrograph,
which characterizes the watershed’s runoff behavior. Sub-basins 1, 2, 3A, and 3B were
selected for calibration as they received the most intense burns within Pajarito Canyon and
also have stream gages to allow for comparison of calculated runoff to gaged runoff.
Three storms were selected to calibrate sub-basins representing burned areas within Pajarito
Canyon. Storms with return intervals of approximately 1-year, 10-years, and 100-years were
chosen to analyze the model’s predictions and to use them to validate its calculations for the
design storm which is discussed in Section 6.0. Section 5.1 contains model simulations for a

26
storm that occurred on August 29, 2007. Section 5.2 contains model simulations for a storm
that occurred on September 28-29, 2005. Section 5.3 contains model simulations for a storm
that occurred on August 25, 2006.
The precipitation data collected at the TA-06 MET were used for precipitation measurements
and contained precipitation data in 15-min. intervals for calibration runs. Gaging stations
proximate to the MET were correlated with TA-06 data to derive local rainfall runoff. While
the data for the TA-06 MET is high quality, given the spatial variation of precipitation events
there was potential for the data to not capture localized precipitation for the entire sub-basins
within upper Pajarito and Twomile Canyon.
Figure 7 shows sub-basins 1 and 2 which were used for calibrating upper Pajarito Canyon.
They are gaged by station E243.
Figure 7. Sub-basins for calibrating upper Pajarito Canyon. Station E243 gaged runoff from the sub-basins which are highlighted in light blue.

27
Figure 8 shows sub-basins 3A and 3B which are gaged by station E244. Station E243.5 gages
runoff from TA-3 and was linked with sub-basin 3B. A detailed description of the stream
gage data quality is in Appendix E.
Figure 8. Sub-basins for calibrating Twomile Canyon. Gaging station E243.5 gages TA-3 runoff and E244 gage flow from sub-basins 3A and 3B as well as runoff that through station E243.5. Sub-basins 3A and 3B are highlighted in light blue.
5.1 August 29, 2007 Precipitation Event Calibration
The first calibration run represented a precipitation event from August 29, 2007 that dropped
0.99 in. of rain at the TA-06 MET. This storm corresponded to an ARI of approximately 1-
year. Figure 9 shows percent precipitation versus percent time for the storm, demonstrating
that the most intense precipitation occurred at the beginning of the storm when 0.58 in. of
rain fell in 30 min. The storm dropped a calculated 241 acre-foot (AF) of equivalent
precipitation into the drainage area for gaging station E243 and 174 AF of equivalent
precipitation into the drainage area for gaging station E244. This storm was selected as it had
two separate intensities which could be useful for determining the model’s capacity for
calculating accurate runoff for varying intensities within the same event.

28
Figure 9. August 29, 2007 Precipitation distribution. Percent precipitation versus percent time for the August 29, 2007 storm at TA-06.
Figure 10 shows the HEC-HMS generated hydrograph for gaging station E243. The peak
discharge observed at station E243 for upper Pajarito Canyon was 86.5 cfs while the model
computed 25.8 cfs. The observed discharge volume for E243 was 7.6 AF while the model
computed 5.5 AF, or 75 percent of the total runoff. While there was variation within the
model’s numerical predictions it was able to represent two separate peaks within the
hydrograph.

29
Figure 10. Discharge hydrograph for upper Pajarito Canyon. Station E243 discharge compared with estimated discharge for the August 29, 2007, precipitation event.
Figure 11 shows the hydrograph generated by HEC-HMS for gaging station E244. The peak
discharge observed at station E244 was 32.0 cfs while the model computed 18.4 cfs. The
observed discharge volume for E244 was 4.6 AF while the model computed 4.2 AF,
corresponding to 91 percent of the total runoff. The model was able to represent both
observed hydrograph peaks and the accuracy of the observed versus predicted discharge
volumes was encouraging.

30
Figure 11. Discharge hydrograph for Twomile Canyon. Station E243 discharge compared with estimated discharge for the August 29, 2007 precipitation event.

31
Table 5 shows the observed and computed peak discharges, and the observed and computed
discharge volumes for gaging stations E243 and E244. Of all three calibration runs the model
was able to predict the peak discharge and volume discharge with the greatest accuracy for
the August, 2007 event.
Table 5. August 29, 2007 Observed and Computed Discharge Data
Hydrologic Element
Observed Peak
Discharge (cfs)
Computed Peak
Discharge (cfs)
Peak Discharge Difference
(cfs)
Observed Discharge Volume
(AF)
Computed Discharge Volume
(AF)
Discharge Volume
Difference (AF)
E243 86.5 25.8 60.7 7.3 5.5 1.8 E244 32 18.4 13.6 4.6 4.2 0.4
5.2 September 28-29, 2005 Precipitation Event Calibration
The second calibration run was for a precipitation event on September 28-29, 2005 that
dropped 2.36 in. of rain at the TA-06 MET. While the storm occurred two years prior to the
CN modification, it was selected for calibration as it was the one of the few storms on record
with a duration of 24-hr. The storm also had a relatively even precipitation distribution which
limited biases associated with potential variation of precipitation related to spatial variability.
The storm corresponded to an ARI of approximately 9-years.
Figure 12 shows percent precipitation versus percent time for the storm, demonstrating its
intensity. The storm dropped a calculated 574 AF of equivalent precipitation in the drainage
are for station E243 and 415 AF of equivalent precipitation in the drainage area for station
E244. Of the three storms selected for calibration it was expected that the calculated
precipitation total would be most accurate for this storm. There were several intensity peaks
within the storm which are visible in the hydrographs. The model was able to represent these
peaks, which was encouraging. However for both gaging stations it underestimated the
hydrograph peak and discharge volume.

32
Figure 12. September 28-29, 2005 Precipitation distribution. Percent precipitation versus percent time for the September 28-29, 2005 storm at TA-06.
Figure 13 shows the hydrograph generated by HEC-HMS for gaging station E243. The peak
discharge observed at station E243 was 46.7 cfs while the model computed 18.8 cfs. The
observed discharge volume for E243 was 71 AF while the model computed 11.3 AF,
corresponding to 16 percent of the total runoff. The model grossly underestimated discharge
volume for the event at station E243. The general shape of the hydrograph was captured by
the model, however. Several attempts were made to modify the CN and impervious area to
get the model to match the gage’s runoff, but representative results were only attained with
values far different from those observed in the field. For purposes of using defensible data the
data gathered in the field was used.

33
Figure 13. Discharge hydrograph for upper Pajarito Canyon. Station E243 discharge in blue compared with estimated discharge in red for the September 28-29, 2005, precipitation event.
Figure 14 is the hydrograph generated by HEC-HMS for gaging station E244. The peak
discharge observed at station E244 was 29.8 cfs and the model computed 14.0 cfs. The
observed discharge volume for E244 was 22.0 AF while the model computed 9.2 AF,
equating to 42 percent of the total runoff. The model represented the first peak of the
hydrograph accurately both in terms of peak magnitude and time, however it was unable to
predict the remaining peaks, thus leading to underestimation of total discharge.

34
Figure 14. Discharge hydrograph for Twomile Canyon. Station E244 discharge in blue compared with estimated discharge in red for the September 28-29, 2005, precipitation event.
Table 6 provides the observed and calculated values for peak discharge, discharge volume
and the difference between observed and computed values for the 2005 precipitation event
calibration.

35
Table 6. September 28-29, 2005 Observed and Computed Discharge Data
Hydrologic Element
Observed Peak
Discharge (cfs)
Computed Peak
Discharge (cfs)
Peak Discharge Difference
(cfs)
Observed Discharge Volume
(AF)
Computed Discharge Volume
(AF)
Discharge Volume
Difference (AF)
E243 46.7 18.8 27.9 71.0 11.3 59.7 E244 29.8 14.0 15.8 22.0 9.2 12.8
5.3 August 25, 2006 Precipitation Event Calibration
Although the August 25, 2006 storm occurred only 6 years after the fire, it was selected for
calibration because it was the best available representation of a 100-year intensity. The
August 25, 2006 storm produced 2.01 in. of precipitation in 4.5 hr at the TA-06 MET. While
the TA-06 measurements did not meet a 100-year ARI, unofficial data from a precipitation
near the center of LANL, which was not available for use in calibration, showed the storm
had an ARI of 100-years at its peak intensity. While the peak intensity of the storm was not
centered over the TA-06 MET, record peak discharge was recorded in Twomile Canyon.
Across LANL, new peak discharges were recorded at more than 20 stream gages (LANL
2006).
The storm generated peak runoff of 15.5 cfs in upper Pajarito Canyon (station E243) and 597
cfs in Twomile Canyon (station E244). The storm dropped a calculated 489 AF of equivalent
precipitation into the drainage area for station E243 and 354 AF into the drainage area for
gaging station E244. Given the proximity of the TA-06 MET and the spatial variability of
precipitation it was not expected that the entire Pajarito watershed received this amount of
precipitation. Figure 15 shows the relationship of percent precipitation versus percent time,
44 percent of the total precipitation fell within a 30 min. period.

36
Figure 15. August 25, 2006 Precipitation distribution. Percent precipitation versus percent time for the August 25, 2006 storm at TA-06.

37
Figure 16 shows the hydrograph generated by HEC-HMS for gaging station E243. The peak
discharge observed at station E243 was 15.5 cfs while the model computed 8.6 cfs. The
observed discharge volume for E243 was 1.2 AF while the model computed 2.2 AF. The
model overestimated the discharge volume by 1 AF for this location.
Figure 16. Discharge hydrograph for upper Pajarito Canyon. Station E243 discharge compared with estimated discharge for the August 25, 2006, precipitation event.

38
Flow at station E244 went from 1.3 cfs at 12:15 pm to 597 cfs at 12:45 pm, suggesting an
extremely rapid runoff response to intense precipitation. Figure 17 shows the hydrograph
generated by HEC-HMS for gaging station E244. The peak discharge observed at station
E244 was 597 cfs while the model computed 36 cfs. The observed discharge volume for
E244 was 100 AF while the model computed 9.1 AF equating to 9.1 percent of the total
runoff. It was expected that the TA-06 precipitation data did not represent the actual
precipitation that fell during the storm. There was also potential that debris could have
interfered with the stream gage, thus altering flow measurement.
Figure 17. Discharge hydrograph for Twomile Canyon. Station E244 discharge compared with estimated discharge for the August 25, 2006, precipitation event.

39
Table 7 contains values for observed and computed peak discharge and discharge volume.
The total discharge predicted for station E244 was dramatically less than the gaged flow. The
calibration simulations contained variables that potentially influenced the difference between
observed and estimated runoff. Contributing factors could be tied to various input parameters
including precipitation data and field conditions variant from model inputs.
Table 7. August 25, 2006 Observed and Computed Discharge Data
Hydrologic Element
Observed Peak
Discharge (cfs)
Computed Peak
Discharge (cfs)
Peak Discharge Difference
(cfs)
Observed Discharge Volume
(AF)
Computed Discharge Volume
(AF)
Discharge Volume
Difference (AF)
E243 15.5 8.6 6.9 1.2 2.2 -1 E244 597 36 561 100 9.1 90.9
The model predicted an average of 42 percent of the peak discharge and 24 percent of the
total discharge volume at station E243. For station E244 it predicted an average of 37 percent
of the peak discharge and 18 percent of the discharge volume. While these relationships show
a general under-prediction of runoff it should be understood that actual precipitation may
have varied greatly from what was observed at TA-06, potentially leading to variation and
ultimately underestimation of runoff.
6.0 Hydrologic Model Design Storm Results
To analyze the runoff response of Pajarito Canyon 7 years after the Cerro Grande fire a
design storm was used to facilitate precipitation within HEC-HMS in scenarios representative
of both year 2000 and year 2007. The precipitation events used in the meteorological portion
of the model had a 6-hr duration and an ARI of 100-years. Table 8 contains design storm
intensities for each of the sub-basins in Pajarito Canyon. The intensities were distributed by
methodology proposed by McLin (2001). The precipitation distributions used were separated
for each sub-basin. The distribution factors can be found in Appendix G.

40
From reviewing NOAA’s Precipitation Frequency Analysis it was determined the value used
by McLin for sub-basin 1 (3.91 in.) was not consistent with a 6-hr storm with a 100-year
ARI. The sub-basin 1 value was modified to 2.84 in. to remain consistent with NOAA’s
data.
Table 8. Design Storm Intensities
Pajarito Sub-basins 100-year 6 hr. Precipitation
(in.)
1 2.84
2 2.73
3A and B 2.73
4 2.10
5 2.27
6 1.86
7 1.59 Note: Precipitation intensities for sub-basins modeled in Pajarito Canyon.
Table 9 contains computed peak discharge and discharge volumes for all sub-basins as well
as station E243, E243.5, and E244. Based on the calibration runs, the predicted peak
discharge and discharge volumes for the station E243 and E244, 2007 simulations they were
most likely underestimated from what actual flow from this storm may be.

41
Table 9. Modeled Discharges for 2000 and 2007 Conditions
Hydrologic Element
Total Precipitation
(AF)
2000 Peak
Discharge (cfs)
2007 Peak Discharge
(cfs)
2000 Discharge Volume
(AF)
2007 Discharge Volume
(AF) Sub-basin 1 301 134 51 19.5 8.1 Sub-basin 2 374 183 76 22.5 10.5
Sub-basin 3A 187 97 36 10.6 4.6 Sub-basin 3B 289 66 27 10.4 6.7 Sub-basin 4 75 38 15 9.0 3.6 Sub-basin 5 205 21 16 7.8 6.1 Sub-basin 6 114 17 7 5.7 3.3 Sub-basin 7 190 18 12 6.2 3.4
E243 675 194 82 39.9 17.7 E243.5 3 13 13 .94 .94 E244 480 130 54 27 12.3
Figure 18 shows the computed hydrograph for the design storm comparing discharge and
watershed response for upper Pajarito Canyon. Following the CN modification a reduction in
peak discharge and discharge volume was observed. The hydrograph peaks occurred at
approximately the same time under both conditions, however. Since the calibration runs
underestimated runoff for 2007 conditions, it was expected that calculations would also be
underestimated for 2000 conditions. Limited availability of stream gage data precluded
extensive calibration for year 2000 simulations. The CNs used for year 2000 were from
previous research at LANL. Without calibration data to use for comparison it was not
possible to determine the magnitude by which the year 2000 predictions may have been
underestimated.
.

42
Figure 18. Upper Pajarito Canyon design storm hydrograph. Hydrograph depicting computed values for upper Pajarito Canyon (Sub-basins 1 and 2) with year 2000 values in red and year 2007 values in blue.
Figure 19 shows the computed hydrograph for the design storm comparing discharge and
watershed response for Twomile Canyon for both year 2000 and year 2007 conditions. The
model predicted a similar response for both simulations, denoted by the general shape of the
hydrograph. CN modification resulted in a reduced peak and discharge volume for the 2007
simulation.

43
Figure 19. Twomile Canyon design storm hydrograph. Hydrograph depicting computed values for Twomile Canyon (Sub-basins 3A and 3B) with year 2000 values in red and year 2007 values in blue.
7.0 Discussion
As a reflection of the CN modification, each of the sub-basins exhibited reduced runoff for
the design storm. For the sub-basins of particular interest (1, 2, 3A, and 3B), the predicted
peak runoff was reduced significantly from 2000 to 2007 conditions. This change is of
interest because those four sub-basins are upstream of the PFRS. The reduction was also
expected as the sub-basins recovered from the burn they have greater capability to retain
water through infiltration and interception following precipitation. From the driving
equations from HEC-HMS as the CN decreases (supported by field work and previous
research) the total maximum retention (S factor in HEC-HMS equations) increases, thus
exhibiting decreased peak flows. Precipitation intensity also plays a significant role in
determining runoff. Through consultation with LANL staff it was learned that prior to the fire

44
Pajarito Canyon and its tributaries were heavily vegetated and did not demonstrate the rapid
runoff response observed following the fire.
Appendix C shows a sequence of photos from BART Unit 2 which was burned in 2000 and
was a focal point of the BAER efforts. The first photo was taken in July, 2000 immediately
following the installation of straw wattles. Photographs were taken from the same point in
2001, 2003, 2005, and 2007. There was significant visual evidence of recovery from the burn
as a result of BAER efforts and natural succession. Many trees that burned in the fire also fell
during that time. Trees can act as flow obstructions once on the ground surface. While
difficult to quantify, the full effect of the rehabilitation efforts versus natural recovery the
cumulative effect of the vegetative recovery is represented by CNs.
Because the CN method is empirical, there is inherent risk in using CNs to evaluate the
watershed’s response to fires, especially in areas like Los Alamos that are dominated by
convective storms, which have not been sufficiently tested by the method (WWE 2003).
Others have found this method to fit the data well despite its supposed lack of sound
theoretical support (Steenhuis 1995). Grove et al. (1998) found that significant errors in
runoff estimates can occur when composited rather than distributed CNs are used. This
problem is avoided, however, when average runoff depths are calculated using distributed
CNs because the true CN value is used to determine the runoff depth for all areas. Thus, CN
compositing will always underestimate runoff depths compared to averaging of runoff
calculated from distributed CN, regardless of any other factors (Grove et al. 1998). The
results from the three calibration runs demonstrated a consistent underestimation of runoff by
HEC-HMS. The underestimation was likely a product of using composited CNs and HEC-
HMS’s inability to represent weighted runoff.
According to Moglen (2000), building a spatially distributed runoff model from a model
conceived in a lumped fashion, such as the SCS (NRCS in this study) method, can introduce
biases in runoff prediction from the original lumped runoff estimates. While HEC-HMS is a
lumped parameter model, the input parameters were derived from a spatial tool, and the
results should be carefully scrutinized. Given a calibrated model, if a new approach
systematically changes the answer in a single direction, the value of the new approach needs
to be questioned (Moglen 2000). In the calibration runs for this model it was found that

45
model could more accurately represent the gaged runoff, but only with inputs that weren’t
representative of field conditions. Consistent with the work of Moglen (2000) since the
modifications changed the output in a positive direction this was determined to be a bias and
the model may not compute representative results should those inputs be used under different
conditions.
As supported by evidence from this project, compositing a CN can lead to variation in the
model’s response, including underestimation of runoff. When compared to gaged runoff
computed discharge volumes were underestimated by an average of 76 percent for station
E243 and 82 percent for station E244. Station E244’s predictions were heavily influenced by
the August 25, 2006 precipitation event, however. A possible solution to the model’s
underestimation would be to use a weighted runoff calculation. The primary advantage of
weighting runoff is that it accounts for variability of high runoff areas and low runoff areas
independently, rather than compositing them as a weighted CN does.
Multiple input parameter variations within the model may have caused differences in
predicted results and observed values. A primary concern was the accuracy of localized
rainfall-runoff relationships used in HEC-HMS. Pajarito Canyon may not respond in a linear
manner for high-intensity or long-duration precipitation events. In addition, runoff
calculations using the CN method is not a linear relationship, so a small CN corresponds to a
large change in calculated runoff. The August 25, 2006 storm and runoff at station E244
supports this claim. Investigating this relationship by measuring localized precipitation,
runoff, and vegetation may improve its definition.
A 100-year storm should correspond to a 100-year runoff (Jiang 2001). Using a 100-year
event can assist the model’s response as a majority of the precipitation should result in stream
flow. This was not seen in the August 25, 2006 calibration, however, that was likely due to
under-representation of the actual precipitation resulting from the spatial distribution of
precipitation for that event. The CN method also often underestimates runoff for storms of
low ARI. Distributed modeling techniques applied to the existing CN method allow for
consideration of the orientation of high-runoff and low-runoff-producing areas when
determining the runoff from a watershed (Moglen 2000).

46
Another potential influence is the initial abstraction ratio used. HEC-HMS automatically
altered manually entered initial abstraction ratios for all sub-basins to between 0.1992 in. and
0.2009 in. Entered values ranged from 1.09 to 1.13 in. as calculated from the relationship Ia =
0.2S. This range implies a storage value much smaller than calculated, which could lead to
miscalculation of the peak hydrograph and discharge volumes.
Additional research may focus on the application of using modified initial abstraction values
in a weighted runoff scenario by applying an initial abstraction ratio of 0.05 and methods
proposed by Jiang (2001). It was apparent that the CNs allowed modeled sub-basins 1, 2, 3A,
and 3B to closely mimic the behavior of the watershed but the volume runoff was
underestimated for all areas except those captured by gage E243.5. Using an initial
abstraction ratio of 0.05 would reduce the retention volume, perhaps allowing for more
accurate calculation of runoff volume.
Variation of a watershed’s hydrologic characteristics greatly influences its runoff producing
potential from storm to storm. An example of an influencing factor not included in the HEC-
HMS model in this study is antecedent soil moisture. While the CN method allows for
adjustment to account for antecedent soil moisture, this study found that without access to
accurate soil moisture data, the CNs may not represent exact field conditions and runoff
calculations can be influenced, leading to under- or over- prediction of runoff.
Other potential sources of variation within the calibration runs include un-gaged runoff not
captured within the Geographic Information System (GIS) watershed layers. Gaging station
E243.5 was included in the model and could serve as a representation of the contributions of
other developed areas along Pajarito Canyon. For Water Year 2007 station E243.5 discharged
6.6 AF and from TA-06 calculations 20.8 AF of equivalent precipitation fell within its
catchment area. This corresponds to 32 percent of precipitation resulting in runoff which
would be expected from an urbanized area such as the E243.5 catchment. While the runoff
contributions of developed areas along Pajarito Canyon likely behave in a hydrologically
similar manner, their contributions should be quantified and included in future studies.
Investigation was made into the effectiveness of modeling runoff in a smaller sub-basin by

47
comparing computed results to gaged runoff at station E243.5. The model was able to predict
discharge through station E243.5 with accuracy (85% of peak discharge and 100% of
discharge volume for the 8/25/06 precipitation event). The model’s response was likely
assisted more by TA-3’s developed setting and the absence of complex hydrologic
characteristics found in many of the other drainages around LANL more than the reduction in
sub-basin size. Since TA-3 didn’t burn during the Cerro Grande fire, further evaluation into
the model’s capabilities in this area wasn’t completed.
8.0 Conclusions
The results of this study indicated that with modified CNs HEC-HMS successfully
demonstrated reduced peak discharges, velocities, and water surface elevations for year 2007
conditions when compared to year 2000. However, the calibration runs showed an
underestimation of peak discharge and discharge volume for all simulations, leading to
concerns regarding the use of a composited CN. Use of a weighed runoff scenario should be
considered rather than a composited CN and it should be used in conjunction with a variable
initial abstraction ratio as proposed by Jiang (2001).
Modeled results should always be validated with field data, if possible, to verify their
accuracy and precision. If the results are not accurate, new input data should be considered,
or an alternative modeling approach or software should be evaluated before predictions
impacting future development are made. Following the calibration runs, it became apparent
that HEC-HMS, when applied with composite CNs, under-estimated peak discharge and
discharge volume for all three calibration simulations. As was discussed, the model predicted
an average of 42 percent the peak discharge in upper Pajarito Canyon and 24 percent of the
total volume discharge for three calibration events. For the same calibration events it
predicted 37 percent of the peak discharge and 18 percent of the volume discharge within
Twomile Canyon. The most encouraging results were from station E244 for the August 27,
2007 event where the model was able to predict 91 percent of the discharge volume. The
model was not able to replicate this accuracy for any of the other calibration storms, thus
demonstrating poor accuracy and precision. While more accurate results were obtained
through modification of the input parameters, the decision was made to use field data rather
than input values that could not be validated. Also evident was the fact that not all hydrologic

48
properties of the watershed were accounted for, including antecedent soil moisture
conditions. In the design storm simulation it was expected that the calculated runoff may be
less than what would occur from an actual storm of equal magnitude.
Incorporating spatial variability into the NRCS runoff equation can lead to clear biases
between the spatial and lumped results. The model did not weigh runoff because it relied on a
composite CN to represent each sub-basin. It was not clear if using smaller sub-basins would
aid with differentiating the drainage areas and improve runoff calculations. Simulations made
with station E243.5 showed potential for HEC-HMS to accurately represent runoff in terms
of peak discharge and discharge volume. The urbanized characteristics of the drainage to
E243.5 likely assisted the model’s response, however. TA-3 lacks the complex hydrologic
characteristics that are present in much of Pajarito Canyon.
The location of the TA-06 precipitation station precluded use of exact localized precipitation
data for the HEC-HMS calibration for Twomile and upper Pajarito Canyons. Given the high
degree of spatial variability of precipitation, it was not possible to represent local
precipitation patterns accurately without additional precipitation monitoring station data.
While the data was not available for this study, the recent implementation of Thiessen
polygon method has helped correct this with an expanded number of stations.
The data intensiveness of HEC-HMS leaves room for interpretation in the parameters in the
model used. There also was no capacity to model specific spatial attributes of a watershed
(i.e., impervious areas) within HEC-HMS without using smaller sub-basins. If smaller sub-
basins were used, their behavior still may not be accurately quantified.
Input parameter variations also arose from complex terrain and associated ephemeral streams,
especially under adverse conditions such as those resulting from a burn. Modeling of
precipitation runoff over the steep, narrow extent of Pajarito Canyon was not effective and
would not be possible without detailed information associated with precipitation, ground
cover, CNs, and soil.
The complex hydrologic characteristics of Pajarito Canyon may not be represented accurately
when the methods from this study are used. The complex and steep canyons complicate the

49
representation of the watershed with weighted CNs. Not all parts of Pajarito Canyon behave
in a hydrologically consistent manner. Using average slopes and composite CNs may lead to
inaccurate results which were visible in the model in this study. Since the CN method was
developed in small agricultural watersheds in the northeast and it’s applicability in a
composited form may be limited in the southwest. Intense data requirements precluded quick
and accurate analysis of runoff, thus limiting the applicability of the model for small scale
studies where results could be required within a short timeframe. Furthermore, the
application of HEC-HMS limits the modeler’s ability to represent weighted runoff and
variable initial abstraction ratios. For these reasons it is not recommended to use HEC-HMS
for making runoff calculations and stormwater management decisions in Pajarito Canyon.
9.0 Future Work
Further investigation for this project should include demonstrating different calculation
techniques with the intent of demonstrating how weighting runoff rather than CNs alters
calculated flow. Future work could also include expanding the sub-basins within ArcMap to
account for contributing areas not included within the predefined watershed area. Developed
areas along Pajarito Road have diverted stormwater runoff into Pajarito Canyon. These
additional drainage areas add to the watershed’s area, and because they are largely
impervious, they contribute increased discharge volume and potentially increase runoff
velocity. Aside from station E243.5, which is gaged, the overall contributions of these areas
to Pajarito Canyon are not completely quantified.
Another area of interest for future research could include developing a runoff model that
captures more accurately the hydrologic characteristics of Pajarito Canyon. This may require
the use of GIS and finite element modeling capabilities to model small sub-basins to generate
more representative results. An additional factor to consider would be to represent hydrologic
factors not depicted in this study including the effect of down timber and BMPs on runoff.
The results of this exercise could be used to analyze potential stormwater runoff from
proposed construction sites to assist LANL managers and contractors with stormwater
management. By improving the understanding of localized rainfall- runoff relationships
planning appropriate management techniques can be achieved with greater success.

50
10.0 Literature Cited
Bonnin, G.M., Martin, D., Lin, B., Parzybok, T., Yekta, M., and Riley, D. 2006. Point
Precipitation Frequency Estimates from NOAA Atlas 14, Los Alamos, New Mexico. Available at: http://dipper.nws.noaa.gov/hdsc/pfds/. Accessed on: September 4, 2008.
Buckley, K.J., Walterscheid, J.C., Loftin, S.R., Kuyumjian, G.A., 2005. Results of Five
Years of Monitoring Post-Fire Rehabilitation Activities at Los Alamos National Laboratory. LA-UR-06-0904.
Grove, M., Harbor, J., Engel, B. 1998. Composite vs. Distributed Curve Numbers: Effects on Estimates of Storm Runoff Depths. Journal of The American Water Resources Association. Vol. 34. No. 6. 1015-1023.
Jiang, R. 2001. Investigation of Runoff Curve Number Initial Abstraction Ratio. MS thesis, Watershed Management, University of Arizona, 120 pp.
Los Alamos National Laboratory. 2006. Environmental Surveillance at Los Alamos during 2006. Los Alamos National Laboratory. LA-14341.
McLin, S., van Eeckhout, M.E., Earles, A. 2001. Mapping 100-Year Floodplain Boundaries Following the Cerro Grande Wildfire. LA-UR-01-5218.
Moglen, G.E., 2000. Effect of Orientation of Spatially Distributed Curve Numbers in Runoff Calculations. Journal of The American Water Resources Association. Vol. 36, No. 6. 1391- 1400
Reneau, S.L., Kuyumjian, G.A., Malmon, D.V., and Tardiff, M.F., 2003. Precipitation- Frequency Relations on the Pajarito Plateau and in the Eastern Jemez Mountains, New Mexico, and Examples of Extreme or Flood-Producing Storms. Los Alamos National Laboratory Report LA-UR-03-6484.
Romero, R.P., Ortiz, D., and Kuyumjian, G., 2006. Surface Water Data at Los Alamos National Laboratory. LA-14328-PR.
Natural Resources Conservation Service, 1985. National Engineering Handbook, Supplement A, Section 4, Chapter 10, Hydrology. U.S. Department of Agriculture, Washington, D.C.
Natural Resources Conservation Service, 1986. Urban Hydrology for Small Watersheds.
Technical Release 55, Washington, D.C. Steenhuis, T. S., M. Winchell, J. Rossing, J. A. Zollweg, and M. F. Walter, 1995. SCS
Runoff Equation Revisited for Variable-Source Runoff Areas. Journal of Irrigation and Drainage Engineering, ASCE 121(3):234-238.

51
U.S. Army Corps of Engineers (USACE). 2006. HEC-HMS Hydrologic Modeling System, User’s Manual for Version 3.1.0 CPD-74A, Hydrologic Engineering Center: Davis, CA.
U.S. Army Corps of Engineers (USACE). 2006. HEC-HMS Hydrologic Modeling System, Technical Reference Manual CPD-74B, Hydrologic Engineering Center: Davis, CA.
U.S. Department of Agriculture (USDA) NRCS Web Soil Survey. Available at: http://websoilsurvey.nrcs.usda.gov/app. Accessed on 8/27/08.
Wright Water Engineers, 2003. Final Report and Documentation of Hydrologic and Hydraulic Modeling for Defining 2, 25, and 100 Year Floodplains at LANL. LA-UR 03-8322.
Wright Water Engineers, 2003. Compilation of Technical Research - Part 1: A Curve Number Approach to Evaluation of Post-Fire Sub-basin Recovery Following the Cerro Grande Fire, Los Alamos, New Mexico, Part 2: Post-Burn Assessment of Hydrologic Conditions and Forest Recovery at the Three-Year Anniversary of the Cerro Grande Forest Fire.

52
Appendix A. Cerro Grande Fire Burn Intensities (from Buckley et al. 2005)

53
Appendix B. Cerro Grande Fire BART units (BART units for the Cerro Grande Fire rehabilitation from Buckley et al. 2005).

54
Appendix C: BART Unit 2 Photographs. BART Unit 2 Photo 1 taken in July,2000 (from Buckley et al. 2005). All photographs were taken from the same photo point with the first photo from 2000 and ranging through 2007.
BART Unit 2, 2000

55
BART Unit 2, 2001
BART Unit 2, 2003

56
BART Unit 2, 2005
BART Unit 2, 2007

57
Appendix D. Vegetation and watershed photographs. Vegetation and watershed photographs of BART units analyzed for vegetative cover and hydrologic modeling.
BART Unit 2, 2007.
BART Unit 6 – Channel Bottom, 2007.

58
Upper reaches of BART Unit 6, 2007.
BART Unit 6, 2007.

59
BART Unit 34, 2007.
BART Unit 34, 2007.

60
Appendix E. Gaging Station Information. Gaging Stations in Pajarito Canyon used for model calibration from 2006 Surface Water Data at Los Alamos National Laboratory (Romero, Ortiz, and Kuyumjian, 2006).
E243 Pajarito above Twomile (used for calibrating upper Pajarito Canyon)
Sutron data logger (5 min. interval) with cellular phone and speech modem housed in a NEMA shelter on left bank. Bubble gage is sensing device and outside staff is reference gage. An ISCO-brand automatic sampler is stage-triggered by the data logger. Porcelain staff gage was available for outside reference until August 24. A steel post was installed 9/1/06 on left bank to existing datum and was used as a reference point of 2.56 gage until gage reconstruction was accomplished in April 2006. No provision for direct measurement of flows above wading stage.
Field Work. The station was visited twenty five times in 2006 for the purpose of making a discharge measurement and/or servicing the instrumentation. Field inspections for the gage are available on request.
Datum Correction. None from levels. On September 1 at same site, a datum correction of 1.0 ft lower due to the scour in channel after the flood of August 24, 2005.
Gage-Height Record. The data logger gage height record was complete and satisfactory for the water year.
Rating. The channel is straight for 150 feet above and below the gage. It is trapezoidal with the bed fairly well armored with large gravel and some cobbles. Banks are fairly well vegetated with grasses and should remain stable at all flows. Once it is well developed, the rating should be stable.
Rating 3 was redrawn based on low measurements and slope area of flood in 2005. Rating “back out” to left at top, but that is hydraulically most likely the case. Because rating 3 was never used for high flows, some of the upper points were just edited.
Discharge. Computed rating 3 with shift at low flow applied by “V” diagrams. Estimated zero flow in winter from icing of bubbler orifice. Stream was frozen dry.
Remarks This station was originally at a site downstream about 0.5 mile. With the building of the Pajarito Flood Control Structure it had to be moved. That site was never rated and although gage height record is available for 1998-2002. Record good, except for estimated daily discharges which are poor.

61
E244 - Twomile above Pajarito (used for calibrating Twomile Canyon)
Equipment. Sutron 8210 data logger (5 min. interval) with cellular phone and speech modem housed in a NEMA shelter. Stage sensor is milltronics sonic probe. ISCO samplers are housed in a separate shelter and are activated by stage through the data logger. An outside staff gage is available for reference. Wading measurements can be in the vicinity of the gage. No provision for measurement above wading stages.
Field Work. The station was visited twenty five times in 2006 for the purpose of making a discharge measurement and/or servicing the instrumentation. Field inspections for the gage are available upon request.
Datum Correction. None from levels. Some corrections applied as datums, but they are actually “pen” corrections. Gage reset by levels after destruction by flood in August 2006.
Rating. The channel at the gage is straight for about 150 feet above gage and 50 feet below gage. Channel expands quite a bit below gage. Bed material is coarse sand and gravel. Banks are grassy with some small trees and outcrops affecting roughness at higher flows.
Rating 1 was continued in use with large -.45 shift at extreme los flows. Measurements 10, 11 defined the shifts. Shift diagrams distributed them by time/stage and no shift was used above 10 cfs.
Peak of record occurred on August 25, 2006 confirmed b flood mark. Rating 1 was extended by log plotting to 6.5 ft. stage.
Rating No. 1 is good to fair.
Discharge. Discharge was computed by applying Rating No. 1 using variable shift diagrams. Some periods have large shifts on lower end because of dry condition varying the PZF. Periods of lost record were estimated using weather records and comparison with E243 which is just downstream on Pajarito Canyon.
Remarks. Records fair, except for estimated daily discharges, which are poor. This station was operated at a site 200 feet downstream but never rated. It had to be moved because that site is backwater from Pajarito Flood Control structure which was built in 2000 just after the Cerro Grande Fire.

62
Appendix F. Design Storm Distribution. Precipitation intensity distribution for the design storm in each of the sub-basins for Pajarito Canyon from McLin (2001).
Time Distribution Time Distribution 12:00:00 PM 0 3:05:00 PM 0.824356 12:05:00 PM 0.001612 3:10:00 PM 0.854579 12:10:00 PM 0.003267 3:15:00 PM 0.873203 12:15:00 PM 0.004968 3:20:00 PM 0.886734 12:20:00 PM 0.006716 3:25:00 PM 0.897403 12:25:00 PM 0.008515 3:30:00 PM 0.906237 12:30:00 PM 0.010369 3:35:00 PM 0.913792 12:35:00 PM 0.01228 3:40:00 PM 0.920401 12:40:00 PM 0.014253 3:45:00 PM 0.926285 12:45:00 PM 0.016292 3:50:00 PM 0.931592 12:50:00 PM 0.018403 3:55:00 PM 0.93643 12:55:00 PM 0.020589 4:00:00 PM 0.940878 1:00:00 PM 0.022859 4:05:00 PM 0.944998 1:05:00 PM 0.025218 4:10:00 PM 0.948836 1:10:00 PM 0.027674 4:15:00 PM 0.95243 1:15:00 PM 0.030236 4:20:00 PM 0.955812 1:20:00 PM 0.032915 4:25:00 PM 0.959005 1:25:00 PM 0.035722 4:30:00 PM 0.962031 1:30:00 PM 0.038671 4:35:00 PM 0.964907 1:35:00 PM 0.041779 4:40:00 PM 0.967649 1:40:00 PM 0.045063 4:45:00 PM 0.970268 1:45:00 PM 0.048548 4:50:00 PM 0.972776 1:50:00 PM 0.05226 4:55:00 PM 0.975183 1:55:00 PM 0.056233 5:00:00 PM 0.977496 2:00:00 PM 0.06051 5:05:00 PM 0.979723 2:05:00 PM 0.065145 5:10:00 PM 0.981871 2:10:00 PM 0.070206 5:15:00 PM 0.983945 2:15:00 PM 0.075786 5:20:00 PM 0.985951 2:20:00 PM 0.08201 5:25:00 PM 0.987892 2:25:00 PM 0.089059 5:30:00 PM 0.989774 2:30:00 PM 0.097201 5:35:00 PM 0.9916 2:35:00 PM 0.106863 5:40:00 PM 0.993374 2:40:00 PM 0.118788 5:45:00 PM 0.995098 2:45:00 PM 0.134449 5:50:00 PM 0.996775 2:50:00 PM 0.15747 5:55:00 PM 0.998408 2:55:00 PM 0.201581 6:00:00 PM 1 3:00:00 PM 0.742916

63
Appendix G. Soil Types in Pajarito Canyon. Soil types found in Pajarito Canyon expressed as a percentage. Complete soil survey data was not available for Sub-basin 1, and therefore Sub-basin 2 data was used.
Soil Type Sub-basin
2 Sub-basin
3A Sub-basin
3B Sub-basin
4 Sub-basin
5 Sub-basin
6 Sub-basin
7 Rock outcrop 22 16 35 38 49 11.8 3 Carjo loam, 1 to 9 percent slopes 43 12 25 18 Tocal very fine sandy loam, 3 to 8 percent slopes 23 50 29 Mirand-Alanos complex, 5 to 40 percent slopes 8 22 Cajete-Cypher association, 8 to 50 percent slopes 3 Hackroy-Nyjack association, 1 to 5 percent slopes 1 6 27 6 31.0 Totavi loamy sand, 0 to 5 percent slopes 1 24 8 30.5 Rock outcrop-Hackroy complex, 1 to 8 percent slopes 3 11 19 26.5 Rock outcrop-Prieta complex, 3 to 15 percent slopes 0.1 89 Penistaja-Hagerman association, 1 to 5 percent slopes 8

64
Appendix H. 8/29-8/30/2007 Pajarito Canyon stream gage data. Discharge data was used for model calibration.
Date Time
Station E243
Discharge (cfs)
Station E243.5
Discharge (cfs)
Station E244
Discharge (cfs)
8/29/2007 12:00 0.03 0 0 8/29/2007 12:05 0.03 0 0 8/29/2007 12:10 0.03 0 0 8/29/2007 12:15 0.03 0 0 8/29/2007 12:20 0.03 0 0 8/29/2007 12:25 0.03 0 0 8/29/2007 12:30 0.03 0 0 8/29/2007 12:35 0.03 0 0 8/29/2007 12:40 0.03 0 0 8/29/2007 12:45 0.03 0 0 8/29/2007 12:50 0.03 0 0 8/29/2007 12:55 0.03 0 0 8/29/2007 13:00 0.03 0 0 8/29/2007 13:05 0.03 0 0 8/29/2007 13:10 0.03 0 0 8/29/2007 13:15 0.03 0 0 8/29/2007 13:20 0.03 0 0 8/29/2007 13:25 0.03 0 0 8/29/2007 13:30 0.03 0 0 8/29/2007 13:35 0.03 0 0 8/29/2007 13:40 0.03 0 0 8/29/2007 13:45 0.03 1.06 0 8/29/2007 13:50 0.03 3.12 0 8/29/2007 13:55 0.03 3.85 0 8/29/2007 14:00 0.04 5.84 0 8/29/2007 14:05 0.05 10 0 8/29/2007 14:10 0.05 10.77 0 8/29/2007 14:15 0.05 9.06 0 8/29/2007 14:20 0.05 6.46 0.04 8/29/2007 14:25 0.05 3.33 1.06

65
8/29/2007 14:30 0.04 1.89 5.3 8/29/2007 14:35 0.04 1.59 10.9 8/29/2007 14:40 0.04 1.61 13.75 8/29/2007 14:45 0.04 1.46 14.11 8/29/2007 14:50 0.04 1.23 18.63 8/29/2007 14:55 0.04 1.12 26.82 8/29/2007 15:00 0.04 0.94 32.01 8/29/2007 15:05 0.03 0.66 32.82 8/29/2007 15:10 8.7 0.45 30.78 8/29/2007 15:15 66.51 0.3 28.6 8/29/2007 15:20 108.69 0.2 26.69 8/29/2007 15:25 100.87 0.12 25.21 8/29/2007 15:30 86.55 0.07 23.8 8/29/2007 15:35 61.68 0.04 23.27 8/29/2007 15:40 48.47 0.02 24.32 8/29/2007 15:45 43.06 0.01 24.85 8/29/2007 15:50 37.06 0 25.4 8/29/2007 15:55 32.86 0 25.04 8/29/2007 16:00 29.57 0 22.77 8/29/2007 16:05 25.56 0 20.93 8/29/2007 16:10 21.56 0 19.05 8/29/2007 16:15 18.73 0 16.28 8/29/2007 16:20 16.77 0 13.3 8/29/2007 16:25 15.56 0 10.59 8/29/2007 16:30 13.89 0 9.22 8/29/2007 16:35 12.83 0 8.56 8/29/2007 16:40 12.57 0 8.86 8/29/2007 16:45 11.62 0 9.14 8/29/2007 16:50 10.93 0 8.64 8/29/2007 16:55 10.7 0 7.84 8/29/2007 17:00 9.66 0 6.03 8/29/2007 17:05 8.65 0 4.6 8/29/2007 17:10 8.1 0 4.15 8/29/2007 17:15 7.74 0 3.87 8/29/2007 17:20 7.24 0 3.47 8/29/2007 17:25 6.58 0 3.11 8/29/2007 17:30 6.13 0 2.58

66
8/29/2007 17:35 5.99 0 2.21 8/29/2007 17:40 5.85 0 2.05 8/29/2007 17:45 5.44 0 1.83 8/29/2007 17:50 5.04 0 1.51 8/29/2007 17:55 4.79 0 1.38 8/29/2007 18:00 4.44 0 1.29 8/29/2007 18:05 4.09 0 1.14 8/29/2007 18:10 3.98 0 1.03 8/29/2007 18:15 3.67 0 0.95 8/29/2007 18:20 3.38 0 0.86 8/29/2007 18:25 3.19 0 0.82 8/29/2007 18:30 3.1 0 0.8 8/29/2007 18:35 2.93 0 0.76 8/29/2007 18:40 2.68 0 0.69 8/29/2007 18:45 2.68 0 0.59 8/29/2007 18:50 2.61 0 0.56 8/29/2007 18:55 2.45 0 0.54 8/29/2007 19:00 2.38 0 0.52 8/29/2007 19:05 2.38 0 0.47 8/29/2007 19:10 2.3 0 0.39 8/29/2007 19:15 2.09 0 0.35 8/29/2007 19:20 2.03 0 0.34 8/29/2007 19:25 1.97 0 0.33 8/29/2007 19:30 1.91 0 0.3 8/29/2007 19:35 1.85 0.39 0.3 8/29/2007 19:40 1.73 0.65 0.27 8/29/2007 19:45 1.67 0.39 0.25 8/29/2007 19:50 1.61 0.22 0.28 8/29/2007 19:55 1.5 0.12 0.28 8/29/2007 20:00 1.46 0.07 0.26 8/29/2007 20:05 1.41 0.04 0.26 8/29/2007 20:10 1.36 0.02 0.26 8/29/2007 20:15 1.32 0.01 0.24 8/29/2007 20:20 1.32 0 0.22 8/29/2007 20:25 1.27 0 0.21 8/29/2007 20:30 1.17 0 0.21 8/29/2007 20:35 1.17 0 0.21
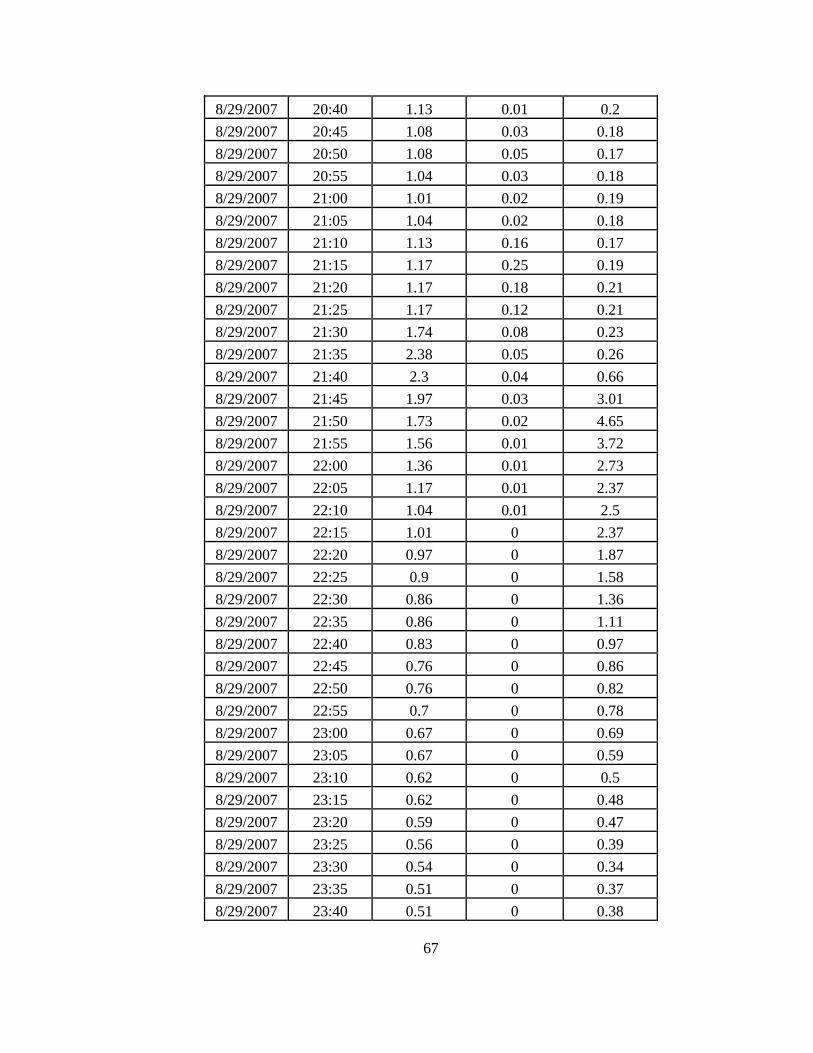
67
8/29/2007 20:40 1.13 0.01 0.2 8/29/2007 20:45 1.08 0.03 0.18 8/29/2007 20:50 1.08 0.05 0.17 8/29/2007 20:55 1.04 0.03 0.18 8/29/2007 21:00 1.01 0.02 0.19 8/29/2007 21:05 1.04 0.02 0.18 8/29/2007 21:10 1.13 0.16 0.17 8/29/2007 21:15 1.17 0.25 0.19 8/29/2007 21:20 1.17 0.18 0.21 8/29/2007 21:25 1.17 0.12 0.21 8/29/2007 21:30 1.74 0.08 0.23 8/29/2007 21:35 2.38 0.05 0.26 8/29/2007 21:40 2.3 0.04 0.66 8/29/2007 21:45 1.97 0.03 3.01 8/29/2007 21:50 1.73 0.02 4.65 8/29/2007 21:55 1.56 0.01 3.72 8/29/2007 22:00 1.36 0.01 2.73 8/29/2007 22:05 1.17 0.01 2.37 8/29/2007 22:10 1.04 0.01 2.5 8/29/2007 22:15 1.01 0 2.37 8/29/2007 22:20 0.97 0 1.87 8/29/2007 22:25 0.9 0 1.58 8/29/2007 22:30 0.86 0 1.36 8/29/2007 22:35 0.86 0 1.11 8/29/2007 22:40 0.83 0 0.97 8/29/2007 22:45 0.76 0 0.86 8/29/2007 22:50 0.76 0 0.82 8/29/2007 22:55 0.7 0 0.78 8/29/2007 23:00 0.67 0 0.69 8/29/2007 23:05 0.67 0 0.59 8/29/2007 23:10 0.62 0 0.5 8/29/2007 23:15 0.62 0 0.48 8/29/2007 23:20 0.59 0 0.47 8/29/2007 23:25 0.56 0 0.39 8/29/2007 23:30 0.54 0 0.34 8/29/2007 23:35 0.51 0 0.37 8/29/2007 23:40 0.51 0 0.38

68
8/29/2007 23:45 0.51 0 0.34 8/29/2007 23:50 0.51 0 0.32 8/29/2007 23:55 0.51 0 0.3 8/30/2007 0:00 0.49 0 0.28 8/30/2007 0:05 0.49 0 0.26 8/30/2007 0:10 0.49 0 0.25 8/30/2007 0:15 0.46 0 0.26 8/30/2007 0:20 0.46 0 0.26 8/30/2007 0:25 0.46 0 0.24 8/30/2007 0:30 0.46 0 0.24 8/30/2007 0:35 0.46 0 0.24 8/30/2007 0:40 0.46 0 0.22 8/30/2007 0:45 0.46 0 0.21 8/30/2007 0:50 0.49 0 0.2 8/30/2007 0:55 0.49 0 0.2 8/30/2007 1:00 0.46 0 0.2 8/30/2007 1:05 0.44 0 0.18 8/30/2007 1:10 0.42 0 0.18 8/30/2007 1:15 0.44 0 0.18 8/30/2007 1:20 0.44 0 0.16 8/30/2007 1:25 0.42 0 0.16 8/30/2007 1:30 0.44 0 0.16 8/30/2007 1:35 0.44 0 0.16 8/30/2007 1:40 0.41 0 0.16 8/30/2007 1:45 0.39 0 0.16 8/30/2007 1:50 0.41 0 0.16 8/30/2007 1:55 0.41 0 0.16 8/30/2007 2:00 0.39 0 0.16 8/30/2007 2:05 0.39 0 0.16 8/30/2007 2:10 0.39 0 0.16 8/30/2007 2:15 0.39 0 0.16 8/30/2007 2:20 0.37 0 0.16 8/30/2007 2:25 0.35 0 0.16 8/30/2007 2:30 0.37 0 0.15 8/30/2007 2:35 0.37 0 0.14 8/30/2007 2:40 0.37 0 0.14 8/30/2007 2:45 0.37 0 0.14
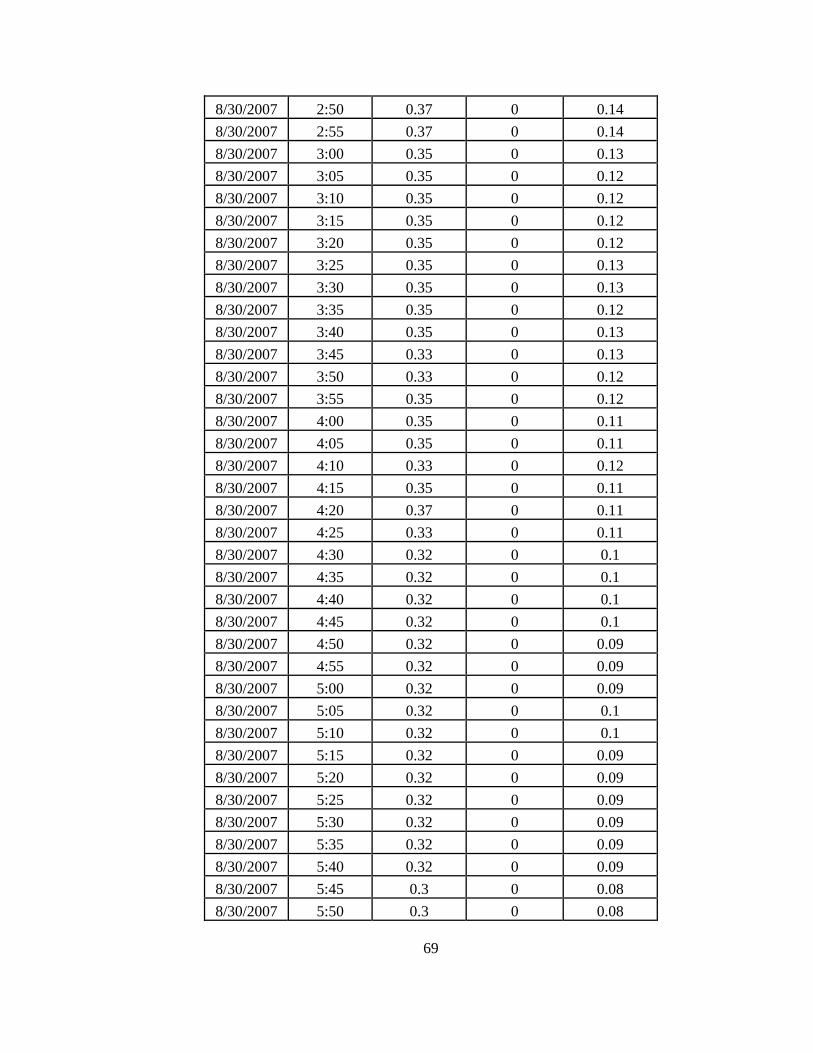
69
8/30/2007 2:50 0.37 0 0.14 8/30/2007 2:55 0.37 0 0.14 8/30/2007 3:00 0.35 0 0.13 8/30/2007 3:05 0.35 0 0.12 8/30/2007 3:10 0.35 0 0.12 8/30/2007 3:15 0.35 0 0.12 8/30/2007 3:20 0.35 0 0.12 8/30/2007 3:25 0.35 0 0.13 8/30/2007 3:30 0.35 0 0.13 8/30/2007 3:35 0.35 0 0.12 8/30/2007 3:40 0.35 0 0.13 8/30/2007 3:45 0.33 0 0.13 8/30/2007 3:50 0.33 0 0.12 8/30/2007 3:55 0.35 0 0.12 8/30/2007 4:00 0.35 0 0.11 8/30/2007 4:05 0.35 0 0.11 8/30/2007 4:10 0.33 0 0.12 8/30/2007 4:15 0.35 0 0.11 8/30/2007 4:20 0.37 0 0.11 8/30/2007 4:25 0.33 0 0.11 8/30/2007 4:30 0.32 0 0.1 8/30/2007 4:35 0.32 0 0.1 8/30/2007 4:40 0.32 0 0.1 8/30/2007 4:45 0.32 0 0.1 8/30/2007 4:50 0.32 0 0.09 8/30/2007 4:55 0.32 0 0.09 8/30/2007 5:00 0.32 0 0.09 8/30/2007 5:05 0.32 0 0.1 8/30/2007 5:10 0.32 0 0.1 8/30/2007 5:15 0.32 0 0.09 8/30/2007 5:20 0.32 0 0.09 8/30/2007 5:25 0.32 0 0.09 8/30/2007 5:30 0.32 0 0.09 8/30/2007 5:35 0.32 0 0.09 8/30/2007 5:40 0.32 0 0.09 8/30/2007 5:45 0.3 0 0.08 8/30/2007 5:50 0.3 0 0.08

70
8/30/2007 5:55 0.32 0 0.08 8/30/2007 6:00 0.3 0 0.08 8/30/2007 6:05 0.3 0 0.09 8/30/2007 6:10 0.32 0 0.09 8/30/2007 6:15 0.32 0 0.09 8/30/2007 6:20 0.32 0 0.09 8/30/2007 6:25 0.32 0 0.09 8/30/2007 6:30 0.3 0 0.09 8/30/2007 6:35 0.28 0 0.08 8/30/2007 6:40 0.28 0 0.08 8/30/2007 6:45 0.3 0 0.08 8/30/2007 6:50 0.32 0 0.07 8/30/2007 6:55 0.3 0 0.07 8/30/2007 7:00 0.28 0 0.07 8/30/2007 7:05 0.28 0 0.08 8/30/2007 7:10 0.28 0 0.09 8/30/2007 7:15 0.28 0 0.08 8/30/2007 7:20 0.3 0 0.07 8/30/2007 7:25 0.3 0 0.08 8/30/2007 7:30 0.28 0 0.09 8/30/2007 7:35 0.28 0 0.09 8/30/2007 7:40 0.3 0 0.09 8/30/2007 7:45 0.3 0 0.1 8/30/2007 7:50 0.28 0 0.1 8/30/2007 7:55 0.28 0 0.1 8/30/2007 8:00 0.3 0 0.1 8/30/2007 8:05 0.3 0 0.1 8/30/2007 8:10 0.28 0 0.1 8/30/2007 8:15 0.28 0 0.11 8/30/2007 8:20 0.28 0 0.11 8/30/2007 8:25 0.3 0 0.1 8/30/2007 8:30 0.3 0 0.1 8/30/2007 8:35 0.27 0 0.1 8/30/2007 8:40 0.27 0 0.08 8/30/2007 8:45 0.28 0 0.07 8/30/2007 8:50 0.27 0 0.08 8/30/2007 8:55 0.28 0 0.09

71
8/30/2007 9:00 0.3 0 0.08 8/30/2007 9:05 0.27 0 0.08 8/30/2007 9:10 0.3 0 0.08 8/30/2007 9:15 0.32 0 0.07 8/30/2007 9:20 0.3 0 0.07 8/30/2007 9:25 0.28 0 0.07 8/30/2007 9:30 0.27 0 0.07 8/30/2007 9:35 0.27 0 0.08 8/30/2007 9:40 0.27 0 0.04 8/30/2007 9:45 0.27 0 0.02 8/30/2007 9:50 0.27 0 0.05 8/30/2007 9:55 0.28 0 0.06 8/30/2007 10:00 0.3 0 0.05 8/30/2007 10:05 0.3 0 0.05 8/30/2007 10:10 0.27 0 0.06 8/30/2007 10:15 0.27 0 0.05 8/30/2007 10:20 0.27 0 0.04 8/30/2007 10:25 0.27 0 0.04 8/30/2007 10:30 0.28 0 0.03 8/30/2007 10:35 0.27 0 0.02 8/30/2007 10:40 0.25 0 0.03 8/30/2007 10:45 0.25 0 0.04 8/30/2007 10:50 0.25 0 0.03 8/30/2007 10:55 0.25 0 0.01 8/30/2007 11:00 0.24 0 0 8/30/2007 11:05 0.24 0 0 8/30/2007 11:10 0.25 0 0 8/30/2007 11:15 0.25 0 0 8/30/2007 11:20 0.25 0 0 8/30/2007 11:25 0.25 0 0 8/30/2007 11:30 0.24 0 0 8/30/2007 11:35 0.23 0 0 8/30/2007 11:40 0.23 0 0 8/30/2007 11:45 0.23 0 0 8/30/2007 11:50 0.24 0 0 8/30/2007 11:55 0.25 0 0 8/30/2007 12:00 0.24 0 0

72
Appendix I. 8/29/2007 TA-06 precipitation data. Precipitation data was used for model calibration.
Date Time Precipitation
(in.) 8/29/2007 13:45 0.01 8/29/2007 14:00 0.28 8/29/2007 14:15 0.3 8/29/2007 14:30 0.15 8/29/2007 14:45 0.06 8/29/2007 15:00 0.03 8/29/2007 15:15 0 8/29/2007 15:30 0 8/29/2007 15:45 0 8/29/2007 16:00 0 8/29/2007 16:15 0 8/29/2007 16:30 0 8/29/2007 16:45 0 8/29/2007 17:00 0 8/29/2007 17:15 0 8/29/2007 17:30 0 8/29/2007 17:45 0 8/29/2007 18:00 0 8/29/2007 18:15 0 8/29/2007 18:30 0 8/29/2007 18:45 0 8/29/2007 19:00 0 8/29/2007 19:15 0 8/29/2007 19:30 0.02 8/29/2007 19:45 0 8/29/2007 20:00 0 8/29/2007 20:15 0 8/29/2007 20:30 0.01 8/29/2007 20:45 0 8/29/2007 21:00 0 8/29/2007 21:15 0.12 8/29/2007 21:30 0.01

73
Appendix J. 9/28-9/29/2005 Pajarito Canyon stream gage data. Discharge data was used for model calibration.
Date Time
Station E243 Discharge
(cfs)
Station E243.5 Discharge
(cfs)
Station E244 Discharge
(cfs) 9/28/05 0:00 6.3 0 0 9/28/05 0:05 6.3 0 0 9/28/05 0:10 6.3 0 0 9/28/05 0:15 6.38 0 0 9/28/05 0:20 6.38 0 0 9/28/05 0:25 6.38 0 0 9/28/05 0:30 6.38 0 0 9/28/05 0:35 6.3 0 0 9/28/05 0:40 6.3 0 0 9/28/05 0:45 6.3 0 0 9/28/05 0:50 6.3 0 0 9/28/05 0:55 6.3 0 0 9/28/05 1:00 6.22 0 0 9/28/05 1:05 6.22 0 0 9/28/05 1:10 6.3 0 0 9/28/05 1:15 6.3 0 0 9/28/05 1:20 6.3 0 0 9/28/05 1:25 6.3 0 0 9/28/05 1:30 6.3 0 0 9/28/05 1:35 6.3 0 0 9/28/05 1:40 6.3 0 0 9/28/05 1:45 6.3 0 0 9/28/05 1:50 6.3 0 0 9/28/05 1:55 6.3 0 0 9/28/05 2:00 6.38 0 0 9/28/05 2:05 6.38 0 0 9/28/05 2:10 6.3 0 0 9/28/05 2:15 6.3 0 0 9/28/05 2:20 6.3 0 0 9/28/05 2:25 6.3 0 0 9/28/05 2:30 6.3 0 0

74
9/28/05 2:35 6.3 0 0 9/28/05 2:40 6.3 0 0 9/28/05 2:45 6.3 0 0 9/28/05 2:50 6.3 0 0 9/28/05 2:55 6.3 0 0 9/28/05 3:00 6.38 0 0 9/28/05 3:05 6.38 0 0 9/28/05 3:10 6.3 0 0 9/28/05 3:15 6.3 0 0 9/28/05 3:20 6.3 0 0 9/28/05 3:25 6.3 0 0 9/28/05 3:30 6.3 0 0 9/28/05 3:35 6.55 0 0 9/28/05 3:40 6.63 0 0 9/28/05 3:45 6.38 0 0 9/28/05 3:50 6.3 0 0 9/28/05 3:55 6.3 0 0 9/28/05 4:00 6.3 0 0 9/28/05 4:05 6.38 0 0 9/28/05 4:10 6.38 0 0 9/28/05 4:15 6.3 0 0 9/28/05 4:20 6.38 0 0 9/28/05 4:25 6.3 0 0 9/28/05 4:30 6.22 0 0 9/28/05 4:35 6.3 0 0 9/28/05 4:40 6.3 0 0 9/28/05 4:45 6.3 0 0 9/28/05 4:50 6.3 0.005 0 9/28/05 4:55 6.3 0.008 0 9/28/05 5:00 6.3 0.008 0 9/28/05 5:05 6.3 0.003 0 9/28/05 5:10 6.3 0 0 9/28/05 5:15 6.3 0 0 9/28/05 5:20 6.3 0 0 9/28/05 5:25 6.3 0 0 9/28/05 5:30 6.3 0.005 0 9/28/05 5:35 6.3 0.008 0 9/28/05 5:40 6.3 0.003 0

75
9/28/05 5:45 6.38 0 0 9/28/05 5:50 6.47 0 0 9/28/05 5:55 6.38 0 0 9/28/05 6:00 6.3 0 0 9/28/05 6:05 6.3 0 0 9/28/05 6:10 6.3 0 0 9/28/05 6:15 6.3 0 0 9/28/05 6:20 6.38 0 0 9/28/05 6:25 6.38 0 0 9/28/05 6:30 6.3 0 0 9/28/05 6:35 6.3 0 0 9/28/05 6:40 6.3 0 0 9/28/05 6:45 6.3 0 0 9/28/05 6:50 6.3 0 0 9/28/05 6:55 6.22 0 0 9/28/05 7:00 6.22 0 0 9/28/05 7:05 6.3 0 0 9/28/05 7:10 6.3 0 0 9/28/05 7:15 6.3 0 0 9/28/05 7:20 6.3 0 0 9/28/05 7:25 6.3 0 0 9/28/05 7:30 6.3 0 0 9/28/05 7:35 6.3 0 0 9/28/05 7:40 6.3 0 0 9/28/05 7:45 6.38 0 0 9/28/05 7:50 6.38 0 0 9/28/05 7:55 6.3 0 0 9/28/05 8:00 6.3 0 0 9/28/05 8:05 6.3 0 0 9/28/05 8:10 6.3 0 0 9/28/05 8:15 6.3 0 0 9/28/05 8:20 6.3 0 0 9/28/05 8:25 6.3 0 0 9/28/05 8:30 6.3 0 0 9/28/05 8:35 6.3 0 0 9/28/05 8:40 6.3 0 0 9/28/05 8:45 6.3 0 0 9/28/05 8:50 6.3 0 0

76
9/28/05 8:55 6.22 0 0 9/28/05 9:00 6.22 0 0 9/28/05 9:05 6.3 0 0 9/28/05 9:10 6.3 0 0 9/28/05 9:15 6.3 0 0 9/28/05 9:20 6.3 0 0 9/28/05 9:25 6.3 0 0 9/28/05 9:30 6.3 0 0 9/28/05 9:35 6.3 0 0 9/28/05 9:40 6.3 0 0 9/28/05 9:45 6.3 0 0 9/28/05 9:50 6.22 0 0 9/28/05 9:55 6.22 0.009 0 9/28/05 10:00 6.22 0.011 0 9/28/05 10:05 6.22 0.008 0 9/28/05 10:10 6.22 0.008 0 9/28/05 10:15 6.22 0.008 0 9/28/05 10:20 6.3 0.003 0 9/28/05 10:25 6.3 0 0 9/28/05 10:30 6.3 0 0 9/28/05 10:35 6.22 0 0 9/28/05 10:40 6.3 0 0 9/28/05 10:45 6.3 0 0 9/28/05 10:50 6.14 0 0 9/28/05 10:55 6.22 0 0 9/28/05 11:00 6.3 0 0 9/28/05 11:05 6.3 0 0 9/28/05 11:10 6.22 0 0 9/28/05 11:15 6.14 0 0 9/28/05 11:20 6.22 0 0 9/28/05 11:25 6.3 0 0 9/28/05 11:30 6.22 0 0 9/28/05 11:35 6.14 0 0 9/28/05 11:40 6.14 0 0 9/28/05 11:45 6.14 0 0 9/28/05 11:50 6.14 0 0 9/28/05 11:55 6.14 0 0 9/28/05 12:00 6.14 0 0

77
9/28/05 12:05 6.22 0 0 9/28/05 12:10 6.22 0 0 9/28/05 12:15 6.14 0 0 9/28/05 12:20 6.22 0 0 9/28/05 12:25 6.22 0 0 9/28/05 12:30 6.14 0 0 9/28/05 12:35 6.14 0 0 9/28/05 12:40 6.22 0 0 9/28/05 12:45 6.22 0 0 9/28/05 12:50 6.14 0 0 9/28/05 12:55 6.14 0 0 9/28/05 13:00 6.14 0 0 9/28/05 13:05 6.14 0 0 9/28/05 13:10 6.14 0 0 9/28/05 13:15 6.14 0 0 9/28/05 13:20 6.14 0 0 9/28/05 13:25 6.14 0 0 9/28/05 13:30 6.06 0 0 9/28/05 13:35 5.98 0 0 9/28/05 13:40 6.06 0 0 9/28/05 13:45 6.14 0 0.02 9/28/05 13:50 6.22 0 0.03 9/28/05 13:55 6.22 0 0.05 9/28/05 14:00 6.06 0 0.06 9/28/05 14:05 5.98 0 0.07 9/28/05 14:10 6.06 0 0.07 9/28/05 14:15 6.14 0 0.08 9/28/05 14:20 6.06 0 0.08 9/28/05 14:25 6.06 0 0.09 9/28/05 14:30 6.06 0 0.09 9/28/05 14:35 6.06 0 0.09 9/28/05 14:40 6.14 0 0.1 9/28/05 14:45 6.14 0 0.1 9/28/05 14:50 6.22 0 0.1 9/28/05 14:55 6.22 0 0.11 9/28/05 15:00 6.14 0 0.11 9/28/05 15:05 6.14 0 0.12 9/28/05 15:10 6.14 0 0.13

78
9/28/05 15:15 6.14 0 0.13 9/28/05 15:20 6.22 0 0.14 9/28/05 15:25 6.3 0 0.15 9/28/05 15:30 6.22 0 0.16 9/28/05 15:35 6.14 0 0.17 9/28/05 15:40 6.14 0 0.17 9/28/05 15:45 6.14 0 0.18 9/28/05 15:50 6.22 0 0.2 9/28/05 15:55 6.3 0 0.22 9/28/05 16:00 6.55 0 0.23 9/28/05 16:05 6.63 0 0.23 9/28/05 16:10 6.73 0 0.24 9/28/05 16:15 7.08 0 0.25 9/28/05 16:20 8.09 0 0.27 9/28/05 16:25 9.01 0 0.33 9/28/05 16:30 9.01 0 0.39 9/28/05 16:35 9.01 0 0.58 9/28/05 16:40 8.9 0 0.8 9/28/05 16:45 8.59 0 3.9 9/28/05 16:50 8.28 0 10.98 9/28/05 16:55 8.07 0 14.87 9/28/05 17:00 7.87 0 13.19 9/28/05 17:05 7.77 0 9.73 9/28/05 17:10 7.57 0 11.28 9/28/05 17:15 7.37 0 18 9/28/05 17:20 7.37 0 20.61 9/28/05 17:25 7.28 0 18.6 9/28/05 17:30 7.18 0 15.13 9/28/05 17:35 7.18 0 12.1 9/28/05 17:40 21.45 0 11.19 9/28/05 17:45 34.87 0 9.5 9/28/05 17:50 33.83 0 7.47 9/28/05 17:55 33.01 0 6.71 9/28/05 18:00 31.98 0 5.92 9/28/05 18:05 31.35 0 5.32 9/28/05 18:10 30.5 0 5.1 9/28/05 18:15 29.45 0 4.48 9/28/05 18:20 28.82 0 3.69

79
9/28/05 18:25 28.21 0 3.47 9/28/05 18:30 27.4 0 3.47 9/28/05 18:35 26.8 0 3.16 9/28/05 18:40 26.6 0 2.85 9/28/05 18:45 26.01 0 2.72 9/28/05 18:50 25.23 0 2.62 9/28/05 18:55 24.85 0 2.62 9/28/05 19:00 24.47 0 2.41 9/28/05 19:05 24.28 0 2.29 9/28/05 19:10 23.9 0 2.21 9/28/05 19:15 23.53 0 2.29 9/28/05 19:20 23.16 0 2.63 9/28/05 19:25 22.61 0 2.76 9/28/05 19:30 22.61 0 2.62 9/28/05 19:35 22.43 0 2.72 9/28/05 19:40 22.07 0 2.85 9/28/05 19:45 21.89 0 2.8 9/28/05 19:50 21.53 0 3 9/28/05 19:55 20.83 0 4.15 9/28/05 20:00 20.3 0 5.24 9/28/05 20:05 20.48 0 5.18 9/28/05 20:10 20.48 0 4.97 9/28/05 20:15 20.3 0 5.03 9/28/05 20:20 20.83 0 5.1 9/28/05 20:25 21.89 0 5.1 9/28/05 20:30 22.98 0 5.24 9/28/05 20:35 23.53 0 5.39 9/28/05 20:40 23.53 0 5.11 9/28/05 20:45 23.72 0 4.71 9/28/05 20:50 23.9 0 4.52 9/28/05 20:55 24.09 0 4.22 9/28/05 21:00 24.47 0 3.75 9/28/05 21:05 24.47 0 3.58 9/28/05 21:10 24.28 0 3.52 9/28/05 21:15 24.47 0 3.64 9/28/05 21:20 24.47 0 3.75 9/28/05 21:25 24.09 0 3.63 9/28/05 21:30 23.72 0 3.58

80
9/28/05 21:35 23.34 0.104 3.47 9/28/05 21:40 23.16 0.263 3.52 9/28/05 21:45 23.16 0.201 3.58 9/28/05 21:50 22.79 0.08 3.81 9/28/05 21:55 22.43 0.03 4.74 9/28/05 22:00 22.43 0.006 5.53 9/28/05 22:05 22.25 0 5.99 9/28/05 22:10 22.25 0 6.3 9/28/05 22:15 22.43 0 6.22 9/28/05 22:20 22.43 0 5.55 9/28/05 22:25 22.25 0 5.79 9/28/05 22:30 22.07 0 6.62 9/28/05 22:35 22.07 0 6.62 9/28/05 22:40 21.89 0 6.46 9/28/05 22:45 21.71 0 6.14 9/28/05 22:50 22.25 0.015 6.14 9/28/05 22:55 23.72 0.103 6.14 9/28/05 23:00 25.04 0.448 5.41 9/28/05 23:05 25.62 1.727 4.9 9/28/05 23:10 25.43 4.179 4.53 9/28/05 23:15 24.85 6.561 3.98 9/28/05 23:20 24.66 6.429 3.92 9/28/05 23:25 24.28 6.081 4.15 9/28/05 23:30 23.72 5.926 4.15 9/28/05 23:35 23.53 4.385 3.97 9/28/05 23:40 23.34 2.567 3.8 9/28/05 23:45 23.34 1.436 3.58 9/28/05 23:50 23.16 1.082 3.36 9/28/05 23:55 22.79 1.049 3.36 9/29/05 0:00 22.61 1.033 3.52 9/29/05 0:05 22.43 1.026 3.52 9/29/05 0:10 22.43 1.019 3.52 9/29/05 0:15 22.43 1.013 3.52 9/29/05 0:20 22.25 1.006 3.47 9/29/05 0:25 22.07 1 3.58 9/29/05 0:30 22.25 0.993 3.8 9/29/05 0:35 22.07 0.986 4.41 9/29/05 0:40 21.89 0.98 5.03

81
9/29/05 0:45 22.07 0.973 5.03 9/29/05 0:50 21.89 0.967 5.03 9/29/05 0:55 21.89 0.96 5.1 9/29/05 1:00 21.71 0.954 5.1 9/29/05 1:05 21.53 0.948 5.32 9/29/05 1:10 21.53 0.941 5.61 9/29/05 1:15 21.35 0.935 7.12 9/29/05 1:20 21.35 0.928 8.55 9/29/05 1:25 21.35 0.922 8.84 9/29/05 1:30 21.35 0.916 9.03 9/29/05 1:35 21.18 0.909 8.65 9/29/05 1:40 21.35 0.903 7.91 9/29/05 1:45 24.35 0.897 6.57 9/29/05 1:50 27 0.89 5.68 9/29/05 1:55 27 0.884 5.61 9/29/05 2:00 26.6 0.878 5.32 9/29/05 2:05 26.21 0.871 4.97 9/29/05 2:10 26.21 0.865 4.41 9/29/05 2:15 25.82 0.859 3.92 9/29/05 2:20 25.23 0.853 3.86 9/29/05 2:25 24.85 0.847 4.22 9/29/05 2:30 24.66 0.84 4.71 9/29/05 2:35 24.66 0.834 4.84 9/29/05 2:40 24.66 0.828 4.71 9/29/05 2:45 24.66 0.822 4.46 9/29/05 2:50 24.66 0.816 4.1 9/29/05 2:55 24.66 0.81 3.86 9/29/05 3:00 24.28 0.804 3.69 9/29/05 3:05 23.72 0.798 3.36 9/29/05 3:10 23.53 0.791 3.53 9/29/05 3:15 23.53 0.785 3.86 9/29/05 3:20 23.53 0.779 3.8 9/29/05 3:25 23.53 0.773 3.63 9/29/05 3:30 23.53 0.767 4.18 9/29/05 3:35 23.53 0.761 5.18 9/29/05 3:40 23.53 0.755 6.76 9/29/05 3:45 23.53 0.75 10.16 9/29/05 3:50 23.53 0.744 12.79

82
9/29/05 3:55 23.72 0.738 13.87 9/29/05 4:00 23.53 0.732 16.61 9/29/05 4:05 23.34 0.726 19.5 9/29/05 4:10 23.53 0.72 23.95 9/29/05 4:15 23.16 0.714 28.4 9/29/05 4:20 22.61 0.708 29.37 9/29/05 4:25 22.61 0.703 30.17 9/29/05 4:30 22.61 0.697 29.58 9/29/05 4:35 30.36 0.691 28.2 9/29/05 4:40 39.62 0.685 27.25 9/29/05 4:45 41.86 0.679 25.58 9/29/05 4:50 43.7 0.674 24.14 9/29/05 4:55 44.4 0.668 23.44 9/29/05 5:00 43.93 0.662 23.62 9/29/05 5:05 43.01 0.657 23.62 9/29/05 5:10 41.86 0.651 22.59 9/29/05 5:15 40.95 0.645 22.42 9/29/05 5:20 40.28 0.64 22.09 9/29/05 5:25 39.39 0.634 20.76 9/29/05 5:30 38.29 0.629 20.12 9/29/05 5:35 37.21 0.623 20.44 9/29/05 5:40 36.99 0.618 19.37 9/29/05 5:45 36.57 0.612 17.38 9/29/05 5:50 34.67 0.607 17.09 9/29/05 5:55 33.22 0.601 15.74 9/29/05 6:00 32.19 0.596 15.45 9/29/05 6:05 31.35 0.591 16.66 9/29/05 6:10 31.14 0.585 16.8 9/29/05 6:15 30.71 0.58 16.66 9/29/05 6:20 30.07 0.574 16.1 9/29/05 6:25 29.86 0.569 16.53 9/29/05 6:30 29.65 0.564 17.09 9/29/05 6:35 29.65 0.559 16.38 9/29/05 6:40 29.65 0.553 16.24 9/29/05 6:45 29.44 0.548 16.95 9/29/05 6:50 29.65 0.543 17.23 9/29/05 6:55 30.07 0.538 16.53 9/29/05 7:00 30.5 0.532 15.03

83
9/29/05 7:05 31.35 0.527 14.24 9/29/05 7:10 31.78 0.522 13.51 9/29/05 7:15 31.35 0.517 12.78 9/29/05 7:20 31.14 0.512 12.55 9/29/05 7:25 31.35 0.507 11.86 9/29/05 7:30 31.35 0.501 11.52 9/29/05 7:35 30.92 0.496 11.09 9/29/05 7:40 30.71 0.491 10.98 9/29/05 7:45 30.08 0.486 11.41 9/29/05 7:50 29.65 0.481 11.09 9/29/05 7:55 29.86 0.476 10.55 9/29/05 8:00 29.45 0.471 10.44 9/29/05 8:05 29.24 0.466 10.65 9/29/05 8:10 29.03 0.461 10.76 9/29/05 8:15 28.62 0.456 10.98 9/29/05 8:20 29.03 0.451 10.98 9/29/05 8:25 29.24 0.446 10.55 9/29/05 8:30 29.03 0.441 10.13 9/29/05 8:35 29.45 0.437 10.13 9/29/05 8:40 29.86 0.432 10.03 9/29/05 8:45 29.86 0.427 9.82 9/29/05 8:50 29.86 0.422 10.13 9/29/05 8:55 29.86 0.417 10.39 9/29/05 9:00 29.65 0.412 10.49 9/29/05 9:05 29.65 0.408 10.55 9/29/05 9:10 29.24 0.403 10.98 9/29/05 9:15 29.03 0.398 10.98 9/29/05 9:20 29.03 0.393 10.87 9/29/05 9:25 28.62 0.389 12.23 9/29/05 9:30 28.82 0.384 13.38 9/29/05 9:35 29.03 0.379 14.52 9/29/05 9:40 28.82 0.375 17.44 9/29/05 9:45 28.62 0.37 20.46 9/29/05 9:50 29.03 0.366 22.95 9/29/05 9:55 30.92 0.361 24.67 9/29/05 10:00 33.22 0.356 24.85 9/29/05 10:05 34.87 0.352 25.58 9/29/05 10:10 36.78 0.347 26.13

84
9/29/05 10:15 41.24 0.343 25.57 9/29/05 10:20 44.87 0.338 26.32 9/29/05 10:25 46.06 0.333 26.68 9/29/05 10:30 46.77 0.329 26.5 9/29/05 10:35 46.05 0.324 26.87 9/29/05 10:40 45.58 0.319 25.95 9/29/05 10:45 44.64 0.315 25.03 9/29/05 10:50 43.47 0.31 24.85 9/29/05 10:55 42.78 0.306 25.03 9/29/05 11:00 41.19 0.301 25.03 9/29/05 11:05 39.83 0.297 24.32 9/29/05 11:10 39.39 0.293 23.96 9/29/05 11:15 38.73 0.288 23.62 9/29/05 11:20 38.07 0.284 23.27 9/29/05 11:25 37.64 0.279 23.79 9/29/05 11:30 36.78 0.275 23.28 9/29/05 11:35 36.13 0.271 22.24 9/29/05 11:40 35.71 0.267 21.91 9/29/05 11:45 34.87 0.262 21.09 9/29/05 11:50 34.66 0.258 19.97 9/29/05 11:55 34.04 0.254 19.18 9/29/05 12:00 32.81 0.25 18.42 9/29/05 12:05 32.81 0.245 17.38 9/29/05 12:10 32.81 0.241 16.8 9/29/05 12:15 31.77 0.237 16.24 9/29/05 12:20 31.14 0.233 15.54 9/29/05 12:25 31.14 0.229 14.51 9/29/05 12:30 30.71 0.225 13.62 9/29/05 12:35 30.07 0.221 12.91 9/29/05 12:40 29.86 0.217 13.15 9/29/05 12:45 29.45 0.213 13.99 9/29/05 12:50 29.03 0.209 13.62 9/29/05 12:55 28.82 0.205 12.9 9/29/05 13:00 28.62 0.201 12.09 9/29/05 13:05 28.21 0.197 11.63 9/29/05 13:10 27.8 0.194 12.94 9/29/05 13:15 28 0.19 13.39 9/29/05 13:20 27.6 0.186 11.87

85
9/29/05 13:25 27.2 0.182 10.87 9/29/05 13:30 27.2 0.179 10.24 9/29/05 13:35 27 0.175 9.52 9/29/05 13:40 26.8 0.171 8.56 9/29/05 13:45 26.4 0.168 8.56 9/29/05 13:50 26.21 0.164 9.42 9/29/05 13:55 26.01 0.16 10.13 9/29/05 14:00 25.81 0.157 10.03 9/29/05 14:05 25.81 0.153 9.23 9/29/05 14:10 25.62 0.15 9.03 9/29/05 14:15 25.43 0.146 8.65 9/29/05 14:20 25.43 0.143 8.09 9/29/05 14:25 25.23 0.139 7.91 9/29/05 14:30 24.85 0.136 7.82 9/29/05 14:35 25.04 0.133 7.55 9/29/05 14:40 25.04 0.129 7.04 9/29/05 14:45 24.66 0.126 6.95 9/29/05 14:50 24.85 0.123 6.87 9/29/05 14:55 24.85 0.12 6.7 9/29/05 15:00 24.47 0.116 7.04 9/29/05 15:05 24.09 0.113 6.95 9/29/05 15:10 23.9 0.11 6.87 9/29/05 15:15 24.09 0.107 7.12 9/29/05 15:20 24.09 0.104 6.48 9/29/05 15:25 23.72 0.1 5.83 9/29/05 15:30 23.53 0.097 5.68 9/29/05 15:35 23.53 0.094 5.76 9/29/05 15:40 23.34 0.091 5.69 9/29/05 15:45 23.16 0.088 5.31 9/29/05 15:50 22.97 0.085 5.17 9/29/05 15:55 22.79 0.082 4.84 9/29/05 16:00 22.97 0.08 4.46 9/29/05 16:05 22.79 0.077 4.1 9/29/05 16:10 22.61 0.074 4.1 9/29/05 16:15 22.79 0.071 4.21 9/29/05 16:20 22.61 0.069 4.34 9/29/05 16:25 22.43 0.066 4.71 9/29/05 16:30 22.43 0.063 4.84

86
9/29/05 16:35 22.43 0.061 4.52 9/29/05 16:40 22.43 0.058 4.27 9/29/05 16:45 22.43 0.056 4.1 9/29/05 16:50 22.25 0.053 3.86 9/29/05 16:55 22.25 0.051 3.8 9/29/05 17:00 22.25 0.048 3.74 9/29/05 17:05 21.89 0.046 3.92 9/29/05 17:10 21.71 0.044 4.09 9/29/05 17:15 21.89 0.041 3.98 9/29/05 17:20 22.07 0.04 3.86 9/29/05 17:25 21.89 0.038 3.8 9/29/05 17:30 21.71 0.037 3.69 9/29/05 17:35 21.53 0.035 3.63 9/29/05 17:40 21.53 0.034 3.52 9/29/05 17:45 21.53 0.033 3.36 9/29/05 17:50 21.35 0.031 3.25 9/29/05 17:55 21.35 0.03 3.1 9/29/05 18:00 21.35 0.028 3.15 9/29/05 18:05 21.35 0.027 3.36 9/29/05 18:10 21.35 0.026 3.41 9/29/05 18:15 21.35 0.024 3.52 9/29/05 18:20 21.35 0.023 3.27 9/29/05 18:25 21.35 0.021 3.16 9/29/05 18:30 21.35 0.02 3.41 9/29/05 18:35 21.18 0.019 3.36 9/29/05 18:40 21.18 0.017 3.15 9/29/05 18:45 21.18 0.016 2.95 9/29/05 18:50 21 0.014 2.95 9/29/05 18:55 20.82 0.013 3 9/29/05 19:00 20.82 0.012 2.95 9/29/05 19:05 20.82 0.01 3.05 9/29/05 19:10 20.65 0.009 3.1 9/29/05 19:15 20.82 0.007 3 9/29/05 19:20 20.82 0.006 3 9/29/05 19:25 20.65 0.005 3 9/29/05 19:30 20.65 0.003 3 9/29/05 19:35 20.48 0.002 2.95 9/29/05 19:40 20.48 0.001 2.9

87
9/29/05 19:45 20.65 0 2.9 9/29/05 19:50 20.65 0 2.9 9/29/05 19:55 20.48 0 2.8 9/29/05 20:00 20.3 0 2.71 9/29/05 20:05 20.48 0 2.71 9/29/05 20:10 20.48 0 2.71 9/29/05 20:15 20.3 0 2.8 9/29/05 20:20 20.3 0 2.8 9/29/05 20:25 20.3 0.001 2.67 9/29/05 20:30 20.3 0.001 2.67 9/29/05 20:35 20.3 0 2.67 9/29/05 20:40 20.3 0.019 2.62 9/29/05 20:45 20.3 0.082 2.62 9/29/05 20:50 20.3 0.08 2.67 9/29/05 20:55 20.3 0.04 2.71 9/29/05 21:00 20.13 0.022 2.71 9/29/05 21:05 20.13 0.006 2.62 9/29/05 21:10 20.13 0 2.54 9/29/05 21:15 20.13 0 2.45 9/29/05 21:20 20.13 0 2.45 9/29/05 21:25 19.79 0 2.45 9/29/05 21:30 19.79 0 2.45 9/29/05 21:35 20.13 0 2.45 9/29/05 21:40 20.3 0 2.45 9/29/05 21:45 20.13 0 2.54 9/29/05 21:50 20.13 0 2.54 9/29/05 21:55 20.13 0 2.41 9/29/05 22:00 20.13 0 2.21 9/29/05 22:05 20.3 0 2.25 9/29/05 22:10 20.13 0 2.37 9/29/05 22:15 20.13 0 2.45 9/29/05 22:20 20.3 0 2.45 9/29/05 22:25 20.13 0 2.37 9/29/05 22:30 19.79 0 2.45 9/29/05 22:35 19.62 0 2.41 9/29/05 22:40 19.79 0 2.33 9/29/05 22:45 19.79 0 2.25 9/29/05 22:50 19.62 0 2.21

88
9/29/05 22:55 19.62 0 2.21 9/29/05 23:00 19.62 0 2.21 9/29/05 23:05 19.96 0 2.21 9/29/05 23:10 19.96 0 2.13 9/29/05 23:15 19.62 0 2.09 9/29/05 23:20 19.45 0 2.09 9/29/05 23:25 19.28 0 2.13 9/29/05 23:30 19.45 0 2.13 9/29/05 23:35 19.62 0 2.13 9/29/05 23:40 19.62 0 2.09 9/29/05 23:45 19.62 0 2.09 9/29/05 23:50 19.62 0 2.13 9/29/05 23:55 19.45 0 2.09 9/30/05 0:00 19.62 0 2.05
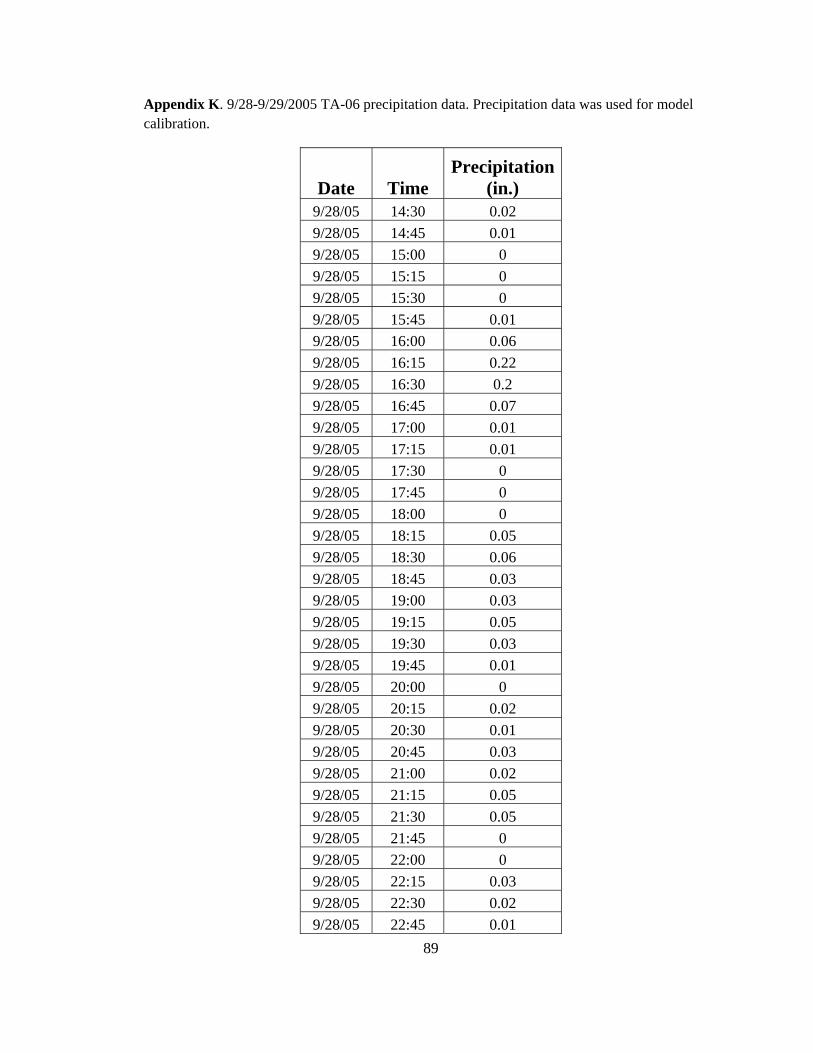
89
Appendix K. 9/28-9/29/2005 TA-06 precipitation data. Precipitation data was used for model calibration.
Date Time Precipitation
(in.) 9/28/05 14:30 0.02 9/28/05 14:45 0.01 9/28/05 15:00 0 9/28/05 15:15 0 9/28/05 15:30 0 9/28/05 15:45 0.01 9/28/05 16:00 0.06 9/28/05 16:15 0.22 9/28/05 16:30 0.2 9/28/05 16:45 0.07 9/28/05 17:00 0.01 9/28/05 17:15 0.01 9/28/05 17:30 0 9/28/05 17:45 0 9/28/05 18:00 0 9/28/05 18:15 0.05 9/28/05 18:30 0.06 9/28/05 18:45 0.03 9/28/05 19:00 0.03 9/28/05 19:15 0.05 9/28/05 19:30 0.03 9/28/05 19:45 0.01 9/28/05 20:00 0 9/28/05 20:15 0.02 9/28/05 20:30 0.01 9/28/05 20:45 0.03 9/28/05 21:00 0.02 9/28/05 21:15 0.05 9/28/05 21:30 0.05 9/28/05 21:45 0 9/28/05 22:00 0 9/28/05 22:15 0.03 9/28/05 22:30 0.02 9/28/05 22:45 0.01

90
9/28/05 23:00 0 9/28/05 23:15 0 9/28/05 23:30 0.02 9/28/05 23:45 0.05 9/29/05 0:00 0.04 9/29/05 0:15 0.05 9/29/05 0:30 0.02 9/29/05 0:45 0 9/29/05 1:00 0 9/29/05 1:15 0 9/29/05 1:30 0 9/29/05 1:45 0 9/29/05 2:00 0.02 9/29/05 2:15 0 9/29/05 2:30 0 9/29/05 2:45 0.02 9/29/05 3:00 0.06 9/29/05 3:15 0.1 9/29/05 3:30 0.1 9/29/05 3:45 0.05 9/29/05 4:00 0.04 9/29/05 4:15 0.01 9/29/05 4:30 0.01 9/29/05 4:45 0 9/29/05 5:00 0.01 9/29/05 5:15 0.03 9/29/05 5:30 0.04 9/29/05 5:45 0.05 9/29/05 6:00 0.02 9/29/05 6:15 0.01 9/29/05 6:30 0 9/29/05 6:45 0.02 9/29/05 7:00 0.02 9/29/05 7:15 0.03 9/29/05 7:30 0.01 9/29/05 7:45 0 9/29/05 8:00 0 9/29/05 8:15 0.01

91
9/29/05 8:30 0.05 9/29/05 8:45 0.05 9/29/05 9:00 0.03 9/29/05 9:15 0.05 9/29/05 9:30 0.07 9/29/05 9:45 0 9/29/05 10:00 0.01 9/29/05 10:15 0.01 9/29/05 10:30 0.02 9/29/05 10:45 0.01 9/29/05 11:00 0.03 9/29/05 11:15 0.01 9/29/05 11:30 0 9/29/05 11:45 0 9/29/05 12:00 0 9/29/05 12:15 0 9/29/05 12:30 0.03 9/29/05 12:45 0 9/29/05 13:00 0.01 9/29/05 13:15 0 9/29/05 13:30 0.03 9/29/05 13:45 0 9/29/05 14:00 0 9/29/05 14:15 0 9/29/05 14:30 0

92
Appendix L. 8/25/2006 Pajarito Canyon stream gage data. Discharge data was used for model calibration.
Date Time
Station E243 Discharge
(cfs)
Station E243.5 Discharge
(cfs)
Station E244 Discharge
(cfs) 8/25/2006 0:00 0 0.62 0.09 8/25/2006 0:05 0 0.45 0.07 8/25/2006 0:10 0 0.31 0.07 8/25/2006 0:15 0 0.22 0.07 8/25/2006 0:20 0 0.14 0.07 8/25/2006 0:25 0 0.1 0.09 8/25/2006 0:30 0 0.05 0.07 8/25/2006 0:35 0 0.02 0.07 8/25/2006 0:40 0 0.02 0.09 8/25/2006 0:45 0 0.01 0.09 8/25/2006 0:50 0 0.01 0.09 8/25/2006 0:55 0 0.01 0.09 8/25/2006 1:00 0 0 0.09 8/25/2006 1:05 0 0 0.09 8/25/2006 1:10 0 0 0.07 8/25/2006 1:15 0 0 0.07 8/25/2006 1:20 0 0 0.07 8/25/2006 1:25 0 0 0.06 8/25/2006 1:30 0 0 0.06 8/25/2006 1:35 0 0 0.06 8/25/2006 1:40 0 0 0.06 8/25/2006 1:45 0 0 0.06 8/25/2006 1:50 0 0 0.05 8/25/2006 1:55 0 0 0.05 8/25/2006 2:00 0 0 0.06 8/25/2006 2:05 0 0 0.07 8/25/2006 2:10 0 0 0.07 8/25/2006 2:15 0 0 0.06 8/25/2006 2:20 0 0 0.06 8/25/2006 2:25 0 0 0.06 8/25/2006 2:30 0 0 0.06 8/25/2006 2:35 0 0 0.06 8/25/2006 2:40 0 0 0.06

93
8/25/2006 2:45 0 0 0.06 8/25/2006 2:50 0 0 0.06 8/25/2006 2:55 0 0 0.05 8/25/2006 3:00 0 0 0.05 8/25/2006 3:05 0 0 0.06 8/25/2006 3:10 0 0 0.06 8/25/2006 3:15 0 0 0.05 8/25/2006 3:20 0 0 0.05 8/25/2006 3:25 0 0 0.06 8/25/2006 3:30 0 0 0.05 8/25/2006 3:35 0 0 0.04 8/25/2006 3:40 0 0 0.04 8/25/2006 3:45 0 0 0.05 8/25/2006 3:50 0 0 0.05 8/25/2006 3:55 0 0 0.04 8/25/2006 4:00 0 0 0.04 8/25/2006 4:05 0 0 0.02 8/25/2006 4:10 0 0 0 8/25/2006 4:15 0 0 0.02 8/25/2006 4:20 0 0 0.04 8/25/2006 4:25 0 0 0.04 8/25/2006 4:30 0 0 0.05 8/25/2006 4:35 0 0 0.06 8/25/2006 4:40 0 0 0.05 8/25/2006 4:45 0 0 0.05 8/25/2006 4:50 0 0 0.06 8/25/2006 4:55 0 0 0.06 8/25/2006 5:00 0 0 0.05 8/25/2006 5:05 0 0 0.05 8/25/2006 5:10 0 0 0.06 8/25/2006 5:15 0 0 0.06 8/25/2006 5:20 0 0 0.06 8/25/2006 5:25 0 0 0.06 8/25/2006 5:30 0 0 0.06 8/25/2006 5:35 0 0 0.03 8/25/2006 5:40 0 0 0.03 8/25/2006 5:45 0 0 0.06 8/25/2006 5:50 0 0 0.06

94
8/25/2006 5:55 0 0 0.06 8/25/2006 6:00 0 0 0.06 8/25/2006 6:05 0 0 0.06 8/25/2006 6:10 0 0 0.06 8/25/2006 6:15 0 0 0.06 8/25/2006 6:20 0 0 0.06 8/25/2006 6:25 0 0 0.06 8/25/2006 6:30 0 0 0.06 8/25/2006 6:35 0 0 0.06 8/25/2006 6:40 0 0 0.06 8/25/2006 6:45 0 0 0.06 8/25/2006 6:50 0 0 0.06 8/25/2006 6:55 0 0 0.06 8/25/2006 7:00 0 0 0.06 8/25/2006 7:05 0 0 0.07 8/25/2006 7:10 0 0 0.07 8/25/2006 7:15 0 0 0.07 8/25/2006 7:20 0 0 0.09 8/25/2006 7:25 0 0 0.09 8/25/2006 7:30 0 0 0.09 8/25/2006 7:35 0 0 0.09 8/25/2006 7:40 0 0 0.09 8/25/2006 7:45 0 0 0.09 8/25/2006 7:50 0 0 0.09 8/25/2006 7:55 0 0 0.09 8/25/2006 8:00 0 0 0.09 8/25/2006 8:05 0 0 0.07 8/25/2006 8:10 0 0 0.07 8/25/2006 8:15 0 0 0.09 8/25/2006 8:20 0 0 0.09 8/25/2006 8:25 0 0 0.09 8/25/2006 8:30 0 0 0.09 8/25/2006 8:35 0 0 0.07 8/25/2006 8:40 0 0 0.06 8/25/2006 8:45 0 0 0.06 8/25/2006 8:50 0 0 0.06 8/25/2006 8:55 0 0 0.06 8/25/2006 9:00 0 0 0.06

95
8/25/2006 9:05 0 0 0.06 8/25/2006 9:10 0 0 0.07 8/25/2006 9:15 0 0 0.09 8/25/2006 9:20 0 0 0.09 8/25/2006 9:25 0 0 0.09 8/25/2006 9:30 0 0 0.09 8/25/2006 9:35 0 0 0.09 8/25/2006 9:40 0 0 0.09 8/25/2006 9:45 0 0 0.09 8/25/2006 9:50 0 0 0.09 8/25/2006 9:55 0 0 0.07 8/25/2006 10:00 0 0 0.06 8/25/2006 10:05 0 0 0.05 8/25/2006 10:10 0 0 0.04 8/25/2006 10:15 0 0 0.04 8/25/2006 10:20 0 0 0.02 8/25/2006 10:25 0 0 0 8/25/2006 10:30 0 0 0 8/25/2006 10:35 0 0 0 8/25/2006 10:40 0 0 0 8/25/2006 10:45 0 0 0 8/25/2006 10:50 0 0 0 8/25/2006 10:55 0 0 0 8/25/2006 11:00 0 0 0 8/25/2006 11:05 0 0 0 8/25/2006 11:10 0 0 0 8/25/2006 11:15 0 0 0 8/25/2006 11:20 0 0 0 8/25/2006 11:25 0 1.76 0 8/25/2006 11:30 0 3.67 0 8/25/2006 11:35 0 6 0 8/25/2006 11:40 0 6.93 0 8/25/2006 11:45 0 5.6 0 8/25/2006 11:50 0 7.51 0 8/25/2006 11:55 0 8.2 0.04 8/25/2006 12:00 0 7.48 0.4 8/25/2006 12:05 0 6.48 0.91 8/25/2006 12:10 0 6.59 1.26

96
8/25/2006 12:15 0.07 8.5 10.85 8/25/2006 12:20 2.29 6.03 83.14 8/25/2006 12:25 6.33 2.31 204.06 8/25/2006 12:30 9.44 0.89 236.06 8/25/2006 12:35 18.74 0.4 295 8/25/2006 12:40 25.04 0.2 504.21 8/25/2006 12:45 15.47 0.12 597.61 8/25/2006 12:50 5.31 0.07 564.01 8/25/2006 12:55 2.79 0.05 554.2 8/25/2006 13:00 2.06 0.05 509.81 8/25/2006 13:05 0.9 0.06 453.2 8/25/2006 13:10 0.31 0.12 415.18 8/25/2006 13:15 0.24 0.16 365.03 8/25/2006 13:20 0.17 0.24 313.4 8/25/2006 13:25 0.15 1.83 287.42 8/25/2006 13:30 0.15 3.42 275.91 8/25/2006 13:35 0.22 3.49 265.28 8/25/2006 13:40 0.51 3.68 254.29 8/25/2006 13:45 0.58 5.29 245.71 8/25/2006 13:50 0.37 6.46 240.78 8/25/2006 13:55 0.37 5.17 234.69 8/25/2006 14:00 0.35 3.15 226.79 8/25/2006 14:05 0.2 1.59 213.44 8/25/2006 14:10 0.12 0.77 200.49 8/25/2006 14:15 0.11 0.47 194.06 8/25/2006 14:20 0.13 0.33 185.26 8/25/2006 14:25 5.07 0.27 171.16 8/25/2006 14:30 12.19 0.74 157.19 8/25/2006 14:35 13.6 1.35 149.19 8/25/2006 14:40 11.23 1.41 144.94 8/25/2006 14:45 9.08 0.93 141.88 8/25/2006 14:50 7.03 0.43 139.98 8/25/2006 14:55 4.77 0.26 137.8 8/25/2006 15:00 3.35 0.63 136.12 8/25/2006 15:05 2.34 1.03 134.96 8/25/2006 15:10 1.76 0.77 130.36 8/25/2006 15:15 1.34 0.51 118.17 8/25/2006 15:20 1.18 1.12 107.75
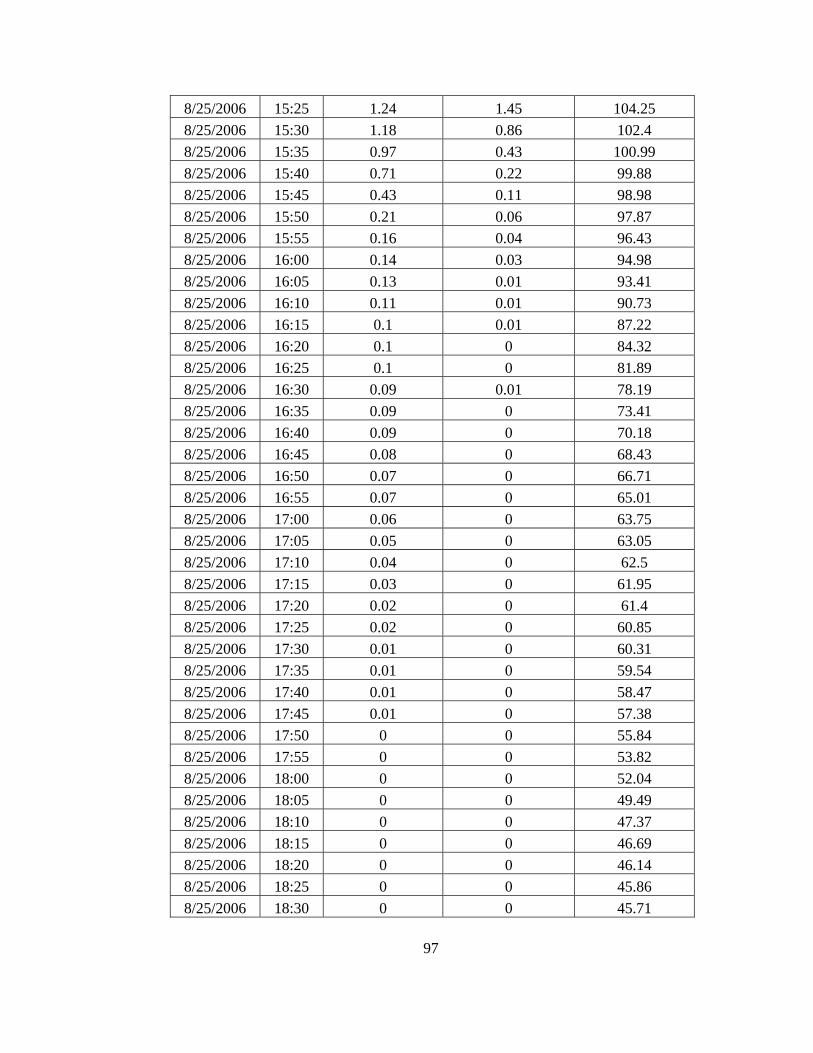
97
8/25/2006 15:25 1.24 1.45 104.25 8/25/2006 15:30 1.18 0.86 102.4 8/25/2006 15:35 0.97 0.43 100.99 8/25/2006 15:40 0.71 0.22 99.88 8/25/2006 15:45 0.43 0.11 98.98 8/25/2006 15:50 0.21 0.06 97.87 8/25/2006 15:55 0.16 0.04 96.43 8/25/2006 16:00 0.14 0.03 94.98 8/25/2006 16:05 0.13 0.01 93.41 8/25/2006 16:10 0.11 0.01 90.73 8/25/2006 16:15 0.1 0.01 87.22 8/25/2006 16:20 0.1 0 84.32 8/25/2006 16:25 0.1 0 81.89 8/25/2006 16:30 0.09 0.01 78.19 8/25/2006 16:35 0.09 0 73.41 8/25/2006 16:40 0.09 0 70.18 8/25/2006 16:45 0.08 0 68.43 8/25/2006 16:50 0.07 0 66.71 8/25/2006 16:55 0.07 0 65.01 8/25/2006 17:00 0.06 0 63.75 8/25/2006 17:05 0.05 0 63.05 8/25/2006 17:10 0.04 0 62.5 8/25/2006 17:15 0.03 0 61.95 8/25/2006 17:20 0.02 0 61.4 8/25/2006 17:25 0.02 0 60.85 8/25/2006 17:30 0.01 0 60.31 8/25/2006 17:35 0.01 0 59.54 8/25/2006 17:40 0.01 0 58.47 8/25/2006 17:45 0.01 0 57.38 8/25/2006 17:50 0 0 55.84 8/25/2006 17:55 0 0 53.82 8/25/2006 18:00 0 0 52.04 8/25/2006 18:05 0 0 49.49 8/25/2006 18:10 0 0 47.37 8/25/2006 18:15 0 0 46.69 8/25/2006 18:20 0 0 46.14 8/25/2006 18:25 0 0 45.86 8/25/2006 18:30 0 0 45.71

98
8/25/2006 18:35 0 0 45.57 8/25/2006 18:40 0 0 45.42 8/25/2006 18:45 0 0 45.28 8/25/2006 18:50 0 0 45.14 8/25/2006 18:55 0 0 44.99 8/25/2006 19:00 0 0 44.85 8/25/2006 19:05 0 0 44.71 8/25/2006 19:10 0 0 44.37 8/25/2006 19:15 0 0 43.83 8/25/2006 19:20 0 0 43.31 8/25/2006 19:25 0 0 42.78 8/25/2006 19:30 0 0 42.47 8/25/2006 19:35 0 0 42.38 8/25/2006 19:40 0 0 42.28 8/25/2006 19:45 0 0 42.19 8/25/2006 19:50 0 0 42.1 8/25/2006 19:55 0 0 42 8/25/2006 20:00 0 0 41.91 8/25/2006 20:05 0 0 41.81 8/25/2006 20:10 0 0 41.72 8/25/2006 20:15 0 0 41.62 8/25/2006 20:20 0 0 41.54 8/25/2006 20:25 0 0 41.47 8/25/2006 20:30 0 0 41.4 8/25/2006 20:35 0 0 41.33 8/25/2006 20:40 0 0 41.26 8/25/2006 20:45 0 0 41.2 8/25/2006 20:50 0 0 41.13 8/25/2006 20:55 0 0 41.06 8/25/2006 21:00 0 0 40.88 8/25/2006 21:05 0 0 40.61 8/25/2006 21:10 0 0 40.33 8/25/2006 21:15 0 0 40.06 8/25/2006 21:20 0 0 39.79 8/25/2006 21:25 0 0 39.51 8/25/2006 21:30 0 0 39.24 8/25/2006 21:35 0 0 38.97 8/25/2006 21:40 0 0 38.7

99
8/25/2006 21:45 0 0 38.44 8/25/2006 21:50 0 0 38.17 8/25/2006 21:55 0 0 37.9 8/25/2006 22:00 0 0 37.75 8/25/2006 22:05 0 0 37.66 8/25/2006 22:10 0 0 37.52 8/25/2006 22:15 0 0 37.39 8/25/2006 22:20 0 0 37.26 8/25/2006 22:25 0 0 37.13 8/25/2006 22:30 0 0 37 8/25/2006 22:35 0 0 36.87 8/25/2006 22:40 0 0 36.68 8/25/2006 22:45 0 0 36.44 8/25/2006 22:50 0 0 36.19 8/25/2006 22:55 0 0 35.95 8/25/2006 23:00 0 0 35.71 8/25/2006 23:05 0 0 35.47 8/25/2006 23:10 0 0 35.16 8/25/2006 23:15 0 0 34.89 8/25/2006 23:20 0 0 34.75 8/25/2006 23:25 0 0 34.61 8/25/2006 23:30 0 0 34.47 8/25/2006 23:35 0 0 34.34 8/25/2006 23:40 0 0 34.18 8/25/2006 23:45 0 0 34.01 8/25/2006 23:50 0 0 33.84 8/25/2006 23:55 0 0 33.67 8/26/2006 0:00 0 0 33.5

100
Appendix M. 8/25/2006 TA-06 precipitation data.
Date Time Precipitation
(in.) 8/25/2006 11:15 0.04 8/25/2006 11:30 0.15 8/25/2006 11:45 0.1 8/25/2006 12:00 0.35 8/25/2006 12:15 0.54 8/25/2006 12:30 0.17 8/25/2006 12:45 0.04 8/25/2006 13:00 0.13 8/25/2006 13:15 0.03 8/25/2006 13:30 0.16 8/25/2006 13:45 0.16 8/25/2006 14:00 0 8/25/2006 14:15 0 8/25/2006 14:30 0 8/25/2006 14:45 0 8/25/2006 15:00 0.01 8/25/2006 15:15 0.1 8/25/2006 15:30 0.03