comparison of prestellar core … · 2014-08-28 · these questions have been developed over the...
TRANSCRIPT

arX
iv:1
405.
0331
v1 [
astr
o-ph
.GA
] 2
May
201
4Submitted to the Astrophysical Journal
Preprint typeset using LATEX style emulateapj v. 04/17/13
COMPARISON OF PRESTELLAR CORE ELONGATIONS AND LARGE-SCALE MOLECULAR CLOUDSTRUCTURES IN THE LUPUS I REGION
POIDEVIN Frederick
UCL, KLB, Department of Physics & Astronomy, Gower Place, London WC1E 6BT, United Kingdom; Instituto de Astrofsica deCanarias, E-38200 La Laguna, Tenerife, Spain; Universidad de La Laguna, Dept. Astrofsica, E-38206 La Laguna, Tenerife, Spain.
ADE Peter A.R.
Cardiff University, School of Physics and Astronomy, Queens Buildings, The Parade, Cardiff, CF24 3AA, U.K.
ANGILE Francesco E.
Department of Physics and Astronomy, University of Pennsylvania, 209 South 33rd Street, Philadelphia, PA, 19104, U.S.A.
BENTON Steven J.
Department of Physics, University of Toronto, 60 St. George St, Toronto, ON, M5S 1A7, Canada.
CHAPIN Edward L.
XMM SOC, ESAC, Apartado 78, 28691 Villanueva de la Canada, Madrid, Spain.
DEVLIN Mark J.
Department of Physics and Astronomy, University of Pennsylvania, 209 South 33rd Street, Philadelphia, PA, 19104, U.S.A.
FISSEL Laura M.
Department of Astronomy and Astrophysics, University of Toronto, 50 St. George Street, Toronto, ON M5S 3H4, Canada andDepartment of Physics and Astronomy, Northwestern University, 2145 Sheridan Road, Evanston, IL 60208.
FUKUI Yasuo
Department of Physics, Nagoya University, Chikusa-ku, Nagoya, Aichi, 464-8601, Japan.
GANDILO Natalie N.
Department of Astronomy and Astrophysics, University of Toronto, 50 St. George Street, Toronto, ON M5S 3H4, Canada.
GUNDERSEN Joshua O.
Department of Physics, University of Miami, 1320 Campo Sano Drive, Coral Gables, FL, 33146, U.S.A.
HARGRAVE Peter C.
Cardiff University, School of Physics and Astronomy, Queens Buildings, The Parade, Cardiff, CF24 3AA, U.K.
KLEIN Jeffrey
Department of Physics and Astronomy, University of Pennsylvania, 209 South 33rd Street, Philadelphia, PA, 19104, U.S.A.
KOROTKOV Andrei L.
Department pof Physics, Brown University, 182 Hope Street, Providence, RI, 02912, U.S.A.
MATTHEWS Tristan G.
Center for Interdisciplinary Exploration and Research in Astrophysics (CIERA) and Department of Physics and Astronomy,

2
Northwestern University, 2145 Sheridan Road, Evanston, IL 60208.
MONCELSI Lorenzo
California Institute of Technology, 1200 E. California Blvd., Pasadena, CA, 91125, U.S.A.
MROCZKOWSKI Tony K.
California Institute of Technology, 1200 E. California Blvd., Pasadena, CA, 91125, U.S.A.
NETTERFIELD Calvin B.
Department of Astronomy and Astrophysics, University of Toronto, 50 St. George Street, Toronto, ON M5S 3H4, Canada; Departmentof Physics, University of Toronto, 60 St. George St, Toronto, ON, M5S 1A7, Canada.
NOVAK Giles
Center for Interdisciplinary Exploration and Research in Astrophysics (CIERA) and Department of Physics and Astronomy,Northwestern University, 2145 Sheridan Road, Evanston, IL 60208.
NUTTER David
Cardiff University, School of Physics and Astronomy, Queens Buildings, The Parade, Cardiff, CF24 3AA, U.K.
OLMI Luca
University of Puerto Rico, Rio Piedras Campus, Physics Department, Box 23343, UPR station, San Juan, Puerto Rico ANDOsservatorio Astrofisico de Arcetri, INAF, Largo E. Fermi 5, I-50125, Firenze, Italy.
PASCALE Enzo
Cardiff University, School of Physics and Astronomy, Queens Buildings, The Parade, Cardiff, CF24 3AA, U.K.
SAVINI Giorgio
UCL, KLB, Department of Physics & Astronomy, Gower Place, London WC1E 6BT, U.K.
SCOTT Douglas
Department of Physics and Astronomy, University of British Colombia, 6224 Agricultural Road, Vancouver, BC V6T 1Z1, Canada.
SHARIFF Jamil A.
Department of Astronomy and Astrophysics, University of Toronto, 50 St. George Street, Toronto, ON M5S 3H4, Canada.
SOLER Juan Diego
Department of Astronomy and Astrophysics, University of Toronto, 50 St. George Street, Toronto, ON M5S 3H4, Canada; CNRS -

3
Institut d’Astrophysique Spatiale, Universit Paris-XI, Orsay, France.
TACHIHARA Kengo
Department of Physics, Nagoya University, Chikusa-ku, Nagoya, Aichi, 464-8601, Japan.
THOMAS Nicholas E.
Department of Physics, University of Miami, 1320 Campo Sano Drive, Coral Gables, FL, 33146, U.S.A.
TRUCH Matthew D.P.
Department of Physics and Astronomy, University of Pennsylvania, 209 South 33rd Street, Philadelphia, PA, 19104, U.S.A.
TUCKER Carole E.
Cardiff University, School of Physics and Astronomy, Queens Buildings, The Parade, Cardiff, CF24 3AA, U.K.
TUCKER Gregory S.
Department pof Physics, Brown University, 182 Hope Street, Providence, RI, 02912, U.S.A.
WARD-THOMPSON Derek
Jeremiah Horrocks Institute, University of Central Lancashire, PR1 2HE, U.K.Submitted to the Astrophysical Journal
ABSTRACT
Turbulence and magnetic fields are expected to be important for regulating molecular cloud formationand evolution. However, their effects on subparsec to 100 parsec scales, leading to the formationof starless cores, is not well understood. We investigate the prestellar core structure morphologiesobtained from analysis of the Herschel-SPIRE 350 µm maps of the Lupus I cloud. This distributionis first compared on a statistical basis to the large scale shape of the main filament. We find thedistribution of the elongation position angle of the cores to be consistent with a random distribution,which means no specific orientation of the morphology of the cores is observed with respect to alarge-scale filament shape model for Lupus I, or relative to a large-scale bent filament model. Thisdistribution is also compared to the mean orientation of the large-scale magnetic fields probed at 350µm with the Balloon-borne Large Aperture Telescope for Polarimetry (BLASTPol) during its 2010campaign. Here again we do not find any correlation between the core morphology distribution andthe average orientation of the magnetic fields on parsec scales. Our main conclusion is that the localfilament dynamics – including secondary filaments that often run orthogonally to the primary filament– and possibly small-scale variations in the local magnetic field direction, could be the dominant factorsfor explaining the final orientation of each core.Keywords: ISM: individual object (Lupus) — ISM: magnetic fields — cores — Experiments: BLAST-
Pol, submm
1. INTRODUCTION
Understanding the processes leading to the formationof stars in our Galaxy is one of the great challengeswhich, despite much progress (e.g., Molinari et al. 2014),still remains open. At sub-parsec scales, the detailedmechanisms remain ellusive through which gravitationalcollapse occurs, leading to the formation of a prestel-lar core which eventually will give birth to one or morestars. Recent advances have shown that turbulenceis a key ingredient and plays a dual role, both creat-ing overdensities to initiate core formation and counter-acting the effects of gravity into the denser regions ofthese objects (e.g., McKee & Ostriker 2007). In addi-tion to gravity and turbulence, other physical processesare likely to play a significant role. Specifically, magneticfield and dynamical chemistry networks are expected tobe relevant for understanding the general phenomenol-
ogy of star-formation (see for example Leao et al. 2013;Girart et al. 2013; Tassis et al. 2012a,b,c, and referencestherein). However, all in all, it is currently unclear whichof all these mechanisms dominates over the other ones,and over which spatial and temporal scales.On larger spatial scales, the formation and evolu-
tion of molecular clouds is not well understood andthere is abundant literature on the subject. Inparticular, several simulation approaches addressingthese questions have been developed over the lasttwo decades (e.g., Ostriker et al. 2001; Gammie et al.2003; Falceta-Goncalves et al. 2008; Heitsch et al. 2009;Nakamura & Li 2011; Bonnell et al. 2013). While theseanalyses sometimes use very different lines of reasoning,almost all of them include and/or show that the com-bined effects of magnetic fields and turbulence are keyingredients to understanding core mass function (CMF)estimates for our Galaxy. However, the impact of mag-netic fields on different spatial and density scales has not

4
yet been established with regards to explaining the ob-served star formation rate (SFR). Recent work suggeststhat magnetic fields are regulating cloud formation (e.g.,Heitsch et al. 2009; Nakamura & Li 2011), with differ-ent scenarii depending on the magnetic field strength andorientation with respect to outflow-driven turbulence.In practice, characterization of cloud structure proper-
ties and star-formation efficiency based on map analysisshow strong variations from one cloud to another (e.g.,Schneider et al. 2013; Rygl et al. 2013). Recent studiesmay provide clues pointing toward the general mecha-nisms dominating the processes in different regions. Inone such study, Ballesteros-Paredes et al. (2011) proposethat bound molecular clouds could be in a state of hi-erachical and chaotic gravitationnal collapse. On theother hand, Poidevin et al. (2013) show that simple ideal,isothermal and non-self graviting MHD simulations aresufficient to describe the large-scale observed physicalproperties of the envelopes of four different molecularclouds. This result is consistent with some of the molec-ular clouds not being necessarily gravitationally boundas discussed by Ward et al. (2014). These findings raiseimportant questions regarding the range of spatial scalesand density regimes which are involved with non-selfgravitating MHD and effective local collapse leading tocore formation.The Lupus I molecular cloud complex has already been
well studied (e.g., Hara et al. 1999). We do not know ifthese clouds are bound or unbound. However, relatedto the questions above, one can study the relation be-tween the large-scale structures of the filamentary molec-ular clouds and the average distribution of the prestel-lar core structure morphologies associated with that re-gion. This is the central question addressed in this work.We focus our study on the structural morphologies ofthe prestellar cores obtained from the analysis of the350 µm SPIRE images associated with these clouds (seeRygl et al. 2013). The morphology of the large-scale fil-amentary structure of Lupus I is discussed in a separatepaper by Matthews et al. (2014). In addition to photo-metric imaging, we use the submm polarimetry data seton Lupus I obtained from the 2010 BLASTPol flight (seeMatthews et al. 2014). Ideally, it would be important tocompare each identified core morphology with the localmagnetic field. In practice, the resolution of the 2010BLASTPol data precludes this approach, and only theaverage core morphology (taken to be the average orien-tation of the core long axes) can be compared to averagedirection of the cloud magnetic field. Therefore, we limitour analysis to these statistical properties.In the following, Section 2 gives a brief description of
the Lupus I region. The data used in this analysis aredescribed in Section 3. We use the list of cores detectedby Rygl et al. (2013) in the SPIRE data, and Section4 discusses the methodology adopted to determine theaverage elongation of these sources. A comparison of theaverage filamentary molecular cloud structures and thesample of prestellar cores for which it is possible to defineaccurate average elongation position angle (EPA) is givenin Section 5. A comparison of the mean magnetic fieldorientation and the prestellar core orientations is alsogiven. Our results and their implication are discussed inSection 6 with conclusions provided in section 7.
2. THE LUPUS I REGION
The Lupus I molecular cloud region is a well studiedsite of star formation. It is one of the closest star-formingregions at (155 ± 8) pc (see Lombardi et al. 2008),lying close to the position centered at RA (J2000)=15h42m00s, Dec (J2000)= −34◦12′00′′. Using the ex-isting Spitzer catalog and SPIRE imaging at 250, 350and 500 µm, Rygl et al. (2013) detected cores located inthis region and discuss their evolutionary classification.These authors show that Lupus I is undergoing a largestar formation event, as estimated by the increased SFRand by the large number of prestellar objects when com-pared to more evolved structures. However, the mecha-nism behind this surge in star formation is not well un-derstood.
3. DATA SETS
3.1. Prestellar Cores Sample
In our analysis we use the sample of prestellar coresidentified by Rygl et al. (2013) with their combined anal-ysis of the Herschel 70 - 500 µm maps. The paper doesnot display an explicit list of coordinates of the cores theydiscuss. Therefore, for identifying the coordinates of theprestellar cores, we used the central position of the mapsdisplayed in their figure A.2. Most of the time the peaklocation of the core was obvious, being no further thana few arcseconds from the center of their map. In suchcases we report these coordinates, and if not we reportthe center coordinates of their map. The intensity mapsshown in our Fig. 1 (discussed further below) comparewell with the intensity maps shown by Rygl et al. (2013)and we believe our core position coordinate estimates areaccurate to ≈ 10′′. These core position coordinate esti-mates are provided in columns 2 and 3 of Tables 1 and2, respectively.
3.2. BLASTPol Polarimetry Data Set
One of the best ways for probing magnetic fieldsin molecular clouds is through submillimeter (submm)polarimetry, where the radiation from aspherical dustgrains, aligned by the local magnetic field (see Lazarian2007, for a review), is detected in polarization. There-fore, submm polarimetry data provide information aboutthe mean projected component of the magnetic fieldon the plane-of-the-sky (POS). We use BLASTPol (seePascale et al. 2012; Angile et al. 2014) submm polarime-try to infer the POS magnetic field orientations.Details about the BLAST and BLASTpol experi-
ment, instruments and flights are given by Pascale et al.(2012), Moncelsi et al. (2014) and Angile et al. (2014).Matthews et al. (2014) provides a detailed discussion ofthe polarimetry analysis of the 2010 BLASTPol data at250, 350 and 500 µm. Most of the modified blackbodyfits of the prestellar cores discussed by Rygl et al. (2013)peak (in Sν units) at a wavelength close to 350 µm. Forthis reason, we focus our analysis on the polarimetry dataset obtained at this wavelength. This data set is simi-lar to the one used by Matthews et al. (2014) in theiranalysis.
4. DATA ANALYSIS
In this section the position angles (PA), whether theyrefer to core elongation position angle (EPA) as seen

5
on the POS, or to mean magnetic field orientations, arecounted positively from north in an anticlockwise direc-tion.The polarization PA is periodic and is defined to wrap
around in a [0◦, 180◦] period. The median values retainedin our analysis correspond to the mean and median es-timates obtained such that the dispersions of the distri-butions are found to be the smallest.
4.1. Core Position Angle Estimates
To define the averaged orientation on the POS of theelongation of each prestellar core structure, we use theHerschel 350 µm intensity map. The spatial limit be-tween the cores and the cloud envelopes in which they areembedded is not always clearly defined, because of thelimit of the resolution of the map. Also dust grain emis-sion along the line-of-sight and the presence of other corestructures can cause confusion. In their work, however,Rygl et al. (2013) consider a prestellar core to be definedas a gravitationally bound region of size < 0.05 pc. Weadopt the spatial scale, lmin = 0.05 pc, as the small-est that should be used for characterizing the prestellarcore shapes. With a distance to Lupus I of ≈ 155 pc(Lombardi et al. 2008) this means that in the Herschel350 µm intensity map, prestellar cores should be wellsampled through kernels of 7 × 7 pixels with pixels ofsize 10′′ × 10′′. To ensure that the structure of eachprestellar core is fully included in our analysis, we havedecided to use sligthly larger kernels of 9 × 9 pixels forestimating the elongations of the observed morphologiesof the cores. This ensures a large enough sample of pixelsfor the fitting procedure that we detail below, and alsoensures direct comparison with the maps of the prestellarcores displayed by Rygl et al. (2013) in their figure A.2.Gravity is expected to be the dominant mechanism
that shape core morphologies. Therefore, we assumethat the shape of a prestellar core can be modeled bya spheroid, and that the size and orientation of the mainaxis of this spheroid (after projection on the POS) canbe approximated and described by the parameters asso-ciated with a two-dimensional (2D) Lorentzian distribu-tion1. Estimates of core elongations have been obtainedwith the IDL mpfit2dpeak2 routine assuming Lorentziandistributions. The fits have been obtained by only forc-ing the center of the Lorentzian models to peak at theposition listed in Tables 1 and 2, and otherwise the re-maining parameters (constant baseline level, peak value,half-width values along the short and long axis and po-sition angle) were left free in the fit.Snapshots of the selected prestellar core regions and
their long axis averaged EPAs (as obtained with theLorentzian fitting procedure) are shown in Fig. 1 withblack line segments. White lines show intensity contoursobtained at levels of 0.5, 0.6, 0.7, 0.8, 0.9, 0.95 and 0.99of the peak. Dark lines show identical fractional intensitylevels obtained from the Lorentzian fit models. Estimatesof the EPA and axis ratio obtained from the fits are dis-played in columns 4 and 5 of Tables 1 and 2, respectively.In order to quantify the quality of the fits regarding the
1 In practice we also assumed and tested Gaussian distributions.The results were similar to those obtained with Lorentzian distri-butions.
2 http://www.exelisvis.com/docs/mpfit2dpeak.html.
Table 1Location of cores and the estimates of their position angle
elongation EPA and axis ratio as obtained from the Lorentzianfitting method discussed in Section 4.1. Also given in the lastcolumn is the linear Pearson coefficient parameter (LPCP)
between model and data distributions.
Index RA (J2000) Dec (J2000) EPA Axis LPCP(◦) (◦) (◦) ratio
1 234.597 -34.8721 151 1.2 0.882 234.837 -34.7280 131 1.8 0.743 235.030 -33.5602 40 3.3 0.955 235.524 -34.1556 89 1.8 0.796 235.547 -34.1519 98 8.1 0.848 235.578 -33.8461 71 1.7 0.759 235.654 -33.8625 108 1.7 0.9310 235.706 -33.9900 153 4.5 0.8712 235.729 -34.0750 136 1.8 0.9113 235.817 -34.0778 165 1.6 0.8515 236.029 -34.6499 68 2.1 0.7116 236.171 -34.3421 54 1.3 0.7217 236.183 -34.2955 14 1.9 0.7318 236.247 -34.2861 121 2.6 0.9119 236.300 -34.2855 85 2.2 0.9220 236.325 -34.2093 70 1.5 0.7925 236.485 -34.4937 118 1.8 0.9226 236.566 -34.5111 62 1.6 0.8027 236.631 -34.5514 95 1.6 0.86
intensity structures imaged by Herschel, we calculatedthe linear Pearson correlation parameter (LPCP) of theLorentzian model and the observed intensity structurefor each core. This parameter is given in the last columnin Tables 1 and 2. Figure 2 show scatter plots of theLorentzian modelled intensity (I(MODEL)) against the350 µm observed emission (I(DATA)). One can see strongcorrelations between the two intensities (e.g., for cores 1,3 and 9), lack of correlations (e.g., for cores 4 and 21)and cases in between. The lack of correlation, i.e. a poorfit of the Lorentzian model is mainly due to complexstructure around the central position of the cores or tothe presence of a secondary stronger peak nearby. Inorder to avoid a bias in the forthcoming analysis, werejected the regions for which the LPCP is lower than 70%. This value provides a good compromise for rejectingambiguous fits while ensuring that good quality fits arekept. We point out, however, that rejecting the regionsfor which the LPCP is lower than 55 % would not haveaffected the general conclusions of this work. We alsorejected core 11, which has an axis ratio of unity fromthe Lorentzian fit, and so the EPA estimate cannot betrusted for this object. In Figure 1, all rejected cores aremarked by a red cross.The histogram of the distribution of the EPAs for the
sample of cores passing the tests discussed above areshown in Fig. 3. The standard deviation is minimizedfor a distribution centered around the median value of95◦, with a standard deviation of 41◦. These results arediscussed further in Section 5.
4.2. Histogram of Inferred Magnetic Field PositionAngles
The histogram of inferred magnetic field orientationsis obtained by shifting all the measured 350 µm polar-ization angles by an angle of 90◦ (Matthews et al. 2014).This histogram is shown in Fig. 4. The distribution isstrongly peaked, with an average value of θB ≈ 29◦ and

6
Figure 1. Snapshot of the intensity structures centered on position of the cores listed in Tables 1 and 2. The black line segment shows theelongation of the intensity structure obtained with the Lorentzian fitting method. White lines show intensity contours obtained at levelsof 0.5, 0.6, 0.7, 0.8, 0.9, 0.95 and 0.99 of the peak. Dark lines show similar contour lines obtained from the Lorentzian fit models. The redcrosses show the prestellar cores rejected from the later analysis, as discussed in Section 4.1.

7
Figure 2. Distribution of the modelled intensity obtained with Lorentzian fits against the Herschel 350 µm observed intensity shown foreach region displayed in Fig. 1. There are 81 pixels shown in these panels. Strong correlations indicate that the Lorentzian model providesa good fit.

8
Table 2List of cores rejected from our analysis because we cannotreliably estimate the EPA, as discussed in section 4.1.
Information displayed is as in Table 1.
Index RA (J2000) Dec (J2000) EPA Axis LPCP(◦) (◦) (◦) ratio
4 235.042 -34.9250 ... 1.4 0.477 235.565 -33.8499 ... 2.0 0.6011 235.704 -34.2224 ... 1.0 0.7314 236.000 -34.6417 ... 1.4 0.5021 236.325 -34.2889 ... 2.0 0.1022 236.342 -34.2541 ... 2.4 0.6123 236.353 -34.3681 ... 2.5 0.6324 236.367 -34.3806 ... 2.0 0.55
Figure 3. Histogram of the distribution of the EPAs estimated forthe list of sources displayed in Table 1 and retained in our analysis,as discussed in Section 4.1.
Figure 4. Histogram of the inferred magnetic field orientations,as derived from the BLASTPol 2010 350 µm polarization data. Theinferred field direction is obtained by adding 90◦ to the measuredpolarization angle.
a standard deviation of ≈ 10◦.
5. STATISTICAL RESULTS
A visual summary of our results is shown on the LupusI map displayed in Fig. 5. The orientations of the averageelongations of the prestellar core structures are shownwith black lines. The locations of the cores displayed inTable 2, which are rejected by our analysis, are indicatedwith white crosses. The inferred projected magnetic fieldorientations are shown with red lines.
Figure 5. Map showing magnetic field orientations red lines in-ferred from the BLASTPol 350 µm data. The locations of theprestellar cores discussed by Rygl et al. (2013) are shown withblack lines (where orientations could be robustly derived) and whitecrosses (where no clear orientation could be fit). The map in thebackground shows the Herschel 350 µm dust emission intensitymap.
5.1. Review The Morphology Discussed in Matthews etal.
The morphology of the main filament running in theLupus I region from bottom left to top right in Fig. 5 hasbeen discussed by Matthews et al. (2014). The relationbetween the large-scale magnetic field, as probed withstarlight polarimetry by Rizzo et al. (1998) in the dif-fuse ISM surrounding Lupus I, the magnetic field struc-ture probed in denser regions of the filament with theBLASTPol 2010 data, and the Lupus I main filamentaryshape observed on large-scale, has also been discussed bythese authors. Consistency is found between the meanmagnetic field orientation in dense and diffuse regionsof the ISM, and the elongation of the main filament isfound on average to be nearly perpendicular to the large-scale magnetic field structure as seen in projection on thePOS.Matthews et al. (2014) investigated the relation be-
tween the large-scale magnetic field and an arced filamentmodel that they introduce for more accurately describ-ing the shape of the main filament in Lupus I. This bentfilament is parameterized by an arc of a circle centeredat RA (J2000) = 231.77◦, Dec (J2000)= −37.67◦, witha radius of = 4.92◦. With this model, the authors foundthat the magnetic field orientations probed along highcolumn density regions with submm data, and in the dif-fuse ISM with optical data, bracket the filament normal,differing from it by 9.8◦ and 8.6◦, respectively.
5.2. Core Elongation Distribution vs. Large-ScaleMolecular Cloud Structures
The histogram of the EPAs for the 19 cores passing theanalysis test discussed in Section 4.1 are shown in Fig.3. Data for these 19 cores are listed in Table 1 .The standard deviation is minimized for a distribution
centered around the median value of 95◦, but whether or

9
Figure 6. Histogram of the distribution of the offset angles be-tween the core EPAs and the normal to the arced filament modeldiscussed by Matthews et al. (2014) .
not we try to minimize this parameter, high standard de-viation values of the order of 41◦ are obtained, i.e. valuesquite close to the value of ≈ 52◦ expected for a strictlyrandom distribution (Serkowski 1962). Therefore, theEPAs appear to have no special global alignment withrespect to the large scale main filament model discussedby Matthews et al. (2014), nor do they appear to havea special alignment with respect to the pattern of sec-ondary filaments that often run orthgonally to this largescale main filament.By using the description of the arced filament model
proposed by Matthews et al. (2014) we calculated the off-set PA between each core’s EPA and the local normal tothe bent filament. Figure 6 shows the histogram of thesePA offsets, obtained for the 19 cores passing the selectionof Section 4.1 and listed in Table 1. Here again we find adistribution consistent with random, which means thatno specific orientation can be seen between the EPAs andthe large-scale bent filament model.
5.3. Core Elongation Distribution vs. Magnetic FieldStructures
Due to problems with a damaged blocking IR filterduring flight and resultant systematics, limiting the 2010data set (as discussed by Matthews et al. 2014), the in-formation provided by the BLASTPol 350 µm polarime-try data is pixelized in pixels of size 2.5′ × 2.5′. Thiscorresponds approximately to kernels of 16× 16 pixels inthe Herschel 350 µm intensity map, i.e., about 3.2 timeslarger than the regions used for characterizing the coremorphology structures. Because of this we decided notto compare the orientation of each individual core to itslocal magnetic field structure. As a consequence, in thefollowing we only compare the distribution of the elonga-tion of the cores to the mean magnetic field orientation.The elongation of the main filament is found on aver-
age to be nearly perpendicular to the large-scale mag-netic field structure as seen in projection on the POS(Matthews et al. 2014). Our result therefore also impliesthat there is no specific orientation of the average elonga-tion of the cores with respect to the large-scale structureof the magnetic field that might shape the main filament.However, since the structure of the magnetic fields in
the high density regions (which have not been probedwith submm polarimetry) is not clear, we have searchedfor possible correlations between the elongations of sub-
Table 3Statistics on PA Distributions.
Field Sample Mean Median σ
Size (◦) (◦) (◦)
EPA(Cores)(a) 19 96 95 41PA(B-Field) (b) 26 29 28 9EPA(Cores)(c) 12 114 108 46EPA(Cores)(d) 6 112 108 43EPA(Cores)(e) 2 103 108 7
(a) Average position angle estimate for the sample of cores listed inTable 1.(b) Average inferred magnetic field position angle estimate.(c) Average EPA for the sample of cores with distance less than 7.5′
from a polarization pseudo-vector as seen on the POS.(d) Same as (c) but for a distance lower than 2.5′, similar to the effec-tive beam size of the BLASTPol 2010 data.(e) Same as (c) but for a distance less than 1.25′.
sets of cores having POS displacements from submmpseudo-vectors smaller than various threshold values.Given that the mean width of the Lupus I main filamentis of order 7.5′, we first calculated mean and median EPAestimates for cores having displacements of less than 7.5′
from the nearest pseudo-vector. The standard deviationof the distribution of EPAs for this subset is higher thanthat obtained for the complete set of selected cores, i.e.,it too is consistent with a random distribution. When thesame calculations are performed for a displacement lowerthan the size of the BLASTPol 2010 beam (2.5′), the sizeof the sample (N = 6) starts to be quite small, but thesame conclusion can be drawn. As an ultimate test, wecalculate a mean EPA of 103◦ for the subset of coresmatching within a BLASTPol beam. This means thereis an average offset angle of about 16◦ between the meanshort axis direction of the sample of cores and the meanorientation of the magnetic field of ≈ 29◦. Although thisresult is obtained for a sample of two cores only, it isconsistent within the uncertainties with the results ob-tained by Ward-Thompson et al. (2009) and Tassis et al.(2009), but obviously no strong conclusions can be drawnfrom this.A summary of all these results is displayed in Table 3.
6. DISCUSSION
Our core orientation characterization method is basedon 2D Lorentzian fits, which means that no assumptionson whether the 3D structure of the cores is oblate orprolate have been made. We chose not to investigatethese aspects because, due to the integration of the sig-nal along the LOS, it is not possible to spatially separatethe contribution of the dust emission provided by the fil-ament from that originating in the cores. This is particu-larly the case in crowded regions at different evolutionarystages (see figure A1 of Rygl et al. 2013) where overlap-ping cores add confusion. It has been possible, however,to define EPAs for 19 sources from the 27 objects in thesample, as listed in Table 1.For the remaining targets of the sample listed in Table
2 it was not possible to define EPA values with highconfidence. In the case of core 11, we believe this isa result of projection effects due to the complex three-dimensional structures of this core. The shape of thisobject might be that of an oblate disk seen face-on or of
10
a prolate ellipsoid pointing end up, as indicated by theaxis ratio of unity. The probability of this is expectedto be low (Gammie et al. 2003) but cannot be totallyrejected (Tassis et al. 2009), in particular if the amountof dust emission between the observer and a given core isnegligible. For prestellar cores 4, 7, 14, 21, 22, 23 and 24,the problems with modelling their 2D projected shapesis more likely coming from the complex dust emissionintensity distribution along their LOSs, in particular inregions containing high numbers of cores with embeddedsources (Rygl et al. 2013).With all the limitations mentioned above and the re-
sults discussed previously, the general picture emergingfrom our analysis is that the sample of selected prestel-lar cores surviving our analysis looks quite randomly ori-ented on the POS, and therefore randomly oriented withrespect to the main filament of the Lupus I molecularcloud, as well as with respect to the mean magnetic fieldstructure probed in various density regimes in this region.This last finding is in agreement with the analysis ofsimulated cores (or clumps) provided by Gammie et al.(2003). These authors study the formation of three-dimensional analogs of cores using self-consistent, time-dependent numerical models of molecular clouds. Theirmodels include decay of initially supersonic turbulencein an isothermal, self-gravitating, magnetized fluid. Allsimulated cores are not expected to be self-gravitatingand their axes are not strongly aligned with the large-scale magnetic field.Matthews et al. (2014) suggest a correlation between
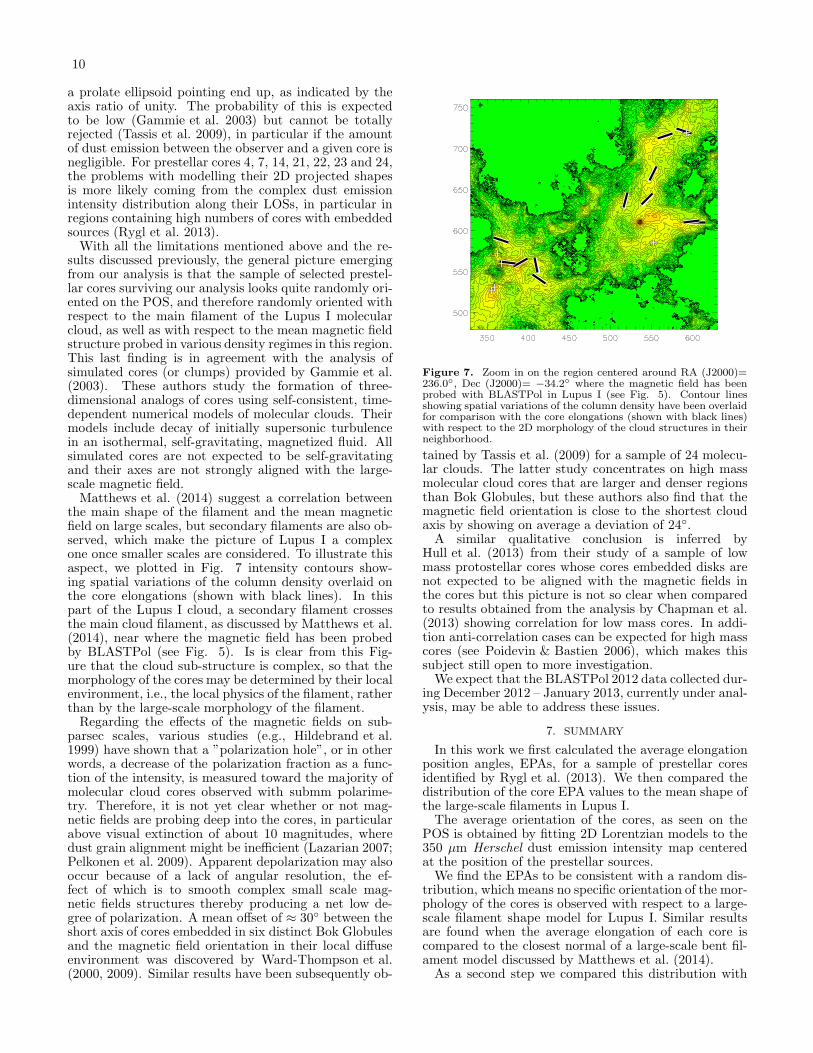
the main shape of the filament and the mean magneticfield on large scales, but secondary filaments are also ob-served, which make the picture of Lupus I a complexone once smaller scales are considered. To illustrate thisaspect, we plotted in Fig. 7 intensity contours show-ing spatial variations of the column density overlaid onthe core elongations (shown with black lines). In thispart of the Lupus I cloud, a secondary filament crossesthe main cloud filament, as discussed by Matthews et al.(2014), near where the magnetic field has been probedby BLASTPol (see Fig. 5). Is is clear from this Fig-ure that the cloud sub-structure is complex, so that themorphology of the cores may be determined by their localenvironment, i.e., the local physics of the filament, ratherthan by the large-scale morphology of the filament.Regarding the effects of the magnetic fields on sub-
parsec scales, various studies (e.g., Hildebrand et al.1999) have shown that a ”polarization hole”, or in otherwords, a decrease of the polarization fraction as a func-tion of the intensity, is measured toward the majority ofmolecular cloud cores observed with submm polarime-try. Therefore, it is not yet clear whether or not mag-netic fields are probing deep into the cores, in particularabove visual extinction of about 10 magnitudes, wheredust grain alignment might be inefficient (Lazarian 2007;Pelkonen et al. 2009). Apparent depolarization may alsooccur because of a lack of angular resolution, the ef-fect of which is to smooth complex small scale mag-netic fields structures thereby producing a net low de-gree of polarization. A mean offset of ≈ 30◦ between theshort axis of cores embedded in six distinct Bok Globulesand the magnetic field orientation in their local diffuseenvironment was discovered by Ward-Thompson et al.(2000, 2009). Similar results have been subsequently ob-
Figure 7. Zoom in on the region centered around RA (J2000)=236.0◦, Dec (J2000)= −34.2◦ where the magnetic field has beenprobed with BLASTPol in Lupus I (see Fig. 5). Contour linesshowing spatial variations of the column density have been overlaidfor comparison with the core elongations (shown with black lines)with respect to the 2D morphology of the cloud structures in theirneighborhood.
tained by Tassis et al. (2009) for a sample of 24 molecu-lar clouds. The latter study concentrates on high massmolecular cloud cores that are larger and denser regionsthan Bok Globules, but these authors also find that themagnetic field orientation is close to the shortest cloudaxis by showing on average a deviation of 24◦.A similar qualitative conclusion is inferred by
Hull et al. (2013) from their study of a sample of lowmass protostellar cores whose cores embedded disks arenot expected to be aligned with the magnetic fields inthe cores but this picture is not so clear when comparedto results obtained from the analysis by Chapman et al.(2013) showing correlation for low mass cores. In addi-tion anti-correlation cases can be expected for high masscores (see Poidevin & Bastien 2006), which makes thissubject still open to more investigation.We expect that the BLASTPol 2012 data collected dur-
ing December 2012 – January 2013, currently under anal-ysis, may be able to address these issues.
7. SUMMARY
In this work we first calculated the average elongationposition angles, EPAs, for a sample of prestellar coresidentified by Rygl et al. (2013). We then compared thedistribution of the core EPA values to the mean shape ofthe large-scale filaments in Lupus I.The average orientation of the cores, as seen on the
POS is obtained by fitting 2D Lorentzian models to the350 µm Herschel dust emission intensity map centeredat the position of the prestellar sources.We find the EPAs to be consistent with a random dis-
tribution, which means no specific orientation of the mor-phology of the cores is observed with respect to a large-scale filament shape model for Lupus I. Similar resultsare found when the average elongation of each core iscompared to the closest normal of a large-scale bent fil-ament model discussed by Matthews et al. (2014).As a second step we compared this distribution with

11
the mean orientation of the magnetic fields probed with350 µm polarimetry in the high density regions of LupusI with the BLASTPol experiment. Here again we donot find any correlation with respect to the large-scalemagnetic field structure.Our main conclusion is that the local filament dynam-
ics – including secondary filaments that often run orthog-onally to the primary filament – and possibly small-scalevariations in the local magnetic field direction, could bethe dominant factors to explain the final orientation ofeach core.The BLASTPol collaboration acknowledges support
from NASA (through grant numbers NAG5-12785,NAG5-13301, NNGO-6GI11G, NNX0-9AB98G, and theIllinois Space Grant Consortium), the Canadian SpaceAgency (CSA), the Leverhulme Trust through the Re-search Project Grant F/00 407/BN, Canadas NaturalSciences and Engineering Research Council (NSERC),the Canada Foundation for Innovation, the Ontario Inno-vation Trust, the Puerto Rico Space Grant Consortium,the Fondo Institucional para la Investigacion of the Uni-versity of Puerto Rico, and the National Science Foun-dation Office of Polar Programs. C.B. Netterfield alsoacknowledges support from the Canadian Institute forAdvanced Research. Finally, we thank the Columbia Sci-entific Balloon Facility (CSBF) staff for their outstandingwork.
REFERENCES
Angile, E. and the BLASTPol team. In prep.Ballesteros-Paredes, J., Hatmann, L.W., Vasquez-Semadeni, E.,
Heitsch, F., Zamora-Aviles, M.A. 2011, MNRAS, 411, 65.Bonnell, I.A., Dobbs, C.L., Smith R.J.2013, MNRAS, 430, 1790.Chapman, N.L., Davidson, J.A., Goldsmith, P.F., Houde, M.,
Kwon, W. et al., 2013 ApJ, in press.Falceta-Goncalves, D., Lazarian, A., Kowal, G. 2008, ApJ, 679,
537-551.Gammie, C.F., Lin, Y.-T., Ostriker, E. C., Stone, J.M. 2003, ApJ,
592, 203.Girart, J.M., Frau, P., Zhang, Q., Koch, P.M., Qiu, K., Tang,
Y.-W., Lai, S.-P., Ho, P.T.P. 2013, ApJ, 772, 69.
Hildebrand, R.H., Dotson, J.L., Dowell, C.D., Schleuning, D.A.,Vaillancourt, J.E. 1999, ApJ, 516, 834.
Heitsch, F., Stone, J.M., Hartmann, L.W. 2009, ApJ, 695, 248.Hara, A., Tachihara, K., Mizuno, A., Onishi, T., Kawamura, A.,
Obayashi, A., Fukui, Y. 1999, PASJ, 51, 895.Hull, C.L.H., Plambeck, R.L., Bolatto, A.D., Bower, G.C.,
Carpenter, J.M. et al., 2013 ApJ, 768, 159.Lazarian, A. 2007, JQSRT, 106, 225.Leao, M. R. M., de Gouveia Dal Pino, E. M., Santos-Lima, R.,
Lazarian, A. 2013, ApJ, in press.Lombardi, L., Lada, C.J., Alves, J. 2008, a, 480, 785.Matthews, T. G., Ade. P. A. R., Angile, F. E., Benton, S. J.,
Chapin, E. L. et. al 2014, ApJ, 784, 116.Molinari, S., Bally, J., Glover, S., Moore, T., Noriega-Crespo, A.
et al., arXiv:1402.6196.Moncelsi, L., Ade, P., Angile, F. E., Benton, S.J., Devlin, M. et
al., 2014 MNRAS, 437, 2772.McKee, C.F., Ostriker, E.C. 2007, ARAA, 45, 565.Nakamura, F., Li, Z.-Y. 2011, ApJ, 740, 36.Pascale, E., Ade, P.A.R., Angile, F.E. et. al 2012, SPIE Vol. 8444,
15.Pelkonen, V.-M., Juvela, M., Padoan, P. 2009, A&A, 502, 833.Poidevin, F. & Bastien, P. 2006, ApJ, 650, 945.Poidevin, F., Falceta-Goncalves, D., Kowal, G., De Gouveia Del
Pino, E., Magalhaes, A.M., 2013, ApJ, 777, 112.Rizzo, J., Morras, R., Arnal, E. 1998, MNRAS, 300, 497.Rygl, K. L. J., Benedettini, M., Schisano, E. et al. 2013, A&A,
549, L1.Ostriker, E. C., Stone, J.M., Gammie, C.F. 2001, ApJ, 546, 980.
Serkowski, K. 1962, Advances in Astronomy and Astrophysics,ed. Z. Kopal (New York: Academic), 290.
Schneider, N., Andr e, Ph., Konyves, V., Bontemps, S., Motte, F.et al. 2013, ApJ, 766, L17.
Tassis, K., Dowell, C.D., Hildebrand, R.H., Kirby, L.,Vaillancourt, J.E. 2009, MNRAS, 399, 1681.
Tassis, K., Talayeh, H., Willacy, K. 2012, ApJ760, 57.Tassis, K., Willacy, K., Yorke, H. W., Turner, N. J. 2012,
ApJ754, 6.Tassis, K., Willacy, K., Yorke, H. W., Turner, N., J. 2012,
ApJ745, 68.Ward, R. L., Wadsley, J., Sills, A. MNRAS 2014, 439, 651.Ward-Thompson, D., Kirk,J. M., Crutcher, R. M.; Greaves, J. S.,
Holland, W. S., Andr e, P. 2000, MNRAS 537, 135.Ward-Thomspon, D., Sen , A.K., Kirk, J.M., Nutter, D. 2009,
MNRAS, 398, 394.