comparison of residential satisfaction among young households in three unplanned neighbourhoods in...
DESCRIPTION
IOSR Journal Of Humanities And Social Science (IOSR-JHSS) vol.20 issue.3 version.4TRANSCRIPT
IOSR Journal Of Humanities And Social Science (IOSR-JHSS)
Volume 20, Issue 3, Ver. IV (Mar. 2015), PP 42-53 e-ISSN: 2279-0837, p-ISSN: 2279-0845.
www.iosrjournals.org
DOI: 10.9790/0837-20344253 www.iosrjournals.org 42 | Page
Comparison of Residential Satisfaction among Young Households
in Three Unplanned Neighbourhoods in Kano Metropolis, Nigeria
Ado Abdu1*
, Ahmad Hariza Hashim2
1Department of Geography, Faculty of Earth and Environmental Sciences, Kano University of Science and
Technology, Wudil, Kano, Nigeria 2Faculty of Human Ecology, Universiti Putra Malaysia, 43400 UPM Serdang, Selangor, Malaysia
Abstract: This study compared residential satisfaction among young households in three unplanned
neighbourhoods namely; Wailari, Dorayi Karama and Gama E in Kano, Nigeria. The data for the study was
collected randomly from 364 respondents in the neighbourhoods, using self-administered questionnaire and was
analysed using descriptive statistics and One-way analysis of variance (One-way ANOVA).The result showed
that the overall residential satisfaction of the young households was moderate in all the neighbourhoods. The
households were most satisfied in Gama E followed by those in Wailari and the least satisfied those in Dorayi.
One-way ANOVA revealed that there were statistically significant differences in the mean satisfaction with housing features, neighbourhood facilities and neighbourhood accessibility among the respondents in all the
neighbourhoods. The findings revealed that there was no significant difference in the mean of satisfaction with
housing conditions in the neighbourhoods. Post-hoc comparison test indicated that satisfaction with
neighbourhood accessibility differed among the respondents in the three neighbourhoods, while satisfaction
with housing features, neighbourhood facilities differed between Wailari and Dorayi Karama and no difference
was found between Wailari and Gama E. This finding suggests that policy makers and planning authorities
should enhance residential satisfaction of young households by improving their housing and neighbourhood
conditions as well as ways as their socio-economic situations.
Keywords: Household, housing, neighbourhoods, satisfaction, young,
I. Introduction
Assessment of residential environment is beyond the general assumption of physical and structural
adequacy of a housing unit (Jiboye, 2009). Housing for people at all socio-economic class or group is more than
mere shelter (Onibokun, 1974). It offers other services such as security, neighbourhood and social relations,
community facilities and services, access to job and control over the environment (Vera-Toscano and Ateca-
Amestoy, 2008). Housing is an essential aspect of individual‟s quality of life, wellbeing and a measure of
individual‟s standard of living and status in the society (Jiboye, 2009; Jansen, 2014). Moreover, households
spent most their working hours in buildings and most of their leisure time at home or in close by neighbourhood
(Garcia-Mira et al., 2005). Households‟ opinion about their residential environment is fundamental to their
quality of life (Caldieron, 2013). Residential satisfaction is households‟ judgment about their housing
environment regarding their needs, expectations and achievements (Amérigo & Aragonés, 1997; Jansen, 2012). Thus, knowledge on factors that determine household‟s satisfaction with housing and neighbourhood is central
to their quality of life and would be a guide for improving housing policies (Lu, 1999; Dunstan et al., 2005;
Jiboye, 2010; Zanuzdana, 2012).
The concept of residential satisfaction has many definitions and applications depending on the context
it occurs. It has been conceptualised as the difference between actual and preferred housing situations (Galster
and Hesser, 1981; Galster, 1987). Individual assesses residential situations in accordance with his needs, desires
and expectation (Amérigo and Aragonés 1997; Vera-Toscano and Ateca-Amestoy, 2008). If one is satisfied with
his situations signifies lack of complaint with one‟s housing conditions and shows the extent of a match between
actual and desired situations, while a mismatch between current housing and desired conditions could lead to
dissatisfaction (Vera-Toscano and Ateca-Amestoy, 2008). Residents‟ satisfaction is central to model of
„Housing adjustment of residential mobility‟ developed by Morris and Winter (1975, 1978) who conceptualised „„housing deficit‟‟. They claimed that households evaluate their housing situations in accordance with family
and cultural norms which are unlikely to be congruent. This lack of congruence between the actual housing
conditions and the housing norms leads to housing deficit which in turn produces housing dissatisfaction
resulting to some form of housing adjustment or mobility. The households could make an in-situ adjustment by
revisiting their housing needs; improve their houses through modifications or to undertake residential mobility
(Mohit and Nazyddah, 2011). Previous literature show that there is link between attributes of residential
environment and residential satisfaction of the individual and households in various housing environments
Comparison of Residential Satisfaction among Young Households in Three...
DOI: 10.9790/0837-20344253 www.iosrjournals.org 43 | Page
(Vera-Toscano and Ateca-Amestoy, 2008; Zanuzdana, 2012; Ibem and Aduwo, 2013; Wu, 2010; Li and Wu,
2013; Jansen, 2014; Makinde, 2014).
Studies on residential satisfaction focused on the perceptions of individuals and households living in a well-planned public or private housing developments in both developed and developing countries, while there
was little concern on the households living in unplanned or informal neighbourhoods (Zanuzdana et al., 2012;
Caldieron, 2011; Caldieron and Miller, 2013). Many of these studies also focused on households of all age
group, while little was known on the level of residential satisfaction among young households with children
living in unplanned neighbourhoods whose housing and neighbourhood needs differ from other age groups such
as young couples without children and older couples with shrinking households (Clark and Onaka, 1983).
Young households with children have special housing and neighbourhood preference for spacious housing with
many rooms, services and with neighbourhood free from crime as well as access to facilities (Clark and Onaka,
1983; Wu, 2010; Abdu, Hashim, Abu Samah & Salim, 2014). Unplanned neighbourhood provides housing for
significant proportion of urban dwellers in developing countries, especially for the poor and low income,
especially young household (Kironde, 2012; Khalifa, 2011). This residential environment is the cheapest means for owning house or renting these residents. This housing environment suffered inadequate provision of
facilities as a result of its haphazard development. For instant, most traditional cities in Nigerian lack adequate
urban facilities and services and sometimes variation in the provision of facilities exists among neighbourhoods
(Muoghalu, 1991, Bashir, 2003). This situation affects residential satisfaction of poor and low income
households in unplanned neighbourhoods. To address the problem of unplanned residential development in
urban centres in Nigeria through provision of planned housing, there is need to assess the views of these
households about their residential situations and future needs. One of the criteria used for assessing actual
residential conditions and needs of the household is residential satisfaction.
Based on these arguments, this paper aimed at comparing and determining residential satisfaction of
young households in three unplanned neighbourhoods in Kano, Nigeria namely Wailari, Dorayi Karama and
Gama E. The objectives were to compare level of satisfaction with residential components among the
respondents and to determine relationships and contributions of satisfaction with each component to the overall residential satisfaction of the respondents in the neighbourhoods.
1.1 The concept of unplanned Neighbourhood
A projection by UN has estimated that more than 50% of the world population will live in unplanned
areas by the year 2035 (Horwood, 2007). Unplanned neighbourhoods are informal residential area characterised
by non-compliance to planning and building laws regulations (Khalifa, 2011). The umbrella concept of all
informal areas is “slum” which comprises of several settlements such as decaying inner-city tenements, squatter
settlements, informal settlements and shantytowns (Khalifa, 2011). The world Bank and UNHS (Habitat),
(2000) refers to it as informality. Khalifa (2011) stated that informality indicates substandard, illegal or
disrespecting building laws and planning regulations. These areas are developed haphazardly, at times on
marginal land, lacking in basic infrastructure, landowners have no certificates of title and their development is attributed to poor regulatory structures that put formal land and housing to poor households inaccessible
(Kironde, 2012).
Significant proportion of urban households lives in unplanned areas in developing countries (Kironde,
2012). Numerous cities in these countries have large areas of unplanned developments (Busgeeth, Brits &
Whisken, 2008), which are claimed to exceed the number of planned developments (Kombe, 2005). Planned
areas are formal developments that have the legal basis of the planning agency and developed within the
structure of government rules, controls and regulations (Sivam, 2003). Common spatial feature for unplanned
areas include for example; non- compliance with planning standards or the absence of planned public open
spaces (Weeks, Hill, Stow, Getis & Fugate 2007). The density of unplanned area was higher compared to low-
moderate in planned areas, and the building sizes in unplanned neighbourhoods were smaller and substandard
compared to larger building in planned areas (Kuffer and Barros, 2011).
1.2 Background of the study Area
Kano Metropolis is one of the largest cities in Nigeria and a capital city of Kano State. It is located
between latitude 11° 55´ 23.93" N to 12° 3´ 53.10" N and longitude 8o 27´ 42.26" E to 8° 36´ 41.62" E and is
1549 feet above sea level (Dankani, 2013). The metropolis comprises eight out of forty-four Local Governments
Councils in Kano State and the first largest commercial and industrial centre in Northern Nigerian and the
second in the whole Nigeria (Mustapha, Abdu & Geidam, 2013). Kano has been experiencing higher population
growth and rapid urbanization, since independence in 1960 (Nabegu, 2010; Dankani, 2013; Muhammad and
Bichi, 2014). For instance, in 1932, the population of Kano was estimated to be only 83,000, by 1952, it was
estimated at 127,000, while it had increased to 295,432 in 1963, 760,000 in 1973, 1.6 million in 1991 and 2.84
million in 2006 census, and its current growth rate was estimated at 5.5% per annum (Mustapha & Yakudima,
Comparison of Residential Satisfaction among Young Households in Three...
DOI: 10.9790/0837-20344253 www.iosrjournals.org 44 | Page
2008; Mustapha and Abdu, 2012; Dankani, 2013). The growth has manifested in the high proportion of young
households in Kano city. According to National Population Commission (NPC, 2009), Kano has over 772 850
young households whose age was between 25 and 44 years accounting for 6.15% of the national figure. The current population growth of Kano metropolis leads to increase in the demands for urban facilities and services
including housing which is currently inadequate both in terms of quantity and quality (Muhammad and Bichi,
2014). This situation resulted in the emergence of slums and unplanned residential areas within the metropolis
which are growing faster than the planned residential areas (Dankani, 2013; Muhammad and Bichi, 2014).
Home (1986) argued that over two – third of the built-up areas within the metropolitan Kano were unplanned.
Housing situations of these unplanned areas in the metropolis include overcrowding, lack of drainages, poor
access roads, inadequate water and electricity supplies and had become sources of concern (Muhammad and
Bichi, 2014). They pointed out that Kano State Government realised the dangers of such situations and instantly
banned new illegal housing development in these unplanned areas. The current study areas are among these
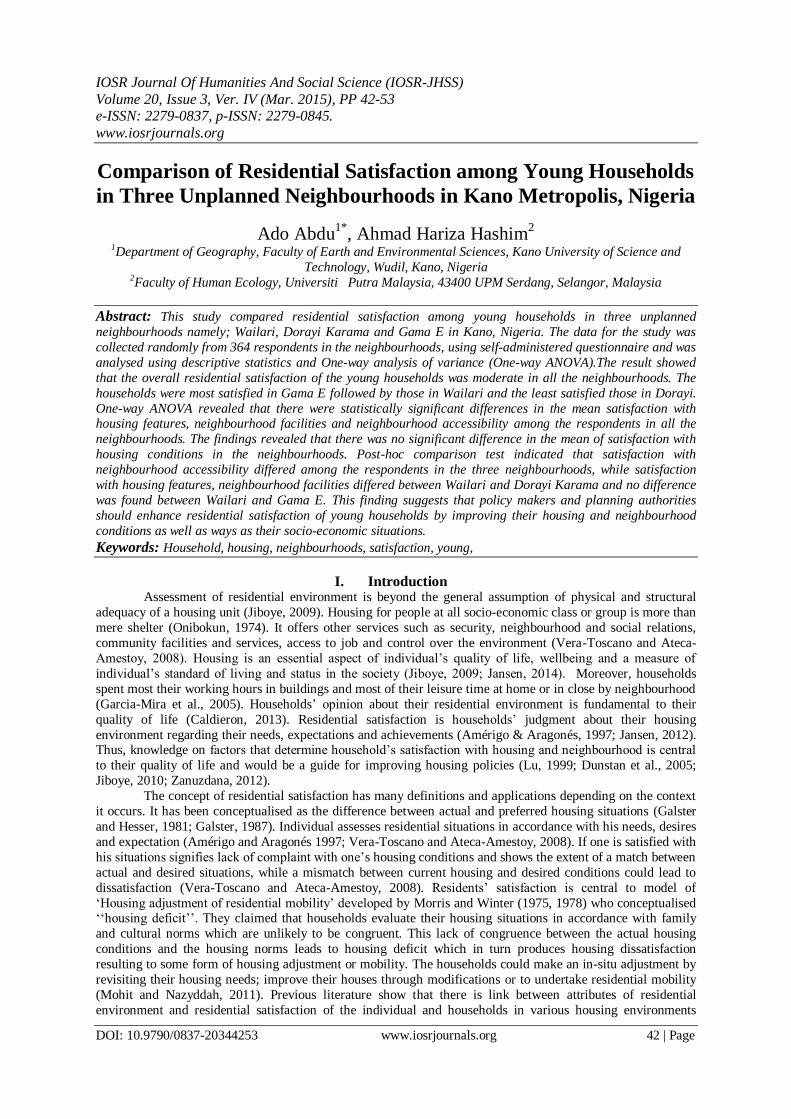
unplanned neighbourhoods located at different sections of the metropolis: Dorayi is located at the western part,
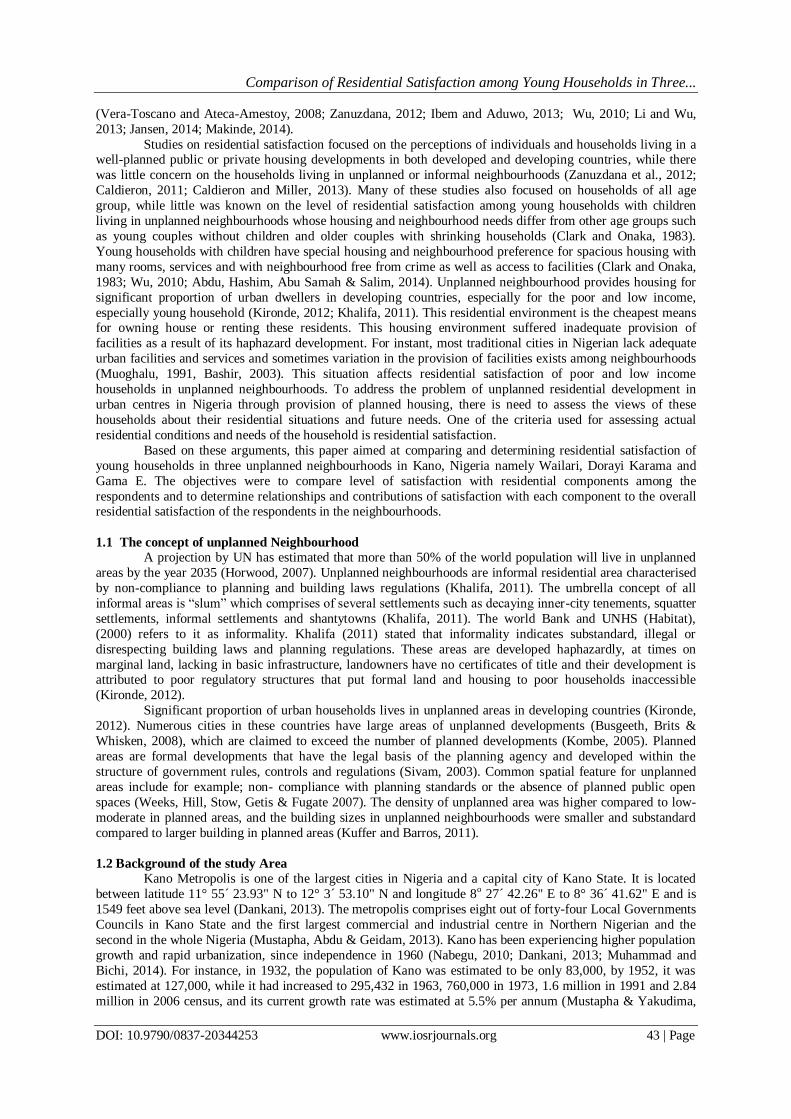
Wailari at the south, Gama E at the eastern part, and the neighbourhoods are medium density areas (fig.1). Houses in these unplanned areas included single family attached houses, traditional compound houses, two
storey houses and Bungalow houses, self-built haphazardly of different sizes and qualities (fig. 2).
House plans for single house (attached) in the neighbourhood are not similar with one another as
everyone built his own house using the services of some architects and local builders. A typical single family
attached house (fig. 3 & fig. 4) had two self-contained sections and each has a bedroom with a living room, a
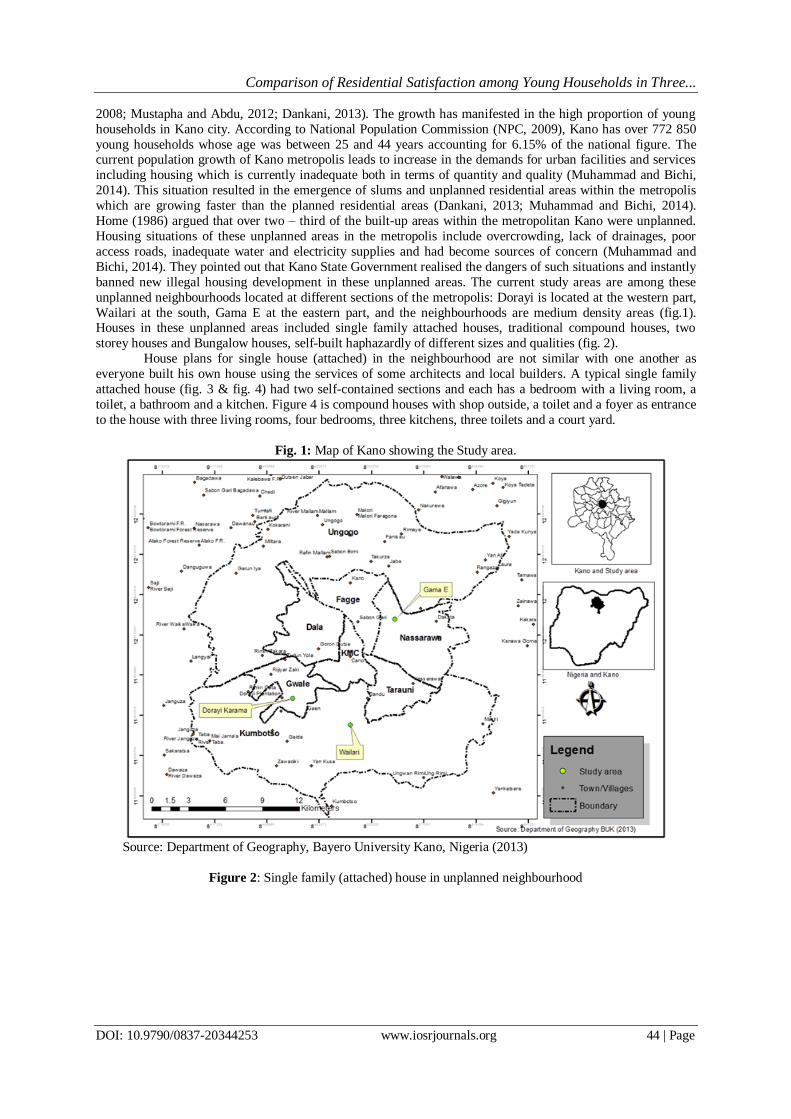
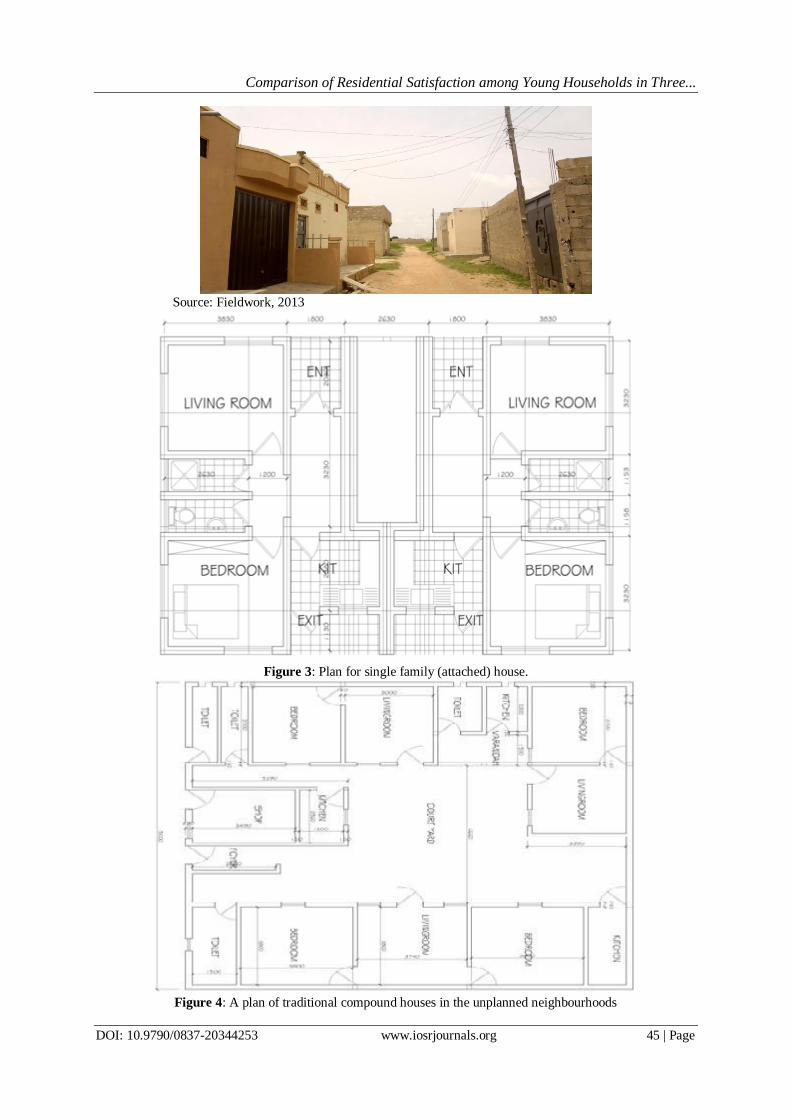
toilet, a bathroom and a kitchen. Figure 4 is compound houses with shop outside, a toilet and a foyer as entrance
to the house with three living rooms, four bedrooms, three kitchens, three toilets and a court yard.
Fig. 1: Map of Kano showing the Study area.
Source: Department of Geography, Bayero University Kano, Nigeria (2013)
Figure 2: Single family (attached) house in unplanned neighbourhood
Comparison of Residential Satisfaction among Young Households in Three...
DOI: 10.9790/0837-20344253 www.iosrjournals.org 45 | Page
Source: Fieldwork, 2013
Figure 3: Plan for single family (attached) house.
Figure 4: A plan of traditional compound houses in the unplanned neighbourhoods
Comparison of Residential Satisfaction among Young Households in Three...
DOI: 10.9790/0837-20344253 www.iosrjournals.org 46 | Page
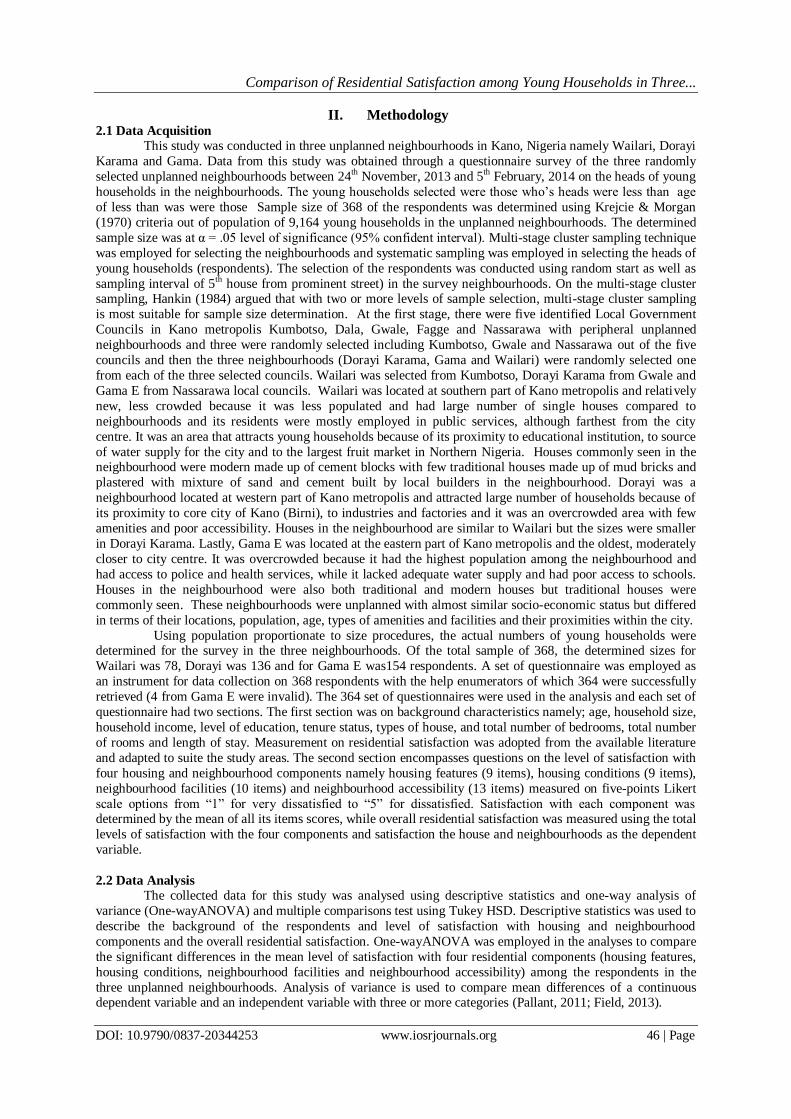
II. Methodology
2.1 Data Acquisition
This study was conducted in three unplanned neighbourhoods in Kano, Nigeria namely Wailari, Dorayi
Karama and Gama. Data from this study was obtained through a questionnaire survey of the three randomly
selected unplanned neighbourhoods between 24th November, 2013 and 5th February, 2014 on the heads of young
households in the neighbourhoods. The young households selected were those who‟s heads were less than age
of less than was were those Sample size of 368 of the respondents was determined using Krejcie & Morgan
(1970) criteria out of population of 9,164 young households in the unplanned neighbourhoods. The determined
sample size was at α = .05 level of significance (95% confident interval). Multi-stage cluster sampling technique
was employed for selecting the neighbourhoods and systematic sampling was employed in selecting the heads of
young households (respondents). The selection of the respondents was conducted using random start as well as
sampling interval of 5th house from prominent street) in the survey neighbourhoods. On the multi-stage cluster sampling, Hankin (1984) argued that with two or more levels of sample selection, multi-stage cluster sampling
is most suitable for sample size determination. At the first stage, there were five identified Local Government
Councils in Kano metropolis Kumbotso, Dala, Gwale, Fagge and Nassarawa with peripheral unplanned
neighbourhoods and three were randomly selected including Kumbotso, Gwale and Nassarawa out of the five
councils and then the three neighbourhoods (Dorayi Karama, Gama and Wailari) were randomly selected one
from each of the three selected councils. Wailari was selected from Kumbotso, Dorayi Karama from Gwale and
Gama E from Nassarawa local councils. Wailari was located at southern part of Kano metropolis and relatively
new, less crowded because it was less populated and had large number of single houses compared to
neighbourhoods and its residents were mostly employed in public services, although farthest from the city
centre. It was an area that attracts young households because of its proximity to educational institution, to source
of water supply for the city and to the largest fruit market in Northern Nigeria. Houses commonly seen in the neighbourhood were modern made up of cement blocks with few traditional houses made up of mud bricks and
plastered with mixture of sand and cement built by local builders in the neighbourhood. Dorayi was a
neighbourhood located at western part of Kano metropolis and attracted large number of households because of
its proximity to core city of Kano (Birni), to industries and factories and it was an overcrowded area with few
amenities and poor accessibility. Houses in the neighbourhood are similar to Wailari but the sizes were smaller
in Dorayi Karama. Lastly, Gama E was located at the eastern part of Kano metropolis and the oldest, moderately
closer to city centre. It was overcrowded because it had the highest population among the neighbourhood and
had access to police and health services, while it lacked adequate water supply and had poor access to schools.
Houses in the neighbourhood were also both traditional and modern houses but traditional houses were
commonly seen. These neighbourhoods were unplanned with almost similar socio-economic status but differed
in terms of their locations, population, age, types of amenities and facilities and their proximities within the city.
Using population proportionate to size procedures, the actual numbers of young households were determined for the survey in the three neighbourhoods. Of the total sample of 368, the determined sizes for
Wailari was 78, Dorayi was 136 and for Gama E was154 respondents. A set of questionnaire was employed as
an instrument for data collection on 368 respondents with the help enumerators of which 364 were successfully
retrieved (4 from Gama E were invalid). The 364 set of questionnaires were used in the analysis and each set of
questionnaire had two sections. The first section was on background characteristics namely; age, household size,
household income, level of education, tenure status, types of house, and total number of bedrooms, total number
of rooms and length of stay. Measurement on residential satisfaction was adopted from the available literature
and adapted to suite the study areas. The second section encompasses questions on the level of satisfaction with
four housing and neighbourhood components namely housing features (9 items), housing conditions (9 items),
neighbourhood facilities (10 items) and neighbourhood accessibility (13 items) measured on five-points Likert
scale options from “1” for very dissatisfied to “5” for dissatisfied. Satisfaction with each component was determined by the mean of all its items scores, while overall residential satisfaction was measured using the total
levels of satisfaction with the four components and satisfaction the house and neighbourhoods as the dependent
variable.
2.2 Data Analysis
The collected data for this study was analysed using descriptive statistics and one-way analysis of
variance (One-wayANOVA) and multiple comparisons test using Tukey HSD. Descriptive statistics was used to
describe the background of the respondents and level of satisfaction with housing and neighbourhood
components and the overall residential satisfaction. One-wayANOVA was employed in the analyses to compare
the significant differences in the mean level of satisfaction with four residential components (housing features,
housing conditions, neighbourhood facilities and neighbourhood accessibility) among the respondents in the
three unplanned neighbourhoods. Analysis of variance is used to compare mean differences of a continuous dependent variable and an independent variable with three or more categories (Pallant, 2011; Field, 2013).
Comparison of Residential Satisfaction among Young Households in Three...
DOI: 10.9790/0837-20344253 www.iosrjournals.org 47 | Page
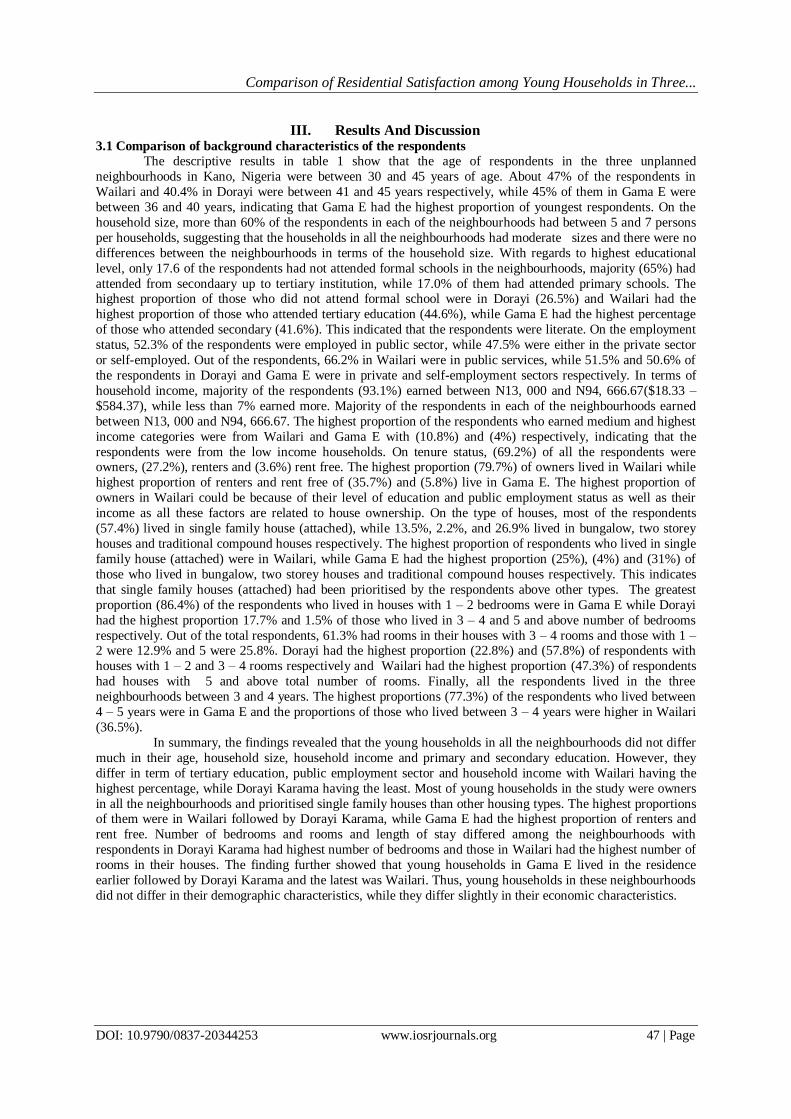
III. Results And Discussion
3.1 Comparison of background characteristics of the respondents
The descriptive results in table 1 show that the age of respondents in the three unplanned
neighbourhoods in Kano, Nigeria were between 30 and 45 years of age. About 47% of the respondents in
Wailari and 40.4% in Dorayi were between 41 and 45 years respectively, while 45% of them in Gama E were
between 36 and 40 years, indicating that Gama E had the highest proportion of youngest respondents. On the
household size, more than 60% of the respondents in each of the neighbourhoods had between 5 and 7 persons
per households, suggesting that the households in all the neighbourhoods had moderate sizes and there were no
differences between the neighbourhoods in terms of the household size. With regards to highest educational
level, only 17.6 of the respondents had not attended formal schools in the neighbourhoods, majority (65%) had
attended from secondaary up to tertiary institution, while 17.0% of them had attended primary schools. The highest proportion of those who did not attend formal school were in Dorayi (26.5%) and Wailari had the
highest proportion of those who attended tertiary education (44.6%), while Gama E had the highest percentage
of those who attended secondary (41.6%). This indicated that the respondents were literate. On the employment
status, 52.3% of the respondents were employed in public sector, while 47.5% were either in the private sector
or self-employed. Out of the respondents, 66.2% in Wailari were in public services, while 51.5% and 50.6% of
the respondents in Dorayi and Gama E were in private and self-employment sectors respectively. In terms of
household income, majority of the respondents (93.1%) earned between N13, 000 and N94, 666.67($18.33 –
$584.37), while less than 7% earned more. Majority of the respondents in each of the neighbourhoods earned
between N13, 000 and N94, 666.67. The highest proportion of the respondents who earned medium and highest
income categories were from Wailari and Gama E with (10.8%) and (4%) respectively, indicating that the
respondents were from the low income households. On tenure status, (69.2%) of all the respondents were owners, (27.2%), renters and (3.6%) rent free. The highest proportion (79.7%) of owners lived in Wailari while
highest proportion of renters and rent free of (35.7%) and (5.8%) live in Gama E. The highest proportion of
owners in Wailari could be because of their level of education and public employment status as well as their
income as all these factors are related to house ownership. On the type of houses, most of the respondents
(57.4%) lived in single family house (attached), while 13.5%, 2.2%, and 26.9% lived in bungalow, two storey
houses and traditional compound houses respectively. The highest proportion of respondents who lived in single
family house (attached) were in Wailari, while Gama E had the highest proportion (25%), (4%) and (31%) of
those who lived in bungalow, two storey houses and traditional compound houses respectively. This indicates
that single family houses (attached) had been prioritised by the respondents above other types. The greatest
proportion (86.4%) of the respondents who lived in houses with 1 – 2 bedrooms were in Gama E while Dorayi
had the highest proportion 17.7% and 1.5% of those who lived in 3 – 4 and 5 and above number of bedrooms
respectively. Out of the total respondents, 61.3% had rooms in their houses with 3 – 4 rooms and those with 1 – 2 were 12.9% and 5 were 25.8%. Dorayi had the highest proportion (22.8%) and (57.8%) of respondents with
houses with 1 – 2 and 3 – 4 rooms respectively and Wailari had the highest proportion (47.3%) of respondents
had houses with 5 and above total number of rooms. Finally, all the respondents lived in the three
neighbourhoods between 3 and 4 years. The highest proportions (77.3%) of the respondents who lived between
4 – 5 years were in Gama E and the proportions of those who lived between 3 – 4 years were higher in Wailari
(36.5%).
In summary, the findings revealed that the young households in all the neighbourhoods did not differ
much in their age, household size, household income and primary and secondary education. However, they
differ in term of tertiary education, public employment sector and household income with Wailari having the
highest percentage, while Dorayi Karama having the least. Most of young households in the study were owners
in all the neighbourhoods and prioritised single family houses than other housing types. The highest proportions of them were in Wailari followed by Dorayi Karama, while Gama E had the highest proportion of renters and
rent free. Number of bedrooms and rooms and length of stay differed among the neighbourhoods with
respondents in Dorayi Karama had highest number of bedrooms and those in Wailari had the highest number of
rooms in their houses. The finding further showed that young households in Gama E lived in the residence
earlier followed by Dorayi Karama and the latest was Wailari. Thus, young households in these neighbourhoods
did not differ in their demographic characteristics, while they differ slightly in their economic characteristics.

Comparison of Residential Satisfaction among Young Households in Three...
DOI: 10.9790/0837-20344253 www.iosrjournals.org 48 | Page
Table 1: Background of the respondents Variables / Categories Wailari Dorayi Gama E Total
N = 74 N = 136 N = 154 N = 364
Age
30-35yrs 17(23.0) 44(32.4) 50(32.5) 111(30.5)
36-40yrs 22(30.0) 37(27.2) 70(45.5) 129(35.4)
41-45yrs 35(47.0) 55(40.4) 34(22.0) 124(34.1)
Household Size
2-4 persons 7(9.5) 19(14) 12(8.0) 38(10.0)
5-7 persons 47(63.5) 95(70) 116(75.0) 258(71.0)
8 persons and above 20(27.0) 22(16) 26(17.0) 68(19.0)
Level of Education
Not attended formal School 8(10.8) 36(26.5) 20(13.0) 64(17.6)
Primary School 13(17.6) 17(12.5) 32(20.7) 62(17.0)
Secondary School 20(27.0) 51(37.5) 64(41.6) 135(37.1)
Tertiary Institution 33(44.6) 32(23.5) 38(24.7) 103(28.3)
Employment Status
Public 49(66.2) 66(48.5) 76(49.4) 191(52.5)
Private/Self employed 25(33.78) 70(51.5) 78(50.6) 173(47.5)
Tenure Status
Owner 59(79.7) 103(75.7) 90(58.4) 252(69.2)
Renter 13(17.6) 31(22.8) 55(35.7) 99(27.2)
Rent Free 2(2.7) 2(1.5) 9(5.8) 13(3.6)
Household Monthly Income (NGN 162
Naira=USD 1)
N13,500 – N94666.67 65(87.8) 135(99.0) 139(90.0) 339(93.1)
N94666.68 – N175833.34 8(10.8) 0(0.0) 9(6.0) 17(4.7)
N175833.35 and above 1(1.4) 1(0.7) 6(4.0) 8(2.2)
Type of House
Bungalow 10(13.5) 1(1.0) 38(25.0) 49(13.5)
Two-storey house 2(2.7) 0(0.0) 6(4.0) 8(2.2)
Traditional compound house 10(13.5) 40(29.0) 48(31.0) 98(26.9)
Single Family House (attached) 52(70.3) 95(70.0) 62(40.0) 209(57.4)
Number of Bedrooms
1-2 rooms 57(77.0) 110(80.9) 133(86.4) 300(82.4)
3-4 rooms 16(21.6) 24(17.7) 21(13.6) 61(16.8)
5 rooms and above 1(1.4) 2(1.5) 0(0.0) 3(0.8)
Number of Rooms
1-2 rooms 6(8.1) 31(22.8) 10(6.5) 47(12.9)
3-4 rooms 33(44.6) 78(57.4) 112(70.7) 223(61.3)
5 rooms and above 35(47.3) 27(19.9) 32(20.8) 94(25.8)
Length of Stay
3-4 years 27(36.5) 41(30.0) 35(22.7) 103(28.3)
4-5 years 47(63.5) 95(70.0) 119(77.3) 261(71.7)
Fieldwork, 2013
Notes: Figures inside the brackets denote percentages and those outside represent frequencies.
3.2 Descriptive analysis of Satisfaction with Residential Components in the Three Unplanned
Neighbourhoods
Table 2 presents descriptive analysis of the mean and standard deviation scores of satisfaction of the
respondents with both housing and neighbourhood components in the three unplanned neighbourhoods (Wailari,
Dorayi Karama and Gama E). The findings show that the respondents in Wailari had mean satisfaction score of
(3.93) with housing features, those in Gama E had (3.80) and the mean satisfaction score for Dorayi Karama
was (3.68). This suggests that Wailari had the highest mean satisfaction score with housing features compared to
Gama E and Dorayi Karama, while the finding shows that Dorayi Karama had the lowest mean among the
neighbourhoods. The highest mean satisfaction with Wailari could be because it is the newest neighbourhood
and the buildings are new, while the lowest mean satisfaction among respondents in Dorayi could be attributed
to overcrowding as the size of houses in the neighbourhood are smaller and are compound houses accommodating many households. The current size of the household and future expectation of more children
and need for more housing space could also be attributed to low mean satisfaction of young households in
Dorayi Karama. In Nigeria, like in many West African countries, a typical family has more than five members
and it may include relatives and other dependents (Ukoha and Beamish, 1997; Addo, 2012). This indicates that
the single family houses most of them are living in, might not satisfy their needs because of large household size
or future needs for more children and or the need for social support they used to enjoy in compound houses
(Addo, 2012). The findings on the mean satisfaction with housing conditions in the neighbourhoods showed
that the respondents Gama E had mean score of (3.91), those Dorayi had (3.89) and the mean satisfaction of
Comparison of Residential Satisfaction among Young Households in Three...
DOI: 10.9790/0837-20344253 www.iosrjournals.org 49 | Page
those in Wailari was (3.87). The findings further showed that the young households in Gama E had the highest
mean level of satisfaction compared to Dorayi Karama and Wailari. The low mean of satisfaction with housing
conditions among respondents in Dorayi Karama and Wailari could be because houses in those neighbourhoods offer little sound proof, adequate fenestration and good visual privacy especially in rental houses. This could
also be attributed to the small sizes of the houses and type of houses in the neighbourhoods compared to Gama
E. Significant proportion of houses in Gama E were older and traditional, but residential plots, though not
planned were much bigger compared to Dorayi Karama and Wailari which are smaller because of subdivision.
The houses made on this subdivided unplanned layouts lack enough spaces for good sound proof structure,
adequate fenestrations and good visual privacy. Thus, the low mean satisfaction of the respondents with visual
privacy suggests that, there is high privacy needs among them. This is because privacy need in houses is highly
needed in Nigeria (Ukoha and Beamish, 1997). On the mean satisfaction with neighbourhood facilities, the
finding from Table 3 showed that the respondents in Gama E had (3.74) mean of satisfaction the facilities, those
in Dorayi Karama had (3.49) and those in Wailari were having a mean satisfaction score of (3.41). The finding
reveals that that mean of satisfaction with the facilities was higher in Gama E compared to Dorayi Karama and Wailari. This could be because Gama E being the oldest neighbourhood had more facilities such police
protection, transportation facilities and relationship with neighbourhoods compared to Wailari and Dorayi that
were less old than Gama E. This finding is in line with Nwaka (2005) that shows informal residential areas in
Nigerian cities lack urban services and facilities including health facilities and police services. Bashir (2003)
argued that where such facilities are available, their distribution is uneven among neighbourhoods in the cities.
Dankani (2013) argued that there is inadequate space for children playgrounds and recreation facilities in Kano
city as a result of higher demand for housing spaces following rapid population growth and urbanization in the
city. On the satisfaction with neighbourhood accessibility, the finding of this study revealed that the respondents
in Gama E had a mean satisfaction of (3.43) with the accessibility, Wailari had (3.29) mean of satisfaction and
Dorayi Karama had mean satisfaction of (3.15). The finding suggests that the respondents were most satisfied
with the neighbourhood accessibility in their neighbourhood followed by those in Wailari and the least satisfied
were those Dorayi Karama. This seems to suggest the importance of access to neighbourhood facilities such religious places, fire brigades, health facilities, children‟s schools, police security and proximity to friends and
relatives. Neighbourhood accessibility in terms of religious places and proximity to friends and relatives points
to high level of social interaction in the neighbourhoods. Nwaka (2005) & Caldieron (2011) argued that
households in informal neighbourhoods have a level of social interaction and participation in community.
Clement and Kayode (2012) found a high rate of satisfaction with the worship centre among dwellers of public
housing in Akure, Ondo State, Nigeria. On the overall residential satisfaction of the respondents in the
neighbourhoods, the finding shows that those in Gama E had the mean satisfaction of 3.720, Wailari had the
mean satisfaction of 3.550with neighbourhoods
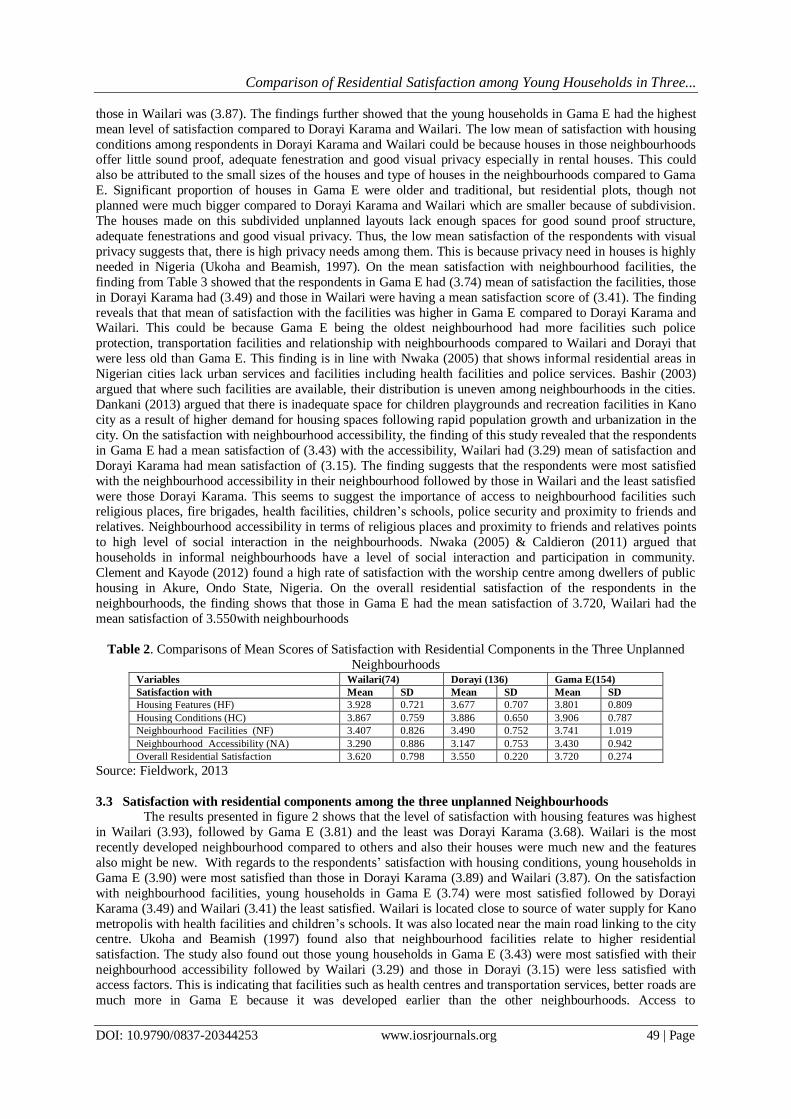
Table 2. Comparisons of Mean Scores of Satisfaction with Residential Components in the Three Unplanned
Neighbourhoods Variables Wailari(74) Dorayi (136) Gama E(154)
Satisfaction with Mean SD Mean SD Mean SD
Housing Features (HF) 3.928 0.721 3.677 0.707 3.801 0.809
Housing Conditions (HC) 3.867 0.759 3.886 0.650 3.906 0.787
Neighbourhood Facilities (NF) 3.407 0.826 3.490 0.752 3.741 1.019
Neighbourhood Accessibility (NA) 3.290 0.886 3.147 0.753 3.430 0.942
Overall Residential Satisfaction 3.620 0.798 3.550 0.220 3.720 0.274
Source: Fieldwork, 2013
3.3 Satisfaction with residential components among the three unplanned Neighbourhoods
The results presented in figure 2 shows that the level of satisfaction with housing features was highest
in Wailari (3.93), followed by Gama E (3.81) and the least was Dorayi Karama (3.68). Wailari is the most
recently developed neighbourhood compared to others and also their houses were much new and the features
also might be new. With regards to the respondents‟ satisfaction with housing conditions, young households in
Gama E (3.90) were most satisfied than those in Dorayi Karama (3.89) and Wailari (3.87). On the satisfaction
with neighbourhood facilities, young households in Gama E (3.74) were most satisfied followed by Dorayi
Karama (3.49) and Wailari (3.41) the least satisfied. Wailari is located close to source of water supply for Kano
metropolis with health facilities and children‟s schools. It was also located near the main road linking to the city centre. Ukoha and Beamish (1997) found also that neighbourhood facilities relate to higher residential
satisfaction. The study also found out those young households in Gama E (3.43) were most satisfied with their
neighbourhood accessibility followed by Wailari (3.29) and those in Dorayi (3.15) were less satisfied with
access factors. This is indicating that facilities such as health centres and transportation services, better roads are
much more in Gama E because it was developed earlier than the other neighbourhoods. Access to

Comparison of Residential Satisfaction among Young Households in Three...
DOI: 10.9790/0837-20344253 www.iosrjournals.org 50 | Page
neighbourhood facilities, religious and worshiping places are very crucial to households‟ satisfaction as they
frequently visit every day. Clement and Kayode (2012) argued that access to worshiping places relate to high
level of satisfaction among the residents of public housing in Akure, Nigeria.
Figure 2. Satisfaction with residential components by the three unplanned Neighbourhoods; SHFs, satisfaction
with housing features; SHCs, satisfaction with housing condition; SNFs, satisfaction with Neighbourhood
Facilities; SNAs, satisfaction with Neighbourhood Accessibility
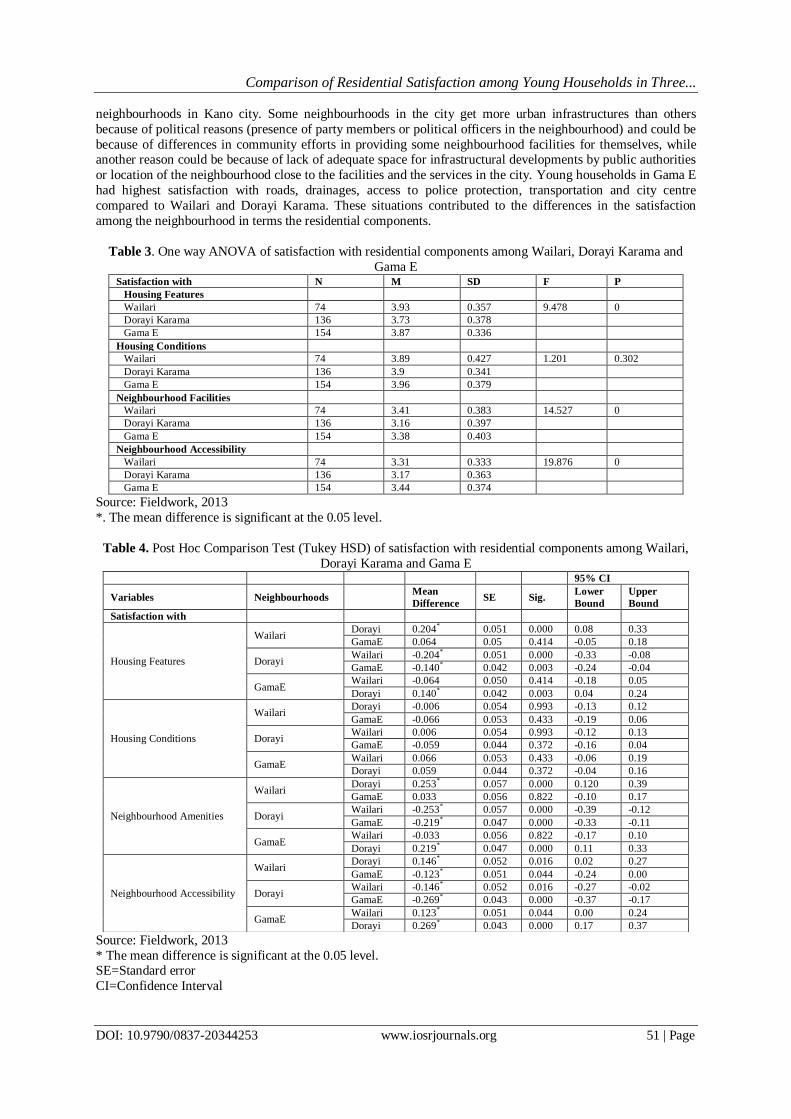
3.4 Comparison of satisfaction with residential components among the three unplanned neighbourhoods
using ANOVA
Table 3 shows the result of One-way between groups analysis of variance (One-way ANOVA) which was used to compare the mean differences in the level of satisfaction with residential components (housing and
neighbourhood) of the respondents among three unplanned neighbourhoods; Wailari, Gama E and Dorayi. The
finding from the ANOVA test indicated that there are significant differences in satisfaction with housing
features among the three neighbourhoods (F = 9.478, (2, 361), p = 0.0001). Post-hoc comparison test using the
Tukey HSD in table 4 showed that the Mean score of satisfaction with housing features for Wailari (M = 3.93,
SD = 0.357) is significantly different from the mean scores of satisfaction with housing features for Dorayi
Karama (M = 3.73, SD = 0.378), while the mean scores for Dorayi Karama differ from Gama E (M = 3.87, SD
= 0.336) did not significantly differ from mean scores of Wailari. This suggested that the difference in the mean
scores of satisfaction among the young households with housing features for Wailari was greatest with Dorayi
Karama greater than Gama E. The ANOVA also showed that there are no significant differences in the level of
satisfaction with housing conditions among the three neighbourhoods (F (2, 361) = 1.201, p = 0.302). The post-
hoc comparison test using Tukey HSD showed that the mean score of satisfaction with housing conditions for Wailari (M = 3.89, SD = 0.427) is not significantly different from mean score of satisfaction with housing
conditions for Dorayi Karama (M = 3.90, SD = 0.341) and for Gama E (M = 3.96, SD = 0.379). Similarly, the
mean score of satisfaction with housing conditions for Dorayi Karama did not significantly differ from mean
score for Gama E.
The results further showed that there are significant differences in the level of satisfaction with
neighbourhood facilities among the neighbourhoods (F (14.383, (2, 361), p = 0.000). The post-hoc comparison
test using Tukey HSD indicated that the mean score of satisfaction with neighbourhood facilities for Wailari (M
= 3.41, SD = 0.383) was significantly different from mean score of satisfaction with neighbourhood facilities for
Dorayi Karama (M = 3.16, SD = 0.397), while no difference from mean score for Gama E. However, mean
score of satisfaction with neighbourhood facilities for Dorayi Karama was significantly different from mean
score for Gama E (M = 3.38, SD = 0.403). This suggested that the level of satisfaction among the young households with neighbourhood facilities for Wailari was higher followed by Gama E and the least was Dorayi.
Similarly, the ANOVA showed that there are significant differences in the level of satisfaction with
neighbourhood accessibility among the neighbourhoods (F 19.879, (2, 361), p = 0.0001). The post-hoc
comparison test using Tukey HSD revealed that the mean score of satisfaction with neighbourhood accessibility
for Wailari (M = 3.31, SD = 0.333) is significantly different from the mean score of satisfaction with
neighbourhood accessibility for Dorayi Karama (M = 3.17, SD = 0.363), while mean score for Dorayi Karama
differed from mean score of satisfaction with neighbourhood accessibility for Gama E (M = 3.44, SD = 0.374).
This shows that the level of satisfaction with neighbourhood accessibility among the young households in all the
neighbourhoods differ from one another with Gama E having highest followed by Wailari and the least was
Dorayi Karama.
Thus, it can be concluded that the differences in the satisfaction with housing features, neighbourhood
facilities and neighbourhood accessibility among Wailari, Dorayi Karama and Gama E could be because of the differences in the provision of urban facilities and services and the size of houses (number of bedrooms and total
number of rooms in the houses), as a result of differences in the sizes of residential plots in the unplanned
Comparison of Residential Satisfaction among Young Households in Three...
DOI: 10.9790/0837-20344253 www.iosrjournals.org 51 | Page
neighbourhoods in Kano city. Some neighbourhoods in the city get more urban infrastructures than others
because of political reasons (presence of party members or political officers in the neighbourhood) and could be
because of differences in community efforts in providing some neighbourhood facilities for themselves, while another reason could be because of lack of adequate space for infrastructural developments by public authorities
or location of the neighbourhood close to the facilities and the services in the city. Young households in Gama E
had highest satisfaction with roads, drainages, access to police protection, transportation and city centre
compared to Wailari and Dorayi Karama. These situations contributed to the differences in the satisfaction
among the neighbourhood in terms the residential components.
Table 3. One way ANOVA of satisfaction with residential components among Wailari, Dorayi Karama and
Gama E Satisfaction with N M SD F P
Housing Features
Wailari 74 3.93 0.357 9.478 0
Dorayi Karama 136 3.73 0.378
Gama E 154 3.87 0.336
Housing Conditions
Wailari 74 3.89 0.427 1.201 0.302
Dorayi Karama 136 3.9 0.341
Gama E 154 3.96 0.379
Neighbourhood Facilities
Wailari 74 3.41 0.383 14.527 0
Dorayi Karama 136 3.16 0.397
Gama E 154 3.38 0.403
Neighbourhood Accessibility
Wailari 74 3.31 0.333 19.876 0
Dorayi Karama 136 3.17 0.363
Gama E 154 3.44 0.374
Source: Fieldwork, 2013
*. The mean difference is significant at the 0.05 level.
Table 4. Post Hoc Comparison Test (Tukey HSD) of satisfaction with residential components among Wailari,
Dorayi Karama and Gama E
Source: Fieldwork, 2013
* The mean difference is significant at the 0.05 level. SE=Standard error
CI=Confidence Interval
95% CI
Variables Neighbourhoods
Mean
Difference SE Sig.
Lower
Bound
Upper
Bound
Satisfaction with
Housing Features
Wailari Dorayi 0.204
* 0.051 0.000 0.08 0.33
GamaE 0.064 0.05 0.414 -0.05 0.18
Dorayi Wailari -0.204
* 0.051 0.000 -0.33 -0.08
GamaE -0.140* 0.042 0.003 -0.24 -0.04
GamaE Wailari -0.064 0.050 0.414 -0.18 0.05
Dorayi 0.140* 0.042 0.003 0.04 0.24
Housing Conditions
Wailari Dorayi -0.006 0.054 0.993 -0.13 0.12
GamaE -0.066 0.053 0.433 -0.19 0.06
Dorayi Wailari 0.006 0.054 0.993 -0.12 0.13
GamaE -0.059 0.044 0.372 -0.16 0.04
GamaE Wailari 0.066 0.053 0.433 -0.06 0.19
Dorayi 0.059 0.044 0.372 -0.04 0.16
Neighbourhood Amenities
Wailari Dorayi 0.253
* 0.057 0.000 0.120 0.39
GamaE 0.033 0.056 0.822 -0.10 0.17
Dorayi Wailari -0.253
* 0.057 0.000 -0.39 -0.12
GamaE -0.219* 0.047 0.000 -0.33 -0.11
GamaE Wailari -0.033 0.056 0.822 -0.17 0.10
Dorayi 0.219* 0.047 0.000 0.11 0.33
Neighbourhood Accessibility
Wailari Dorayi 0.146
* 0.052 0.016 0.02 0.27
GamaE -0.123* 0.051 0.044 -0.24 0.00
Dorayi Wailari -0.146
* 0.052 0.016 -0.27 -0.02
GamaE -0.269* 0.043 0.000 -0.37 -0.17
GamaE Wailari 0.123
* 0.051 0.044 0.00 0.24
Dorayi 0.269* 0.043 0.000 0.17 0.37
Comparison of Residential Satisfaction among Young Households in Three...
DOI: 10.9790/0837-20344253 www.iosrjournals.org 52 | Page
IV. Conclusions
This study compared the mean levels of satisfaction with residential satisfaction among young
households in unplanned neighbourhoods namely Wailari, Dorayi Karama and Gama E in Kano, Nigeria. The
findings revealed that the young households in unplanned neighbourhoods have similar socio-economic status,
although they differ slightly not only in terms of their age, household size, tenure status, income and type of
houses, but also differ in terms of highest level of education and total number of rooms and bedrooms. The
finding also revealed that the respondents had moderate to low satisfaction with their housing and
neighbourhood components, respectively. The study further revealed that there was no significant difference in
mean level of satisfaction with housing conditions among the respondents in the neighbourhoods, while they
differed in terms of mean level of satisfaction with housing features, neighbourhood facilities and
neighbourhood accessibility. Satisfaction with these housing and neighbourhood components is crucial to their
quality of life. These differences in the mean level of satisfaction could be attributed to uneven distribution urban facilities and services by government among unplanned areas and inadequate space for infrastructural
developments in the neighbourhoods as a result of haphazard housing construction and poor physical planning
in the neighbourhoods in the city. Despite the fact that unplanned housing developments are haphazard and lack
adequate facilities and services that would enhance their satisfaction, policy makers and planners should
consider the important role played by unplanned developments in providing housing for low income and poor
households who constituted majority of urban households in Nigeria including Kano city. Improving housing
conditions of low income and poor households, especially young households living in unplanned
neighbourhoods would enhance their satisfaction, quality of life and wellbeing.
Therefore, policy makers and planners should improve residential satisfaction of young households in
the existing unplanned neighbourhoods by providing essential services and facilities such as water, electricity,
drainages, health facilities, police and fire brigade services, roads and also improve their socio-economic status through economic empowerment in order to reduce disparity among the young households in the
neighbourhoods. In addition to this government should control future unplanned development by providing
easily accessible and affordable housing and serviced land as well as offering interest free loan to young
households and create awareness for them on the need for improving their housing and neighbourhood
conditions. Government should consider cultural needs and their participation of young households in decision
making concerning future housing improvement policies.
References [1]. Abdu, A., Hashim, A. H., Samah, A. A., & Salim, A. S. S. (2014). Comparison of Satisfaction with Residential Components
between Previous and Current Unplanned Neighbourhoods among Young Households in Kano, Nigeria. Research on Humanities
and Social Sciences, 4(23), 27-34.
[2]. Addo, I. A. (2013). Perceptions and Acceptability of Multihabitation as an Urban Low Income Housing Strategy in Greater Accra
Metropolitan Area, Ghana. Urban Forum, Springer (pp. 1–29).
[3]. Amérigo, M. A., & Aragones, J. I. (1997). A theoretical and methodological approach to the study of residential satisfaction.
Journal of Environmental Psychology, 17(1), 47-57.
[4]. Busgeeth, K., A. Brits, and J. Whisken. Potential Application of Remote Sensing in Monitoring Informal Settlements in Developing
Countries where Complimentary Data Dos not Exist, in Planning Africa Conference. 2008: Sandton Convention Centre,
Johannesburg, South Africa, April 14-16, 2008.
[5]. Bashir, A. (2003). Regional Planning and Urban Infrastructure Development in the Gongola Region, North Eastern, Nigeria, Global
Journal of Social Sciences, 2(1), 75 – 82.
[6]. Caldieron, J. (2011). Residential satisfaction in la Perla informal neighborhood, San Juan, Puerto Rico. OIDA International Journal
of Sustainable Development, 2(11), 77-84.
[7]. Caldieron, J., & Miller, R. (2013). Residential Satisfaction in the Informal Neighborhoods of Ulaanbaatar, Mongolia. Enquiry/The
ARCC Journal of Architectural Research, 7(1), 12-18.
[8]. Clark, W. A., & Onaka, J. L. (1983). Life cycle and housing adjustment as explanations of residential mobility. Urban Studies,
20(1), 47-57.
[9]. Clement, O. I., & Kayode, O. (2012). Public Housing Provision and User Satisfaction in Ondo State Nigeria. British Journal of Arts
& Social Sciences, 8(1).
[10]. Dankani, I. M. (2013). Constraints to sustainable physical planning in metropolitan Kano, International Journal of Management and
Social Sciences Research, 2( 3), 34 – 42.
[11]. Dunstan, F., Weaver, N., Araya, R., Bell, T., Lannon, S., Lewis, G., . . . Palmer, S. (2005). An observation tool to assist with the
assessment of urban residential environments. Journal of Environmental Psychology, 25(3), 293-305.
[12]. Field, A. (2013). Discovering statistics using IBM SPSS statistics: Sage publications, London.
[13]. Galster, G. (1987). Identifying the correlates of dwelling satisfaction. Environment and Behavior, 19(5), 539-568.
[14]. Galster, G. C., & Hesser, G. W. (1981). Residential Satisfaction. Environment and Behavior, 13(6), 735-758.
[15]. García-Mira, R., Uzzell, D. L., Real, E., & Romay, J. (2005). Housing, space and quality of life: Introduction. In R. García-Mira, D.
L. Uzzell, E. Real, & J. Romay (Eds.), Housing, space and quality of life (pp. 1–5). Aldershot: Ashgate.
[16]. Hakin, D.G.(1984). Multistage sampling designs in fisheries research:applications in small streams. Canadian Journal of Fisheries
and Acquatic Sciences, 41(11),1575-1591.
[17]. Horwood, C. Overview: Tomorrow‟s Crises Today, Cities of darkness / cities of life. UN-HABITAT, Tomorrow‟s Crises Today -
The humanitarian impact of urbanization. 2007, Malta.
[18]. Ibem, E. O., & Aduwo, E. B. (2013). Assessment of residential satisfaction in public housing in Ogun State, Nigeria. Habitat
International, 40, 163-175.
Comparison of Residential Satisfaction among Young Households in Three...
DOI: 10.9790/0837-20344253 www.iosrjournals.org 53 | Page
[19]. Jansen, S. J. T. (2012). The Impact of Socio-Demographic Characteristics, Objective Housing Quali-ty and Preference on
Residential Satisfac-tion.
[20]. Jansen, S. (2014). The impact of the have-want discrepancy on residential satisfaction. Journal of Environmental Psychology,
[21]. Jiboye, A. D. (2009). Evaluating Tenants' Satisfaction with Public Housing in Lagos, Nigeria. Town Planning and Architecture,
33(4), 239-247.
[22]. Jiboye, A. D. (2010). The correlates of public housing satisfaction in Lagos, Nigeria. Journal of geography and regional planning,
3(2), 017-028.
[23]. Khalifa, M. A. (2011). Redefining slums in Egypt: Unplanned versus unsafe areas. Habitat International, 35(1), 40–49.
[24]. Kironde, J. L. (2006). The regulatory framework, unplanned development and urban poverty: Findings from Dar es Salaam,
Tanzania. Land Use Policy, 23(4), 460-472.
[25]. Kombe, W.J. Land use dynamics in peri-urban aeas and their implications on the urban growth and form: The case of Dar es
Salaam, Tanzania. Habitat International, 2005, 29(1): p. 113-135.
[26]. Krejcie, R. V., & Morgan, D. W. (1970). Determining sample size for research activities. Educ Psychol Meas.
[27]. Kuffer, M., & Barrosb, J. (2011). Urban Morphology of Unplanned Settlements: The Use of Spatial Metrics in VHR Remotely
Sensed Images. Procedia Environmental Sciences, 7, 152–157. doi:10.1016/j.proenv.2011.07.027.
[28]. Li, Z., & Wu, F. (2013). Residential Satisfaction in China's Informal Settlements: A Case Study of Beijing, Shanghai, and
Guangzhou. Urban Geography, 34(7), 923-949.
[29]. Lu, M. (1999). Determinants of residential satisfaction: Ordered logit vs. regression models. Growth and Change, 30(2), 264-287.
[30]. Makinde, O. O. (2014). Influences of socio-cultural experiences on residents‟ satisfaction in Ikorodu low-cost housing estate, Lagos
state. Environment, Development and Sustainability, 1-26.
[31]. Mohit, M. A., & Nazyddah, N. (2011). Social housing programme of Selangor Zakat Board of Malaysia and housing satisfaction.
Journal of housing and the built environment, 1-22.
[32]. Mohit, M. A., Ibrahim, M., & Rashid, Y. R. (2010). Assessment of residential satisfaction in newly designed public low-cost
housing in Kuala Lumpur, Malaysia. Habitat International, 34(1), 18-27.
[33]. Mohit, M. A., & Azim, M. (2012). Assessment of Residential Satisfaction with Public Housing in Hulhumale‟, Maldives. Procedia-
Social and Behavioral Sciences, 50, 756–770.
[34]. Morris, E. W., & Winter, M. (1975). A theory of family housing adjustment. Journal of Marriage and the Family, 79-88.
[35]. Morris, E. W., & Winter, M. (1978). Housing, family, and society: John Wiley and Sons.
[36]. Muhammad, M. & Bichi, A. M. (2014). Constraints and challenges on housing provision in Kano city, Nigeria. International
Journal of Advancements in Research & Technology, 3 (6), 4 – 23.
[37]. Muoghalu, L. N. (1991). Measuring housing and environmental quality as indicator of quality of urban life: A case of traditional
city of Benin, Nigeria. Social indicators research, 25(1), 63-98.
[38]. Mustapha, A. (2013). The Influence of Land use and Land- Cover changes on Surface Water, 2(3), 158–164.
[39]. Mustapha, A., Abdu, A., & Geidam, A. L. (2013). The Influence of landuse and land-cover changes on surface water quality
variations in the Jakara basin North- Western Nigeria. International Journal of Advanced and Innovation Research & Technology,
2(3)158-164.
[40]. Mustapha, A. & Yakudima, I. (2008). Population and Settlement. In E.A. Olofin, A.B. Nabegu & A. M. Dambazau. Wudil within
Kano Region: A Geographical Synthesis (pp. 35 - 52). Kano: Adamu Joji Publishers.
[41]. Nwaka, G. I. (2005). The urban informal sector in Nigeria: towards economic development, environmental health, and social
harmony. Global Urban Development Magazine, 1(1), 1–11.
[42]. Nabegu, A. B. (2010). An analysis of municipal solid waste in Kano metropolis, Nigeria. Journal of Human Ecology, 31(2), 111–
119.
[43]. National Population Commission (NPC), (2009). 2006 Population and Housing Census of the Federal Republic of Nigeria Priority
Tables (Volume I): National and State Population and Housing Tables. Abuja, Nigeria. Retrieved
29/05/2011,http://www.population.gov.ng/index.php/publications/136-housing-characteristics-and- ameniti.. 130 - 222.
[44]. Okezie, C., Ogbe, A., & Okezie, C. (2010). Socio-economic determinants of (Mohit & Azim, 2012)contraceptive use among rural
women in Ikwuano Local Government Area of Abia State, Nigeria. Int NGO J, 5(4), 74-77.
[45]. Pallant, J. (2011). SPSS Survival Manual 4th edition: A step by step guide to data analysis using SPSS version 18. Maidenhead,
Berkshire: Open University Press. Retrieved on from http://www. allenandunwin. com/spss.
[46]. Sivam, A. (2003). Housing supply in Delhi. Cities, 20(2), 135-141.
[47]. UN Habitat. (2001). National Trend in Housing Production Practices (Vol. 4, pp. 60–69). Nigeria: United Nations Centre for
Human Settlements. Retrived in 20/05/2010 from http://www.chs.ubc.ca/archives/files/HS-313.
[48]. Ukoha, O. M., & Beamish, J. O. (1996). Predictors of housing satisfaction in Abuja, Nigeria. Housing and Society, 23(3), 26-46.
[49]. Ukoha, O. M., & Beamish, J. O. (1997). Assessment of residents' satisfaction with public housing in Abuja, Nigeria. Habitat
International, 21(4), 445-460.
[50]. Vera-Toscano, E., & Ateca-Amestoy, V. (2008). The relevance of social interactions on housing satisfaction. Social indicators
research, 86(2), 257-274.
[51]. Weeks, J., Hill. A., Stow, D., Getis, A., & D. Fugate, D. (2007). Can we spot a neighbourhood from the air? Defining
neighbourhood structure in Accra, Ghana GeoJournal, 2007, 69(1-2): p. 9-22
[52]. Wu, F. (2010). “Housing environment preference of young consumers in Guangzhou”, China. Property Management, Vol. 28, pp.
174-92.
[53]. Zanuzdana, A., Khan, M., & Kraemer, A. (2013). Housing satisfaction related to health and importance of services in urban slu ms:
evidence from Dhaka, Bangladesh. Social indicators research, 112(1), 163-185.